Embed Size (px)
Citation preview

2
DECLARATION I declare that this research report is my own unaided work. It is being submitted for Degree of Masters of Science in the University of the Witwatersrand, Johannesburg. It has not been submitted before for any degree or examination in any other University.
(Signature of candidate) day of (Year)

3
ABSTRACT The widespread application of pressurized SF6 gas and its mixtures as insulating medium in many electric power applications is the result of recent advances in technologies. The likelihood of failure for a Gas Insulated Substation or Transmission Line (GIS/GITL) is primarily due to the presence of defects inside the equipment. Defects can be introduced into the GIS/GITL system for various reasons. Partial discharge (PD) is a natural phenomenon occurring in the GIS/GITL systems, which invariably contains defects. During commissioning or routine tests PD measurements serve to identify the type and status of a defect. Of particular interest for this research work will be the critical review of PD measurement for different types of free conducting particles in the gas using the UHF method due to its superiority among others. The work highlights the integrity of the method as a tool for both commissioning and routine tests and its alignment with the high voltage SF6 test standards is reviewed. 80/20 N2/SF6 mixture is used to reduce the surface roughness effect in pure SF6, as well as for the reduction of economical and environmental risks. Key words: Commissioning or routine test guidelines, Defects, GIS/GITL, Inception voltage, Lift-off field, N2/SF6 Mixture, Partial Discharge (PD), UHF PD testing

4
ACKNOWLEDGEMENTS I would like to thank Professor IR Jandrell for the motivation and advice throughout this research. His ability to inspire an individual is highly appreciated. I would like to thank Thavenesen Govender for his help with accessing important issues in PD detection as well as his overall advice on how to handle the HV equipment. I would also like to thank Garth Drake for his help in SF6 gas handling, loaning some of the gas cylinders and SF6 percentage tester. I would also like to thank him for his advice and calm explanation to resolve many of the problems experienced with the gas. Thanks to Dr. Shawn Nielsen for his advice on the use of the gas compressor in the HV laboratory. I also give thanks to him for advice and explanations on how to handle gas mixtures. Thanks to Eskom for the financial assistance to do this MSc research on SF6 GIS discharges. Lastly, I give thanks to my family and friends who carried me through this research and all my life.

5
CONTENTS Page DECLARATION .............................................................................................. 2 ABSTRACT..................................................................................................... 3 ACKNOWLEDGEMENTS ............................................................................... 4 LIST OF FIGURES.......................................................................................... 7 LIST OF TABLES............................................................................................ 9 LIST OF SYMBOLS ...................................................................................... 10 1. INTRODUCTION....................................................................................... 11
1.1 Origin of PD in GIS/GITL ....................... ............................................ 11 1.2 Defect mitigation techniques................... ......................................... 12
1.2.1 SF6 gas mixtures........................................................................... 12 1.2.2 Particle traps ................................................................................. 12 1.2.3 Dielectric coating of conductors .................................................... 12
1.3 Diagnostic techniques .......................... ............................................ 12 1.3.1 Conventional PD measurements .................................................. 13 1.3.2 Ultrasonic PD testing .................................................................... 13 1.3.3 Optical PD measurement .............................................................. 13 1.3.4 UHF PD testing ............................................................................. 13
2. OBJECTIVES ...................................... ..................................................... 15 3. STANDARDS FOR GIS ON-SITE/FACTORY COMMISSIONING . .......... 18 4. UHF METHOD .......................................................................................... 19
4.1 Excitation of UHF signals by PD ................ ...................................... 19 4.2 Noise considerations ........................... ............................................. 20 4.3 Monopole design and sensitivity verification ... .............................. 21 4.4 Broadband and narrowband measurement........... .......................... 22 4.5 Comparison between internal and external UHF co uplers ............ 23 4.6 UHF coupler design............................. .............................................. 23
5. INCEPTION VOLTAGE ............................... ............................................. 25
5.1 Streamer breakdown mechanism in gas mixtures ... ...................... 25 5.2 Inception due to defects ....................... ............................................ 26
6. FIELD CALCULATION AND MODELING.................. .............................. 27
6.1 Net charge acquired ............................ .............................................. 27 6.2 Particle lift-off field ........................ .................................................... 27 6.3 Particle field modelling ....................... .............................................. 28
7. LABORATORY SETUP................................ ............................................ 30 8. RESULTS ................................................................................................. 32

6
8.1 Predicted breakdown voltage.................... ....................................... 32 8.2 Field orientation.............................. ................................................... 32 8.3 Partial discharges............................. ................................................. 33
9. DISCUSSIONS ......................................................................................... 37 10. CONCLUSIONS AND RECOMMENDATIONS ................ ...................... 37
10.1 Conclusions................................... .................................................. 37 10.2 Recommendations ............................... ........................................... 38
11. REFERENCES........................................................................................ 40 APPENDIX A: ATTENUATION CALCULATION ................ ......................... 44 APPENDIX B: FREQUENCY BAND IN GAUTENG.............. ....................... 45 APPENDIX C: PARTICLE DIMENSIONS .................... ................................ 46 APPENDIX D: HV LABORATORY SAFETY GUIDELINES........ ................. 47 APPENDIX E: BREAKDOWN VOLTAGE CALCULATION .......... ............... 49 APPENDIX F: PD ACTIVITIES MEASUREMENT.............. .......................... 50 APPENDIX G: SF6 AND N2 PROPERTIES .................................................. 56 APPENDIX H: GAS HANDLING PROCEDURE ................. ......................... 58

7
LIST OF FIGURES Figure Page 1 Bath tub curve of the failure rate versus time 16 2 Attenuation curve for the 11TE mode in an Al coaxial waveguide
with inner enclosure radius of 200 mm 20 3 The monopole probe: (a) design and (b) the actual probe fitted
on the GIS 21 4 (a) Radiation patterns and (b) VSWR simulation for an RF
signal with 2 GHz frequency in a 37.5 mm monopole 22 5 UHF coupler: (a) design and (b) photograph 24 6 Hommel roughness tester: (a) the device and (b) computer
generated profile 25 7 Aluminium and steel particles used for the experiments 27 8 Field orientation for Al miscellious defect 29 9 Measurement equipment and a typical GIS test chamber 30 10 Gas compressor and vacuum pump fitted with storage tanks 30 11 Dilo SF6 % tester display 31 12 Prediction of inception voltage for the GIS 32 13 Field orientation for (a) Al and (b) steel sphere defects 32 14 Field orientation for (a) Al and (b) steel rectangular defects 33 15 Field orientation for (a) Al and (b) steel miscellaneous defects 33 16 Frequency spectrum for (a) background and (b) sensitivity
verification 34 17 PD activity for (a) steel and (b) Al sphere defect at 337 kV 34 18 PD activity for (a) steel and (b) Al misc. defect at 187 kV 35 19 PD activity for (a) steel at 337 kV and (b) Al misc. defect at 225 kV 35 20 PD activity for (a) steel and (b) Al cylindrical defects at 262 kV 36 C.1 Sphere defect, r=4 mm, (Surface area = 201.06 mm2) 46 C.2 Wire defect, r=4 mm h=8 mm, (Surface area = 201.06 mm2) 46 C.3 Miscellaneous defect, w=5 mm, h=3 mm, l= 6, b=6 mm,
(Surface area = 208 mm2) 46 C.4 Rectangular defect, w= 7, l= 8mm, h=4 mm
(Surface area = 189 mm2) 46 F.1.1 PD activity for (a) steel and (b) Al sphere defect at 187 kV 50 F.1.2 PD activity for (a) steel and (b) Al sphere defect at 262 kV 50 F.1.3 PD activity (a) steel and (b) Al sphere defect at 337 kV 50 F.2.1 PD activity for (a) steel and (b) Al misc. defects at 150 kV 51 F.2.2 PD activity for (a) steel and (b) Al misc. defect at 187 kV 51 F.2.3 PD activity for (a) steel and (b) Al misc. defect at 225 kV 51 F.2.4 PD activity for (a) steel at 337 kV and (b) Al misc. defect at 225 kV 52 F.3.1 PD activity for (a) steel and (b) Al cylinder defect at 112 kV 52 F.3.2 PD activity for (a) steel and (b) Al cylinder defect at 150 kV 52

8
F.3.3 PD activity for (a) steel and (b) Al cylinder defect at 187 kV 53 F.3.4 PD activity for (a) steel and (b) Al cylinder defect at 225 kV 53 F.3.5 PD activity for (a) steel and (b) Al cylinder defect at 262 kV 53 F.3.6 PD activity for Al cylinder defect at 300 kV 54 F.4.1 PD activity for (a) steel and (b) Al rect. defect at 150 kV 54 F.4.2 PD activity for (a) steel and (b) Al rect. defect at 187 kV 54 F.4.3 PD activity for (a) steel and (b) Al rect. defect at 225 kV 55 F.4.4 PD activity for (a) steel and (b) Al rect. defect at 262 kV 55 F.4.5 PD activity for steel rectangular defect at 300 kV 55 H.1 Used gas: (a) storage tanks and (b) contaminated gas stored
in empty SF6 gas cylinders 59

9
LIST OF TABLES Table Page 1 Eskom GIS plants 15 2 Comparison between internal and external couplers [Judd 01] 23 3 Particle surface area and lift-field equation derivation [Russel] 28 4 Particle’s lift-off field 28 5 Significant equipment expenditure 31 B.1 Gauteng radio Frequencies 45 B.2 Gauteng TV Frequencies 45 G.1 Physical Properties of SF6 56 G.2 Physical Properties of N2 57

10
LIST OF SYMBOLS Speed of light constant c Radius r Permittivity of the material ε Frequency f Resistivity of the metal wall reρ Permeability of the metal wall µ Wave impedance of the propagation medium wZ
Eigenvalue of the TEnm mode nmk
Signal power at the starting point oP Coordinate of the propagation direction z Period T Wavelength λ Total pressure p Partial pressure of SF6 pS Partial pressure of N2 pN Electric field E Surface area A Mass of the article m Acceleration due to gravity constant g Density of the particle mρ Volume of the particle V Height of the particle h Width of the particle w Length of the particle l Base of the particle b Perimeter of the base of the particle P Integrals numbers n , m Constants β , K Damping coefficient of the duct TEα

11
1. INTRODUCTION SF6 gas is widely used in the high-voltage electrical industry because it is an excellent dielectric and has a very good electrical arc-switching characteristic compared to alternative insulating/interrupting technologies, based on safety, environmental and economic considerations [Boggs 89]. SF6 gas insulated substations (GIS) have proved to be very reliable in their long-term operation. These GIS’s are generally assembled under controlled procedures onsite. However, internal defects may still occur and may affect the dielectric strength. These defects may be left inside the chamber accidentally during assembly or when the system is in operation where the mechanical parts move against each other. Most flashovers occur during the initial operational phase, which points to the importance of having a reliable method of detecting these defects during the high-voltage (HV) commissioning tests. SF6 gas is one of the strongest manmade greenhouse gases [Bessede 06]. Its global warming potential is estimated to be 23,000 times larger than that of CO2 gas and it is an expensive gas, which also points to the importance of developing new gases or using gas mixtures such as N2/SF6 for gas insulated transmission lines (GITL). 1.1 Origin of PD in GIS/GITL Partial discharges (PD) are electrical discharges that do not completely bridge the space between the electrodes. PD magnitudes are usually small and they can cause progressive deterioration leading to ultimate failure. PD’s in compressed SF6 GIS/GITL arise from protrusions, free conducting particles, floating components and bulk insulation defects such as voids, delaminations, etc. Protrusion from live or grounded parts creates a local field enhancement. Such defects have little influence on the alternating current (AC) withstand level, because the voltage varies slowly and corona at the tip will have time to buildup a space charge that shields the tip [Baumgartner 92]. With switching and lightning surges, there is not enough time to build up such space charge. As a consequence, the basic lightning impulse withstand level (BIL) will be drastically reduced. Free moving metallic particles have little impact on the BIL, while the AC withstand level can be significantly reduced. The reduction depends on their shape and position; the longer they are and the closer they get to the HV conductor the more dangerous they become. If they move onto a spacer they become even more dangerous. A particle on a spacer may with time lead to deterioration of the spacer surface. Apparent PD charges induced in the measuring system will depend on the particle shape, position in the GIS/GITL, and the operating voltage level of the apparatus. Voids and defects inside

12
spacers will create discharges, electrical trees and will eventually lead to breakdown. To improve the reliability of GIS/GITL systems, the problem of particle contamination should be overcome through meticulous quality control. 1.2 Defect mitigation techniques If defects are controlled, the reliability of the SF6 GIS/GIL can be improved. There are various mitigation methods that have been adopted by manufacturers. Some of these techniques used for controlling the contamination in GIS/GIL are the used of SF6 gas mixtures, particle traps and dielectric coating of the electrodes [Morcos 00]. 1.2.1 SF6 gas mixtures N2/SF6 is considered the best substitute for SF6 in GITL because of the following reasons: (a) Nitrogen is a cheap gas and its dielectric strength in a uniform field is higher than that of gas mixtures of SF6 with most common gases, (b) Reducing the quantity of SF6 reduces environmental impact, (c) SF6 liquefaction at low ambient temperatures is avoided, and (d) At equal gas pressure, N2/SF6 mixtures are less sensitive to insulation defects than undiluted SF6, because pure SF6 is sensitive to surface roughness. 1.2.2 Particle traps During the manufacturing process particle traps are deliberately created at the conductor-spacer joints. Before the equipment is put into service voltage will be raise in discrete steps so as to move the free conducting particles into particle traps. 1.2.3 Dielectric coating of conductors Dielectric coating of conductors in GIS systems improves the dielectric strength. Coating over the conductor roughness decreases high local field and the coating resistance reduces the development of pre-discharges in the gas. Dielectric coating of the conductor can also create problems: (a) if the coating is damaged it could create particles; (b) the coating lowers the particle mobility and thus makes the use of particle traps more difficult; (c) by increasing the lift-off voltage, it can be more dangerous because the particles can then lift-off and induce direct breakdown without warning or possibility of PD detection. 1.3 Diagnostic techniques There are several diagnostic techniques available to detect the presence of pre-discharge phenomena, evaluate the level of degradation of the SF6 gas,

13
localize possible faults or flashovers and detect the presence of mechanical vibrations [Gross 04, Morcos 00]. Diagnostic methods in use can be classified as electrical, acoustical, and optical methods. The main features of these methods are described below. 1.3.1 Conventional PD measurements The conventional PD measuring method according to IEC 60270 is the most known since it is in use already for many years in various fields of PD measurements. PD signals are measured using a coupling capacitor, which can be fully enclosed or externally connected. The PD signal is not significantly damped in the GIS so that this method can be calibrated. Since PD signals are measured in the kHz range, excessive electromagnetic interference of much higher amplitude, such as corona discharges of incoming overhead lines and AM radio transmission makes detection of PD in GIS difficult. To obtain an acceptable background noise level the use of a suitable ratio of the coupling capacitor to the test object is required. 1.3.2 Ultrasonic PD testing Partial discharge activity also produces ultrasonic signals. Generally, such ultrasonic signals undergo a much stronger attenuation than the UHF signals. Ultrasonic detection of partial discharge activity of embedded voids (spherical gas cavities) in epoxy resin material is hampered by attenuations. This method cannot be calibrated, and since the measuring range is limited to one-gas compartment, acoustic PD measurements on a complete GIS are very time-consuming. 1.3.3 Optical PD measurement Besides electromagnetic and acoustic signals, gas discharges also produce light emission due to excitation and/or ionization processes of the gas molecules within the discharging volume. Since GIS operates in an enclosed, light-tight environment and light detection is not affected by environmental noise, optical PD detection may also offer much better sensitivity than the other techniques. Optical PD detection is conducted with a photomultiplier tube (PMT) operating in a photon counting mode. Progress in the developments of small, ambient temperature-operated photomultiplier tubes and in optical fiber technology may make optical PD measurements in GIS as a feasible diagnostic tool. 1.3.4 UHF PD testing By using frequency bands in the UHF range, partial discharge measurements can be performed using suitable embedded or external couplers. The electron

14
avalanche of a partial discharge event has a rise time in the range of 200 ps, leading to a bandwidth of the partial discharge signal of significantly above 1 GHz. High frequency components of such impulse signals can undergo a relatively strong attenuation, when travelling in GIS/GITL chamber, and this will be explained later.

15
2. OBJECTIVES HV SF6 GIS have been in use world-wide for more than 30 years with generally very good experiences. However, the use of SF6 gas mixtures is relatively new. GIS are most common in use in Japan, the largest single GIS market in the world, in Europe, the Middle East, and also the Far East and South East Asia. In the USA, where this technology was founded, the success of GIS is limited [Bolin 05]. The use of HV SF6 substations is infrequent in electricity networks in the South Africa. Some of the current installations are tabulated below in Table 1 [Eskom GIS WG 08]. Table 1: Eskom GIS plants
Voltage Level
Plant
765kV
Alpha
Beta
400kV
Koeberg
Drakensberg
Invubu
275kV
Invubu
Craighall
Croydon
132kV
Croydon
Koeberg
88kV
Craighall
For the distribution industry the use of SF6 medium voltage (MV) distribution switchgear and in particular secondary switchgear (e.g. ring main units) is driven by a lower cost, enhanced safety and greater reliability. These switchgear units are being used to replace the old oil-filled switchgear, which has either remained un-maintained and/or has been overstressed and is posing danger for the operator, property and the general public [Kelly 06]. There are no installations of HV N2/SF6 GITL in South Africa and this can be attributed to the lack of space constraints in the country previously. Koeberg power station has an SF6 GITL extension that runs to the transmission yard situated outside the nuclear power station. Restriction in the availability of

16
space for new substations and the replacement of aging equipment in cities and metropolitan areas indicates that in the near future South Africa will require a larger number of GIS/GITL systems which will need to be installed and operated. There is therefore a need to understand the problems associated with this equipment. The long-term performance of the insulating system of GIS/GITL is of increasing interest for both manufacturers and users. The question is whether there are any ageing processes or undetected defects that can cause a reduction of the GIS/GITL lifetime. Generally, ageing processes cannot be avoided and any material is subject to ageing. However, it is of interest to consider defects which can remain undetected during commissioning stage and which can result in an increase of the statistical failure rate of the GIS/GITL equipment [Cigre WG 15.03 02]. This research will involve a critical review of the current quality assurance/commissioning tests used to determine defects in the SF6 or gas mixture systems using the UHF method. The statistical performance of an SF6 GIS system is usually described by the bath tub curve of the failure rate shown in Figure1.
Figure 1: Bath tub curve of the failure rate versus time
A: Dominating teething failures B: Random failures C: Dominating aging failures It can be observed that the failure rate initially decreases with time. It is critical to improve the performance of GIS during the commissioning phase, for example shifting the failure curve 1 to curve 2 in section A of Figure 1. Teething and free conducting particles have the greatest influence on the initial stages of operation. Hence this work will concentrate on the integrity of

17
commissioning tests in determining such defects. It should be observed that when the failure rate is constant in the figure above, the failures are considered to be caused by random phenomena. This can also be attributed to free particles initiating breakdown occurring in operating parts of GIS such as isolators and circuit-breakers. An increase of the failure rate indicates that ageing becomes critical. Contaminating particles in practice are unlikely to be regular in shape. These particles can occur in different size and can result from different conducting materials. To review the quality assurance/commissioning tests using the UHF method, the following questions need to be explored during the course of this work:
• What are there international guidelines and minimum requirements for commissioning of GIS/GITL equipment?
• Is the UHF PD detection method in line with HV SF6 commissioning test guidelines?
• What are the limitations of commissioning tests for GIS/GITL defects detection?
• Does shape variation of free conducting particles makes any difference in the PD detection sensitivity of the UHF method?
• What effects do different materials of free conducting particles (i.e. Steel vs. Aluminium) of equal surface area does it have on PD detection sensitivity?
• Compute the lift-off fields for sphere-, rectangular solid-, cylindrical- and the proposed miscellaneous-shaped particles for steel and aluminium materials.
• What is the status of GIS/GITL failure mechanisms in South Africa’s HV equipment?

18
3. STANDARDS FOR GIS ON-SITE/FACTORY COMMISSIONING There are two main procedures among others recommended in IEC and IEEE standards [IEC 60517, IEEE Std C37.122, IEC 62271-203]:
• A 1 minute AC withstand test at 80% of the factory routine test voltage level. In addition to this 3 impulses of both polarity, at 80% of the rated lightning withstand level should also be applied.
• A minimum of a 5 minute withstand test at not less than 3/maxV
should be applied followed by the impulse test. If breakdown occurs, re-testing or internal inspection is required. The high voltage test should not damage the GIS/GITL or affect its long-term reliability. The UHF method was not developed to substitute the factory routine test but there were vital objectives to improve the site-testing procedure, which are [Hampton 92]:
• To develop a sensitive test technique which will allow defects to be detected at lower test voltages and as such avoid overstressing the solid insulation with a high voltage
• To detect defects before flashover could occur, thereby avoiding the
risks of secondary flashovers
• To minimize commissioning time, and
• To enable a defect to be located, so that the correct GIS/GITL compartment is opened for inspection.

19
4. UHF METHOD The UHF method is used to detect PD signals in the UHF frequency range from 300 MHz up to 3 GHz with built-in sensors or with external UHF sensors mounted on chamber windows [Cigre WG 15.03 00]. PD in the GIS/GITL can excite electromagnetic waves which propagate along the coaxial waveguide made up by the inner conductor and the outer enclosure of the chamber. The currents produced by the partial discharge have a very fast rise time of a few tens of picoseconds. These waves are excited not only in the transverse electromagnetic (TEM) mode but also in several higher order transverse electric or transverse magnetic (TE/TM) modes. 4.1 Excitation of UHF signals by PD [Judd 96] states that excitation and propagation of transfer functions in a coaxial waveguide can be obtained by using the suitable Dyadic Green’s functions. Green’s functions for electric field in a coaxial waveguide are defined in terms of the orthogonal field patterns of the TEM, TE and TM modes. The dominating mode with the lowest cut-off frequency is the TE11. The cut-off frequency of the TE11 mode is given by the following equation [Kraus 99, Judd 96]:
r
cr
cf
ε41.3= (1)
The signals below the cut-off frequency calculated above will be subjected to high attenuation given by the following equation:
12
69.82
−
=
f
f
c
f cTE
πα cff < (2)
And for frequencies above the cut-frequency, attenuation will be given by:
2
22
22
1
69.8
−
−+
=
f
frZ
nk
n
f
ff
cw
nm
cre
TE
πµρ
α cff < (3)

20
The wave impedance of the propagation medium is given by:
2
0
0
1
−
=
f
fZ
c
w
εµ
(4)
The damping of the signal power in a coaxial duct is described by [Schöffner 01]:
zoz
TEePP ..2. α−= (5) Thus the signal attenuation resulting from the above damping can be calculated by the following equation in dB, and the result is plotted in Figure 2 below:
( )z
o
z TEeP
PdBA ..2log.10log.10][ α−=
= (6)
Figure 2: Attenuation curve for the 11TE mode in an Al coaxial waveguide with inner enclosure radius of 200 mm
The calculation for attenuation is shown in Appendix A. 4.2 Noise considerations Noise signals can be encountered in the UHF range, caused for example by air radio and radar. Transmitters for TV and mobile communication also

21
cause noise in this frequency range. Power transmission lines can also cause corona noise [Urban 02]. These problems are especially encountered in onsite UHF-PD measurements contrary to the controlled laboratory environment, where transmission lines are not present. The noise which is in the vicinity of the University of the Witwatersrand high voltage laboratory is from the Sentech radio and TV transmission tower. Frequency allocation for Sentech is up to 679 MHz, see Appendix B. 4.3 Monopole design and sensitivity verification A pulse injection procedure is normally carried out on a HV GIS system in order to verify the correct operation of the PD detection system [Hampton 92]. The pulse generator is used to mimic signals produced by PD in GIS. The characteristic of the pulse wave shape is such that it generates frequencies in the range of tens of MHz to above 1 GHz. A 2 mm particle that gives a -50 dBm signal at a discharge level of 5 pC can be generated if a variable voltage pulse of up to 200 V, rise time of 0.8-1 ns and duration of 3-300 ns is injected on a suitable monopole probe. The exact shape of the electrical pulse is not critical if the following parameters are taken into consideration [Cigre WG 15.03 99]:
• Pulses with rise time faster than 1 ns must be generated. • The pulse width should be more than 500 ns in case of a rectangular
pulse and the time to half-value should be more than 20 ns for double exponential pulses.
• The magnitude of the impulse voltage or power of the artificially generated UHF signal is dependent on the magnitude of the impulse voltage or power.
• The time between consecutive pulses must be greater than the duration of the UHF signal in order to avoid superposition of multiple pulses. A repetition rate of less than 100 kHz can be used.
The monopole probe was designed to be mounted on the viewing window [Judd 96]. The monopole is shown with its dimension in Figure 3.
(a) (b)
Figure 3: The monopole probe: (a) design and (b) the actual probe fitted on the GIS

22
Antenna theory was used to calculate the monopole length [Landstorfer 85]. The length of the monopole for a pulse with a rise time of 0.5 ns can be calculated as follows:
Tf /1= 5.0/1= ns =2 GHz (7) Therefore fc /=λ =300M m.s-1/2000M s-1 =0.15 m But the length of the monopole is given by:
0375.04/ == λml m=37.5 mm (8) Figure 4(a)-(b) shows the radiation pattern and VSWR from SuperNEC simulation for an RF signal with 2 GHz frequency in a 37.5 mm monopole.
(a) (b)
Figure 4: (a) Radiation patterns and (b) VSWR simulation for an RF signal with 2 GHz frequency in a 37.5 mm monopole
4.4 Broadband and narrowband measurement The spectrum analyzer can be used to measure both the narrowband and broadband properties of the PD activity [Meijer 98]. The advantage of the narrowband UHF measurement is the possibility of discriminating against external noise and other disturbances by selecting a centre frequency. This method is done by setting the spectrum analyzer to zero-span. For a broadband measurement the system can measure the time domain signal in a frequency range from 500 MHz to up to 3 GHz. The main disadvantage of this method is the fact that external noise and other disturbances can not be excluded. But when a band of frequencies which is above the noise level is selected on the spectrum analyzer, it is possible to

23
exclude these disturbances. PD measurements are performed using the broadband method. 4.5 Comparison between internal and external UHF couplers The use of internal couplers has its own advantages and disadvantages when compared with external couplers. [Judd 01] gives a comparison between internal and external couplers. Table 2 below gives some of these characteristics. Table 2: Comparison between internal and external couplers [Judd 01]
Performance criteria
Internal Coupler
External Coupler
Sufficient sensitivity to PD
Yes, if coupler is of a good design
Yes, if window and coupler are correctly
designed
Screening of external noise
Yes, screen by metal cladding
Not necessary, depends on the setup
Coupler part of HV Insulation system
Yes
Not necessary
Risk of hazardous power frequency
Yes
No
Easy to repair or Upgrade for on-site
fitted coupler
No, intrusive procedure required
Yes
Is coupler part of pressure vessel
Yes
No
Can coupler be used to measure
fast transients
Yes, if designed to do so.
No, unlikely due to high attenuation
at VHF
Sensitivity for this research work is very important, and as such an internal coupler was selected. 4.6 UHF coupler design The coupler used is similar to the internal couplers which are designed to be mounted on the inside of an access hatch cover plate. The coupler can be fitted simply, even to existing GIS. The coupler was donated to Eskom by

24
ABB and it is shown in Figure 5 below. The coupler is insulated from the hatch cover plate, and is connected by a wire to a sealed N-type 50 Ω coaxial socket. These sockets are helium leak proof and can withstand severe hydraulic pressure test. When no tests are being performed on these couplers, the sockets are fitted with a weatherproof shorting cap, as shown in Figure 5.
(a) (b)
Figure 5: UHF coupler: (a) design and (b) photograph

25
5. INCEPTION VOLTAGE 5.1 Streamer breakdown mechanism in gas mixtures [Baumgartner 74] states that each gas contributes to α and η in proportion to its partial pressure. The effective ionisation coefficient for SF6/N2 mixture is derived as:
E
p
mix pNppEpS××−
×××+××−×=−71008.2
56 exp1032.5)1089.8(028.0)( ηα (9) Surface roughness will have an effect on the SF6 breakdown strength. For smooth electrode breakdown the threshold of pE /0 is approximately equal to
lim)/( pE [Pedersen 75]. Taking into account the influence of the surface roughness factor, Rs , the real streamer inception will be reduced to [Boeck 03, Pedersen 75]:
)/(lim)/()/( 0 βKspEspE RR == (10) The limiting value β/)/( lim KpE = for pure SF6 is equal to 88.4 kV/cm.bar. β
and K are constants equal to 27.8 kV-1 and 2460 (bar.cm)-1 respectively. Figure 6 below shows the measurement of surface roughness by a Hommel roughness tester T5000. The average roughness profile is about 5.12 mµ for the GIS test chamber. It is assumed that the conductor and the chamber enclosure’s roughness are similar.
(a) (b)
Figure 6: Hommel roughness tester: (a) the device and (b) computer generated profile

26
5.2 Inception due to defects The presence of particles will cause a non-uniform field. This will lead to inception voltages being modified. [Hattori 88] investigated the relationship between the length of the conducting particles and 50% probability of AC flashover voltages. It was discovered that flashover characteristics with conducting particles depend largely on high-voltage conducting stress and the inclination of v-t characteristics on length of the particles. The stress on the electrode can be reduced by the presence of a particle. The characteristics can be estimated with voltage application and time used as a parameter [Hattori 88]:
nmtlEE11
0
−−= (11)
Where 1500 =E kVrms/cm, 2=tm for particles length of 5-50 mm, and this holds for both short time AC voltage application and longer times.
kln =74
log (12)
Where 007.0−=k For a particle length of 8=l mm, n is equal to 69. [Metwally 03] suggests that the inception voltage due to non-uniformity be estimated by:
pgup
E
pRU
c
i
+= λ
1 (13)
Where u is the field utilization factor, which is the ratio of average and maximum fields ( )EE ˆ/ . The limitation on this premise is that R is assumed to be a mean radius for a protrusion or a tiny particle lying on the surface of the conductor while for this research work the particles investigated were lying on the enclosure below the conductor.

27
6. FIELD CALCULATION AND MODELING 6.1 Net charge acquired Free conducting particles can acquire a net charge in the presence of an electric field which is proportional to its surface area projected in the direction of the field [Indira 98]. The net charge is approximated by the equation:
sEAQ ε= (14) The Maxwell force acting on the particle trying to lift the charge can then be written as:
EQFL = (15) The above force must be greater than or equal to the force of gravity for the particle to lift-off. The equation for the force of gravity is approximated by:
gVmgF mg ρ== (16)
Aluminium and steel particles of different shapes and equal surface areas were used for the experiments. The dimensions for the particles are shown in Appendix C. The particles used are shown in Figure 7.
Figure 7: Aluminium and steel particles used for the experiments
6.2 Particle lift-off field Lift-off electric field can be calculated by force equations for Maxwell and gravity [Indira 98], i.e., the following equation holds:
gL FF ≥ (17)
[Russell 2002] gives mathematical formulas for surface areas and volumes for different shapes. Table 3 shows the formulas used to estimate the surface area and volume as well as the lift-off field for sphere, cylinder, rectangular

28
and miscellaneously-shaped particles (assumed to be a prism on a rectangular-solid). The actually lift-off fields calculated are given in Table 4 below. Table 3: Particle surface area and lift-field equation derivation [Russel]
Particles’ Surface Area
Volume
Lift-off field liftE
1
24 rA π=
3)3/4( rV π=
ερ 3/grE ms =
2
)(2 2 rhrA ππ +=
hrV 2π=
)(2/ hrgrhE mc += ερ
3
2)( whhllwA ++=
lwhV =
( )whhllwgwhlE mr ++= ερ 2/
4
PhbhwlhwlA ++++= 2222
)(2/3 lwhV =
( )PhbhwlhwlgwhlE mm ++++= 2222/)(2/3 ερ
Table 4: Particle lift-off field
Particle
Calculated LiftE )/( mV
Al )kg/m^3 2700( =mρ
Fe )kg/m^3 7850( =mρ
Sphere
3.9 610×
6.6 610×
Cylinder
43.3 610×
73.9 610×
Rectangular
374 610×
639 610×
miscellaneous
5.5 610×
9.5 610×
6.3 Particle field modelling Field modelling was performed using ANSOFT’s Maxwell field modelling tool [Maxwell SV]. There are two useful properties one can obtain from the field modelling. Once the lift-off field has been calculated, it is possible to model the voltage that will cause that particular lift-off field. Secondly, it is possible to view how the field orientation will look like on different defects, particularly on the edges of the particles. Figure 8 shows field orientation for an Al miscellaneous defect.

29
Figure 8: Field orientation for Al miscellaneous defect

30
7. LABORATORY SETUP The experimental setup, measurement equipment and some of the settings are presented below. The experimental setup used is shown in Figure 9. It consists of a 765 kV Gas Insulated Test Transformer, and GIS enclosure designed for 420 kV rated voltage. There are three compartment separated by cone type insulators known as spacers. These spacers hold the HV busbar in the middle of the duct and act as gas barriers when they are completely closed. The defect chamber consists of an internal UHF coupler mounted into a flange opening on the side of the GIS. It has been explained above how the sensitivity of the UHF method was verified by injecting an artificial signal into the chamber. The dimensions of the UHF coupler are given in Figure 5.
Figure 9: Measurement equipment and a typical GIS test chamber The central compartment is dedicated to defects. This chamber is de-gassed to the main tanks shown in Figure 10 when a defect is changed. The movement of free conducting particles is restricted to the central defects chamber to avoid contamination of the whole GIS.
Figure 10: Gas compressor and vacuum pump fitted with storage tanks

31
The GIS chamber features, spectrum analyzer settings and pre-amplifier features are listed Table 5. The costs which were significant are also listed in Table 5: Table 5: Significant equipment expenditure Item Unit Amount Pre-Amplifiers 2 R1,611.96 RG400 coaxial cable 10 m R 979.26 Gas fittings R2,134.88 TOTAL R4,726.10 GIS test chamber
• The maximum rated pressure for 750 kV Gas Insulated test transformer is 6bar,
• 20/80 N2/ SF6 mixture was used and a Dilo SF6 % tester was used to verify the mixture ratio (Figure 11).
• Electrode roughness was measured by the Hommel tester.
Figure 11: Dilo SF6 % tester display Pre-Amplifier (ZX60-2534M-S+)
• 50 Ω , 0.5-2.5 GHz, 10 dBm power gain. Coaxial Cables
• 50 Ω , RG400 coaxial cable. Spectrum Analyzer settings (Agilent N9320A 9kHz-3GHz)
• Broadband measurement, 0.8-2.9 GHz, • Centre frequency = 1.05 GHz, • Span of 2.1 GHz, • Sweeps time of 5 s, • Bandwidth = 300 kHz,
The safety measures were followed as indicated in Appendix D.

32
8. RESULTS 8.1 Predicted breakdown voltage The predicted breakdown voltage for the mixture without defects is shown in Figure 12, see Appendix E for Matlab simulation. The inception voltage is about 1762 kV at a mean distance of 2.6mm from the inner conductor.
Figure 12: Prediction of inception voltage for the GIS
The [Hattori 88] premise gives the reduced stress of about 51 kVrms/cm for the mixture when the defects are present. The rated stress for the 420 kV duct used is 60 kVrms/cm. The reduced voltage that corresponds to 51 kVrms/cm from the Maxwell field model is about 850 kV. 8.2 Field orientation Field orientation around the HV electrode and on the defects is shown in Figures 13-15. 39 kV/cm is observed at 300 kV when the aluminium and steel sphere-defects are placed in a chamber.
(a) (b)
Figure 13: Field orientation for (a) Al and (b) steel sphere defects
33
(a) (b)
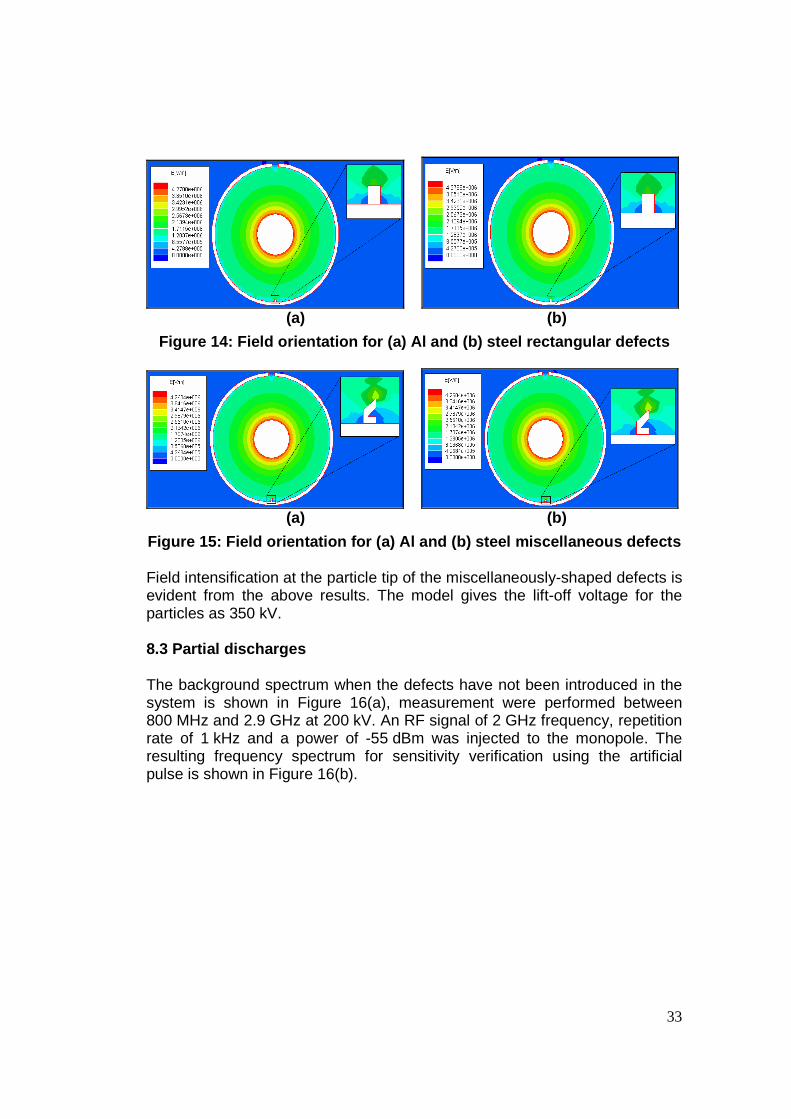
Figure 14: Field orientation for (a) Al and (b) steel rectangular defects
(a) (b)
Figure 15: Field orientation for (a) Al and (b) steel miscellaneous defects Field intensification at the particle tip of the miscellaneously-shaped defects is evident from the above results. The model gives the lift-off voltage for the particles as 350 kV. 8.3 Partial discharges The background spectrum when the defects have not been introduced in the system is shown in Figure 16(a), measurement were performed between 800 MHz and 2.9 GHz at 200 kV. An RF signal of 2 GHz frequency, repetition rate of 1 kHz and a power of -55 dBm was injected to the monopole. The resulting frequency spectrum for sensitivity verification using the artificial pulse is shown in Figure 16(b).

34
(a) (b)
Figure 16: Frequency spectrum for (a) background and (b) sensitivity verification
The frequency spectrum for both aluminium and steel particles are shown in Figure 17. The predicted lift-off voltage is in agreement with the spectrum behaviour, particles start to shuffle at around 300 kV. Figure 17 shows the spectrum for steel and aluminium sphere particle at 337 kV. The aluminium sphere defect has high PD activity compared to the steel defect. Both defects have a spectrum occurring at distinct frequencies.
(a) (b)
Figure 17: PD activity for (a) steel and (b) Al sphere defect at 337 kV

35
Figure 18 shows the PD for aluminium miscellaneously-shaped defects at 187 kV while PD for the steel defect at the same voltage is inhibited.
(a) (b)
Figure 18: PD activity for (a) steel and (b) Al misc. defect at 187 kV Defect radiate audible noise when they start to shuffle around and sometimes the flashover will occur without any sign of PD for miscellaneously-shaped defects. Figure 19 shows the PD activity for steel and Al defects at 337 kV and 225 kV respectively.
(a) (b)
Figure 19: PD activity for (a) steel at 337 kV and (b) Al misc. defect at 225 kV
PD activity for the steel cylindrical defect disappeared above 260 kV and when the voltage was brought down again to around 260 kV PD re-appeared (Figure 20). More partial discharge results are included in Appendix F.

36
(a) (b)
Figure 20: PD activity for (a) steel and (b) Al cylindrical defects at 262 kV

37
9. DISCUSSIONS The sensitivity of PD detection using the UHF method for different defects in a GIS/GITL either for factory or onsite commissioning measurement has been investigated. Its limitations and reliability as one of the diagnostic methods during commissioning has been investigated. The breakdown voltage for the chamber was predicted from Baumgartner’s effective ionization coefficient, the equation takes into account the influence of partial pressure from both gases (SF6 and N2) [Baumgartner 74]. The surface roughness for the compartment is also considered in the equation. The predicted value gives a limit for the test voltage in the presence of defects. The ANSOFT Maxwell field modelling tool was used to obverse the field orientation and to predict the lift-off field for the defects. For optimal output the mesh resolution should be increased, but the system would take longer to solve the model. The spectrum analyzer is used to observe the PD activities caused by defects. It is impossible to observe any PD activity on the spectrum analyzer unless it has been correctly setup. A sweep time of 5 s and a bandwidth of 300 kHz was used for the broadband method and the frequency spectrum was stable. PD inception for aluminium defects occur at slightly lower voltages than steel defects. The good electrical conductivity of the aluminium material coupled with its light weight is an important factor that can be attributed to this PD behaviour. The electrical conductivity grade for aluminium is approximately 27 mΩ/cm. Because aluminium has about one third the density of steel, an aluminium conductor of equal current carrying capacity as steel will have better conductivity. This is an advantage because most of these GIS systems are made out of aluminium meaning that the likelihood of encountering aluminium defects is higher 10. CONCLUSIONS AND RECOMMENDATIONS 10.1 Conclusions Based on the results obtained the following conclusions may be made:
• The calculated breakdown voltage for the mixture is 1760kV, this value is in-line with the rated BIL for the test chamber which is 1600kV. The basic impulse level is the highest voltage level that the system will tolerate and the system is designed for this level which explains the similarity between the predicted and the rated value. The presence of defects reduces the breakdown voltage by almost half. However it

38
must be emphasized that this value can change depending on the location and the type of defect.
• The modeled lift-off field is in agreement with the observed defect
behaviour on the spectrum analyzer.
• 150 kV is sufficient to initiate PD activity on the spectrum analyzer irrespective of the defect’s shape and type. When voltage is increased at discrete steps PD activity also increases. The risks of flashover can be avoided because PD occurs at lower voltages. When a defect lift-off occurs that may induce a direct breakdown without warning.
• The UHF detection method has different sensitivity for different types
of defects. It has been established that the UHF method is more sensitive to the aluminium particles than to the steel particles. Therefore free aluminium defects can be detected much easier and faster than other defects during commissioning or routine testing.
• PD activities disappeared above a certain voltage level for the defects
with long sharp points. This is attributed to the corona stabilization because this phenomenon shields the sharp points resulting in field weakening around the sharp edges and this may inhibit the PD activity. The disadvantage of this behaviour is that breakdown may occur without warning due to PD activity.
• PD activity occurs at particular frequencies for different defects at
different voltage levels. It should be emphasized that different voltage levels can cause different behaviour of PD pulses because different PD pulse rise times result in different frequency spectrums.
10.2 Recommendations UHF PD detection is seldom used as a diagnostic tool for free moving particles inside the GIS plants of Eskom. Gas analysis and acoustic methods are familiar diagnostic tools. UHF method should be used in conjunction with these methods to eradicate uncertainties. At some instances results from the acoustic method may be confused with vibrating loose metals on the GIS system. UHF couplers do exist in some of the installed Eskom plants and are now a requirement in all new installations. To improve the reliability of the GIS equipment and to prevent faults due to free particles, UHF spectrum analysis must be implemented as part of the diagnostic tool either at a commissioning stage or as a routine inspection.

39
It is recommended that during HV GIS plant commissioning stage, the voltage should be raised in discrete steps for UHF PD detection in order to avoid direct breakdown without warning. The sensitivity of the UHF coupler must be confirmed and must be sensitive to pick up low power signals. Note that other utilities, such as in the U.K suggest 6 mVrms output voltage for an incident UHF electric field of 1 V/mrms and IEC suggests that a detectable -50 dBm or 5 pC of a UHF impulse is representative of a 2 mm particle. Apparent PD charges induced in the measuring system indeed depend on the particle shape in the GIS/GITL, and the voltage level. It is recommended that care be taken when the UHF method is used, because destructive back-flashover may be induced on the measuring unit. Further work is also recommended for lightning impulses: this is to be investigated for the same type of defects. Different PD activity may be expected because AC voltage varies slowly in such a way that enough time is given to build up space charge that shields the sharp tips of the defects.

40
11. REFERENCES [Boggs 89] Boggs, S.A, SULPHUR HEXAFLOURIDE:
INTRODUCTION TO THE MATERIAL AND DIELECTRIC, IEEE Electrical Insulation Magazine, Vol. 5, No. 5, pp.s18 – 21, September/October 1989.
[Bessede 06] Bessede, J.L, Buescher, A., Marshall, R., Montillet, G.F,
Stelter, A. LIMITING SF6 GAS EMISSIONS BY OPTIMIZATION OF DESIGN AND HANDLING OVER THE LIFE CYCLE OF HV SWITCHGEAR. Fourth International EPA Conference on SF6 and the Environment, San Antonio, November 2006.
[Baumgartner 92] Baumgartner, R., Fruth, B. Lonz, W., Pettersson, K.
PARTIAL DISCHARGE. X. PD IN GAS-INSULATED SUBSTATIONS-MEASUREMENTAND PRACTICAL CONSIDERATIONS, IEEE Electrical Insulation Magazine, Vol.8, Issue 1, pp.s16-27, Jan/Feb 1992.
[Morcos 00] Morcos, M.M, Ward, S.A, Anis, H., Srivastava, K.D,
Gubanski, S.M. NSULATION INTEGRITY OF GIS/GITL SYSTEMS AND MANAGEMENT OF PARTICLE CONTAMINATION, IEEE Electrical Insulation Magazine, Vol. 16, No. 5, pp.s 25-37, September/October 2000.
[Gross 04] Gross, D.W, and Soller, M. COMMISSIONING AND ON-
LINE TESTING OF GIS AND GIL, IEEE International Symposium on Electrical Insulation, Indianapolis, USA, 19-22 September 2004.
[Bolin 05] Bolin, P., Koch, H. INTRODUCTION AND
APPLICATIONS OF GAS INSULATED SUBSTATION (GIS), Power Engineering Society General Meeting, 2005. IEEE, Vol. 1, Issue, pp.920-926, 12-16 June 2005.
[EskomGISWG08] Eskom GIS WG, Gas Insulated Stations, ESKOM
INTRANET. http://acgdev/GIS/default.html Cited March 2008.
[Kelly 06] Kelly, R.A “Medium-Voltage Distribution Switchgear
Technologies - Developments and Solutions for End-Users”, 21st AMEU conference, South Africa, 16-18 October 2006.

41
[CigreWG 15.03 02] Cigre WG 15.03, LONG-TERM PERFORMANCE OF SF6
INSULATED SYSTEMS, Cigre Report 15-301, Paris, 2002.
[IEC 60517] IEC 60517 - Draft Document - Gas-insulated metal-
enclosed switchgear for rated voltages of 72.5 kV and above, 1990.
[IEEE Std C37.122] IEEE Std C37.122-1993 IEEE Standard for Gas-
Insulated Substations, Jun 1994. [IEC 62271-203] High-Voltage Switchgear and Controlgear - Part 203:
Gas-insulated metal-enclosed switchgear for rated voltages above 52 kV, Ed. 2.0, 2003.
[Hampton 92] Hampton, B.F, Pearson, J.S, Jones, C.J and Irwin, T.
EXPERIENCE AND PROGRESS WITH UHF DIAGNOSTICS IN GIS, Cigre Paper, 15/23-03, Session 1992.
[CigreWG 15.03 00] Cigre WG 15.03, PD MEASUREMENTS ON GIS OF
DIFFERENT DESIGNS BY NON-CONVENTIONAL UHF SENSORS, Cigre Report 15-305, Paris, 2000.
[Judd 96] Judd, M.D, Farish, O, Hampton, B.F. THE EXCITATION
OF UHF SIGNALS BY PARTIAL DISCHARGES IN GIS, IEEE Transactions on Dielectrics and Electrical Insulation, Vol.3, No.2, pp.213-228, April 1996.
[Kraus 99] Kraus, J.D and Fleisch, D.A. Electromagnetics with
Applications, 5th Edition, McGraw-Hill, 1999. [Schöffner 01] Schöffner, G., Boeck, W., Graf, R. and Diessner, A.
ATTENUATION OF UHF-SIGNALS IN GIL, paper 457 presented at 12th Int. Symp. on High Voltage Eng., Bangalore, pp. 453-456, 2001.
[Urban 02] Urban, R., Reader, H., Holtzhausen, J. AC
TRANSMISSION LINE CORONA NOISE ISSUES IN A SMALL CORONA CAGE, Africon Conference in Africa, 6th Africon conf, 2-4 Oct. pp. 639-644, vol.2, 2002.
[CigreWG 15.03 99] Cigre WG 15.03. PARTIAL DISCHARGE DETECTION
SYSTEM FOR GIS: SENSITIVITY VERIFICATION FOR

42
THE UHF METHOD AND THE ACOUSTIC METHOD. Electra No. 183, pp. 75-87, April 1999.
[Landstorfer 85] Landstorfer, F.M and Sacher, R.R. OPTIMISATION OF
WIRE ANTENNAS, Research Studies Press, England, Ch.3, pp.s44-69, 1985.
[Meijer 98] Meijer, S., Gulski, E., and Smit, J.J. PATTERN
ANALYSIS OF PARTIAL DISCHARGE IN SF6 GIS, IEEE Transactions on Dielectrics and Electrical Insulation, Vol. 5, No. 6, December 1998.
[Judd 01] Judd, M.D, Farish, O, Pearson, J.S, and Hampton, B.F.
DIECTRIC WINDOWS FOR UHF PARTIAL DISCHARGE DETECTION, IEEE Transactions on Dielectrics and Electrical Insulation, Vol.8, No.6, pp.953-958, December 2001.
[Baumgartner 74] Baumgartner, R.G, DIELECTRIC CHARACTERISTICS
OF MIXTURES OF SULFURHEXAFLUORIDE (SF6) AND NITROGEN (N2), IEE conference publication, No.115, pp366-369, September 1974.
[Pedersen 75] Pedersen, A., THE EFFECT OF SURFACE
ROUGHNESS ON BREAKDOWN IN SF6, IEEE Transactions on Power Apparatus and Systems, Vol. PAS-94, no. 5, September/October 1975.
[Boeck 03] Boeck, W., Graf, R., Finkel, M., EFFECT OF SURFACE
ROUGHNESS AND CURVATURE ON STREAMER INCEPTION AND BREAKDOWN OF N/SUB 2//SF/SUB 6/ MIXTURES, Proceedings of the 7th International Conference on Properties and Applications of Dielectric Materials, Volume 2, Issue 1-5, pp.543-546, June 2003.
[Hattori 88] Hattori, T., Honda, M., Aoyagi, H., Kobayashi, N., and
Terasaka, K. A STUDY ON EFFECTS OF CONDUCTING PARTICLES IN SF6 GASAND TEST METHODS FOR GIS, IEEE Transactions on Power Delivery, Volume: 3, Issue: 1, pp.197-204, Jan 1988.
[Metwally 03] Metwally, I.A., THEORETICAL ANALYSIS OF
PARTICLE INITIATED CORONA ACTIVITIES IN HYBRID GAS INSULATED TRANSMISSION LINES,

43
Electric Power Systems Research, Volume 66, Issue 2, Pages 123-131, August 2003.
[Indira 98] Indira, M.S and Ramu, T.S. THEORETICAL AND
EXPERIMENTAL MODEL FOR PARTICLE INITIATED BREAKDOWNS IN GIS, Conference Record of the 1998 IEEE International Symposium on Electrical Insulation, Arlington, Virginia, USA, 7-10 June 1998.
[Russel 2002] Russell, D., Mathematics. INTERNET.
http://math.about.com/library/blmeasurement.htm, Cited 20 Jan 08.
[Maxwell SV] Maxwell SV, Electromagnetic Field Simulation for High-
Performance Electromechanical Design, Student version, 2002.

44
APPENDIX A: ATTENUATION CALCULATION clear r = input ('Inner radius of the enclosure in mm '); r1 = r*0.001; c = (2.8)*10.^(8); % Inner conductor radius, m.s-1 rp= 1; % Relative permittivity of the material inside the duct fc=c./(3.41*r1*sqrt(rp)); % Cut-off frequency of the TE11 mode, Hz Mfc=fc./(10.^6); % Cut-off frequency in MHz Cutoffrequency = Mfc Mu = 1; Rho = 5*10.^(-8); n = 1; k = 1.84; Mu0 = 1; Eps0 = (8.85)*10.^(-12); f= 10:50:3000; %Plotting range & interal,MHz p = length(f); for i=1:1:p, if(f(i) < Mfc) Alpha(i) = ((8.67*2*pi*f(i))./c)*[sqrt(((Mfc./f(i)).^2)-1)]; % High attenuation for f<fc elseif (f(i) > Mfc) Z = (sqrt(Mu0./Eps0))./(sqrt((1-(Mfc./f(i)).^2))); Alpha(i) = ((8.69*sqrt(pi*Mu*Rho*f(i)))*((Mfc/f(i)).^2 + (n.^2/(k.^2-n.^2))))/(r1*Z*(sqrt(1-(Mfc/f(i)).^2))); % High attenuation for f>fc else end end AlphadB = 10*log(exp(2*Alpha*Z)); plot (f,AlphadB); xlabel('Frequency, (MHz)') ylabel('Attenuation, (dB/m)') title(['Attenuation of the TE11 mode']) grid
45
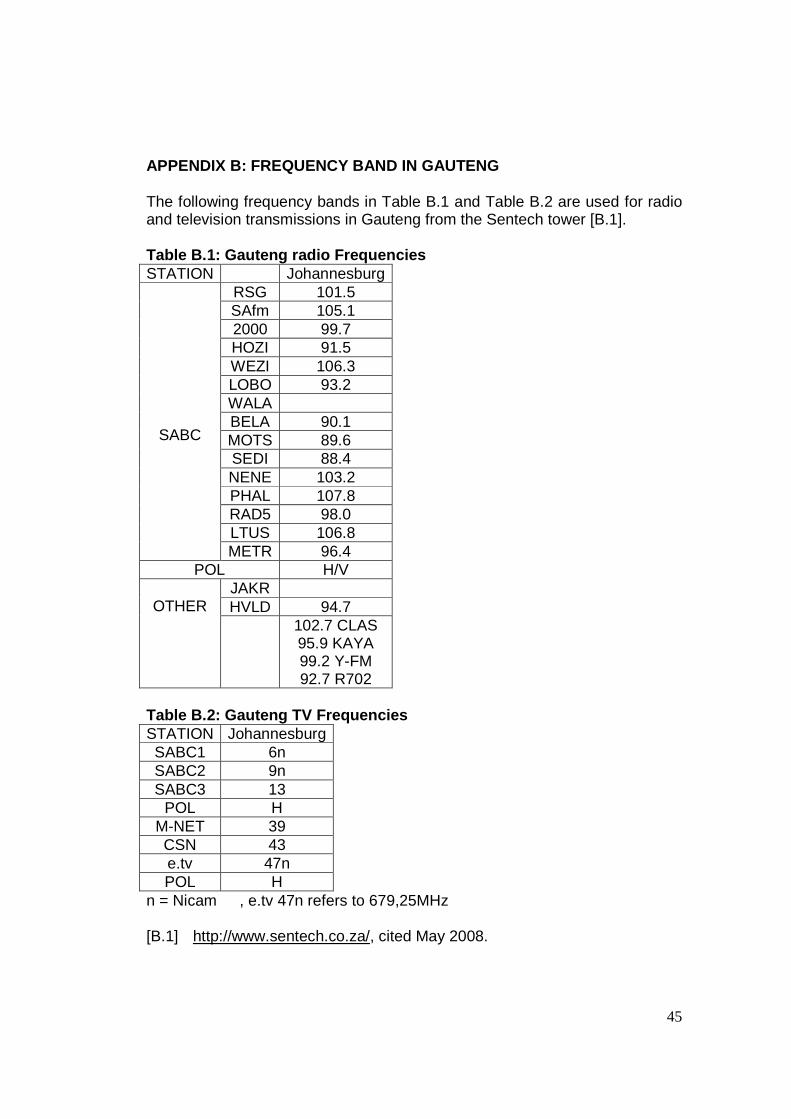
APPENDIX B: FREQUENCY BAND IN GAUTENG The following frequency bands in Table B.1 and Table B.2 are used for radio and television transmissions in Gauteng from the Sentech tower [B.1]. Table B.1: Gauteng radio Frequencies STATION Johannesburg
RSG 101.5 SAfm 105.1 2000 99.7 HOZI 91.5 WEZI 106.3 LOBO 93.2 WALA BELA 90.1 MOTS 89.6 SEDI 88.4 NENE 103.2 PHAL 107.8 RAD5 98.0 LTUS 106.8
SABC
METR 96.4 POL H/V
JAKR HVLD 94.7
OTHER
102.7 CLAS 95.9 KAYA 99.2 Y-FM 92.7 R702
Table B.2: Gauteng TV Frequencies STATION Johannesburg SABC1 6n SABC2 9n SABC3 13
POL H M-NET 39 CSN 43 e.tv 47n POL H
n = Nicam , e.tv 47n refers to 679,25MHz [B.1] http://www.sentech.co.za/, cited May 2008.

46
APPENDIX C: PARTICLE DIMENSIONS The dimensions for the defects are shown in Figures C.1-C.4.
Figure C.1: Sphere defect, r=4 mm, (Surface area = 201.06 mm2)
Figure C.2: Wire defect, r=4 mm h=8 mm, (Surface area = 201.06 mm2)
Figure C.3: Miscellaneous defect, w=5 mm, h=3 mm, l= 6, b=6 mm,
(Surface area = 208 mm2)
Figure C.4: Rectangular defect, w= 7, l= 8mm, h=4 mm (Surface area = 189 mm2)

47
APPENDIX D: HV LABORATORY SAFETY GUIDELINES The school of Electrical and Information Engineering have the guide to electrical safety in the laboratory areas. The book addresses three issues summarized below, which are general, dress code and general safety rules: D.1 General
• You are responsible for your own safety, and for the safety of others in the laboratory.
D.2 Dress Code
• No person who is not properly dressed and wearing the appropriate protective clothing will be permitted to enter a laboratory.
D.3 General Safety Rules
• Correct lifting equipment should be used. • Cables must be laid in such a way as not to pose a safety hazard and
floating cables must be marked with red tape to identify the lack of the protective-earth connection.
• Isolation transformers should be used in conjunction with all mains powered measured equipment.
• When making differential measurements or measurements at numerous points, care must be taken in the earthing strategy employed for the measurement equipment.
• The user of measurement equipment must first familiarise himself or herself with the operation and most importantly the maximum ratings of the inputs to the equipment.
• Never touch, interfere with or modify in any way another person’s experiment.
• Never enter the area of an experiment that has been demarcated with warning signs or chained off without the express permission of the experimenter.
• All voltage and current supplies are to be treated as live at all times. • Warning signs must be placed in a clearly visible position on all
equipment containing capacitors that could be charged to more than 100V.
• All AC supplies are to be fitted with over current circuit breakers of the correct rating on the primary side.
• No experiment is to be set up in such a way to block walk ways, prevent the switching off of the power at the main distribution board, and prevent access to fire fighting equipment.

48
• When an experiment is over, the experiment is to be dismantled and all equipment returned to its storage location.
• Using RF power in excess of 13dBm must be approved by the lab coordinator.
• All measurement equipment connected to the computer network must be powered by an earth-leakage unit on the computer supply circuits.

49
APPENDIX E: BREAKDOWN VOLTAGE CALCULATION clear delR = ((0:.01:6)/1000); %Plotting range & interal,mm px = mean(delR)*0.75*1e3; R1 = 0.060; % Inner conductor radius, m R2 = 0.200; % Outer conductor, inner radius, m pn2 = 3.2; % Partial pressure of Nitrogen psf6 = 0.8; % Partial pressure of SF6 ruf = 59/89; % Pederson's roughness coefficient for SF6 pn = pn2/(pn2+psf6); % Partial pressure of Nitrogen ps = psf6/(pn2+psf6); % Partial pressure of SF6 ks = 0.028; %Coefficient for alpha bar in SF6 ka = ks*ps; kc = 8.89e6; % Critical field at 1 bar in SF6 kn = 5.32e5; % Coefficient for alpha in N2 at 1 bar ki = 2.08e7; % Index coefficient for alpha in N2 at 1 bar kb = kn*pn; R = R1 + delR; pt = pn2+psf6; % Total pressure, bar V = input ('Voltage estimate in kV '); V1 = V *1000; ints = ka*V1*log(R/R1)/log(R2/R1)-ka*kc*pt*ruf*delR; %Streamer integral for SF6 intn = kb*V1/(ki*log(R2/R1))*(exp(-(ki*pt*log(R2/R1)*R1/V1))-exp(-(ki*pt*log(R2/R1)*R/V1))); %Streamer integral for N2 int = ints+intn; Intmax = max(int) Distance = delR(find(int>=max(int)))*1000 plot (delR*1000,int); xlabel('Distance from inner conductor, mm') ylabel('Integral') title(['Breakdown in 20% SF6 & 80% N2 mixture. psf6=',num2str(psf6),', pn2=',num2str(pn2),', pt=',num2str(pn2+psf6),', V=',num2str(V),'kV']) grid text(px,0.8*max(int),['Max integral ',num2str(max(int))]) text(px,0.7*max(int),[' at ',num2str(Distance),' mm']) text(px,3.5,['R1=',num2str(R1*1000),' mm']) text(px,2.5,['R2=',num2str(R2*1000),' mm']) text(px,1.5,['Roughness coefficient = ',sprintf('%.2f', ruf)])

50
APPENDIX F: PD ACTIVITIES MEASUREMENT
F.1 Steel and aluminium spherical shaped defects
(a) (b)
Figure F.1.1: PD activity for (a) steel and (b) Al sphere defect at 187 kV
(a) (b)
Figure F.1.2: PD activity for (a) steel and (b) Al sphere defect at 262 kV
(a) (b)
Figure F.1.3: PD activity (a) steel and (b) Al sphere defect at 337 kV
51
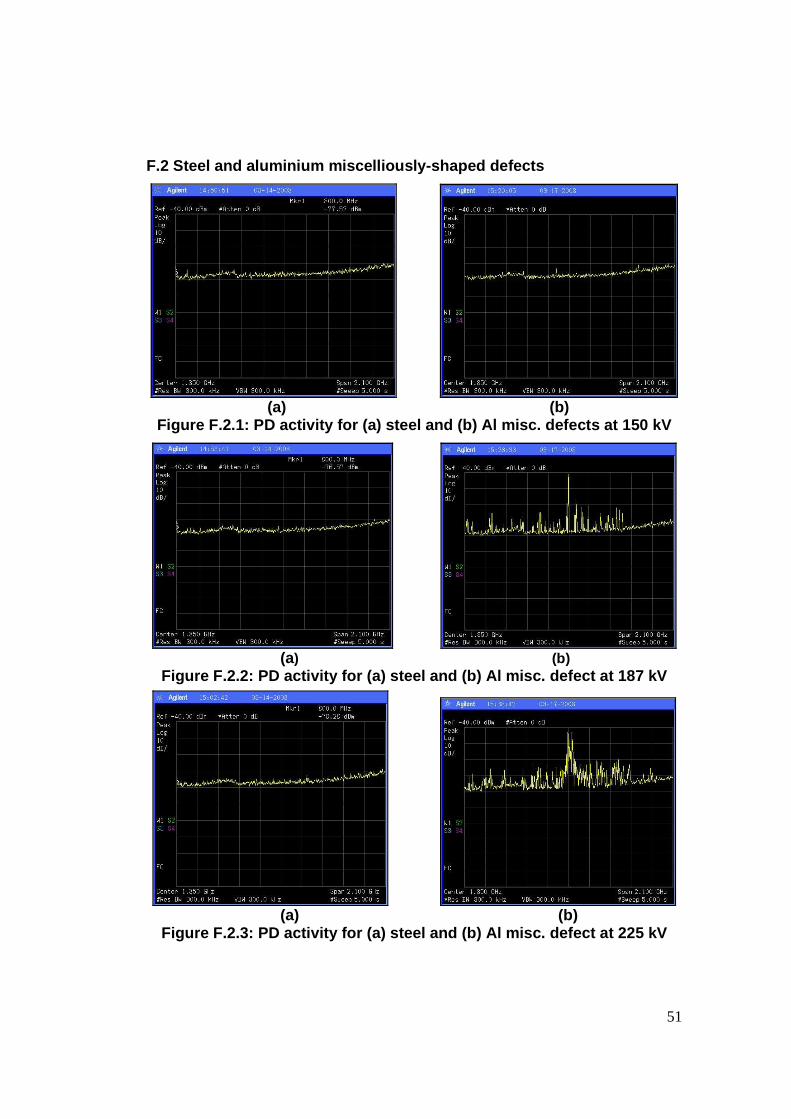
F.2 Steel and aluminium miscelliously-shaped defects
(a) (b)
Figure F.2.1: PD activity for (a) steel and (b) Al misc. defects at 150 kV
(a) (b)
Figure F.2.2: PD activity for (a) steel and (b) Al misc. defect at 187 kV
(a) (b)
Figure F.2.3: PD activity for (a) steel and (b) Al misc. defect at 225 kV

52
(a) (b) Figure F.2.4: PD activity for (a) steel at 337 kV and (b) Al misc. defect at
225 kV
F.3 Steel and aluminium cylindrical shaped defects
(a) (b)
Figure F.3.1: PD activity for (a) steel and (b) Al cylinder defect at 112 kV
(a) (b)
Figure F.3.2: PD activity for (a) steel and (b) Al cylinder defect at 150 kV

53
(a) (b) Figure F.3.3: PD activity for (a) steel and (b) Al cylinder defect at 187 kV
(a) (b) Figure F.3.4: PD activity for (a) steel and (b) Al cylinder defect at 225 kV
(a) (b) Figure F.3.5: PD activity for (a) steel and (b) Al cylinder defect at 262 kV

54
Figure F.3.6: PD activity for Al cylinder defect at 300 kV
F.4 Steel and aluminium rectangular defects
(a) (b)
Figure F.4.1: PD activity for (a) steel and (b) Al rect. defect at 150 kV
(a) (b)
Figure F.4.2: PD activity for (a) steel and (b) Al rect. defect at 187 kV

55
(a) (b)
Figure F.4.3: PD activity for (a) steel and (b) Al rect. defect at 225 kV
(a) (b)
Figure F.4.4: PD activity for (a) steel and (b) Al rect. defect at 262 kV
Figure F.4.5: PD activity for steel rectangular defect at 300 kV

56
APPENDIX G: SF6 AND N2 PROPERTIES G.1 Sulfur Hexafluoride (SF6) Some of the SF6 properties are: it is not flammable, it is non-toxic, it is a good insulator (being an electronegative gas), with a breakdown strength of about 3 times that of air. At normal temperatures, it is non-corrosive, and is fairly inert, although at temperatures above 500 °C it decomposes, and the decomposition products (Fluorine) react with several substances, especially any water vapor. Physical properties of SF6 are shown in Table C.1, [G.1, G.2]. Table G.1: Physical Properties of SF6 Molecular Weight 146.05 Melting point -50.8 °C Sublimation Temperature -63.9 °C Density (liquid at 50 °C) 1.98 g/mL Density (liquid at 25 °C) 1.329 g/mL Density (gas at 1 bar and 20 °C)
6.164 g/L
Critical temperature 45.6 °C Critical pressure 36.557 atm Critical density 0.755 g/mL Surface tension (at -50 °C) 11.63 dyne/cm Thermal conductivity 3.36E4 cal/s/sq
cm/K/cm Viscosity (gas at 25 °C) 1.61E-4 poise Boiling point -63.0 °C Specific heat (at 30 °C) 0.143 cal/g Relative density (air =1) 5.10 Vapor pressure (at 20 °C) 10.62 bar The current price is around R170/kg for the CP (chemically pure) grade. G.2 Nitrogen (N2) Nitrogen (N2) is a colourless, odorless and tasteless gas that makes up 78.09% (by volume) of the air we breathe. It is nonflammable and it will not support combustion. It is slightly lighter than air and slightly soluble in water. It is commonly used as an inert gas; but it is not truly inert. It forms nitric oxide and nitrogen dioxide with oxygen, ammonia with hydrogen, and nitrogen sulfide with sulphur. Nitrogen compounds are formed naturally through biological activity. Compounds are also formed at high temperature.

57
At high temperatures, nitrogen combines with active metals, such as lithium, magnesium and titanium to form nitrides. Nitrogen is necessary for various biological processes, and is used as a fertilizer, usually in the form of ammonia or ammonia-based compounds. Physical properties of N2 are shown in Table C.2 [G.3]. Table G.2: Physical Properties of N2
Substance Nitrogen Chemical Symbol
N2 Metric Units
Mol. Weight 28.01 Temp. °C -195.8 Boiling Point
@ 101.325 kPa Latent Heat of Vaporization
kJ/kg 199.1
Specific Gravity
Air = 1 0.9737
Specific Heat (Cp)
kJ/kg ° C 1.04
Gas Phase Properties @ 0 °C & @ 101.325 kPa
Density kg/m3 1.2506 Specific Gravity
Water = 1 0.808 Liquid Phase Properties @ B.P., & @ 101.325 kPa Specific Heat
(Cp) kJ/kg ° C 2.042
Temp. °C -210 Triple Point Pressure kPa abs 12.5 Temp. °C -146.9 Pressure kPa abs 3399
Critical Point
Density kg/m3 314.9 Sources: [G.1] http://www.spectra-gases.com/PureGases/sf6/SulfurHex.htm , cited
January 2007. [G.2] http://www.c-f-c.com/specgas_products/sulfurhex_sf6.htm, cited
January 2007. [G.3] http://www.uigi.com/nitrogen.html, cited February 2007.

58
APPENDIX H: GAS HANDLING PROCEDURE The safe working practice, storage and SF6 gas handling procedures required on SF6 gas-insulated apparatus are described. The rules and applicable standards entail that all compressed gases should be procured, transported, stored, and handled only in cylinders or containers that are fabricated, tested, maintained, and marked in accordance with the applicable specifications and requirements. H.1 Toxicity Noncontaminated gas or unused SF6 gas is odorless, tasteless, colourless, and non-toxic in its pure state. SF6 gas is approximately five times heavier than air and tends to collect in low places, in buildings or equipment. This collection can reduce oxygen levels and can cause suffocation. Suffocation can occur without warning if the oxygen content of air breathed is reduced from the normal. Electric arcs in SF6 gas form toxic gases, which in the presence of moist air have the characteristic odor of rotten eggs. Inhaling the gases can cause nausea, drowsiness, breathing difficulty, damage to the respiratory system and body organs, and death depending on the exposure level and the person's susceptibility. This is not a concern for laboratory tests which do not involve heavy electric arcing and exposure to the contaminated gas. H.2 Storage SF6 gas is supplied in pressurized cylinders, which like any gas cylinder is capable of being damaged or ruptured, by careless handling. Cylinders should never be left standing without secure protection against failing or being knocked over. Cylinders can develop accidental leaks. They should thus not be stored in an unventilated area where escaping gas can cause SF6 contamination build-up. The compressor’s storage tanks in the high voltage laboratory at the University of the Witwatersrand had contaminated gas from previous experiments, therefore empty gas cylinders were loaned from Eskom as shown in Figure E.1 below.

59
(a) (b)
Figure H.1: Used gas: (a) storage tanks and (b) contaminated gas stored in empty SF6 gas cylinders
H.3 SF6 Gas Handling When filling or retrieving SF6 gas from SF6-insulated apparatus, the ventilating equipment must be in operation. Personnel in the area should refrain from smoking. No exposed heaters, flames, or arc-producing equipment should be used in the area while the gas is being handled. Significant and audible leakage should not be tolerated at hose fittings due to the possibility of gas build-up in laboratory and due to environmental issues.