Embed Size (px)
Citation preview

Decision-tool for water allocation in the Volta Basin
1/14
DECISION-TOOL FOR WATER ALLOCATION IN THE VOLTA BASIN
Devaraj de Condappa1, Anne Chaponnière2, Jacques Lemoalle1
1Institut de Recherche pour le Développement, UMR G-EAU, Montpellier, France 2International Water Management Institute, Regional Office for Africa, Ghana, Accra Correspondance : [email protected]
Abstract A first version of a decision-tool for the management of the transboundary water resource of the Volta basin has been developed. A hydrological model by Kirby et al. has been used to provide the inputs to the WEAP allocation model. Both models were calibrated to describe the basin and to reproduce observed river flows and water stored in the hydroelectric reservoirs. As an application, the consequences on Lake Volta of a drier and a wetter climatic change scenario were considered. The inflow to the lake is highly sensitive to the rainfall over the basin, with an inter-annual variability of higher amplitude than the simulated climate shift. In all scenarios, the water demand for the operation of the hydropower scheme is often higher than the simulated available resource, even though a lower than present target for hydropower production had been set. This situation calls for a careful management of the water resource basin wide. The model is multipurpose, and may be further applied to other development issues, provided that the necessary data become available. Such issues may be increased used of irrigation in the upper basin or changes in water use by the increasing population in the basin.
I. Introduction The Volta Basin is located in West Africa within latitudes 5°45’ N and 14°10’ N and longitudes 2°17’ E and 5°20’ W. It is a transboundary basin of 394,100 km2, which lies mainly (83 %) in Ghana and Burkina Faso, while Benin, Togo, Côte-d’Ivoire and Mali share the remaining 17 %. Although the part of Togo is a small fraction of the basin (6.4 %), it covers a significant part of the country itself (47 %). This work will focus on the upstream Burkinabe and the downstream Ghanaian parts of the basin. The climate of the region is contrasted, from tropical in the south of the basin (around 1,500 mm/y of rainfall distributed in two rain seasons) to semi-arid in its northern part (less than 500 mm/y). Many African rivers (Nile, Niger, Senegal, Chari) flow from a humid upstream basin to a drier lower basin. They provide surface water to dry regions. To the contrary, the upper part of the Volta basin lies in semi-arid areas and the rivers, most of them being seasonal, flow toward the more humid lower basin and the Guinean Gulf. There is thus a priority to develop water conservation in Burkina Faso, with numerous small dams and some medium size reservoirs in the upper basin, while the Akosombo/Kpong hydroelectric compound lies in the lower part of the basin, only 90 km from the ocean. Lake Volta, which is the largest man-made lake in Africa, was created to generate hydropower at Akosombo (1,020 MW) and to meet the rapidly increasing demand for electricity by industries and populations in Ghana. Hydropower generation is a high priority on Ghana’s agenda. These different uses of water in different parts of the basin set the scene for the need of some consultation processes for water allocation, both within and between countries, in a context of climate change and a population increase at a rate of 2.5 to 3 % per year (Andah at al, 2004). This paper presents results from the Basin Focal Project - Volta, a part of the CGIAR Challenge Program on Water and Food. A first version of a decision-tool for water allocation in the Volta basin was developed, based on the hydrologic model of Kirby et al. (2006) coupled with the software Water Evaluation And

Decision-tool for water allocation in the Volta Basin
2/14
Planning (WEAP) of the Stockholm Environment Institute (Yates et al. 2005a; Yates et al. 2005b). First, the parameterization of the hydrologic model and WEAP will be presented. Next, the impact of two scenarios of climate change will be developed as an illustration.
II. Parameterization and calibration of the decision-tool The decision-tool developed in this work is composed of two coupled elements (Figure 1): the hydrologic model of Kirby et al. (2006) and the software Water Evaluation And Planning (WEAP). This section details these two elements, the input data, the parameterization of the Volta basin and its calibration. Scenarios will be developed in section III.
II.1. Hydrological modeling The first stage of the decision-tool is the hydrological modeling (Figure 1). The “Water use account spreadsheet” developed by Kirby et al. (2006) is used here. Groundwater behaviour has not been taken into account, due to the lack of data, and surface terms (runoff, river flows, evapotranspiration) have been considered. The spreadsheet requires as inputs the land use, a digital elevation model (DEM) and meteorological data. The DEM was analyzed to identify contributing areas to gauged sites (gauge stations), and generated 19 sub-basins (Figure 2).
“Water use account spreadsheet”
Kirby et al. (2006)WEAP
Calibration to reproduceobserved flows
0
1 000
2 000
3 000
4 000
5 000
6 000
7 000
1950 1953 1956 1959 1961 1964 1967 1970 1972
Observed flowCalculated flow
Meteorologicaldata
Parameters(landuse, DEM)
Observedflows
Simulatedriver flows
Water demandsin the basin
Observed data(storages and water releasesof hydroelectrical dams)
Calibration to reproduceobserved storages ofhydroelectrical dams
0
5
10
15
20
25
30
1979 1982 1984 1987 1990 1993 1995 1998
ObservedCalculated
Scenarios
Dia
logu
e / D
ecis
ion
Dia
logu
e / D
ecis
ion
Figure 1: Scheme of the decision-tool and its two stages: in blue, the hydrological modeling and in green the
water allocation modeling. The spatial and temporal distributions of rainfall have been extracted from the TS 2.1 data-set of the Climate Research Unit (see references) whereas the reference evapotranspiration (ET0) was calculated using the Hargreaves method, the minimum and maximum temperatures being extracted from the same TS 2.1 data-set. Figure 2 shows the 0.5° grid of the CRU over the Volta basin. The time period considered in this work is

Decision-tool for water allocation in the Volta Basin
3/14
1951 to 2000. It is assumed that CRU meteorological figures are actual data, although as interpolated data they might smooth natural variability. Next, land use pattern and meteorological data have been averaged within each sub-basin and the river flows have been calculated with the spreadsheet at the outlet of the 19 sub-basins. Please refer to Kirby et al. (2006) for a detailed description of the calculations steps implemented in the spreadsheet. The spreadsheet was calibrated with the available observed river flows between 1951 and 2000, taken from Bodo (2001). The data sets cover a variable part of the whole 1951-2000 period, and thus allow for more or less satisfactory calibrations according to the importance of the data set (Figure 3). The climate change which occurred in the north of the basin in the 70’s, coupled with the continuous increase of anthropogenic influences, have impacted the hydrological functioning. It entailed in particular an important increase of the runoff coefficient after 1970 in the northern part of the basin (Mahé et al., 2005). Unfortunately it was not possible to take this change into account since no observed data are available after 1990. Moreover, no observed flows were available for the Kompienga sub-basin at the time of this work. For the sake of clarity, all lacking data and assumptions / simplifications taken in this work are summarized in Table 5.
Figure 2: The sub-basins used in the hydrological modeling of the Volta basin, overlaid with the Climate Research Unit TS 2.1 data-set grid (0.5° space).
II.2. Water allocation modeling The water flows calculated with the spreadsheet have been used as inputs to the modeling of water allocation (Figure 1), with the software Water Evaluation And Planning (WEAP).
II.2.1. Parameterization of the Volta basin in WEAP The 19 sub-basins of Figure 2 were imported in WEAP as spatial modeling entities (Figure 4). Each river of a sub-basin is symbolized as a segment, ending with a tributary outlet (Figure 5). Four types of water use have been identified in the basin:
1. water demands, separated into three sub-categories: irrigation, domestic and livestock;

Decision-tool for water allocation in the Volta Basin
4/14
2. small reservoirs, noted SR, which are mostly informal / private arrangements and mainly located in Burkina Faso;
3. large irrigation dams, which are formal / state arrangements; 4. and large hydroelectric dams.
Estimation of these water uses will be developed below. For the sake of simplicity, the water uses distributed spatially in each sub-basin have been lumped in each category of water uses presented above, irrespective of their location. The runoff calculated by the spreadsheet of Kirby et al. (2006) within a sub-basin was lumped as well and injected as a head flow of the river-segment; in reality, this runoff is generated all along a sub-basin.
Nwokuy sub-basin, satisfactory Prang sub-basin, unsatisfactory
0
100
200
300
400
500
600
700
1951 1955 1959 1963 1967 1971 1975 1979 1983Years
Flow
(Mm
3)
Observed flow
Calculated flow
0
500
1 000
1 500
2 000
2 500
1951 1959 1967 1975 1983 1991 1999Years
Flow
(Mm
3)
Observed flow
Calculated flow
Figure 3: Calibration of some river discharge according to the data available.
Figure 4: Parameterization of the Volta basin in WEAP. In background (red), the hydrological sub-basins; in blue the river-segments the demands as red dots.
Figure 5: Focus on the Lerinord sub-basin, with its demands and the tributary outlets of Lerinord and Nwokuy, flowing into Dapola.
II.2.2. Water demands Water demands for the three sub-categories (irrigation, domestic and livestock) have been taken from Ministry of Works and Housing (1998), Direction Générale de l’Hydraulique(DGH, 2001),
Decision-tool for water allocation in the Volta Basin
5/14
Boubacar et al. (2005) and Nii Consult (2007). As data on groundwater utilization in the Volta basin is lacking, interactions with groundwaterhave not been taken into account. All values are reported in Table 1. Domestic and livestock demands were estimated from censuses (population in 2000, livestock in 1996, annual population growth) and per capita consumption (which differs among rural / urban population as well as between poultry / sheep / cattle). Three categories of irrigation demands were identified: • irrigation from large dams, which occurs at five specific large irrigated schemes (Sourou, Tono, Vea,
Yako Kanazoé and Ziga); • irrigation from Small Reservoirs (SR), which represents an important but unregistered demand: official
figures for this category do not exist and the demand was estimated here from specific data collected on SR;
• and finally small scale irrigation schemes, labelled as ‘Various’ in Table 1, which were estimated from figures of irrigated surface and from expert knowledge.
II.2.3. Small reservoirs Informal / private Small Reservoirs (SR) are mainly present in Burkina Faso. Their main characteristics are as follows : • water is used mostly for irrigation and, • no information on their physical properties (e.g., storage capacity, storage-water level relation) and
operation (e.g., inactive zone of the reservoir), neither on the water management (observed data on storage and water release) were available at the time of this work,
It has been assumed that: • water from a SR is consumed totally by (i) direct evaporation from the reservoir and (ii)
evapotranspiration in fields (the part which is percolating to the groundwater was neglected) and, • a SR can be modeled in WEAP as a water demand which is totally lost by the basin. As a SR may not be
entirely filled during the monsoon nor totally emptied after the dry season, the amount of this demand was arbitrarily taken equal to 75% of the reservoir storage capacity.
Figure 6: Sub-basins used in the hydrological modeling of the Volta basin, overlaid with 1,136 SR identified in the Burkinabe part of the basin plus 154 SR described by Liebe (2002) in the Upper East Region of Ghana.

Decision-tool for water allocation in the Volta Basin
6/14
DGH (Burkina Faso) has estimated the storage capacity of 1,453 dams in Burkina Faso, 1136 of them belonging to the Volta basin with an estimated total storage volume of 500.0 Mm3(Figure 6). Little information is available for informal/private SR in Ghana. Liebe (2002) and Liebe et al. (2005) identified dugouts and small reservoirs in the Upper East Region of Ghana (Figure 6) and estimated their total storage capacity as 16.2 Mm3. By extrapolation, the estimated total storage of SR in the Ghanaian part of the basin is 20.7 Mm3. The total of SR storage capacity in the basin is 520.7 Mm3. The associated water demand (75% of this total) is 390.5 Mm3/year and is reported in Table 1.
Table 1: The water demands in the Volta basin.
Various Large dam Small reservoirsArly - - - - 0.5Bamboi 11.5 3.8 - - -Dapola 17.4 12.5 19.2 - 64.5Ekumdipe 2.4 1.3 - - -Kompienga 3.0 3.3 - - 5.7Lerinord 4.3 3.5 - 89.0 4.3Mango - - - - 0.7Nanggodi 5.0 3.9 2.6 - 46.2Nawuni 23.4 13.4 - 82.0 19.0Noumbiel - - - - 2.5Nwokuy 13.1 5.5 46.4 188.0 30.2Pwalagu - - - - 16.5Sabari 7.1 2.6 26.9 - -Senchi 30.1 4.9 80.9 - -Yakala 38.4 16.3 66.2 - 118.8Wayen - - - 150.0 81.6Total 155.7 71.0 242.2 509.0 390.5
Domestic (Mm3/year)
Livestock (Mm3/year)
Irrigation (Mm3/year)
II.2.4. Large irrigation reservoirs Similarly to SR, it is assumed that a large irrigation reservoir can be modeled in WEAP as a water demand which is totally lost by the basin. The amount of this demand is equal to the storage capacity minus the inactive storage of the reservoir. When the inactive storage is unknown, the demand is taken equal to 75% of the total storage capacity. Five large irrigation reservoirs have been identified (Table 2). The water demands from these large irrigation reservoirs are reported in Table 1.
Table 2: Large irrigation reservoirs.
Dam Storage capacity (Mm3)
Inactive storage (Mm3)
Demand (Mm3) Sub-basin Source
Sourou 370 unknown 277 Lerinord and Nwokuy DGH (2001)
Tono 90 unknown 67 Nawuni Liebe et al. (2005) Vea 20 unknown 15 Nawuni Liebe et al. (2005)
Yako Kanazoé 100 50 50 Wayen http://aochycos.ird.ne/HTMLF/ PARTNAT/MEE/GRD_REAL.HTM
Ziga 200 100 100 Wayen DGH (2001)
Decision-tool for water allocation in the Volta Basin
7/14
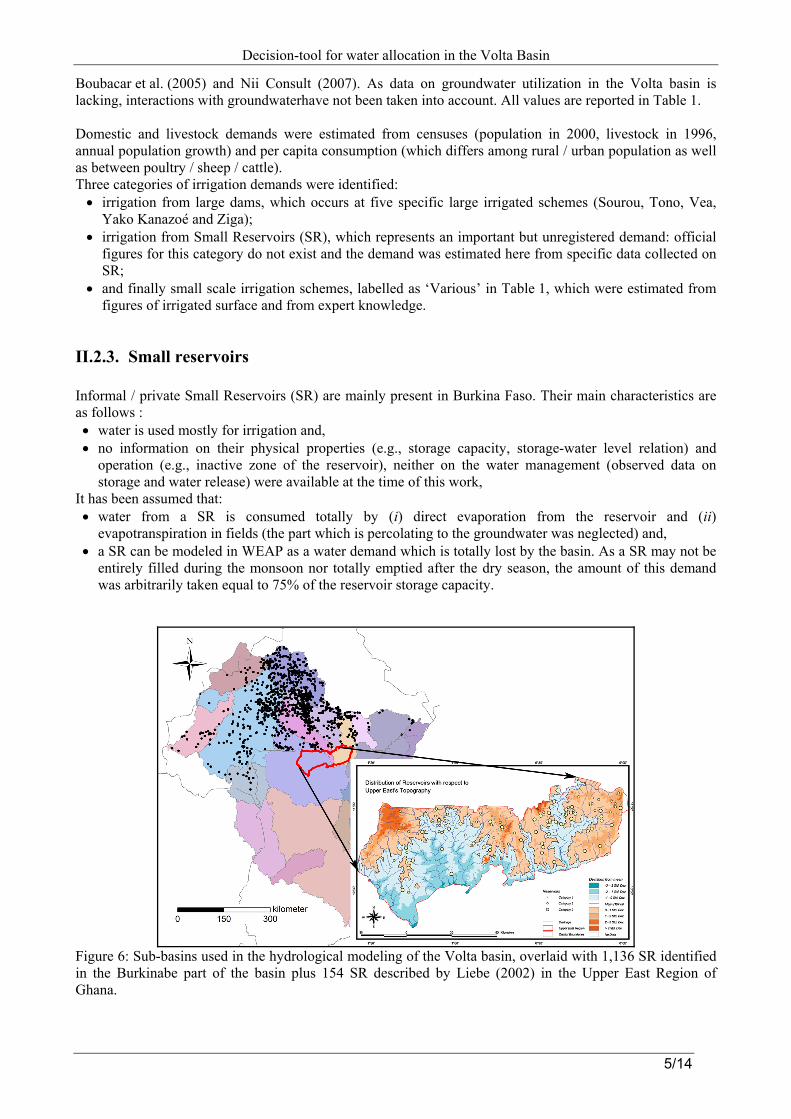
II.2.5. Large hydroelectric reservoirs Data from various sources for Akosombo, Bagré and Kompienga are presentad in Table 3. Additionally, the relation storage-water depth of the reservoirs was obtained from the Société Nationale d’Electricité du Burkina (SONABEL) and van de Giesen et al. (2001). Evaporation from a reservoir was assumed to be 0.7 x ET0, ET0 being the reference evapotranspiration and the coefficient 0.7 taken as advised by Allen et al. (1998). The net evaporation, i.e., evaporation minus rainfall, was reported in WEAP for each dam.
Table 3: Large hydroelectric reservoirs in the Volta basin.
Dam Storage capacity (Mm3)
Inactive storage (Mm3)
Turbined-water release target (Mm3/year)
Sub-basin Source
Akosombo 148,000 70,000 31,200 Senchi van de Giesen et al. (2001), Obeng-Asiedu (2004)
Bagré 1,700 400 800 Yakala SONABEL,
SIEREM (http://www.hydrosciences.org/sierem/)
Kompienga 2,025 500 550 Kompienga SONABEL,
SIEREM (http://www.hydrosciences.org/sierem/)
At least three additional parameters are required in WEAP to simulate a dam operation: • the target for water release through the turbines, which is related to the target for hydroelectric
production. It has been estimated from SIEREM data and from Obeng-Asiedu (2004), • the top of the buffer zone of the reservoir, below which turbined-water is constrained, • and the buffer coefficient, i.e., the rate of release of the fraction of water contained in the buffer zone.
Values of the two parameters related to the buffer zone are considered as calibration parameters (see II.2.7).
II.2.6. Priorities for water allocation First priority was for SR water demand. Indeed, SR are spread out on the area of a sub-basin (Figure 6) and drain runoff water before it may reach main rivers. Hence SR are considered as having an uncoordinated upstream position within each sub-basin. All other water demands have been given second priority.
II.2.7. Calibration of WEAP The objective of the calibration is to adjust the buffer parameters of hydroelectric reservoirs so as to reproduce observed variations of water storage. All the water demands, SR and large irrigation reservoirs introduced above, as well as the allocation priority, have been included in the modeling. Observed storage data are from SIEREM (see references), from van de Giesen et al. (2001) and Obeng-Asiedu (2004). It is reminded that lacking data and assumptions / simplifications taken so far are reported in Table 5. Final calibrations are reported in Figure 7 and Table 4. Results are poor for the case of Kompienga and especially Bagré. Two causes have been identified: • The main cause is due to the fact that our calibration of the hydrological model (spreadsheet of
Kirby et al. (2006)) does not take into account the increase of runoff coefficient that occurred in the 80’s in the sub-basins upstream of Bagré and Kompienga. Hence it is very likely that the calculated inflows are largely underestimated and simulated stored volumes are far below observed values.
• The other cause is, at the same time, a possible overestimation of small reservoirs storage (cf. Table 1). This could explain that the simulation of Bagré is particularly far from reality, as it is located downstream of the two sub-basins containing most of the SRs in Burkina Faso.

Decision-tool for water allocation in the Volta Basin
8/14
The simulations of mean levels of Lake Volta, as well as seasonal and inter-annual variations are satisfactory, although there are some differences. Simulated water storages are smaller than observations, but not as markedly as for Bagré and Kompienga. Indeed, calculated inflows to the Lake Volta are not as underestimated since: • the hydrological functioning (runoff coefficient) of the southern part of the basin did not change as
importantly as the northern part after 1980, • and rivers from humid south are the main contributors to inflows, • moreover, a possible overestimation of SR storage may not affect Akosombo as much as Bagré and
Kompienga. Additional causes of error are diverse and may be corrected when additional data are available (e.g., calibration of upstream demands, recent river discharge, SR storage volume, target for release of turbined-water). In this first step, the modeled water storage in Lake Volta by WEAP may be used to analyze trends resulting from different scenarios.
0
5
10
15
20
25
30
1979 1982 1984 1987 1990 1993 1995 1998
Wat
er h
eigh
t (m
)
ObservedWEAP modelling
Storage capacity(148,000 Mm3)
Top of inactive(70,000 Mm3)Top of buffer zone
(85,000 Mm3)
Figure 7: Final calibration of Lake Volta. Observed data from van de Giesen et al., (2001).
Table 4: Calibration parameters for large hydroelectric reservoirs Dam Top of buffer (Mm3) Buffer coefficient
Akosombo 85,000 0.1 Bagré 500 0.1
Kompienga 700 0.1
III. Scenarios In this work, emphasis has been given to the water stored in Lake Volta. Scenarios have been developed for 20 years, with year 2000 as initial condition. Two types of scenarios have been considered: • reference scenario, where no change occurs, especially no population growth, • climate change scenario.
In this work, no population growth has been considered and focus has been given to the development of a decision support tool. For scenarios with demographic changes, see for example the work of Nii Consult (2007). Assumptions are those mentioned in Table 5, and Table 6 summarizes the scenarios as they are presented below. The question to the model is: how does the Lake Volta behave in different climatic circumstances and rainfall changes?

Decision-tool for water allocation in the Volta Basin
9/14
Table 5: Lacking data and assumptions for modeling of the current account (year 2000). Category Lacking data Assumptions
Hydrology • Observed river flows after 1990. • Observed flows for the sub-basin
Kompienga.
• Groundwater is neglected. • Calculated runoff is lumped into a head flow
point in each sub-basin. • CRU meteorological data are considered as
actual data.
Large irrigation reservoir • Storage-water depth relation. • Observed data (storage and water
release).
• Considered as a water demand: o with no return flow to the river, o if the inactive storage is known, the
demand is taken equal to the storage capacity minus the inactive storage,
o otherwise it is taken equal to 75% of the storage capacity.
Large hydroelectric reservoir
• Target for water release. • Data on the reservoir buffer zone.
• Target for turbined-water release remains constant with time.
Small reservoirs (SR)
• Physical data (storage capacity and storage-water depth relation).
• Operational data (e.g., inactive zone of the reservoir).
• Observed data (storage and water release).
• SR are smaller than 10 Mm3. • No SR are present in middle and south of
Ghana. • All SR are lumped into a single term in each
sub-basin. • This term is considered as a water demand: o with no return flow to the river, o equal to 75% of the total storage of SR in
the sub-basin.
Water demands • Groundwater utilization. • Recent data.
• No population growth. • No interactions with groundwater. • No return flow to the river. • Irrigated surface is a good proxy for
irrigation demand estimation.
Table 6: Scenarios considered for 20 years, following the current account in 2000. Scenario for 20 years Meteorological data Demands
Reference CRU grids for the period 1980 to 2000 As in 2000
Drier CRU grids for the period 1980 to 2000, shifted 1° southwards As in the reference scenario
Wetter CRU grids for the period 1980 to 2000, shifted 1° northwards As in the reference scenario
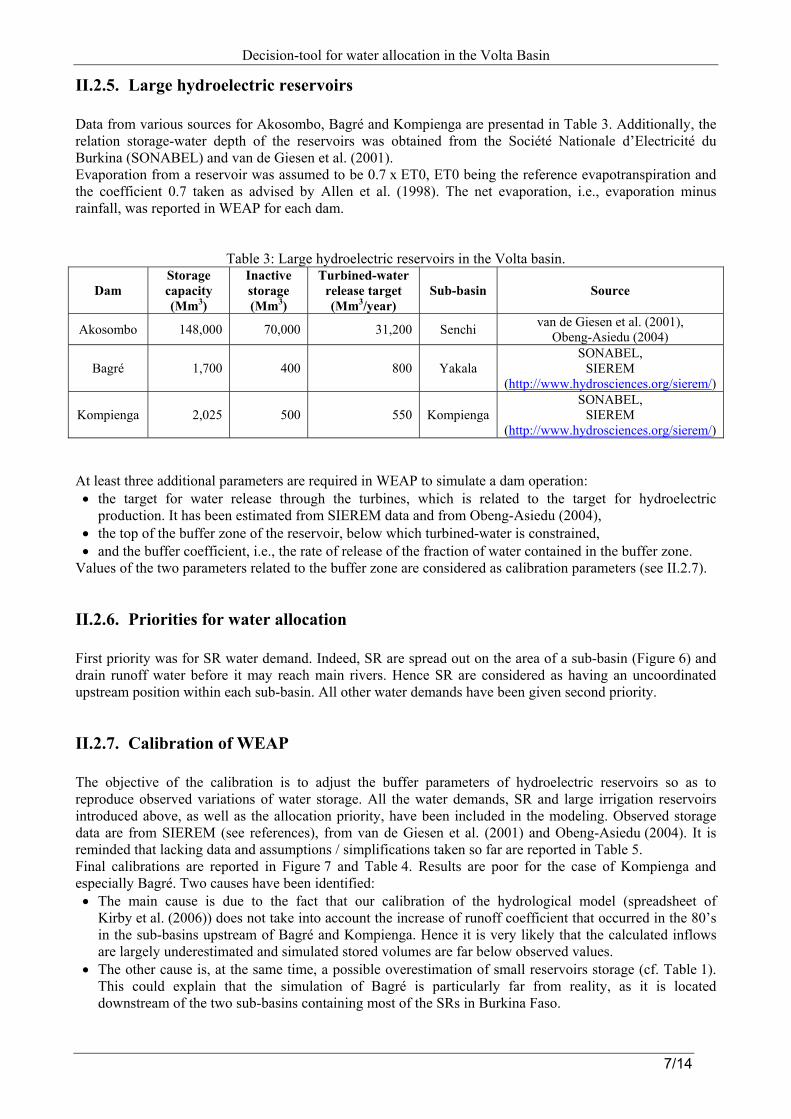
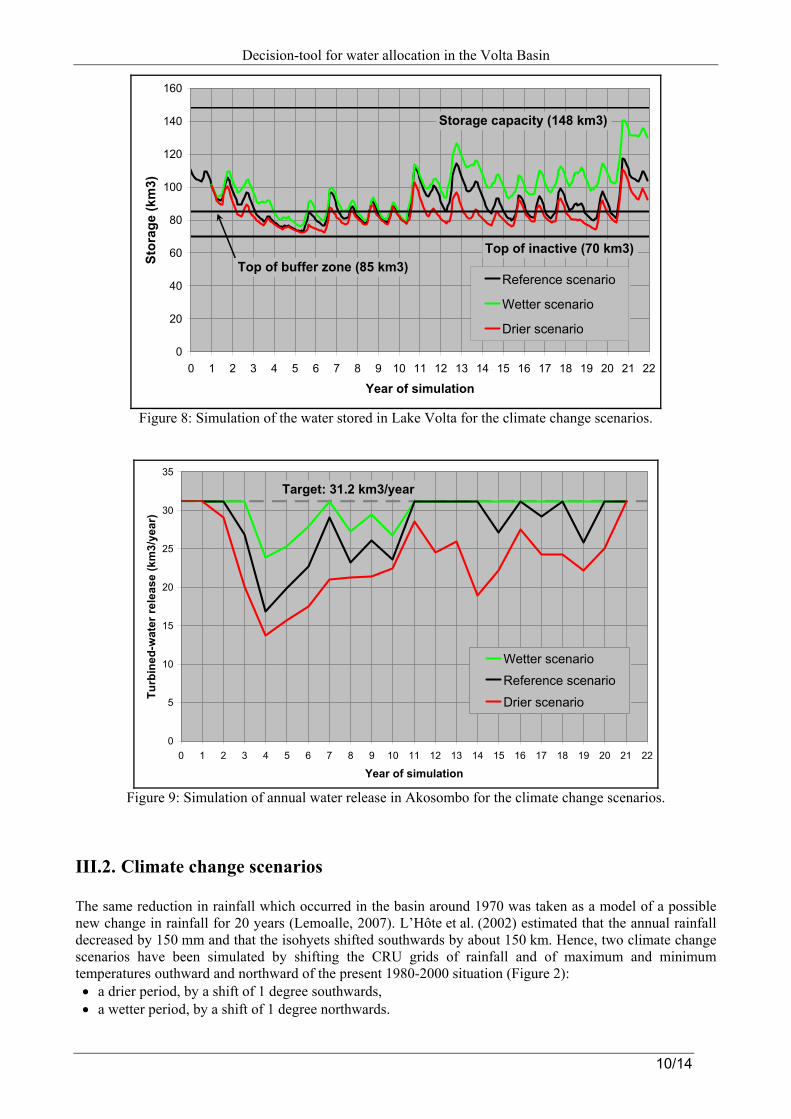
III.1. Reference scenario In this scenario of reference, WEAP is run for 20 years while all water demands and behaviors of reservoirs (SR, large irrigation and hydroelectricity) remain as in the year 2000. The yearly fluctuations in meteorological data (e.g., rainfall) and flows simulated from the spreadsheet of Kirby et al. (2006) for the period 1980 to 2000 (cf. Figure 3) are used as inputs to WEAP. Figure 8 shows the simulated stored volumes in Lake Volta. In this scenario of reference, Akosombo operation is always possible, in particular with the same target for release of turbined-water (31,200 Mm3/year). However, the use of water is restrained because the water level in the reservoir often falls below the top of buffer zone. This is visible in Figure 9: the annual water release is less than the target for several years of simulation. The target for release of turbined-water, which is related to the target for electricity production, was assumed to remain constant during 20 years in this scenario. This hypothesis is known to be wrong, but additional data on the functioning of Akosombo power station are presently lacking for a more realistic simulation.
Decision-tool for water allocation in the Volta Basin
10/14
0
20
40
60
80
100
120
140
160
0 1 2 3 4 5 6 7 8 9 10 11 12 13 14 15 16 17 18 19 20 21 22
Year of simulation
Stor
age
(km
3)
Reference scenario
Wetter scenario
Drier scenario
Top of inactive (70 km3)
Storage capacity (148 km3)
Top of buffer zone (85 km3)
Figure 8: Simulation of the water stored in Lake Volta for the climate change scenarios.
0
5
10
15
20
25
30
35
0 1 2 3 4 5 6 7 8 9 10 11 12 13 14 15 16 17 18 19 20 21 22
Year of simulation
Turb
ined
-wat
er re
leas
e (k
m3/
year
)
Wetter scenario
Reference scenario
Drier scenario
Target: 31.2 km3/year
Figure 9: Simulation of annual water release in Akosombo for the climate change scenarios.
III.2. Climate change scenarios The same reduction in rainfall which occurred in the basin around 1970 was taken as a model of a possible new change in rainfall for 20 years (Lemoalle, 2007). L’Hôte et al. (2002) estimated that the annual rainfall decreased by 150 mm and that the isohyets shifted southwards by about 150 km. Hence, two climate change scenarios have been simulated by shifting the CRU grids of rainfall and of maximum and minimum temperatures outhward and northward of the present 1980-2000 situation (Figure 2): • a drier period, by a shift of 1 degree southwards, • a wetter period, by a shift of 1 degree northwards.

Decision-tool for water allocation in the Volta Basin
11/14
III.2.1. Hydrological consequences Data from the shifted grids and for the reference period were computed for each sub-basin and given as an input for the hydrological model (spreadsheet of Kirby et al. (2006)). Figure 10 shows the calculated inflow to the lake Volta and the contributing rainfall (rain falling in the upstream contributing area). Departure from reference rainfall is slightly greater for the drier scenario and this deviation is accentuated for the calculated inflow.
-20
-10
0
10
20
30
40
50
60
0 1 2 3 4 5 6 7 8 9 10 11 12 13 14 15 16 17 18 19 20 21Year of simulation
Inflo
w to
the
Lake
Vol
ta
(km
3/ye
ar)
0
100
200
300
400
500
600
700
800
900
1000
Con
trib
utin
g ra
infa
ll (k
m3/
year
)
Reference scenarioWetter scenarioDrier scenario
Inflow
Rainfall
Figure 10: Annual inflow to the Lake Volta calculated by the spreadsheet of Kirby et al. (2006) and annual
contributing rainfall (falling upstream).
III.2.2. Consequences on Lake Volta Flows calculated by the spreadsheet of Kirby et al. (2006) have been used as inputs to WEAP as headflow of river-segments. Figure 8 shows the simulated storages of Lake Volta. In the drier scenario, the inactive storage limit is almost reached in years 5 and 6 of the simulation. In the wetter scenario, the inactive storage limit is never reached. Although inflow to Lake Volta is reduced in the drier scenario (Figure 10), the volume of stored water stays relatively similar to the reference scenario. This is due to the management of the buffer zone, where water use is strongly restrained (Figure 9). The water used for hydropower is reduced for both scenarios between the 3rd and the 10th year of simulation, after a very dry year (4th year, Figure 10). This shows that the lake does not recover quickly after dry years. Afterwards, the release target is always met in the wetter scenario, while it is hardly met in the drier scenario. Capacity to produce electricity appears therefore severely reduced in the drier scenario.

Decision-tool for water allocation in the Volta Basin
12/14
IV. Conclusion The aim of this work was to develop a first version of a decision-tool for the management of the Volta basin transboundary water resource. To that end, two models were coupled: the hydrological model of Kirby et al. (2006) and the software WEAP developed by the Stockholm Environment Institute (Yates et al. 2005a; Yates et al. 2005b). Both models were parameterized to describe the basin and to reproduce observed river flows and storage of hydroelectric reservoirs. As an application, a drier and a wetter climatic change scenario were considered through a shift of the CRU meteorological grids by 1 degree southwards and northwards respectively. Consequences on Lake Volta were analyzed. The inflow to the lake is highly sensitive to the rainfall over the basin, with an inter-annual variability of higher amplitude than the simulated climate shifts. In all scenarios, the water demand for hydropower operation is often higher than the simulated available resource, even though a lower than present target for hydropower production had been set. This situation calls for a careful basin wide management of the water resource. This work will be presented to stakeholders of the basin and training will be provided for its utilization. As a final caveat, it must be kept in mind that the tool has been parameterized and calibrated for the basin with limited data on river flows and water uses or demands (cf. Table 5), hence further tuning must be realized with additional data. The model is multipurpose and may be further applied to other development issues, provided that the necessary data are available. Such issues may be: • a scenario of increase in number of small reservoir, as these arrangements are prone to develop in an
uncontrolled / uncoordinated manner, • the groundwater recharge and use, • trends for other water demands, such as urban use and population growth.
References Allen, R. G., L. S. Pereira, D. Raes and M. Smith (1998). Crop evapotranspiration - Guidelines for
computing crop water requirements. FAO Irrigation and drainage paper 56, FAO, Rome. Downloadable from
http://www.fao.org/docrep/X0490E/x0490e00.htm (accessed January 2008).
Andah W., N. van de Giesen, A. Huber-Lee and C. A. Biney (2004). Can we maintain food production
without losing hydropower? The Volta basin (West Africa). pp 181-194 In Climate change in contrasting
river basins, J.C.J.H. Aerts & P. Droogers eds, CABI Publ. Wallingford UK, 264 p.
Bodo, B.A. (2001). Annotations for Monthly discharge data for world rivers (excluding former Soviet
Union). Available from http://dss.ucar.edu/datasets/ds552.1/ (accessed January 2008)
Boubacar Barry, B. E. Obuobie, M. Andreini, W. Andah, M. Pluquet (2005). Volta River Basin Synthesis.
IWMI/Comprehensive Assessment of Water Management in Agriculture.
Climate research Unit: http://www.cru.uea.ac.uk/cru/data/hrg/cru_ts_2.10/

Decision-tool for water allocation in the Volta Basin
13/14
Direction Générale de l’Hydraulique (2000). Ouvrages de mobilisation des ressources en eau. Inventaire et
pertinence du suivi. Version provisoire. Ministère de l’environnement et de l’eau, Ouagadougou, Mai 2000.
Direction Générale de l’Hydraulique (2001). Etat des Lieux des Ressources en Eaux du Burkina Faso et de
leur Cadre de Gestion. Ministère de l’Environnement et de l’Eau, Ouagadougou.
L’Hôte, Y., G. Mahé, B. Somé and J.-P. Triboulet (2002). Analysis of a Sahelian annual rainfall index from
1896 to 2000; the drought continues. Hydrological Sciences Journal, 47: 563-572.
Liebe, J (2002). Estimation of water storage capacity and evaporation losses of small reservoirs in the Upper
East Region of Ghana. Diploma thesis. University of Bonn.
Liebe, J., N. van de Giesen, M. Andreini (2005). Estimation of small reservoir storage capacities in a semi-
arid environment. A case study in the Upper East Region of Ghana. Physics and Chemistry of the Earth, 30:
448-454
Kirby, M., M. Mainuddin, M. ud-Din Ahmad, P. Marchand and L. Zhang (2006). Water use account
spreadsheets with examples of some major river basins. 9th International River Symposium, Brisbane, 3-6
September 20006. Downloadable from www.riversymposium.com/index.php?element=06KIRBYMac
(accessed January 2008).
Lemoalle J. (2007). Global trends in the Volta basin. BFP Volta Reports Series, CPWF/IRD, 23 p.
Mahe, G., J.-E. Paturel, E. Servat, D. Conway and A. Dezetter (2005). The impact of land use change on soil
water holding capacity and river flow modelling in the Nakambe River, Burkina-Faso. Journal of Hydrology,
300: 33-43.
Ministry of Works and Housing (1998). Water Resources Management Study, Information ‘Building Block’
Study. Part II, Volta Basin System, Groundwater Resources. Ministry of Works and Housing, Accra.
Nii Consult (2007). Water Audit Volta Basin. Project for Improving Water Governance in the Volta River
Basin. Final report. IUCN/BRAO, Ouagadougou, August 2007.
Obeng-Asiedu, P. (2004). Allocating water resources for agricultural and economic development in the Volta
river basin. Doctoral thesis, University of Bonn, Germany. Downloadable from http://www.glowa-
volta.de/publications/printed/thesis_pobenga.pdf (accessed January 2008).
SIEREM: http://www.hydrosciences.org/sierem/

Decision-tool for water allocation in the Volta Basin
14/14
van de Giesen, N., M. Andreini, A. van Edig and P. Vlek (2001). Competition for water resources of the
Volta basin. Proceedings of the sixth IAHS scientific assembly, Maastricht, the Netherlands.
Yates D., J. Sieber, D. Purkey and A. Huber-Lee (2005a). WEAP21 – A Demand-, Priority- and Preference-
Driven Water Planning Model: Part 1, Model Characteristics. Water International, 30: 487-500.
Yates D., D. Purkey, J. Sieber, A. Huber-Lee and H. Galbraith (2005b). WEAP21 – A Demand-, Priority-,
and Preference-Driven Water Planning Model: Part 2, Aiding Freshwater Ecosystem Service Evaluation.
Water International, 30: 501-512.