Embed Size (px)
Citation preview
Decision Support Systems 51 (2011) 745–759
Contents lists available at ScienceDirect
Decision Support Systems
j ourna l homepage: www.e lsev ie r.com/ locate /dss
Predicting stock market returns from malicious attacks: A comparative analysis ofvector autoregression and time-delayed neural networks
Lara Khansa a,⁎, Divakaran Liginlal b
a Department of Business Information Technology, Virginia Polytechnic Institute and State University, Blacksburg, VA, United Statesb Carnegie Mellon University in Qatar, Doha, Qatar
⁎ Corresponding author at: Pamplin College of BusiInformation technology, 2062 Pamplin Hall (0235), BlackStates. Tel.: +1 540 231 5003.
E-mail addresses: [email protected] (L. Khansa), liginlal@
0167-9236/$ – see front matter © 2011 Elsevier B.V. Aldoi:10.1016/j.dss.2011.01.010
a b s t r a c t
a r t i c l e i n f oAvailable online 1 February 2011
Keywords:Malicious attacksStock priceTime-delayed artificial neural networkVector autoregression
With the growing importance of Internet based businesses, malicious code attacks on information technologyinfrastructures have been on the rise. Prior studies have indicated that these malicious attacks are associatedwith detrimental economic effects on the attacked firms. On the other hand, we conjecture that more intensemalicious attacks boost the stock price of information security firms. Furthermore, we use artificial neuralnetworks and vector autoregression analyses as complementary methods to study the relationship betweenthe stock market returns of information security firms and the intensity of malicious attacks, computed as theproduct of the number of malicious attacks and their severity levels. A major contribution of this work is theresulting time delayed artificial neural network model that allows stock return predictions and is particularlyuseful as an investment decision support system for hedge funds and other investors, whose portfolios are atrisk of losing market value during malicious attacks.
ness, Department of Businesssburg, VA 24061–0101, United
cmu.edu (D. Liginlal).
l rights reserved.
© 2011 Elsevier B.V. All rights reserved.
1. Introduction
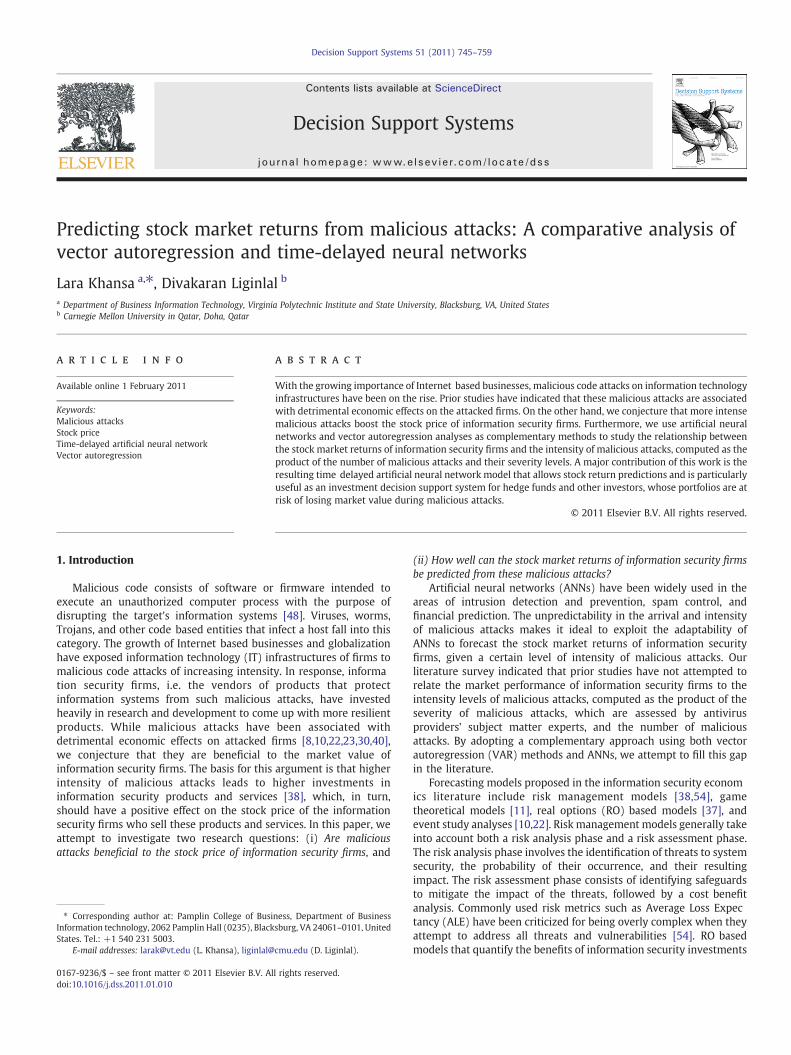
Malicious code consists of software or firmware intended toexecute an unauthorized computer process with the purpose ofdisrupting the target's information systems [48]. Viruses, worms,Trojans, and other code based entities that infect a host fall into thiscategory. The growth of Internet based businesses and globalizationhave exposed information technology (IT) infrastructures of firms tomalicious code attacks of increasing intensity. In response, information security firms, i.e. the vendors of products that protectinformation systems from such malicious attacks, have investedheavily in research and development to come up with more resilientproducts. While malicious attacks have been associated withdetrimental economic effects on attacked firms [8,10,22,23,30,40],we conjecture that they are beneficial to the market value ofinformation security firms. The basis for this argument is that higherintensity of malicious attacks leads to higher investments ininformation security products and services [38], which, in turn,should have a positive effect on the stock price of the informationsecurity firms who sell these products and services. In this paper, weattempt to investigate two research questions: (i) Are maliciousattacks beneficial to the stock price of information security firms, and
(ii) How well can the stock market returns of information security firmsbe predicted from these malicious attacks?
Artificial neural networks (ANNs) have been widely used in theareas of intrusion detection and prevention, spam control, andfinancial prediction. The unpredictability in the arrival and intensityof malicious attacks makes it ideal to exploit the adaptability ofANNs to forecast the stock market returns of information securityfirms, given a certain level of intensity of malicious attacks. Ourliterature survey indicated that prior studies have not attempted torelate the market performance of information security firms to theintensity levels of malicious attacks, computed as the product of theseverity of malicious attacks, which are assessed by antivirusproviders' subject matter experts, and the number of maliciousattacks. By adopting a complementary approach using both vectorautoregression (VAR) methods and ANNs, we attempt to fill this gapin the literature.
Forecasting models proposed in the information security economics literature include risk management models [38,54], gametheoretical models [11], real options (RO) based models [37], andevent study analyses [10,22]. Risk management models generally takeinto account both a risk analysis phase and a risk assessment phase.The risk analysis phase involves the identification of threats to systemsecurity, the probability of their occurrence, and their resultingimpact. The risk assessment phase consists of identifying safeguardsto mitigate the impact of the threats, followed by a cost benefitanalysis. Commonly used risk metrics such as Average Loss Expectancy (ALE) have been criticized for being overly complex when theyattempt to address all threats and vulnerabilities [54]. RO basedmodels that quantify the benefits of information security investments

746 L. Khansa, D. Liginlal / Decision Support Systems 51 (2011) 745–759
have also been developed [37]. However, these RO based modelsimpose assumptions on the distribution of malicious attacks. Incontrast, our analyses in this paper are based on actual records ofmalicious attacks and hard financial stock market data. Further, eventstudy analyses have been conducted to relate security breachesresulting from malicious attacks to the stock price of informationsecurity firms [10,22]. Event studies only capture the momentaryimpacts of security breaches around the time of their announcements.In this paper, we relate the time series of malicious attacks to that ofthe stock market returns of information security firms and study theirdynamic relationship over time. We first make use of VAR analysis toinvestigate this relationship, in the Granger causality sense [24]. VARanalysis, in the context of this paper, is a better fit than otherregression methods because it captures time lagged effects andfeedback between variables. These effects and feedback are particularly relevant in time series data where relationships betweenvariables could go both ways. One could argue that when the marketvalue of information security firms increases, their ability to innovateand reduce the intensity of future malicious attacks increases as well.Sims [52] advocated the use of VAR models for such analyses becausethey make no a priori assumptions regarding the relationshipsbetween variables, thus avoiding the identification restrictions ofstructural models. After we have established the significance betweenour model's variables and the time lag using VAR analysis, we useANN based analytical methods that complement VAR analysis byeffectively mapping complex nonlinearities without specification ofassumptions regarding the statistical distribution or properties of theunderlying data.
The remainder of this paper is organized as follows. Section 2provides a background to the research in the subject disciplines,surveys contemporary literature, and develops our hypothesis.Section 3 covers the research design, including a discussion of thedata collection methods and measures. VAR analysis and results arepresented in Section 4. The time delayed ANN based analysis,comparisons with the results of VAR, and sensitivity analyses withrespect to ANNparameters and data quality are presented in Section 5.Section 6 discusses the implications, contributions, and limitations ofthe study, and avenues for future research.
2. Theoretical background
Malicious attackers can be classified as one of three types: amasquerader who is not a legitimate user but attempts to exploit alegitimate user account, a misfeasor who is a legitimate user butattempts to access resources to which he/she does not have usagepermission, and a clandestine user who attempts to gain administrative control of the system [56]. What all these types of intrudershave in common is that they all need a way into the system theydesire to access. There exist many ways in which to gain access to asystem, such as tricking a legitimate user over the telephone or byemail into releasing account details. However, one of the mostpopular means of gaining entry is by exploiting software bugs, alsocalled vulnerabilities, in host operating systems or Web applicationsthat are running on Web servers. Software vendors have beenshown to follow the strategy of releasing their products early andfixing them later through patching [3,44], especially when themarket size and the degree of competition are high. Spier [55]showed that if manufacturers have the ability to repurchase theirdefective product, they have fewer incentives to design saferproducts. In a sense, software vendors have the ability to“repurchase their product” or more accurately they can repairtheir product without a physical recall. They can “ship” a patch to auser and have the user “install” the solution. The fact that softwarevendors do not have to physically recall their products from thecustomer could lessen their incentives to reduce vulnerabilities.Anderson [2] concluded that software vendors are capable of
creating more secure software but that the economics of thesoftware industry provide few incentives to encourage the development of more secure products and that the idea of shipping theproduct now and fixing the bugs later is a perfectly rationalapproach. The number of software vulnerabilities has increaseddramatically over the years. Even in recent years, Symantec, a majorantivirus provider (http://www.symantec.com), reported a 19%increase in documented vulnerabilities from 2007 to 2008, andthat, in parallel, new malicious code signatures have increased by anastonishing 265% in 2008 compared to 2007.
A parallel exists between vulnerabilities in software and vulnerabilities in manufactured products. This paper, therefore, draws uponthe research stream studying the effect of product defects on themarket value of related firms, whether attacked firms or firmsproducing solutions for these defects. Bad reputation and lack ofcustomer satisfaction have been shown to affect future customerbehavior and, in turn, the level, timing, and risk of future cash flowsof suppliers [5,12,29,32,33,35,48,50,51,63]. Chen et al. [12] showedthat firms are better off being passive in responding to productrecalls because proactive strategies are perceived by investors as asignal of larger financial losses to the firm. Rhee and Haunschild [48]tested automobile recalls from 1975 to 1999 and found that highlyreputable firms are punished more upon product recalls than lessreputable firms. Rupp [51] found that recalls initiated by thegovernment were as damaging to shareholders as other recalls.White and Pomponi [63] reported the costs of recalls to consumerproducts companies to be more than 6 billion US$ per year. Kampand Burton [35] reported that Medtronic's fourth quarter 2008earnings fell 69% due to charges of product flaws and a safety notice.Mattel recalled millions of toys in 2007 and reported a cost of30 million US$ related to those recalls. The costs (tangible andintangible) to Toyota of their recent recalls are expected to beastronomical. Early estimates of the cost of these recalls reach2 billion US$ [32]. There are several studies that illustrate thenegative effects of product recalls on firm value. Jarrell and Peltzman[33] found that drug recalls by the Food and Drug Administration(FDA) resulted in an average 6% loss in stock equity values for theaffected firms. Moreover, some of the effects of the recall on stockequity values spilled over to other drug companies not directlyaffected by the recall. Similarly, Rubin et al. [50] estimated thatproduct recalls by the U.S. Consumer Product Safety Commissionresulted in an average 7% reduction in the stock equity values of thefirms involved. Hendricks and Singhal [29] recounted the negativeeffects of supply chain glitches that resulted in production andshipment delays, on the market value of suppliers.
In the particular realm of information security, several researchers have investigated the impact of information security breaches onthe market value of affected firms. Goel and Shawky [23] studiedsecurity breaches over the period 2004 2008 and noted a significantly negative impact on the market value of breached firms.Campbell et al. [8] found that only breaches linked to loss ofconfidential information had significant negative effects on the stockprice of firms, while the impact of non confidential breaches werenot significantly different from zero. Hovav and D'Arcy [30] alsostudied the impact of denial of service attack announcements on themarket over 4.5 years and showed that the market penalizes“Internet specific” companies more than other companies. Liginlalet al. [40] found that investors' confidence in a financial firm'scontinuity is particularly abated after a human error related privacybreach. Cavusoglu et al. [10] studied the change in market value offirms whose systems had been breached. The study showed that theannouncement of a security breach decreased the market capitalization values of a firm, on average, by 2.1 billion US$ within twodays of the breach. Furthermore, the study demonstrated asignificant information transfer effect to information security firms.Garg et al. [22] reported similar findings and confirmed this transfer

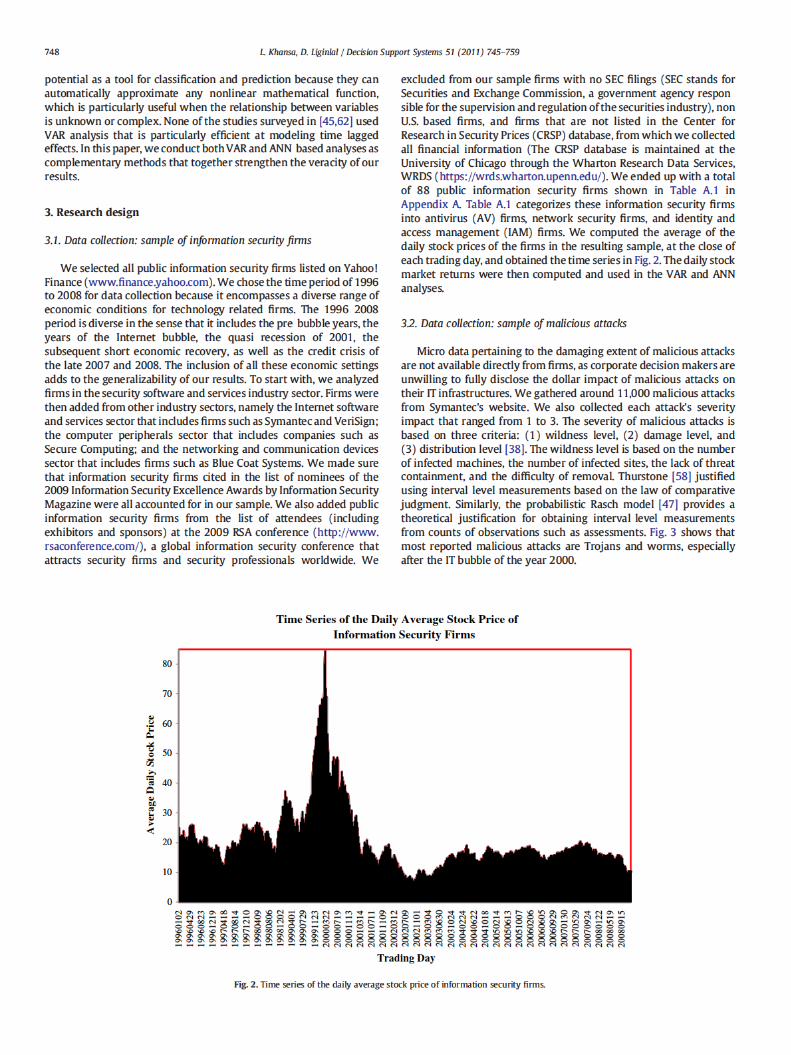


Fig. 5. Response of security return index to a unit shock in malicious intensity (~300-day horizon).
751L. Khansa, D. Liginlal / Decision Support Systems 51 (2011) 745–759
information security firms, while controlling for the market index.Joint significance tests confirmed that all included variables areindispensible. We found a significant Granger causality effect ofmalicious intensity on the stock market returns of informationsecurity firms (coefficient=0.005583, p valueb0.01, Lag=30 days).After controlling for the market index, a 1 month lagged increase inmalicious intensity has a positive effect on the stock market returns ofinformation security firms. In Table 3, we use DIFi to denote ith orderdifferencing. We further confirmed the significance of the selectedlagged variables using the variance decomposition method, based onimpulse response functions, which permits us to study the responseof each variable to a unit shock in another variable. These impulseresponse functions study how a particular variable in the systemresponds to unit changes in another variable, while all other shocksare held at zero.
Fig. 5 represents the graph of the impulse response correspondingto our hypothesis, with 1% error bands. The x axes in the figuresrepresent the forecast horizon for 10 months (approximately300 days) forward. The y axes represent the response of a givendependent variable to a unit shock in a given independent variable,while holding constant the remaining variables. The two timestandard error band corresponds to the point wise 99% confidenceinterval of each innovation response. When the two time standarderror band is above (below) the horizontal axis, the response issignificantly positive (negative). The results from Fig. 5 confirm, at the1% significance level, a Granger causality effect of malicious intensityon the stock market returns of information security firms.
Other interesting results are also revealed in Table 3. Maliciousintensity is shown to be negatively associated with prevailing marketconditions (coefficient=−55.724480, p valueb0.01, Lag=60 days).This is consistent with the results in [38] where it was shown thatmalicious attacks get more virulent in down markets. On the otherhand, when the stock market is thriving, firms and individualshave more cash on hand to invest in information security, whichhelps in alleviating the negative effects of malicious attacks. Table 3also shows that malicious attacks can have a long term negativeeffect on the stock market (coefficient=−0.014095, p valueb0.05,lag=90 days). In fact, it has been shown that security breaches thatcould result from malicious attacks have a significant negative effecton the stock price of breached firms [8,23,30,40]. The overall negativeeffect of malicious attacks on the stock market indicates that theirnegative consequences on the stock price of breached firms far moreoutweighs their benefits vis à vis the market value of informationsecurity firms.
5. Time-delayed ANN-based analysis
Numerous studies have proposed ANNs as a viable and evenbetter alternative than regression analysis for classification andprediction problems. ANNs have been widely used for financialforecasting [9,36,57,59,64 66]. The application of ANNs to information security has been used in the areas of intrusion detection andprevention, and spam detection and control [14]. To relate lagged
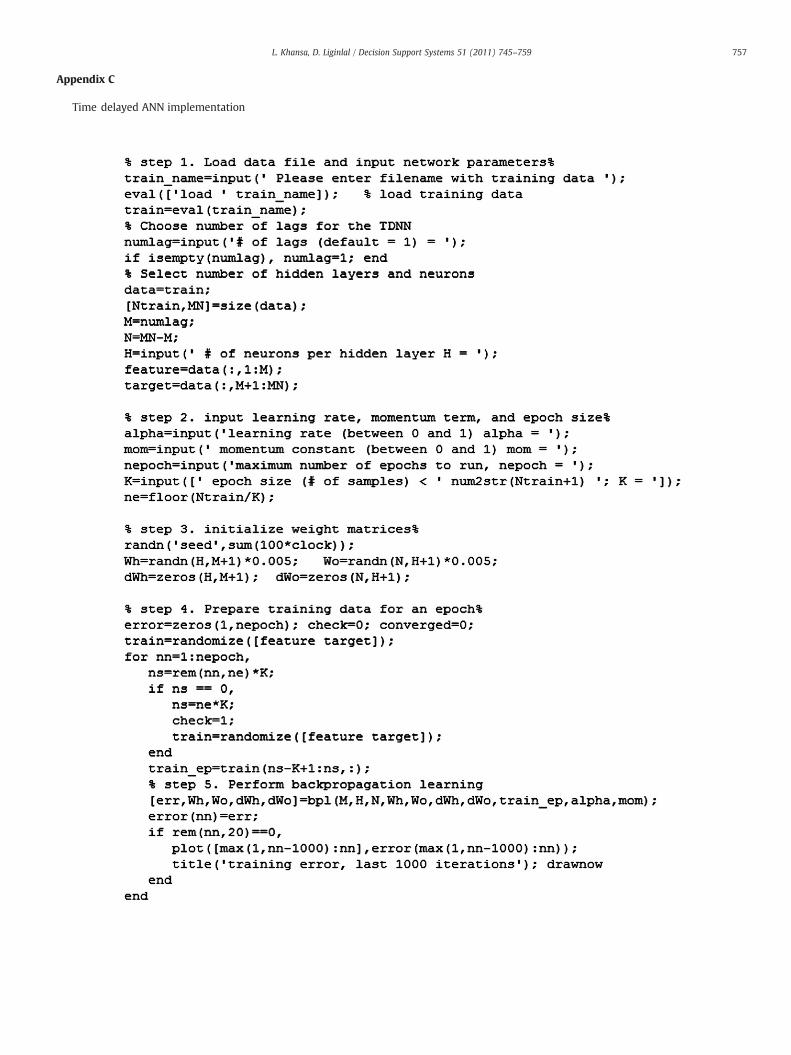
versions of the variables, as was done for the VAR analysis inSection 4, we propose to use the time delayed ANN structure, anonlinear time series model that is time lagged. Time delayed ANNshave been shown to be particularly useful for forecasting stockprices [68]. A time delayed ANN is based on a multilayer perceptron(MLP) neural network design in which the input is formed by adelayed segment of a time series [28]. The algorithm and MATLABcode for the time delayed ANN model implementation are given inAppendix C [31]. The inputs to our model are the daily aggregatedintensity of malicious attacks and the daily levels of the NYSE/AMEX/NASDAQ value weighted index. The output is the security returnindex that is used as a proxy for the stock market performance of theinformation security market segment.
We divided the time series into a training sample to build themodel and a testing sample to validate its performance. Althoughthere are no clear cut guidelines on how to partition datasets intotraining and testing sub samples, Hair et al. [26] recommends a threeto one split between the two samples. We correspondingly dividedour data points into three quarters training data and one quartertesting data. The backpropagation (BP) algorithm is employed to trainthe network; this is because Cybenko [16] recognized the power of theBP algorithm to approximate any continuous function using a feedforward network of appropriate topology. To achieve backpropagation learning, the activation function needs to be both bounded anddifferentiable so that it can implement the underlying gradient searchweight updating formula. We chose the logistic function as theactivation function for the output layer, as recommenced in [28].Although other considerations, such as choosing the epoch size (i.e.the size of the batch of data that are swept through during eachtraining and testing run of the MLP neural network), learning rate,momentum term, termination criteria, among others, are necessaryfor the software implementation of the MLP neural network, thispaper only discusses a select set of MLP design and implementationissues relevant to our problem. We refer the interested reader to [28]for an extensive and more general coverage of the subject. Manyresearchers have proposed different heuristic methods to determinethe required number of neurons for optimal ANN performance.Haykin [28] conjectured thatN input patterns require (N−1) neuronsin the single hidden layer network case and argued that simplenetworks have more effective generalizing capabilities than morecomplex networks do with more hidden layers. Smaller networkslearn and operate more quickly [25] because the shortage of unitsforces the algorithm to develop general rules to discriminate betweeninput patterns, whereas it would otherwise tend to learn each item ofdata as a special case [17]. Accordingly, we selected the simplest MLPtopology to avoid over fitting.We used twometrics, namely adjustedR2 and the mean square error (MSE), to evaluate a particular MLPtopology.
5.1. Comparative results
The time delayed ANN topology with only one hidden layer andfour neurons gave a relative predictive accuracy of 95%, 93.44%

55.00%
60.00%
65.00%
70.00%
75.00%
80.00%
85.00%
90.00%
95.00%
100.00%
55.00% 65.00% 75.00% 85.00% 95.00% 105.00%Monthly Predictive Accuracy
Dai
ly P
redi
ctiv
e A
ccur
acy
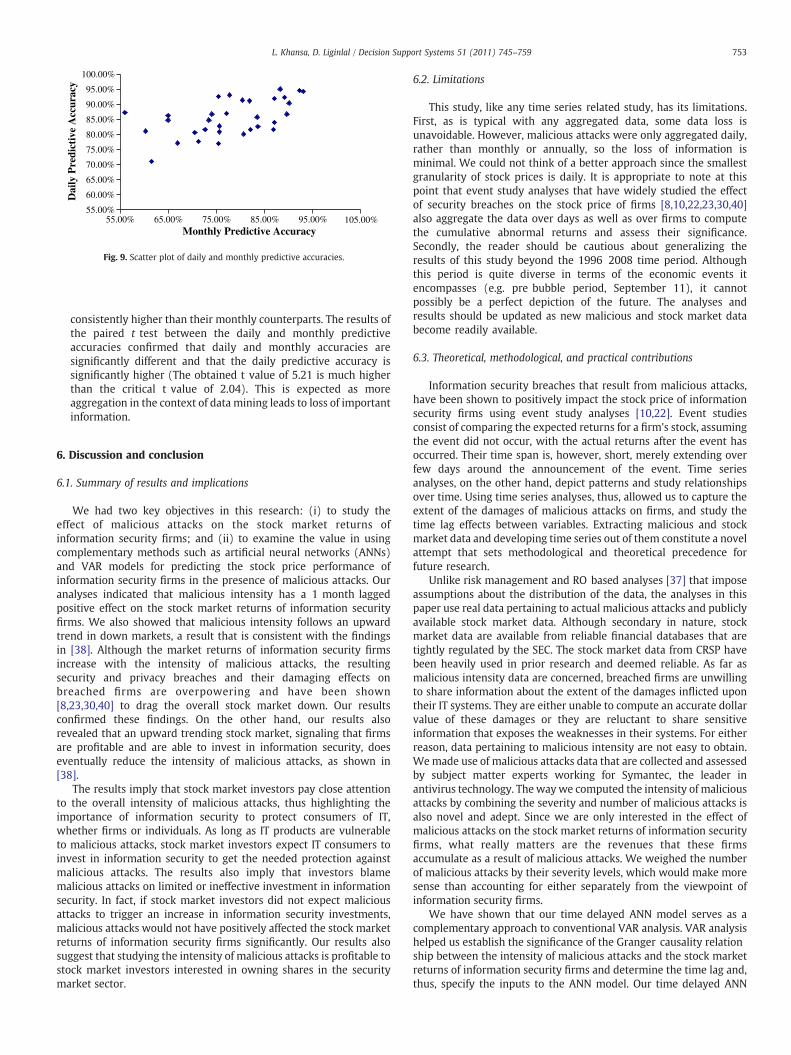
Fig. 9. Scatter plot of daily and monthly predictive accuracies.
753L. Khansa, D. Liginlal / Decision Support Systems 51 (2011) 745–759
consistently higher than their monthly counterparts. The results ofthe paired t test between the daily and monthly predictiveaccuracies confirmed that daily and monthly accuracies aresignificantly different and that the daily predictive accuracy issignificantly higher (The obtained t value of 5.21 is much higherthan the critical t value of 2.04). This is expected as moreaggregation in the context of data mining leads to loss of importantinformation.
6. Discussion and conclusion
6.1. Summary of results and implications
We had two key objectives in this research: (i) to study theeffect of malicious attacks on the stock market returns ofinformation security firms; and (ii) to examine the value in usingcomplementary methods such as artificial neural networks (ANNs)and VAR models for predicting the stock price performance ofinformation security firms in the presence of malicious attacks. Ouranalyses indicated that malicious intensity has a 1 month laggedpositive effect on the stock market returns of information securityfirms. We also showed that malicious intensity follows an upwardtrend in down markets, a result that is consistent with the findingsin [38]. Although the market returns of information security firmsincrease with the intensity of malicious attacks, the resultingsecurity and privacy breaches and their damaging effects onbreached firms are overpowering and have been shown[8,23,30,40] to drag the overall stock market down. Our resultsconfirmed these findings. On the other hand, our results alsorevealed that an upward trending stock market, signaling that firmsare profitable and are able to invest in information security, doeseventually reduce the intensity of malicious attacks, as shown in[38].
The results imply that stock market investors pay close attentionto the overall intensity of malicious attacks, thus highlighting theimportance of information security to protect consumers of IT,whether firms or individuals. As long as IT products are vulnerableto malicious attacks, stock market investors expect IT consumers toinvest in information security to get the needed protection againstmalicious attacks. The results also imply that investors blamemalicious attacks on limited or ineffective investment in informationsecurity. In fact, if stock market investors did not expect maliciousattacks to trigger an increase in information security investments,malicious attacks would not have positively affected the stock marketreturns of information security firms significantly. Our results alsosuggest that studying the intensity of malicious attacks is profitable tostock market investors interested in owning shares in the securitymarket sector.
6.2. Limitations
This study, like any time series related study, has its limitations.First, as is typical with any aggregated data, some data loss isunavoidable. However, malicious attacks were only aggregated daily,rather than monthly or annually, so the loss of information isminimal. We could not think of a better approach since the smallestgranularity of stock prices is daily. It is appropriate to note at thispoint that event study analyses that have widely studied the effectof security breaches on the stock price of firms [8,10,22,23,30,40]also aggregate the data over days as well as over firms to computethe cumulative abnormal returns and assess their significance.Secondly, the reader should be cautious about generalizing theresults of this study beyond the 1996 2008 time period. Althoughthis period is quite diverse in terms of the economic events itencompasses (e.g. pre bubble period, September 11), it cannotpossibly be a perfect depiction of the future. The analyses andresults should be updated as new malicious and stock market databecome readily available.
6.3. Theoretical, methodological, and practical contributions
Information security breaches that result from malicious attacks,have been shown to positively impact the stock price of informationsecurity firms using event study analyses [10,22]. Event studiesconsist of comparing the expected returns for a firm's stock, assumingthe event did not occur, with the actual returns after the event hasoccurred. Their time span is, however, short, merely extending overfew days around the announcement of the event. Time seriesanalyses, on the other hand, depict patterns and study relationshipsover time. Using time series analyses, thus, allowed us to capture theextent of the damages of malicious attacks on firms, and study thetime lag effects between variables. Extracting malicious and stockmarket data and developing time series out of them constitute a novelattempt that sets methodological and theoretical precedence forfuture research.
Unlike risk management and RO based analyses [37] that imposeassumptions about the distribution of the data, the analyses in thispaper use real data pertaining to actual malicious attacks and publiclyavailable stock market data. Although secondary in nature, stockmarket data are available from reliable financial databases that aretightly regulated by the SEC. The stock market data from CRSP havebeen heavily used in prior research and deemed reliable. As far asmalicious intensity data are concerned, breached firms are unwillingto share information about the extent of the damages inflicted upontheir IT systems. They are either unable to compute an accurate dollarvalue of these damages or they are reluctant to share sensitiveinformation that exposes the weaknesses in their systems. For eitherreason, data pertaining to malicious intensity are not easy to obtain.Wemade use of malicious attacks data that are collected and assessedby subject matter experts working for Symantec, the leader inantivirus technology. The waywe computed the intensity of maliciousattacks by combining the severity and number of malicious attacks isalso novel and adept. Since we are only interested in the effect ofmalicious attacks on the stock market returns of information securityfirms, what really matters are the revenues that these firmsaccumulate as a result of malicious attacks. We weighed the numberof malicious attacks by their severity levels, which would make moresense than accounting for either separately from the viewpoint ofinformation security firms.
We have shown that our time delayed ANN model serves as acomplementary approach to conventional VAR analysis. VAR analysishelped us establish the significance of the Granger causality relationship between the intensity of malicious attacks and the stock marketreturns of information security firms and determine the time lag and,thus, specify the inputs to the ANN model. Our time delayed ANN
754 L. Khansa, D. Liginlal / Decision Support Systems 51 (2011) 745–759
model resulted in 95% predictive accuracy, compared to around 85%for the regression counterpart.
The time delayed ANN implementation can be further compiledinto an Excel plug in using the MATLAB Excel builder (http://www.mathworks.com). The resulting decision support system serves as aninvestment tool for mutual funds, hedge funds, and other investorswho wish to balance their portfolios and protect them against stockprice fluctuations resulting from security breaches. For example,hedge funds investing in information retrieval services companies,such as Amazon, Yahoo!, Ebay, and Google are at risk of losingsignificant market value upon the occurrence of malicious attacks andtheir resulting security breaches, which are especially debilitating forthese information service providers. These hedge funds can use theproposed time delayed ANN model and decision support system todetermine how much to invest in the information security marketsector, thereby reducing the risk of losing money as a result ofmalicious attacks.
6.4. Avenues for future work
As future work and to gain even more accurate and statisticallysound predictions, we propose to augment the time delayed ANNswith genetic algorithms (GAs), whose unstructured search and
Table A.1List of public information security firms (Stock ticker in parentheses).
Public antivirus (AV) firms Public network security firms
CyberGuard Corp (CGFW) Applied Theory Corp (ATHY) Trusted InformatiSystems (TISX)
eLinear Inc (ELU) Cavium Networks Inc (CAVM) Verint Systems InGuardian Technologies (GRDN) C-COR Electronics Inc (CCBL) WatchGuard Tech
Inc (WGRD)McAfee Inc (MFE) Checkpoint Software (CHKP) Websense (WBSN
Procera Networks Inc (PKT) Citrix Systems (CTXS)Symantec Corp (SYMC) Cylink Corp (CYLK)
Diversified Security Solutions (DVS)
E-Biz Solutions Inc (EBIZ)EFJ Inc (EFJI)eSoft Inc (ESFT)
F5 Networks (FFIV)GRIC Communications Inc (GRIC)
Info Resource Engineering Inc (IREG)International Network Services (INSS)Internet Sec Sys Inc (ISS)
ITI Technologies Inc (ITII)
Kanbay International (KBAY)
Litronic Inc (LTNX)NetLogic Microsystems (NETL)NetScreen Technologies Inc (NSCN)Network Associates Inc (NET)Network Engines (NENG)NPS International Corp (NPSZ)Rainbow Technologies Inc (RNBO)SafeNet Inc (SFNT)
Secure Computing (SCUR)SonicWALL (SNWL)Sourcefire Inc (FIRE)SteelCloud inc (SCLD)
Appendix A
decision trees assist ANNs in the task of variable selection. GAs canbe used to better select the time delayed ANN architecture includingthe number of hidden layers and number of hidden neurons in everylayer. GAs can also be used to determine the variables from the inputlayer that have the highest correlation with the stock return output.As such more characteristics of malicious attacks, including their type(e.g. Trojans, worms) and origin, can be accounted for in the model.We also plan to incorporate attackers, firms, and other meaningfulactors into the framework to add more realism and flexibility to ouranalyses.
We believe this paper raised interesting research issues throughthe proposed measures, methodologies, model, and findings that willhelp other researchers make sense of quantifiable malicious intensityand widely available financial data.
Acknowledgements
The authors would like to thank Professor Yu Hen Hu, whoseguidance on an earlier project provided motivation for this research.We would also like to thank the Editors, especially Professor JamesMarsden, and the three anonymous reviewers for their valuablecomments and suggestions.
Public identity and access management (IAM) firms
on ActivCard Corp (ACTI) L-1 Identity Solutions Inc (ID)
c (VRNT) Adaptive Solutions Inc (ADSO) Liska Biometry Inc (LSKA)nologies Alien Technology Corp (RFID) Macrovision Corp (MVSN)
) Applied Digital Solutions Inc(ADSX)
Netegrity Inc (NETE)
AuthenTec Inc (AUTH) NetIQ Corp (NTIQ)AXENT Technologies Inc (AXNT) Novell Inc (NOVL)Bindview Development Corp(BVEW)
Phoenix Technologies Ltd(PTEC)
Blue Coat Systems Inc (BCSI) RSA Security Inc (RSAS)Cogent Inc (COGT) Saflink Corp (SFLK)Cognizant Tech Solutions Corp(CTSH)
Security Dynamics Technologies(SDTI)
Commun Intelligence Corp (CICI) Tegal Corp (TGAL)Convera Corp (CNVR) Transcrypt International Inc
(TRII)CyberSource Corp (CYBS) TSL Inc (TSLI)Digital Angel Corp (DOC) TTR Technologies Inc (TTRE)Digital Biometrics Inc (DBII) Tumbleweed Communications
Corp (TMWD)Document Security Systems Inc(DMC)
VASCO Corp (VAS)
Double-Take Software Inc(DBTK)
VASCO Data Security Intl Inc(VDSI)
Entrust Inc (ENTU) VeriSign Inc (VRSN)ePresence Inc (EPRE) Viisage Technology Inc (VISG)First Data Corp (FDC) WidePoint Corp (WYY)I D Systems Inc (IDSY) Zebra Technologies Corp (ZBRA)Identix Inc (IDNX) Zix Corp (ZIXI)Imageware Systems Inc (IW)Intelli-Check Inc (IDN)InterTrust Technologies Corp(ITRU)iPass Inc (IPAS)IQ Biometrix Inc (IQBM)


4746
38
56
42
52
3540
454339
44
50
25
3740
33
404443
24
30
54
393535
31
3837
2931
23
32
2628
21
3433
25
37
2727
36
3030282726
3739
3035
30
2225
3331262425
5
0
10
20
30
40
50
60
1 3 5 7 9 11 13 15 17 19 21 23 25 27 29 31 2 4 6 8 10 12 14 16 18 20 22 24 26 28 30
20042003
Daily Number of Attacks (2003-2004)
5555
46
64
76
48
56
3943
534846
5255
26
4647
38
494848
27
34
62
43393837
4143
33
4035
48
3539
29
4843
39
48
3833
444040
363635
454742
4641
3134
4143
323230
6
0
10
20
30
40
50
60
70
80
1 3 5 7 9 11 13 15 17 19 21 23 25 27 29 31 2 4 6 8 10 12 14 16 18 20 22 24 26 28 30
20042003
Daily Intensity of Attacks (2003-2004)
414237
33
27
36
42
2529
39
28
34
25
5257
3134
22
44
25
4746
333840
2934
38
24
32
2521
24
18182121
3233
17
27
182123
2020
32
24
3328
34
252526
14
25242225
1823
18
0
10
20
30
40
50
60
1 3 5 7 9 11 13 15 17 19 21 23 25 27 29 31 2 4 6 8 10 12 14 16 18 20 22 24 26 28 30
20062005
Daily Number of Attacks (2005-2006)
58
66
5047
37
50
65
33
42
57
41
48
34
79
4948
38
68
37
6466
46
5763
4549
52
35
4439
24
32
23222324
3738
20
29
2125
2822
25
40
29
373640
303229
18
312725
31
20
2722
0
10
20
30
40
50
60
70
80
1 3 5 7 9 11 13 15 17 19 21 23 25 27 29 31 2 4 6 8 10 12 14 16 18 20 22 2426 28 30
20062005
Daily Intensity of Attacks (2005-2006)
24
9 9
15
23
13
1618
20
25
1818
21
30
2018
141211
1615
23
19
14
18171918
24
17
9
6
121414
7
15141313
17
1212
5
1011
810
15
10
16
91112
8
11
18
10
20
13
5 6
0
5
10
15
20
25
30
1 3 5 7 9 11 13 15 17 19 21 23 25 27 29 31 2 4 6 8 10 12 14 16 18 20 22 24 26 28 30
20082007
Daily Number of Attacks (2007-2008)
30
1011
18
27
15
19
25
21
29
2120
24
36
2323
141412
1817
30
25
15
20202221
27
19
96
12
1615
7
15151314
18
1212
7
1211910
19
11
19
121114
8
13
19
10
20
13
76
0
5
10
15
20
25
30
35
40
1 3 5 7 9 11 13 15 17 19 21 23 25 27 29 31 2 4 6 8 10 12 14 16 1820 2224 26 28 30
20082007
Daily Intensity of Attacks (2007-2008)
Table B.1 (continued)
756 L. Khansa, D. Liginlal / Decision Support Systems 51 (2011) 745–759
757L. Khansa, D. Liginlal / Decision Support Systems 51 (2011) 745–759
Appendix C
Time delayed ANN implementation

758 L. Khansa, D. Liginlal / Decision Support Systems 51 (2011) 745–759
References
[1] E. Alfaro, N. Garcia, M. Gamez, D. Elizondo, Bankruptcy forecasting: an empiricalcomparison of AdaBoost and neural networks, Decision Support Systems 45 (1)(2008) 110–122.
[2] R. Anderson, Why information security is hard — an economic perspective,Proceedings of 17th Annual Computer Security Applications Conference, NewOrleans, Louisiana, 2001.
[3] A. Arora, R. Krishnan, R. Telang, Y. Yang, An empirical analysis of software vendors'patch release behavior: impact of vulnerability disclosure, Information SystemsResearch 21 (2010) 115–132.
[4] A. Bansal, R.J. Kauffman, R.R. Weitz, Comparing the modeling performance ofregression and neural networks as data quality varies: a business value approach,Journal of Management Information Systems 10 (1993) 11–32.
[5] B.M. Barber, M.N. Darrough, Product reliability and firm value: the experience ofAmerican and Japanese automakers, 1973–1992, Journal of Political Economy104 (5)(1996) 1084.
[6] A. Blumstein, J. Cohen, D. Nagin, Introduction in Deterrence and Incapacitation:Estimating the Effects of Criminal Sanctions on Crime Rates, National Academy ofSciences, Washington, D.C., 1978
[7] M.A. Boyacioğlu, Y. Kara, O.K. Baykan, Predicting bank financial failures usingneural networks, support vector machines and multivariate statistical methods: acomparative analysis in the sample of savings deposit insurance fund (SDIF)transferred banks in Turkey, Expert Systems with Applications 36 (2) (2009)3355–3366.
[8] K. Campbell, L.A. Gordon, M.P. Loeb, L. Zhou, The economic cost of publiclyannounced information security breaches: empirical evidence from the stockmarket, Journal of Computer Security 11 (2003) 431–448.
[9] Q. Cao, M.E. Parry, Neural network earnings per share forecasting models: acomparison of backward propagation and the genetic algorithm, Decision SupportSystems 47 (1) (2009) 32–41.
[10] H. Cavusoglu, B. Mishra, S. Raghunathan, The effect of Internet security breachannouncements on market value: capital market reactions for breached firms andInternet security developers, International Journal of Electronic Commerce 9(2004) 69–104.
[11] H. Cavusoglu, S. Raghunathan, W. Yue, Decision-theoretic and game-theoreticapproaches to it security investment, Journal of Management InformationSystems 25 (2) (2008) 281–304.
[12] Y. Chen, S. Ganesan, Y. Liu, Does a firm's product recall strategy affect its financialvalue? An examination of strategic alternatives during product-harm crises,Journal of Marketing 73 (6) (2009) 214–226.
[13] W.K. Chiang, D. Zhang, L. Zhou, Predicting and explaining patronage behaviortoward web and traditional stores using neural networks: a comparative analysiswith logistic regression, Decision Support Systems 41 (2) (2006) 514–531.
[14] C. Chou, A.P. Sinha, H. Zhao, Commercial Internet filters: perils and opportunities,Decision Support Systems 48 (4) (2010) 521–530.
[15] E.K. Clemons, Evaluation of strategic investments in information technology,Communications of the ACM 34 (1) (1991) 22–36.
[16] G. Cybenko, Approximation by superpositions of a sigmoidal function, Math,Control, Signals, and Systems 2 (1989) 303–314.
[17] K.B. DeTienne, D.H. DeTienne, S.A. Joshi, Neural networks as statistical tools forbusiness researchers, Organizational Research Methods 6 (2003) 236–265.
[18] L. Ehrlich, Participation in illegitimate activities: a theoretical and empiricalinvestigation, Journal of Political Economy 81 (1973) 521–564.
[19] E.F. Fama, Efficient capital markets: a review of theory and empirical work, Journalof Finance 25 (2) (1970) 383–417.
[20] E.F. Fama, Efficient capital-markets 2, Journal of Finance 46 (5) (1991)1575–1617.
[21] P. Fraser, N. Groenewold, US share prices and real supply and demand shocks, TheQuarterly Review of Economics and Finance 46 (1) (2006) 149–167.
[22] A. Garg, J. Curtis, H. Halper, Quantifying the financial impact of IT securitybreaches, Information Management & Computer Security 11 (2003) 74–83.
[23] S. Goel, H. Shawky, Estimating the market impact of security breach announce-ments on firm values, Information and Management 46 (7) (2009) 404–410.
[24] C.W.J. Granger, P. Newbold, Forecasting Economic Time Series, 2nd ed, AcademicPress, 1986.
[25] M. Hagiwara, Removal of hidden units andweights for backpropagation networks,Proceedings 1993 Int. Joint Conf. Neural Networks, 1, 1993, pp. 351–354.
[26] J.F. Hair, R.E. Anderson, R.L. Tatham, W.C. Black, Multivariate Data Analysis,Prentice Hall, New Jersey, 1998.
[27] E.J. Hannan, B.G. Quinn, The determination of the order of an autoregression,Journal of the Royal Statistical Society 41 (1979) 190–195.
[28] S. Haykin, Neural networks: A Comprehensive Foundation, Macmillan Publishing,New York, 1994.
[29] K.B. Hendricks, V.R. Singhal, The effect of supply chain glitches on shareholderwealth, Journal of Operations Management 21 (2003) 501–522.
[30] A.J. Hovav, J. D'Arcy, The impact of denial-of-service attack announcements of themarket value of firms, Risk Management and Insurance Review 6 (2) (2003)97–121.
[31] Y.H. Hu, Time series analysis, http://homepages.cae.wisc.edu/~ece539/matlab/index.html8 (Last accessed April 29, 2010).
[32] C. Isidore, Toyota recall costs: $2 billion, http://money.cnn.com/2010/02/04/news/companies/toyota_earnings.cnnw/?postversion=20100204108 (Lastaccessed April 29, 2010).
[33] G. Jarrell, S. Peltzman, The impact of product recalls on the wealth of sellers, TheJournal of Political Economy 93 (1) (1985) 512–536.
[34] S. Johansen, Statistical analysis of cointegrating vectors, Journal of EconomicDynamics and Control 12 (1988) 231–254.
[35] J. Kamp, T.M. Burton, Corporate news: recalls hurt Medtronic earnings,Wall StreetJournal8 B.4, http://online.wsj.com/article/SB124272809096834003.html 20098(Last accessed April 29, 2010).
[36] A. Keles, M. Kolcak, A. Keles, Adaptive neuro-fuzzy model for forecastingthedomestic debt, Knowledge-Based Systems 21 (2008) 951–957.
[37] L. Khansa, D. Liginlal, Valuing the flexibility of investing in security processinnovations, European Journal of Operational Research 192 (2009) 216–235.
[38] L. Khansa, D. Liginlal, Quantifying the benefits of investing in information security,Communications of the ACM 52 (2009) 113–117.
[39] W.R. King, G. Premkumar, K. Ramamurthy, An evaluation of the role andperformance of a decision support system in business education, DecisionSciences 21 (3) (2007) 642–659.
[40] D. Liginlal, I. Sim, L. Khansa, How significant is human error as a cause to privacybreaches? An empirical study and a framework for error management, Computersand Security 28 (3–4) (2009) 215–228.
[41] C.-J. Lu, T.-S. Lee, C.-C. Chiu, Financial time series forecasting using independentcomponent analysis and support vector regression, Decision Support Systems 47(2009) 115–125.
[42] Z. Meng, S.T. Lee, The value of IT to firms in a developing country in the catch-upprocess: an empirical comparison of China and the United States, DecisionSupport Systems 43 (3) (2007) 737–745.
[43] J. Muntermann, Towards ubiquitous information supply for individual inves-tors: a decision support system design, Decision Support Systems 47 (2) (2009)82–92.
[44] K. Palepu, Diversification strategy, profit performance and the entropy measure,Strategic Management Journal 6 (1985) 239–255.
[45] M. Paliwal, U.A. Kumar, Neural networks and statistical techniques: a review ofapplications, Expert Systems with Applications 36 (2009) 2–17.
[46] I. Pankratz, Forecasting with Dynamic Regression Models, Wiley, New York,1991.
[47] G. Rasch, On general laws and the meaning of measurement in psychology,Proceedings of the 4th Berkeley Symposium on Mathematical Statistics andProbability, IV, University of Chicago Press, Berkeley, 1980, pp. 321–334.
[48] M. Rhee, P.R. Haunschild, The liability of good reputation: a study of product recallsin the U.S. automobile industry, Organization Science 17 (1) (2006) 101–117.
[49] A. Rombel, Internet security in an insecure world, Global Finance 15 (13) (2001)28–32.
[50] P.H. Rubin, R.D. Murphy, G. Jarrell, Risky products, risky stocks, Regulation 12 (1)(1988) 35–39.
[51] N.G. Rupp, Are government initiated recalls more damaging for shareholders?Evidence from automotive recalls 1973–1998, Economics Letters 71 (2001)265–270.
[52] C.A. Sims, Macroeconomics and reality, Econometrica 48 (1980) 1–48.[53] A.P. Sinha, J.H. May, Evaluating and tuning predictive data mining methods using
receiver operating characteristic curves, Journal of Management InformationSystems 21 (2004–5) 249–280.
[54] K.J. Soo Hoo, How much is enough? A risk-management approach to computersecurity, Ph.D. dissertation, Graduate School of Engineering, Stanford University,Stanford, CA, 2000
[55] K.E. Spier, Product safety, buybacks, and the post-sale duty to warn, Journal ofLaw, Economics, and Organization, in press.
[56] W. Stallings, Network Security Essentials: Applications and Standards, 3rd ed.Prentice Hall, New Jersey, 2007.
[57] J. Sun, H. Li, Data mining for listed companies' financial distress prediction,Knowledge-Based Systems 21 (1) (2008) 1–5.
[58] L.L. Thurstone, A law of comparative judgment, Psychological Review 34 (1927)278–286.
[59] E. Tsang, P. Yung, J. Li, EDDIE-Automation, a decision support tool for financialforecasting, Decision Support Systems 37 (4) (2004) 559–565.
[60] A. Vellidoa, P.J.G. Lisboaa, J. Vaughanb, Neural networks in business: asurvey of applications (1992–1998), Expert Systems with Applications 17(1999) 51–70.
[61] S. Walczak, T. Sincich, A comparative analysis of regression and neural networksfor university admissions, Information Sciences 119 (1999) 1–20.
[62] H. Wang, A.S. Weigend, Data mining for financial decision making, DecisionSupport Systems 37 (4) (2004) 457–460.
[63] T. White, R. Pomponi, Gain a competitive edge by preventing recalls, QualityProgress 36 (8) (2003) 41–49.
[64] L. Yu, S. Wang, K.K. Lai, Credit risk assessment with a multistage neural networkensemble learning approach, Expert Systems with Applications 34 (2) (2008)1434–1444.
[65] L. Yu, S. Wang, K.K. Lai, An intelligent-agent-based fuzzy group decision makingmodel for financial multicriteria decision support: the case of credit scoring,European Journal of Operational Research 195 (3) (2009) 942–959.
[66] W. Zhang, Q. Cao, M.J. Schniederjans, Neural network earnings per shareforecasting models: a comparative analysis of alternative methods, DecisionSciences 35 (2) (2004) 205–237.
[67] L. Zhou, J.K. Burgoon, D.P. Twitchell, T. Qin, J.A. Nunamaker, Comparison ofclassification methods for predicting deception in computer-mediatedcommunication, Journal of Management Information Systems 20 (2004)139–165.
[68] X. Zhu, H. Wang, L. Xu, H. Li, Predicting stock index increments by neuralnetworks: the role of trading volume under different horizons, Expert Systemswith Applications 34 (4) (2008) 3043–3054.

759L. Khansa, D. Liginlal / Decision Support Systems 51 (2011) 745–759
Lara Khansa is an Assistant Professor in the Department of Business InformationTechnology at Virginia Tech. She received her Ph.D. in Information Systems, M.S inComputer Engineering, and MBA in Finance and Investment Banking from theUniversity of Wisconsin, Madison. Her primary research interests include theeconomics of information systems and information security, economic-based decisionmaking in information systems, theories of investment, innovation, and market valuecreation in the particular realm of information systems, business value of informationsystems, and regulatory economics and its implications for IT innovation and thereshaping of the IT industry landscape. Dr. Khansa has published in leading journalsincluding Decision Support Systems, European Journal of Operational Research,Communications of the ACM, Computers and Security, IEEE Technology and Society,and many others. She is a member of the Association for Information Systems (AIS), theInstitute of Electrical and Electronics Engineers (IEEE), and the Beta Gamma SigmaNational Honor Society.
Divakaran Liginlal is an Associate Teaching Professor of Information Systems atCarnegie Mellon University. Lal holds a B.S. in Telecommunication Engineering fromCET, a M.S. in Computer Science from the Indian Institute of Science, and a Ph.D. inManagement Information Systems from the University of Arizona. Before joining CMU,he taught at three U.S. universities, including nine years at the University of Wisconsin-Madison. Lal's research in information security and decision support systems has beenpublished in such journals as CACM, IEEE-TKDE, IEEE-SMC, European Journal ofOperational Research, Computers & Security, Decision Support Systems, and Fuzzy Sets& Systems. Lal's teaching and research have been supported by organizations such asMicrosoft Corporation, Hewlett Packard, CISCO, and the ICAIR at the University ofFlorida.