Embed Size (px)
Citation preview

Decision Support for Choice of Security Solution
The Aspect-Oriented Risk Driven Development (AORDD) Framework
Thesis for the degree philosophiae doctor
Trondheim, November 2007
Norwegian University of Science and TechnologyFaculty of Information Technology, Mathematics and Electrical Engineering Department of Computer and Information Science
Siv Hilde Houmb
I n n o v a t i o n a n d C r e a t i v i t y

NTNUNorwegian University of Science and Technology
Thesis for the degree doctor philosophiae
Faculty of Information Technology, Mathematics and Electrical Engineering Department of Computer and Information Science
© Siv Hilde Houmb
ISBN 978-82-471-4588-3 (printed version)ISBN 978-82-471-4591-3 (electronic version)ISSN 1503-8181
Doctoral theses at NTNU, 2007:208
Printed by NTNU-trykk

To Erlend


Abstract
In security assessment and management there is no single correct solution tothe identi�ed security problems or challenges. Instead there are only choices andtradeo¤s. The main reason for this is that modern information systems and se-curity critical information systems in particular must perform at the contractedor expected security level, make e¤ective use of available resources and meetend-users�expectations. Balancing these needs while also ful�lling development,project and �nancial perspectives, such as budget and TTM constraints, meanthat decision makers have to evaluate alternative security solutions.This work describes parts of an approach that supports decision makers in choos-ing one or a set of security solutions among alternatives. The approach is calledthe Aspect-Oriented Risk Driven Development (AORDD) framework, combinesAspect-Oriented Modeling (AOM) and Risk Driven Development (RDD) tech-niques and consists of the seven components: (1) An iterative AORDD process.(2) Security solution aspect repository. (3) Estimation repository to store experi-ence from estimation of security risks and security solution variables involved insecurity solution decisions. (4) RDD annotation rules for security risk and securitysolution variable estimation. (5) The AORDD security solution trade-o¤ analysisand trade-o¤ tool BBN topology. (6) Rule set for how to transfer RDD informa-tion from the annotated UML diagrams into the trade-o¤ tool BBN topology. (7)Trust-based information aggregation schema to aggregate disparate informationin the trade-o¤ tool BBN topology. This work focuses on components 5 and 7,which are the two core components in the AORDD framework.This work has looked at four main research questions related to security solutiondecision support. These are:
RQ.1: How can alternative security solutions be evaluated against each other?RQ.2: How can security risk impact and the e¤ect of security solutions be mea-
sured?RQ.3: Which development, project and �nancial perspectives are relevant and
how can these be measured?RQ.4: How can the disparate information involved in RQ.1, RQ.2 and RQ.3 be
combined?

ii Abstract
The main contributions of this work towards the above-mentioned research ques-tions are:
C.1: A set of security risk variables.C.2: A set of security solution variables.C.3: A set of trade-o¤ parameter variables to represent and measure relevant
development, project and �nancial perspectives.C.4: Methodology and tool-support for comparing the security solution variables
with the security risk variables.C.5: Methodology and tool-support for trading o¤ security solutions and iden-
tifying the best-�tted one(s) based on security, development, project and�nancial perspectives.
C.1-C.5 is integrated into components 5 and 7 of the AORDD framework. C.1,C.2 and C.4 address RQ.1 and RQ.2, while C.3 and C.5 address RQ.3 and RQ.4and C.5 addresses RQ.4.

Acknowledgement
PhD work is a strenuous task and feels much like running a marathon. Throughthis long and sometimes painful race I have had several people to discuss matterswith and I am grateful to them all. I will �rst and foremost thank my supervisorsProfessor Dr Tor Stålhane, Professor Dr Maria Letitzia Jaccheri and Dr PerHokstad (SINTEF), the head of the software engineering group Professor DrReidar Conradi, all of the Department of Computer and Information Science atNTNU and my dear friend and colleague Sven Ziemer. Other people that havebeen of importance in completing this work are Dr Ketil Stølen, SINTEF; Senioradviser Stewart Clark, Student and Academic Division, NTNU; Dr. Bjørn AxelGran, IFE; Professor Dr Robert France, Dr Geri Georg, Professor Dr IndrakshiRay, Professor Dr James Bieman and Professor Dr Indrajit Ray, all from ColoradoState University; Dr Jan Jürjens, Open University in London and all of TelenorR&I and in particular Judith Rossebø, Gerda Hybertsen, Dr Oddvar Risnes andSune Jakobsson. Dr Stølen was of great help during the �rst two years of thiswork. He struggled heroically with my stubbornness. I do really appreciate hisdevoted way of commenting on my work and his ability to repeatedly challenge myideas and ask the necessary questions. I would also like to take the opportunity tothank Professor Dr France for allowing me to join his research group at ColoradoState University as a visiting researcher for nearly two years and Dr Georg andProfessor Dr Indrakshi Ray for close and fruitful cooperation since 2002. Therewould not be much to report in this work without the two of you.When it comes to people who have been crucial for me in both my everyday lifeand as a source of inspiration for my work my dear and devoted husband Erlendis irreplaceable. He has the rare ability to make me smile even when things seemtoo complicate to solve and when times are rough and work is not as smooth andpleasant as it should be. In addition, my parents Johan and Inger Houmb are andhave always been very important to me. I owe them my ability to look at thingsfrom di¤erent perspective. They are the best parents that anyone can ever hopefor. I know that they have not always agreed with my decisions but even thoughthey have always been able to advise, accept and move on. Their pure and wise

iv Acknowledgement
degree of tolerance and sense of fairness is something that I will strive to achieve.Thanks a lot mom and dad.Last but not least, my gratitude and honour to my baby sister, Liv Elin Houmb,with whom I have shared many joyful and challenging tasks and experiences with.She is the anchor that I can always rely on. And then there are my dear friendsthat I can discuss anything and nothing with. Thanks Sven, Kari, Xiaomeng,Sverre, Ove, Judith, Jens, Ana, Pete, Vidya, Frode, Helen, Mette, Sangita andeverybody else. Thanks also to my two sets of "foster parents" in Fort Collins,Bob and Nancy Sturtevant and Dan and Maggie Matheson and to my grandmaBorghild. Thanks for always being there.

Preface
Living in a technological society is like riding a bucking bronco. I don�t believe wecan a¤ord to get o¤, and I doubt that someone will magically appear who can leadit about on a leash. The question is: how do we become better broncobusters?
William RuckelshausRisk in a Free Society
Modern society relies heavily on networked information systems. The risks asso-ciated with these systems might have serious implications, such as threateningthe �nancial and physical well-being of people and organisations. For example,the unavailability of a telemedicine system might result in loss of life and anInternet-based organisation can be put out of business as a result of a successfuldenial of service (DoS) attack. Hence, decision-makers must gain control overrisks associated with security attacks and they need techniques to support themin determining which security strategy best serves their many perspectives.
In practice, the traditional strategy for security assurance has been penetrationand patch, meaning that when the penetration of a software system is discoveredand the exploited weaknesses are identi�ed the vulnerability is removed. Thisstrategy is often supported by the use of tiger teams, which cover all organisedand authorised penetration activity. Many of the major software vendors still usethis strategy today, as the size and complexity of their software has outgrowntheir ability to ensure su¢ cient coverage of their testing. Some million lines ofcode have many possible combinations of potential use and misuse. Even thoughboth alpha and beta testing user groups are used the last few per cent of testingand vulnerability analysis are left to the end-users and the today�s very activehacker environment. This process transfers responsibility for the security of theinformation system to the consumers and system administrators. Thus, the soft-ware vendor takes no responsibility for the security level of their software andprovides no documentation of the risk level associated with using the system.

vi Preface
Hence, these information systems are shipped with a high degree of uncertaintyin their security level.
Military systems struggled with similar problems in the beginning of the 1980sand developed early approaches for advanced classi�cation and access controlmodels and software evaluation methods, such as the Trusted Computer SystemEvaluation Criteria (TCSEC) also known as the Orange Book. TCSEC is a UnitedStates Government Department of Defense (DoD) standard that speci�es the ba-sic requirements for assessing the e¤ectiveness of the computer security controlsbuilt into an information system (called computer system in the standard). Thisis done by the use of seven prede�ned security classes; D, C1, C2, B1, B2, B3and A1, where class A1 o¤ers the highest level of assurance. Similar e¤orts werealso undertaken in Europe and Canada which led to the Information Technol-ogy Security Evaluation Criteria (ITSEC) and the Canadian Trusted ComputerProduct Evaluation Criteria (CTCPEC).
Later industry adopted these models, but not without problems as most of themare unsuitable for cost-e¤ective development of industrial applications. There areseveral reasons for this, one being the clear di¤erences between the environmentsthat military and industrial systems operate in. As a response to this the securityevaluation standard ISO 15408 Common Criteria for Information TechnologySecurity Evaluation was developed as a common e¤ort by the the InternationalOrganization for Standardization (ISO). The Common Criteria has today largelytaken over from TCSEC, ITSEC and CTCPEC.
The Common Criteria is tailored for industrial purposes and is the result ofthe experience and recommendations of researchers and experienced developersboth within the military sector and from industry. The standard has adoptedthe strategy from TCSEC and its subsequent evaluation standards. It evaluatesthe security level of information systems using a hierarchy of prede�ned evalua-tion classes called evaluation assurance levels (EAL). The EALs and associatedguidelines take an evaluator through a well-formulated and structural process ofassessing the security level of a system to gain con�dence in the security controlsof the system. However, even though the Common Criteria is developed for anindustrial setting the evaluation process is time and resource demanding and con-sidered by many not to be worth the e¤ort and cost. This is particularly true forweb-based applications where a system may be of no interest to the market bythe time the evaluation is completed. Furthermore, despite the structural processthat a Common Criteria evaluation undertakes the evaluation is still a subjec-tive assessment and does not su¢ ciently address the development, project and�nancial perspectives of information systems.
Security assessment and management is a strategy for controlling the security ofa system that lies between the penetration and patch and the security evaluation

Preface vii
strategies. In security assessment and management several techniques for iden-tifying and assessing security problems in an information system are combinedinto a process that ensures that there is continuous review and update of itssecurity controls. This process is based on observations from vulnerability analy-sis or hacker reports and from the structural and continuous examination of thepotential security problems and challenges in the information system. Securityassessment and management can be employed at any level of rigour and can betailored for any type of system. However, as for the Common Criteria, securityassessment and management is subjective and its results depend on the abilityof the risk analyst carrying out the assessment. There are also problems withestimating the variables involved as little empirical information for security riskestimation exists.
Thus, the situation is that the ad-hoc and after-the-fact security strategy �pen-etration and patch�ensures that systems are delivered within a reasonable timeand cost, but with a high degree of uncertainty and lack of con�dence in the e¢ -ciency of the security controls in an information system. On the other hand, thepreventive security strategy employed by Common Criteria evaluation providescon�dence in the e¢ ciency of the security controls, but is too costly and demandstoo much in terms of time and resources. It is also very dependent on the expe-rience level of the evaluator for it to be practical in today�s highly competitivemarket with strict budget and time-to-market (TTM) constraints. Security as-sessment and management relies on subjective judgments and su¤ers from thelack of empirical data. However, all three approaches possess some desired prop-erties in a development setting where security, development, project and �nancialperspectives must be ful�lled. This is the reason why this work is based on therecommendations in the Common Criteria as a penetration and patch type ofconstruct in the setting of security assessment and management that makes useall available information for identifying the best-�tted security solutions for thesecurity problems or challenges of an information system.
Trondheim, ...............................September 2007 Siv Hilde Houmb


Contents
Part I. Background and Research Context
1. Research Context : : : : : : : : : : : : : : : : : : : : : : : : : : : : : : : : : : : : : : : : : : : : : 3
1.1 Background and motivation . . . . . . . . . . . . . . . . . . . . . . . . . . . . . . . . . . 3
1.2 Research objective and research questions . . . . . . . . . . . . . . . . . . . . . 5
1.3 Main contributions of this work . . . . . . . . . . . . . . . . . . . . . . . . . . . . . . 6
1.3.1 Publications . . . . . . . . . . . . . . . . . . . . . . . . . . . . . . . . . . . . . . . . . 8
1.4 Research method and way of work . . . . . . . . . . . . . . . . . . . . . . . . . . . . 12
1.4.1 Application of action research for this work . . . . . . . . . . . . . . 13
2. Outline of the Thesis : : : : : : : : : : : : : : : : : : : : : : : : : : : : : : : : : : : : : : : : : 17
Part II. Background Information and State of the Art
3. Security in Information Systems : : : : : : : : : : : : : : : : : : : : : : : : : : : : : : 21
3.1 Security standards and regulations . . . . . . . . . . . . . . . . . . . . . . . . . . . . 24
4. The Common Criteria : : : : : : : : : : : : : : : : : : : : : : : : : : : : : : : : : : : : : : : : 29
4.1 Relevant parts of Common Criteria terminology . . . . . . . . . . . . . . . . 30
4.2 Evaluation and certi�cations according to the Common Criteria . . 31
4.3 Performing a Common Criteria evaluation . . . . . . . . . . . . . . . . . . . . . 34
5. Risk Assessment and Management of Information Systems : : : 37
5.1 Security (risk) assessment . . . . . . . . . . . . . . . . . . . . . . . . . . . . . . . . . . . 39

x Contents
5.1.1 Performing security assessment . . . . . . . . . . . . . . . . . . . . . . . . . 39
5.2 AS/NZS 4360:2004 Risk Management . . . . . . . . . . . . . . . . . . . . . . . . . 41
5.3 CRAMM . . . . . . . . . . . . . . . . . . . . . . . . . . . . . . . . . . . . . . . . . . . . . . . . . . 46
5.4 The CORAS approach . . . . . . . . . . . . . . . . . . . . . . . . . . . . . . . . . . . . . . 47
5.4.1 CORAS risk management process . . . . . . . . . . . . . . . . . . . . . . 49
6. Towards Quantitative Measure of Operational Security : : : : : : : 51
7. Subjective Expert Judgment : : : : : : : : : : : : : : : : : : : : : : : : : : : : : : : : : : 55
7.1 Aggregation techniques for combining expert opinions . . . . . . . . . . . 60
8. Bayesian Belief Networks (BBN) : : : : : : : : : : : : : : : : : : : : : : : : : : : : : 63
9. Architecture/Design trade-o¤ analysis : : : : : : : : : : : : : : : : : : : : : : : : 69
9.1 Architecture Trade-o¤ Analysis Method (ATAM) . . . . . . . . . . . . . . . 69
9.2 Cost Bene�t Analysis Method (CBAM) . . . . . . . . . . . . . . . . . . . . . . . 71
Part III. Security Solution Decision Support Framework
10. The AORDD Framework : : : : : : : : : : : : : : : : : : : : : : : : : : : : : : : : : : : : : 77
11. The AORDD Process : : : : : : : : : : : : : : : : : : : : : : : : : : : : : : : : : : : : : : : : : 81
Part IV. AORDD Security Solution Trade-O¤ Analysis
12. The Role of Trade-O¤ Analysis in Security Decisions : : : : : : : : : 89
13. AORDD Security Solution Trade-O¤ Analysis : : : : : : : : : : : : : : : : 93
13.1 Phase 1: Risk-driven analysis . . . . . . . . . . . . . . . . . . . . . . . . . . . . . . . . 95
13.1.1 Relationship between misuse variables . . . . . . . . . . . . . . . . . . 99
13.1.2 Deriving the list of security risks in need of treatment . . . . . 104
13.2 Phase 2: Trade-o¤ analysis . . . . . . . . . . . . . . . . . . . . . . . . . . . . . . . . . . . 105
13.2.1 Identifying and assigning values to assets . . . . . . . . . . . . . . . . 110

Contents xi
13.2.2 Relationship between MI/SE and AV . . . . . . . . . . . . . . . . . . . 115
13.2.3 Misuse and security solution costs . . . . . . . . . . . . . . . . . . . . . . 117
14. Structure of the Trade-O¤ Analysis : : : : : : : : : : : : : : : : : : : : : : : : : : : 121
15. The Trade-O¤ Tool : : : : : : : : : : : : : : : : : : : : : : : : : : : : : : : : : : : : : : : : : : : 129
15.1 SSLE subnet . . . . . . . . . . . . . . . . . . . . . . . . . . . . . . . . . . . . . . . . . . . . . . . 131
15.1.1 Aggregating asset value . . . . . . . . . . . . . . . . . . . . . . . . . . . . . . . 134
15.2 RL subnet . . . . . . . . . . . . . . . . . . . . . . . . . . . . . . . . . . . . . . . . . . . . . . . . . 136
15.3 SSTL subnet . . . . . . . . . . . . . . . . . . . . . . . . . . . . . . . . . . . . . . . . . . . . . . . 140
15.4 TOP subnet . . . . . . . . . . . . . . . . . . . . . . . . . . . . . . . . . . . . . . . . . . . . . . . 142
Part V. Aggregating Information in the Trade-O¤ Tool
16. Information Sources : : : : : : : : : : : : : : : : : : : : : : : : : : : : : : : : : : : : : : : : : : 149
16.1 Sources for observable information . . . . . . . . . . . . . . . . . . . . . . . . . . . . 149
16.2 Sources for subjective or interpreted information . . . . . . . . . . . . . . . 154
17. Trust-Based Information Aggregation Schema : : : : : : : : : : : : : : : : 157
17.1 Step 1: Specify trust context . . . . . . . . . . . . . . . . . . . . . . . . . . . . . . . . . 160
17.2 Step 2: IS trustworthiness weight . . . . . . . . . . . . . . . . . . . . . . . . . . . . . 162
17.2.1 Knowledge level . . . . . . . . . . . . . . . . . . . . . . . . . . . . . . . . . . . . . . 162
17.2.2 Expertise level . . . . . . . . . . . . . . . . . . . . . . . . . . . . . . . . . . . . . . . 168
17.2.3 Computing IS trustworthiness weights . . . . . . . . . . . . . . . . . . 172
17.3 Step 3: Trust between decision maker and IS . . . . . . . . . . . . . . . . . . . 174
17.4 Step 4: Update relative IS trustworthiness weights . . . . . . . . . . . . . . 175
17.5 Step 5: Aggregate information . . . . . . . . . . . . . . . . . . . . . . . . . . . . . . . . 175
Part VI. Validation, Discussion and Concluding Remarks
18. Validation of the Approach : : : : : : : : : : : : : : : : : : : : : : : : : : : : : : : : : : : 179

xii Contents
18.1 Demonstration of the trade-o¤ tool and TBIAS . . . . . . . . . . . . . . . . 180
18.1.1 Aggregating information for the trade-o¤ tool using TBIAS 181
18.1.2 Example of trading o¤ two DoS solutions . . . . . . . . . . . . . . . . 194
19. Discussion : : : : : : : : : : : : : : : : : : : : : : : : : : : : : : : : : : : : : : : : : : : : : : : : : : : : 203
19.1 Related work . . . . . . . . . . . . . . . . . . . . . . . . . . . . . . . . . . . . . . . . . . . . . . 210
20. Concluding Remarks and Suggestions for Further Work : : : : : : 219
References : : : : : : : : : : : : : : : : : : : : : : : : : : : : : : : : : : : : : : : : : : : : : : : : : : : : : : : : 229
Part VII. Appendices
Appendix A.1: AORDD Concepts : : : : : : : : : : : : : : : : : : : : : : : : : : : : : : : : 233
Appendix B.1: P.16: Houmb and Georg (2005) : : : : : : : : : : : : : : : : : : : : 237
Appendix B.2: P.26; Houmb et al. (2006) : : : : : : : : : : : : : : : : : : : : : : : : : 253
Appendix B.3: P.17; Houmb et al. (2005) : : : : : : : : : : : : : : : : : : : : : : : : : 285
Appendix C: Publication List : : : : : : : : : : : : : : : : : : : : : : : : : : : : : : : : : : : : : 305

List of Figures
1.1 The relation between the research questions, main contributions andthe three studies of this work . . . . . . . . . . . . . . . . . . . . . . . . . . . . . . . . . . . . 7
1.2 The phases and iterations of the construction (work) process . . . . . . . . . 14
1.3 Action research and how it in�uenced the construction process . . . . . . . 14
1.4 The evaluation and validation process used in this work . . . . . . . . . . . . 15
4.1 ST, PP and ToE in relation to phases of a development process . . . . . . 32
4.2 Relationship between PP, ST and ToE in Common Criteria (page 45in Part 1 of [15]) . . . . . . . . . . . . . . . . . . . . . . . . . . . . . . . . . . . . . . . . . . . . . . . 33
5.1 AS/NZS 4360:2004 Risk management process . . . . . . . . . . . . . . . . . . . . . . 42
5.2 The �ve main components of the CORAS framework . . . . . . . . . . . . . . . . 48
7.1 Example case description using a state transition diagram . . . . . . . . . . . 56
7.2 Example of Triang(a,b,c) distribution for three experts . . . . . . . . . . . . . . 59
7.3 Robustness analysis used to derive the weighting schema . . . . . . . . . . . . 61
8.1 Example BBN for ��rewall down�. . . . . . . . . . . . . . . . . . . . . . . . . . . . . . . . . 65
10.1 The seven components of the AORDD framework . . . . . . . . . . . . . . . . . . 78
11.1 Outline of the AORDD process . . . . . . . . . . . . . . . . . . . . . . . . . . . . . . . . . . . 83
11.2 Overview of the activities of the requirement and design phase of theAORDD process . . . . . . . . . . . . . . . . . . . . . . . . . . . . . . . . . . . . . . . . . . . . . . . . 83
13.1 The two phases of the AORDD security solution trade-o¤ analysis . . . . 94

xiv List of Figures
13.2 The security assessment concepts involved in Phase 1 and 2 of theAORDD security solution trade-o¤ analysis . . . . . . . . . . . . . . . . . . . . . . . . 95
13.3 Concepts involved in Phase 1 of the AORDD security solution trade-o¤ analysis . . . . . . . . . . . . . . . . . . . . . . . . . . . . . . . . . . . . . . . . . . . . . . . . . . . . 97
13.4 Example of a risk model . . . . . . . . . . . . . . . . . . . . . . . . . . . . . . . . . . . . . . . . . 98
13.5 Relation between security threat, security vulnerability and misuse . . . 100
13.6 Overview of how misuses happen and how they can be prevented . . . . . 101
13.7 Illustration of a misuse hierarchy . . . . . . . . . . . . . . . . . . . . . . . . . . . . . . . . . 103
13.8 Concepts involved in Phase 2 of the AORDD security solution trade-o¤ analysis . . . . . . . . . . . . . . . . . . . . . . . . . . . . . . . . . . . . . . . . . . . . . . . . . . . . 107
13.9 The input and outputs of Phase 2 of the AORDD security solutiontrade-o¤ analysis . . . . . . . . . . . . . . . . . . . . . . . . . . . . . . . . . . . . . . . . . . . . . . . 109
13.10Asset value table as a composite of the 15 asset valuation categories(sub variables) . . . . . . . . . . . . . . . . . . . . . . . . . . . . . . . . . . . . . . . . . . . . . . . . . 115
13.11The 15 misuse impact sub variables and how to aggregate these intothe misuse impact table . . . . . . . . . . . . . . . . . . . . . . . . . . . . . . . . . . . . . . . . . 116
13.12The relation between misuse impacts, the original asset values and theresulting updated asset value table . . . . . . . . . . . . . . . . . . . . . . . . . . . . . . . . 117
13.13The 15 security solution e¤ect sub variables and how to aggregatethese into the security solution e¤ect table . . . . . . . . . . . . . . . . . . . . . . . . . 118
14.1 Overview of the structure and the step by step procedure of the trade-o¤ analysis . . . . . . . . . . . . . . . . . . . . . . . . . . . . . . . . . . . . . . . . . . . . . . . . . . . . 122
14.2 Variables involved in estimating the risk level of a ToE in the trade-o¤analysis method . . . . . . . . . . . . . . . . . . . . . . . . . . . . . . . . . . . . . . . . . . . . . . . . 124
14.3 The relation between misuse cost and security solution cost in thetrade-o¤ analysis method . . . . . . . . . . . . . . . . . . . . . . . . . . . . . . . . . . . . . . . . 125
15.1 The top-level network of the trade-o¤ tool BBN topology . . . . . . . . . . . . 130
15.2 SSLE subnet . . . . . . . . . . . . . . . . . . . . . . . . . . . . . . . . . . . . . . . . . . . . . . . . . . . 132
15.3 Asset value subnet . . . . . . . . . . . . . . . . . . . . . . . . . . . . . . . . . . . . . . . . . . . . . . 135
15.4 The ToE risk level or operation security level of a ToE as a result ofthe environmental (security) and internal (dependability) in�uence onthe ToE . . . . . . . . . . . . . . . . . . . . . . . . . . . . . . . . . . . . . . . . . . . . . . . . . . . . . . . 136
15.5 RL subnet . . . . . . . . . . . . . . . . . . . . . . . . . . . . . . . . . . . . . . . . . . . . . . . . . . . . . 137

List of Figures xv
15.6 Negative and positive misuse impacts . . . . . . . . . . . . . . . . . . . . . . . . . . . . . 138
15.7 Misuse impact (MI) subnet . . . . . . . . . . . . . . . . . . . . . . . . . . . . . . . . . . . . . . 139
15.8 Misuse cost (MC) subnet . . . . . . . . . . . . . . . . . . . . . . . . . . . . . . . . . . . . . . . . 140
15.9 SSTL subnet . . . . . . . . . . . . . . . . . . . . . . . . . . . . . . . . . . . . . . . . . . . . . . . . . . . 141
15.10Security solution cost (SC) subnet . . . . . . . . . . . . . . . . . . . . . . . . . . . . . . . . 142
15.11TOP subnet . . . . . . . . . . . . . . . . . . . . . . . . . . . . . . . . . . . . . . . . . . . . . . . . . . . 143
17.1 Overview of the �ve steps of the trust-based information aggregationschema . . . . . . . . . . . . . . . . . . . . . . . . . . . . . . . . . . . . . . . . . . . . . . . . . . . . . . . . 159
17.2 General reference knowledge domain model . . . . . . . . . . . . . . . . . . . . . . . . 164
18.1 Reference knowledge domain model . . . . . . . . . . . . . . . . . . . . . . . . . . . . . . . 185
18.2 Information source knowledge domain models for experts 4, 6, 15 and18 . . . . . . . . . . . . . . . . . . . . . . . . . . . . . . . . . . . . . . . . . . . . . . . . . . . . . . . . . . . . 189
18.3 Information inserted and propagated for security solution s1 (cookiesolution) . . . . . . . . . . . . . . . . . . . . . . . . . . . . . . . . . . . . . . . . . . . . . . . . . . . . . . 193
18.4 Information inserted and propagated for security solution s2 (�ltermechanism) . . . . . . . . . . . . . . . . . . . . . . . . . . . . . . . . . . . . . . . . . . . . . . . . . . . . 193
18.5 The top-level network of the trade-o¤ tool BBN topology . . . . . . . . . . . . 194
18.6 The resulting risk level . . . . . . . . . . . . . . . . . . . . . . . . . . . . . . . . . . . . . . . . . . 195
18.7 The resulting security solution treatment level for the security solutions1 with the information from the information sources inserted andpropagated . . . . . . . . . . . . . . . . . . . . . . . . . . . . . . . . . . . . . . . . . . . . . . . . . . . . 196
18.8 The resulting security solution treatment level for the security solutions2 with the information from the information sources inserted andpropagated . . . . . . . . . . . . . . . . . . . . . . . . . . . . . . . . . . . . . . . . . . . . . . . . . . . . 196
18.9 Details on the computations made for the Security Solution E¤ectnode for security solution s1 and security solution s2 . . . . . . . . . . . . . . . . 197
18.10TOP subnet with prior probability distributions . . . . . . . . . . . . . . . . . . . . 198
18.11Status of TOP subnet when security requirement information is en-tered and propagated . . . . . . . . . . . . . . . . . . . . . . . . . . . . . . . . . . . . . . . . . . . 199
18.12Evidence, propagation and result for the TOP subnet . . . . . . . . . . . . . . . 200
18.13Fitness score for s1 (cookie solution) . . . . . . . . . . . . . . . . . . . . . . . . . . . . . . 201
18.14Fitness score for s2 (�itering mechanism) . . . . . . . . . . . . . . . . . . . . . . . . . . 201


List of Tables
7.1 Answer table for Question 1 in the questionnaire for Expert i . . . . . . . . 58
8.1 Node probability table for �ftp fork attack�. . . . . . . . . . . . . . . . . . . . . . . . . 66
13.1 Example asset value table . . . . . . . . . . . . . . . . . . . . . . . . . . . . . . . . . . . . . . . 113
13.2 Example of qualitative scale evaluation . . . . . . . . . . . . . . . . . . . . . . . . . . . . 114
15.1 Nodes and their states in the TOP subnet . . . . . . . . . . . . . . . . . . . . . . . . . 145
17.1 Example calibration variables for determining the expertise level foran information source . . . . . . . . . . . . . . . . . . . . . . . . . . . . . . . . . . . . . . . . . . . 169
18.1 The combined knowledge and experience level questionnaire . . . . . . . . . 186


Part I
Background and Research Context

4 1. Research Context
problems are often costly in terms of money and time and resources. Thus, se-curity issues should be addressed at the appropriate level for a reasonable cost.In a system development context this means that information security shouldbe addressed as part of the development process rather than as an afterthought.Additionally, as cost and security are not the only perspectives involved in sys-tem development designers and decision makers need to evaluate security risksand security solutions in relation to development, project and �nancial perspec-tives as well. As it is hardly ever evident which of the alternative solutions thatmeet these multi-dimensional perspectives the best, the alternatives need to beevaluated against each other to identify the best-�tted solution.
The security standard ISO 15408 Common Criteria for Information TechnologySecurity Evaluation (Common Criteria) [15] permits comparability between re-sults of independent security evaluation. Hence, the Common Criteria is usefulas a guide for choosing one security solution among alternatives. However, theCommon Criteria has a pure security perspective and does not provide any sup-port for choosing security solutions based on other of the involved perspectives,such as development, project and �nancial perspectives.
Penetration and patch strategies are more �exible in taking additional perspec-tives into consideration. In such a security strategy a solution is only identi�edand employed whenever a problem is discovered and the choice of security solu-tion is restricted by the time and budget available at the time the problem occurs.However, this leaves a business prone to security attacks and without control. Se-curity assessment and management on the other hand focuses on future events andpotential security risks and have several well-tested methodologies for identifyingand assessing security risks �a priori�. The problem with security assessment andmanagement though is that no e¤ective approaches for measuring and evaluatingalternative solutions to the security risks have been established. Furthermore,most of these techniques do not su¢ ciently address the development, project and�nancial perspectives involved. What is needed is a security strategy that bene�tsfrom best practice and comparability of the Common Criteria, the ad-hoc andtime e¤ectiveness of penetration and patch strategies and the preventive focusof security assessment and management. Furthermore, the strategy must o¤ersu¢ cient performance, meaning that it must possess the ability to be carried outwithin a reasonable time frame, as well as take the relevant development, projectand �nancial perspectives into consideration.
1. Research Context
1.1 Background and motivation
6 February 2007 is the date where the so far last major security breach wasreported in Norway (today is 6 August 2007). This time a major bank in Norwayhad to close down many of their branches due to a virus attack that successfullyexecuted a DoS attack and took out many of the bank�s critical business servers.The only services provided by the bank on 7 February 2007 was cash withdrawalusing ATMs and Internet banking. The news story showed frustrated customersand Bank representatives assuring that no customers�bank accounts were a¤ectedby the attack and that all services would be running normally from the next day.
Last year (2006) was remarkably bad in terms of security incidents. Not onlywere Windows-based personal computers and servers a¤ected, which had beenthe case before 2006, this time the type of security incidents had expanded toalso target Macintosh and embedded systems in critical infrastructure. 2006 wasalso the year when the �rst terror-motivated security attacks materialised.
PriceWaterhouseCooper reported in their information security breaches surveyfor 2006 [26] that around 62% of all UK businesses experienced serious securityincidents in 2006. This is a high number. For premeditated and malicious incidentsthe number is even more worrying as the number of business a¤ected by suchsecurity attacks has increased by around 34% from 1998 to 2006. There are severalreasons for this increase one being the heavy computerising of the businessesanother the increased number of automated attack tools a¢ liating script kiddies.However, of the many security attacks leading to security incidents in 2006 theattack on the web services of the US export department on 9 October 2006 wasparticularly worrying. This attack originated from several computers located inChina and resulted in more than a month�s downtime for the web service issuingonline export licences for the US.
The increased amount of serious security incidents reported the past few yearshas put focus on information security. However, solutions to information security

1.2 Research objective and research questions 5
1.2 Research objective and research questions
The objective of this work has been to aid a decision maker in choosing thebest-�tted security solution among alternatives taking relevant security, develop-ment, project and �nancial perspectives into consideration. The context of thisdecision support for choice of security solution is the development of securitycritical information systems and a security solution can be comprised of one ormore of the following: security control, security mechanism, security procedure,security process, security policy or similar. This work is based on several secu-rity standards that will be discussed throughout this work and has adopted andre�ned the de�nitions of an information system and information security fromthese standards.
De�nition Information system is a system containing physical and conceptualentities that interacts as a potential target for intended or unintended securityattacks which might a¤ect either the system itself, its data or its stakeholdersand end-users (modi�ed from IEEE Std 1471�2000 [52]).
De�nition Information security comprises all perspectives related to de�n-ing, achieving, and maintaining con�dentiality, integrity, availability, non-repudiation, accountability, authenticity and reliability of an information sys-tem (adapted and modi�ed for information security from ISO/IEC TR 13335[54]).
The above research objective requires techniques for estimating security risksand security solutions so that alternative security solutions can be evaluatedagainst each other to derive the best-�tted security solution. This also involvesthe identi�cation of relevant development, project and �nancial perspectives thatshould be taken into consideration when evaluating alternative security solutions,as well as a clear perception of how to measure the �tness of a security solution.Additionally, information sources for estimating security risk, security solutionand development, project and �nancial perspectives needs to be identi�ed andcombined. This led to the following research questions:
RQ.1: How can alternative security solutions be evaluated against each other toidentify the most e¤ective alternative?
RQ.2: How can security risk impact and the e¤ect of security solutions be mea-sured?
RQ.3: Which development, project and �nancial perspectives are relevant foran information system and how can these be represented in the context ofidentifying the most e¤ective security solution among alternatives?

6 1. Research Context
RQ.4: How can the disparate information involved in RQ1, RQ2 and RQ3 becombined such that the most e¤ective security solution among alternativescan be identi�ed?
1.3 Main contributions of this work
The main contributions of this work towards the above four research questionsare:
C.1 A set of security risk variables used to measure the impact, frequency andcost of potential undesired events, which in this work is called misuses.
C.2 A set of security solution variables used to measure the treatment e¤ect andcost of alternative security solutions.
C.3 A set of trade-o¤ parameter variables to represent and measure relevantdevelopment, project and �nancial perspectives.
C.4 Methodology and tool-support for comparing the security solution variableswith the security risk variables to identify how e¤ective a security solution isin protecting against the relevant undesired behaviour (misuse).
C.5: Methodology and tool-support for trading o¤ security solutions and iden-tifying the best-�tted one(s) based on security, development, project and�nancial perspectives.
C1-C5 are integrated into the Aspect-Oriented Risk Driven Development (AORDD)framework which is a security solution decision support framework comprised ofseven components: (1) An iterative AORDD process. (2) Security solution aspectrepository. (3) Estimation repository to store experience from estimation of secu-rity risks and security solution variables involved in security solution decisions.(4) RDD annotation rules for security risk and security solution variable estima-tion. (5) The AORDD security solution trade-o¤ analysis and trade-o¤ tool BBNtopology. (6) Rule set for how to transfer RDD information from the annotatedUML diagrams into the trade-o¤ tool BBN topology. (7) Trust-based informa-tion aggregation schema to aggregate disparate information in the trade-o¤ toolBBN topology. This work focuses on components 5 and 7, which are the AORDDsecurity solution trade-o¤ analysis and trade-o¤ tool and the trust-based infor-mation aggregation schema. Details of the AORDD framework are given in Part3 while details of the AORDD security solution trade-o¤ analysis (component 5)are given in Part 4 and details of the trust-based information aggregation schema(component 7) are given in Part 5.

1.3 Main contributions of this work 7
AORDD security solutiontradeoff analysis
Security aspect repository Estimation repository
RDD annotation rules RDD information input rule set
Trustbased informationaggregation schema
RQ.1, RQ.2 and RQ.3C.1, C.2, C.4 and C.5 RQ.4
C.4 and C.5RQ.4
C.4 and C.5
RQ.1 and RQ.2C.1 and C.2
RQ.1 and RQ.2C.1 and C.2
RQ.4C.4 and C.5
AORDD FrameworkOverall objective of this workDescribed in Part 3
AORDD Process
C.4 and C.5Described in Part 3
Part 4
Part 5
Fig. 1.1. The relation between the research questions, main contributions and the threestudies of this work
Figure 1.1 shows which of the �ve contributions in this work addresses whichof the four research questions posed in this work. Figure 1.1 also shows thateach of the three simulation examples performed in this work addresses all fourresearch questions and tests all �ve contributions. The three simulation examplesare named Study 1, 2 and 3 respectively. Details are in Section 1.4.
Contributions 1 and 2 are closely related as the �tness of a security solution isthe sum of the e¤ect of applying security solutions on the security risks. The setof security risk variables must therefore be comparable with the set of securitysolution variables. Security risk is in this work de�ned as a function over misusefrequency (MF), misuse impact (MI), mean e¤ort to misuse (METM), mean timeto misuse (MTTM) and misuse cost (MC) and security solution e¤ect is de�nedas a function over security solution e¤ect (SE) and security solution cost (SC).Thus, MF, MI, METM, MTTM and MC are the security risk variables and SEand SC are the security solution variables. This means that C.1 and C.2 addressresearch questions RQ.1 and RQ.2.
Contribution 3 is a selection of relevant development, project and �nancial per-spectives in a security critical information system development context. Theseare modelled as a set of trade-o¤ parameters in the AORDD security solutiontrade-o¤ analysis and the trade-o¤ tool, which are component 5 of the AORDDframework. The trade-o¤ parameters included are: priorities, budget, businessgoals, standards, business strategy, law and regulations, TTM, policies and se-curity risk acceptance criteria. For policies, business goals, standards, business

8 1. Research Context
strategy and law and regulations only the security perspective is considered. Thismeans that C.3 addresses research question RQ.3 and RQ.4.
To evaluate security solutions and identify the best-�tted security solution amongalternatives for a particular context a methodology for measuring and compar-ing security risk variables, security solution variables and trade-o¤ parametersis needed. This is covered by contributions 4 and 5 of this work. Contribution4 is a methodology for evaluating the e¤ect that a security solution has on asecurity risk while contribution 5 is a methodology for identifying the best-�ttedsecurity solution taking security, development, project and �nancial perspectivesinto consideration. This means that C.4 addresses research question RQ.1, RQ.2and RQ.4 and that C.5 addresses research question RQ.3 and RQ.4.
1.3.1 Publications
The work presented in this thesis is supported by a number of papers that eachdiscusses issues related to the seven components of the AORDD framework tosome degree. However, only three of the papers in the below publication listare enclosed as appendices to this thesis. These are P.16, P.17 and P.26. P.16gives an overview of the AORDD framework and its components. P.17 and P.26describe parts of the �rst and second version of the AORDD security solutiontrade-o¤ analysis. This thesis gives an overview of the current version of theAORDD framework in Part 3 and describes the current version of the two corecomponents of the AORDD framework; the security solution trade-o¤ analysisand trade-o¤ tool and the trust-based information aggregation schema, in Parts4 and 5. Details of which component(s) of the AORDD framework that the otherrelevant papers in the below publication list discusses are given throughout thiswork.
P.1: Siv Hilde Houmb, Folker den Braber, Mass Soldal Lund and Ketil Stølen.Towards a UML Pro�le for Model-based Risk Assessment. In Proceedingsof the First Satellite Workshop on Critical System Development with UML(CSDUML�02) at the Fifth International Conference on the Uni�ed ModelingLanguage (UML�2002). Pages 79-92, TU-Munich Technical Report numberTUM-I0208. Dresden, Germany, 2002.
P.2: Theodosis Dimitrakos, Brian Ritchie, Dimitris Raptis, Jan Øyvind Aagedal,Folker den Braber, Ketil Stølen and Siv Hilde Houmb. Integrating model-based security risk management into eBusiness systems development - theCORAS Approach. In Proceedings of the IFIP Conference on Towards TheKnowledge Society: E-Commerce, E-Business, E-Government. Pages 159-

1.3 Main contributions of this work 9
175, Vol. 233, Kluwer IFIP Conference Proceedings. Lisbon, Portugal, 2002.ISBN 1-4020-7239-2.
P.3: Ketil Stølen, Folker den Braber, Rune Fredriksen, Bjørn Axel Gran, SivHilde Houmb, Mass Soldal Lund, Yannis C. Stamatiou and Jan ØyvingAagedal. Model-based risk assessment - the CORAS approach. In Proceedingsof Norsk Informatikkonferanse (NIK�2002), Pages 239-249, Tapir, 2002.
P.4: Siv Hilde Houmb, Trond Stølen Gustavsen, Ketil Stølen and Bjørn AxelGran. Model-based Risk Analysis of Security Critical Systems. In Fischer-Hubner and Erland Jonsson (Eds.): Proceedings of the 7th Nordic Workshopon Secure IT Systems. Pages 193-194, Karlstad University Press, Karlstad,Sweden, 2002.
P.5: Ketil Stølen, Folker den Braber, Theodosis Dimitrakos, Rune Fredriksen,Bjørn Axel Gran, Siv Hilde Houmb, Yannis C. Stamatiou and Jan Øyv-ing Aagedal. Model-Based Risk Assessment in a Component-Based SoftwareEngineering Process: The CORAS Approach to Identify Security Risks. InFranck Barbier (Eds.): Business Component-Based Software Engineering.Chapter 10, pages 189-207, Kluwer, ISBN: 1-4020-7207-4, 2002.
P.6: Siv Hilde Houmb and Kine Kvernstad Hansen. Towards a UML Pro�le forModel-based Risk Assessment of Security Critical Systems. In Proceedingsof the Second Satellite Workshop on Critical System Development with UML(CSDUML�03) at the Sixth International Conference on the Uni�ed ModelingLanguage (UML�2003). Pages 95-103, TU-Munich Technical Report numberTUM-I0323. San Francisco, CA, USA, 2003.
P.7: Glenn Munkvoll, Gry Seland, Siv Hilde Houmb and Sven Ziemer. Empiricalassessment in converging space of users and professionals. In Proceedings ofthe 26th Information Systems Research Seminar in Scandinavia (IRIS�26).14 Pages. Helsinki, Finland, 9-12 August, 2003.
P.8: Siv Hilde Houmb and Jan Jürjens. Developing Secure Networked Web-basedSystems Using Model-based Risk Assessment and UMLsec. In Proceedings ofIEEE/ACM Asia-Paci�c Software Engineering Conference (APSEC2003).Pages 488-498, IEEE Computer Society. Chiang Mai, Thailand, 2003. ISBN0-7695-2011-1.
P.9: Jan Jürjens and Siv Hilde Houmb. Tutorial on Development of Safety-Critical Systems and Model-Based Risk Analysis with UML. In DependableComputing, First Latin-American Symposium, LADC 2003. Pages 364-365,LNCS 2847, Springer Verlag. Sao Paolo, Brazil, 21-24 October 2003. ISBN3-540-20224-2.

10 1. Research Context
P.10: Siv Hilde Houmb and Ørjan M. Lillevik. Using UML in Risk-Driven De-velopment. In H.R. Arabnia, H. Reza (Eds.): Proceedings of the InternationalConference on Software Engineering Research and Practice, SERP �04. Vol-ume 1, Pages 400-406, CSREA Press. Las Vegas, Nevada, USA, 21-24 June2004. ISBN 1-932415-28-9.
P.11: Siv Hilde Houmb, Geri Georg, Robert France and Dan Matheson. Usingaspects to manage security risks in risk-driven development. In Proceedingsof the Third International Workshop on Critical Systems Development withUML (CSDUML�04) at the Seventh International Conference on the Uni�edModeling Language (UML�2004). Pages 71-84, TU-Munich Technical Reportnumber TUM-I0415. Lisbon, Portugal, 2004.
P.12: Jingyue Li, Siv Hilde Houmb and Axel Anders Kvale. A Process to Com-bine AOM and AOP: A Proposal Based on a Case Study. In Proceedingsof the 5th Workshop on Aspect-Oriented Modeling (electronic proceeding)at the Seventh International Conference on the Uni�ed Modeling Language(UML�2004). 8 pages, ACM. Lisbon, Portugal, 11 October 2004.
P.13: Jan Jürjens and Siv Hilde Houmb. Risk-driven development process forsecurity-critical systems using UMLsec. In Ricardo Reis (Ed.): InformationTechnology, Selected Tutorials, IFIP 18th World Computer Congress, Tu-torials. Pages 21-54, Kluwer. Toulouse, France, 22-27 August 2004. ISBN1-4020-8158-8.
P.14: Mona Elisabeth Østvang and Siv Hilde Houmb. Honeypot Technology ina Business Perspective. In Proceedings of Symposium on Risk-Managementand Cyber-Informatics (RMCI�04): the 8th World Multi-Conference on Sys-temics, Cybernetics and Informatics (SCI 2004). Pages 123-127, InternationalInstitute of Informatics and Systemics. Orlando, FL, USA, 2004.
P.15: Siv Hilde Houmb, Ole-Arnt Johnsen and Tor Stålhane. Combining Dis-parate Information Sources when Quantifying Security Risks. In Proceedingsof Symposium on Risk-Management and Cyber-Informatics (RMCI�04): the8th World Multi-Conference on Systemics, Cybernetics and Informatics (SCI2004). Pages 128-131, International Institute of Informatics and Systemics.Orlando, FL, USA, 2004.
P.16: Siv Hilde Houmb and Geri Georg. The Aspect-Oriented Risk-Driven De-velopment (AORDD) Framework. In Proceedings of the International Con-ference on Software Development (SWDC-REX). Pages 81-91, University ofIceland Press. Reykjavik, Iceland, 2005. ISBN 9979-54-648-4.
P.17: Siv Hilde Houmb, Geri Georg, Robert France, Jim Bieman and Jan Jür-jens. Cost-Bene�t Trade-O¤ Analysis Using BBN for Aspect-Oriented Risk-Driven Development. In Proceedings of the Tenth IEEE International Con-

1.3 Main contributions of this work 11
ference on Engineering of Complex Computer Systems (ICECCS2005). Pages195-204, IEEE Computer Society Press. Shanghai, China, 2005. ISBN 0-7695-2284-X.
P.18: Siv Hilde Houmb. Combining Disparate Information Sources When Quan-tifying Operational Security. In Proceedings of the 9th World Multi-Conferenceon Systemics, Cybernetics and Informatics, Volume I. Pages 128-131, Inter-national Institute of Informatics and Systemics. Orlando, USA, 2005. ISBN980-6560-53-1.
P.19: Siv Hilde Houmb, Geri Georg, Robert France, Raghu Reddy and JimBieman. Predicting Availability of Systems using BBN in Aspect-OrientedRisk-Driven Development (AORDD). In Proceedings of 2nd Symposium onRisk Management and Cyber-Informatics (RMCI�05): the 9th World Multi-Conference on Systemics, Cybernetics and Informatics, Volume X. Pages396-403, International Institute of Informatics and Systemics. Orlando, USA,2005. ISBN 980-6560-62-0.
P.20: Siv Hilde Houmb and Karin Sallhammar. Modeling System Integrity of aSecurity Critical System Using Colored Petri Nets. In Proceedings of Safetyand Security Engineering (SAFE 2005). Pages 3-12, WIT Press. Rome, Italy,2005. ISBN 1-84564-019-5.
P.21: Jan Jürjens and Siv Hilde Houmb. Dynamic Secure Aspect Modeling withUML: From Models to Code. In Model Driven Engineering Languages andSystems: 8th International Conference, MoDELS 2005. Pages 142-155, LNCS3713, Springer Verlag. Montego Bay, Jamaica, 2-7 October 2005. ISBN 3-540-29010-9.
P.22: Dan Matheson, Indrakshi Ray, Indrajit Ray and Siv Hilde Houmb. Build-ing Security Requirement Patterns for Increased E¤ectiveness Early in theDevelopment Process. Symposium on Requirements Engineering for Informa-tion Security (SREIS). Paris, 29 August, 2005.
P.23: Geri Georg, Siv Hilde Houmb and Dan Matheson. Extending Security Re-quirement Patterns to Support Aspect-Oriented Risk-Driven Development.Workshop on Non-functional Requirement Engineering at the 8th Interna-tional Conference on Model Driven Engineering Languages and Systems,MoDELS 2005. Montego Bay, Jamaica, October 2-7 2005.
P.24: Siv Hilde Houmb, Indrakshi Ray and Indrajit Ray. Estimating the RelativeTrustworthiness of Information Sources in Security Solution Evaluation. InKetil Stølen, William H. Winsborough, Fabio Martinelli and Fabio Massacc(Eds.): Proceedings of the 4th International Conference on Trust Management(iTrust 2006). Pages 135-149, LNCS 3986, Springer Verlag, Pisa, Italy, 16-19May 2006.

12 1. Research Context
P.25: Geri Georg, Siv Hilde Houmb and Indrakshi Ray. Aspect-Oriented RiskDriven Development of Secure Applications. In Damiani Ernesto and PengLiu (Eds.), Proceedings of the 20th Annual IFIP WG 11.3 Working Confer-ence on Data and Applications Security 2006 (DBSEC 2006). Pages 282-296,LNCS 4127, Springer Verlag, Sophia Antipolis, France, 31 July - 2 August2006.
P.26: Siv Hilde Houmb, Geri Georg, Robert France and Jan Jürjens. An Inte-grated Security Veri�cation and Security Solution Design Trade-o¤ Analysis.In Haralambos Mouratidis and Paolo Giorgini (Eds), Integrating Securityand Software Engineering: Advances and Future Visions. Chapter 9, Pages190-219. Idea Group Inc, 2007. ISBN: 1-59904-147-6. 288 pages.
P.27: Siv Hilde Houmb, Geri Georg, Robert France, Dorina C. Petriu and JanJürjens (Eds.). In Proceedings of the 5th International Workshop on CriticalSystems Development Using Modeling Languages (CSDUML 2006). 87 pages.Research Report Telenor R&I N 20/2006, 2006.
P.28: Geri Georg, Siv Hilde Houmb, Robert France, Ste¤en Zschaler, DorinaC. Petriu and Jan Jürjens. Critical Systems Development Using ModelingLanguages �CSDUML 2006 Workshop Report. In Thomas Kühne (Eds.),Models in Software Engineering: Workshops and Symposia at MoDELS 2006,Genoa, Italy, October 1-6, 2006, Reports and Revised Selected Papers. Pages27-31, LNCS 4364, Springer Verlag, 2007.
P.29: Dorina C. Petriu, C. Murray Woodside, Dorin Bogdan Petriu, Jing Xu,Toqeer Israr, Geri Georg, Robert B. France, James M. Bieman, Siv HildeHoumb and Jan Jürjens. Performance analysis of security aspects in UMLmodels. In Proceedings of the 6th International Workshop on Software andPerformance, WOSP 2007. Pages 91-102, ACM. Buenes Aires, Argentina,5-8 February 2007. ISBN 1-59593-297-6.
1.4 Research method and way of work
The research method adopted in this work is action research [90]. In action re-search the construction and evaluation of an approach under development is donein an integrating and re�ecting context. This means that the constructors (suchas developers of software systems or researches of methodology) and end-userswork together in a setting that enables the end-users to express their goals andopinions explicitly and implicitly and the constructor can passively observe andactively interact with the tasks performed by the end-users. Here, the goal of theconstructor is to understand the why, when and what of the tasks performed by

1.4 Research method and way of work 13
the end-users. The latter is called change and re�ection and hence the emphasisin action research is more on what practitioners do than on what they say theydo.
Action research comes in a number of shapes and are applied in �elds such asorganisation development and education and health [90, 99]. Lately, action re-search has also been adapted for and applied in the software engineering domain[100], such as that of the CORAS project [19]. More information and appropri-ate references on action research and theory on community of practice for whichaction research is based upon are in Munkvoll et al. (2003) [76].
1.4.1 Application of action research for this work
Most action research projects set out to explicitly study something in order tochange and improve it. In many cases the need for change or improvement arisesfrom an unsatisfactory situation that those a¤ected want to improve. However, itcan also arise from a need to extend or re�ne an already satisfactory situation. Asimprovement can only be facilitated by a complete understanding of the particularwork situation it is important to ensure that the constructors have the ability tostudy and understand the problems of the end-users. This is best done throughpractical participation and experimentation. Hence, the process of action researchis iterative and usually consists of some variation of the three phases: hypothesis,�eldwork and analysis and conclusion based on the results from the �eldwork andanalysis.
This work has used an example-driven action research approach both for the ini-tial explorative phase and for the development and evaluation phase. The explo-rative phase focused on understanding the needs of the decision maker (end-user)in the context of security solution decisions. This was performed in a number ofiterations through execution and observation of security solution decision situa-tions using simulation examples. The development and evaluation phase includedthe interpretation of the result from the explorative phase and change and re-�ection through example-driven testing of alternative approaches and techniquesto the problems or challenges discovered. This phase also went through a num-ber of iterations as well as reiterated back to the explorative phase as it becameevident that a better understanding of the problems and challenges involved insecurity solution decisions were needed. These two phases constitute the overallwork process of this work. To achieve a structured and repeatable process withineach of the two work phases each was called a construction process and structuredlike a development process as shown in Figure 1.2.
As action research is used in this work the testing phase is extended to includeprototyping. Also, as the evaluation is example-driven through testing and pro-

14 1. Research Context
RequirementsPhase
DesignPhase
Test andPrototypingPhase
ImplementationPhase
Evaluate, Refineand Update Phase
RequirementsPhase
DesignPhase
Test andPrototypingPhase
ImplementationPhase
Evaluate, Refineand Update Phase
Fig. 1.2. The phases and iterations of the construction (work) process
Develop version n of approach
Test version n of approach in trial n
Evaluation of version n of approach
If approach does not meetrequirements, or predefinedgoals not met: n=n+1
Requirements andpredefined goalsare met (sufficently met)
Develop version n of approach
Test version n of approach in trial n
Evaluation of version n of approach
If approach does not meetrequirements, or predefinedgoals not met: n=n+1
Requirements andpredefined goalsare met (sufficently met)
Fig. 1.3. Action research and how it in�uenced the construction process
totyping an additional loop-back phase called evaluate, re�ne and update areperformed in all iterations before �nally entering the implementation phase. Thisensures that the approach developed is su¢ ciently mature and evaluated beforeany implementation activity is started. Hence, the work process iterates betweenall phases, as well as between the testing and prototyping phase and the require-ments phase. This means that several iterations involving the four �rst phaseswere executed before any full iteration was performed. Figure 1.3 shows howaction research in�uenced the construction process while Figure 1.4 illustrateshow the community of practice was built and maintained throughout this workand and gives an overview of the step-wise construction and evaluation strategyadapted in this work.

1.4 Research method and way of work 15
ConstructorsPractitioners
Evaluation session:Examine evaluation results,
and refine and updatemethdology
2
34
1
Test and evaluationthrough example runs
ConstructorsPractitioners
Evaluation session:Examine evaluation results,
and refine and updatemethdology
2
34
1
Test and evaluationthrough example runs
Fig. 1.4. The evaluation and validation process used in this work
As can be seen in Figure 1.4 the communities of practice were built and main-tained using three main constructs: (1) Requirement speci�cation, design, testingand implementation with involvement from both the practitioner and constructorroles where the practitioners execute and the researchers observe. (2) Test andevaluation through practical examples. (3) Evaluation, re�ne and update basedon the results from the example runs. An important question in the latter was:Did the methodology meet its intentions su¢ ciently in terms of feasibility, usabil-ity and applicability? The results from the evaluation session in (3) are used asinput to the next iteration in the construction of the methodology. This processwas repeated until the requirements of the end-user were met or the goal of thiswork was su¢ ciently achieved.
This work re-engineered parts of the ACTIVE e-commerce platform in three fulliterations of the action research based work process described above. Each ofthese iterations are called a study and referred to as study 1, 2 and 3 in Figure1.1. These studies are simulation examples as they were not carried out in anindustrial setting but rather in a research setting. Details are given in Chapter18.
In addition to the three simulation examples included as part of the action re-search work process three controlled experiments were executed; one using stu-dents at NTNU and two using a mixture of students and people with relevantindustrial background at Colorado State University, Fort Collins, US. These three

16 1. Research Context
experiments were performed to explore the relation between some of the variablesin the trust-based information aggregation schema described in Part 5 of this the-sis. A selection of the results from the �rst experiment is given in Houmb, Johnsenand Stålhane (2004) [49].

2. Outline of the Thesis
As can be seen from the publication list in Section 1.3.1 this work has crawleddown many small paths. The reason for this is that risk assessment and manage-ment is still a rather new �eld within the security domain and quanti�cation ofsecurity risks, security levels or operational security level of information systemsare even less explored. However, during the last thirteen years, since the pub-lication of the �rst major paper on quantifying security risks as an operationalmeasure by Littlewood et al. (1993) [74], the focus has shifted but the domain isstill far from mature. There is thus substantial work left in advocating a broaderacceptance on the importance of structured and formalised security assessmentand management both during development and as a continuous day-to-day activ-ity and particular on how to handle security risk in relation to other perspectives.The latter has however improved as the �nancial factors became more importantduring and after the massive breakdown of the dot-com bubble in 2001.
In an attempt to avoid confusing the reader by presenting the many detours inthis work the focus is put on three topics and these are: (1) Giving an overview ofthe AORDD framework. (2) Describing the AORDD security solution trade-o¤analysis and associated trade-o¤ tool. (3) Describing the trust-based informationaggregation schema used to combine information as input to the trade-o¤ tool.
The reminder of this work is organised as follows:
Part 2: Background Information and State of the Art. This part provides back-ground information in terms of state of the art within security and risk assessmentand management, risk management processes and development processes relevantfor this work. This part also gives an overview of relevant security standards anddescribes the state of the art in security evaluation, quantifying security, archi-tectural/design trade-o¤ analysis and subjective expert judgment.
Part 3: Security Solution Decision Support Framework. This part is the �rst of thethree main parts of this work and gives an overview of the AORDD framework andits seven components. This part also looks into how each of these components

18 2. Outline of the Thesis
relates to each other and how each contributes in aiding a decision maker inchoosing a security solution among alternatives.
Part 4: AORDD Security Solution Trade-O¤ Analysis. This part is the second ofthe three main parts of this work and provides details on the AORDD securitysolution trade-o¤ analysis, which is one of two main components of the AORDDframework. The trade-o¤ analysis is implemented as the BBN topology trade-o¤tool which is also described in this part.
Part 5: Aggregating information in the trade-o¤ tool. This part is the last of thethree main parts of this work and describes the steps-wise trust-based informationaggregation schema, which is an performance-based weighting expert opinionaggregation schema tailored for security solution decision support. This part alsogives an overview of information sources suitable for estimating the security risksand security solutions variables in the AORDD security solution trade-o¤analysisand trade-o¤ tool.
Part 6: Validation, Discussion and Concluding Remarks. This part concludesthis work and contains a validation of the applicability, feasibility and usabil-ity of the AORDD framework as a security solution decision support approachby demonstrating the use of the trust-based performance weighting schema andthe AORDD security solution trade-o¤ analysis and trade-o¤ tool. In addition,this part includes a discussion of the strengths and weaknesses of the AORDDframework as a security solution decision support framework and concludes witha summary of this work, as well as some insights into ongoing and further work.
Part 7: Appendices. This part contains the appendices to this work which is thefollowing:
� Appendix A: AORDD Concepts� Appendix B.1: P.16: Houmb and Georg (2005); The Aspect-Oriented Risk-Driven Development (AORDD) Framework
� Appendix B.2: P.26: Houmb et al. (2006); An Integrated Security Veri�cationand Design Security Solution Trade-o¤ Analysis
� Appendix B.3: P.17: Houmb et al. (2005); Cost-Bene�t Trade-O¤ AnalysisUsing BBN for Aspect-Oriented Risk-Driven Development
� Appendix C: Publication list

Part II
Background Information and State of the Art


3. Security in Information Systems
According to ISO 15408:2006 Common Criteria for Information Technology Secu-rity Evaluation Common Criteria [15] security is about protection of assets fromunauthorised disclosure, modi�cation or loss of use. Hence, the goal of securityassurance is to establish con�dence in that assets are su¢ ciently protected frompotential security risks. Assets in this context are entities that have a value toone or more of the system stakeholders.
The ascribed meaning of security, security threats and security attacks in relationto an information system is however ambiguously de�ned and used. This is alsothe case across well-known security standards, such as ISO 15408:2006 CommonCriteria for Information Technology Security Evaluation Common Criteria [15],ISO/IEC 17799:2000 Information technology �Code of Practice for informationsecurity management [55] and ISO/IEC TR 13335:2001 Information technology�Guidelines for management of IT Security [54]. ISO/IEC 17799 talks aboutinformation security while ISO 15408 (Common Criteria) and ISO/IEC TR 13335targets Information Technology (IT) security. Furthermore, Common Criteria andISO/IEC 17799 de�ne security to include con�dentiality, integrity and availabilityof IT and information systems respectively while ISO/IEC 13335 has a broaderscope that also covers the security attributes authenticity, accountability, non-repudiation and reliability. This ambiguity makes it hard to communicate andmanage security and leads to confusion and imprecise description of the potentialundesired behaviour of a system. To meet these challenges and avoid confusionin the context of this work a clear and precise de�nition of the involved conceptsincluding security, security threats, security attacks, security assessment, securitymanagement, security assurance and security evaluation is given in the following.
IT security relates to an IT system while information security relates to an infor-mation system. IT systems are systems with computers connected to a networkcontaining data, software and hardware as a potential target for intended or un-intended security attacks that might a¤ect either the system itself, its data or itsstakeholders and users [54]. An information system goes beyond the concept ofcomputers and does also covers the conceptual parts related to a system, such as

22 3. Security in Information Systems
the people who use, develop, manage and maintain the system. Hence, IT systemsare the computerised part of an information system.
This work targets information systems and has adopted the de�nition of informa-tion system from the architecture standard IEEE Std 1471-2000 RecommendedPractice for Architectural Description of Software�Intensive Systems [52] whilesecurity is understood as information security and de�ned according to ISO/IECTR 13335, which includes all seven security attributes.
De�nition Information system is a system containing physical and conceptualentities that interacts as a potential target for intended or unintended securityattacks which might a¤ect either the system itself, its data or its stakeholdersand end-users (modi�ed from IEEE Std 1471�2000 [52]).
De�nition Information security comprises all perspectives related to de�n-ing, achieving, and maintaining con�dentiality, integrity, availability, non-repudiation, accountability, authenticity and reliability of an information sys-tem (adapted and modi�ed for information security from ISO/IEC TR 13335[54]).
According to the Common Criteria a security critical information system is asystem where information held by IT products is a critical resource which enablesorganisations to succeed in their mission. This means that the success of such asystem is highly dependent on its perceived level of security. The security levelof an information system should be understood as the ability of the system tomeet the end-users expectations and ensure that their personal information iskept con�dential (secret), is available to them upon request and is not modi�edby unauthorised users. An information system should perform its functionalitywhile exercising proper control of the contained information to ensure that it isprotected against unwanted or unwarranted dissemination, alternation or loss.The term IT security is used in the Common Criteria to cover prevention andmitigation of undesired events a¤ecting the value of assets.
De�nition Assets are entities that have value to one or more of the system stake-holders modi�ed from [15]).
De�nition Stakeholder is an individual, team or organisation (or classes thereof)with interest in or concerns relative to an information system (modi�ed fromthe software architectural standard IEEE 1471 [52]).
De�nition Physical assets are physical entities of value to one or more stake-holders, such as hardware and other infrastructure entities, operating systems,application and information (interpretation of de�nition given in [20]).

3. Security in information systems 23
De�nition Conceptual assets are non-physical entities of value to one or morestakeholders, such as people and their skills, training, knowledge and experi-ence, and the reputation, knowledge and experience of an organisation (in-terpretation of de�nition given in [20]).
De�nition Asset value is the value of an asset in terms of its relative impor-tance to a particular stakeholder. This value is usually expressed in terms ofsome potential business impacts. This could in turn lead to �nancial losses,loss of revenue, market share or company image (modi�ed from the risk man-agement standard AS/NZS 4360:2004 [4]).
In this work, as in AS/NZS 4360:2004, CRAMM and CORAS, assets are the cen-tre of the attention and de�nes the entities of concern in an information system.In the reminder of this work a security critical information system is understoodas a system that contains assets with values which it is critical to preserve oneor more of the security attributes of. Here, critical means that security attacksagainst the security attributes of such a system might lead to unacceptable lossof value of one or more of the asset for at least one of the involved stakeholders.Such systems include for example systems for e-commerce, medical systems, �-nancial systems and databases that stores personal information. The preservationof the information held by these systems is often a critical success factor for theorganisation and its stakeholders to succeed in their goals. End-users or anyonethat are involved in the day-to-day use of these systems expect that the sensitiveinformation they provide to the system are adequately protected.
De�nition Security critical information system is an information system wh-ere there are assets with values for which it is critical to preserve one or moreof the security attributes of (modi�ed from [15]).
De�nition Con�dentiality (or secrecy) means that information is made avail-able or disclosed only to authorised individuals, entities or processes [54].
De�nition Integrity means that information is not destroyed or altered in anunauthorised manner and that the system performs its intended function inan unimpaired manner free from deliberate or accidental unauthorised ma-nipulation of the system [54].
De�nition Availability means that system services are accessible and usable ondemand by an authorised entity [54].
De�nition Authenticity ensures that the identity of a subject or resource is theone claimed [54].
De�nition Accountability Accountability means that actions of an entity maybe traced uniquely to the entity [54].

24 3. Security in Information Systems
De�nition Non-repudiation is the ability to prove that an action or event hastaken place in order to prevent later repudiation of this event or action [54].
De�nition Reliability is the ability of an item to perform a required functionunder stated conditions [96] (Please note that the use of the term �item�intentionally allows for the calculation of reliability for individual componentsor for the system as a whole.).
A security threat denotes a potential action that violates one or more security at-tributes of an information system by exploiting vulnerabilities in the informationsystem. A security attack is the employment of a security threat. Such threatsand attacks denote unauthorised use of an information system and can be eitherintentional or unintentional (accidental). Furthermore, a security attack might beinitiated by both external and internal users of an information system. In fact,research indicates that about 80% of all security breaches are caused by insiders,meaning a company�s own employees.
Security attacks can be either active or passive [95]. In an active attack the in-truder engages in tampering with the information being exchanged either throughmodi�cation of data streams or through creation of false data streams. Active at-tacks target the integrity, availability and authenticity of assets and the account-ability and non-repudiation of the identity and actions of the authorised usersof a system. In a passive attack the intruder observes the information passingthrough a communication channel without interfering with its �ow or content.Passive attacks a¤ect the con�dentiality of assets.
3.1 Security standards and regulations
Security management standards aid in the overall and detailed management ofsecurity in an organisation. In this work the most relevant standards within thesecurity domain are the ISO/IEC 17799:2000 Information Technology � Codeof Practice for information security management [55], ISO/IEC TR 13335:2001Information Technology �Guidelines for management of IT Security [54] and theAustralian/New Zealand standard for risk management AS/NZS 4360:2004 [4].However, it is important to note the distinction between security management andsecurity risk management. The �rst do not necessary include any use of structuredrisk analysis methods while the latter does. Security management is often aidedby the use of checklists, vulnerability analysis and other similar security analysis.Risk analysis in the context of this work refers to safety analysis methods adaptedto the security domain, such as those described in the CORAS framework [97].

3.1 Security standards and regulations 25
The security management standard ISO/IEC 17799 provides recommendationsfor information security management and supports the people in an organisationthat are responsible for initiating, implementing or maintaining security in an or-ganisation. The standard aid in developing organisational-speci�c security stan-dards and hence ensures e¤ective security management in practice. The standardalso provides guidelines about how to establish con�dence in inter-organisationalmatters.
The security management standard ISO/IEC 13335 provides guidance on howto manage IT security. Here, the main objectives are to de�ne and describe theconcepts associated with the management of IT security, to identify the relation-ships between the management of IT security and management of IT in general,to present models for reasoning about IT security and to provide general guidanceon the management of IT security.
AS/NZS 4360 is a widely recognised and used standard within the risk assess-ment and management domain. The standard is a general risk management stan-dard that has been tailored for security risk assessment and management in theCORAS framework [97]. The standard includes a risk management process thatconsists of �ve assessment sub-processes and two management sub-processes, adetailed activity description for each sub-process, a separate guideline compan-ion standards and general risk management advice. More information on riskmanagement and AS/NZS 4360 is in Chapter 5.
The last category of security standards relevant for this work is security evalu-ation standards. ISO 15408:2005 Common Criteria for Information TechnologySecurity Evaluation [15] is an example of a security evaluation standard. Suchstandards with their associated evaluation techniques and guidelines have beenaround since the beginning of the 1980s. The oldest known standard for evaluationand certi�cation of information security of IT products is the Trusted ComputerSystem Evaluation Criteria (TCSEC) [24]. The standard was developed by theUS Department of Defense (DoD), issued in 1985 and evaluates systems accord-ing to the six prede�ned classes: C1, C2, B1, B2, B3 and A1. These classes arehierarchically arranged with A1 as the highest level and C1 is the lowest level(actually TCSEC groups these classes into four categories: A, B, C and D, butcategory D is not used for certi�cation). Each class contains both functional andassurance requirements. The functional requirements are divided into authenti-cation, role-based access control, obligatory access control and logging and reuseof objects. TCSEC is also known as the Orange Book and was developed withmilitary IT systems in mind. The standard was to some extent also used to evalu-ate industrial IT products but was shown to be too cost and resource demandingand thus not su¢ ciently e¤ective in an industrial setting.

26 3. Security in Information Systems
As a response to the development of TCSEC the United Kingdom, Germany,France and the Netherlands produced their own national evaluation criteria.These were harmonised and in 1991 published under the name Information Tech-nology Security Evaluation Criteria (ITSEC) [25]. ITSEC certi�cation of a soft-ware product means that users can rely on an assured level of security for anyproduct they are about to purchase. As for TCSEC, ITSEC certify productsaccording to prede�ned classes of security (E0, E1, E2, E3, E4, E5 and E6).
A similar activity was also undertaken in Canada by the Communications Se-curity Establishment (CSE), which is an intelligence agency of the Canadiangovernment charged with the duty of keeping track of foreign signals intelligence.The Canadian initiative led to the Canadian Trusted Computer Product Eval-uation Criteria (CTCPEC) [39]. CTCPEC was published in 1993 and combinesthe TCSEC and ITSEC approaches.
However, TCSEC, ITSEC and CTCPEC did not su¢ ciently address the needsfrom industry and the International Organization for Standardization (ISO)started combining these e¤orts into one industrial adapted version called theCommon Criteria (ISO 15408). This work started in 1990 and led to the publi-cation of the Common Criteria version 1.0 in 1995. The Common Criteria hassince then largely taken over for TCSEC, ITSEC and CTCPEC. The idea behindthe Common Criteria was to merge the three existing approaches into a worldwide framework for evaluating security properties of IT products and systems.The standard incorporates experience from TCSEC, ITSEC, CTCPEC and otherrelevant standards and provides a common set of requirements for the securityfunctions of IT products and systems. As for its predecessors certi�cation is doneaccording to prede�ned levels. In the Common Criteria these are called evalu-ation assurance levels (EAL) and there are seven EALs: EAL1, EAL2, EAL3,EAL4, EAL5, EAL6 and EAL7 where EAL 7 is the highest level and includesrequirements for the use of formal methods during the development of the ITproduct.
The Common Criteria also provide a program called Arrangement on the Recog-nition of Common Criteria Certi�cates in the �eld of IT Security (CCRA) andan evaluation methodology called Common Methodology for IT Security Eval-uation (CEM). These two together ensure the equality and quality of securityevaluations such that results from independent evaluations can be compared andhence aid decision makers (customers) in choosing among security solutions. Moreinformation on CCRA and CEM is given in Chapter 4.
A common problem for most security evaluations however is the large amountof information involved. The result of evaluations is also subject to bias as theevaluation is done by one or a few evaluators. However, these evaluators mustusually be certi�ed to perform the evaluation but that does not prevent the

3.1 Security standards and regulations 27
evaluation from involving a high degree of subjectivity. It is these problems thatthe AORDD framework, and in particular the AORDD security solution trade-o¤ analysis described in Part 4 of this work and the trust-based informationaggregation schema described in Part 5 of this work, is meant to aid.


4. Common Criteria for Information TechnologySecurity Evaluation
The current version of the Common Criteria is version 3.1 [15] which was pub-lished in September 2006. As with its preceding versions, version 3.1 consist offour parts: Common Criteria Part 1, Common Criteria Part 2, Common CriteriaPart 3 and the Common Methodology for Information Technology Security Eval-uation (CEM), with the associated numbers CCMB-2006-09-001, CCMB-2006-09-002, CCMB-2006-09-003 and CCMB-2006-09-004 respectively. Here, CommonCriteria Parts 1 to 3 contain the general model, the security functional compo-nents and the security assurance components and targets mainly developers andconsumers of IT products. The CEM is a guidance tool for a Common Criteriaevaluator that also provides useful information and guidance for developers inpreparing information for the evaluation and for consumers in getting an insightinto the activities leading to the evaluation conclusion and on how to read andinterpret the evaluation result.
The Common Criteria provides a methodology and process that allows for com-parability between results of independent security evaluations. This is the maincontribution of the Common Criteria to the security evaluation domain. Thestandard does this by providing a common set of requirements for the securityfunctionality of IT products and for the assurance measures that are applied tothese products during evaluation. In addition, the Common Criteria o¤ers con-structs for consumers to specify their security requirements and evaluation resultsformulated such that it helps a consumer to determine whether a particular ITproduct ful�ls their security needs.
During a Common Criteria evaluation the IT product is denoted Target of Evalua-tion (ToE). A ToE can consist of any speci�ed combination of hardware, �rmwareor software, the development environment of these and the operational environ-ment that these are intended to work in or evaluated for. Hence, a ToE is aspeci�c con�guration of an IT product. It should be noted however that the pro-cedures and techniques used for accreditation of IT products according to theevaluation results are outside the scope of the Common Criteria and are handledby separate evaluation authorities. Guidance on certi�cation and accreditation

30 4. The Common Criteria
and a set of experience and interpretation documents for all parts of a CommonCriteria evaluation and certi�cation are available for download from the CommonCriteria portal (see http://www.commoncriteria.org).
There are three groups with general interest in a Common Criteria evaluationand these are consumers, developers and evaluators. Consumers can use CommonCriteria evaluations and Common Criteria information to assist in procurementof IT products. This means that a consumer can have alternative IT productsto choose between and would like to identify which of the alternatives that arebest-�tted to his or her needs. Thus, consumers can use the Common Criteriato compare di¤erent IT products con�gured into ToEs in a Common Criteriaevaluation. Consumers may also use Protection Pro�les (PP) to specify theirsecurity requirements (also called needs). A PP is a particular set of securityrequirements speci�ed for a type or group of IT Products that can either becerti�ed separately or used as a requirement speci�cation.
Developers use the Common Criteria to assist in the identi�cation of securityrequirements and to package information on the security of their IT product toaid consumers in their procurement (or rather convince a consumer to purchasetheir product). The above is achieved by following the general guidelines given inCommon Criteria Part 1 and the guidelines for selection and assignment of thesecurity functional components in Common Criteria Part 2.
An evaluator uses the Common Criteria to aid in deriving and formulating judg-ments about the conformance of a ToE to its security requirements. The CommonCriteria also gives the evaluator guidelines on which actions to carry out during aCommon Criteria evaluation. Generally, an evaluator is supported by the securityassurance components in Common Criteria Part 3 and the evaluation methodol-ogy in CEM.
4.1 Relevant parts of Common Criteria terminology
As discussed earlier the security domain is not consistent in the use of and as-cribed meaning of the concepts involved in assessing, managing and evaluatingthe security of information systems. Therefore, this section provides the Com-mon Criteria security evaluation concepts relevant for this work. This is to aidin the understanding of the focus and contribution of this work. The de�nitionsare taken from Common Criteria v3.1 Part 1. Please note that a de�nition of theconcept �asset�is not included in the de�nition list below as it has been de�nedearlier. Any concepts used by this work not given in the below de�nition list arede�ned when �rst used. There are also concepts where the ascribed meaning in

4.2 Evaluation and certi�cations according to the Common Criteria 31
this work di¤ers from that of the Common Criteria. Any such situation is clearlystated throughout this work.
De�nition Development environment is the environment in which the ToE isdeveloped [15].
De�nition Evaluation authority is a body that implements the Common Cri-teria for a speci�c community by means of an evaluation scheme and therebysets the standards and monitors the quality of evaluation conducted by bodieswithin that community [15].
De�nition Evaluation scheme is the administrative and regulatory frameworkunder which the Common Criteria is applied by an evaluation authoritywithin a speci�c community [15].
De�nition Operational environment is the environment in which the ToE isoperated [15].
De�nition Security Target (ST) is an implementation-dependent statement ofthe security needs for a speci�c TOE [15].
De�nition Protection Pro�le (PP) is an implementation-independent state-ment of security needs for a TOE type [15].
De�nition Target of Evaluation (ToE) is a set of software, �rmware and/orhardware possibly accompanied by guidance [15].
De�nition User is any external entity (human user or machine user) to the ToEthat interacts (or may interact) with the ToE [15].
It should be noted from the de�nition of ToE and the earlier de�nition of ITsystem (product) and information system that a ToE does not fully addressall perspectives of an information system. A ToE covers parts or whole of thecomputerised part of an information system. As discussed earlier an IT systemis the computerised part of an information system and hence in this work aninformation system covers the ToE, the user, the development environment andoperational environment and has a broader scope than the Common Criteria.Details are given in Parts 3 and 4 of this thesis.
4.2 Evaluation and certi�cations according to the CommonCriteria
The Common Criteria recognises two types of evaluations: (1) ST/ToE evaluationand (2) PP evaluation. In case of an ST/TOE evaluation particular parts of or

32 4. The Common Criteria
Objectives Requirements Specifications MechanismsObjectives Requirements Specifications Mechanisms
Fig. 4.1. ST, PP and ToE in relation to phases of a development process
the whole IT product are de�ned into a ToE. In case of a PP evaluation particularparts of or the whole IT product type is de�ned into a ToE type. A PP is animplementation-independent version of a particular IT product type, such asSmart Cards. This means that a PP can be looked upon as a template for atype of IT products. Figure 4.1 illustrates the process of a Common Criteriaevaluation in relation to a standard development process while Figure 4.2 showsthe relationship between PP, ST and ToE. The important factor to note in thiscontext is that the result of either a PP or ST/ToE evaluation is stored for laterreuse in a PP and ToE registry respectively.
As discussed earlier the Common Criteria does not directly deal with the cer-ti�cation and accreditation process. This is done by local evaluation authoritiesusually on a country-wise basis using their local evaluation scheme. However,CEM is a common methodology for the Common Criteria evaluation processand provides general guidelines that these local evaluation schemes can be basedupon. CEM is mutually recognised across the existing local evaluation schemesand thus contributes to enhancing the ability of consumers to compare alterna-tive solutions. However, there are activities in an evaluation process that requiresubjective interpretation and opinion and thus are hard to �objectively�compare.
In Norway the evaluation scheme is held by the Norwegian Certi�cation Authorityfor IT Security (SERTIT) operated by the Norwegian National Security Agency.This means that SERTIT is the authority issuing Common Criteria certi�catesto IT products in Norway and hence de�nes the certi�cation and accreditationmethodology and process for the evaluation scheme in Norway. In practice this

4.2 Evaluation and certi�cations according to the Common Criteria 33
EvaluateST
PP EvaluationResults
ST EvaluationResults
ToE EvaluationResults
EvaluatedPP
EvaluatedST
EvaluatedToE
ToE
Registry
PP
Registry
EvaluateST
EvaluateST
EvaluateST
PP EvaluationResults
ST EvaluationResults
ToE EvaluationResults
EvaluatedPP
EvaluatedST
EvaluatedToE
ToE
Registry
PP
Registry
EvaluateST
EvaluateST
Fig. 4.2. Relationship between PP, ST and ToE in Common Criteria (page 45 in Part1 of [15])
means that SERTIT is responsible for all evaluation done within the Norwegianscheme. SERTIFF is also responsible for issuing accreditations for evaluators andthus determines who can be quali�ed evaluators in Norway. To be a quali�edevaluator under the SERTIT scheme potential evaluators need to undertake atrial evaluation to prove their ability to understand the Common Criteria andthe CEM. Quali�ed evaluators are called EVIT and accredited as a laboratoryaccording to the Norwegian standard NS-ISO 17025 [78]. There are two o¢ cialevaluators in Norway per 30 June 2006 and these are Norconsult AS and SecodeNorge AS.
CCRA is the arrangement on the recognition of Common Criteria certi�cations inthe �eld of IT security and is an international regulatory framework for evaluatorschemes that works towards establishing certi�cation frameworks so that cer-ti�cates from di¤erent evaluation schemes can be mutually recognised (meaninginternationally recognised between the member CCRA certi�cation authorities).CCRA was established on 23 May 2000. As of 5 June 2007 there are 12 certi�cateauthorisation schemes recognised by CCRA. These are the certi�cate schemes ofAustralia and New Zealand (Australasian Information Security Evaluation Pro-gram (AISEP)), Canada (Canadian Common Evaluation and Certi�cation Cri-teria Scheme), France (French Evaluation and Certi�cation Scheme), Germany(German Evaluation and Certi�cation Scheme), Japan (Japanese Evaluation andCerti�cation Scheme), the Republic of Korea (Korea IT Security Evaluation andCerti�cation Scheme (KECS)), the Netherlands (Netherlands Scheme for Certi-�cation in the Area of IT Security (NSCIB)), Norway (Norwegian Certi�cation

34 4. The Common Criteria
Authority for IT Security (SERTIT)), Spain (Organismo de Certi�cacíon de laSeguridad de las Tecnologías de la Información), the United Kingdom (UK ITSecurity Evaluation and Certi�cation Scheme) and the United States (CommonCriteria Evaluation and Validation Scheme (CCEVS)). In addition, there are 11countries that are in the process of setting up or getting acceptance for their lo-cal schemes. These are called certi�cation consuming by the CCRA and include:Austria, the Czech Republic, Denmark, Finland, Greece, Hungary, India, Italy,Singapore, Sweden and Turkey.
4.3 Performing a Common Criteria evaluation
A Common Criteria evaluation usually involves the developer and the evaluator.In some cases the consumer is known and requests the evaluation. In additionthere are cases where the entity paying for the evaluation is external to thedeveloper and therefore called the sponsor. An example of such is when theconsumer is the Norwegian military authorities with the Norwegian Governmentpaying for the evaluation. In this case the Norwegian Government is called thesponsor.
The developer is always the entity that has or is developing the IT product thatthe evaluator evaluates using the local evaluation scheme. Since it is a particularcon�guration of an IT product that is of interest in a Common Criteria evaluationthe evaluation target and context are speci�ed into a ToE or type of ToE. Thismeans that one IT product might lead to several ToEs. Note that each ToE hasa development and operational environment associated to it.
A Common Criteria evaluation is performed by the evaluator using Common Cri-teria Part 3; security assurance components. Part 3 provides a set of assurancecomponents that de�nes a set of evaluation tasks structured into groups of com-ponents that target a particular security level and which the evaluator and thedeveloper needs to execute. These groups of components are called EvaluationAssurance Levels (EAL). Recall that there are seven EAL levels where EAL 1provides the lowest level of assurance and EAL 7 provides the highest level ofassurance or con�dence in that the assets of the ToE are su¢ ciently protected.
Before an evaluation can be carried out there are speci�c pieces of informationthat the developer needs to provide. These pieces of information can be derivedby the developer using the Common Criteria Part 3 to guide the development ofthe ToE. By doing so the developer are able to prepare the necessary developmentdocuments and to perform the required analysis for a Common Criteria evalu-ation, such as vulnerability analysis to provide the necessary evidence that theToE posses the required security attributes. The general idea is that the developer

4.3 Performing a Common Criteria evaluation 35
needs to provide any piece of information that is required for the evaluator togain the necessary con�dence in the security abilities of the ToE. The evaluatoruses Common Criteria Part 3 to check the development deliverables and performadditional analyses depending on which EAL the ToE targets.
Generally, the Common Criteria o¤ers a well-founded, well-tested and struc-tural industry standard means of evaluating IT products. However, the standardhas not gained as wide use as anticipated. Although this is improving, for ex-ample through the adaptation of the Common Criteria in ETSI TISPAN (seehttp://portal.esti.org), it might be too large a framework for systems with rapidand ad-hoc development processes, short TTM, tight budget constraints and shortlife-time. Web-based systems, such as some e-commerce systems, are examples ofsystems that might fall out of the market before a Common Criteria evaluationare completed. This does not mean that the Common Criteria is not relevant forthese systems. On the contrary, the very existence of these systems depends ontheir security level. There is a need for methodology and tool support to makethe Common Criteria applicable in practice for these systems. This has partlybeen addressed by the AORDD Security Solution Trade-O¤ Analysis developedin this work. Details are given in Part 4.


5. Risk Assessment and Management ofInformation Systems
The [risk assessment] approach adopted should aim to focus securitye¤ort and resources in a cost-e¤ective and e¢ cient way [1]
Security is traditionally maintained through security policies and security mech-anisms. Security policies specify roles related to who, what and when of an in-formation system, meaning which users (who) can perform which actions (what)at which points in time (when). Thus, security policies give procedures and rulesfor the authorised use of an information system and are often on a conceptualor enterprise level of abstraction. Security mechanisms are the concrete securitycontrols implemented in a system, such as �rewalls, �ltering on Internet gateway,encryption of communication and data and anti-virus software. The purpose ofthese mechanisms is to protect data, software and hardware from malicious at-tackers by preventing them from exposing it, altering it, removing it or in anyway obstructing authorised behaviour in the system and normal internal systembehaviour. Security mechanisms thus implement the security policies.
An important perspective to remember in this context is that it is possible toemploy and su¢ ciently maintain the strongest available protective security mech-anisms against the outsiders (unauthorised entities of the system) and still endup with a weak system due to the lack of proper protection against insiders (au-thorised entities) and lack of fail-secure and fail-safe mechanism to protect thesystem from committing suicide. There is also the perspective of insiders andoutsiders working together to break the security mechanism of an informationsystem.
There are many reasons why information systems are not secure. One major rea-son is the complexity of today�s information systems and the need for continuousmaintenance, which means that all systems need at least one system adminis-trator with a username and password to perform every action possible on theinformation system. This raises the issue of a healthy delegation of responsibilitywith a clear de�nition of the roles involved. For such separation of concerns towork it must be properly maintained and revised regularly and employed in such away that it does not introduce new vulnerabilities. This calls for the use of proper

38 5. Risk Assessment and Management of Information Systems
risk control. Risk management and risk assessment are techniques that can beused to identify, monitor and control the risk level of an information system.
There are several principles about how risk assessment can be performed. Thesecan be roughly classi�ed into three main types: rule based, risk based (probabilis-tic) and judgment based (expert judgment). Rule based risk assessment covers allapproaches where an assessor or evaluator checks a system against a set of crite-ria or guidelines given by standards and/or checklists. These criteria or checkliststhus represent rules that a system should comply with. Hence, these criteria orguidelines are considered �best practice�and by following these rules the systemis su¢ ciently protected. This imply that the potential risks in a system are knownand rarely change.
Probabilistic risk assessment targets both known and unknown undesired events(risks) and focuses on identifying and assessing the probability of these events.However, it is important to distinguish between the frequentist (classical or �ob-jective�) and the Bayesian interpretation of probability [105, 16, 31, 32]. In classi-cal interpretations it is assumed that there exists a true value P which denotes theprobability of the occurrence of a given event A. The true value P is unknownand needs to be estimated. The classical interpretations only allow the use ofempirical data from actual use of the system or similar systems to estimate P .Hence, estimation cannot be done based on any subjective data (also called in-terpreted data) as this is considered to be uncertain data. The uncertainty inclassic interpretation is related to how close the calculated value of P , called P 0,is to the true value of P .
The perspective of uncertainty is understood di¤erently in subjective interpreta-tion. Here the data sources express their subjective uncertainty regarding futureobservable events. The probability in this case expresses the expert�s or subject�suncertainty for P and thus there is no meaning in talking about the uncertainty ofthe probability itself [31, 32]. The latter is called judgment based risk assessmentor subjective expert judgment.
Subjectivity is not a new subject in risk assessment and management. It hasbeen discussed within the reliability domain since the 1970s [31, 32]. There havealso been activities on the area of aggregating subjective expert judgment, suchas guidelines and questionnaires for collecting relevant information from experts[17, 79]. It is this subjective interpretation of probability that this work makesuse of in the trust-based information aggregation schema described in Part 5.Details on subjective expert judgment are given in Chapter 7.

5.1 Security (risk) assessment 39
5.1 Security (risk) assessment
Risk assessment is often referred to as risk analysis. However, this work dis-tinguish between the two terms and understands risk analysis as referring tothe analysis of consequence and frequency of a potential threat or undesiredevent/behaviour. Risk assessment is seen as referring to the whole process of iden-tifying, analysis, evaluating and treating risks. The reader should note howeverthat risk assessment is di¤erent from risk management in that risk managementrefers to monitoring, communicating, consulting and controlling that the resultsof a risk assessment is employed and maintained in practice. Risk assessment isa one-time activity while risk management is a continuous activity and involvesseveral risk assessments. When risk assessment is used to assess security criticalsystems or examine the security level of a system it is often referred to as se-curity risk assessment or simply security assessment. Similarly, risk managementis often called security management whenever used for managing results fromsecurity assessments.
The purpose of any risk assessment is to identify potential threats or undesiredevents/behaviour and assess their degree of criticality to the system. Hence, se-curity assessment provides relevant and necessary information to support deci-sion makers in choosing a security solution, meaning a solution to the securitythreats posed upon an information system by reducing or removing the criticalitythat these represent. Decision makers can also use these results when prioritis-ing di¤erent sets of solutions, also called countermeasures, into an e¤ective andcost-friendly overall security strategy.
The intention of security (risk) assessment is not to obtain a completely securesystem but rather to ensure the employment and maintenance of a correct orrather an acceptable level of security. Assessment activities also contribute toincreased knowledge and insight into the system and the dependencies and inter-relations between the system and its environment. This is an important issue ina security solution decision-making context but also motivates and increases theawareness of the importance of systematic security follow-ups.
5.1.1 Performing security assessment
Performing security assessment is a multidisciplinary task. The process requiresknowledge of the technical and operational perspectives of an information sys-tem and on the circumstances that may result in undesired system behaviour.Experts in the area of performing security assessment are also required, that isexperts with knowledge of the assessment techniques and methods and the math-ematical/statistical concepts needed for carrying out the tasks involved. Due to

40 5. Risk Assessment and Management of Information Systems
the increased complexity of information systems and the inherent problem withaccidental complexity and poor user interfaces there is also a need for experts inthe area of behaviour and organisational perspectives, that is experts that haveknowledge of human reactions and work capacity under stress.
Some kind of a model of the information system is often used to direct the assess-ment activities. A model in this context refers to a representation of the infor-mation system at some level of abstraction. Such a model can be either graphicalor mathematical. However, establishing a mathematical description is necessaryif the intention is to perform calculations of the input data at some point duringthe assessment. This does not mean that security assessments performed with-out extensive use of models or with inaccurate models is useless and provide nouseful results. The result from a security assessment is not only dependent onthe model but also on the composition of the assessment team and the informa-tion sources used to evaluate or estimate the involved variables. What should benoted though is that the results from a security assessment performed based on aparticular model are no more accurate than the model itself. Additionally, whensecurity assessment is used as an integrated part of the development, such as inthe CORAS approach, the result is also a¤ected by the degree to which the actualimplementation of the system relates to the models that the security assessmentwas performed on. If the system is not implemented as described by the models,the security assessment results might be of little or no relevance.
There are many ways to perform a security assessment but most security assess-ment processes goes through the three phases: planning, execution and use. Ageneral description of these three phases is given below, this is taken from Aven(1992) [5]:
1. Planning
� Objectives� System de�nition
� Time planning
2. Execution
� System description
� De�nition of system failure
� Assumptions� Causal Analysis� Data collection and analysis� Presentation of results

5.2 AS/NZS 4360:2004 Risk Management 41
3. Use
� Reliability evaluation� Decisions
The planning phase deals with the preparatory activities that are important fora successful result of a security assessment. This phase is used to de�ne whatthe assessment will include and what is out of scope, the goal with the securityassessment and a plan for the use of the results from the assessment. Activitiesinvolved in this phase are: identify the objectives of the assessment, de�ne thescope of the assessment and creating plans for who does what at which time anda description of the expertise needed for each of the involved tasks.
The execution phase deals with the actual execution of the security assessment.This means actively using the plans made during the planning phase to directthe tasks of the security assessment. At this point in a security assessment it isimportant to keep in mind the objectives and scope of the security assessment.The phase starts by creating a clear and unambiguous description of the systembeing analysed and by linking this description to the objectives and scope of thesecurity assessment as de�ned in the planning phase. The next activity concernsthe de�nition of types of system failures, which means providing a rough descrip-tion of the expected normal and potential abnormal behaviour of the informationsystem. Then the assumptions associated with the assessment need to be unam-biguously described. This includes among other things to describe the possibleinterpretation of the security threat to make sure that all involved stakeholdersunderstand and agree on the circumstances for interpreting the assessment re-sults. The phase ends by carrying out the analysis tasks, collecting the resultsand formulating the results so that they can be presented to the target audience.
The use phase deals with the application of the results from the execution phaseand on how these results can be used to support and direct the decisions thatneed to be made. This involves qualitative or quantitative evaluation of potentialsecurity solutions to the identi�ed security risks, identifying a treatment plan,allocating resources, etc.
5.2 The Australian/New Zealand Standard for RiskManagement
The Australian/New Zealand Standard for Risk Management AS/NZS 4360:2004[4] provides a generic framework for the process of managing risks. The standarddivides the elements of the risk management process into seven sub-processes

42 5. Risk Assessment and Management of Information Systems
ESTABLISH THE CONTEXT
§§The external context§The risk management context§Develop criteria§Decide the structure
CO
MM
UN
ICA
TE A
ND
CO
NSU
LT
MO
NIT
OR
AN
D R
EVIE
W
yes
EVALUATE RISKS§Compare against criteria§Set risk priorities
TREAT RISKS§Identify options§Assess options§Prepare and implement
§Analyse and evaluateresidual risk
Treat Risks
Determinelikelihood
Determineconsequence
Determine level of risk
ANALYSE RISKS
no
Identify existing controls
The internal context
IDENTIFY RISK•What can happen?•When and where?•How and why?
treatment plan
Fig. 5.1. AS/NZS 4360:2004 Risk management process
where �ve are sequential and related to risk assessment activities and two are inparallel with the other �ve and cover the risk management part of the process.An overview of the process is given in Figure 5.1.
As for the general security assessment process outlined in the previous section the�rst sub-process of AS/NZS is used to de�ne the context for the assessment. Thissub-process also deals with establishing the criteria for what constitute acceptableand unacceptable risk. This is called de�ning the risk acceptance criteria.

5.2 AS/NZS 4360:2004 Risk Management 43
During the second sub-process the potential threats, vulnerabilities and theirassociated impacts are identi�ed. The results from sub-process 2 are then analysedand evaluated in two subsequent sub-processes. The �fth and last sub-process inthe risk assessment part of the process deals with identifying and evaluatingpotential treatments to the identi�ed risks. The two parallel sub-processes coverthe risk management perspective of the process and focus on the communicatingand consultation with the involved stakeholders, such as the decision maker andthe monitoring and reviewing of the execution and results of each of the riskassessment sub-processes. The following gives a brief description of the activitiesinvolved in each sub-process.
Establish the context
The activities of the �rst sub-process of the risk assessment part of the AS/NZS4360 risk management process focuses on the context that the organisation op-erates in. The sub-process is divided into �ve activities:
Establish the external context focuses on de�ning the external environment inwhich the organisation operation. This includes among other thinfs a speci�cationof the organisation�s strengths and weaknesses, key business drivers and externalstakeholders.
Establish the internal context aims at understanding the organisation and its ca-pabilities, including its culture, business goals, objectives, structure and strate-gies.
Establish the risk management context involves describing the goals, objectives,strategies, scope and parameters involved in a directed and proper identi�cation,analysis, evaluation, treatment and management of the potential risks.
Develop risk evaluation criteria involves establishing a clear de�nition of whatconstitute acceptable risk and what constitute unacceptable risk in terms of ac-ceptance criteria. The important factor to note in this context is that acceptablerisk will not be treated and hence the de�nition of the risk evaluation criteriashould be executed with care. The criteria may be a¤ected by legal requirements,the perceptions of external and internal stakeholders or by organisational policies.
De�ne the structure deals with dividing the assessment and management activi-ties into sets of elements that allow a structured and logical way of assessing andmanaging the risks.
Risk identi�cation
The second sub-process of the risk assessment part of the AS/NZS 4360 riskmanagement process identi�es the risks that need to be managed. Systematicmethods for risk identi�cation, such as HazOp, FTA, FME(C)A, Markov analysisand CRAMM, should be applied at this stage. Proper execution of the identi�-

44 5. Risk Assessment and Management of Information Systems
cation of risks is a critical success factor to the success of the risk assessment andmanagement as potential risks that are not identi�ed at this stage are excludedfrom further analysis. The process is divided into two activities:
What can happen, where and when identi�es the potential threats, vulnerabilitiesand subsequent unwanted incidents arising from these.
Why and how can it happen is directed towards identifying the possible causesinitiating the identi�ed threats and describing scenarios to demonstrate how thethreat can be materialised.
Risk analysis
Based on information from sub-processes 1 and 2 the impacts and likelihoodof all identi�ed threats are assessed. The objective of sub-process 3 of the riskassessment part of the AS/NZS 4360 risk management process is thus to derivethe risk level of each risk identi�ed during risk identi�cation. This is necessaryin order to separate the acceptable risks from the risks requiring treatment. Riskis analysed by combining estimates of the consequence and the likelihood of theidenti�ed threats in the context of existing control measures. The analysis canbe either qualitative or quantitative depending on the amount and type of dataavailable. Qualitative analysis uses descriptive scales to describe the magnitudeof potential consequences and the likelihood that those consequences will occurwhile quantitative analysis uses numerical values for both measures. The sub-process is divided into the following activities:
Evaluate existing controls looks into which security mechanisms that are alreadyin place in the system and the relevant system environment. This involves iden-tifying the existing management strategies both in terms of technical solutionsand procedures.
Determine consequence and likelihood is the activity where the qualitative orquantitative analysis of consequence and likelihood of the identi�ed threats isperformed.
Estimate level of risk takes the likelihood and consequence from previous activityand estimates the risk level. The risk level can be expressed both qualitatively andquantitatively depending on the output from the previous activity. This meansthat if the consequence and likelihood from the prevision activity is expressed asqualitative values the risk level is expressed as a qualitative value and visa versa.
Risk evaluation
In sub-process 4 of the risk assessment part of the AS/NZS 4360 risk manage-ment process the risks are evaluated by comparing the risk level with the riskevaluation criteria established in the �rst sub-process. Based on the results ofthe evaluation it is decided whether a risk is perceived as acceptable or not. The

5.2 AS/NZS 4360:2004 Risk Management 45
risks identi�ed to be in need of treatment are then assigned a treatment priority.From this stage on the risks considered to be acceptable are no longer parts ofthe assessment. Nevertheless, these risks should be monitored to ensure that theyremain acceptable.
Risk treatment
The last sub-process in the risk assessment part of the AS/NZS 4360 risk manage-ment process concerns the treatment of the risks. In this sub-process the focusis on �nding alternative treatment solutions to the risks in need of treatment,meaning the risks identi�ed as not acceptable in the previous sub-process. Thereare generally four main treatment strategies [4]: (1) Avoid the risk. (2) Transferthe parts of or the complete risk to a third party. (3) Reduce the likelihood ofthe risk. (4) Reduce the consequence of the risk.
Determining which treatment strategy to choose and the �nancial and securityimpact of this strategy is derived through a series of treatment activities. Treat-ment activities speci�ed in ANS/NZS 4360 are the following:
Identify treatment options include the identi�cation of the treatment strategyand the identi�cation of alternative treatment options within the boundaries ofthe treatment strategy. Note that treatment options are identi�ed and evaluatedboth for risks with negative impact and for risks with positive impact
Assess treatment options evaluates and compares the bene�ts of implementing aparticular treatment option from the set of alternative treatment opinions iden-ti�ed in the previous activity with the cost of employing the treatment option inthe system. This activity also recommends a treatment option or usually a set oftreatment options by taking both the �nancial and the risk acceptance criteriainto consideration. The general rule given is to choose treatment option(s) so thatthe risk is made as low as reasonably practicable (ALARP).
Prepare and implement treatment plans looks at the results from the previous ac-tivity and develops a plan for how to prepare and implement the treatment optionin the system and/or the system environment. This activity includes resource al-location, distribution of reponsibilities, performance measures and reporting andmonitoring requirements.
Monitoring and Review
The monitoring and review sub-process is one of the two risk management sub-processes speci�ed in AS/NZS 4360. In this sub-process stakeholders involvedin managing the risks monitor and review the execution of the treatment im-plementation plan. The sub-process runs in parallel with the �ve risk assessmentsub-processes and monitors and reviews the results from all risk assessment activ-ities as well as ensuring that continuous attention is given to the system and that

46 5. Risk Assessment and Management of Information Systems
there is protection of the system against potential risks. Risk management worksbest if strategies for managing risks and for monitoring the practical implicationsof the risk management strategy are clearly described. For a treatment imple-mentation plan to remain relevant the plans need to be reviewed and updatedregularly.
Communication and Consultation
Communication and consultation is the second risk management speci�c sub-process included in the AS/NZS 4360 risk management process. As discussedearlier the success of any risk assessment or management plan and activity ishighly dependent on the ability of the involved stakeholders, experts, users andother interested parties ability to communicate. This is also crucial in risk man-agement. If the managers and the people developing the system and employing thetreatment options do not communicate and consult to a su¢ cient level through-out the life-cycle of a system the ability of the management strategy to succeed inits mission is dramatically reduced. Being in interaction, being in control, havinga proper overview of the implications of all actions, etc. is not just importantin risk management, it is a necessity. The communication perspective is also im-portant in relation to the potential consumers in order to establish and maintainmutual respect and con�dence. Also, a continuous improvement of the risk man-agement plans and strategies require proper communication and consultation toensure that the risk management plan remains relevant for those involved andnot only for the managers.
5.3 CCTA risk analysis and management methodology(CRAMM)
CCTA Risk Analysis and Management Methodology (CRAMM) [8] is developedby the British Government�s Central Computer and Telecommunications Agency(CCTA) as a recommended standard for risk analysis of information systemswithin healthcare establishments in the UK. This approach incorporates perspec-tives taken in �nance risk management approaches and are tailored for assessingrisks to medical and health related IT system. However, due to the structured andgeneral process adapted the approach also represents a general, structured andconsistent approach to computer security management of all types of informationsystems. CRAMM is also used as the basis for many risk assessment and man-agement methodologies and frameworks, such as the CORAS framework, and isthe �rst risk assessment methodology that successfully and in large-scale adaptedan asset-centric perspective on risk assessment.

5.4 The CORAS approach 47
The �rst version of CRAMM was issued as a set of paper-based forms. LaterCRAMM was supported by software tools and now it is fully computerised.CRAMM consists of three stages: (1) Asset identi�cation and valuation. (2) As-sessment of threats, which is similar to the identi�cation and analysis of risksactivities in the AS/NZS 4360 risk management process. (3) Assess vulnerabili-ties and suggests countermeasures.
CRAMM has 10 prede�ned asset tables to support the identi�cation and valua-tion of assets. Furthermore, the asset tables are structured into asset categoriesthat are linked to lists of known vulnerabilities and threats for each asset cate-gory. The CRAMM software tool lists these to you automatically based on theresult of the asset identi�cation and valuation in stage 1 of CRAMM.
Furthermore, there are also sets of associated countermeasures to each of thethreats and vulnerabilities stored in respective repositories in CRAMM. TheCRAMM software tool also suggests countermeasures automatically based oninformation such as the set of assets identi�ed, the values assigned to these as-sets and the identi�ed threats and vulnerabilities. However, there is a prede�nedbalance between physical, personnel, procedural and technical countermeasuresthat is tailored for medical systems within the CRAMM software tool. This makesthe latter feature less valuable to other types of information systems. To makeCRAMM e¤ective for other types of information systems all decisions made mustbe recorded and reviewed and the associated repositories updated to re�ect thee¤ects of these decisions. Hence, the software tool needs to learn from experience.
The CORAS approach makes use of the asset-driven approach of CRAMM andhas adopted the asset valuation technique of CRAMM. More details on theCORAS approach is given in the following.
5.4 The CORAS approach to assessing and managingsecurity risks
IST-2000-25031 CORAS: A platform for risk analysis of security critical sys-tems [19] was a Fifth Framework European Commission IST-project that ranfrom 2000-2003. The aim of the CORAS project was to develop a frameworkfor model-based risk assessment of security critical systems. The main resultfrom the CORAS project is the methodology for model-based risk assessmentthat has four supporting pillars: (1) The risk documentation framework based onRM-ODP. (2) The risk management process based on the AS/NZS4360 risk man-agement process. (3) The integrated risk management and system developmentprocess based on the Uni�ed Process (UP). (4) The platform for tool inclusion

48 5. Risk Assessment and Management of Information Systems
Systemdevelopment
andmaintenance
process
Systemdocumentation
framework
Riskmanagementprocess
Platform for toolinclusion based on
data integration
Modelbasedrisk management
RMODP
XML
AS/NZS 4360RUP
Systemdevelopment
andmaintenance
process
Systemdocumentation
framework
Riskmanagementprocess
Platform for toolinclusion based on
data integration
Modelbasedrisk management
RMODP
XML
AS/NZS 4360RUP
Fig. 5.2. The �ve main components of the CORAS framework
based on data-integration using XML. However, the main bene�ts of the CORASapproach is the tailoring of a set of risk assessment methods from the safety do-main for the security domain, as well as the focus on integrating risk managementinto the system development process. The latter ensures that risks are handledthroughout the development process at the right time and for the correct cost.Figure 5.2 gives an overview of the CORAS framework [97].
The CORAS framework is model-based in the sense that it gives detailed recom-mendations for modelling both the system and the risks and treatments identi-�ed during the security (risk) assessment using the Uni�ed Modeling Language(UML). This means that the CORAS framework provides support, guidelines andUML modelling elements which extend the value of both system developmentand risk assessment activities in three dimensions [97]: (1) To improve precisionof descriptions of the target system. (2) As a media for communication betweenstakeholders involved in a risk assessment. (3) To document risk assessment re-sults and the assumptions on which these results depend. Details are in Stølen etal. (2002) [97].
Also, the risk assessment methodology in CORAS integrates techniques frompartly complementary risk assessment methods. These include HazOp, FTA,

5.4 The CORAS approach 49
FMECA, Markov analysis and CRAMM. Like CRAMM the CORAS method-ology is asset-driven, which means that the identi�cation of assets is the drivingtask in the risk assessment process. Actually, if no assets are identi�ed there isno need to carry out the risk assessment.
5.4.1 CORAS risk management process
The CORAS risk management process is based on the AS/NZS 4360:1999 riskmanagement process and the recommendations in ISO/IEC 17799-1:1999 [55].The underlying terminology of the CORAS risk management process is supportedby the two standards: ISO/IEC TR 13335-1 [54] and IEC 61508:1998 Functionalsafety of electical/elect-ronic/progammable electronic safety-related systems [51]. As for AS/NZS 4360the CORAS risk management process consists of seven sub-processes where �veare sequential risk assessment related sub-processes and two are parallel risk man-agement related sub-processes. In order to adapt the standard for use in the secu-rity domain CORAS decomposed the �ve sequential sub-processes into activitiesas shown in the activity list below. For each sub-process the CORAS methodol-ogy provides guidelines with respect to which models should be constructed andhow these models should be expressed to support the risk assessment activities.
The main di¤erence from the AS/NZS 4360 risk management process is thatthe CORAS risk management process has a stronger focus on assets and thattheir process is asset-driven. The risk management process is therefore extendedby relevant activities for asset identi�cation and valuation. As for CRAMM theidenti�cation and valuation of assets guides the risk assessment process. Moredetails are in Stølen et al. (2002) [97] and the other publications from the project.Please see [19] for details.

50 5. Risk Assessment and Management of Information Systems
Sub-process 1: Identify Context
� Activity 1.1: Identify areas of relevance� Activity 1.2: Identify and value assets� Activity 1.3: Identify policies and evaluation criteria� Activity 1.4: Approval
Sub-process 2: Identify Risks
� Activity 2.1: Identify threats to assets� Activity 2.2: Identify vulnerabilities of assets� Activity 2.3: Document unwanted incidents
Sub-process 3: Analyse Risks
� Activity 3.1: Consequence evaluation� Activity 3.2: Frequency evaluation
Sub-process 4: Risk Evaluation
� Activity 4.1: Determine level of risk� Activity 4.2: Prioritise risks� Activity 4.3: Categorise risks� Activity 4.4: Determine interrelationships among risk themes� Activity 4.5: Prioritise the resulting risk themes and risks
Sub-process 5: Risk Treatment
� Activity 5.1: Identify treatment options� Activity 5.2: Assess alternative treatment approaches

6. Towards Quantitative Measure of OperationalSecurity
The fact that most security evaluation and assurance approaches are qualitative,subjective and resource demanding and the need for easily accessible techniquesthat provide comparability between security solutions has raised the need fortechniques with the ability to quantify security attributes of information sys-tems. This relates both to security requirements in Quality of Service (QoS)architectures and as input to design and architecture trade-o¤ analysis to sup-port the choice of security solutions such as security mechanisms to comply withan established security policy.
Early research in this area focused on state transition models such as Markovor semi-Markov models. In the dependability domain these techniques are usedto measure values such as mean time between failures (MTBF) and to quantifyfrequency and consequence of undesired events. However, the dynamic nature ofsecurity attacks makes these models intractable due to the problems with stateexplosions. To express the complete state space involved in a security solutiondecision situation for an information system it is necessary to consider not onlyhardware, operating system and application/services fault but also the surviv-ability of the system in terms of withstanding intentional and accidental securityattacks.
In Littlewood et al. (1993) [74] the �rst step towards operational measures ofcomputer security is discussed. The authors point to the lack of quantitativemeasures available to determine the security level of a system under operation,called operational security, and suggest a model that relates security assessmentto traditional probability theory. Note that operational security relates to theToE working in the operational environment in a Common Criteria context. Themain idea is to reuse the knowledge and methods from the reliability domain andtailor these for the security domain. This requires re�ning the concepts involved,as well as a rede�nition of the input space and usage environment. The maindi¤erence between the security and the reliability domain is that the input spacenot only covers system internal inputs but also external inputs, such as thosecoming from intentional attacks to security critical information systems. The

52 6. Towards Quantitative Measure of Operational Security
same applies to the usage environment where the population of attackers andtheir behaviour comes in addition to normal system operation. The operationalmeasures of security discussed in the paper are the e¤orts and time that theattacker need to invest to perform a security attack in terms of Mean E¤ort toSecurity Failure and Mean Time to Security Failure .
In Ortalo et al. (1999) [80] the authors discuss a quantitative model to measureknown Unix security vulnerabilities using a privilege graph. The privilege graphis transformed into a Markov chain based on the assumption that the probabilityof a successful attack given an elementary attack and the associated amount of ef-fort e spent is exponentially distributed. The e¤ort e is expressed as P (e) = 1��
e
where 1=� is the mean e¤ort to successful elementary security attack. Further-more, the model allows for the evaluation of operational security as proposed in[74].
In Jonsson and Olovsson (1997) [62] the authors present and discuss a quan-titative analysis of attacker behaviour based on empirical data collected fromintrusion experiments using undergraduate students at Chalmers University inSweden. The results of the experiment indicated that typical attacker behaviouris comprised of three phases: the learning phase, the standard attack phase andthe innovative attack phase. The authors also found that the probability for suc-cessful attacks is small during the learning and innovative phases while the prob-ability is considerably higher during the standard attack phase. For the standardattack phase the probability for successful attacks was found to be exponentiallydistributed.
In Madan et al. (2000) [75] the authors demonstrate an approach for quantifyingsecurity attributes of software systems using stochastic modelling and Markovtheory. In this paper the authors consider security to be a QoS attribute andinterpret security as preserving the con�dentiality and integrity of data and theavoidance of denial of service attacks. The authors model the combination ofattacker behaviour and the response from the system to the attack as a randomprocess using stochastic modelling techniques. The stochastic model is used toanalyse and quantify the security attributes of the system, such as the MeanE¤ort to Security Failure and Mean Time to Security Failure as �rst introducedin [74]. The authors argue that qualitative evaluation of security is no longeracceptable and that it is necessary to quantify security in order to meet contractedlevels of security. Furthermore, the authors compare intrusion tolerance withfault tolerance and pinpoints that it can be assumed that once a system hasbeen subjected to a security attack an intrusion tolerant system responds to thissecurity threat in a manner similar to the actions initiated by a fault tolerantsystem. Such situations can be modelled using the stochastic modelling techniques

6. Towards Quantitative Measure of Operational Security 53
Markov chains and semi-Markov processes. However, the authors did not look intothe problem of state explosion and how to handle this issue in practice.
In Wang et al. (2003) [104] the state transition approach described in [75] isextended. The paper points to the weakness of Markov models by discussingthe di¢ culty of capturing details of real architectures in a manually constructedMarkov model. The authors advocate the use of higher level formalism and makeuse of Stochastic Petri Nets (SPN) to model the behaviour of an intrusion tolerantsystem for quantifying security attributes. The SPN model is then parameterisedand transferred into a continuous-time Markov chain. This model contains thebehaviour of two main entities: the attacker behaviour and the response from thesystem to an attack. As in [75] security is considered a QoS attribute. The modelalso handles simultaneously co-existence of several vulnerabilities in a system.The example system used to demonstrate the approach both in [104] and [75] isthe SITAR intrusion tolerance system.
In Singh et al. (2003) [92] the authors describe an approach for probabilisticvalidation of an intrusion-tolerant system. Here, the authors use a hierarchicalstochastic activity net (SAN) model to validate intrusion tolerant systems andto evaluate the merits of several security design choices. The proposed model iscomposed of sub-models of management algorithms, replicas and hosts where thehosts are structured into application domains of di¤erent sizes. The managementsub-model controls the initiation of new replicas and the removal of host andeven whole domains. Issues discussed in the paper are the number of hosts thatcan be handled by a domain and how to manage a corrupted host. The intrusion-tolerant system includes an intrusion detection system (IDS) to detect corruptedhosts. However, as for IDS intrusion-tolerant systems are subject to the problemof false positives.
The above described work represents state of the art in quantifying operationalsecurity. The AORDD security solution trade-o¤ analysis bene�ts from thesepieces of work and have incorporated the notion of operational security levelboth in the structure and in the set of variables in the trade-o¤ analysis andassociated trade-o¤ tool. Details are in Part 4.

7. Subjective Expert Judgment
Uncertainty is what is removed by becoming certain and certainty is achievedthrough a series of consistent observations. In subjective interpretation of prob-ability uncertainty expresses the degree of belief of a particular subject. For ex-ample, expert i believes that the number of DoS attacks per month for a .NETe-commerce system is between 2 and 20 and the most likely around 10. To fur-ther specify the uncertainty con�dence intervals and �ner granulated uncertaintyfunctions can be used. However, this is only allowed in the Bayesian interpreta-tion of probability and not in the truly subjective interpretation, which is usedin this work.
Probability becomes purely subjective when a true value does not exist (it has notyet or cannot be observed directly). In such cases the focus is put on observablevalues that are unknown at the time of the assessment but that can be observedsome time in the future. The future observable values are expressed as the sub-jective estimate of what the expert thinks will be the outcome. This does notrefer to the actual value and is rather an expression of how uncertain the expertis about what will be the actually outcome. Note that the expert provides his orher opinion based on his or hers set of relevant experience, knowledge and rec-ommendations provided by one or more external sources that the expert trusts.How to measure trust and how to aggregate these three categories of informationin the context of this work is discussed in Part 5 and demonstrated in Part 6 ofthis thesis.
An expert�s uncertainty is described by a subjective probability distribution foruncertain quantities with values in a continuous range. The Triangular distribu-tion is the most commonly used distribution for modelling expert opinions [102].This is de�ned by its minimum value (a), most likely value (b) and maximumvalue (c). Ideally, any probability distribution should be available to the expertswhen expressing their belief. However, experience has shown that simple proba-bility distributions are more tractable and even more importantly understandablefor the experts. The latter is important as it has been observed that poor perfor-

56 7. Subjective Expert Judgment
1. System OK 2. System Degraded 3. System NOT OK1. System OK 2. System Degraded 3. System NOT OK
Fig. 7.1. Example case description using a state transition diagram
mances by experts are often not due to lack of expertise but rather to the lack oftraining in subjective probability assessment [38, 17].
When expert judgments are cast in the shape of distributions of uncertain quan-tities the issue of conditional dependence is important. Quanti�ed uncertainty inan uncertainty analysis is always conditional upon something and it is essentialto make clear the conditional background information. This is the role of thecase structure, which describes the areas of interest or problem that the expertsare to assess. The case structure both describes the problem in question and isused to derive the questionnaire for the elicitation variables in subjective expertjudgments. These variables are essential in the expert opinion aggregation anddiscussed, along with the questionnaire, further in Section 7.1.
Gossens et al. (2000) [38], Cooke and Gossens (2000) [17] and Øien and Hokstad(1998) [79] describe the procedure guides for structured expert judgment elicita-tion. The main structure of such procedures is usually a variant of the followingthree steps: (1) Preparation for elicitation, which includes identifying and select-ing experts and describe the area of interest. (2) Elicitation, which is the actualcollection of expert judgments. (3) Post-elicitation, which includes among otherthings the aggregation and analysis of expert opinions. In the following a briefexample of the techniques for the three steps is given. Further details and speci�cexpert elicitation techniques can be found in the above references.
Figure 7.1 shows an example case description. Here, the problem to that theexperts shall assess (area of interest) is modelled in terms of three states expressedin a state transition diagram. The three states are: (1) System OK, (2) Systemdegraded and (3) System NOT OK. State 1 denotes all situations where thesystem is operating according to speci�cations. State 2; system degraded, includesall situations where the system is under attack and is usually modelled more �nelygranulated. State 3 models the situation of a successful attack, meaning that thesystem has been compromised.
Example of information of interest for this case description is the probability of asystem to be in the degraded and NOT OK state; states 2 and 3 respectively. TheTriang(a,b,c) distribution is used to elicit expert judgments and the questionnairederived from the case description are:

7. Subjective Expert Judgment 57
Probability of being in state 1
a. What is the minimum probability that the system is in state 1?
b. What is the most likely probability that the system is in state 1?
c. What is the maximum probability that the system is in state 1?
Probability of being in state 2
a. What is the minimum probability that the system is in state 2?
b. What is the most likely probability that the system is in state 2?
c. What is the maximum probability that the system is in state 2?
Probability of being in state 3
a. What is the minimum probability that the system is in state 3?
b. What is the most likely probability that the system is in state 3?
c. What is the maximum probability that the system is in state 3?
Expert elicitation targeting estimation of the cost associated with the di¤erentstates would give the following questionnaire:
Cost related to state 1
a. What is the minimum cost of being in state 1?
b. What is the most likely cost of being in state 1?
c. What is the maximum cost of being in state 1?
Cost related to state 2
a. What is the minimum cost of being in state 2?
b. What is the most likely cost of being in state 2?
c. What is the maximum cost of being in state 2?
Cost related to state 3
a. What is the minimum cost of being in state 3?
b. What is the most likely cost of being in state 3?
c. What is the maximum cost of being in state 3?

58 7. Subjective Expert Judgment
Table 7.1. Answer table for Question 1 in the questionnaire for Expert i
Question 1
Expert i Triang(a,b,c) x f(x)
Min (a)
Most likely (b)
Max (c)
Both the questionnaire for probability and cost elicitation can be tailored toa particular undesired event called misuse in this work or security mechanismor control called security solution in this work. This makes it possible to aidthe choice of security solution for a particular con�guration of the informationsystem, called ToE in the Common Criteria, and provides information that canbe used to support the choice of security solution. The latter is the objective ofthis work and have been materialised in the AORDD security solution trade-o¤analysis and trade-o¤ tool described in Part 4. Details of decision-support for thechoice of security solution is given in Parts 3 and 4 of this work, Houmb et al.(2005) [44] enclosed as Appendix B.3 and Houmb et al. (2006) [48] enclosed asAppendix B.2.
The Triang distribution is given as Triang(a,b,c) where a=minimum, b=mostlikely and c=maximum, with the probability density function f(x) = 2(x�a)
(b�a)(c�a) inthe interval [a; c]. Table 7.1 shows an example answer table for Question number 1in the above questionnaire for Expert number i. In expert elicitation such a tableis �lled out for each combination of question and expert and the probabilitydensity function (pdf) is calculated to derive the shape of the distribution.
Figure 7.2 shows an example Triang(a,b,c) distribution for Question 1 in thequestionnaire for three experts. As can be seen in this �gure the result from theexpert elicitation is widely distributed and there seems to be little consensusbetween the experts. Some common reasons for such situations is that the areaof interest are new and little explored, that one or more of the experts do nothave a su¢ cient amount of relevant knowledge and experience in the area orthat one or more of the experts did not understand the statistical implications oftheir answers. The last can be treated by adding feedback meetings to the expertelicitation process. In these meetings the risk analyst interprets the contextualmeaning of the answers from all the experts and gives each expert feedback onthe contextual implications of his or her opinions. The risk analyst also oftenpresents an overview of the answers given by all involved experts. Then, basedon the feedback given and the overview of information provided by the other

7. Subjective Expert Judgment 59
Fig. 7.2. Example of Triang(a,b,c) distribution for three experts
involved experts each expert is given the ability to adjust their answers such thatit better re�ects their actual belief.
The example in Figure 7.2 shows that it is of vital importance to calibrate the ex-perts in expert elicitation. This is done using empirical control, such as that incor-porated in rational consensus described by Cooke and Goossens (2000) [17]. Whenperforming empirical control it is important to re�ect on the concept of when aproblem is actually an expert judgment problem. Expert judgments should notbe used for problems that are physically measurable or for problems that have noanswers, such as meta-physical problems. A problem is suited for expert judgmentif there is relevant scienti�c expertise. This entails the existence of theories andmeasurements relevant to the area of interest but where the quantities themselvescannot be measured in practice.
For an expert judgment problem there will usually be relevant experiments that inprinciple can be used to enable empirical control. However, such experiments willmost often not be performed because of lack of resources or strict time constraints.This does not mean that information cannot be elicited, just that it is too costlyand time demanding to perform the experiments. In such cases empirical controlis achieved based on prior relevant experience where the analyst reasons about thesoundness of the results from the expert elicitation by comparing the experts witheach other taking their knowledge and experience into mind and by comparing theresults with whatever observable information that is available. Empirical controlcan also be obtained by looking into the degree of consensus of the informationelicited from the sets of experts involved. If the consensus is low a new expertelicitation should be performed. Additionally, empirical control can be executedusing robustness and discrepancy analysis on the expert elicitation results asdescribed in Goossens, Cooke and Kraan (1998) [37].

60 7. Subjective Expert Judgment
There are three additional factors that must be taken care of during elicitation ofexpert judgment and these are scrutability, neutrality and fairness. Scrutabilityor accountability is of great importance and means that all data including detailsof the experts and the tools used must be open to peer review and that the re-sults must be reproducible by competent reviewers. Neutrality is also important.This means that all elicitation and evaluation methods must be constructed suchthat they encourage experts to state their true opinions. Underestimation andoverestimation should be taken into account in relation to neutrality. Underesti-mation means that the expert has little con�dence in his or her experience andknowledge and consequently gives pessimistic information. Overestimation is theopposite and means that the expert has great con�dence in his or her expertiseand knowledge and consequently provides optimistic information. Additionally,there is the issue of disregarding known and important information when assess-ing the problem area as discussed in Kirkebøen (1999) [71]. Fairness means thatexperts should not be prejudged prior to processing the results of their assess-ment.
7.1 Aggregation techniques for combining expert opinions
After the elicitation of expert judgment the results are examined in order todecide on a suitable expert judgment aggregation technique. This is step 3 inthe structured expert judgment elicitation described above. This decision canbe aided by the use of robustness and discrepancy analysis as shown in Figure7.3. Robustness and discrepancy analysis is performed to assess the robustness ofthe combined result from the expert judgment, to examine the consensus amongthe experts and to examine whether some of the expert opinions are of greaterimportance than others
Robustness and discrepancy analysis can be done on both the expert judgmentand on the calibration variables. Such an analysis is performed by removing ex-pert judgments or calibration variables from the data set one at the time andthen recalculate the result to account for the relative information loss that theinformation removal has on the original result. Calibration variables in subjec-tive expert judgments are the variables that are used to derive the appropriateexpert opinion weighting scheme. These variables serve a threefold purpose inexpert elicitation (modi�ed from Goossens, Cooke and Kraan (1998) [37]): (1) Toquantify experts�performance as subjective assessors. (2) To enable performance-optimised combinations of expert distributions. (3) To evaluate and validate theaggregation of expert judgments.

7.1 Aggregation techniques for combining expert opinions 61
Fig. 7.3. Robustness analysis used to derive the weighting schema
Generally, there are two main types of expert aggregation techniques: (1) Equalweighted combination and (2) Performance-based weighted combination. The lat-ter includes a wide variety of weighting schemas but the easiest way to aggregateexpert judgments is the equal weighted combination. However, experience hasshown that performance-based weighting schemas generally outperform the equalweighting schema [17]. The main reason for this is that experts as a group oftenshow poor performance due to group dynamic problems [17]. Another observa-tion made during expert elicitation by Cooke and Gossens (2000) [17] is that astructured combination of expert judgment may show satisfactory performanceeven though the experts individually perform poorly. The main reason for thisis because performance-based weighting schema will assign low weights to theseexperts to counter for their poor performance.
The trust-based information aggregation schema described in Part 5 of this workis a performance weighting schema for aggregating disparate information as inputto the AORDD security solution trade-o¤ analysis and trade-o¤ tool describedin Part 4.


8. Bayesian Belief Networks (BBN)
Bayesian Belief Networks (BBN) has proven to be a powerful technique for rea-soning under uncertainty and have successfully been applied when assessing thesafety of systems as discussed in [21], [23], [29], [91] and [30]. The �rst majorcontribution to this paradigm of uncertainty modelling was by Pearl (1988) [83]and Lauritzen and Spiegelhalter (1988) [73].
Today, BBN is used to aid decision makers in domains such as medicine, software,mechanical industry, economy and military. In the medical domain BBN is usedfor supporting decisions in the diagnosis of muscle and nerve diseases, in antibi-otic treatment systems and in diabetes advisory systems. In the software domainBBN is used to aid in software debugging, printer troubleshooting, safety andrisk evaluation of complex systems and for the help facilities in Microsoft O¢ ceproducts. In the mechanical industry BBN is used to aid diagnosis and repairof on-board unmanned underwater vehicles, in systems for control of centrifugalpumps and in systems for process control in wastewater puri�cation. In the �-nancial domain BBN is used to aid credit application evaluation and portfoliorisk and return analysis and in the military domain BBN is used in the NATOAirborne Early Warning system.
A Bayesian Belief Network (BBN), also called Bayesian Network (BN) or beliefnetwork, is tailored to model situations involving uncertainty. Several circum-stances can give rise to this uncertainty. When choosing between alternative se-curity solutions, which is the objective of this work, uncertainty involves a widevariety of factors, such as incomplete understanding of a security problem or thebehaviour of a software system and its security (system) environment, incompleteknowledge of the e¤ect of a security incident or the inherent vulnerabilities of thesystem, inconsistent information on the behaviour of the system or the e¤ect thatsome security solution (security mechanism, process, procedure etc.) has on thesystem behaviour or any combination of the above.
In the AORDD security solution trade-o¤ analysis described in Part 4 and inthe trust-based information aggregation schema described in Part 5 there areseveral types of information sources with variable levels of trustworthiness in-

64 8. Bayesian Belief Networks (BBN)
volved. These information sources are critical in the AORDD framework, whichis the security solution decision support approach developed in this work. In theAORDD framework each information source provides qualitative and/or quanti-tative information on the uncertain circumstances of future potential misuses andthe e¤ect that alternative security solutions may have on these misuses. With-out such information it is di¢ cult to identify the best-�tted security solutionamong alternatives. However, combining disparate information and aggregatinguncertainty is a rather challenging task as there are multi-dimensional dependen-cies involved. The latter makes BBN an excellent implementation language forthe AORDD security solution trade-o¤ analysis and the trust-based informationaggregation schema described in Parts 4 and 5 of this work.
The problematic part of modelling uncertainty is that the outcome of an event isdependent on many factors and on the outcome of other events. Hence, there arecomplex dependency relationships that need to be accounted for. This is handledby the underlying computation model of BBN, which is based on Bayes rule and�rst introduced as a methodology for modelling problems involving uncertaintyin the late 1980s. Bayes rule calculates conditional probabilities and given thetwo variables X and Y the probability P for the variable X given the variableY can be calculated from: P (XjY ) = P (Y jX) � P (X)=P (Y ). By allowing Xi tobe a complete set of mutually exclusive instances Bayes formula can be extendedto calculate the conditional probability of Xi given Y . The latter form the basicfor computation engines in BBN tools, such as the HUGIN tool [50] used toimplement the AORDD security solution trade-o¤ analysis and the trust-basedinformation aggregation schema described in Parts 4 and 5 of this work. Detailson Bayes rule is available at the Serene website [91] and in Vose (2000) [102] orsimilar textbooks on probability theory.
When modelling a problem or the variables involved in a case description, asdescribed in Chapter 7, BBN is represented as a directed acyclic graph (DAG)together with an associated set of probability tables. A DAG consists of nodesrepresenting the variables involved and arcs representing the dependencies be-tween these variables. Nodes are de�ned as stochastic or decision variables andmultiple variables are often used to determine the state of a node. Each stateof each node is expressed using probability density functions (pdf). Probabilitydensity expresses the con�dence in the various outcomes of the set of variablesconnected to a node and depends conditionally on the status of the parent nodesat the incoming edges. This �ts well with what is needed to model expert opinionsas described in Chapter 7.
There are three types of nodes in a DAG: (1) Target node(s), (2) Intermediatenodes and (3) Observable nodes. Target nodes are nodes about which the objec-tive of the network is to make an assessment (the question that needs an answer).

8. Bayesian Belief Networks (BBN) 65
Firewalldown
ftp fork attack Virus attack
Firewalldown
ftp fork attack Virus attack
Fig. 8.1. Example BBN for ��rewall down�
An example of such a node is the node �Firewall down�as shown in the exam-ple BBN in Figure 8.1. Intermediate nodes represent variables that connect theobservable nodes with the target nodes. These nodes usually represent events orsimilar factors which there exist limited information or beliefs on. The associatedvariables are hidden variables. Typically hidden variables represent issues or per-spectives that increase or decrease the belief in the target node. Observable nodesare nodes that represent events where evidence or information on these eventscan be directly observed or obtained in other ways.
In the example BBN there are no intermediate nodes and two observable nodes,namely �ftp fork attack�and �Virus attack�. The directed arcs between the nodesdenote the causal relationship between the underlying variables. Evidence or in-formation is thus entered at the observable nodes and propagated through thenetwork using these causal relationships and a propagation algorithm based onthe underlying computational model of BBN.
As described above the nodes represent stochastic or decision variables. Further-more, a variable can be either discrete or continuous. For example, the targetnode of the example BBN in Figure 8.1 is �Firewall down�. This node is a discretevariable with the two associated values �true�and �false�. The arcs in the exampleBBN represent causal relationships between the observable nodes and the targetnode. Suppose that the associated variable with the observable node �ftp forkattack�also is discrete with values �true�and �false�. Since the �rewall being downcan cause an �ftp fork attack�the relationship between the two variables is mod-elled as a directed arc from the node �Firewall down�to the node �ftp fork attack�where the direction of the arc represents the causal direction of the relationship.In the example BBN in Figure 8.1 this means that the ��rewall is down�doesnot imply that an �ftp fork attack�will de�nitely happen but that there is anincreased probability that this attack will occur. In a BBN this causal relation is

66 8. Bayesian Belief Networks (BBN)
Table 8.1. Node probability table for �ftp fork attack�
Firewall down True False
ftp fork attack
True 0.8 0.1
False 0.2 0.9
model in the probability table for each node. For the node �ftp fork attack�theprobability table (also called the Node Probability Table or NPT) might look likethat of Table 8.1.
The example NPT represents the conditional probability of the variable �ftp forkattack�given the variable �Firewall down�; P (�ftp fork attack�j�Firewall down�).The possible values (true or false) for �ftp fork attack� are shown in the �rstcolumn. Note that there is a probability for each combination of events (four inthis case) although the rules of probability mean that some of this informationis redundant. There might be several ways of determining the probabilities in anNPT such as that in the NPT above where the probabilities are based on pre-viously observed frequencies of times when the �Firewall is down�. Alternatively,if no such statistical data are available subjective probabilities estimated by ex-perts can be used. The strength of BBN is that they can accommodate subjectiveprobabilities and probabilities based on empirical data. As limited empirical in-formation is available for choosing among alternative security solutions this is amost desirable feature in this work.
The BBN method is applied whenever using BBN as a decision making tool. Theapplication of the BBN method consists of three main tasks:
� Construction of the BBN topology� Elicitation of probabilities to nodes and edges� Making computations
Construction of the BBN topology where a BBN topology is a hierarchy of DAGslinked together, is done by examining the variables involved and their relation-ships and by modelling these explicitly as nodes and arches in a hierarchy ofDAGs. Elicitation of probabilities to nodes and edges involves the collection andaggregation of evidence/information, such as elicitation of expert opinions as de-scribed in Chapter 7. The probabilistic relationship between the nodes in a DAGis described using node probability tables (NPT) where variables can be indepen-dent or dependent. Examples of independent variables are observable nodes thatare d-separated from all other nodes in the topology. Details on d-separation is

8. Bayesian Belief Networks (BBN) 67
found in Jensen (1996) [59]. Collecting evidence for the observable nodes in a BBNtopology may not be straightforward. This problem was discussed in Chapter 7and will be discussed further in Parts 4 and 5 of this work.
Making computation means propagating information and evidence entered intothe observable nodes of the BBN topology. These pieces of information is propa-gated to the target node of the topology through the intermediate nodes. Prop-agation is done by updating the conditional probabilities on the edges of thetopology taking the new evidence into consideration. There exist e¤ective algo-rithms used for evidence propagation, such as Bayesian evidence propagation andthe HUGIN propagation algorithm. Details are in Jensen (1996) [59].
For more information on BBN and in particular the highly relevant work onapplication of BBN for software safety assessment the reader is referred to Gran(2002) [40] and the SERENE project (http://www.hugin.dk/serene/) [91].


9. Architecture/Design trade-o¤ analysis
The two most commonly used software architectural trade-o¤ analysis methodsare the Architecture Trade-o¤Analysis Method (ATAM) [70] and the Cost Bene�tAnalysis Method (CBAM) [69]. Both ATAM and CBAM were developed by theSoftware Engineering Institute (SEI) at Carnegie Mellon. There are also severalother methods available that build on parts of these two methods. However, inthis work the focus is put on ATAM and CBAM as representatives of relevanttrade-o¤ analysis for the AORDD security solution trade-o¤ analysis.
9.1 Architecture Trade-o¤Analysis Method (ATAM)
ATAM focuses on providing insight into how quality goals interact with andtrade-o¤ against each other. ATAM consists of a set of steps that aids in the elic-iting of quality requirements along multiple dimensions, in analysing the e¤ectsof each requirement in isolation and in understanding the interactions of theserequirements. The result of an ATAM is a set of potential architectural decisionsand a description of how these decisions are linked to business goals and desiredquality attributes of the future or existing system.
There are four phases in ATAM: (1) Presentation, (2) Investigation and Analysis,(3) Testing and (4) Reporting. In the presentation phase the context and goalsof the particular trade-o¤ context is presented and an introduction to ATAM asa method is given. In the investigation and analysis phase the current situationis examined and potential architectural approaches are identi�ed and evaluatedby looking at their associated quality attributes. In the testing phase the ar-chitectural approaches are analysed in more detail and the associated scenariosare identi�ed and prioritised. In the reporting phase the result from the threeprevious phases are packaged and presented to the appropriate stakeholders anddecision makers. An overview of the four phases and their associated steps aregiven below.

70 9. Architecture/Design trade-o¤ analysis
1. Presentation
� Present ATAM. In this step the evaluation leader gives a brief introductionto ATAM to the assembled participants by focusing on establishing a com-mon set of expectations and by answering questions from the participants.
� Present business drivers. In this step a project spokesperson (ideally theproject manager or future/current consumer(s)) describes the businessgoals that motivate the development e¤ort and hence the primary archi-tectural drivers, such as high availability, time to market or high security.
� Present architecture. In this step the architect describes the current archi-tecture of the system by focusing on how it addresses the business drivers.
2. Investigation and Analysis
� Identify architectural approaches. In this step the architect identi�es anddescribes alternative architectural approaches. Note that the architecturalapproaches are not analysed at this point.
� Generate quality attribute utility tree. In this step the quality factors thatcomprise system utility, such as performance, availability, security, mod-i�ability, usability, etc., are elicited and speci�ed as scenarios annotatedwith stimuli and responses and then prioritised. These pieces of informa-tion are modelled in a utility tree, which is a hierarchic model of the drivingarchitectural requirements.
� Analyse architectural approaches. In this step the architectural approachesthat address the involved quality factors are elicited and analysed (e.g. anarchitectural approach aimed at meeting performance goals will be sub-jected to a performance analysis) based on the high-priority factors iden-ti�ed in the previous step. During this step the architectural risks, thesensitivity points and the trade-o¤ points are also identi�ed.
3. Testing
� Brainstorm and prioritise scenarios. In this step a larger set of scenar-ios for each architectural approach is elicited in an brainstorming sessionpreferably involving the entire group of stakeholders. This set of scenariosis then prioritised using a voting process involving the entire stakeholdergroup.
� Analyse architectural approaches. This step reiterates the analysis of the ar-chitectural approaches step from the investigation and analysis activity forthe group of highly ranked scenarios identi�ed in the previous step. Thesescenarios are considered to be test cases and the analysis may uncover

9.2 Cost Bene�t Analysis Method (CBAM) 71
additional architectural approaches, risks, sensitivity points and trade-o¤points.
4. Reporting
� Present results. In this step the results and collected information from theprevious steps of ATAM (approaches, scenarios, attribute-speci�c ques-tions, the utility tree, risks, non-risks, sensitivity points and trade o¤s) arecollected and put into an easily understandable format to be presented tothe decision maker or similar.
9.2 Cost Bene�t Analysis Method (CBAM)
CBAM is an extension of ATAM that takes both the architectural and the eco-nomic implications of decisions into consideration when evaluating alternativearchitectures. CBAM focuses on how an organisation should invest its resourcesto maximise gains and minimise risks and o¤ers a set of techniques for assessingthe uncertainty of the judgments involved in assessing costs and bene�ts for eachalternative architecture.
CBAM begins where ATAM concludes and depends on the artefacts produced byATAM. ATAM uncovers the architectural decisions made and links these to busi-ness goals and quality attribute response measures. CBAM builds on these piecesof information by eliciting the costs and bene�ts associated with the decisions.As the architectural solutions have both technical and economic implications thebusiness goals of a software system should in�uence the architectural solutionused by software architects or designers. The technical implications are the char-acteristics of the software system (namely the quality attributes) while the direct�nancial implications are the cost of implementing the system. However, thequality attributes also have �nancial implications as the bene�ts are measured as�nancial return on investment derived from the system.
When the ATAM is applied to a software system the result is a set of documentedartefacts. These are the following:
� A description of the business goals that are critical for the success of the system.� A set of architectural views that document the existing or proposed architec-tures.
� A utility tree that represents a decomposition of the quality goals of the stake-holders for each architecture that starts with high-level statements of qualityattributes and ends with speci�c scenarios.

72 9. Architecture/Design trade-o¤ analysis
� A set of architectural risks that have been identi�ed.� A set of sensitivity points, which are architectural decisions that a¤ect somequality attribute measure of concern.
� A set of trade-o¤ points, which are architectural decisions that either positivelyor negatively a¤ect more than one quality attribute measure.
ATAM also identi�es the set of key architectural decisions that are relevant to thequality attribute scenarios elicited from the stakeholders. These decisions resultin speci�c quality attribute responses, such as levels of availability, performance,security, usability and modi�ability. Each decision also has associated costs. Thismeans that using redundant hardware to achieve a desired level of availability hasone cost and check-pointing to a disk �le has another cost. Furthermore, botharchitectural solutions will result in (presumably di¤erent) measurable levels ofavailability. It is these �nancial considerations that CBAM addresses.
CBAM is performed in two iterations: (1) Establish an initial ranking and (2)Incorporating uncertainty. An overview of the two iterations of CBAM is givenbelow.
Iteration I: Establish an initial ranking
In the �rst iteration of CBAM a series of 9 steps are executed to establish aninitial ranking of the result from ATAM. This intial ranking is later re�ned in thesecond iteration of CBAM. These steps serve to reduce the size of the decisionspace, re�ne the scenarios, collect su¢ cient information for decision making andto establish an initial ranking of architectural strategies derived using ATAM.
Step 1: Collate scenarios. This step collates the scenarios elicited during theATAM exercise and asks stakeholders to contribute with new scenarios if suchexist. Then the scenarios are prioritised in relation to satisfying the business goalsof the system and the top one-third of the scenarios are chosen for further study.
Step 2: Re�ne scenarios. This step re�nes the scenarios from Step 1 by focusing ontheir stimulus/response measures. Then for each scenario the worst, current, de-sired and best-case quality attribute response level is identi�ed and documented.
Step 3: Prioritise scenarios. In this step 100 votes are allocated to each stake-holder and each of these are asked to distribute the votes among the scenariosby considering the desired response value for each scenario. The votes are thensummed and the top 50% of the scenarios are chosen for further analysis. This isdone by assigning a weight of 1.0 to the highest rated scenario and then ratingthe other scenarios in relation to this scenario. The result of this voting is thescenario weights used to calculate the overall bene�t of an architectural solution.

9.2 Cost Bene�t Analysis Method (CBAM) 73
Step 4: Assign utility. In this step the utility for each quality attribute responselevel (worst-case, current, desired or best-case) is assigned to all scenarios. Thequality attributes of concern in this context are those identi�ed in the previousstep.
Step 5: Develop architectural strategies for scenarios and determine their expectedquality attribute response levels. In this step the architectural strategies address-ing the top 50% from Step 3 is developed further to determine the expectedquality attribute response levels that will result from implementing the di¤erentarchitectural strategies. Given that an architectural strategy may a¤ect multiplescenarios, this calculation must be performed for each a¤ected scenario.
Step 6: Determine the utility of the expected quality attribute response level byinterpolation. In this step the elicited utility values is used to determine the utilityof the expected quality attribute response level. The calculation is performed foreach a¤ected scenario.
Step 7: Calculate the total bene�t obtained from an architectural strategy. In thisstep the utility value of the �current� level is subtracted from the �expected�level and normalised using the votes from Step 3. Then the bene�t of a partic-ular architectural strategy is summed over all scenarios and all relevant qualityattributes.
Step 8: Choose architectural strategies based on Return On Investment (ROI)subject to cost and schedule constraints. In this step the cost and schedule im-plications of each architectural strategy is determined. Then the ROI value forall remaining architectural strategies are calculated as a ratio of bene�t to costand ranked according to their ROI values. These architectural strategies are thenselected from the top of the rank list and down until the budget or schedule isexhausted.
Step 9: Con�rm the results with intuition. In this step the chosen architecturalstrategies are evaluated to examine if they seem to align with the business goalsof the organisation. If that is not the case, issues that may have been overlookedduring the analysis should be taken into consideration and reiteration of someof the previous steps might be necessary. If signi�cant issues exist it might benecessary to reiterative all nine steps.
Iteration II: Incorporating uncertainty
A more sophisticated and realistic version of CBAM are achieved by expandingon the steps of CBAM iteration 1. This is done by incorporating uncertainty.This version of CBAM is covered by iteration 2 of CBAM. When incorporatinguncertainty information about risk estimation and uncertainty and the alloca-tion of development resources are added into the result from iteration 1. Eachcategory of relevant information may potentially a¤ect the investment decisions

74 9. Architecture/Design trade-o¤ analysis
under consideration. Therefore, the way each of the nine steps of iteration 1 isaugmented must be considered carefully for correctness and for practicality.
The stakeholder weights in iteration 2 of CBAM are assigned by voting usingutility scores. Utility is measured as the relationship between a score and thebest score possible, which is usually set to equal 100%. Utility scores are thenassigned to each architectural scenario from iteration 1 given in terms of worstcase, current, desired and best. Utility scores are given to both scenarios andarchitectural strategies. To eliminate and prioritise scenarios the stakeholders voteindividually or together and the total sum of votes for all scenarios is normalisedover 100%. This is to force the stakeholders to prioritise among the alternativesand to avoid them giving votes to an architectural strategy independent of theother architectural strategies involved.
The AORDD security solution design trade-o¤ analysis described in Part 4 isa security speci�c design trade-o¤ analysis. This trade-o¤ analysis incorporatesideas from both ATAM and CBAM but is extended to include security solutionand misuse-speci�c parameters in addition to the economic implications fromCBAM and other relevant development, project and �nancial perspectives asinput to the trade-o¤ analysis. The analysis is also extended to incorporate thenotion of operational security level, as discussed in Littlewood et al. (1993) [74],to evaluate the operational security level of an information system.

Part III
Security Solution Decision Support Framework


10. The Aspect-Oriented Risk DrivenDevelopment (AORDD) Framework
The security solution decision support approach developed in this work iscalled the Aspect Oriented Risk Driven Development (AORDD) framework. TheAORDD framework combines the risk driven development (RDD) work of theCORAS project with the aspect-oriented modelling (AOM) work of the AOMgroup at Colorado State University (CSU) (see http://www.cs.colostate.edu/~france/#Projects). The framework bene�t from techniques in ATAM, CBAM,subjective expert judgment, security assessment and management, the CommonCriteria, operational measures of security and BBN and is tailored for aidingdecision makers or designers and the like in choosing the best-�tted security so-lution or set of security solutions among alternatives. The context of this workis security solution decisions for information systems in general and e-commercesystems in particular.
Figure 10.1 illustrates the AORDD framework and its seven components whichare:
1. An iterative AORDD process.
2. Security solution aspect repository.
3. Estimation repository to store experience from estimation of security risksand security solution variables involved in the trade-o¤ tool BBN topologyof component 5.
4. RDD annotation rules for security risk and security solution variable estima-tion.
5. The AORDD security solution trade-o¤ analysis and trade-o¤ tool BBNtopology.
6. Rule set for how to transfer RDD information from the annotated UMLdiagrams into the trade-o¤ tool BBN topology.
7. Trust-based information aggregation schema to aggregate disparate informa-tion in the trade-o¤ tool BBN topology.
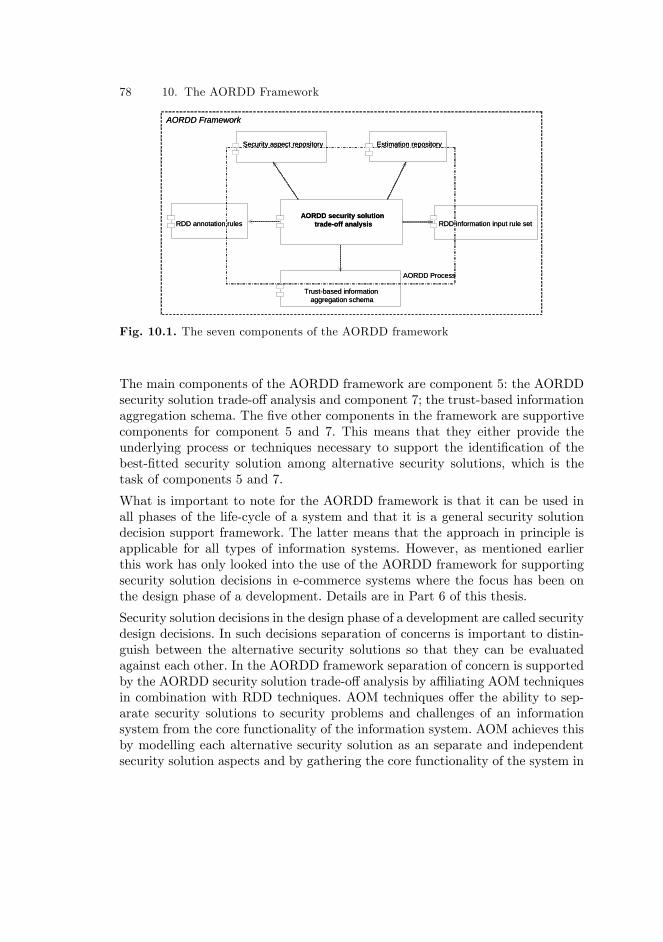
78 10. The AORDD Framework
AORDD security solutiontradeoff analysis
Security aspect repository Estimation repository
RDD annotation rules RDD information input rule set
Trustbased informationaggregation schema
AORDD Framework
AORDD Process
AORDD security solutiontradeoff analysis
Security aspect repository Estimation repository
RDD annotation rules RDD information input rule set
Trustbased informationaggregation schema
AORDD Framework
AORDD Process
Fig. 10.1. The seven components of the AORDD framework
The main components of the AORDD framework are component 5: the AORDDsecurity solution trade-o¤ analysis and component 7; the trust-based informationaggregation schema. The �ve other components in the framework are supportivecomponents for component 5 and 7. This means that they either provide theunderlying process or techniques necessary to support the identi�cation of thebest-�tted security solution among alternative security solutions, which is thetask of components 5 and 7.
What is important to note for the AORDD framework is that it can be used inall phases of the life-cycle of a system and that it is a general security solutiondecision support framework. The latter means that the approach in principle isapplicable for all types of information systems. However, as mentioned earlierthis work has only looked into the use of the AORDD framework for supportingsecurity solution decisions in e-commerce systems where the focus has been onthe design phase of a development. Details are in Part 6 of this thesis.
Security solution decisions in the design phase of a development are called securitydesign decisions. In such decisions separation of concerns is important to distin-guish between the alternative security solutions so that they can be evaluatedagainst each other. In the AORDD framework separation of concern is supportedby the AORDD security solution trade-o¤ analysis by a¢ liating AOM techniquesin combination with RDD techniques. AOM techniques o¤er the ability to sep-arate security solutions to security problems and challenges of an informationsystem from the core functionality of the information system. AOM achieves thisby modelling each alternative security solution as an separate and independentsecurity solution aspects and by gathering the core functionality of the system in
10. The AORDD Framework 79
what is called the primary model. This clear separation makes it possible to eval-uate one security solution at a time and to observe in practice how the di¤erentalternatives a¤ect the core functionality of the system. For this to be e¤ective inpractice e¤ective and tool-supported composition techniques, security veri�cationand composition analysis is necessary.
The AORDD framework makes use of the AOM technique developed at CSU,which includes composition techniques and to some extent tool-support for com-posing security solution aspects with the core functionality of an informationsystem modelled in the primary model. The security veri�cation approach usedin the AORDD framework is the UMLsec approach developed by Jürjens (2005)[67]. The UMLsec approach is tool-supported and proven to be fairly e¤ectiveand accurate. Details are in [67]. It should be noted however that thus fare theAORDD framework has only used the UMLsec approach to verify the securityattributes of the security solution aspects and not the �nal composed model.Techniques for analysing the composed model to check that no security design�aws arise as a result of the composition and that the resulting model preservethe security attributes of the security solution has not been explored to muchextent thus far. The latter is on-going work and the initial ideas are described inGeorg, Houmb and Ray (2006) [35].
Information on AOM and AOM techniques can be found in [33, 34, 98] andthe references therein. Additionally, Houmb et al. (2006) [48] in Appendix B.2provides a brief introduction to AOM and describes the role of AOM in theAORDD security solution trade-o¤ analysis. Details on the AORDD frameworkand its components are in Houmb and Georg (2005) [42], Appendix B.1. Houmbet al. (2006) [48] in Appendix B.2 gives an overview of a specialised version ofthe AORDD framework called the Integrated Security Veri�cation and SecuritySolution Design Trade-O¤ Analysis (SVDT) approach.


11. The AORDD Process
The underlying methodology of the AORDD framework is the AORDD process.The AORDD process [47] is based on the CORAS integrated system developmentand risk management process [97], structured according to the phases of theRational Uni�ed Process (RUP) [86] and the viewpoints of the Reference Modelfor Open Distributed Processing (RM-ODP) [56]. As for the CORAS integratedsystem development and risk management process, the whole or a part of aninformation system con�gured into a ToE is designed, analysed and composedaccording to a particular RM-ODP viewpoint in all iteration of the AORDDprocess. (Note that the ToE is called Target of Assessment (ToA) in CORAS).Hence, security assessment is an integrated activity of the development that drivesall iterations of the AORDD process. Security as a quality attribute of the ToEis by this addressed as early as possible and hopefully at the right time for areasonable price. More information on how to integrate security assessment intothe development of an information system is given in Stølen et al. (2002) [97].
Rather than describing all perspectives of the AORDD process the followingdescription is focused on providing an overview of the AORDD process and toexplain how it di¤ers from the CORAS integrated system development and riskmanagement process. Readers are referred to Stølen et al. (2002) [97] for otherdetails.
The AORDD process di¤ers from the CORAS process in that it provides tech-niques, syntax and some semantic for describing security solutions (called treat-ment options in CORAS) as security solution aspects and for composing thesecurity aspects with a primary design model. This is then used as input to theAORDD security solution trade-o¤ analysis in sub-process 5.
Modelling the security solutions as security solution aspects ease the task of de-veloping and evaluating alternative security solutions in the risk treatment sub-process (sub-process 5) of the CORAS risk management process, which is partof the CORAS integrated system development and risk management process.This also enhances software evolution and increases reusability. However, as theCORAS risk management process and the underlying CORAS MBRA method-

82 11. The AORDD Process
ology do not include guidelines for evaluating alternative security solutions andidentifying the most e¤ective set of security solutions for a security problem orchallenge, which is a critical success factor for cost-e¤ective development of secu-rity critical information systems, these issues need to be addressed explicitly inthe AORDD process. Thus, the AORDD process provides activities, techniquesand guidelines that assist a decision maker, designer or the like in choosing fromalternative security solutions. The AORDD process also o¤ers guidelines on howto estimate the involved variables in security solution decision support.
Figure 11.1 illustrates the iterative nature of the AORDD process while Figure11.2 gives an overview of the activities involved in the requirement and designphases. The AORDD process consists of a requirement phase, a design phase, im-plementation phase, deployment phase and a maintenance phase. Developmentspirals from requirements to maintenance and in each phase development ac-tivities are structured into iterations. Work moves from one phase to the nextafter �rst iterating through several sub-phases that end with acceptable analysisresults.
It should be noted that the analysis activity in AORDD di¤ers from the assess-ment activity, as shown in Figure 11.1. In the AORDD process assessing risksconcern identifying potential security problems and to identify and evaluate al-ternative security solutions to solve the security problem or challenge while theanalyse activity refers to the veri�cation and analysis of the composed models toidentify design �aws. Details on the latter is in Georg, Houmb and Ray (2006)[35].
As can be seen in Figure 11.1 each phase and all iterations in each phase includesa security assessment activity. This security assessment activity is where the secu-rity risks to a ToE (or information system) is identi�ed and where the alternativesecurity solutions to solve the security risks are analysed. As described in Chap-ter 5 security assessment is a specialisation of risk management for the securitydomain that was adapted into a MBRA domain for security critical informationsystems by the CORAS project. In the AORDD framework the risk assessmentprocess of CORAS has been augmented with activities to support and executethe AORDD security solution trade-o¤ analysis.
The activities of the security assessment step in the AORDD process is as fol-lowing:
� Sub-process 1: Context identi�cation
�Activity 1.1: Identify purpose and scope of assessment
�Activity 1.2: Describe the target of evaluation (ToE), business perspectivesand the security environment

11. The AORDD Process 83
assessrisks
specifyrequirements
analyze
specifydesign
analyzeassessrisks
implement
assessrisks
analyze
deploy
assessrisks
analyze
specifychanges
assessrisks
analyze
Requirements Phase
Design Phase
Implementation PhaseDeployment Phase
Maintenance Phase
iterativedevelopment
assessrisks
specifyrequirements
analyze
specifydesign
analyzeassessrisks
implement
assessrisks
analyze
deploy
assessrisks
analyze
specifychanges
assessrisks
analyze
Requirements Phase
Design Phase
Implementation PhaseDeployment Phase
Maintenance Phase
iterativedevelopment
Fig. 11.1. Outline of the AORDD process
Ince
ptio
n
Choosea partSpecify funtional req
Req. risk assessment
Tradeoff decision
iterate
Ince
ptio
nIn
cept
ion
iterate
Req
uire
men
t
Impl
emen
tatio
n
Solutionas req.
Specify sec.req
Choosea partSpecify design
Design risk assessment
Tradeoff decisionSolutionas design
Ince
ptio
n
Choosea partSpecify funtional req.
Req. risk assessment
Tradeoff decision
iterate
Ince
ptio
n
Ela
bora
tion
iterate
Ince
ptio
n
Ela
bora
tion
iterateiterate
Req
uire
men
t
Des
ign
iterate
Impl
emen
tatio
n
Refine and update Refine and update
Ince
ptio
n
Choosea partSpecify funtional req
Req. risk assessment
Tradeoff decision
iterate
Ince
ptio
nIn
cept
ion
iterate
Req
uire
men
t
Impl
emen
tatio
n
Solutionas req.
Specify sec.req
Choosea partSpecify design
Design risk assessment
Tradeoff decisionSolutionas design
Ince
ptio
n
Choosea partSpecify funtional req.
Req. risk assessment
Tradeoff decision
iterate
Ince
ptio
n
Ela
bora
tion
iterate
Ince
ptio
n
Ela
bora
tion
iterateiterate
Req
uire
men
t
Des
ign
iterate
Impl
emen
tatio
n
Security Solution Aspect
Refine and update Refine and update
Ince
ptio
n
Choosea partSpecify funtional req
Req. risk assessment
Tradeoff decision
iterate
Ince
ptio
nIn
cept
ion
iterate
Req
uire
men
t
Impl
emen
tatio
n
Solutionas req.
Specify sec.req
Choosea partSpecify design
Design risk assessment
Tradeoff decisionSolutionas design
Ince
ptio
n
Choosea partSpecify funtional req.
Req. risk assessment
Tradeoff decision
iterate
Ince
ptio
n
Ela
bora
tion
iterate
Ince
ptio
n
Ela
bora
tion
iterateiterate
Req
uire
men
t
Des
ign
iterate
Impl
emen
tatio
n
Security Solution Aspect
Refine and update Refine and update
Fig. 11.2. Overview of the activities of the requirement and design phase of the AORDDprocess

84 11. The AORDD Process
�Activity 1.3: Identify system stakeholders
�Activity 1.4: Identify assets and have stakeholders assign values to assets
�Activity 1.5: Describe the asset-stakeholder graph
�Activity 1.6: Describe relevant security policies (SP)
�Activity 1.7: Identify and describe the security risk acceptance criteria (SAC)
� Sub-process 2: Risk identi�cation
�Activity 2.1: Identify security threats to assets from the security environment
�Activity 2.2: Identify vulnerabilities in ToE, security policies, security processes,security procedures and the security environment
�Activity 2.3: Document misuse scenarios and group misuses into misusegroups
� Sub-process 3: Risk analysis
�Activity 3.1: Estimate impact of misuse
�Activity 3.2: Estimate frequency of misuse
� Sub-process 4: Risk evaluation
�Activity 4.1: Determine level of risk for each set of impact and frequency
�Activity 4.2: Evaluate risks against the security risk acceptance criteria(SAC)
�Activity 4.2: Categorise risks in need of treatment into risk themes
�Activity 4.3: Determine interrelationships among risk themes
�Activity 4.4: Identify con�icts among risk themes
�Activity 4.5: Prioritise risk themes and risks
�Activity 4.6: Resolve identi�ed con�icts
� Sub-process 5: Risk treatment
�Activity 5.1: Identify alternative security solutions and group these into se-curity solution sets
�Activity 5.2: Identify e¤ect and cost of all alternative security solutions
�Activity 5.3: Model all security solutions as security solution aspects usingRDD modelling elements
�Activity 5.4: Compose security aspects with primary model and composeRDD information

11. The AORDD Process 85
�Activity 5.5: Evaluate and �nd the best-�tted security solution or set ofsecurity solutions using the AORDD security solution trade-o¤ analysis
The main di¤erence from the activities of the CORAS security assessment processis the re�nement of the activities in sub-process 1, the use of the concept misuserather than unwanted incident in sub-process 2, a clear separation of potentialcon�icts among risk themes and risks in sub-process 4 and a re�nement andextension of the activities of sub-process 5. It is in sub-process 5 that the securitysolution decision support is made explicit by use of the AORDD security solutiontrade-o¤ analysis to support the choice of security solution or set of securitysolutions among alternatives.
As can be seen in Figure 11.2 the security assessment step in the requirement spec-i�cation phase is done using the functional and security requirements as the ToE.The result of this activity is a set of unresolved security problems or challenges.These problems are either solved in sub-process 5 of the respective iteration ortransformed into security requirements for the next iteration. In the design phasethe security risk assessment is done using the available design speci�cation asthe ToE. Similar to the requirement phase the security problems or challengesidenti�ed are either solved as a security solution design decision in sub-process5 of the security assessment step of a particular iteration or transformed intosecurity requirements in the next iteration. This means that whenever new se-curity requirements are introduced the relevant parts of the information systemgoes through a new requirement security risk assessment before proceeding to thenext development phase.
Details on the AORDD process are in Houmb et al. (2004) [47]. Details on theAORDD security solution trade-o¤ analysis are in Part 4, Houmb et al. (2006)[48] in Appendix B.2 and Houmb et al. (2005) [44] in Appendix B.3. Details onthe AORDD framework are in Houmb and Georg (2005) [42], Appendix B.1.


Part IV
AORDD Security Solution Trade-O¤Analysis


12. The Role of Trade-O¤Analysis in SecurityDecisions
In security assessment and management there are no single correct solution tothe identi�ed security problems or challenges but rather choices and tradeo¤s.The main reason for this is that information systems and in particular securitycritical information systems must perform at the contracted or expected securitylevel, make e¤ective use of available resources, comply with standards and regula-tion and meet end-users�expectations. Balancing these needs while also ful�llingdevelopment, project and �nancial perspectives to an information system such asbudget and TTM constraints require decision makers, designers and the like toevaluate alternative security solutions to their security problems or challenges.
As described in Chapter 10 (Part 3) choosing among alternative security solutionsis part of the risk treatment sub-process of the security assessment activity in theAORDD process. The technique used to perform this activity is the AORDDsecurity solution trade-o¤ analysis. This analysis takes security, development,project and �nancial perspective into mind during its evaluation of how well aparticular security solution �ts with the set of stakeholder and system goals andexpectations and the requirements posed upon an information system. This ismeasured as a security solution �tness score, but before discussing the details ofhow to use the AORDD security solution trade-o¤ analysis to derive this �tnessscore, it is important to clearly de�ne and explain the ascribed meaning to theconcepts trade-o¤ analysis and security solution in the context of the AORDDframework. This is to enable reproducibility of this work.
De�nition Trade-o¤ Analysis is making decisions when each choice has bothadvantages and disadvantages. In a simple trade-o¤ it may be enough to listeach alternative and the pros and cons. For more complicated decisions, listthe decision criteria and weight them. Determine how each option rates oneach of the decision score and compute a weighted total score for each option.The option with the best score is the preferred option. Decision trees may beused when options have uncertain outcomes [101].

90 12. The Role of Trade-O¤ Analysis in Security Decisions
De�nition Security solution is any construct that increases the level of con�-dentiality, integrity, availability, authenticity, accountability, non-repudiation,and/or reliability of a ToE. Examples of security solutions are security re-quirements, security protocols, security procedures, security processes and se-curity mechanism, such as cryptographic algorithm and anti-virus software.
As can be seen by the above de�nitions trade-o¤ concerns decisions where thereare alternative solutions that all have both advantages and disadvantages in termsof the goals involved. To aid such decisions it is necessary to measure the alter-natives against each other by means of comparable relative weights derived usinga set of decision criteria. This means that the estimation techniques used mustproduce comparable weights for the alternative security solutions.
Estimation techniques can be either qualitative or quantitative. In the context ofthe AORDD framework these are used to measure the degree that a security solu-tion addresses the set of decision criteria involved in a security solution decision.For the security assessment activity in the AORDD process decision criteria arecalled trade-o¤ parameters and includes security risk acceptance criteria, stan-dards, policies, laws and regulation, priorities, business goals, TTM, budget, thee¤ect that a security solution have on the security problem or challenge that it isa solution to and the resources needed for employment and proper maintenanceof the security solution. Details are in Chapter 13.
The AORDD framework measures security in terms of the seven security at-tributes con�dentiality, integrity, availability, authenticity, accountability, non-repudiation and reliability. This means that the AORDD security solution trade-o¤ analysis can use these seven security attributes to measure the decision scorefor each of the decision variables mentioned above. When deriving the �tnessscore of a security solution using the AORDD security solution trade-o¤ analysiseach of these decision scores are combined into a total decision score. This totaldecision score measures the perceived level of ful�lment of the stakeholder andsystem goals and expectations and the requirements posed upon an informationsystem for an security solution relative, to the other alternative security solutions.Details are in Chapter 13.
However, as discussed in Chapter 5 there is usually a great deal of uncertaintyinvolved in security solution trade-o¤ analysis as little hard or empirical dataor evidence on the actual e¤ect and cost of a particular security solution exists.There are many reasons for this, one being the instability of the security environ-ment of an information system and that information systems tend to vary fromeach other to such a degree that experience on one cannot directly be reused onthe other. Other sources of uncertainty in a security solution trade-o¤ context arethe lack of overview of the factors involved in the security solution decision and

12. The Role of Trade-O¤ Analysis in Security Decisions 91
that new security solutions are introduced faster than their actual e¤ect in var-ious situations are demonstrated. Thus, the AORDD security solution trade-o¤analysis needs to deal with disparate information and uncertainties.
Recall from Chapter 5 that uncertainty in this work is interpreted accordingto the subjectivistic interpretation of probability. Note that uncertainty usuallycannot be completely dealt with, as this implies deriving at a state where thereis certain which security solution alternative is the better. Thus the goal of theAORDD security solution trade-o¤ analysis is not to remove uncertainty, butto derive at a state where there are clear indications that one or a few of thealternative security solutions are better suited than others.


13. AORDD Security Solution Trade-O¤Analysis
The AORDD security solution trade-o¤ analysis is part of the risk driven devel-opment (RDD) strategy in the AORDD framework. In this context RDD meansthat identifying, analysing and evaluating security risks is the driving factor inthe development process. This RDD strategy is incorporated into the activities ofthe AORDD process and used to decide whether to move from one developmentiteration or phase to the next in the AORDD process. The role of the securitysolution trade-o¤ analysis in the AORDD framework is to evaluate alternativesecurity solutions to the identi�ed security risks in all iterations and phases ofthe AORDD process. This refers to Activity 5.5; Evaluate and �nd the best-�ttedsecurity solution or set of security solutions using the AORDD security solutiontrade-o¤ analysis, of the security assessment activity of the AORDD process.Details are in Chapter 11.
There are several ways to measure what is the �ttest security solution amongstalternatives. In the AORDD framework this is done using a �tness score derivedfrom decision variables addressing the following high level perspectives: securitylevel and relevant development, project and �nancial goals. This means that the�tness score is an expression of how well a security solution meets the contracted,expected or required security level and the relevant development, project and�nancial perspectives for the ToE or the information system. The AORDD secu-rity solution trade-o¤ analysis deals with this by separating the analysis into twophases: (1) Evaluate security risks against the security risk acceptance criteriaand (2) Trade-o¤ alternative security solutions by means of relevant development,project and �nancial perspectives.
Figure 13.1 gives an overview of the groups of inputs and outputs of the two-phase trade-o¤ analysis while Figure 13.2 shows the security assessment conceptsinvolved in the trade-o¤ analysis. There are also development, project and �nan-cial perspectives involved and these are represented by the �trade-o¤ parameters�in Figure 13.1 and discussed in detail in Section 13.2.
The �rst phase of the AORDD security solution trade-o¤ analysis is called risk-driven analysis. The risk-driven analysis involves the evaluation of the set of

94 13. AORDD Security Solution Trade-O¤ Analysis
Riskdrivenanalysis
Tradeoffanalysis
best “fitted”security solutionor set of security solutions
tradeoff parametersalternative security solutions
list of security risks in need of treatment
security risk acceptance criteriaRiskdriven
analysis
Tradeoffanalysis
best “fitted”security solutionor set of security solutions
tradeoff parametersalternative security solutions
list of security risks in need of treatment
security risk acceptance criteria
Fig. 13.1. The two phases of the AORDD security solution trade-o¤ analysis
identi�ed misuses and their associated risk levels, which are the result of sub-processes 2, 3 and 4 of the AORDD process, against the relevant set of securityrisk acceptance criteria, such as those identi�ed in sub-process 1 of the AORDDprocess. The result of this phase is a list of security risks in need of treatment.This means that the risk-driven analysis covers sub-processes 1, 2, 3 and 4 of theAORDD process, as described in Chapter 11.
The list of security risks in need of treatment, the set of alternative security so-lutions and the trade-o¤ parameters which are the relevant development, projectand �nancial perspectives involved, are the inputs to the second phase of theAORDD security solution trade-o¤ analysis. Here, the security risks are the prob-lems or challenges that need to be solved, the security solutions are the alternativeways of solving the problems and the trade-o¤ parameters are the decision vari-ables. The outputs from the second phase are the best-�tted security solution orset of security solutions. This means that Phase 2 is where the security solutionsare traded-o¤. This is done by deriving the relative �tness score for each securitysolution and then comparing these to identify the best-�tted security solution orset of security solutions. As for Phase 1 there are security assessment conceptsinvolved and these are shown in Figure 13.2. More details on both phases aregiven in the following.

13.1 Phase 1: Risk-driven analysis 95
Risk
Security Solution
Risk Acceptance
Frequency Impact
MisuseRelates to
1 1 11..*1
1
1
1
1..*
Reduces 11 Reduces
1..*
Risk
Security Solution
Risk Acceptance
Frequency Impact
MisuseRelates to
1 1 11..*1
1
1
1
1..*
Reduces 11 Reduces
1..*
Phase 1
Phase 2
Risk
Security Solution
Risk Acceptance
Frequency Impact
MisuseRelates to
1 1 11..*1
1
1
1
1..*
Reduces 11 Reduces
1..*
Risk
Security Solution
Risk Acceptance
Frequency Impact
MisuseRelates to
1 1 11..*1
1
1
1
1..*
Reduces 11 Reduces
1..*
Phase 1
Phase 2
Fig. 13.2. The security assessment concepts involved in Phase 1 and 2 of the AORDDsecurity solution trade-o¤ analysis
13.1 Phase 1: Risk-driven analysis
The activities in the risk-driven analysis are supported by standard vulnerabilityassessment and vulnerability scans, other types of security analysis and stan-dard risk assessment methods, such as those in the CORAS framework. In theAORDD framework no constraints are put on the selection of the methods usedas long as the output is a list of security risks in need of treatment, as shownin Figure 13.2. However, the AORDD process o¤ers a structured approach toderive these pieces of information through the activities of sub-processes 2, 3and 4 in its security assessment activity, as described in Chapter 11. In addition,security risk acceptance criteria are needed. These are derived in activity 1.7 ofthe AORDD security assessment activity. Hence, the relevant activities from theAORDD security assessment activity for Phase 1 is the following:
� Sub-process 1: Context identi�cation
�Activity 1.7: Identify and describe the security risk acceptance criteria (SAC)
� Sub-process 2: Risk identi�cation

96 13. AORDD Security Solution Trade-O¤ Analysis
�Activity 2.1: Identify security threats to assets from the security environment
�Activity 2.2: Identify vulnerabilities in ToE, security policies, security processes,security procedures and the security environment
�Activity 2.3: Document misuse scenarios and group misuses into misusegroups
� Sub-process 3: Risk analysis
�Activity 3.1: Estimate impact of misuse
�Activity 3.2: Estimate frequency of misuse
� Sub-process 4: Risk evaluation
�Activity 4.1: Determine level of risk for each set of impact and frequency
�Activity 4.2: Evaluate risks against the security risk acceptance criteria(SAC)
�Activity 4.2: Categorise risks in need of treatment into risk themes
�Activity 4.3: Determine interrelationships among risk themes
�Activity 4.4: Identify con�icts among risk themes
�Activity 4.5: Prioritise risk themes and risks
�Activity 4.6: Resolve identi�ed con�icts
The above activity list involves a set of concepts and these are the pieces ofinformation involved in Phase 1 of the trade-o¤ analysis. These concepts aresecurity threat, vulnerability, misuse, misuse frequency, misuse impact, securityrisk and security risk acceptance criteria, as shown in Figure 13.3. Figure 13.3shows parts of the AORDD concept-relation model described in Houmb andGeorg (2005) [42], Appendix B.1.
In the following the assumption is that the output from sub-processes 2 and 3of the AORDD security assessment activity are sets of vulnerabilities, securitythreats, misuses, misuse frequency and misuse impact. These pieces of informationare necessary in order to derive the risk level of the ToE and for evaluatingwhich of the security risks that needs to be treated. In the AORDD securityassessment activity deriving the security risks is the task of sub-process 4 wherea security risk is derived for each misuse by combining the misuse frequency withone of the misuse impacts. This means that one misuse leads to one or moresecurity risks depending on the number of associated misuse impacts. As bothmisuse frequency and misuse impact can be described either as a qualitativevalue or as a quantitatively value the resulting risk level can also be measuredeither qualitatively or quantitatively. However, to combine misuse frequency and

13.1 Phase 1: Risk-driven analysis 97
Threat Vulnerability
Frequency MisuseImpact
Unwanted Incident
Cause of system impact
*
*1
1
1 Has1
1
1..*
1..*1..*
Relates to
Has
Security Threat Vulnerability
Security Risk
MisuseFrequency
Misuse
Security RiskAcceptance criteria
Cause of impact
*
*1
1
1 Has1
1
1..*
1..*1..*
Has
Threat Vulnerability
Frequency MisuseImpact
Unwanted Incident
Cause of system impact
*
*1
1
1 Has1
1
1..*
1..*1..*
Relates to
Has
Security Threat Vulnerability
Security Risk
MisuseFrequency
Misuse
Security RiskAcceptance criteria
Cause of impact
*
*1
1
1 Has1
1
1..*
1..*1..*
Has
Fig. 13.3. Concepts involved in Phase 1 of the AORDD security solution trade-o¤analysis
misuse impact into a security risk both values need to be in the same format ortransformed in such a way that they can be combined.
When qualitative values are used for all involved concepts it is called qualitativerisk evaluation. Qualitative risk evaluation usually involves two sets of qualita-tive scales that are combined into a qualitative scale describing the risk levelof a security risk. For example, if the misuse frequency is measured accordingto the qualitative scale {incredible, improbable, remote, occasional, probable andfrequent} and the misuse impact is measured according to the qualitative scale{negligible, marginal, critical and catastrophic} the resulting security risk maybe measured according to the qualitative scale {low, medium, high, extreme andcatastrophic}, denoting the level of risk. The way this is done in practice is tocombine the two input qualitative scales into a risk matrix with misuse impactvalues on the vertical scale and misuse frequency values on the horizontal scale.Each cell in the risk matrix then denotes a risk level, which in this context isaccording to the qualitative scale {low, medium, high, extreme and catastrophic}.Examples of qualitative scales for misuse impact, misuse frequency and risk levelare in AS/NZS 4360:2004 [4].

98 13. AORDD Security Solution Trade-O¤ Analysis
Security Threat Misuse
Impact Loss
I1L2I2
I3 L3
L1
Security Threat Misuse
Impact Loss
I1L2I2
I3 L3
L1
Fig. 13.4. Example of a risk model
Misuse frequency and misuse impact can also be expressed as quantitative valuesand in such cases misuse frequency are either given as the number of occurrenceswithin a certain time frame or as a probability measure, such as for examplethe probability for the misuse to occur within a certain time frame. Quantitativemisuse impact values may be measured using several units, including �nancialloss, loss of reputation etc. When both misuse frequency and misuse impact aregiven as quantitative values it is called quantitative risk evaluation. Quantitiesrisk evaluation di¤ers from qualitative risk evaluation in that quantitative misusefrequency and impact values are directly computable and thus the risk level aredirectly derived as the product of the two.
However, probability as an expression of misuse frequency can be given accordingto the classical or the subjective interpretation of probability. Classical interpre-tation in the case of quantitative risk evaluation means that there is a probabilityP for an event e to occur within the time frame t. This P is interpreted as a truevalue of the actual event e and the uncertainty of how close P is to the true valueis modelled by associating con�dence intervals. Interpreting quantitative misusefrequency values in the subjectivist way means that P is considered as a beliefin the occurrence of the event e expressed using some probability distribution,such as the Triang distribution. In this case it is not the true value of P thatis expressed but an expert�s or other information source�s uncertainty on theoccurrence of event e within time frame t. The same is the case for subjectiveinterpretation of quantitative misuse impact values.
Furthermore, it does not always make sense to directly multiply the misuse fre-quency and misuse impact values to obtain the risk level in quantitative riskevaluation. The reason might be that the impacts of particular misuses are de-pendent on each other. In such cases the risk level can be derived by examiningthe misuse frequency and misuse impact values separately before combine themin a risk model, such as the one shown in Figure 13.4.
In the risk model in Figure 13.4, loss related to a particular security threatare expressed by the impact space f(I1; F1); (I2; F2); :::; (In; Fn)g where Fi is theoccurrence rate or occurrence probability for the misuse leading to the impact Ii.

13.1 Phase 1: Risk-driven analysis 99
This results in the set of losses fL1; L2; :::; Lig and measures such as statisticalexpected loss can be used to express the risk level. Statistic expected loss isdetermined by summing over the impact space by multiplying each loss in theset fL1; L2; :::; Lig with its associated impact, as shown in Equation 13.1.
�Statistical expected loss�= (I1�F 1) � L1+:::+ (Ii�F i) � Li+:::+(In � Fn) � Ln (13.1)
Using risk models and expressing risk level using intuitive measures like statis-tical expected loss makes the results from the risk-driven analysis in Phase 1 ofthe trade-o¤ analysis easily accessible for the decision makers. These measuresare concrete and enable the decision makers to directly compare the alternativesecurity solutions by means of the e¤ect on the impact space and the statisticalexpected loss.
There are also risk evaluation situations where there are insu¢ cient informationto asses the impact, the frequency or both. In such situations it becomes partic-ularly valuable to use the subjective interpretation of probability as this opensfor the use of subjective expert judgments. Examples of such are the Markov likeanalysis described in Houmb, Georg, France, Reddy and Bieman (2005) [43].
13.1.1 The relationship between vulnerability, security threat, misuseand security risk in AORDD
The AORDD security assessment activity performs two types of identi�cation ac-tivities during sub-process 2. These are vulnerability analysis and security threatidenti�cation. This separation of identi�cation activities is according to AS/NZS4360:2004 and the the Common Criteria and is done to distinguish between prob-lems with the ToE or its security environments, from the events that might exploitthese problems in an undesired manner. This means that a vulnerability is un-derstood as a weakness in the ToE or the ToE security environment that canbe misused and a security threat is the event that performs the misuse of theweakness in the ToE or the ToE security environment.
De�nition Vulnerability is a weakness in the ToE and/or the ToE security envi-ronment that if exploited a¤ects the capabilities of one or more of the securityattributes con�dentiality, integrity, availability, authenticity, accountability,non-repudiation or reliability of one or more assets (modi�ed from AS/NZS4360:2004 [4]).

100 13. AORDD Security Solution Trade-O¤ Analysis
Security vulnerabilitiesSecurity threats
Misuse
Security vulnerabilitiesSecurity threats
Misuse
Fig. 13.5. Relation between security threat, security vulnerability and misuse
De�nition Security Threat is a potential undesired event in the ToE and/orthe ToE security environment that may exploit one or more vulnerabilitiesa¤ecting the capabilities of one or more of the security attributes con�den-tiality, integrity, availability, authenticity, accountability, non-repudiation orreliability of one or more assets (modi�ed from AS/NZS 4360:2004 [4]).
The result of a security threat exploiting a vulnerability is some undesired event.This undesired event is called a misuse. It is important to note however thatmisuses can only occur if both a vulnerability and a security threat exist andif the vulnerability is exploitable by the security threat. This means that theset of potential misuses is a sub set of the set of vulnerabilities and that theset of potential security threats and hence M = � ST \ SV where M is theset of misuses, ST is the set of security threats and SV is the set of securityvulnerabilities, as shown in Figure 13.5.
The undesirability of a misuse is always towards one or more of the system assetsas the AORDD process and the AORDD framework is asset-driven. The wayassets can be a¤ected is that their values are either reduced or increased. In theAORDD framework asset value reduction results from some loss in the capabilitiesof one or more of the security attributes of a ToE while asset value increase resultsfrom some gain in the capabilities of one or more of the security attributes of aToE. The actual asset value loss or gain is not the misuse, but rather the impactof the misuse. These issues are elaborated on in the following.
De�nition Misuse is an event that a¤ects one or more of the security at-tributes con�dentiality, integrity, availability, authenticity, accountability,non-repudiation or reliability of one or more assets.

13.1 Phase 1: Risk-driven analysis 101
Threat is initiated
Misuse occurs
Threat exploits vulnerability Threat is prevented by Safeguard
[vulnerability exist]
[vulnerability does not exist]
[safeguard exist]
[safeguard does not exist]
Threat is initiated
Misuse occurs
Threat exploits vulnerability Threat is prevented by Safeguard
[vulnerability exist]
[vulnerability does not exist]
[safeguard exist]
[safeguard does not exist]
Fig. 13.6. Overview of how misuses happen and how they can be prevented
As misuses leads to impacts that can be negative or positive, the resulting secu-rity risk can also be either negative or positive. Exploring the positive e¤ects ofmisuses are often referred to as opportunity analysis and commonly used in the�nance and stock trade domain. However, this issue will not be elaborated on inthis work as it was not part of the scope of this work.
Assuming that misuses have negative impact on asset values it is important toknow how to prevent, detect or act on misuses. Figure 13.6 illustrates the generalprinciple of how misuses are created and how they can be prevented. As can beseen in the �gure there are situations where security threats are identi�ed butwhere there does not exists any vulnerabilities for the security threat to exploitand hence no misuse can occur. In such situations no treatment is needed as thereare no events or impact to reduce or prevent. Also, if there already exist practice,procedure or security mechanism in the ToE and/or the ToE security environmentthat are able to prevent the security threat from exploiting the vulnerability nomisuse will occur. Such existing security threat protections are called safeguards.
De�nition Safeguard is an existing practice, procedure or security mechanismin the ToE and/or the ToE security environment that reduces or preventssecurity threats from exploiting vulnerabilities and thus reduces the level ofrisk (modi�ed from ISO 13335 [54]).
In addition to the above mentioned cases there might be situations where asecurity threat is not able to exploit a vulnerability even though no safeguards

102 13. AORDD Security Solution Trade-O¤ Analysis
exists. The reason for this might be that the magnitude of the security threat isnot big enough to launce the exploit. In such cases the exploit might be launchedif several security threats are initiated simultaneously and where the combinationof these breaks the exploit limit. This is best modelled using Petri Nets (PN) orsimilar dynamic modelling behaviour semantic. An example of a Coloured PetriNets (CPN) model that capture the perspective of misuse comprised of severalsimulations security threats initiated by several attackers is described in Houmband Sallhammar (2005) [46].
Furthermore, there are also cases where a security threat exploits a vulnerabilityand initiate a chain of misuses resulting in a misuse hierarchy, as illustratedin Figure 13.7. In the case of a misuse hierarchy there is always either a singlesecurity threat or several simultaneously security threats that initiate the chain ofevents. This security threat is referred to as a basic security threat. An example ofa misuse hierarchy security attack is the "ILOVEYOU" virus. This virus exploiteda vulnerability in the email client Microsoft Outlook so that when a user openedthe email with the virus, the virus used the address book in Microsoft Outlook andthe users�email account to propagate the virus. For some companies many of theseaddress book entries where address lists and internal contacts and the amountof email sent within and out of the SMTP server in some of these companiestriggered the exploit of a vulnerability in some Virus walls and resulted in theVirus wall either letting all emails pass through without cheeking for viruses orthat emails got stuck in an never-ending sending queue on the Virus wall.
As described earlier, a security risk is usually measured as the combination of onemisuse frequency and one misuse impact. In the AORDD framework additionalconcepts related to operational security level are also included. These are meantime and e¤ort to misuse and called MTTM and METM. In the misuse hierarchythis means that there is a set of misuse frequency, misuse impact, MTTM andMETM for each level in the hierarchy. As the occurrence of a misuse in the layerabove in the misuse hierarchy is dependent on the occurrence of all misuses inthe layers below the misuse frequency for each level is a multiple of the misusefrequency for the current layer and all layers below.
MF j=jQi=1
MF i�MF (i�1) (13.2)
whereMFj is the misuse frequency for the current layer j,MFi is the misuse fre-quency for layer number i and MF(i�1) is the misuse frequency for layer number(i� 1).The associated de�nitions are given below:

13.1 Phase 1: Risk-driven analysis 103
Basic threat Vulnerability exist
Misuse occurs Vulnerability exist
Misuse occurs Vulnerability exist
Misuse occurs
Basic threat Vulnerability exist
Misuse occurs Vulnerability exist
Misuse occurs Vulnerability exist
Misuse occurs
Fig. 13.7. Illustration of a misuse hierarchy
De�nition Basic Security Threat is the initial security threat that exploits oneor more vulnerabilities in the ToE or the ToE security environment and leadsto a chain of misuses.
De�nition Misuse Frequency is a measure of the occurrence rate of a misuseexpressed as either the number of occurrences of a misuse in a given timeframe or the probability of the occurrence of a misuse in a given time frame(modi�ed from AS/NZS 4360:2004 [4]).
De�nition Misuse Impact is the non-empty set of either a reduction or an in-crease of the asset value for one asset.
De�nition Loss is a reduction in the asset value for one asset.
De�nition Gain is an increase in the asset value for one asset.
De�nition Security Risk is the combination of exactly one misuse frequency,one misuse impact, one mean time to misuse (MTTM) and one mean e¤ortto misuse (METM) (modi�ed from AS/NZS 4360:2004 [4] by taking in theconcepts for operational security level from Littlewood et al. [74]).

104 13. AORDD Security Solution Trade-O¤ Analysis
13.1.2 Deriving the list of security risks in need of treatment
De�nition Security Risk Acceptance Criteria is a description of the accept-able level of risk (modi�ed from AS/NZS 4360:2004 [4]).
The security acceptance criteria are derived in activity 1.7 of the AORDD securityassessment activity. Such criteria are descriptions of what is an acceptable levelof risk for a particular ToE. These criteria are usually given by the set of stake-holders involved in the security assessment and management and most preferablethe decision maker. The reason for this, is that the stakeholder responsible foran eventual damage or paying for the security solution aiming at preventing,detecting or removing the security risk should also decide on the acceptable po-tential damage. This potential damage should also be evaluated in relation to thecost associated with the potential security solutions. It is however often di¢ cultfor any stakeholder to set the acceptance level before some information on thepotential damage is available. In practice this means that such criteria often arenegotiated between the stakeholders during the risk evaluation phase of a securityassessment, which refers to sub-process 4 of the security assessment activity inthe AORDD process. The acceptance criteria can also be derived from relevantstandards, company security policies and business goals.
In the AORDD framework the security risk acceptance criteria are recommendedderived as part of the context identi�cation in sub-process 1. However, secu-rity risk acceptance criteria information is also supported as dynamic and nego-tiable information in the AORDD security solution trade-o¤ analysis. This meansthat the criteria may be updated whenever more information becomes availablethroughout the development or assessment of a ToE and that it can be a ne-gotiation variable while trading of security solutions in Phase 2 of the trade-o¤analysis. The latter is described in Section 13.2.
In Phase 1 of the trade-o¤ analysis the security risk acceptance criteria availableat the time is used to evaluate which security risks are acceptable and whichare not acceptable. The main goal of this task is to partition the set of result-ing security risks from sub-process 4 of the AORDD security assessment activityinto the subset of security risks that must be treated and the subset of securityrisks that can be discarded from further consideration. An example of a securityrisk acceptance criteria used to partition risk levels is that all risks with levelsgreater than or equal to risk level �HIGH�must be treated. In this context treatedmeans reducing the risk level to lower than �HIGH�. Note that in this exampleall security risks with the risk level lower than �HIGH� are disregarded and notincluded in the trade-o¤ analysis performed in Phase 2 of the AORDD securitysolution trade-o¤ analysis. Also note that the security risk acceptance criteriashould be formatted to be comparable with the security risks, as discussed ear-
13.2 Phase 2: Trade-o¤ analysis 105
lier. For example if the security risks are given in terms of a risk matrix usingthe qualitative risk level scale {low, medium, high, extreme, catastrophic}, thesecurity risk acceptance criteria should preferable also be given according to thisscale. If that is not possible the acceptance criteria must be interpreted or trans-formed before they can be used to separate the acceptable security risks from theunacceptable security risks. Similarly, for quantitative security risk measures thesecurity risk acceptance criteria should be expressed as a comparable quantitativevalue of acceptable risk level. The same goes for risk models producing measuressuch as statistical expected loss where the security risk acceptance criteria shouldpreferable be expressed as maximum and minimum acceptable statistical loss.
� NSR = SR \ SAC (13.3)
� ASR = SR� SR \ SAC (13.4)
where NSR is the set of non-acceptable security risks, ASR is the set of accept-able security risks, SR is the set of security risks and SAC is the set of securityacceptance criteria.
13.2 Phase 2: Trade-o¤ analysis
Phase 2 of the AORDD security solution trade-o¤analysis concerns the evaluationand choice of security solutions from a set of alternatives. This covers sub-process5; the risk treatment sub-process, of the AORDD security assessment activitydiscussed in Chapter 11 and are called trade-o¤ analysis as it is in this phasethat the alternative security solutions are traded o¤. The main goal of Phase 2is to identify and evaluate alternative security solutions to the resulting list ofsecurity risks from Phase 1 and the expected output is a rated list of securitysolutions for each of the security risks transferred from Phase 1. It is this ratedlist that the decision maker uses as support when deciding on which securitysolution to employ in the ToE. More details are given in Houmb et al. (2005) [44]enclosed as Appendix B.3.
The task of Phase 2 in relation to security assessment is to handle risk treat-ment. Risk treatment is an activity that is included in most security assessmentapproaches, such as the CORAS approach and CRAMM. However, there is onemain di¤erence between the risk treatment strategy of the AORDD security so-lution trade-o¤ analysis and other security assessment approaches and this is thedetailed and structured support for dynamically trading o¤ alternative security
106 13. AORDD Security Solution Trade-O¤ Analysis
solutions based on security perspectives and development, project and �nancialperspectives. Actually, the AORDD security solution trade-o¤ analysis focusesonly on the risk treatment part of a security assessment.
In the following the activities of sub-process 5 is given and the concepts involvedin Phase 2 of the AORDD security solution trade-o¤ analysis is discussed. Theactivities of sub-process 5 of the security assessment activity in the AORDDprocess are the following:
� Sub-process 5: Risk treatment
�Activity 5.1: Identify alternative security solutions and group these into se-curity solution sets
�Activity 5.2: Identify e¤ect and cost of all alternative security solutions
�Activity 5.3: Model all security solutions as security solution aspects usingRDD modelling elements
�Activity 5.4: Compose security aspects with primary model and composeRDD information
�Activity 5.5: Evaluate and �nd the best-�tted security solution or set ofsecurity solutions using the AORDD security solution trade-o¤ analysis
Activity 5.1 identi�es alternative security solutions to one or more of the securityrisks transferred from Phase 1. In the AORDD framework this activity is partlyhandled by the security aspect repository, which stores experience from earliersecurity solution decision situations and partly by domain knowledge and sub-jective expert judgment. However, this activity is often not straightforward. SeeHoumb et al. (2006) [48] in Appendix B.2 and Georg, Houmb and Ray (2006)[35] for details.
The way activity 5.1 is performed in practice is to �rst identify the alternativesecurity solutions, then check to what degree each security solution meets theexpected security requirements, before verifying that the security solution doesnot contain �aws or vulnerabilities and that all involved security requirementsstill holds also after each security solution is employed in the ToE and �nallythat the core functionality of the ToE is not substantially a¤ected. This is donefor all security risks in the outputted list of security risks from Phase 1 and usedto identify alternative sets of security solutions. In this context a set of securitysolutions is one unique con�guration of security solutions that together solvessome or all security risks in the resulting list of security risks from Phase 1.As security solutions often are not independent of each other the dependenciesbetween the security solutions in a set must also be considered. This is discussedto some degree in Matheson, Ray, Ray and Houmb (2005) [22]. Note that it

13.2 Phase 2: Trade-o¤ analysis 107
is also possible to evaluate security solutions for one security risk at the time.Note also that the sub activities of activity 5.1 is handled by other parts ofthe AORDD framework and in particular the RDD annotation rules for securityrisk and security solution variable estimation, the UMLsec security veri�cationtechnique of Jürjens [67] and AOM composition techniques, such as that discussedin Straw et al. (2004) [98].
In activity 5.2 the associated cost and treatment e¤ect of each security solutionidenti�ed in activity 5.1 is examined and estimated. Note that both the securitysolution cost and the security solution e¤ect are variables to the trade-o¤ analysisin Phase 2, as shown in Figure 13.9. As the values of these variables in manycases is unknown or at least uncertain they need to be estimated. In the AORDDframework the treatment e¤ects of a security solution is assessed using AOMcomposition, as discussed in Georg, Houmb and Ray (2006) [35]. In addition tothe AOM composition subjective expert judgment and domain knowledge can beused to assess this variable. The security solution cost is often harder to estimateas there are many factors involved in estimating cost of future events. The latteris further elaborated on in Section 13.2.3.
In activity 5.3 each security solution is modelled as a UML security solutionaspect and annotated with RDD modelling elements. The RDD modelling ele-ments relevant for Phase 2 are the misuse and security solution variables shownin Figure 13.8. Details on the RDD UML Pro�le can be found in Houmb, Georg,France, Reddy and Bieman (2005) [43], Georg, Houmb and Ray (2006) [35] andGeorg, Houmb and France (2006) [36]. Note that the terms in Figure 13.8 havebeen de�ned earlier and are given in complete in Appendix A; AORDD concepts.
In activity 5.4 the security solution aspects are composed with the core func-tionality of the ToE and the e¤ects that each security solution has on the ToEare observed. The RDD information in the security solution aspects and the pri-mary model for the ToE is also composed, as discussed in Georg, Houmb andRay (2006) [35]. To validate that no new design �aws or other vulnerabilities hasemerged as a direct or indirect result of the composition, it is necessary to followall composition activities with testing and veri�cation activities. This issue isdiscussed in some detail in Houmb et al. (2005) [44] in Appendix B.3 and Georg,Houmb and Ray (2006) [35].
In activity 5.5, each of the security solutions are evaluated in terms of their �tnessto the decision factors involved in a particular security solution decision situation.These factors are called the decision criteria and examples of such are the secu-rity requirements that the security solutions need to meet and the development,project and �nancial perspectives that the ToE must adhere to. The main aimof this activity is to derive the �tness score for each alternative security solutionor each security solution set in terms of the above mentioned decision criteria.
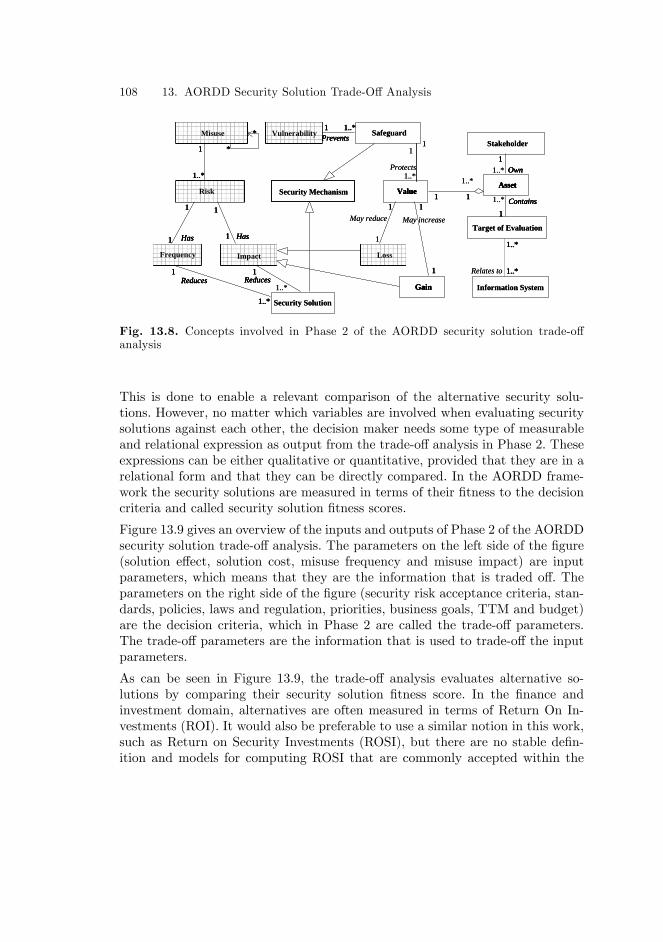
108 13. AORDD Security Solution Trade-O¤ Analysis
Vulnerability
AssetValue
Stakeholder
Risk
Frequency Loss
Target of Evaluation
Safeguard
Impact
Information System
Unwanted Incident
GainReduces
1..*
*
*1
1Prevents
1..*
1Reduces
1
1
1 Has1
1
1..*
Has
1..*
May reduce1
1
1..* Own1
1
1
1..*1 11
1
Contains
May increase
1..*
1..*
1..*Relates to
Security Mechanism
Vulnerability
AssetValueRisk
Frequency LossImpact
Security Solution
Misuse
GainReduces
1..*
*
*1
1Prevents
1..*
1Reduces
1
1
1 Has1
1
1..*
Has
1
OwnProtects1
1
1
1 11
1
Contains
1..*
1..*
1..*
Vulnerability
AssetValue
Stakeholder
Risk
Frequency Loss
Target of Evaluation
Safeguard
Impact
Information System
Unwanted Incident
GainReduces
1..*
*
*1
1Prevents
1..*
1Reduces
1
1
1 Has1
1
1..*
Has
1..*
May reduce1
1
1..* Own1
1
1
1..*1 11
1
Contains
May increase
1..*
1..*
1..*Relates to
Security Mechanism
Vulnerability
AssetValueRisk
Frequency LossImpact
Security Solution
Misuse
GainReduces
1..*
*
*1
1Prevents
1..*
1Reduces
1
1
1 Has1
1
1..*
Has
1
OwnProtects1
1
1
1 11
1
Contains
1..*
1..*
1..*
Fig. 13.8. Concepts involved in Phase 2 of the AORDD security solution trade-o¤analysis
This is done to enable a relevant comparison of the alternative security solu-tions. However, no matter which variables are involved when evaluating securitysolutions against each other, the decision maker needs some type of measurableand relational expression as output from the trade-o¤ analysis in Phase 2. Theseexpressions can be either qualitative or quantitative, provided that they are in arelational form and that they can be directly compared. In the AORDD frame-work the security solutions are measured in terms of their �tness to the decisioncriteria and called security solution �tness scores.
Figure 13.9 gives an overview of the inputs and outputs of Phase 2 of the AORDDsecurity solution trade-o¤ analysis. The parameters on the left side of the �gure(solution e¤ect, solution cost, misuse frequency and misuse impact) are inputparameters, which means that they are the information that is traded o¤. Theparameters on the right side of the �gure (security risk acceptance criteria, stan-dards, policies, laws and regulation, priorities, business goals, TTM and budget)are the decision criteria, which in Phase 2 are called the trade-o¤ parameters.The trade-o¤ parameters are the information that is used to trade-o¤ the inputparameters.
As can be seen in Figure 13.9, the trade-o¤ analysis evaluates alternative so-lutions by comparing their security solution �tness score. In the �nance andinvestment domain, alternatives are often measured in terms of Return On In-vestments (ROI). It would also be preferable to use a similar notion in this work,such as Return on Security Investments (ROSI), but there are no stable de�n-ition and models for computing ROSI that are commonly accepted within the

13.2 Phase 2: Trade-o¤ analysis 109
Tradeoff parameters
TradeOffAnalysis
Budget
TimeToMarket (TTM)
Security acceptance criteria
Priorities
Misuse impact
Misuse frequency
METM
MTTM
Risk level variables
Security solution variables
Security solution effect
Security solution cost
Security SolutionFitness Score
Tradeoff parameters
TradeOffAnalysis
Budget
TimeToMarket (TTM)
Security acceptance criteria
Priorities
Misuse impact
Misuse frequency
METM
MTTM
Risk level variables
Security solution variables
Security solution effect
Security solution cost
Security SolutionFitness Score
Fig. 13.9. The input and outputs of Phase 2 of the AORDD security solution trade-o¤analysis
security domain and those that exist does not cover the necessary factors in-volved in this work. In this work it is not su¢ cient to only consider the �nancialperspectives, as the �tness score is rather an aggregate of the abilities of a secu-rity solution to meet all relevant perspectives. These perspectives are the abovementioned decision criteria and expressed as security requirements and project,development and �nancial perspectives, such as TTM, budget constraints, lawsand regulations, policies, etc.
However, before the abilities of a security solution can be evaluated, the inputvariables to the trade-o¤ analaysis, such as the misuse impact and security so-lution e¤ect, must be estimed. In the AORDD framework misuse impact andsecurity solution e¤ect is measured in terms of their in�uence on the values ofthe system assets. Thus, before the input variables to the trade-o¤ analysis canbe estimated the system assets must be identi�ed and valued. This is done insub-process 1 of the AORDD security assessment activity, as discussed in Chap-ter 11. In the following the relationship between the asset values and the misuseimpact and security solution e¤ect is discussed.

110 13. AORDD Security Solution Trade-O¤ Analysis
13.2.1 Identifying and assigning values to assets
To estimate the misuse impact and the security solution e¤ect the system assetsneeds to be identi�ed and assigned values to. This is done as part of the contextidenti�cation (sub-process 1) in the AORDD security assessment activity andmore speci�cally activity 1.4. As it is the stakeholders that assign values to theassets, the relationship between assets and stakeholders and the scope of theassessment also needs to be determined. These issues are all taken care of insub-process 1 of the AORDD security assessment activity.
� Sub-process 1: Context identi�cation�Activity 1.1: Identify purpose and scope of assessment
�Activity 1.2: Describe the target of evaluation (ToE), business perspectivesand the security environment
�Activity 1.3: Identify system stakeholders
�Activity 1.4: Identify assets and have stakeholders assign values to assets
�Activity 1.5: Describe the asset-stakeholder graph
�Activity 1.6: Describe relevant security policies (SP)
�Activity 1.7: Identify and describe the security risk acceptance criteria (SAC)
Assets relate to the ToE and the ToE is parts of or the complete informationsystem that is being assessed. Note that a ToE can include anything from hard-ware to humans. However, in this context assets are entities that are of securityinterest, meaning that some stakeholder is interested in that the con�dentiality,integrity, availability, authenticity, accountability, non-repudiation or reliabilityattributes of the entity is preserved at a particular level. This level refers to thedesired asset value. To simplify the asset valuation the AORDD framework pro-vides asset categories and some asset valuation guidelines. The asset categories inthe AORDD framework are modi�ed from CRAMM to �t the AORDD securitysolution trade-o¤ analysis and includes the following: personal safety, personalinformation, company information, legal and regulatory obligations, law enforce-ment, commercial and �nancial interest, company reputation, business strategy,business goals, budget, physical, data and information, organisational aspects,software and other. Below is a short description of each asset category, alongwith some examples of each. More details are in the CRAMM toolkit (infor-mation can be found at http://www.cramm.com) and the CRAMM user guide[103].
Personal safety assets are entities that a¤ect the well-being of humans. Examplesof such include applications that handles medical records, such as a Telemedicine

13.2 Phase 2: Trade-o¤ analysis 111
system that either transfers, stores or processes sensitive medical information, airtra¢ c control applications etc.
Personal information assets are pieces of information in the ToE that one or morestakeholders consider to be of a private or sensitive character. Examples of suchinclude salary, age, health-related information, bank account number, liquidityand other similar types of information.
Company information assets are pieces of information in the ToE that a companyconsiders to be sensitive and of a company con�dential character. Examples ofsuch includes user credentials for accessing business critical systems such as user-name and passwords, business results that are not public, liquidity and othersimilar types of information.
Legal and regulatory obligations assets are entities that are a¤ected or controlledby legal and regulatory body. Examples of such are the tra¢ c information ina Telecommunication network in Norway, which is regulated by Ekomloven andcontrolled by Post- og Teletilsynet.
Law enforcement assets are entities that is a¤ected or regulated by law. Ex-amples of such are the EU data retention directive (2006/24/EC) [28], whichenforces retention of tra¢ c and subscriber data for Police crime investigationsfor Telecommunication providers. The Directive determines the date when all af-fected providers of services, as speci�ed in the Directive, must provide a solutionthat meets the requirements stated in the Directive. In this case both the infor-mation systems involved and the information stored, by these systems might beconsidered as assets.
Commercial and �nancial interest assets are entities that are of value to ensurethe �nancial stability of a company. Examples of such include stock exchangerelated information, quarterly results before they are public etc.
Company reputation assets are entities that might lead to a reduction in thecompany reputation if they are revealed to unauthorised parties. Examples ofsuch include security incident reports, information on identity theft from theircustomer database, etc.
Business strategy assets are entities that in some way are critical for the dayto day execution and maintenance of the business strategy. Examples of suchincludes business process descriptions, internal control etc.
Business goals assets are entities that in some way are critical for the achievementof the business goals. This is di¤erent from the business strategy in that the goalis the description of what the company strives to achieve in short and long-term while the business strategy is the tool used to achieve the business goals.Examples of such include business goal description of various types.

112 13. AORDD Security Solution Trade-O¤ Analysis
Budget assets are entities that in some way are related to the budget of a companyor speci�c parts of a company. Examples include any information used to derivethe budget for the di¤erent parts of a company, details on the budget process etc.
Physical assets are entities that represent physical infrastructure that the com-pany owns or in some way have at their disposal. Examples include buildings,servers, routers, workstations, network cables etc.
Data and information assets are entities in the data and information set con-tained or controlled by a company with some value to one or more stakeholders.Examples include identities of the customers, information on which products cus-tomers have procured and when, health-related information, billing informationetc.
Organisational aspects assets are entities that in some way denote or representthe how, who, when and why for an organisation and that are of some value toone or more stakeholders. Examples of such are the structure of an organisation,issues related to restructuring of the organisation, the day to day work processesin the organisation etc.
Software assets are entities that are contained in the software portfolio of a com-pany. Examples of such are domain speci�c applications, software licenses, in-house code and components etc.
The asset category �other� covers all entities that have some value to one ormore stakeholders and that are not naturally contained in the above mentionedcategories. Examples of such could be entities that are comprised of two or moreasset categories. For more information on assets and how to specify and groupassets, the reader is referred to CRAMM [103] and CORAS [20]. Some details onhow to value assets is given in the following.
Asset valuation and asset valuation categories. For all asset categories inthe AORDD framework, the asset valuation is given according to the seven secu-rity attributes con�dentiality, integrity, availability, authenticity, accountability,non-repudiation and reliability. Hence, the asset value for each asset are derivedby summing over all values for all security attributes.
AV j=7Xi=1
avi (13.5)
where AV is the asset value for asset number j, avi is the security attribute valuefor security attribute number i and i denotes the security attribute for which thevalue is given for.

13.2 Phase 2: Trade-o¤ analysis 113
Table 13.1. Example asset value table
AssetValue
Commercial and Economic Interests
1 Of interest to a competitor but of no com-mercial value
2 Of interest to a competitor with a value ofNOK10,000 or less
3 Of value to a competitor of the sizeNOK10,001 to NOK100,000
4 Of value to a competitor of the sizeNOK100,001 to NOK1,000,000
5 Of value to a competitor of the sizeNOK1,000,001 to NOK10,000,000
6 Of value to a competitor of the size morethan NOK 10,000,000
7 Could substantially undermine economic andcommercial interests
8 No entry
9 Would be likely to cause substantial materialdamage to economic and commercial inter-ests
10 Would be likely to cause severe long-termdamage to the economy of the company
It is the stakeholders of a ToE that assigns the values to the ToE assets. This taskis however sometimes di¢ cult to perform in practice. To make the asset valuationfeasible for the stakeholders the AORDD framework allows the stakeholder tointerpret the asset value as: the degree of importance that the preservation ofeach of the security attributes has for a particular asset. To further assist thestakeholder, the AORDD framework has adopted two asset valuation schemes:(1) asset values on the scale 1-10 and (2) asset values on the qualitative scale{low, medium, high}. The �rst is the asset valuation scheme used in CRAMM,only modi�ed to �t the AORDD framework. Table 13.1 shows a modi�ed versionof the CRAMM asset valuation table for the asset category �Commercial andeconomic interests�. More details are given in the CRAMM toolkit and CRAMMuser guide [103].
Type 2 asset valuation schema involves valuing an asset in relation to a qualitativescale. An example of such is when each stakeholder assigns a qualitative value foreach security attribute according to an appropriate qualitative scale, such as for

114 13. AORDD Security Solution Trade-O¤ Analysis
Table 13.2. Example of qualitative scale evaluation
Name Value
Stakeholder x
Stakeholder category Decision-maker
Asset password
Asset category Data and information
Asset value con�dentiality high
Asset value integrity medium
Asset value availability low
Asset value authenticity N/A
Asset value accountability N/A
Asset value non-repudiation low
Asset value reliability N/A
example {low, medium, high}. Table 13.2 shows an example of a qualitative scaletype valuation for Stakeholder x. As can be seen in the table stakeholders arealso assigned to stakeholder categories. This is done to ease the risk evaluationactivities in the risk-driven analysis of Phase 1 of the following developmentiterations. Recall that Phase 1 of the AORDD security solution trade-o¤ analysisdeals with prioritising security risks. Recall also that the AORDD process isiterative, which means that several iterations of the activities involved in Phase1 and Phase 2 is usually undertaken during a development using the AORDDprocess, as described in Chapter 11.
The result of the asset valuation activity is a set of tables like Table 13.2 foreach stakeholder. As the asset values are not always given as quantitative valuesand as there often are more than one stakeholder involved in the asset valuation,Equation 13.5 can often not be directly applied to derive the asset value foran asset. Thus, the sets of tables must be aggregated for each asset over allstakeholders. In the AORDD framework a simple asset value aggregation schemawhere set by set of asset values from the stakeholder are inserted and combinedby taking the arithmetic average for quantitative asset values or the medianfor qualitative asset values is used, as illustrated in Figure 13.10. The result isone asset value table, which is a composite of the aggregated asset values fromthe set of stakeholders involved. In addition, the stakeholders may have di¤erenttrustworthiness associated with them. This is discussed further in the presentationof the trade-o¤ tool in Chapter 15 and the trust-based information aggregationschema described in Part 5.

13.2 Phase 2: Trade-o¤ analysis 115
Personal safety Personal information Company informationLegal and regulatory obligations Law enforcement
Commercial and economical interestCompany reputationBusiness strategy Business goals Budget Physical
Data and informationOrganisational aspects Software Other
Asset Value Table
Personal safety Personal information Company informationLegal and regulatory obligations Law enforcement
Commercial and economical interestCompany reputationBusiness strategy Business goals Budget Physical
Data and informationOrganisational aspects Software Other
Asset Value Table
Fig. 13.10. Asset value table as a composite of the 15 asset valuation categories (subvariables)
13.2.2 Misuse impact and security solution e¤ect and their relationto asset value
Misuse impact and security solution e¤ect is measured using the same scale asthe valuation scale used for valuing the assets that these a¤ect. If the same scaleis not used either the asset value or the misuse impact and the security solutione¤ect value must be transformed so that they can be compared. However, thereader should be aware of the problems involved in transforming values into ascale di¤erent from their original one.
Figure 13.11 illustrates the 15 misuse impact categories. As for asset valuationtwo types of misuse impact scales are used and these are (1) quantitative scalefrom 1-10 in terms of seriousness and (2) the qualitative scale {low, medium,high}. In the trade-o¤ tool discussed in Chapter 15 misuse impact is representedas a value with the 15 misuse impact categories as sub-variables where all can bein either the state {low, medium, high} or a number in the range [1; 10].
As can be seen in Figure 13.11, the set of misuse impact sub-variable is aggregatedinto the misuse impact table. This aggregation is done for each asset that themisuse has an impact on. The resulting misuse impact is then aggregated withthe original asset values for each a¤ected asset to derive the updated asset value,as illustrated in Figure 13.12. The aggregation technique used depends on thetype of values given. If the asset value and misuse impact are given according a

116 13. AORDD Security Solution Trade-O¤ Analysis
Personal safety
Personal information
Company information
Legal and regulatory obligationsLaw enforcement
Commercial and economical interest
Company reputationBusiness strategy
Business goalsBudgetPhysical
Data and informationOrganisational aspects Software
Other
Personal safety
Personal information
Company information
Legal and regulatory obligationsLaw enforcement
Commercial and economical interest
Company reputationBusiness strategy
Business goalsBudgetPhysical
Data and informationOrganisational aspects Software
Other
Fig. 13.11. The 15 misuse impact sub variables and how to aggregate these into themisuse impact table
qualitative scale the rule is such that the lowest value of the two becomes theresulting asset value. For example, if the original asset value is �medium�and themisuse impact is �low�the result is a decrease in the asset value from �medium�to �low�. If the quantitative scale is used the arithmetic average is used as theaggregation technique.
Security solutions are introduced to prevent, reduce or detect and act on thepotential decrease in asset value caused by a misuse. These solutions protect theassets of the ToE by either preventing the associated security threat, by removingthe vulnerability that the security threat exploits or by doing a combination ofpreventing and removing so that the impact of a potential misuse is reduced toan acceptable level. The e¤ects of these security solutions are therefore measuredin terms of regaining the asset value. Figure 13.13 shows the 15 security solutionimpact sub-variables and how these are aggregated into the security solutione¤ect table. The aggregation of the solution e¤ect sub-variables is performed inthe same way as for the misuse impact sub-variables.
The asset value reduction caused by the misuse impact brings the asset value toan unacceptable level and a security solution needs to be employed to bring theasset value back to an acceptable level. This is done by applying the values in thesecurity solution e¤ect table on the updated asset value table from Figure 13.12.The result is an reupdated asset value table, as shown in Figure 13.14.

13.2 Phase 2: Trade-o¤ analysis 117
Personal safety Personal information Company informationLegal and regulatory obligations Law enforcement
Commercial and economical interestCompany reputationBusiness strategy Business goals Budget Physical
Data and informationOrganisational aspects Software Other
Asset Value Table
PersonalsafetyPersonalinform
ation
Com
panyinform
ation
Legal andregulatory
obligationsLaw
enforcement
Com
mercialand
economicalinterest
Com
panyreputation
Business
strategyB
usiness goalsB
udgetPhysical
Data and
information
Organisationalaspects
Software
Other
UpdatedAsset Value Table
Personal safety Personal information Company informationLegal and regulatory obligations Law enforcement
Commercial and economical interestCompany reputationBusiness strategy Business goals Budget Physical
Data and informationOrganisational aspects Software Other
Asset Value Table
Personal safety Personal information Company informationLegal and regulatory obligations Law enforcement
Commercial and economical interestCompany reputationBusiness strategy Business goals Budget Physical
Data and informationOrganisational aspects Software Other
Asset Value Table
PersonalsafetyPersonalinform
ation
Com
panyinform
ation
Legal andregulatory
obligationsLaw
enforcement
Com
mercialand
economicalinterest
Com
panyreputation
Business
strategyB
usiness goalsB
udgetPhysical
Data and
information
Organisationalaspects
Software
Other
UpdatedAsset Value Table
Fig. 13.12. The relation between misuse impacts, the original asset values and theresulting updated asset value table
13.2.3 Misuse and security solution costs
Misuse cost is usually harder to estimate than security solution costs as it isoften easier to see the potential costs of alternative solutions than to estimatethe potential cost if a misuse occurred. A security solution has a procurementcost, licence cost and maintenance cost while misuses often have costs outsideof what is obvious and a¤ects the resource usage to a larger degree than ancontrolled introduction of a security solution. This work has not examined factorsin�uencing the misuse cost in detail and have adopted the simplistic version ofmisuse cost estimation approach described in Sonnenreicht et al. (2006) [93].
In the AORDD framework misuse costs are measured in terms of one cost vari-able, namely productivity while security solution cost is measured using the four

118 13. AORDD Security Solution Trade-O¤ Analysis
Personal safety
Personal information
Company information
Legal and regulatory obligationsLaw enforcement
Commercial and economical interest
Company reputationBusiness strategy
Business goalsBudgetPhysical
Data and informationOrganisational aspects Software
Other
Personal safety
Personal information
Company information
Legal and regulatory obligationsLaw enforcement
Commercial and economical interest
Company reputationBusiness strategy
Business goalsBudgetPhysical
Data and informationOrganisational aspects Software
Other
Fig. 13.13. The 15 security solution e¤ect sub variables and how to aggregate theseinto the security solution e¤ect table
cost variables: procurement, employment, maintenance and productivity. Pro-curement cost covers all expenses related to procuring a security solution and in-volves the initial price for the security solution, cost associated with the necessarysoftware licences, cost of regular software updates, cost of support agreement etc.Employment cost targets the phase between procurement and the normal opera-tion of the security solution and covers all factors related to installing and productclearance of the security solution. This includes time, resources and budget nec-essary for tailoring the security solution to the ToE and its security environment.Maintenance cost targets the phase after the security solution is completely em-ployed in its operational environment and until it is taken out of production. Thismeans that this cost category covers the day-to-day operation and maintenanceand includes costs such as the resources needed for maintenance, expected timethat the system need to be down or run with reduced capabilities due to regularupdates etc. Productivity is measured as described in Sonnenreicht et al. (2006)[93] and targets the extra hassle that comes as a result of either the occurrence ofa misuse or the introduction of a security solution. As done in [93] the estimationof the time and thus money spent on reduced productivity is measured using aset of categories that are combined into misuse cost and security solution costrespectively.
For misuse costs the following categories are supported in the AORDD framework:

13.2 Phase 2: Trade-o¤ analysis 119
Pers
onal
safe
tyPe
rson
alin
form
atio
n
Com
pany
info
rmat
ion
Lega
l and
regu
lato
ryob
ligat
ions
Law
enfo
rcem
ent
Com
mer
cial
and
econ
omic
alin
tere
stC
ompa
nyre
puta
tion
Bus
ines
sst
rate
gyB
usin
ess
goal
sB
udge
tPh
ysic
alD
ata
and
info
rmat
ion
Org
anis
atio
nala
spec
tsSo
ftwar
e
Oth
er
Personal safety Personal information Company informationLegal and regulatory obligations Law enforcement
Commercial and economical interestCompany reputationBusiness strategy Business goals Budget Physical
Data and informationOrganisational aspects Software Other
Asset Value Table
PersonalsafetyPersonalinform
ation
Com
panyinform
ation
Legal andregulatory
obligationsLaw
enforcement
Com
mercialand
economicalinterest
Com
panyreputation
Business
strategyB
usiness goalsB
udgetPhysical
Data and
information
Organisationalaspects
Software
Other
UpdatedAsset Value Table
ReupdatedAsset Value Table
Pers
onal
safe
tyPe
rson
alin
form
atio
n
Com
pany
info
rmat
ion
Lega
l and
regu
lato
ryob
ligat
ions
Law
enfo
rcem
ent
Com
mer
cial
and
econ
omic
alin
tere
stC
ompa
nyre
puta
tion
Bus
ines
sst
rate
gyB
usin
ess
goal
sB
udge
tPh
ysic
alD
ata
and
info
rmat
ion
Org
anis
atio
nala
spec
tsSo
ftwar
e
Oth
er
Personal safety Personal information Company informationLegal and regulatory obligations Law enforcement
Commercial and economical interestCompany reputationBusiness strategy Business goals Budget Physical
Data and informationOrganisational aspects Software Other
Asset Value Table
Personal safety Personal information Company informationLegal and regulatory obligations Law enforcement
Commercial and economical interestCompany reputationBusiness strategy Business goals Budget Physical
Data and informationOrganisational aspects Software Other
Asset Value Table
PersonalsafetyPersonalinform
ation
Com
panyinform
ation
Legal andregulatory
obligationsLaw
enforcement
Com
mercialand
economicalinterest
Com
panyreputation
Business
strategyB
usiness goalsB
udgetPhysical
Data and
information
Organisationalaspects
Software
Other
UpdatedAsset Value Table
ReupdatedAsset Value Table
Fig. 13.14. The relation between asset value, misuse impact and security solution e¤ect
� Application and system related crashes
� Email �ltering sorting and spam� Bandwidth e¢ ciency and throughput� Ine¢ cient and ine¤ective security policies� Enforcement of security policies� System related rollouts and upgrades from IT
� Security patches for OS and applications� Insecure and ine¢ cient network topology� Virus and virus scanning� Worms

120 13. AORDD Security Solution Trade-O¤ Analysis
� Trojan horses and key logging� Spyware and system trackers
� Popups� Compatibility issues (hardware and software)� Permission based security problems (e.g. usernames and passwords)� File system disorganisation
� Corrupt or inaccessible data� Hacked or stolen system information and data
� Backup and restore� Application usage issues
For security solutions the following cost categories are supported in the AORDDframework:
� Application and system related crashes
� Bandwidth e¢ ciency and throughput� Over-restrictive security policies� Enforcement of security policies� System related rollouts and upgrades from IT
� Security patches for OS and applications� Trouble downloading �les due to virus scanning� Compatibility issues (Hardware and Software)� Too many passwords or other permission security problems
For each of these categories an estimate of the time spent related to either amisuse or a security solution needs to be estimated. As it might be di¢ cultto estimate the time as a quantitative value both cost values can be estimatedboth quantitatively and qualitatively. This is the same as for misuse impact andsecurity solution e¤ect and thus the same aggregation techniques apply.

14. Structure of the AORDD Security SolutionTrade-O¤Analysis
The structure of the underlying trade-o¤ analysis method and procedure for theAORDD security solution trade-o¤ analysis are such that they are easy to tai-lor, change and maintain. This �exibility is necessary to easily incorporate anyupdates from experience gained during the use of the AORDD security solutiontrade-o¤ analysis. To ensure the required level of �exibility, the trade-o¤ analysismethod and procedure are built as a set of replaceable sub-components groupedinto levels that are linked together through interfaces in such a way that the con-tent of each level is independent of each other provided that the required outputis delivered accordingly. This means that components can be changed indepen-dently of each other while interfaces are dependent on the outputs provided fromthe lower level and the inputs required by the higher level and thus are depen-dent on these two types of information. For example, a component in one of thelayers of the trade-o¤ method can be replaced without having to update otherparts of the method provided that no interfaces are changed, but if an interfaceis changed, all components associated with the interface might be a¤ected.
Figure 14.1 illustrates the component-wise and hierarchical step-by-step structureof the underlying trade-o¤ method of Phase 2 of the AORDD security solutiontrade-o¤ analysis. The structure consists of four levels and follows the seven steptrade-o¤ procedure described below. The AND gates in Figure 14.1 mean thatall information coming in at the incoming arches are combined. The outgoingarches from an AND gate carries the result of the combination of the incominginformation to the next level in the analysis. Each of the squares in Figure 14.1represents a set of information, such as the set of information that contributes tothe static security level. As the trade-o¤ tool directly implements the structureof the trade-o¤ analysis as shown in Figure 14.1 details of the content of eachcomponent and how information are AND-combined are described in relation tothe trade-o¤ tool in Chapter 15.
The seven step trade-o¤ procedure is as follows.
Step 1: Estimate the input parameters in the set I whereI = fMI;MF;MTTM;METM;MC;SE; SCg and MI is misuse impact, MF

122 14. Structure of the Trade-O¤ Analysis
Level 3
Level 4
Static SecurityLevel
“Current”Security Level
Level 1
SolutionTreatment Level
AND
AND
TreatmentEffect and Cost
Level 2
TradeOffParameters
AND
Level 3
Level 4
AND
AND
TreatmentEffect and Cost
Level 2
TradeOffParameters
AND
Level 3
Level 4Security SolutionFitness Score
Risk Level
Level 3
Level 4
Static SecurityLevel
“Current”Security Level
Level 1
SolutionTreatment Level
AND
AND
TreatmentEffect and Cost
Level 2
TradeOffParameters
AND
Level 3
Level 4
AND
AND
TreatmentEffect and Cost
Level 2
TradeOffParameters
AND
Level 3
Level 4Security SolutionFitness Score
Risk Level
Fig. 14.1. Overview of the structure and the step by step procedure of the trade-o¤analysis
is misuse frequency, MTTM is mean time to misuse, METM is mean e¤ortto misuse, MC is misuse cost, SE is security solution e¤ect and SC is securitysolution cost. The output from Phase 1 of the trade-o¤ analysis is a set of secu-rity risks in need of treatment. A security risk is a composite of misuse, misusefrequency, misuse impact, MTTM and METM and a particular security risk isthe unique combination of exactly one misuse, one misuse frequency, one misuseimpact, one MTTM and one METM. The misuse cost denotes the �nancial andother costs that comes as a direct or indirect consequence of the misuse and ishandled separate from the other misuse variables. The security solution e¤ect andcost are derived in activities 5.1 and 5.2 of the AORDD security assessment ac-tivity and are part of Phase 2 of the AORDD security solution trade-o¤ analysis,as described in Section 13.2.

14. Structure of the Trade-O¤ Analysis 123
Step 2: Estimate the static security level by examining the relevant factors fromthe development of the ToE according to the security assurance componentsin Common Criteria Part 3 and the asset values of the involved ToE assets asdescribed in Section 13.2.1. Note that it is the assurance components in Com-mon Criteria Part 3 that is used and not the security functional components ofCommon Criteria Part 2. Recall that Common Criteria Part 2 and Part 3 areindependent and that Part 2 contains classes of security functional componentsthat address di¤erent factors of applying proper security functions to a system.Hence, this part provides support for the selection and composition of securitysolutions in a system. Common Criteria Part 3 however describes a set of classesof security assurance components that are used by an evaluator in a CommonCriteria evaluation to establish the necessary con�dence in the security level of asystem. This is done through examining the resulting ToE or ToE design and thedevelopment documentation provided by the developer. This is the same strat-egy for evaluating software quality as is used in the safety standards IEC 61508Functional Safety of Electrical/Electronic/Programmable Electronic (E/E/PE)Safety-Related Systems [51] and DO-178B: Software Considerations in AirborneSystems and Equipment Certi�cation [89]. Similarly to the Common Criteriathese two standards determine the quality of the end-product by examining theactivities involved in the development. As standards tend to neither be easilyaccessible nor easy to interpret and employ in practice tools and methodologysupport are often helpful. An example of such for DO-178B is given in Gran(2002) [40], which describes a BBN topology for safety assessment of softwarebased systems to support the DO-178B evaluation approach.
Step 3: Estimate the operational risk level using appropriate security assess-ment methods and models such as the availability prediction model describedin Houmb, Georg, France, Reddy and Bieman (2005) [43]. This prediction modelis tailored for estimating the level of availability for an information system or ToEbut is applicable for estimating other security attributes as well. In the trade-o¤analysis method, the prediction model is extended to include variables relatedto Common Criteria Part 2, such as attacker abilities, in addition to METM,MTTM, MF and MI. Figure 14.2 shows the variables involved when estimatingthe risk level of a ToE in the trade-o¤ analysis method for the AORDD securitysolution trade-o¤ analysis.
As can be seen in Figure 14.2 the operational risk level is derived by combiningthe existing security controls according to the recommendations in Common Cri-teria Part 2, the security risks identi�ed in the risk-driven analysis of Phase 1 ofthe AORDD security solution trade-o¤ analysis and the operational security levelas described in Littlewood et al. (1993) [74]. It is important to note however thatthe main factor that separates the operational risk level from the static security

124 14. Structure of the Trade-O¤ Analysis
Securityrisks
Risk Level
ExistingSafeguards
Operationalsecurity level
Misusescenario
Misusefrequency MTTM METM
Attackerabilities
Attackermotivation and
motive
Attackerresources
Attackerskills
Misuseimpact
Securityrisks
Risk Level
ExistingSafeguards
Operationalsecurity level
Misusescenario
Misusefrequency MTTM METM
Attackerabilities
Attackermotivation and
motive
Attackerresources
Attackerskills
Misuseimpact
Fig. 14.2. Variables involved in estimating the risk level of a ToE in the trade-o¤analysis method
level in the trade-o¤ analysis method is that the static security level expressesthe risk level associated with the development activities while the operationalrisk level expresses the security level of the ToE and its security environment inits operational environment. Thus, the static security level makes use of the ideaof quality through development activities while the risk level targets the securitylevel of the end-product employed in its security environment. Note that bothfuture events and current events relevant for the operational risk level can be es-timated when the subjectivistic approach is applied. Details on the subjectivisticapproach is given in Chapter 7.
The operational security measures included in the trade-o¤ analysis method arethe Mean Time To Misuse (MTTM), the Mean E¤ort To Misuse (METM) andthe attacker abilities. MTTM denotes the mean calendar time between successfulmisuses (security breaches) while METM denotes the mean calendar time thatan attacker needs to invest in order to perform a misuse. Here, the attackere¤ort depends on the abilities of the attacker, such as the attacker skills (novice,standard, expert) and the resources availability to the attacker. Hence, METM isdependent on the attacker abilities. MTTM and METM are estimated accordingto the security adaptation of reliability theory as discussed in Littlewood et al.(1993) [74].
The operational risk level also depends on the security functional componentsalready employed in the ToE and the ToE security environment. In the trade-o¤

14. Structure of the Trade-O¤ Analysis 125
MC SCMCn SCMC SCMCn SC
Fig. 14.3. The relation between misuse cost and security solution cost in the trade-o¤analysis method
analysis method this is covered by the security functional component classes ofCommon Criteria Part 2, which includes Security Audit (FAU), Communication(FCO), Cryptographic Support (FCS), User Data Protection (FDP), Identi�ca-tion and Authentication (FIA), Security Management (FMT), Privacy (FPR),Protection of the TSF (FPT), Resource Utilisation (FRU), TOE Access (FTA)and Trusted Path/Channels (FTP).
Step 4: Estimate the security solution treatment level. The treatment level ofa security solution is the composite of the security solution e¤ect and securitysolution cost. In the trade-o¤ analysis method, the security solution e¤ect isevaluated against the misuse frequency and impact while the resulting cost afteremploying the security solution in the ToE and/or the ToE security environmentis computed by updating the misuse costs taking the security solution cost intomind, as illustrated in Figure 14.3.
Step 5: Estimate the trade-o¤ parameters in the set T whereT = fSAC;POL; STA;LR;BG; TTM;BU;PRIg and SAC is security accep-tance criteria, POL is policies, STA is standards, LR is law and regulation, BGis business goal, TTM is time-to-market, BU is budget and PRI is priorities.As for the other variables involved in the trade-o¤ analysis method, there arealso di¢ culties involved in estimating some of the trade-o¤ parameters. The twotrade-o¤ parameters that should be straightforward to estimate are the budgetand TTM. These two pieces of information should be as concrete as possibleand can usually be derived from the development plan, schedule and budget andmodelled either as a discrete value or as a probability distribution, dependenton the operational risk level and the security solution treatment level derived inStep 3 and 4 respectively.
Security acceptance criteria are part of the context identi�cation of the AORDDsecurity assessment activity. However, such criteria are often di¢ cult to assignduring the early stages of a security assessment activity. Stakeholders often �ndit easier to relate to what is an acceptable and unacceptable risk when the list of

126 14. Structure of the Trade-O¤ Analysis
misuses and the security risks that these lead to becomes clearer. This risk pictureseems to be a suitable abstraction level for stakeholders to relate to and hence,the stakeholders should be given the ability to express the security acceptancecriteria also at the later stages in a security assessment activity.
Policies cover any kind of relevant policies associated with the involved organ-isation(s). The current assumption in the trade-o¤ analysis method is that therelevant policies are security policies and that these are clearly speci�ed in termsof tge required level of con�dentiality, integrity, availability, authenticity, account-ability, non-repudiation and reliability. As this is often not the case, the existingpolicies must be interpreted so that they can be expressed as required levels ofeach of the security attributes. This is done so these can be directly usable inthe trade-o¤ analysis method. When several organisations are involved and/orseveral stakeholders are concerned with the same assets, policy statements acrossthe organisations might con�ict. In such cases, the con�ict must be resolved aspart of the trade-o¤ analysis. A practical trick in such cases is to rank stakeholderinterest and use the resulting ranked list to negotiate the policy con�ict.
Laws and regulations include any relevant legal aspect that a¤ects the ToE orthe ToE security environment. Examples of such are the EU directive on dataretention (2006/24/EC) [28], which a¤ects all systems storing or processing traf-�c data in the telecommunication domain, the Privacy directive [27] and thePersonopplysningsloven (act relating to the processing of personal data) in Nor-way. As for policies, the relevant perspectives of the laws and regulations needto be expressed in terms of required level of con�dentiality, integrity, availability,authenticity, accountability, non-repudiation and reliability.
Standards cover any security or other relevant standards that the ToE needsto comply with. Examples of such are the EALs in the Common Criteria andthe security integrity levels (SIL) in IEC 61508 Functional safety of electi-cal/electronic/programmable electronic safety-related systems. As for the policiesand laws and regulations, standards need to be expressed in terms of requiredlevel of con�dentiality, integrity, availability, authenticity, accountability, non-repudiation and reliability.
Business goals are usually a bit more fuzzy than the above-mentioned trade-o¤parameters. The reason for this is that many organisations do not have a clear goalfor their security work. The security goal is often formulated in a highly abstractmanner regarding how to ensure that the organisation�s information system issecure enough. Since being secure is a relative term, the trade-o¤analysis requiresprecise formulations of the security goals of the involved organisations. Hence,the business goals for the security work must be expressed as aims to achieve acertain level of con�dentiality, integrity, availability, authenticity, accountability,non-repudiation and reliability.

14. Structure of the Trade-O¤ Analysis 127
The last trade-o¤ parameter in the set T is priorities. Priorities di¤er from theother trade-o¤ parameters in that it does not measure security in some way butrather provide a prioritised list of the requirements formulated by the other trade-o¤ parameters. Priorities are included to explicitly model the importance rank ofeach parameter in relation to the others. Hence, priorities contain a priority listof the other trade-o¤ parameters in the set T .
Step 6: Derive security solution �tness score for the security solution by: (1)Derive the security level by combining the static security level and the risk level.(2) Evaluate the treatment level of the security solution. (3) Derive the treatmente¤ect of the security level from (1), by applying the result from (2), with thesecurity level from (1). (4) Derive the treatment cost and e¤ect by examiningthe relative return on security solution investment, by comparing the relativedi¤erence in security solution cost and misuse cost, in relation with the e¤ectthat the security solution has on the misuse impact and frequency. (5) Computesecurity solution �tness score by evaluating the result of (4), using the set oftrade-o¤ parameters.
Step 7: Evaluate �tness score for each security solution against the other alterna-tive security solutions in the set A of alternative security solutions. The aim ofthis step is to compare the �tness score for the alternative security solutions andidentify the best-�tted security solution(s). In cases where the aim is to identifythe overall best set of security solutions all involved security solutions need to begrouped into solution sets and the �tness score of these solution sets need to becompared.


15. The Trade-O¤Tool
Phase 2 of the AORDD security solution trade-o¤ analysis is implemented as aBBN topology and called the trade-o¤ tool. BBN is chosen as the implementa-tion language as it sophisticatedly handles large scale conditional probabilitiesand has, through practical application, proven to be a powerful technique forreasoning under uncertainty. The notion trade-o¤ analysis topology implies thatthe trade-o¤ tool is split into a set of Bayesian networks that interacts. Thus, therequirement for separation of concerns and independent levels with clear inter-faces are achieved, as described in Chapter 14. Furthermore, the BBN topologyalso follows the trade-o¤ procedure described in Chapter 14. This means thatthe trade-o¤ tool can easily evolve as experience is gained and that it is easyto tailor the trade-o¤ tool to a particular context, such as making a companyspeci�c trade-o¤ tool version.
Figure 15.1 shows the top-level network of the BBN topology of the trade-o¤tool. The topology consists of four levels and follows the structure of the trade-o¤ analysis method and the step-wise trade-o¤ procedure described in Chapter14. As can be seen in the �gure level 1 from the trade-o¤ analysis method struc-ture is employed as the SSLE and RL nodes with associated subnets. Subnets areconnected to the parent network through output nodes in the subnet and corre-sponding input nodes in the parent network. The latter are modelled as dottedline ovals in Figure 15.1 where the SSLE input node receives information fromthe associated SSLE subnet, the RL input node receives information from theassociated RL subnet, etc.
Subnets are generally a re�nement of an input node and models the details of thenodes containing sub-variables and the internal relations of these sub-variables.It is this hierarchy of subnets, with output nodes and parent networks with in-put nodes, that enable the propagation of information and evidence through thetopology. Information and evidence are inserted into the observable nodes in thesubnets and propagated through the output nodes in the subnets to the inputnodes in the higher level networks. Hence, information or evidence are usuallynot inserted directly into the input node of the parent network. However, as all

130 15. The Trade-O¤ Tool
Fig. 15.1. The top-level network of the trade-o¤ tool BBN topology
networks in the BBN topology are self-su¢ cient evidence and information canbe inserted at any level in the topology, provided that the level of abstraction isappropriate.
Level 2 in the trade-o¤ analysis method is employed as the �security level�andSSTL nodes in the top-level network. As can be seen in Figure 15.1 the SSTLnode is a subnet while the security level node is a stochastic intermediate node.Being an intermediate node means that states of the variables of the securitylevel node are dependent on the state of the variables in the two subnets SSLEand RL. In practice this means that before any security solutions are employedthe security level of a ToE is derived by examining the risk level of the ToE andthe existing safeguards in the ToE. The SSTL subnet models the sub-variablesand their internal relations for the input node SSTL. As for the SSLE and RLsubnet the SSTL subnet is connected to the top-level BBN by the correspondingoutput and input nodes. The SSTL subnet contains a set of sub variables usedto determine the treatment level of a security solution.
Level 3 in the trade-o¤ analysis method is employed by the subnet TOP, the sto-chastic intermediate node �treatment e¤ects and costs�and the two input nodesBU and TTM. The stochastic intermediate node �treatment e¤ect and cost�takesinput from the SSTL subnet through the input node SSTL and the intermediatestochastic node �security level� and computes the relative treatment e¤ect andcost for a particular security solution or set of security solutions. The relativetreatment e¤ect and cost is measured in terms of how e¤ective the security so-

15.1 SSLE subnet 131
lution or security solution set treats the risk level of the ToE in relation to theassociated costs of procuring and employing the security solution.
The TOP subnet contains the trade-o¤ parameters and models the relationsbetween the involved trade-o¤ parameters. It is these parameters that are usedto trade-o¤ the security solutions against each other and thus used to determinehow to rate a security solution. Nodes BU and TTM are part of the TOP subnetas well as being input nodes in the top-level network. The reason for separatingthese two trade-o¤ parameters and modelling them explicitly in the top-levelnetwork is that they are of particular importance when determining the �tnessscore of a security solution and thus needs to be linked directly into the �tnessscore utility function in level 4 of the trade-o¤ analysis method described inChapter 14.
Level 4 in the trade-o¤ analysis method is employed by the utility node �Fitnessscore utility�and the decision node �Fitness score�. The �tness score decision nodeis the target node of the network. This means that this node at all times holdsthe current �tness score of the security solution being evaluated.
Details of how the trade-o¤ procedure is employed in the trade-o¤ tool are de-scribed and demonstrated using an example case study of the trade-o¤ tool inSection 18.1.
15.1 SSLE subnet
In the trade-o¤ tool, the static security level is separate from the operationalrisk level of the ToE. The main reason for this separation of concern is to easythe evolving and maintenance of the trade-o¤ tool. Figure 15.2 shows the staticsecurity level (SSLE) subnet. The SSLE is the re�nement of the SSLE input nodein the top-level network and hence feeds information into the SSLE input node inFigure 15.1. The concept �static�in this context refers to the fact that it denotesthe security level of the system before any security risks and security solutions aretaken into consideration. Hence, the static security level denotes the �original�security level.
The SSLE subnet consists of two parts and these are: (1) The security assurancecomponents of Common Criteria Part 3 and (2) Asset value. Part 3 of the Com-mon Criteria contains sets of security assurance components and describes generaldevelopment factors that in�uence the quality of a system. To ease the securityevaluation according to the Common Critera the security assurance componentsare grouped together into Evaluation Assurance Levels (EAL), as described inChapter 4. Recall that the Common Criteria consist of four parts where Part

132 15. The Trade-O¤ Tool
Fig. 15.2. SSLE subnet
1 gives the general model for security evaluation, Part 2 contains the securityfunctional components, Part 3 contains the security assurance components andPart 4 is the Common Evaluation Methodology (CEM), which gives evaluationguidelines to assist the Common Criteria evaluator. This is according to otherrelevant software and safety quality evaluation standards and best practices, suchas IEC 61508, DO-178B and Capability Maturity Model (CMM).
The SSLE subnet includes six of the assurance classes from Common CriteriaPart 3. These are development (ADV), guidance documents (ADG), life cyclesupport (ACL), tests (ATE), vulnerability assessment (AVA) and composition(ACO). Part 3 has two additional classes: the Protection Pro�le Evaluation class(APE) and the security target evaluation class (ASE), but these are not includedin the subnet as only the general development factors are relevant for Phase 2 ofthe AORDD security solution trade-o¤ analysis.
Furthermore, Common Criteria Parts 3 consists of the four levels: classes, fami-lies, components and elements. Classes are used for the most general grouping ofassurance components that share a common general focus. Families are groupingsof components that share a more speci�c focus but that usually di¤er in empha-sis or rigour. Components are atomic entities with a speci�c purpose that areconstructed from individual elements. An element is the lowest level expressionof requirements to be met in the evaluation, see [15] for details. The structure ofthe SSLE subnet follows the structure of Common Criteria Part 3 and thus has

15.1 SSLE subnet 133
four levels. As can be seen in Figure 15.2 each of the assurance classes includedin the SSLE subnet are input nodes with associated subnets and each of thesesubnets have four levels. Level one is the SSLE subnet and includes the assuranceclasses. The other three layers for each assurance class models assurance families,assurance components and assurance elements respectively. In the following thefocus is put on level 1.
As discussed in Chapter 4 security evaluation according to the Common Criteria isabout establishing con�dence in the quality of the end-product, here measured asthe security level, through observing development factors. In the trade-o¤analysisin Phase 2 of the AORDD security solution trade-o¤ analysis this con�dence levelis measured using the three states: low, medium and high. This means that allnodes in the Common Criteria part of the SSLE subnet have these three stateswhere the value of these states refer to the level of con�dence in the quality forthe associated node. As all these nodes are stochastic variables the value of thestates are expressed using probability distributions of the subjective belief of theevaluator or other experts assessing the development factors. Note that evidenceor information can be inserted directly into the Common Criteria assurance inputnodes if such information is available. However, as each of the Common Criteriaassurance nodes are subnets that follow the guidelines of Common Criteria Part3 the general recommendation is to insert evidence at the element or componentlevel.
The propagation of evidence and information in the Common Criteria assurancepart of the SSLE subnet follows the guidelines for the EALs as given in CommonCriteria Part 3. This means that the relationship between the variables withineach subnet in each level of the Common Criteria assurance part is modelled tore�ect the recommendations for the assurance components for each EAL. In thetrade-o¤ tool this means that the trade-o¤ analysis method models the internalrelations between the assurance components. This is done to re�ect that an EALhas a list of assurance components from each assurance family that should beincluded. Note that the actual information propagation still is probabilistic andperformed using the Hugin propagation algorithm contained in the HUGIN toolfor the trade-o¤ tool. To simplify the model each involved node re�ecting infor-mation that should be included in a particular EAL needs to be in the �high� statewith a probability of < 0:8 for it to be ful�lled. There are no requirements forthe �low� and �medium� states. These rules are captured in the �CC EAL utility�node in the SSLE subnet. The decision on which EAL the ToE might con�rm to,is determined by the rules modelled in the CC EAL utility node. Note that theuse of the wording �might con�rm to�, as the aim is not to replace the CommonCriteria evaluations but rather to incorporate the best practice and guidelinescontained in the Common Criteria.

134 15. The Trade-O¤ Tool
The asset value node in the SSLE subnet is also an input node and has a subnetassociated to it. This input node is used to aggregate the asset values for the assetsin the ToE, according to the previously discussed asset valuation categories. Moredetails are given in the following.
The computation order for the SSLE subnet is that the Common Criteria assur-ance part and the asset value subnet are computed independently but before theSSLE decision node as their variables are independent and given as input to thelatter. The static security level is then derived by combining the result from thesetwo input nodes.
15.1.1 Aggregating asset value for the ToE in the SSLE subnet
Assets and their values is the driving factor in many risk assessment methods,such as CRAMM, the CORAS framework and AS/NZS 4360. It is however notalways clear how to perform the actual identi�cation and valuation of the assets.In this work the asset valuation technique of CRAMM is applied on a small scale.
The complexity of asset valuation in a security assessment context is that there aremultiple stakeholders involved. These stakeholders often have di¤erent and evencon�icting interests and hence there is a need to specify a prioritised list of theseinterests based on something. In the trade-o¤ analysis method and the trade-o¤tool that something is an importance weight measuring the relative importanceof a particular stakeholder interest in relation to the other stakeholder interest.The the weight assignment approach used is that of CBAM and the reader isreferred to CBAM [69] for details.
This valuation strategy is however not straightforward in practice as many sit-uations end up in some sort of negotiation where the strongest stakeholder orthe stakeholder picking up the bill gets his or her will. It is no di¤erent in thetrade-o¤ tool except that the tool includes guidelines about how to measure theinterests against each other using the notion of importance weights. Thus, thetrade-o¤ tool takes the role of a negotiation tool in such situations. The way thisworks is that the risk analyst inserts the set of asset values into the trade-o¤ toolto re�ect the importance weights and propagates the information. The e¤ect ofthe priorities on the security solution costs and risk level can then be observedand used to guide the asset valuation. This means that if a particular stake-holder interest leads to a high level of risk that requires an expensive securitysolution the stakeholder might reconsider and decide to take some risks, ratherthan protecting the asset(s) to the desired level. Figure 15.3 shows the asset valuesubnet.
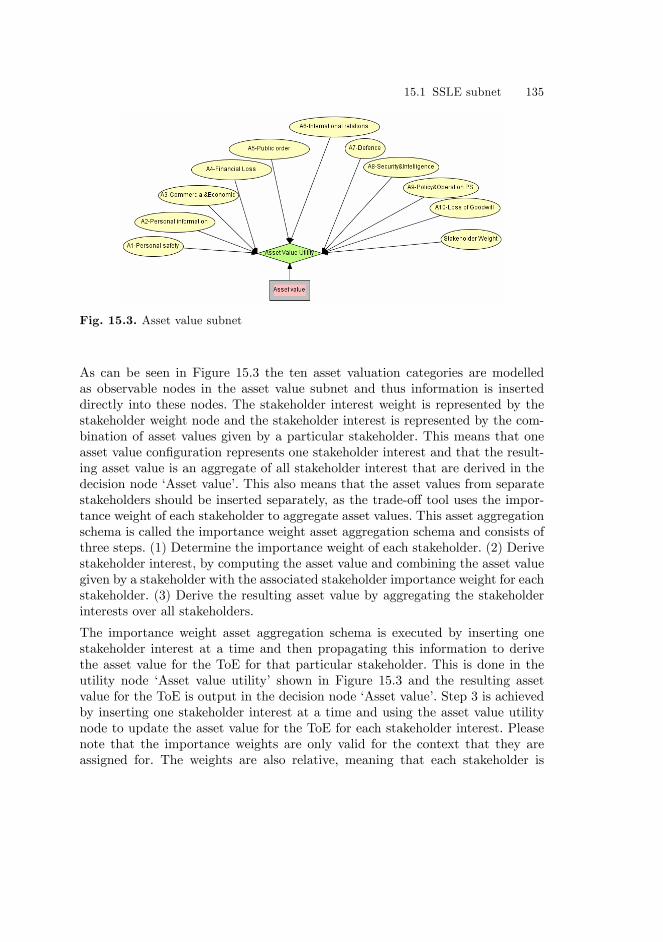
15.1 SSLE subnet 135
Fig. 15.3. Asset value subnet
As can be seen in Figure 15.3 the ten asset valuation categories are modelledas observable nodes in the asset value subnet and thus information is inserteddirectly into these nodes. The stakeholder interest weight is represented by thestakeholder weight node and the stakeholder interest is represented by the com-bination of asset values given by a particular stakeholder. This means that oneasset value con�guration represents one stakeholder interest and that the result-ing asset value is an aggregate of all stakeholder interest that are derived in thedecision node �Asset value�. This also means that the asset values from separatestakeholders should be inserted separately, as the trade-o¤ tool uses the impor-tance weight of each stakeholder to aggregate asset values. This asset aggregationschema is called the importance weight asset aggregation schema and consists ofthree steps. (1) Determine the importance weight of each stakeholder. (2) Derivestakeholder interest, by computing the asset value and combining the asset valuegiven by a stakeholder with the associated stakeholder importance weight for eachstakeholder. (3) Derive the resulting asset value by aggregating the stakeholderinterests over all stakeholders.
The importance weight asset aggregation schema is executed by inserting onestakeholder interest at a time and then propagating this information to derivethe asset value for the ToE for that particular stakeholder. This is done in theutility node �Asset value utility� shown in Figure 15.3 and the resulting assetvalue for the ToE is output in the decision node �Asset value�. Step 3 is achievedby inserting one stakeholder interest at a time and using the asset value utilitynode to update the asset value for the ToE for each stakeholder interest. Pleasenote that the importance weights are only valid for the context that they areassigned for. The weights are also relative, meaning that each stakeholder is

136 15. The Trade-O¤ Tool
Authorised User Authorised User
Unauthorised User Unauthorised User
ToE and the ToEsecurity environment
Environmental influenceFault introduction
ToE behaviour
ToE internal influenceFault introduction
delivery of service
denial of service
service request
service request
ToE risk level
ToE risk level
ToE risk level ToE risk levelToE risk level
ApplicationFailure
Operating SystemFailure
HardwareFailure
reliability, availability
confidentialityintegrityauthenticityaccountabilitynonrepudiation
Authorised UserAuthorised User Authorised UserAuthorised User
Unauthorised UserUnauthorised User Unauthorised UserUnauthorised User
ToE and the ToEsecurity environment
Environmental influenceFault introduction
ToE behaviour
ToE internal influenceFault introduction
delivery of service
denial of service
service request
service request
ToE risk level
ToE risk level
ToE risk level ToE risk levelToE risk level
ApplicationFailure
Operating SystemFailure
HardwareFailure
reliability, availability
confidentialityintegrityauthenticityaccountabilitynonrepudiation
Fig. 15.4. The ToE risk level or operation security level of a ToE as a result of theenvironmental (security) and internal (dependability) in�uence on the ToE
measured in relation to the other involved stakeholders for a particular context.The importance weights thus say nothing about the absolute importance of astakeholder.
15.2 RL subnet
The risk level (RL) subnet is used to derive the operational risk level of thesecurity risks identi�ed. The risk level is also called the operational security levelof the ToE and points to the security level of the ToE under operation that aresubject to both in�uence from its internal and external environment. The notionof operational security level was �rst discussed in Littlewood et al. (1993) [74] anddescribes the situation in a ToE at any point in time, taken all possible in�uencefrom the ToE security environment into mind. To illustrate the set of in�uencesand how they a¤ect the system, the AORDD framework has re�ned operationalsecurity level into the concept ToE risk level. Figure 15.4 shows the factors thata¤ect the ToE risk level or the operational security level of a ToE. The modelis based on the dependability framework in Avizienis et al. (2004) [6] and theintegrated framework for security and dependability in Jonsson (1998) [61] andincorporates both security related factors and dependability or reliability factors.Please see Houmb and Sallhammar (2005) [46] for details.
Figure 15.5 shows the RL subnet. This subnet provides input to the RL inputnode in the top-level network of the trade-o¤ tool BBN topology. The relevant in-

15.2 RL subnet 137
Fig. 15.5. RL subnet
formation for the RL subnet is the information used to derive the ToE risk level, asshown in Figure 14.2. These are the security risk concepts misuse frequency (MF)and misuse impact (MI), the existing safeguards, such as the security functionalcomponents of Common Criteria Part 2 and the operational security measuresMETM and MTTM. In addition, misuse cost (MC) is included and used to sup-port the evaluation of relative treatment e¤ect and cost in level 3 of the trade-o¤analysis method.
As can be seen in Figure 15.5 the RL subnet has six observable nodes and threesubnets associated to it. The observable nodes are the stochastic nodes MI,METM, MTTM, Attacker motivation, Attacker resources and Attacker skills.The three subnets are: MC, MI and the existing safeguards. The latter subnetwill not be described in detail, as a number of methods exist to determine thestrength of the existing safeguards in a ToE, such as the Common Criteria. Statesassociated with this node are {low, medium, high}, meaning no safeguards, somesafeguards and su¢ cient set of safeguards.
MTTM points to the average calendar time that it takes from an attacker initi-ates the misuse until the misuse is successfully completed. METM points to theaverage calendar time it takes one attacker to initiate and complete a successfulattack. Both these variables depend on the time it takes to mount the attack, theknowledge that the attacker has of the ToE and the abilities of the attacker(s).The latter is modelled as the intermediate node �Attacker ability�which has threeincoming observable nodes, namely Attacker motivation, Attacker resources andAttacker skills.
Misuse frequency (MF) is a qualitative or quantitative measure of the rate ofoccurrence of a misuse. When qualitative measures are used, they are called

138 15. The Trade-O¤ Tool
Fig. 15.6. Negative and positive misuse impacts
likelihood while a quantitative misuse frequency measure is usually expressed aseither the probability of occurrence within a time unit or the number of eventsper time unit. Information on the frequency is inserted directly into the MF nodein the RL subnet as MF is an observable node. More information on the conceptof misuse frequency can be found in the CORAS framework, AS/NZS 4360 andthe like.
Misuse Impact (MI) is measured in terms of asset loss and asset gain. As discussedearlier one misuse can only have either negative or positive impact on one assetbut the same misuse can have negative impact on one asset and positive impacton another asset. As for misuse frequency misuse impact can be measured interms of qualitative and quantitative values. Figure 15.6 shows an example of arisk matrix composed of qualitative misuse impact and misuse frequency scalesthat covers misuse impact both as asset gain and asset loss.
The misuse impact is an aggregate of all its negative and positive impacts on alla¤ected assets in the ToE and/or the ToE security environment. To make it feasi-ble to measure the impact that one misuse has on the asset values in the trade-o¤tool the misuse impact is categorised according to the asset valuation categories.This means that a negative impact increases the asset value, as the asset valuesare either given on the ordinal scale [1; 10] where 10 represents the worst case

15.2 RL subnet 139
Fig. 15.7. Misuse impact (MI) subnet
scenario for the asset or according to the qualitative scale {low, medium, high}.Similar, a positive impact moves the asset value one or more steps closer to thevalue 0 or the state �low�. Determining the misuse impact is done by aggregatingover all negative and positive impacts. In the trade-o¤ tool this is done throughaggregation by inserting one misuse impact at the time, recompiling the misuseimpact and then inserting the next misuse impact etc. Figure 13.11 shows themisuse impact subnet.
The third input node and subnet in the risk level subnet is the misuse cost(MC) subnet shown in Figure 15.8. Misuse cost is often hard to measure andparticularly as a pure �nancial loss, as it is rarely possible to observe the directlink between the misuse and the �nancial perspectives. Often it is evident thatthere is a cost associated with the misuse but the magnitude of it is not. However,if such information is available it can be inserted directly into the MC node ofthe risk level subnet. If such information is not available the MC subnet is usedto derive the misuse cost.
In the MC subnet the cost of a misuse is measured in terms of the three variables:productivity, TTM and budget. Here, productivity includes factors like a stopin normal production for a shorter or longer period, delays in the production,increased hassle and loss of productivity for the end-user. TTM relates to deliverydate for the system and is one of the factors that usually a¤ected as a result of amisuse. The cost associated with increased TTM may be hard to estimate and thequalitative scale {low, medium, high} is used to measure this sub variable. Thesame qualitative scale is used to measure potential increase in the budget andreduction in the productivity where the interpretation is that the misuse leads toa low, medium or high increase in the budget or reduction in the productivity.

140 15. The Trade-O¤ Tool
Fig. 15.8. Misuse cost (MC) subnet
The output node of the MC subnet is the decision node �Misuse Cost (MC)�. It isthis misuse cost that is propagated through the MC decision node from the RLsubnet to the RL node in the top-level network. The states of the decision nodeequal that of the three observable nodes of the MC subnet and hence the misusecost can be low, medium or high.
15.3 SSTL subnet
The security solution treatment level (SSTL) subnet in Figure 15.9 is the re-�nement of the SSTL node in the top-level network of the trade-o¤ tool BBNtopology. This subnet contains variables used to determine the treatment level ofa security solution. This treatment level is then fed back to the top-level networkand used to evaluate the treatment e¤ect and cost of the security solution inrelation to the risks level and static security level of the ToE as described earlier.The SSTL subnet follows the same structure as the SSLE and RL subnet andconsist of a set of stochastic observable nodes and intermediate nodes, an ad-ditional subnet, a decision support utility function node and an output decisionnode that is connected to the top-level network and hence carries the informationfrom the SSTL subnet to the top-level network in the trade-o¤ tool.
As can be seen Figure 15.9 the treatment level of a security solution is determinedfrom the security solution cost (SC) and the security solution e¤ect (SE). Here,the e¤ect of a security solution is measured in terms of its e¤ect on the risk levelvariables METM, MTTM, MI and MF for the misuse that the security solution isintended to treat. This could be a security risk theme (group of misuses with their

15.3 SSTL subnet 141
Fig. 15.9. SSTL subnet
associated frequency, impact, MTTM and METM, which comprises a securityrisk), as discussed in the CORAS framework.
There are several information sources available for determining the solution e¤ect,such as formal security veri�cation using UMLsec as shown in Houmb et al.(2006) [48] in Appendix B.2 and Houmb et al. (2005) [44] in Appendix B.3. Thereare also more informal ways of obtaining the information, such as subjectiveexpert judgment. Possible information sources and aggregation techniques forvarious types of information (both observable and subjective expert judgments)is discussed further in Chapter 16.
The states of all nodes involved in determining the solution e¤ect are modelledaccording to the qualitative scale {low, medium, high}. This means that if thenode �SE on METM�is in the state �low�the security solution has a low e¤ecton the mean e¤ort to misuse and is not able to signi�cantly increase the e¤ortneeded to complete the misuse. On the other hand, if this node is in the �high�state the security solution signi�cantly increases the mean e¤ort that an attackermust invest to complete and succeed with the misuse and thus makes it moreunlikely that the misuse can be completed successfully.
The security solution cost (SC) is modelled as an input node with associated sub-net in the SSTL subnet. The reason for this is the cost of a security solution mayvary from domain to domain and hence are application, system and domain spe-ci�c. Thus, the contained sub-variables contributing to the security solution costare separated and put into a subnet. This subnet is called the security solutioncost subnet and depicted in Figure 15.10.
In the trade-o¤ analysis method and the trade-o¤ tool the cost of a securitysolution is measured as the combination of the four variables: procurement, em-ployment, maintenance and productivity. Here, procurement covers the actual

142 15. The Trade-O¤ Tool
Fig. 15.10. Security solution cost (SC) subnet
cost of purchasing the solution (the price tag on the security solution). Employ-ment costs are the costs related to tailoring the security solution to the particularcontext and for employing the security solution as part of the ToE and/or theToE security environment. Maintenance costs cover expenses related to ensuringcontinuous normal operation of the security solution in the ToE after the solu-tion is employed in the ToE and/or the ToE security environment. These includeextra resources to update the security solution or to respond to user requests inrelation to the functionality of the security solution. Productivity costs cover thecosts related to the hassle that the security solution has on the end-users andtheir productivity, such as extra time needed to log-in, extra procedures neededto carry out etc. As for security e¤ect the state spaced used for all involved vari-ables is {low, medium, high}. More details are given in the example run of thetrade-o¤ tool in Section 18.1.
15.4 TOP subnet
The TOP subnet re�nes the trade-o¤ parameter node in the top-level network ofthe trade-o¤ tool BBN topology. The TOP subnet includes the decision criteriaor variables used to trade security solutions o¤ against each other and hence arethe variables that model the preferences of the stakeholders or decision maker,such as that the budget being more important than TTM and similar. The trade-o¤ parameters included in the current version of the trade-o¤ tool are priorities,budget, business goals, standards, business strategy, law and regulations, TTM,policies and security risk acceptance criteria. The trade-o¤ parameter �priorities�

15.4 TOP subnet 143
Fig. 15.11. TOP subnet
di¤er from the other parameters by receiving input from the others and from thatproducing a prioritised list of trade-o¤ parameters. Figure 15.11 shows the TOPsubnet.
As can be seen in this �gure the target node of the TOP subnet is an output nodethat corresponds to the input node TOP in the top-level network. As discussedearlier, the target node of a BBN represents the objective of the assessment,which in this case is to derive a prioritised list of the trade-o¤ parameters. TheTOP subnet also has two additional output nodes, namely TTM and BU. As forthe TOP output node both BU and TTM have their associated input nodes inthe top-level network that they fed information into. This construct by explicitlytransferring budget and time-to-market information directly into the top-levelnetwork gives the ability to give budget and TTM double e¤ect when trading o¤security solutions.
The trade-o¤ variables each represent factors that in�uences which security solu-tion is best-�tted for a particular security solution decision situation. By allowingthe prioritising of the trade-o¤ parameters the trade-o¤ tool ensures that a de-cision maker�s preferences or needs regarding the development factors actuallyin�uence the outcome of the security solution evaluation. To support this priori-tising the trade-o¤ parameter �priorities�are modelled as a decision node withassociated utility function. By using a utility and decision node pair construct tomodel priorities the preferences is explicitly modelled. As can be seen in Figure15.11 the parameter priorities receive input from the other trade-o¤ parametersand derive the prioritised trade-o¤ parameters list using the node probabilitymatrix of its utility node. This node probability matrix speci�es the relationsbetween the states of all the other trade-o¤ parameters and makes the network�exible in tailoring the trade-o¤ tool and to quickly incorporate new trade-o¤ pa-

144 15. The Trade-O¤ Tool
rameters. Hence, the node probability matrix of the TOP priorities utility nodecan be used to make the BBN topology company, system and domain speci�c.
In addition to the above-mentioned node probability matrix of the utility node,conditional expressions can be used to explicitly model precedence constructs anddependencies, such as if-then-else constructs. An example of such are: IF PRI.BU== �1�THEN TOP.BU=�high�, which explicitly speci�es that budget is given ahigh priority whenever the budget is given the priority 1.
In a Bayesian network or an in�uence diagram all nodes have one or more statesthat they can be in. Which state a node is in at a particular point in time de-pends on the density probability function of the node and the states of othernodes connected to this node with incoming arches. As the TOP priorities deci-sion node outputs a prioritised list of the other trade-o¤ parameters there is onecorresponding state for each incoming trade-o¤ parameter in the TOP prioritiesnode. The node BU denotes the budget available for mitigating security risks andis given as the interval [min;max] wheremin is the minimum budget available formitigating security risks andmax is the maximum budget available for mitigatingsecurity risks. The variable BG speci�es security speci�c business goals, such asthat the con�dentiality of customer information is a critical business asset. BG iscomprised of seven states: {Conf, Integr, Avail, NonR, Accnt, Auth, Relia} cor-responding to con�dentiality, integrity, availability, authenticity, accountability,non-repudiation and reliability. These are the seven security attributes includedin the de�nition of information security in the AORDD framework. The nodeSTA is used to specify standards that the system must adhere to and the nodeBS covers security issues related to the business strategy expressed as the degreeof importance of security as a quality measure for the business. LR covers lawsor regulations for security issues that the system must comply by, such as thedata privacy regulations in Personopplysningsloven (act relating to the process-ing of personal data) in Norway. SAC represents security risk acceptance criteriaand are used to specify the acceptable risk level for the ToE and the node POLdenotes the relevant security policies that the ToE should comply by. As for theBG node, the states of STA, BS, LR and POL are the seven security attributes.TTM is given as the interval [mindate;maxdate] where mindate is the earliestTTM date and maxdate is the latest TTM date. Table 15.1 shows the nodes andtheir states for the TOP subnet.
The states assigned to the nodes in the trade-o¤ tool may di¤er and can betailored to the information that is available. The state space described for thetrade-o¤ tool in this chapter is an examples. In Section 18.1 the trade-o¤ analysismethod and the trade-o¤ tool are demonstrated using the example state spacedescribed here. Part 6 also contains a discussion on how to tailor the trade-o¤tool for a particular context while Chapter 16 looks into potential information

15.4 TOP subnet 145
Table 15.1. Nodes and their states in the TOP subnet
Node/Variable States
TOP BU, TTM, Conf, Integr, Avail, NonR, Ac-cnt, Auth and Relia
PRI BU, BG, BS, LR, TTM, SAC, POL
BU [min, max]
TTM [mindate, maxdate]
SAC, STA,BG, BS andPOL
Conf, Integr, Avail, NonR, Accnt, Authand Relia
sources for the variables in the trade-o¤ tool. Note that the trade-o¤ tool hasbeen developed using the action research based development process described inPart 1 and that parts of the results from the last case study by examples is givenin Section 18.1. Details on the trade-o¤ tool and examples of its use can also befound in Houmb et al. (2006) [48] enclosed as Appendix B.2 and Houmb et al.(2005) [44] enclosed as Appendix B.3.


Part V
Aggregating Information in the Trade-O¤Tool


16. Information Sources for Misuse and SecuritySolution Variable Estimation
The AORDD security solution trade-o¤ analysis makes use of misuse and securitysolution variables to estimate the impact and cost of a misuse and the e¤ect andthe cost of a security solution. These are the inputs to the trade-o¤ tool andthus are necessary information to derive the best-�tted security solution or setof security solution. Furthermore, to trade o¤ the security solutions against eachother the involved variables must be comparable and hence they must be eitherqualitatively or quantitatively measurable.
Due to the lack of su¢ cient amount of empirical data to measure the misuseand security solution variables and due to the great deal of uncertainty involvedin determining which security solution best �ts a particular security risk, thereis a need to extend the trade-o¤ tool with techniques for aggregating whateverinformation available as input to the trade-o¤ tool.
There are two main types of information sources that can be used to estimatemisuse and security solution variables. These are: (1) Observable information and(2) Subjective or interpreted information. Observable information is also referredto as empirical information (or �objective� information) and includes informa-tion from sources that have directly observed or experienced a phenomenon. Suchsources have not been biased by human opinions, meaning that the sources havegained knowledge or experience by observing events and facts. Interpreted infor-mation sources include sources that have indirectly observed phenomena or thosethat pose a particular set of knowledge and experience, such as subjective expertjudgments.
16.1 Sources for observable information
Observable information sources are most often represented using the classicalinterpretation of probability, meaning that these describe some event and theobserved occurrence of this event. Here, uncertainty is associated with how repre-sentative the observations are of the actual facts. Observable information sources

150 16. Information Sources
includes among other things publicly available experience repositories, companycon�dential experience repositories, domain knowledge (facts), recommendationor best practice, standards (a collection of best practice), results from risk as-sessment, results from formal security veri�cation, honeypot log-�les, IntrusionDetection Systems (IDS) log-�les and other type of log-�les, such as Firewalllog-�les.
Information from IDS and honeypots are real-time information sources and thusrecord information in real-time. Such sources are useful both for deriving themisuse scenario and for estimating misuse occurrence frequencies and securitysolution e¤ects. The latter can be done by employing two log periods, one be-fore and one after the employment of a security solution. There are many waysthat information can be obtained from real-time information sources and someexamples are given in the following.
The real-time observable information source Snort is a freeware IDS and fre-quently used both in academia and in industry. An example of output from Snortfor the Internet worm CodeRed is:
10/30-11:47:14.834837 0:80:1C:CE:8C:0! 0:10:60:DB:37:E5 type:0x800 len:0x3E 129.241.216.114:1203
! 129.241.209.154:139 TCP TTL:125 TOS:0x0 ID:45447 IpLen:20 DgmLen:48 DF ******S* Seq:
0x6F12FE95 Ack: 0x0 Win: 0xFFFF TcpLen: 28 TCP Options (4) => MSS: 1260 NOP NOP SackOK.
The above is interpreted as following:{date}�{time} {source MAC address} ! {destination MAC address} {type} {length} {source ad-
dress} ! {destination address} {protocol} {TTL} {TOS} {ID} {IP- length} {Datagram� length}
{Flags}{Sequence number} {Acknowledgment} {Window} {TCP�length} {TCP options}
The above information from Snort is an example of transport layer logging (layer4 in the OSI reference model and layer 3 in the TCP/IP protocol stack), in thiscase TCP. As for anti-virus software Snort triggers alarms according to knownsignatures describing suspicious activity. By con�guring the logging mechanism,Snort can be set up to monitor particular attacks, such as speci�c Denial ofService (DoS) attacks. Due to its �exible con�guration abilities Snort has theability to record potential impacts and frequency of DoS attacks and thereforerepresents an e¤ective and real-time gathers of information for estimating bothmisuse and security solution variables. However, for the logging to be e¤ectiveand accurate the IDS should be combined with a honeypot, such as the freewarehoneypot Honeyd [77]. Such a con�guration gives a second layer of logging whichis necessary due to the problem of false positives with IDS. Using both IDS andhoneypot makes it possible to compare and calibrate the two information sourcesagainst each other to eliminate some of the false positives.

16.1 Sources for observable information 151
A honeypot is an information system resource whose value lies in all unauthorisedor illicit use of that resource [94]. The advantages of an honeypot is its abilityto capture new attacks and attack methods by observing, responding to anddocumenting interactions with its environment. Honeypots come in a wide rangeof types and more advanced types are able to capture more information thana simpler and low-interaction honeypot. Honeypots are able to capture attackinformation easily, as they are set up as resources that normally are not used byany authorised users. This limits the problem with false positives. It also meansthat any data sent from the honeypot indicates a successful attack which makesit easier to measure events such as the number of successful attacks within aparticular time frame.
There are three main categories of honeypots available. These are low-interaction,middle-interaction and high-interaction honeypots. The low-interaction honey-pots have limited interaction with the attackers and hence are limited in theirability to detect more advanced and innovative attacks. Low-interaction hon-eypots can only simulate parts of an operating system and some applications.Middle-interaction honeypots are able to simulate an entire operation systemand its belonging applications and hence provide more realistic information thanthe low-interaction honeypots. High-interaction honeypots are real system thatusually are employed in parallel with the production system, only separated byan attack routing gateway called Honeywall. However, employing the honeypotas a real system involves the risk of attackers taking over the honeypot and usingit as a gateway into the network. This problem has been further elaborated onin Østvang (2004) [81] and Østvang and Houmb (2004) [82].
Combing the two information sources IDS and honeypot gives the ability to testthe e¤ect that a particular security solution has on a particular misuse in arealistic environment. Assume that a set of security solutions S are identi�ed aspotential treatments for DoS attacks. Each security solution si where i points to aparticular security solutions is employed into the Honeyd simulation environmentfor the logging period 4t. Here, 4t is de�ned as the time di¤erence between starttime and end time of the logging. By taking each security solution through a seriesof logging periods an estimate for the anticipated number of DoS attacks can byderived by calculating the set average. From this the anticipated e¤ect on DoSattacks for each security solution can be derived and thus the solution �tness forDoS attacks have been observed. To make the evaluation as realistic as possiblethe logging period 4t should cover the same amount of time and be comparableas there are often di¤erences in number of attack tries during weekends thanduring week days.
In the example given in Section 18.1 the e¤ect of two DoS security solutions fora .NET e-commerce system are measured using the combination of Snort and

152 16. Information Sources
Honeyd. This is done by simulating the employment of each security solutionseparately and then comparing the result of the logging with the result of thesimulation of the .NET e-commerce system without any DoS solutions. By doingso a real-time simulation of future con�gurations of ToEs can be performed. Thetrick, in this context is that the alternative security solutions are included into thesimulation environment so their actual e¤ect on preventing DoS attacks can beobserved. Note that there are still problems creating a realistic and comparablecontext for the simulation.
Log-�les from �rewalls, anti-virus �rewalls, Internet gateways (routers) etc. pro-vide information such as the source and destination IP addresses and the accessedTCP port for all connection attempts. Such logging mechanism can also employaction rules, such as �ltering mechanisms on the IP and TCP levels. Here, �l-tering means to con�gure the router with access lists containing either single IPaddresses or ranges of IP addresses. The rules used are among others �access�and �deny�. In addition, �rewalls provide application layer �ltering in combina-tion with the two other �ltering functions. In the trade-o¤ tool information onwho tried to contact whom, at what time and for what reason is of interest. Suchinformation can provide information on whether there has been an attempt ofport scan or other DoS attacks that was not successfull due to the �ltering rules.These pieces of information are valuable for both the misuse and the securitysolution variables in the trade-o¤ tool.
Virus and spyware scanners also use log-�les to record the result of their activities.In addition, these mechanisms have the capability to issue alarms and performprescribed actions to remove the problem detected, such as removing a virus andclosing a connection. A vulnerability scanner works in a similar way but has moreoptions when it comes to the actions. It detects and proposes solutions to thevulnerabilities detected, if such solutions exist (such as a list of downloadablevulnerability �xes). These tools are all helpful in detecting vulnerabilities in thesystem and other relevant information for the misuse variables in the trade-o¤tool. These tools can also be used to identify potential security solutions.
Public repositories are used to store experience and best practise from variousrelevant activities that are publicly available. Examples of such are the quarterlyreports from Norsk Senter for Informasjonssikring (NorSIS) in Norway, incidentand security reports and white papers from CERT, NIST, NSA and CSO, reportsfrom the Honeynet-project and other attack trend reports. A repository can alsobe speci�c to a company and in such cases they are called company experiencerepositories. Often these repositories contain company con�dential informationand thus the access to them is restricted. The information that these two typesof repositories contain is mostly related to the misuse variables in the trade-o¤tool. However, the repositories might also provide input to the security solution

16.1 Sources for observable information 153
variables, such as suggested solutions to a particular security problem and exam-ples of unsolved issues with these that reduce their ability to withstand certainattacks.
Domain knowledge is similar to the experience repositories but represent estab-lished knowledge within a particular domain, such as the e-commerce domain.Information denoted domain knowledge is based on observations of multiple co-herent events over a certain amount of time. Examples are lists of well-known vul-nerabilities in existing systems, such as patch lists with downloadable patches fora particular operating system version or application. Such information is highlyrelevant for the both the misuse and the security solution variables in the trade-o¤tool.
Recommendations and standards are best practice and industry standards de-rived from long-term experience from industry or similar, such as the qualityassurance best practise and standards (e.g. CMM and ISO 9000). Recommen-dations could also take the form of interpreted information source type, such assubjective recommendation from domain experts. Examples of recommendationsare those captured in Common Criteria Protection Pro�les (PP). Examples ofsecurity standards for security level evaluation are the Common Criteria, Infor-mation Technology Security Evaluation Criteria (ITSEC) and ISO 17799 Infor-mation technology �Code of Practice for information security management.
System analysis and tests are module and integration tests performed on bothor either of the design models and the implementation. Vulnerability analysis issuch as those in the vulnerability assessment techniques and guidelines describedfor the Common Criteria assurance class vulnerability assessment (AVA). Themain aim of these tests is to detect design �aws or security problems in theimplementation and to check whether the implemented system meets the securityrequirements outlined in the design models.
Formal security veri�cation covers techniques that use mathematical rigour tocheck a system model for �aws and for resistance to attacks. An example of thisis the UMLsec security veri�cation approach described in Houmb et al. (2005)[44] (Appendix B.3). Results from security veri�cation are applicable to both themisuse and the security solution variables of the trade-o¤ tool. The example givenin [44] demonstrates the use of such information as input to the security solutionvariables.
Risk assessment results give information on the potential misuses, their potentialfrequency and their associated impacts on the system assets. In some cases arisk assessment may also identify alternative security solutions and perform anevaluation of these solutions. The result from such activities is thus relevant forboth the misuse and the security solution variables of the trade-o¤ tool.

154 16. Information Sources
16.2 Sources for subjective or interpreted information
Subjective information sources provide information for the misuse and securitysolution variables according to the subjectivistic interpretation. Thus, the sub-jective information sources express their uncertainty on some event, rather thanproviding a value and trying to estimate how close this value is to the actual value.The reader should note however that the subjective or interpreted informationsources described here are according to the truly subjective interpretation andnot the Bayesian interpretation. The important factor in this context is that withthe truly subjective approach the problem of expressing the uncertainty relatedto a true value is avoided, as it is the information source�s uncertainty that isexpressed. See Chapter 5 and DeFinetti (1973) [31, 32] for details.
The AORDD framework and the trade-o¤ tool support three categories of subjec-tive information sources, namely subjective expert judgment, interpreted expertinformation and expert judgment on prior experience from similar systems.
Subjective expert judgment makes use of domain experts, developers, securityexperts, stakeholders and other sources that are considered to posses a signi�cantamount of understanding of the problem being assessed. The process of collectingthese opinions consists of choosing the domain experts, elicitation of the expertopinions and analysis of potential biases using seed and calibration variables, asdiscussed in Chapter 7.
In subjective expert judgment, the experts have directly gained knowledge andexperience that they use when providing information. This is di¤erent than forthe subjective information source interpreted expert judgment where an expertinterprets events observed by external sources, such as the opinion from a do-main expert or a directly observable source. Here, the experts base their opinionon their interpretation of information from other sources. This means that theinformation these source provides is indirect.
The third category of subjective information sources is expert judgment on priorexperience from similar systems. Here, the experts base their opinion on empiri-cal information from the use of similar systems or on their own experience fromworking with a similar system. It is important however that the experience infor-mation used to assess misuse and/or security solution variables for a ToE is froma system that is similar to such a degree that the information is applicable to theToE. To ensure documentation of the basis of the opinions provided the expertsneed to document their reasoning about the di¤erence between the system thatthe empirical information or experience is gathered and the ToE and the e¤ectsthat eventual di¤erences have on the information provided.

16.2 Sources for subjective or interpreted information 155
In the following, the trust-based performance weighting schema for informa-tion aggregation of misuse and security solution variables in the trade-o¤ toolis described. This information aggregation schema is able to combine all above-mentioned information source categories, both for observable information sourcesand subjective information sources.


17. Trust-Based Information Aggregation Schema
There are a variety of performance-based aggregation techniques, such as thecopula model developed by Jouini and Clemen (1996) [66] and the dependence-based aggregation techniques developed by Cooke and his group at Delft Uni-versity of Technology [68, 18, 72, 38]. The latter is also supported by theirexpert aggregation program Excalibur (Software product downloadable fromhttp://ssor.twi.tudelft.nl/~risk/software/excalibur.html). These techniques are tai-lored for aggregating subjective expert judgment. However, as there is some ob-servable information available for misuse and security solution variables, tech-niques for combining observable and subjective information is needed.
The AORDD framework re�nes and extends the current aggregation approachesin its trust-based information aggregation schema. This schema di¤ers from otherperformance information aggregation techniques in that it enables the combina-tion of objective and subjective information by adding the perceived con�denceof each information source to the aggregation weights. This is done through theintroduction of the notion of trust, in addition to calibration variables, whenderiving the aggregation weights.
In most trust-based approaches trust is measured using binary entities such astotal trust or no trust. See Ray and Chakraborty [88] for examples of relatedwork on binary trust approaches. The vector trust model developed by Ray andChakraborty [87, 88] extends the binary approaches by considering degrees oftrust. In their model trust is speci�ed as a vector of numeric values with the threeparameters: knowledge, experience and recommendation where each of these ele-ments in�uence the level of trust. The model allows trust to be a value in the rangev 2 [�1; 1] and ? where �1 represents total distrust, 1 represents total trust, 0represents no-trust and ? represents situations where not enough informationare available to evaluate the trust level. Values in the range [�1; 0] denotes semi-untrustworthiness and values in the range [0; 1] denotes semi-trustworthiness.
The trust-based performance weight information aggregation schema is based onthe vector trust model in [87, 88], but has been re�ned and extended to tailor themodel for information aggregation as input to the trade-o¤ tool. Among other

158 17. Trust-Based Information Aggregation Schema
things this includes the introduction of an additional dimension when assessingtrust.
In this work trust is considered to be between a decision maker A and an in-formation source bi and there might be several information sources that provideinformation to the decision maker. The set of information sources is thus denotedB where B = fb1; :::; bi; :::bng. Trust and distrust in relation to estimating misuseand security solution variables is de�ned as the following (note that these de�n-itions are re�ned from [88] to target information gathering and aggregation forsecurity solution evaluation).
De�nition Trust is de�ned to be the �rm belief in the competence of an entityto provide accurate and correct information within a speci�c context.
De�nition Distrust is de�ned to be the �rm belief in the incompetence of anentity to provide accurate and correct information within a speci�c context.
Figure 17.1 shows the �ve steps of the information aggregation schema for thetrade-o¤ tool. As can be seen in the �gure, the �rst four steps of this schemacover the trust-based performance weighting schema while Step 5 of the schemacovers the trust-based information aggregation. This separation of the informa-tion aggregation schema is done to allow for the use of alternative methods, bothto derive the internal relative information source weights and for aggregating theinformation using the information source weights.
Step 1 concerns the speci�cation of the trust context. This is an important taskwhen combining information from di¤erent sources and of di¤erent types as in-formation given under di¤erent trust contexts cannot directly be combined. Thetrust context is speci�ed using a trust context function C(T ). This function takesthe trust purpose and assumptions such as input and returns the context of thetrust relationship as output.
Step 2 concerns the speci�cation of the relationship between the set of informa-tion sources B using knowledge domain models and is measured in terms of theperceived knowledge level, against the desired knowledge level and the perceivedexperience level. Both the knowledge level and the experience level are measuredin relation to the problem in question and used to derive the information sourceperceived and relative knowledge and experience level.
The relationship between the information sources is a relative measure within B.These relationships denote the internal rank and needs to be determined beforethe relationship between the decision maker and the information sources areexamined. The latter is the task of Step 3 where the trust relationships betweenthe decision maker and the information sources are evaluated using the threetrust variables: knowledge, experience and recommendation.

17. Trust-Based Information Aggregation Schema 159
ATrust relationship
betweeninformation sources
Trust Context
purpose assumptions
Apply B on A
Aggregateinformation using
TBISPweights
BTrust relationship
betweendecision maker andinformation sources
Trust based IS performance weights
Step 1
Step 2 Step 3
Step 4
Step 5
ATrust relationship
purpose assumptions
BTrust relationship
betweendecision maker andinformation sources
Step 1
Step 2 Step 3
Step 4
Step 5
Trustbased performanceweighting schema
Trustbased Information aggregation
ATrust relationship
betweeninformation sources
Trust Context
purpose assumptions
Apply B on A
Aggregateinformation using
TBISPweights
BTrust relationship
betweendecision maker andinformation sources
Trust based IS performance weights
Step 1
Step 2 Step 3
Step 4
Step 5
ATrust relationship
purpose assumptions
BTrust relationship
betweendecision maker andinformation sources
Step 1
Step 2 Step 3
Step 4
Step 5
Trustbased performanceweighting schema
Trustbased Information aggregation
Fig. 17.1. Overview of the �ve steps of the trust-based information aggregation schema
In Step 4 the trust relationship between the decision maker and the informationsources derived in Step 3 are applied to the relative internal trust relationshipbetween the information sources from Step 2. This results in the trust-basedinformation source performance weights. Step 4 is thus the last step of the trust-based performance weighting schema.
Step 5 is the trust-based information aggregation technique and concerns theaggregation of information from the information sources using the trust-basedinformation source performance weights from Step 4. This is done by combiningthe information source weights with the information provided from each informa-tion source over all information sources. It is Step 5 of the trust-based informationaggregation schema that connects the schema with the trade-o¤ tool describedin Part 4. A demonstration of the use of Step 5 in the trade-o¤ tool is given inSection 18.1.
Note that Step 1 and 3 are re�nements of parts of the vector trust model [87, 88]while all other steps are new.

160 17. Trust-Based Information Aggregation Schema
17.1 Step 1: Specify trust context
Step 1 in the trust-based information aggregation schema speci�es the trust con-text for the information elicitation and aggregation. The trust context de�nesunder which conditions the trust relationships for information aggregation areestablished. Furthermore, the trust context is also used to make sure that thedecision maker and the information sources have the same understanding of boththe problem being assessed and the information being provided for the trade-o¤tool. The way that the trust context is speci�ed might include several variablesas well as varying from case to case depending on the trust purpose as discussedby Branchaud and Flinn (2004) [10].
The purpose of a trust relationship states why the relationship is established, suchas �The purpose of the trust relationship between the decision maker A and theinformation source bi is that of bi providing information on <case description>�.A case description represents the problem being assessed. An example of such is�the number of average DoS attacks per month for the coming year for a particulare-commerce system�. More information on case description is in Chapter 7.
The assumptions of a trust relationship speci�es the understanding that the in-volved parties have about the information provided and received. This is com-prised of the decision maker�s understanding of the information provided by theinformation source and the information source�s understanding of the informa-tion provided to the decision maker. These two understandings need to be equalto ensure that all pieces of information are accurate and in accordance with theinformation request (the case description) from the decision maker.
De�nition The atomic purpose of a trust relationship A C! bi is that of
� Provide information on <case description>. The main reason for es-tablishing the trust relationship is for one information source to providecorrect and accurate information on <case description> where case de-scription is a clear and unambiguous model of the problem being assessed.
De�nition The Purpose of a trust relationship is that of (modi�ed from Rayand Chakraborty [87])
� An atomic purpose is a purpose of a trust relationship,� The negation of an atomic purpose denoted by �not� atomic purpose is apurpose,
� Two or more purposes connected by the operator �and� form a purpose,
� Two or more purposes connected by the operator �or� form a purpose,
17.1 Step 1: Specify trust context 161
� Nothing else is a purpose.
The assumption of a trust context denotes any understanding or prerequisitemade by any of the involved parties when requesting and providing informa-tion. Hence, assumptions is used to specify the setting and understanding of theinformation given or received.
De�nition The atomic assumptions of a trust relationship A C! bi is that of
� Decision maker�s understanding of the information request. Thisdenotes the decision maker�s own understanding of the information requestthat the decision maker provides to the information source.
� Information source�s understanding of the information request.This denotes the information source�s understanding of the informationrequest as given by the decision maker.
� Decision maker�s understanding of the information provided. Thisdenotes the decision maker�s understanding of the information as providedby the information source.
� Information source�s understanding of the information provided.This denotes the information source�s own understanding of the informa-tion that the information source provide to the decision maker.
De�nition The assumptions of a trust relationship is that of
� An atomic assumption is an assumption of a trust relationship,� The negation of an atomic assumption denoted by �not� atomic assump-tion, is an assumption
� Two or more assumptions connected by the operator �and� form an as-sumption,
� Two or more assumptions connected by the operator �or�form an assump-tion,
� Nothing else is an assumption.
By combining trust purpose and trust assumptions trust is de�ned as the inter-related conditions in which trust exists or occurs. This trust context is speci�edusing a trust context function C(T ).
De�nition The trust context function C(T ) of a trust relationship T is a functionthat takes the trust relationship as input and returns the context of the trustrelationship as output (modi�ed from Ray and Chakraborty [87]).

162 17. Trust-Based Information Aggregation Schema
De�nition Let U denote the set of trust purposes and A the set of trust as-sumptions. Then the trust context C(T ) of a trust relationship is de�ned as(modi�ed from Ray and Chakraborty [87])
� A tuple of the form < ui; ai > is a trust context where ui 2 U and ai 2 A,� Two or more trust contexts connected by the operator �and�form a trustcontext,
� Two or more trust contexts connected by the operator �or� form a trustcontext,
� Nothing else is a trust context.
17.2 Step 2: Trust relationship between information sources
Step 2 of the trust-based information aggregation scheme concerns assessing andderiving the trust relationship between the set of information sources in B. Theserelations are also called information source relative trustworthiness. The �rstversion of the technique to derive information source relative trustworthiness wasdescribed in Houmb, Ray and Ray (2006) [45].
Determining information source relative trustworthiness to express the perceivedabilities of an information source for providing accurate and correct informationfor a particular case description is done using two trust variables: (1) knowledgelevel and (2) expertise level. Details on how to derive these two levels is given inthe following.
17.2.1 Knowledge level
The trust variable knowledge level is used to express the perceived and relevantdomain knowledge for an information source according to the case description andthe trust context and is measured in terms of a knowledge score. Here, knowl-edge covers the perceived aggregate of information that an information sourcepossesses. Knowledge is most often perceived either through education or profes-sional work situations.
Knowledge level is a subjective measure and should therefore be assessed notonly by the information source itself but also by an evaluator (as done duringevaluation according to the Common Criteria) or a third party that has su¢ -cient overview of both the education and work experience for the informationsource. In addition, the third party or the evaluator has to be su¢ ciently aware

17.2 Step 2: IS trustworthiness weight 163
of the implications of the case description and the purpose and assumptions ofthe information that the information source is providing, as de�ned by the trustcontext. Such an evaluator or third party is external to a decision maker (the en-tity requesting information) and hence the trust relationship between the decisionmaker and the external source should also be established and evaluated However,in the trust-based performance weighting schema all trust relationships betweenthe decision maker and an external source are assumed to have the trust value 1.This means that the external source is considered to be totally trustworthy.
Deriving the knowledge level of an information source is done using three activi-ties. These are: (1) Establish the reference knowledge domain model. (2) Estab-lish the information source knowledge domain model for each information source.(3) Derive the relative knowledge score for each information source, by evaluationthe information source knowledge domain models against the reference knowledgedomain model normalised over all information sources. Estimating the relativeknowledge score from the comparison in activity 3 might be done in a number ofways. In the example in Section 18.1, a simple score-based approach is used.
When computing the knowledge score of an information source the two types ofknowledge domain models derived in activities 1 and 2 have di¤erent purposesin the computation and are thus modelled separately. The reference knowledgedomain model is used to derive the relative score for each of the knowledgedomains in the reference model. This is done using the knowledge domain scoremodel of activity 1. The information source knowledge domain models, which areevaluated against the reference knowledge domain model to derive the knowledgescore of the information sources, describes the perceived knowledge level for eachof the knowledge domains for each information source. These models express theknowledge score for each of the information sources and are derived using theinformation source knowledge domain score model in activity 2.
Activity 1: Establish the reference knowledge domain model. The ref-erence knowledge domain model consists of a set of knowledge domains relevantfor the case description and a speci�cation of their internal relations. The inter-nal relations are measured as the relative importance of each involved knowledgedomain. The knowledge domains might be derived using several techniques anda reference knowledge domain model is used to describe the relevant knowledgefor the case description under the conditions given in the trust context.
Figure 17.2 shows a general reference knowledge domain model consisting of fourdomains. The �gure shows both the involved knowledge domains and their relativeimportance weights. As can be seen in the �gure the four domains are: domainA, domain B, domain C and domain D and the relative importance weight for allknowledge domains is 0:25 in the importance weight interval [0; 1]. Section 18.1gives an example of a reference knowledge domain model, information source

164 17. Trust-Based Information Aggregation Schema
Fig. 17.2. General reference knowledge domain model
knowledge domain models and how to compare the two types of models to derivethe knowledge score.
Usually, the internal relation between the knowledge domains of the referenceknowledge domain model is not directly given or extractable and several externalsources must be used to derive the internal relation. This is supported by theknowledge domain score model described below.
Knowledge domain score model derives the relative importance and cover-age measured as knowledge domain score for each knowledge domain in thereference knowledge domain model according to the trust context C.

17.2 Step 2: IS trustworthiness weight 165
WKimp(x) =h[wKimp(x(j))]
mj=1
ix2X
(17.1)
qKimp=
"1P
jWKimp(x(j))
#x2X
(17.2)
WRKimp(x) = [qKimp�WKimp(x)]x2X (17.3)
WaggrKimp(X) = faggrKimp([WRKimp(x(j))]x2X) (17.4)
WKcov(x) =h[wKcov(x(j))]
mj=1
ix2X
(17.5)
qKcov=
"1P
jWKcov(x(j))
#x2X
(17.6)
WRKcov(x) = [qKcov�WKcov(x)]x2X (17.7)
WaggrKcov(X(j)) = faggrKcov([WRKcov(x)]x2X) (17.8)
WinitKDscore(X) =W aggrKimp(X)�W aggrKcov(X) (17.9)
qinitKDscore=1P
jW initKscore(X(j))(17.10)
WDKscore(X) = qinitKscore�W initKDscore(X) (17.11)
As can be seen in the knowledge domain score model each knowledge domainin the reference knowledge domain model is measured in terms of their impor-tance (weight) and coverage (weight) and modelled as the vectors wKimp andwKcov respectively. Here, coverage measures the extent that a knowledge domaincovers the required knowledge to assess the particular case description, whichis the problem being assessed. Importance on the other hand measures the im-portance that the knowledge domain has for an information source to provideaccurate information. More details on this distinction is given in the example inSection 18.1.
A knowledge domain is denoted j and the set of knowledge domains is denotedJ . Furthermore, there are m number of j in J , #j 2 J = m and thus the wKimpand wKcov vectors each have m elements. Note as m is a variable the number ofknowledge domains may vary from case to case.
The importance and coverage weights for each knowledge domain in the referenceknowledge domain model might be assigned by any of the involved evaluators orthird parities, such as stakeholders, standards or regulations. This means thatthere might be several data sets for the importance and coverage of a particularknowledge domain. These stakeholders, standards, regulations etc. are denotedexternal sources x and the set of external sources are denote X. The importance

166 17. Trust-Based Information Aggregation Schema
and coverage for each external source x 2 X are thus modelled as WKimp(x) =[wKimp(x(j))]
mj=1 and WKcov(x) = [wKcov(x(j))]
mj=1.
The knowledge domain score model �rst considers the importance weights. Equa-tion 17.1 in the knowledge domain score model derives the importance vectorWKimp(x) for all external sources in X. This gives #x 2 X number of impor-tance vectors. These importance vectors represent the initial importance weightsand must be normalised to express relative knowledge domain internal relation.This is done in (17.3) using the normalisation factor derived in (17.2) and resultsin #x 2 X number of normalised importance weight vectors.
As it is easier to work with one importance weight vector than an arbitrary num-ber of such vectors, the set of importance weight vectors are combined into oneimportance weight vector. This is done using the aggregation function faggrKimpin Equation 17.4. Here, the aggregation function includes normalisation and theoutput from the aggregation is one aggregated normalised importance weightvector.
The aggregation can be done using one of several available aggregation techniques,such as those described in Cooke (1991) [16]. In the example in Section 18.1 theaggregation is done by taking the arithmetic average. Taking the arithmetic aver-age is the simplest type of expert opinion aggregation and thus does not capturethe di¤erences in the ability of x to evaluate the relations between knowledgedomains.
Deriving the coverage weights for each knowledge domain is performed by fol-lowing the same procedure as for deriving the importance weight. The coverageweight vector for each x 2 X is derived using Equation 17.5. This result in#x 2 X of not normalised coverage weight vectors. Before these coverage weightvectors can be combined each must be normalised, which is done in (17.7) usingthe normalisation factor derived in (17.6). The aggregation of the #x 2 X ofnormalised coverage weight vectors derived in (17.7) is then aggregated in (17.8).
The importance score and coverage score vectors are then combined into an initialknowledge domain score vector using Equation 17.9. Finally, the initial knowledgedomain scores are normalised in (17.11) using the normalisation factor derivedin (17.10).
Activity 2: Establish the information source knowledge domain modelfor each information source. Activity 2 is supported by the informationsource knowledge domain score model described below. This model derives thescore of an information source for each of the knowledge domains in the referenceknowledge domain model. This is done independently from assessing the impor-tance and coverage of the knowledge domains in the reference knowledge domainmodel.

17.2 Step 2: IS trustworthiness weight 167
As for the knowledge domain score model, there might be several external sources(third parties) providing information used to evaluate the knowledge of an infor-mation source. Here, these external sources are denoted y to specify that theseexternal sources are di¤erent from those in the knowledge domain score modeland that x and y are independent. However, in practice x and y might be di¤er-ent external sources or the same sources playing di¤erent roles. The set of theseexternal sources is denoted Y .
Information source knowledge domain score model derives the relative scorefor each knowledge domain in the reference knowledge domain model for aninformation source bi according to the trust context C.
WKis(y(bi)) =h[wKis(bi(j))]
mj=1
iy2Y
(17.12)
qKis=
"1P
jWKis(bi(j)))
#y2Y
(17.13)
WRKis(y(bi)) = [qKis�W is(y(bi))]y2Y (17.14)
WaggrKis(Y (bi)) = faggrKis([WRKis(y(bi))]y2Y ) (17.15)
As can be seen in the information source knowledge domain score model each ex-ternal source y in the set of external sources Y gives information on the knowledgelevel for information source bi. The output of the information source knowledgedomain score model is a vector of information source knowledge domain score ag-gregated over all y in Y . This vector is denoted WaggrKis(Y (bi)) and the modelderives one such vector for each information source bi 2 B.Equation 17.12 is used to assess the score for information source bi, for all knowl-edge domains in the reference knowledge domain model. This is done for allexternal sources, meaning all y 2 Y and result in #y 2 Y of vectors. As thesevectors are not normalised their contained knowledge score for each knowledgedomain in the reference knowledge domain model must ve updated to expressthe relation between thema. This is done by normalising all #y 2 Y number ofvectors in (17.14) using the normalisation factor derived in (17.13).
To obtain one information knowledge domain score vector for bi, the #y 2 Ynumber of vectors derived in (17.14) is combined into one vector by aggregatingover Y using the aggregation function faggrKis in (17.15). Note that the aggrega-tion function includes normalisation and that the output of the aggregation thusis a normalised vector.
Activity 3: Derive the relative information source knowledge score.The result from the knowledge domain score model and the information source

168 17. Trust-Based Information Aggregation Schema
knowledge score model is then combined to derive the knowledge score for theinformation source bi. This is done in activity 3, which is supported by the knowl-edge score model described below.
Knowledge score model derives the knowledge score for an information sourcebi by combining the knowledge domain scores from the knowledge domainscore model with the values for each knowledge domain for an informationsource bi derived in the information source knowledge domain score model.
WKscore(bi) =X
bi2BWDKscore(X)�W aggrKis(Y (bi)) (17.16)
The result from the knowledge score model is a vector holding the score thatan information source bi has for each knowledge domain contained in the ref-erence knowledge domain model. This resulting knowledge score vector is de-rived by component-based multiplication of the two vectors WDKscore(X) andWaggrKis(Y (bi)) using Equation 17.16. By diving over the number 1 it makes iteasier to combine the knowledge score vector with the experience score to derivethe information source trustworthiness weight for bi which is the output of Step2 of the trust-based performance weighting scheme.
Note that the factor of trustworthiness of the external sources in X and Y are notconsidered in this model. As mentioned earlier all external sources are consideredto be completely trustworthy and thus all these trust relationships are assignedtrust value 1.
17.2.2 Expertise level
The second trust variable expertise level concerns the perceived level of expertisethat a particular information source has obtained in some way. Determining whois an expert and thus has a high level of expertise is usually highly subjectiveand determined by such as a certi�ed assessor in a security evaluation. Here, thetrust-based information aggregation schema is not concerned with the absolutemeasure of the expertise level but rather the relative perceived expertise levelof an information source. Relative in this context means relative to the otherinformation sources in B. As for knowledge level the expertise level is measuredin terms of a score, here called expertise score.
This expertise score is determined using three activities and these are: (1) Deriveinternal and relative category scores for all categories for each calibration variable.(2) Derive category scores for all calibration variables for each information source.

17.2 Step 2: IS trustworthiness weight 169
Table 17.1. Example calibration variables for determining the expertise level for aninformation source
Variables Categories
level of expertise low, medium, high
age under 20, 20-25, 25-30, 30-40, 40-50,over 50
years of relevanteducation
1 year, 2 years, Bsc, Msc, PhD, other
years of educa-tion others
1 year, 2 years, Bsc, Msc, PhD, other
years of experi-ence from the in-dustry
1-3 years, 5 years, 5-10 years, 10-15years, over 15 years
years of experi-ence from acad-emia
1-3 years, 5 years, 5-10 years, 10-15years, over 15 years
role experience database, network management, devel-oper, designer, security managementand decision maker
(3) Derive the expertise score for each information source by combing the resultfrom activity 2 with the result from activity 1 for each information source. Notethat the category scores in activities 1 and 2 are independent. Hence, changescan be made in the internal category scores for an calibration variable, withouthaving to reassess the category scores for all information sources.
The number and set of calibration variables used will vary from case to case de-pending on the case description. The trust-based information aggregation schemado not mandate the use of a particular set, as the schema assess the internal re-lations of the calibration variable set in activity 1. Table 17.1 gives an exampleset of calibration variables with their associated categories.
Activity 1: Deriving calibration variable category scores. Activity 1 ofderiving the expertise score is performed by the calibration variable categoryscore model described below. This model examines the internal relations of thecategories contained in each calibration variable and derives a calibration variablerelative category score for all categories for all calibration variables.
In the trust-based performance weighting schema the internal relations for ex-pertise level are measured in terms of importance related to the case description,which is the problem that the information source is providing information forand modelled using the two vectors WEcat and WEimp. WEcat is a support vec-

170 17. Trust-Based Information Aggregation Schema
tor used for reference purposes and holds the identity or name of each categoryin a calibration variable while WEimp holds the relative importance weights forthe categories of a calibration variable. Thus, the �rst element in WEcat for thecalibration variable v holds the name of its category number 1 while the �rstelement in WEimp for the calibration variable v holds the importance weight forits category number 1.
As for the knowledge level several external sources might provide information topopulate the two vectors. Also as for knowledge level, the external sources aredenoted x and the set of external sources are denoted X. In addition, there areusually several calibration variables involved and these are collected in the set Vof calibration variables v.
Calibration variable category score model derives the internal relative cat-egory score for all categories of all calibration variables according to the trustcontext C.
WEcat(v(k)) =h[wEcat(k)]
lk=1
iv2V
(17.17)
WEimp(x(v(k))) =h[wEimp(k)]
lk=1]v2V
ix2X
(17.18)
qEimp(v(k)) =
""1Pl
k=1WEimp(v(k))
#v2V
#x2X
(17.19)
WREimp(x(v(k))) =h[qEimp(v(k))�WEimp(x(v(k)))]v2V
ix2X
(17.20)
WaggrEimp(X(v(k))) =hfaggrEimp([WREimp(x(v(k)))]x�X)
iv2V
(17.21)
The calibration variable category score model starts with populating the cate-gories for each of the calibration variables. This is done in Equation 17.17 andresults in theWEcat vector with l number of elements for each calibration variable.The elements of each WEcat vector is the categories for the associated calibra-tion variable. Note that l might vary depending on the calibration variable andthat the categories for a calibration variable are given prior or as part of theassessment. Furthermore, in the calibration variable category score model, theassumption is that all external sources in X have come to an agreement on thename and number of categories for each calibration variable.
The importance weight of each category in a calibration variable is modelled asthe WEimp vector in the calibration variable category score model. As #x 2 X >

17.2 Step 2: IS trustworthiness weight 171
1 the importance weight for each category of an calibration variable can be givenby several external sources. This means that the WEimp vector for a calibrationvariable v is populated #x 2 X times to derive the initial category importanceweights using Equation 17.18. As the importance weight of the categories of v ismeasured relative to each other the initial importance weights from (17.18) mustbe normalised. This is done in (17.20) using the normalisation factor derived in(17.19) for all calibration variables v 2 V for all external sources x 2 X.To derive one category importance vector for each calibration variable, all nor-malised category importance vectors for all v 2 V are aggregated over X. Thisis done using Equation 17.21. As for the knowledge level the aggregation func-tion used may vary. An example of aggregating importance weights is given inSection 18.1.
The resulting aggregated category importance weight for all v 2 V needs to benormalised to recover the relative importance weights after the aggregation. Thisnormalisation is part of the aggregation function in (17.21).
Activity 2: Deriving information source calibration variable categoryscores. Activity 2 of deriving the expertise score concerns the evaluation of theabilities of each information source in relation to the categories of each calibrationvariable. This is done using the information source calibration variable categoryscore model described below. As for the knowledge level an additional set Y ofexternal sources y provides the information on the information sources.
Information source calibration variable category score model derives therelative category score for all categories of all calibration variables for an in-formation source according to the trust context C.
WEis(y(bi(v(k))))=
�h[wEimp(k)]
lk=1
iv2V
�y2Y
(17.22)
qEis(bi(v(k)))=
""1Pl
k=1WEis(bi(v(k)))
#v2V
#y2Y
(17.23)
WREis(y(bi(v(k)))) =�[qEis(bi(v)�WEis(y(bi(v)))]v2V
�y2Y (17.24)
WaggrEis(Y (bi(v(k)))) =hfaggrEis([WREis(y(bi(v)))]y�Y )
iv2V
(17.25)
The �rst task to perform in the information source calibration variable categoryscore model is to populate the WEis vector for the information source bi. This is

172 17. Trust-Based Information Aggregation Schema
done using Equation 17.22 for all y 2 Y . The WEis vector is used to model theinformation source category scores for a calibration variable v. Here, the #v 2 Vis the same as for the calibration variable category score and for each informationsource bi 2 B the WEis vector must be populated #v 2 V times for all y 2 Y .However, as it happens that one or more of y 2 Y do not have information onall categories for all calibration variables, a value to indicate the lack of informa-tion is introduced. The symbol for no information is �, which is padded for thecorresponding elements in the WEis vector.
As the category scores are measured in relation to each other, all WEis vectorsneed to be normalised. This is done in (17.24) by updating the result from (17.22)using the normalisation factor derived in (17.23) for all WEis vectors.
As the category scores for an information source is given by several externalsources y and as theWEis vectors only hold the scores for one y theWEis vectorsfor each calibration variable must be aggregated over Y . This is done using Equa-tion 17.25 and the results in the information source relative calibration variablecategory score for the information source bi. The result of the aggregation mayproduce not normalised values and thus normalisation must be performed. Thisis part of the aggregation function in (17.25).
Activity 3: Derive expertise score for each information source. In ac-tivity 3 of deriving the expertise score, the internal category scores from the cal-ibration variable category score model is combined with the information sourcecalibration category scores for all v 2 V . In the trust-based performance weight-ing schema this is done using the expertise score model described below. This usesEquation 17.26 where the expertise score is derived by component-wise multipli-cation over all calibration categories k. The construct in Equation 17.26 ensuresthat the resulting expertise score is equal or less than 1.
Expertise score model derives the expertise score for an information sourcebi by combing the calibration variable category score with the informationsource calibration variable category score for all v 2 V . The result is theexpertise score for an information source according to the trust context C.
FEscore(bi) =X
kWaggrEimp(X(v(k))�W aggrEis(Y (bi(v(k)))) (17.26)
17.2.3 Computing relative information source trustworthiness weights
The results from the two trust variables knowledge level and expertise level are theknowledge score and the expertise score for an information source bi respectively.

17.2 Step 2: IS trustworthiness weight 173
To derive the information source relative trustworthiness, which is the expectedoutput from Step 2 in the trust-based performance weighting schema, these twoscores must be combined. This is done using the relative IS trustworthiness modeldescribed below.
As the information sources in B are evaluated against each other the goal ofthe relative IS trustworthiness model is to derive a relative information sourcetrustworthiness weight and not the absolute trustworthiness weight for an infor-mation source. Also, as trust exists in a context the relative information sourcetrustworthiness weight is only valid for the trust context C.
Relative IS trustworthiness model is used to derive the relative trustwor-thiness weight for an information source bi. This is done by combining theknowledge score and the experience score for bi for the trust context C.
FinitTrust(bi) =
�FKscore(bi) + FEscore(bi)
2�"bi
�bi2B
(17.27)
qRTrust=1P
bi�BFinitTrust(bi)
(17.28)
FISTW (bi) = F initTrust(bi))� qRTrust (17.29)
The initial information source trustworthiness of information source bi is com-puted by the initial trustworthiness function FinitTrust(bi) in (17.27). This initialtrustworthiness is derived by adding the relative knowledge score with the rel-ative experience scores for all bi 2 B. As can be seen in (17.27) the knowledgeand experience scores are given the same importance weights in the relative IStrustworthiness model. If there is a need to emphasise one over the other, theinitial trustworthiness function can be changed to re�ect this.
As one of the common problems in subjective expert judgment is underestimationand overestimation by the external sources an error function is included in theinitial trustworthiness function. This error function is modelled as "(bi) and holdsthe experience-based corrections of overestimation and underestimation of Y onbi. Thus, "(bi) represents the ability of the model to capture the experience gainedon the use of Y to evaluate bi. If there is no prior experience in using Y to evaluatebi the error function is left empty. Note that the error function is able to captureindividual experiences of y as the output of the error function is a normalisedexpression over all y 2 Y . This also means that "(bi) 6= � in all cases where oneor more y of Y have experience.
More information on the problem of underestimation and overestimation or elici-tation and aggregation of subjective expert judgments in general can be found in
174 17. Trust-Based Information Aggregation Schema
Cooke (1991) [16], Cooke and Goossens (2000) [17], Goossens et al. (2000) [38],Cooke and Slijkhuis (2003) [18] and similar sources.
As the initial trustworthiness is not a relative measure it needs to be normalised.Normalisation is done by using Equation 17.29 which updates the initial trust-worthiness in (17.27) using the normalisation factor derived in (17.28).
As the relative information source trustworthiness weights are normalised, trust-worthiness is expressed as a weight with values in the range [0; 1]. Here, value 0means no trustworthiness and the value 1 means complete trustworthiness. Val-ues close to 0 express little trustworthiness and values close to 1 describe hightrustworthiness. If no information on the knowledge level and experience levelof bi is available the model does not provide any output for bi. This should beinterpreted as unknown trustworthiness. To ensure the computability of unknowntrustworthiness in the preceding steps in the trust-based information aggregationschema unknown trustworthiness is assigned the value 0.
17.3 Step 3: Trust relationship between decision maker andinformation sources
Step 3 of the trust-based performance weighting schema evaluates the trust rela-tionship between the decision maker and each of the information sources bi in theset of information sources B. This is done using the vector trust model developedby Ray and Chakraborty [87, 88].
The vector trust model measures trust as a value in the range [�1; 1] using thethree trust variables: knowledge, experience and recommendation. Please notethat the variable knowledge in the vector trust model is not the same as the trustvariable knowledge level in Step 2. Knowledge in Step 3 addresses the knowledgethat the decision maker has on the perceived past performance of an informationsource while knowledge level in Step 2 denotes the perceived level of knowledgethat an information source has gained through its personal and professional activ-ities. This implies that observable information sources do not perceive knowledgebut that they are considered completely knowledgeable within the knowledgedomain that the information they provide covers.
This work does not describe the vector trust model and the reader is referred toRay and Chakraborty [87, 88] for details. Here, it su¢ ces to say that the outcomeis a decision maker speci�c trust weight for each information source bi in the setof information sources B. This trust weight denotes the degree that the decisionmaker A trusts bi to provide correct and accurate information according to thetrust context C derived in Step 1.

17.5 Step 5: Aggregate information 175
17.4 Step 4: Updating the relative information sourcetrustworthiness weights
In Step 4 the relative information source trustworthiness weights derived in Step2 are updated with the result from Step 3 to derive the decision maker speci�crelative information source trustworthiness weights. This is done using Equation17.30.
As described earlier Step 3 derives the trust relationship and the trust weightbetween the decision maker, as the truster A and the information sources biin B and Step 2 derives the relative information source trustworthiness weightsfor all bi 2 B. These two types of weights are independent in the trust-basedperformance weighting schema and thus the contents of Step 2 and 3 can bemodi�ed independent of each other, as long as the output stays the same.
This also means that both this step and Step 3 can be skipped if the decisionmaker does not have any previous knowledge, experience or recommendation onthe information sources bi or to reduce the complexity of the schema. The outputof this step is the trust-based performance weight for each information source biin B.
FISTW_Step4(bi) =hFISTW (bi)� v(A
C! bi)ibi2B
(17.30)
Step 4 concludes the trust-based performance weighting schema. The initial ver-sion of this schema was published in Houmb, Ray and Ray (2006) [45]. Notethat the version of the schema described here di¤ers signi�cantly from the initialschema described in [45].
17.5 Step 5: Aggregating information (in the trade-o¤ tool)
Step 5 of the trust-based information aggregation schema is the trust-based in-formation aggregation. This is the step that connects the trust-based informationaggregation schema with the trade-o¤ tool described in Part 4. The main taskin this step is to aggregate the set of pieces of information from the informationsources. This is done by applying the associated trust-based performance weightderived in Step 4 of the trust-based performance weighting schema on each pieceof information. This task is ful�lled by performing the two activities: (1) Updateeach piece of information from bi by applying to it the relative trustworthiness

176 17. Trust-Based Information Aggregation Schema
weight of bi. (2) Aggregate all pieces of information by multiplying the result of(1) for all bi 2 B.Activity 1 is supported by Equation 17.31 and activity 2 is supported by Equation17.32. In (19.31), a piece of information provided by bi is denoted Ibi . If bi providesseveral pieces of information Equation 17.31 is performed for each of these piecesof information.
The result of activity 2 and hence Equation 17.32, is one set of information thatcan be directly fed into the associated nodes in the BBN topology of the trade-o¤tool described in Part 4.
FISTW_Step4Ud(bi)=�Ibi�F ISTW_Step4(bi)
�bi2B
(17.31)
Faggr_Step5(z)=�bi2BFISTW_Step4Ud(bi) (17.32)
An example of trust-based information aggregation and a short description ofthe implementation of Step 5 of the trust-based information aggregation schemais given in Section 18.1. There is also an alternative and explorative approachto combine observable and subjective information developed in this work. Thisapproach is described to some detail in Houmb (2005) [41].

Part VI
Validation, Discussion and Concluding Remarks


18. Validation of the Approach
This thesis has given an overview of the AORDD security solution decision frame-work and described some of the details of its two core components. These are theAORDD security solution trade-o¤ analysis with its trade-o¤ method and tooland the trust-based information aggregation schema for feeding information intothe trade-o¤ tool. Of the two the trust-based information aggregation schema israther explorative and has not been thoroughly evaluated. However, some vali-dation of the feasibility and usability of the schema has been performed throughcase studies by examples. The demonstration of the feasibility of the schema isgiven in Section 18.1.
The AORDD trade-o¤ analysis has been implemented as a BBN topology trade-o¤ tool and both have been tested and reviewed through three iterations of casestudy by example using the action research approach described in Section 1.4. Inaddition, an informal reasoning about the scalability, feasibility and applicabilityof the approach has been performed. The latter is documented brie�y in the dis-cussion provided in Chapter 19. The three example-runs of the AORDD securityanalysis trade-o¤ analysis are documented in several papers, the most importantbeing Houmb et al. (2006) [48] in Appendix B.2 and Houmb et al. (2005) [44] inAppendix B.3. Houmb et al. (2005) describes parts of the result from the �rstexample run of the trade-o¤ analysis while Houmb et al. (2006) describes partsof the result from the second example run. The third and �nal example run ispartly documented in Section 18.1.
The AORDD framework in itself is evaluated through validation of the ful�lmentof the research questions of this work and the requirements to the current de-sign. Validating the practical applicability of the framework and its containedcomponents is critical to its potential future use in industry as many techniquesdeveloped in the academia never make it to industry due to their inherent acci-dental complexity and lack of scalability.
The balance between desired and accidental complexity is a key factor in this con-text. Industry needs approaches that are easy to use and that take all necessaryfactors into consideration to ensure that they actually solve some real problems.

180 18. Validation of the Approach
To meet these demands, this work uses an action research based work processwith a step-wise practical validating using an example e-commerce system. Theevaluation in this work used the requirements, design documents and prototypedescription of the ACTIVE e-commerce platform developed by the EU-projectACTIVE and redeveloped parts of the e-commerce platform by a¢ liating theAORDD framework and in particular the AORDD security solution trade-o¤analysis and the trust-based information aggregation schema. The prototype ofthe ACTIVE system was �nalised in 1999. Details of the ACTIVE system can befound in Georg, Houmb and France (2006) [36].
This work approach has enabled the study of the practical implications of thecurrent design of the framework and its components at several points in time,as well as getting practical experience in doing development using the AORDDframework. This was done both in the initial exploration phase and in the de-velopment and evaluation phase of the construction work process used in thiswork (details are in Part 1). There have been many updates and changes to theframework and its components throughout the work and the framework and itscontained components are far from �nalised and need further revisions and vali-dation. The evaluation and validation performed in this work merely covers theinitial explorative phase and the �rst few iterations of the development and eval-uation phase from requirement speci�cation to testing and validation. The nextstep in the validation will need to include a realistic industrial scale case study.
18.1 Demonstration of the trade-o¤ tool and thetrust-based information aggregation schema to supportchoice of security solution
This chapter demonstrates the trade-o¤ tool and the trust-based information ag-gregation schema for aggregating information as input to the trade-o¤ tool usingthe login service of the reengineered version of the ACTIVE e-commerce proto-type platform, as described in Georg, Houmb and France (2006) [36]. The AC-TIVE e-commerce platform provides services for electronic purchasing of goodsover the Internet. The platform was initially developed for the purchase of med-ical equipment, but does also possess qualities that make it a general platform forproviding services on the Internet. Thus, ACTIVE is a general purchase platformthat can host a wide variety of electronic stores for vendors. The infrastructureconsists of a web server running Microsoft Internet Information Server (IIS), aJava application server (Allaire JSP Engine) and a Microsoft SQL server runningRDBMS. The communication between the application server and the database ishandled using the JDBC protocol.

18.1 Demonstration of the trade-o¤ tool and TBIAS 181
The IST EU project CORAS performed three risk assessments of ACTIVE inthe period 2000-2003 (for details see [19]). The project looked into security risksof the user authentication mechanism, secure payment mechanism and the agentnegotiation mechanisms of ACTIVE. Here, the focus is on the result of the �rstassessment which identi�ed the user authentication mechanism to be vulnerableto various types of Denial of Service (DoS) attacks and in particular the SYN-ACK �ooding attack [13]. This attack is well known and exploits a weaknessin the TCP three-way handshake. The handshake works as follows: whenevera host receive a SYN message it replies with an ACK message and waits forthe returning SYN message. If the returning SYN message does not arrive theconnection is kept open. If an attacker sends several SYN messages and henceopens several connection with the host it will lead to a situation where too manyconnections are left open. Soon the bu¤er at the host is �lled up and the host isunable respond to any other requests. Thus, the host is busy waiting for messagesthat never arrive. There are several possible solutions to this security problem.The following sections demonstrates how to evaluate the �tness score of two suchsolutions using the AORDD security solution trade-o¤ analysis and the trust-based information aggregation schema.
18.1.1 Aggregating information as input to the trade-o¤ tool usingthe trust-based information aggregation schema
As described in Part 5 the trust-based information aggregation schema consistsof �ve steps. This section demonstrates the use of Step 1; specify trust context,Step 2; trust relationship between information sources and Step 5; aggregateinformation, of this schema to support choice of security solution.
Step 1 of the trust-based information aggregation schema. Step 1 ofthe schema concerns the speci�cation of the trust context which is important toensure that the information sources and the decision maker have the same under-standing of the information provided and received. As described in Part 5 this isspeci�ed as a set of trust purposes and assumptions in the trust context C. Thetrust context C must be the same to combine the various pieces of informationprovided by the information sources.
However, before the trust context can be speci�ed the case description must begiven, as described in Chapter 7. The goal in this context is to support a decision-maker A in choosing between two security solutions for the DoS attack SYN�ooding. The two DoS security solutions are: (1) the cookie solution denoteds1 and (2) the �lter mechanism denoted s2. The cookie solution is a patch tothe network stack software that adds another message layer once the partialconnection data structures become close to full. In this solution a cookie is sent

182 18. Validation of the Approach
to the client and the pending connection is removed from the data structure. Ifthe client does not respond within a short period of time the cookie expires andthe client must restart the TCP three-way handshake. If the client responds intime the SYN-ACK message is sent and the connection is set up as in the originalcase. Adding the cookie message makes it unlikely that an attacker can respondin time to continue setting up the connection. The cookie will expire on the serverwithout taking up any storage in the data structures of the pending connectionsand if the client address has been spoofed the client will not respond in any event.In both cases the cookie will expire on the server without taking up any storagein the pending connections data structures.
The DoS security solution �ltering mechanism consist of �ltering rules that con-trolles all inbound and outbound communication requests. These �ltering rulesare contained in a software extension to the network stack software. So, ratherthan adding another message layer the �ltering mechanism adds a �ltering serviceto the network stack that works similar to a simple �rewall �ltering mechanism.This �ltering mechanism checks the source IP address of all inbound and out-bound connections requests against a list of allowed IP addresses. By doing sothe client will only allow communication from hosts that it trusts. However, the�ltering mechanism will not protect against DoS attacks from trusted hosts orDoS attacks that are routed through one or more trusted hosts.
The above description represents a simple case description. In addition to theabove a state transition diagram and associated transition probability matrixshould also be modelled, as described in Chapter 7 and Houmb, Georg, France,Reddy and Bieman (2004) [43].
Before starting with the examination of the potential information sources andcollecting the information, the trust context must be speci�ed. As described ear-lier the trust context speci�es under which circumstances the information sourceswill provide information on the problem according to the case description. Thisinvolves specifying the purpose and assumption, as described in Section 17.1.
In this example there are a set of information sources B where bi represent infor-mation source number i and where all information sources provides informationon the expected availability of the two DoS security solutions. The decision maker
is denoted A. The trust context for all trust relationships is denoted A C! bi andthe trust context function C(T ) is a tuple of the form < ui; ai > where ui 2 Uand ai 2 A. To make the information possible to aggregate, the trust context forall information sources must be the same, meaning C(T )bi=C(T )bi+1 for all i.
The purpose 8i ubi where 8i ubi 2 U of the trust relationships 8i A !bi is that of: �The information source bi should provide correct and accurateinformation on the security attribute availability for each of the two security

18.1 Demonstration of the trade-o¤ tool and TBIAS 183
solutions: cookie solution and �ltering mechanism, separately according to thecase description in terms of the anticipated number of successful DoS attacks withthe respective security solution incorporated into the login mechanism for the e-commerce prototype per month.
The assumptions 8i abi where 8i abi 2 A of the trust relationships 8i A ! bi isas following. Recall from Section 17.1 that the assumptions are comprised of fourparts: (1) Decision maker�s understanding of the information request. (2) Infor-mation source�s understanding of the information request. (3) Decision maker�sunderstanding of the information provided. (4) Information source�s understand-ing of the information provided. For all information sources in set B their under-standing of both the information request and information they are providing arethe same, namely the number of successful DoS attacks per month for each of thesecurity solutions. This refers to assumptions 2 and 4 for all information sourcesin the set B. The decision maker�s (A) understanding of the information he or shehas requested and hence that should be provided by the information sources, isthe number of successful DoS attacks per month for each of the security solutions.This refers to assumptions 1 and 3. This gives the trust context function:
C(T ) = 8i < ubi ; abi> \ < ubi+1 ; abi+1>=< ubi ; abi>=< ubi+1 ; abi+1> (18.1)
Step 2 of the trust-based information aggregation schema. Step 2 of thetrust-based information aggregation schema is used to derive the relative informa-tion source trustworthiness weights. Before performing this step the informationsources involved need to be identi�ed and described.
This example uses �ve information sources where one is an observable informationsource and the four others are subjective information sources. The �ve sources arethe real-time observable information source honeypot and four domain experts,which gives the following: fbhoneypot; b4; b6; b15; b18g 2 B. These �ve informationsources provided information on the anticipated number of DoS attacks for thetwo involved DoS security solutions to the decision maker A according to the trustcontext speci�ed above. In addition to the �ve information sources there is oneexternal source x in X to provide information on the calibration variables usedand one external source y in Y that assesses each information source accordingto the calibration variables in Step 2. Details on the external sources are givenin Section 17.2.
The observable information source honeypot was set up to re�ect the con�gura-tion of ACTIVE (Windows NT 4.0 operating system and IIS 4.0). As a secondlayer of logging the Intrusion Detection System (IDS) Snort were used. For moreinformation on the honeypot and its con�guration the reader is referred to Øst-vang (2003) [81]. The group of experts used was comprised of undergraduate

184 18. Validation of the Approach
students at Norwegian University of Science and Technology. Further informa-tion on the collection of expert judgments is provided in Houmb, Johnsen andStålhane (2004) [49]. The reader should note that to make the example tractableonly the judgments from 4 of the 18 domain experts involved in the experiementare included.
For the information source �honeypot�information was extracted from the hon-eypot and the Snort log �les. Logging was done for the same amount of time,namely 24 hours for the three con�gurations: (1) system without any securitysolutions, (2) system with the patch to the network stack software: the cookiesolution and (3) system with the �ltering mechanism. For con�guration (1) Snortdetected 470 di¤erent IP addresses trying to open connections to port 80 whichgives 470=24 = 19:8 attack tries per hour. Here, the interest is in the attackattempts where outsiders sent several SYN requests to the same source. 140 ofthe 470 IP-addresses sent series of SYN requests to the same source within 24hours which gives 140=24 = 5:8 SYN �ooding attack attempts per hour. Twoof the attack attempts were successful and thus MTTM=12:0 hours. The meanattack time (e¤ort) for the successful attacks is denoted mean e¤ort to misuseand was METM=0:2 hours. METM is a measure of the average time (clock time)it takes an attacker to perform the attack. MTTM is a measure for the averagetime (clock time) it takes between attacks. In this case it is the successful attacksthat are taken into consideration and not the attack attempts. More informationon MTTM and METM is given in Part 4 and Houmb, Georg, France, Reddy andBieman (2005) [43].
Computed average monthly (assuming a 30 day month) successful attacks for (1)were 60. For the cookie solution (con�guration 2), the average monthly successfulattacks observed was 1:5 and for the �ltering mechanism (con�guration 3), theaverage monthly successful attacks observed was 4:0. As the honeypot simulatedthese three con�gurations no updates were done between the attack attemptsand successful attacks. However, this is usually done in a real system (otherwisethe system would just keep on being attacked until it crashed).
The information extracted from the log �les is used as the information providedfrom the information source bhoneypot when evaluating the two DoS security so-
lutions. The information source is assigned the trust value v(A C! bhoneypot) = 1which means completely trustworthy as honeypot is a directly observable informa-tion source that observes actual events and as the decision maker A has completetrust in the abilities of honeypot to provide accurate and correct informationon the potential number of successful DoS attacks. This means that there is noneed to calculate the knowledge and experience score for the information sourcehoneypot and that the initial trustworthiness weight can be directly assigned asFinitTrust(bhoneypot) = 1. This is done using the relative IS trustworthiness model

18.1 Demonstration of the trade-o¤ tool and TBIAS 185
50 %
20 %
15 %
10 %5 %
Domain A: securitymanagementDomain B: networkmanagementDomain C: database
Domain D: design
Domain E: developer
Domain A
Domain B
Domain C
Domain DE
50 %
20 %
15 %
10 %5 %
Domain A: securitymanagementDomain B: networkmanagementDomain C: database
Domain D: design
Domain E: developer
Domain A
Domain B
Domain C
Domain DE
Fig. 18.1. Reference knowledge domain model
described in Part 5. It should be noted however that honeypots are subject tothe problem of simulating su¢ ciently realistic system environment and that IDSsare subject to the problem of false positives.
Elicitation of expert judgments was done using a combined knowledge and ex-pertise level questionnaire. The data provided on each expert for all variables inthe questionnaire was then used to derive the knowledge and expertise score, asdescribed in Sections 17.2.1 and 17.2.2. Table 18.1 shows the variables and thevalues provided for the combined questionnaire. For discussion on problems andpossible biases related to the procedure of collecting expert judgment, see Cooke(1991) [16] and Cooke and Goossens (2000) [17].
As described in Section 17.2.1 the knowledge score for an information source isdetermined by comparing the information source knowledge domain models withthe reference knowledge domain model. The reference knowledge domain modelis created by combining the importance and coverage weights for the aggregatedset of knowledge domains provided, by the set of external sources X, using theknowledge domain score model described in Section 17.2.1. The relevant knowl-edge domains are: security management, design, network manager, database anddeveloper. Figure 18.1 shows the four knowledge domains and their internal rela-tive importance. For demonstration purposes the focus is put on the result of theidenti�cation rather than discussing techniques used to identify these knowledgedomains.
To provide data on each information source a domain expert that was not part ofthe expert judgment panel was used as the external source x1 2 X. This external
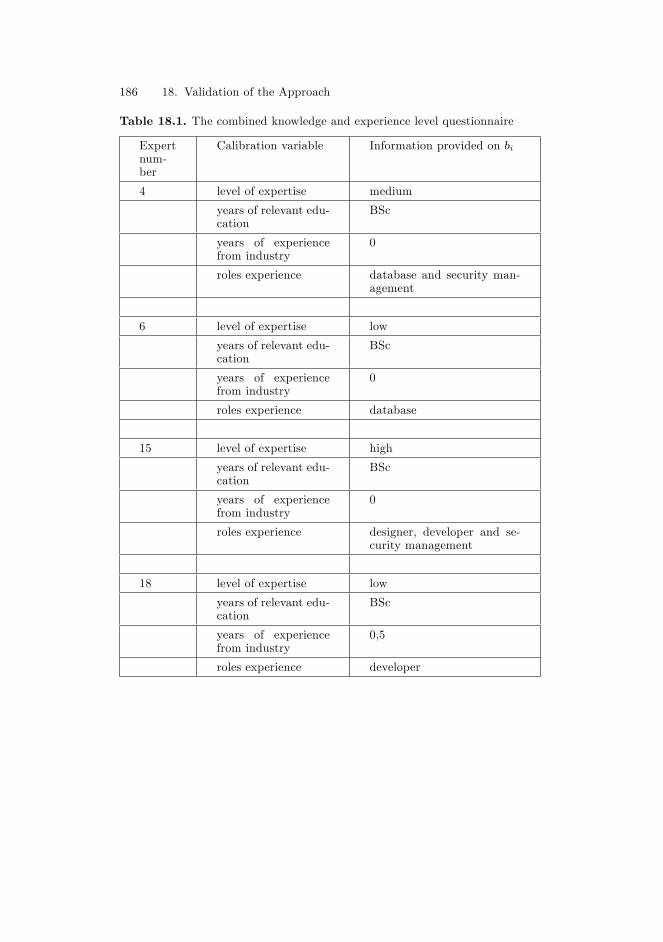
186 18. Validation of the Approach
Table 18.1. The combined knowledge and experience level questionnaire
Expertnum-ber
Calibration variable Information provided on bi
4 level of expertise medium
years of relevant edu-cation
BSc
years of experiencefrom industry
0
roles experience database and security man-agement
6 level of expertise low
years of relevant edu-cation
BSc
years of experiencefrom industry
0
roles experience database
15 level of expertise high
years of relevant edu-cation
BSc
years of experiencefrom industry
0
roles experience designer, developer and se-curity management
18 level of expertise low
years of relevant edu-cation
BSc
years of experiencefrom industry
0,5
roles experience developer

18.1 Demonstration of the trade-o¤ tool and TBIAS 187
source did the identi�cation based on prior experience in the domain of securesystem development. Due to the subjective nature of this assessment and becausethe set of external sources X only consist of one external source x1 the potentialbiases need to be assessed. What is needed to reduce the degree of bias is toestablish guidelines for knowledge domain identi�cation. This is the subject offurther work.
The importance weight for each of the knowledge domains is modelled usingEquations 17.1, 17.2, 17.3 and 17.4 from the knowledge domain score modeldescribed in Section 17.2.1. This information is provided by x1 and accordingto Equation 17.1. This gives WKimp(x1) = [1; 0:5; 0:5; 0:2; 0:2]. The elementsin the importance vector for x1 are then normalised in Equation 17.3 usingthe normalisation factor derived in Equation 17.2, which is qKimp � 0:4. Thisgives WRKimp(x1) = [0:4; 0:2; 0:2; 0:1; 0:1]. As there is only one external sourceWaggrKimp(X) =WRKimp(x1).
As can be seen in Figure 18.1 the coverage for the di¤erent knowledge domainsin the reference knowledge domain model are: 50% for security management,20% for network management, 15% for database, 10% for design and 5% fordeveloper. The coverage vector is modelled using Equation 17.5 in the knowledgedomain score model, which givesWKcov(x1) = [0:5; 0:2; 0:15; 0:1; 0:05]. As X onlycontains x1 and as the coverage weights are already normalisedWaggrdKcov(X) =WRKcov(x1) =WKcov(x1).
Based on the two above vectors the knowledge domain score for each of the knowl-edge domains is computed using Equation 17.9, which gives WinitKDscore(X) =[0:5� 0:4; 0:2� 0:2; 0:15� 0:1; 0:1� 0:1; 0:05� 0:1] = [0:2; 0:04; 0:015; 0:01; 0:005].These knowledge scores are then normalised in Equation 17.11 using the normali-sation factor derived in Equation 17.10. The normalisation factor is: qinitKscore =3:8 and the normalised vector is WDKscore(X) = [0:8; 0:2; 0:0; 0:0; 0:0].
Figure 18.2 shows the information source knowledge domain models for the fourexperts (the subjective information sources). The coverage that each of the ex-perts have for the knowledge domains are the following: 80% on security manage-ment and 15% on database for expert 4. 100% on database for expert 6. 60% fordesign, 30% on developer and 10% for security management for expert 15. 100%on developer for expert 18. The knowledge level for each expert is computed us-ing the information source knowledge domain score model described in Section17.2.2 and Equation 17.16 in the knowledge score model. Using Equation 17.12in the information source knowledge domain score model gives the informationsource knowledge domain vectors:
� Expert 4: b4: Wis(y1(b4)) = [0:85; 0:0; 0:15; 0:0; 0:0]
� Expert 6: b6: Wis(y1(b6)) = [0:0; 0:0; 1:0; 0:0; 0:0]

188 18. Validation of the Approach
� Expert 15: b15: Wis(y1(b15)) = [0:1; 0:0; 0:0; 0:6; 0:3]
� Expert 18: b18: Wis(y1(b18)) = [0:0; 0:0; 0:0; 0:0; 1:0]
As all information source knowledge domain vectors are already normalised,WRKis(y1(bi)) = Wis(y1(bi)) for all bi 2 B. And as there are only one exter-nal source y1 in the set of external source Y Equation 17.14 and 17.15 does notapply and thus FaggrKis(y1(bi)) = Wis(y1(bi)). The knowledge score for each ofthe information source are then derived using Equation 17.16 in the knowledgescore model:
� Expert 4: b4:WKscore(y1(b4)) = 0:85�0:8+0�0:2+0:15�0+0�0+0�0 � 0:7� Expert 6: b6: WKscore(y1(b6)) = 0� 0:8 + 0� 0:2 + 1� 0 + 0� 0 + 0� 0 = 0� Expert 15: b15:WKscore(y1(b15)) = 0:1�0:8+0�0:2+0�0+0:6�0+0:3�0 =0:08 � 0:1
� Expert 18: b18: WKscore(y1(b18)) = 0�0:8+0�0:2+0�0+0�0+1:0�0 = 0
These resulting knowledge scores are not normalised over the number of informa-tion sources in this example. The reason for this is to express the perceived levelof knowledge rather than the normalised level, as this makes it easy to add inmore information sources in B throughout the evaluation (recall that there were18 experts and that only 4 of these are included in this example).
The expertise level for an information source is derived using the calibration vari-ables described in Table 18.1, as described in Section 17.2.2. First the importanceweight for each of the categories for all calibration variables needs to be deter-mined. This is done using the calibration variable category score model. In thisexample only three calibration variables is used to determine the expertise level,namely �level of experience�denoted v1, �years of relevant education�denoted v2and �years of experience from industry�denoted v3. This gives the following vec-tors of categories for the three calibration variables according to Equation 17.17in the calibration variable category score model from Section 17.2.2:
� WEcat(x1(v1(k))) = [0low0;0medium0;0 high0]
� WEcat(x1(v2(k))) = [0BSc0]
� WEcat(x1(v3)(k)) = [0per_year0]
Next the importance weight for each of the categories for all calibration vari-ables is derived. This is done using Equations 17.18 through 17.21 in the calibra-tion variable category score. For the calibration variable �level of experience�the

18.1 Demonstration of the trade-o¤ tool and TBIAS 189
Fig. 18.2. Information source knowledge domain models for experts 4, 6, 15 and 18
external source x1 provided the following importance weights: Wimp(x1(v1(k =�low�)) = 0:2,Wimp(x1(v1(k = �medium�)) = 0:5 andWimp(x1(v1(k = �high�))) =1:0. For the calibration variable �years of relevant education� the importanceweight given by x1 are Wimp(x1(v2(k = �BSc�))) = 0:2. For the calibration vari-able �years of experience from industry� the importance weight given by x1 isWimp(x1(v3(k = �per_year�))) = 0:2 for each year of industrial experience. Asfor the category vectors the aggregated vectors equals the vectors for the externalsource x1, as x1 is the only external source in X. Before aggregating though, thevectors needs to be internally normalised. This gives the following normalisedaggregated vectors:
� WaggrEimp(X(v1(k))) = [0:1; 0:3; 0:6]
� WaggrEimp(X(v2(k)) = [1:0]
� WaggrEimp(X(v3(k)) = [1:0]
Before computing the expertise score for each information source the externalsources yi 2 Y provide data sets for all bi 2 B . As for the knowledge scoreonly one external source is used and this is yi. The information provided by y1is shown in Table 18.1 and the information source calibration variable categoryscore model in Section 17.2.2 is used to derive the information source speci�c score

190 18. Validation of the Approach
for each of the categories for all three calibration variables. As when deriving theknowledge score each variable for each information source is modelled as vectors.In this case Equation 22 in the information source calibration variable categoryscore model is used to derive the set of vectors.
� Expert 4: WEis(b4(v1(k))) = [0medium0], WEis(b4(v2(k))) = [0BSc0] andWEis(b4(v3(k))) = [0]
� Expert 6: WEis(b6(v1(k))) = [0low0], WEis(b6(v2(k))) = [
0BSc0] andWEis(b6(v3(k)) = [0]
� Expert 15: WEis(b15(v1(k))) = [0high0], WEis(b15(v2(k))) = [
0BSc0] andWEis(b15(v3(k)) = [0]
� Expert 18: WEis(b18(v1(k))) = [0high0], WEis(b18(v2(k))) = [
0BSc0] andWEis(b18(v3(k)) = [0:5]
As there are only y1 in Y , there is no need to aggregate information over Y andWaggrEiS(Y (bi(v(k))) =WEis(y1(b1(v(k))) for all k.
The expertise score for the information sources are then computed using Equation17.26 in the the expertise score model which gives:
� Expert 4: FEscore(b4(v1(k))) = [0:3], FEscore(b4(v2(k))) = [1:0],FEscore(b4(v3(k))) = [0:0] and FEscore(b4) = (0:3 + 1:0 + 0:0)=3 = 0:4
� Expert 6: FEscore(b6(v1(k))) = [0:1], FEscore(b6(v2(k))) = [1:0],FEscore(b6(v3(k))) = [0:0] and FEscore(b6) = (0:1 + 1:0 + 0:0)=3 = 0:4
� Expert 15: FEscore(b15(v1(k))) = [0:6], FEscore(b15(v2(k))) = [1:0],FEscore(b4(v3(k))) = [0:0] and FEscore(b15 = (0:6 + 1:0 + 0:0)=3 = 0:5
� Expert 18: FEscore(b18(v1(k))) = [0:6], FEscore(b18(v2(k))) = [1:0],FEscore(b18(v3(k))) = [0:1] and FEscore(b18 = (0:6 + 1:0 + 0:1)=3 = 0:6
Now both the knowledge and expertise score are derived for all �ve informationsources. These two scores are then combined when estimating information sourcerelative trustworthiness using the relative IS trustworthiness model described inSection 17.2.3. Recall that the initial trustworthiness for the information sourcehoneypot was set to FinitTrust(bhoneypot) = 1:0. The initial trustworthiness for thefour experts are derived using Equation 17.27 in the relative IS trustworthinessmodel which combines the knowledge score for bi with its expertise score. Asthere are no previous experience on the use of y1 to assess B, the error function"bi = 0 for all bi 2 B. See Section 17.2.3 for details. This gives:
� Honeypot: FinitTrust(bhoneypot) = 1:0

18.1 Demonstration of the trade-o¤ tool and TBIAS 191
� Expert 4: FinitTrust(b4) = (0:7 + 0:4)=2 = 0:6� Expert 6: FinitTrust(b6) = (0:0 + 0:4)=2 = 0:2� Expert 15: FinitTrust(b15) = (0:08 + 0:5)=2 = 0:3� Expert 18: FinitTrust(b18) = (0:0 + 0:6)=2 = 0:3
These initial trustworthiness weights are normalised in Equation 17.29 using thenormalisation factor derived in Equation 17.28, which is qRTrust = 1=(1:0+0:6+0:2 + 0:3 + 0:3) = 0:4. This gives the following updated relative trustworthinessweights:
� Honeypot: FISTW (bhoneypot = 1:0� 0:4 = 0:4� Expert 4: FISTW (b4) = 0:6� 0:4 = 0:3� Expert 6: FISTW (b6) = 0:2� 0:4 = 0:1� Expert 15: FISTW (b15) = 0:3� 0:4 = 0:1� Expert 18: FISTW (b18) = 0:3� 0:4 = 0:1
As can be seen by the above results the information source relative trustworthi-ness weights re�ect the information provided on each source�s knowledge domainsand level of expertise. In this example expert 4 possesses two knowledge domainswhere one of the domains is security management which is assigned a high levelof importance. Expert 4 also has a medium level of expertise. It is therefore rea-sonable that expert 4 is given a higher trustworthiness weight than expert 18 asexpert 18 has a low level of expertise and only covers one knowledge domain forwhich are given a low level of importance. As also can be seen by the result it isnot possible to distinguish between expert 6, 15 and 18. This is also reasonabletaking into account that their knowledge domains and level of expertise combinedequals out the di¤erences. This concludes Step 2 of the trust-based informationaggregation schema.
Step 5 of the trust-based information aggregation schema. In Step 5 ofthe trust-based information aggregation schema the information source relativetrustworthiness weights derived in Step 2 is applied to the information providedby each information source. Step 5 is thus the link between the trust-based in-formation aggregation schema and the trade-o¤ tool in the AORDD framework.However, note that it is possible to apply an equal weighting information aggre-gation schema and thus directly insert the information into the relevant variablein the BBN topology of the trade-o¤ tool. The reason why the trust-based infor-mation aggregation schema is introduced is to distinguish between informationsources and to make use of disparate information sources.

192 18. Validation of the Approach
Recall that the information provided from the information source honeypot wasfor the misuse variables MTTM and METM and the security solution variablesE¤ect on METM and E¤ect on MTTM while the four experts provided infor-mation on the security level of the e-commerce system taken both the misuseSYN attack and the two security solutions into consideration. This means thatthe pieces of information provided goes into di¤erent variables in the BBN topol-ogy of the trade-o¤ analysis. However, before populating the BBN topology withinformation each piece of information provided must be made relative using theinformation source trustworthiness weights derived in Step 2. This is what is donein Step 5 of the trust-based information aggregation schema.
The information provided by bhoneypot was bhoneypot(s1) = 1:5 and bhoneypot(s2) =4:0 (s1 =�cookie_solution�and s2 =�filter_mecha�nism�). The information provided by b4 was b4(s1) =�medium�and b4(s2) =�low�.The information provided by b6 was b6(s1) =�medium�and b6(s2) =�medium�.The information provided by b15 was b15(s1) =�medium�and b15(s2) =�low�. Theinformation provided by b18 was b18(s1) =�high�and b18(s2) =�low�. These piecesof information are then updated with the trustworthiness weights, which gives:
� bhoneypot(s1) = 1:5 and bhoneypot(s2) = 4:0 at a relative weight of 0:4 (this isinterpreted as the state �high�for s1 and �low�for s2 in the reminder of thisexample)
� b4(s1) =�medium�at a relative weight of 0:3 and b4(s2) =�low�at a relativeweight of 0:3
� b6(s1) =�medium�at a relative weight of 0:1 and b6(s2) =�medium�at a relativeweight of 0:1
� b15(s1) =�medium� at a relative weight of 0:1 and b15(s2) =�low�at a relativeweight of 0:1
� b18(s1) =�high� at a relative weight of 0:1 and b18(s2) =�low� at a relativeweight of 0:1
The important thing to note is that the trustworthiness weight cannot directlybe combined with the information provided. This is because the trustworthinessweights do not denote a probability, but the relative weight of each of the infor-mation sources. Thus, b4(s1) =�medium�at a relative weight of 0:1 does not meanthat the state is �medium�with a probability P = 0:1, but that the informationprovided by expert 4 should contribute with 0:1 to the outcome of the variableit is inserted into in the BBN topology of the trade-o¤ tool. The information isthus aggregated by taking the contribution factor of each piece of information.To make this tractable Step 5 is implemented as a BBN that are connected to

18.1 Demonstration of the trade-o¤ tool and TBIAS 193
Fig. 18.3. Information inserted and propagated for security solution s1 (cookie solution)
Fig. 18.4. Information inserted and propagated for security solution s2 (�lter mecha-nism)
the BBN topology of the trade-o¤ tool for the AORDD security solution trade-o¤analysis.
Figure 18.3 shows the BBN implementation of Step 5 with the information fors1 entered and propagated through the network using the utility function �Step5 Utility�while Figure 18.4 shows the same for the security solution s2.

194 18. Validation of the Approach
Fig. 18.5. The top-level network of the trade-o¤ tool BBN topology
18.1.2 Tradeing o¤ two DoS security solutions using the trade-o¤tool BBN topology
The AORDD security solution trade-o¤ analysis is implemented as the trade-o¤ tool BBN topology as described in Part 4. The overall goal of the trade-o¤analysis is to support a decision maker in identifying the best-�tted securitysolution among alternatives taken security, development, project and �nancialperspectives into consideration. This is done by deriving and comparing securitysolution �tness scores. The following gives a demonstration of the use of the trade-o¤ tool BBN topology to evaluate the �tness of the two DoS security solutionss1 =�cookie_solution�and s2 =�filter_mechanism�for the misuse TCP SYN�ooding attack, as described in the previous sections.
Figure 18.5 shows the top-level network of the trade-o¤ tool BBN topology fromPart 4. The AORDD trade-o¤ analysis method takes the output from the trust-based information aggregation schema as demonstrated in the previous sectionas input and follows the seven step trade-o¤ procedure described in Chapter 14.In addition, the development, project and �nancial perspectives are added alongwith any other relevant information available.
Step 1 in the trade-o¤ analysis method procedure is to estimate the input para-meters in the set I where I = fMI;MF;MTTM;METM;MC;SE; SCg. Thevariables MI, MF, MTTM, METM and MC are misuse variables in the risk levelsubnet (modelled as the input node Risk Level (RI) in Figure 18.5) while the vari-ables SE and SC are security solution variables in the security solution treatmentlevel subnet (modelled as the Security Solution Treatment Level (SSTL) input

18.1 Demonstration of the trade-o¤ tool and TBIAS 195
Fig. 18.6. The resulting risk level
node in Figure 18.5). The information given for these variables was presented andaggregated using the trust-based information aggregation schema in the previoussection. The result of the information aggregation is the treatment level of s1 ands2 which is inserted directly into the intermediate node treatment e¤ect and costin the top-level network. See previous sections for details.
Step 2 in the trade-o¤ analysis method procedure is to estimate the securitylevel of the ToE or case description before any security risks or security solutionshave been considered. This is done using the assurance functional components ofCommon Criteria Part 3. As no such information is available in this example theSSLE subnet is not included when deriving the �tness scores of s1 and s2.
In Step 3 of the trade-o¤ analysis method the misuse variables information fromStep 1 is inserted into the risk level subnet. In this example only the misusevariable METM and MTTM are considered (static security level). These whereidenti�ed to beMETM =�low�andMTTM =�low�. Details are given in Houmb,Georg, France, Reddy and Bieman (2005). Figure 18.6 shows the resulting risklevel when these two pieces of information has been entered as evidence intothe network. Note that Figure 18.6 shows a re�ned version of the RL subnetwhere only theMETM andMTTM variables are taken into consideration whenderiving the risk level.
In Step 4 of the trade-o¤analysis method, the information on the security solutionvariables from Step 1 is inserted into the security solution treatment level subnet.As the security e¤ect is measured using the sub-variables SE on METM, SE onMTTM, SE on MI and SE on MF the SE variable is modelled as an intermediatenode in the SSTL subnet with these four sub-variables as observable nodes thatprovides information to the SE node. As there are no information available on

196 18. Validation of the Approach
Fig. 18.7. The resulting security solution treatment level for the security solution s1with the information from the information sources inserted and propagated
Fig. 18.8. The resulting security solution treatment level for the security solution s2with the information from the information sources inserted and propagated
the cost of the two DoS security solutions s1 and s2 the SSTL subnet is re�nedand includes only the relevant variables in this example. Figure 18.7 shows theresulting security solution treatment level for the security solution s1 with theSE information inserted and propagated while Figure 18.8 shows the same forsecurity solution s2. Details on the computation of the resulting NPT for both s1and s2 are given in Figure 18.9. Note that the information inserted in the SSTLsubnets for s1 and s2 are the result from Step 5 in the trust-based informationaggregation schema from the previous section.
In Step 5 of the trade-o¤ analysis method the trade-o¤ parameters in the TOPsubnet is estimated. The trade-o¤ parameters are modelled as the set T where

18.1 Demonstration of the trade-o¤ tool and TBIAS 197
Fig. 18.9. Details on the computations made for the Security Solution E¤ect node forsecurity solution s1 and security solution s2
T = fSAC;POL; STA;LR;BG; TTM;BU;PRIg. These are the development,project and �nancial perspectives included in the trade-o¤ analysis and modelledas variables in the TOP subnet of the trade-o¤ tool BBN topology.
To limit the scope and to show the �exibility of the trade-o¤ analysis, only threeof the trade-o¤ parameters are considered in this example. These are securityacceptance criteria (SAC), budget and TTM. Figure 18.10 shows the nodes withthe prior node probability distributions of the re�ned TOP subnet. The SACvariable is used to specify acceptable risk level or the security requirements thatmust be ful�lled. The budget and TTM variables are used to specify the budgetavailable for risk mitigation and the date or days or similar when the systemshould be launched on the market. All three variables can be estimated usingeither qualitative or quantitative values. The trade-o¤ tool supports both butin this example qualitative values are used for the estimation of all variablesinvolved.
As can be seen in this �gure the variable SAC is an intermediate node in theTOP subnet and has sub-variables associated to it. These are the seven securityattributes con�dentiality, integrity, availability, authenticity, accountability, non-repudiation and reliability. Each of these seven sub-variables has four associatedstates and the outcome of the states of all seven sub-variables determines thestate of the SAC variable.
Security requirements are usually given according to the system assets and theirperceived and desired security properties. To simplify the example neither thesystem assets nor the Common Criteria security assurance components whichare part of the SSLE subnet of the trade-o¤ tool BBN topology and estimated inStep 2 of the trade-o¤ analysis method procedure are taken into consideration inthis example. Details on the assets and the user authentication mechanism are inHoumb et al. (2005) enclosed as Appendix B.3 and Houmb, Ray and Ray (2006)enclosed as Appendix B.4.

198 18. Validation of the Approach
Fig. 18.10. TOP subnet with prior probability distributions
Here, the security requirements are derived from the trust context and the casedescription from previous section. This given the following security requirement:�To preserve the availability of the user authentication mechanism�. Interpretedin the context of the security acceptance criteria this means that the SAC sub-variable �Availability�must be in the �high�state. As no other requirements aregiven the other sub-variables to SAC is put in the state �N/A�, which means notapplicable.
Figure 18.11 shows the status in the TOP subnet when the security requirementsinformation is entered into the TOP subnet and propagated from the observablenodes. Note that only the sub-variable �Availability�is included in the �gure.
The information for the budget and TTM variables can be extracted from severalsources, such as project plans. The information can also be provided by any ofthe stakeholders involved in the development. In this example the decision makerprovides these two pieces information, which is the following: budget =�medium�and TTM =�short�. This means that the budget available for risk mitigation ismedium and that the time until the ToE should be launched on the market isshort. In practice this means that a security solution that is easy and quick toemploy is preferable as long as the cost is not unreasonable.
Before the result of the TOP subnet can be transferred to the TOP input node inthe top-level network the priorities list of trade-o¤ parameters must be derived.This is the task of the TOP Priorities decision node and assisted by the TOPPriorities Utility node. This construct of a decision and utility nodes pair give�exibility in specifying the relationship between the input variables of the decisionnode, which is the target node of the TOP subnet in this context. Rule sets for

18.1 Demonstration of the trade-o¤ tool and TBIAS 199
Fig. 18.11. Status of TOP subnet when security requirement information is enteredand propagated
prioritising trade-o¤parameter are speci�ed in the utility node, which is modelledas a diamond in the �gure. The rules speci�ed in this example are given by thedecision maker and is the following: priority 1 is given to TTM, priority 2 is givento security requirements and priority 3 is given to budget. These are the rulesspeci�ed in the TOP Priorities Utility.
Figure 18.12 shows the TOP subnet with SAC, budget and TTM informationinserted and propagated to derive the resulting prioritised list of trade-o¤ para-meters.
As can be seen in Figure 18.12 the TOP subnet is structured into three layers:the observable node layer, the intermediate node layer and the target node layer.Observable nodes are where information or evidence is entered into the networkwhile intermediate nodes are the nodes that connects the aim and questionsthat the network is to provide answers to, which is modelled as the target node,with the information entered into the observable nodes. Hence, the intermediatenodes specify the relation and e¤ect that the observations has on the target ofthe network. For the TOP subnet the target is to derive the trade-o¤ parameterpriorities so that a prioritised list of the trade-o¤ parameters can be fed into thetop-level network in the trade-o¤ tool BBN topology.
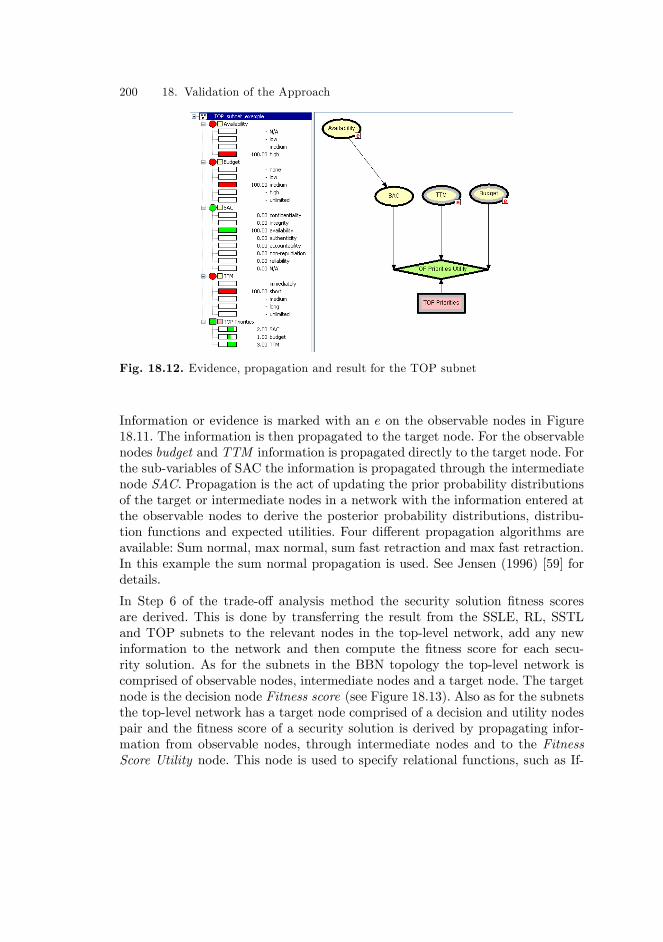
200 18. Validation of the Approach
Fig. 18.12. Evidence, propagation and result for the TOP subnet
Information or evidence is marked with an e on the observable nodes in Figure18.11. The information is then propagated to the target node. For the observablenodes budget and TTM information is propagated directly to the target node. Forthe sub-variables of SAC the information is propagated through the intermediatenode SAC. Propagation is the act of updating the prior probability distributionsof the target or intermediate nodes in a network with the information entered atthe observable nodes to derive the posterior probability distributions, distribu-tion functions and expected utilities. Four di¤erent propagation algorithms areavailable: Sum normal, max normal, sum fast retraction and max fast retraction.In this example the sum normal propagation is used. See Jensen (1996) [59] fordetails.
In Step 6 of the trade-o¤ analysis method the security solution �tness scoresare derived. This is done by transferring the result from the SSLE, RL, SSTLand TOP subnets to the relevant nodes in the top-level network, add any newinformation to the network and then compute the �tness score for each secu-rity solution. As for the subnets in the BBN topology the top-level network iscomprised of observable nodes, intermediate nodes and a target node. The targetnode is the decision node Fitness score (see Figure 18.13). Also as for the subnetsthe top-level network has a target node comprised of a decision and utility nodespair and the �tness score of a security solution is derived by propagating infor-mation from observable nodes, through intermediate nodes and to the FitnessScore Utility node. This node is used to specify relational functions, such as If-

18.1 Demonstration of the trade-o¤ tool and TBIAS 201
Fig. 18.13. Fitness score for s1 (cookie solution)
Fig. 18.14. Fitness score for s2 (�itering mechanism)
Then-Else constructs, for the incoming arches to the decision node and computesthe �tness score using a propagation algorithm. Figure 18.13 and 18.14 show theresulting �tness score for the security solutions s1 and s2 respectively.
In Step 7 of the trade-o¤ analysis method the �tness score for each alternativesecurity solution is derived and compared to identify the best-�tted alternative.As can be seen in Figure 18.13 and 18.14 the �tness score for the cookie solution

202 18. Validation of the Approach
is slightly higher than for the �ltering mechanism. The �tness score for the cookiesolution is believed to be high 54% of the time and low 17% of the time. For the�ltering mechanism the belief is that the �tness score is high 40% of the timeand low 30% of the time. This result con�rms with the observations made bythe information source honeypot, as discussed earlier. However, the outcome ofthe computation in the network is highly sensitive to the structure of the BBNtopology, the con�guration of the utility nodes and the propagation algorithmused. This means that this issue must be handled with care. For example, for theutility nodes a sensitivity analysis should be performed to check the magnitudeof the impact that changes in the network have on the outcome.

19. Discussion
It is generally recognised that subjectivity is inherent to any risk and securityassessment methodology and that there are no single correct approach to iden-tifying security risks, as the choice of model and its contained parameters cannever by fully objective. So, rather than trying to formally prove the correctnessof the AORDD framework and its two core components; the AORDD securitysolution trade-o¤ analysis and the trust-based information aggregation schema,this work followed an action research type work process that integrated validationand evaluation as part of the work process both for the initial explorative phaseand for the development and evaluation phase as described in Section 1.4.
The evaluation performed in this work is done in a research context using threecase studies by example and did not include any industrial evaluation. Also asdiscussed earlier the evaluation focused on examining the feasibility, scalabilityand applicability of the approach developed and on reasoning about the validityof the approach, in relation to the research questions of this work. Details onthe example-runs and parts of the result from the third example-run was givenin Chapter 18. The �rst and second example-run is documented in Houmb etal. (2005) [44] and Houmb et al. (2006) [48] enclosed as Appendix B.3 and B.2respectively.
There exist several evaluations strategies for evaluating results of a subjectivenature. According to McGrath (1984) [58] there are three general perspectivesthat are important when evaluation such results and these are: (1) Generalisingthe validation evidence. (2) Precision of the measurement used. (3) Realism ofcontext. McGrath also lists and categories eight evaluations strategies accordingto these three research features. These are laboratory experiment, experimentalsimulations, �eld experiments, �eld studies, computer simulations, formal theory,sample survey and judgment studies.
This work has performed three �eld studies or actually simulation example �eldstudies in the context of the action research based work process followed. Toensure proper quality of the result throughout this work, relevant evaluationcriterion from the three categories above was assessed to examine the degree of

204 19. Discussion
internal, construct and conclusion validity of the approach. For information onvalidity of evaluation and research result see Wohlin et al. (2000) [12].
Generalising validation evidence is important in research to make sure that theresults and evaluation of the work is applicable outside of the speci�c contextthat the work has been performed under. This concerns the external applicabilityof the approach developed and the structured identi�cation of any assumptionsmade during the work and weather these are reasonable for the context that thework is intended for. This is done by examining the feasibility, scalability and ap-plicability of the AORDD framework and its two core components and the resultof the validation of the approach through the example-driven �eld studies. Thesecond and third evaluation perspective: precision of measurement and realism ofcontext, are addressed in relation to internal, construct and conclusion validity.
Bellow are the de�nition of the evaluation perspectives undertaken in this work.All de�nitions are from Thesaurus.
De�nition Feasibility is the quality of being doable.
De�nition Applicability is the relevance by virtue of being applicable to the mat-ter at hand where applicable is the capability of being applied or having rele-vance.
De�nition Scalability is the quality of being scalable, where scalable is the ca-pability of being scaled or that it is possible to scale.
De�nition Validity is the property of being strong and healthy in constitution.
As the work process followed in this work is both iterative and includes explicitevaluation sessions a set of evaluation criteria targeting the above de�ned evalua-tion perspectives, for each of the three evaluation categories was speci�ed as partof the two �rst iterations of the work process. This led to the following evaluationcriteria:
Generalising validation evidence:
� EvC.1 on feasibility: To what level is the AORDD framework and its two corecomponents e¢ cient to use in practice.
� EvC.2 on feasibility: To what degree is the AORDD framework and its twocore components easy to use for the decision maker.
� EvC.3 on applicability: To what level does the AORDD framework and its twocore components address all relevant security aspects and important develop-ment factors.

19. Discussion 205
� EvC.4 on applicability: To what degree is the AORDD framework and its twocore components able to produce realistic and usable results.
� EvC.5 on scalability: To what level is the AORDD framework and its twocore components able to address small and medium as well as large and verycomplex systems.
Precision of measurement and Realism of context:
� EvC.6 on internal validity: To what degree does the work process and evalu-ation strategy followed in this work contribute to su¢ ciently address the fourresearch questions.
� EvC.7 on construction and conclusion validity: To what degree is the contri-butions of this work (the AORDD framework and its two core components)capable to su¢ ciently address the four research questions.
Recall that the main contributions of this work are incorporated into the AORDDframework and its two core components; the AORDD security solution trade-o¤analysis and the trust-based information aggregation schema. The evaluation cri-teria are thus applied on these rather than on each of the contributions separately.
EvC.1 looks into the feasibility perspective and concerns to what level theAORDD framework and its two core components are e¢ cient to use in practice.This issue has been addressed through the layer-wise structure of the underlyingtrade-o¤ analysis method for the AORDD security solution trade-o¤ analysis andthe separation of concerns in the underlying trade-o¤ procedure for the AORDDsecurity solution trade-o¤ analysis. The trade-o¤ tool BBN topology, which is theimplementation of the AORDD security solution trade-o¤ analysis, has adoptedboth this layer-wise structure and the separation of concern in practice and hencethe di¤erent parts of the trade-o¤ analysis can be executed simultaneously. Fur-thermore, the trust-based information aggregation schema is also layer-based andcan be executed in parts or in complete depending on the characteristics of theinformation that needs to be aggregated. This means that separation of concernsis also achieved in the information aggregation. This enables the decision makerto use only the parts of the approach that are relevant to his or her problem andto focus on small independent tasks as the tool takes care of the dependencies bythe way it is structured. The approach also allows the decision maker to observewhat is going on and to get guidance on what type of information that are neededas well as make him or her able to input whatever information available. The ap-proach developed in this work can thus also take the role of a security analyst forthe decision maker (usually only for designer or developer type of decision makersas management level decision makers usually do not have su¢ cient knowledge tounderstand the technical implications of what they observe).

206 19. Discussion
The trade-o¤ tool BBN topology is designed in the context of security evaluationand focuses on providing con�dence in the ful�lment of the security, development,project and �nancial perspectives posed upon an information system. As currentsecurity evaluation approaches are both time and resource exhaustive the goalof the security evaluation approach developed in this work has been to come upwith a cost and resource e¤ective way of comparing security solutions in prac-tice. However, as both the AORDD security solution trade-o¤ analysis and thetrust-based information aggregation schema still involves a substantial amount ofmanual tasks, further work is needed on automating more of the tasks involvedbefore this goal can be achieved.
The trust-based information aggregation schema which is used to aggregate theinformation inserted into the tool is able to aggregate disparate types of infor-mation. However, the schema is somewhat di¢ cult to use when the number ofexternal sources involved, in evaluating the calibration variables and the abili-ties of each information source according to these calibration variables, are large.The reason for this is that when the number of external sources grows it be-comes di¢ cult to keep track of and separate the calibration information fromthe information provided on the abilities of the information sources accordingto the calibration variables. Currently the schema performs best when only oneexternal source in each of the two sets of external sources X and Y is used andwhen limiting the number of steps included from the schema. Hence, furtherwork is needed on more clearly separating the calibration information from theinformation provided on the information sources.
EvC.2 concerns the feasibility perspective and whether the AORDD frameworkand its two core components is easy to use for the decision maker. This is oneof the most critical factors for an approach to successfully making it in the in-dustry. Any approach targeting industrial use must successfully balance su¢ cientcomplexity with being intuitive and easy to use. Usability is in IEEE ComputerDictionary - Compilation of IEEE Standard Computer Glossaries [53] de�ned as�the ease with which a user can learn to operate, prepare inputs for and interpretoutputs of a system or component�. The user in the context of this work is thedecision maker and through the �eld studies the approach developed has beendemonstrated and described with the aim of making the approach concrete andshowing how to use it in practice. However, the trade-o¤ tool BBN topology andthe trust-based information aggregation schema is currently at an early prototypestage, involve a substantial amount of manual tasks and hence do not yet ful�lthe usability requirement.
The ultimate goal for work such as this is to provide the decision maker with a�one button�interface for choosing a security solution among alternatives wherethe tool keeps control of the provided and necessary information and automati-

19. Discussion 207
cally learns from experience. If this was the case the tool could simply show thedecision maker how it reasoned about the decision problem and through that ac-tivity establish a high trust relationship with the decision maker. However, thisgoal is for now not very realistic and a substantial amount of further work isneeded before this overall goal can be achieved.
EvC.3 concerns whether all relevant security concerns are covered. The relevantsecurity concerns was identi�ed during the requirements phase in the initial ex-plorative phase of this work and are captured in the static security level (SSLE)subnet, risk level (RL) subnet and the security solution treatment level (SSTL)subnet of the trade-o¤ tool BBN topology. Recall from Chapter 15 that the trade-o¤ tool BBN topology materialise the underlying trade-o¤method and procedureof the AORDD security solution trade-o¤ analysis. The same is the case for therelevant development, project and �nancial perspectives. These perspectives areincorporated as the trade-o¤ parameters in the TOP subnet of the trade-o¤ toolBBN topology. However, so far no extensive analysis on whether the perspectivesincluded cover all relevant perspectives has been performed. This is a clear weak-ness of this work and might have consequences for the applicability of the resultof this work in practice. Thus, further work should include a realistic study toidentify additional security, development, project and �nancial perspectives thatshould be taken into consideration in security solution decision situations. Thiscan be done either by using semi-structured interviews with decision makers fromseveral companies or as a series of realistic case studies performed in an actionresearch context. The problems related to company con�dentiality made a morerealistic setting for evaluation of the approach di¢ cult, but should neverthelesshave be attempted. What is important in this context is to address the issue ofcompany con�dentiality up front and to ensure that any agreements are legallydocumented on paper.
EvC.4 concerns the applicability of the approach in terms of the capabilities ofthe AORDD framework and its two core components to produce realistic andusable results. The �eld studies performed are documented in various papers andhave shown to produce realistic and usable results based on subjective domainexpertise and the argumentation provided in these papers. However, the �eldstudies are limited in that they only look into simplistic security solution deci-sion situations and do therefore not su¢ ciently address the additional problemswith con�icting stakeholder interests. Please consult Houmb et al. (2006) [48] inAppendix B.2, Houmb et al. (2005) [44] in Appendix B.3, Georg, Houmb andRay (2006) [35] and Houmb, Ray and Ray (2006) [45] for details.
EvC.5 concerns the scalability of the AORDD framework and its two core com-ponents. This issue has only been investigated to some degree in this work bylooking into di¤erent abstraction levels of security solution decisions situations.
208 19. Discussion
The levels of abstractions investigated range from technology speci�c securitymechanisms (technology viewpoint in RM-ODP) to the security strategy level(enterprise viewpoint in RM-ODP) for the design phase of a development. Theexamples used are limited to small size information systems and thus this workmakes no claim to support medium, large and complex information systems asthis issue has not yet been addressed properly. Tool support and automation is animportant factor for scalability and have been provided for the AORDD securitysolution trade-o¤ analysis and the trust-based information aggregation schema.However, the fact that a small scale prototype for parts of the security solutiondecision framework has been developed does not imply that the approach auto-matically is applicable outside of small size information system. Examining thescalability issue is ongoing work and it therefore su¢ ce to say that the believe isthat the approach will scale to some degree and that both the trade-o¤ analysisand the information aggregation schema will be able to work su¢ ciently e¢ cientfor medium to large information systems, provided that more of the manual tasksinvolved are automated.
EvC.6 concerns the internal validity of the result of this work. The result ofthis work is the �ve contributions incorporated into the AORDD framework andits two core components, as discussed earlier. The internal validity is thus anevaluation perspective that aims at examining the degree that these results meetthe four research questions of this work. The latter points to the quality of theresult and on whether this quality has been unbiased examination of this qualityhave been performed. Thus, in this work the internal validity is examined bylooking into whether the work and evaluation process followed su¢ ciently ensuresa non-bias examination.
As discussed in Section 1.4 the results of this work are developed and evaluatedusing an action research based work process that includes a separate evaluationphase. This work process was iterated three times with evaluation by simulationcase study for all iterations, as discussed earlier. The main problem with this workis the lack of industrial validation. This was not carried out as it was consideredto be too time consuming and with too many challenges not directly relatedto the actual evaluation of the result. Instead three simulation case studies wereperformed as part of the evaluation phase of the work process. The goal with thesecase studies was to demonstrate the feasibility and applicability of the approachand to discover problems with the current results, in each of the three iterations.The quality of the result has thus been demonstrated to some extend. However,this does not represent a su¢ cient evaluation and more empirical evidence isneeded until a conclusion can be drawn. It su¢ ces to say that the work andevaluation process was design to bring in several roles during the process and toexamine the results from several perspectives. However, in practice all evaluation

19. Discussion 209
and the evaluation meetings were performed by the same people as those thatdeveloped the approach. For details and more discussion, see Houmb et al. (2005)[44], Georg, Houmb and Ray (2006) [35], Houmb et al. (2006) [48] and future workin Chapter 20.
EvC.7 concerns the construction and conclusion validity which in this work pointsto the degree that the contributions of this work (the AORDD framework andits two core components) are capable to su¢ ciently address the four researchquestions. This can also be referred to as the completeness of the results in relationto the research questions. The construction validity is in this work interpretedas the degree that the resulting constructs meet the research questions whilethe conclusion validity concerns whether the conclusion drawn on the ful�lmentof the research questions are sound and un-biased. The latter means that theconclusions need to be drawn based on empirical evidence or un-biased reasoningand not merely be based on subjective belief.
This work had four research questions and these are: RQ.1: How can alternativesecurity solutions be evaluated against each other to identify the most e¤ectivealternative? RQ.2: How can security risk impact and the e¤ect of security solu-tions be measured? RQ.3: Which development, project and �nancial perspectivesare relevant for an information system and how can these be represented in thecontext of identifying the most e¤ective security solution among alternatives?RQ.4: How can the disparate information involved in RQ1, RQ2 and RQ3 becombined such that the most e¤ective security solution among alternatives canbe identi�ed?
As these four research questions cover a large spectre of challenges, this workused an iterative work process that re�ned the research questions as new resultswas developed and new challenges appeared. After three iterations through thework process, the �nal result consisted of the following �ve contributions. C.1: Aset of security risk variables. C.2: A set of security solution variables. C.3: A setof trade-o¤ parameter variables to represent and measure relevant development,project and �nancial perspectives. C.4: Methodology and tool-support for com-paring the security solution variables with the security risk variables to identifyhow e¤ective a security solution is in protecting against the relevant undesiredbehaviour (misuse). C.5: Methodology and tool-support for trading o¤ securitysolutions and identifying the best-�tted one(s) based on security, development,project and �nancial perspectives.
These �ve contributions were all incorporated into the AORDD framework andits two core components and have all been materialised as described in Parts 3, 4and 5. All �ve results are directly related to one or more of the research questions.C.1, C.2 and C.4 address RQ.1 and RQ.2 while C.3 and C.5 address RQ.3 andRQ.4 and C.5 addresses RQ.4.

210 19. Discussion
The resulting constructs representing C.1-C.5 in the AORDD framework have allbeen evaluated three times in the three case studies by examples. These exam-ples have demonstrated the feasibility and applicability of the approach, as wellas demonstrate how each of the research questions has been addressed. The con-clusion from these three case studies are that the approach developed representan increased support for the decision maker when choosing among alternativesecurity solutions and thus the conclusion is that C.1-C.5 meet the objective ofthis work to a su¢ cient degree. Details can be found in Houmb et al. (2005) [44]in Appendix B.3, Georg, Houmb and Ray (2006) [35], Houmb et al. (2006) [48]in Appendix B.2 and Chapter 18.
19.1 Related work
In the domain of security solution decision support there are �ve main categoriesof techniques that are of relevance. These are operational and quantitative mea-surement of security, security risk assessment, security management standards,security evaluation and certi�cation approaches such as the Common Criteriaand architectural or design trade-o¤ analysis.
The �rst major step towards techniques for measuring operational security wasdescribed in Littlewood et al. (1993) [74]. In this paper the authors argue stronglyfor the importance of extending the capabilities of current security evaluationapproaches with techniques for quantitatively measuring the perceived level ofoperational security, rather than merely providing a subjective and qualitativemeasure of security. The concept of operational security level points to the per-ceived level of security in a system when deployed in its future or current securityenvironment. To meet these challenges the paper provides an initial model thatuse the experience in the reliability domain and that computes quantitative se-curity measures by the use of traditional probability theory. The quantitativesecurity measures discussed are mean time to successful security attacks andmean e¤ort to successful security attacks.
These concepts are further explored by Ortalo et al. (1999) in [80], Madan et al.(2002) [75] and Wang et al. (2003) [104]. In [80] Ortalo et al. (1999) provides aquantitative model for known Unix security vulnerabilities using a privilege graphusing the ideas from [74]. The privilege graph is transformed into a Markov chainand examined using Markov analysis. These idea is then taken a step furtherin Madan et al. (2002) [75]. This paper also discusses how to quantify securityattributes of software systems using traditional reliability theory for modellingrandom processes, such as stochastic modelling and Markov analysis. However,the authors extends the concept of security from [80] and consider security to be

19.1 Related work 211
a Quality of Service (QoS) attribute, as well as arguing for the need to quantifysecurity as a means to meet contracted levels of security. In Wang et al. (2003)[104] this idea is taken a step further by introducing a higher level of formalismby a¢ liating Stochastic Petri Nets (SPN).
In Jonsson and Olovsson (1997) [62] the authors discusses the challenge in a morepractical way by analysing attacker behaviour through controlled experiments.The focus in the work documented in this paper was to investigate how attackerbehaviour can be used to aid the quanti�cation of operational security. The paperdiscusses an approach to quantitative analysing attacker behaviour based on theresult of the empirical data collected from intrusion experiments using undergrad-uate students at Chalmers University in Sweden. The result from the experimentindicated that a typical attacker behaviour comprises the following three phases:the learning phase, the standard attack phase and the innovative attack phase.The results of the experiments showed that the probability for successful securityattacks is small during the learning and innovative phases while the probabilitywas considerably higher during the standard attack phase. For this phase thecollected data indicated an exponentially distribution of perceived time betweensuccessful security attacks.
The AORDD framework and in particular the AORDD security solution trade-o¤ analysis makes use of the models discussed in the above papers and supportquantitative measures of operational security level through the variables meantime and e¤ort to misuse (MTTM and METM) in the RL subnet of the trade-o¤ tool BBN topology. This work also extends the work discussed above andprovides a model for quantitative measure of availability that is able to use bothempirical and subjective information sources. Details are provided in Houmb,Georg, France, Reddy and Bieman (2005) [43].
Risk assessment was initially developed within the safety domain, but has laterbeen adapted to security critical systems as security risk assessment. Since thebeginning of the 1990s, several e¤orts have been devoted to developing structuredand systematic security risk assessment approaches. The three main approachesare the OCTAVE framework [3], CRAMM [8] and the CORAS framework [19].The OCTAVE framework was developed by the NSS Program at SEI and providesguidelines that enable organisations to develop appropriate protection strategies,based on risks to critical information assets. CCTA Risk Analysis and Man-agement Methodology (CRAMM) was developed by the Central Computer andTelecommunication Agency (CCTA) in Britain and targets health care informa-tion systems. CRAMM o¤ers a structured approach to manage risks in computer-based systems in the health sector. CRAMM is asset-driven which means thatthe focus is on identifying the main assets connected to the system and on iden-tifying and assessing the risks to these assets. The CORAS framework is inspired

212 19. Discussion
by CRAMM and has adapted the asset-driven strategy of CRAMM. CORAS alsouses models to assist in risk assessment activities, with the use of UML as theirmodelling language. The overall objective of the approach is to provide meth-ods and tools for precise and e¢ cient risk assessment of security-critical systemsusing semi-formal models. Here, models are used to describe the target of assess-ment, as a medium for communication between di¤erent groups of stakeholdersinvolved in a risk assessment and to document risk assessment results and theassumptions on which these results depend.
As discussed in Part 3 of this work the AORDD framework and its underly-ing AORDD development process and the AORDD security assessment activity,makes use of parts of the CORAS framework and in particular the CORAS inte-grated system development and risk management process. The AORDD approachdi¤ers from CORAS in that it provides speci�c guidelines for choosing among al-ternative treatment options (called security solutions in AORDD). CORAS doesnot provide any particular decision support in this context and focused on thesemi-formal modelling rather than on decision support. Details are in Chapter 5and Part 3.
Security management standards represent best practice for handling the over-all and detailed management of security in an organisation. The most importantstandards in this area are the ISO/IEC 17799:2000 Information technology �Codeof Practice for information security management [55], ISO/IEC TR 13335:2001Information technology �Guidelines for management of IT Security [54] and theAustralian/New Zealand standard for risk management AS/NZS 4360:2004 [4].ISO/IEC 17799 provides recommendations for information security managementand supports those that are responsible for initiating, implementing or maintain-ing security in their organisation. The standard is intended to aid in developingorganisational speci�c security standards to ensures e¤ective security manage-ment in practice. It also provides guidelines on how to establish con�dence ininter-organisational matters. ISO/IEC 13335 provides guidance on managementaspects of IT security. The main objectives of this standard are to de�ne and de-scribe the concepts associated with the management of IT security, to identify therelationships between the management of IT security and management of IT ingeneral, to present several models which can be used to explain IT security and toprovide general guidance on the management of IT security. AS/NZS 4360:2004is a widely recognised and used standard within the �eld of risk assessment. Thisstandard is a general risk management standard that has been tailored for se-curity critical systems in the CORAS framework. The standard includes a riskmanagement process, which consists of �ve assessment sub-processes and twomanagement sub-processes, a detailed activity description, a separate guidelinecompanion standards and general management advices.

19.1 Related work 213
The AORDD framework is based on all above mentioned risk management relatedstandards through it de�nition of information security and information systemand its decision support for choice of security solution in the AORDD securitysolution trade-o¤ analysis. Details are in Chapters 3 and 5 and in Parts 4 and 5of this work.
As described in Chapter 3 security evaluation techniques have been around fora long time. TCSEC is the oldest known standard for evaluation and certi�ca-tion of information security in IT products. The standard was developed by theDepartment of Defense (DoD) in the USA in the 1980s and evaluates systemsaccording to the six prede�ned classes: C1, C2, B1, B2, B3 and A1. As a re-sponse to the development of TCSEC the United Kingdom, Germany, Franceand the Netherlands produced versions of their own national evaluation criteria.These were later harmonised and published under the name ITSEC. ITSEC cer-ti�cation of a software product means that users can rely on an assured levelof security for any product they are about to purchase. As for TCSEC, ITSECcertify products according to prede�ned classes of security (E0, E1, E2, E3, E4,E5 and E6). These standards were later replaced by the Common Criteria whichwas developed as a common e¤ort under the International Organization for Stan-dardization (ISO). In the Common Criteria certi�cation is done according to theseven prede�ned classes: EAL1, EAL2, EAL3, EAL4, EAL5, EAL6 and EAL7where EAL 7 represent the highest level of assurance.
However, the above security evaluation standards have two problems in commonand these are : the large amount of information involved and the heavy reliance onsubjective expert assertions. The evaluation is most often carried out by one or afew evaluators and even though these evaluators must be certi�ed to perform theevaluation the evaluation still includes a high degree of inherent trust by holdinga particular role. This means that the decision maker must always completelytrust the evaluator and that he or she has no means of objectively assessing theabilities of the evaluator. This work addresses these issues in the trust-basedinformation aggregation schema described in Part 5 of this work by not onlyproviding the security evaluation information to the decision maker but also theperceived trustworthiness of the information sources (evaluators) providing theinformation.
Related trade-o¤ analysis techniques exist but none are tailored to the securitydomain. This does not mean that one cannot use these techniques when per-forming security solution trade-o¤ analyses. It rather means that a specialisedtechnique is more e¢ cient and particularly for developers unfamiliar with thesecurity domain. The main reason for this is that the e¤ects of a series of securitysolution decisions are conceptually hard for humans to analyse due to the inter-relations and dependencies between the security solutions. The two most relevant

214 19. Discussion
software architectural trade-o¤ analysis methods are the Architecture Trade-o¤Analysis Method (ATAM) and the Cost Bene�t Analysis Method (CBAM). Inaddition, there are variations on these two methods available. Both ATAM andCBAM were developed by the Software Engineering Institute (SEI) at CarnegieMellon. The focus of ATAM is to provide insight into how quality goals inter-act with and trade o¤ against each other. ATAM consists of nine steps and aidsin eliciting sets of quality requirements along multiple dimensions, on analysingthe e¤ects of each requirement in isolation and in understanding the interactionsof these requirements. This uncovers architectural decisions and links these tobusiness goals and desired quality attributes.
CBAM is an extension of ATAM that looks at both the architectural and theeconomic implications of decisions. The focus in CBAM is on how an organisationshould invest its resources to maximise gains and minimise risks by incorporatingcost, bene�t and schedule implications of decisions into the trade-o¤ analysis.
The AORDD security solution design trade-o¤ analysis described in Part 4 of thiswork is a security speci�c trade-o¤ analysis that incorporates ideas from bothATAM and CBAM. However, the AORDD security solution trade-o¤ analysis isextended to use security solution and misuse-speci�c parameters in addition tothe economic implications as input to the trade-o¤analysis. The AORDD securitysolution is also extended to evaluate the required security level by combining bothstatic and operational security levels. Details are in Houmb et al. (2005) [44] inAppendix B.3, Houmb et al. (2006) [48] in Appendix B.2 and Part 4.
The trust-based information aggregation schema developed in this work and de-scribed in Part 5 uses the notion of trust and trustworthiness to combine infor-mation as input to the AORDD security solution trade-o¤ analysis. This schemais a model that aggregate information using trust weights and hence relevantliterature on trust are work on trust models.
A number of logic-based formalisms of trust have been proposed by researchers.Almost all of these view trust as a binary relation. Forms of �rst order logic [11],[57], [2], modal logic or its modi�cation [85] have all been used to model trustin these cases. Simple relational formulae of the form Ta;b (stating that a trustsb) are also used to model trust between two entities. Each of the formalismsextends this primitive construct to include features such as temporal constraintsand predicate arguments. Given these primitives and the traditional conjunction,disjunction, negation and implication operators, these logical frameworks expresstrust rules in their language and reason about these properties.
Abdul-Rahman and Hailes (2000) [2] propose a trust model that allows arti�cialagents to reason about trustworthiness and that allow real people to automate thisprocess. The trust model is based on a �reputation�mechanism or word-of-mouth.

19.1 Related work 215
Reputation information and direct experiences are used by a set of algorithms tomake decisions regarding the trustworthiness of agents. Agents can decide whichother agents� opinions they trust more and thus allow agents to progressivelytune their understanding of another agent�s subjective recommendations.
Rangan (1988) [85] proposes a model consisting of simple trust statements of theform Bi;p, meaning that agent i believes proposition p. In this model a distributedsystem is a collection of agents communicating with each other by message pass-ing. The state of an agent is the agent�s message history. The state of the systemsis the state of all agents. Rangan uses modal logic to de�ne a set of propertiesof the trust statements, like transitivity etc. These constructs are then used tospecify systems and to analyse them with respect to the property of interest.
Jones and Firozabadi (2000) [60] address the issue of reliability of an agent�stransmission. Here, the authors use a variant of modal logic to model varioustrust scenarios like �b belief that a says to it that m�. They also use the languageto model the concepts of deception and the level that an entity trust in anotherentity.
Yahalom et al. (1993, 1994) [108, 107] propose a formal model for deriving newtrust relationships from existing ones. In [108] the authors propose a formal modelfor expressing trust relations in authentication protocols together with an algo-rithm for deriving trust relations from recommendations. The authors proposeseven di¤erent classes of trust. These are identifying entities, quality randomkey generation, keeping secrets, not interfering, clock-synchronisation, perform-ing correctly algorithmic steps and providing recommendations. Being trustedfor a particular class means that an entity can be trusted to perform a speci�ctask. Each of these classes of trust can have two types of trust : direct trust andrecommendation trust. Direct trust is when an entity trusts the other entity with-out including an intermediary in the trust relationship. Recommendation trustinvolves trusting an entity based on recommendation from a third party. Therecan be multiple trust relationships between the same pair of entities.
Beth et al. (1994) [9] extends the ideas presented in [108, 107] to include relativetrust. The paper presents a method for extracting trust values based on experi-ences from the real world and gives a method for deriving new trust values fromexisting ones within a network of trust relationships. Such trust values can beused in models like the ones in [108, 107]. The method proposed is statistical innature. It is based on the assumption that all trusted entities have a consistentand predictable behaviour. To model degrees of trust, the notion of �numbers ofpositive or negative experiences� is used. The authors posit that for calculationof direct trust, no negative experiences are accepted if an entity is to be trustedat all. This means that the direct trust level can only increase. A consequence ofthis is that a long history of experience implies either almost absolute trust or

216 19. Discussion
none at all. For recommended, both positive and trust negative experiences areaccepted. This means that the trust value from recommendation can be relativelylow, even after a long history. However, there is one problem with this schema andthis is that the expression for deriving recommended trust is unsuitable in envi-ronments where the trustworthiness of entities is likely to change, as discussedin Jøsang (1997) [63]. Furthermore, the expression for deriving new direct trustfrom direct and recommended trust appears to be counter-intuitive and can leadto cases as �If you tell me that you trust NN by 100% and I only trust you by 1%to recommend me somebody then I also trust NN by 100%�(see [63] for details).
Jøsang (1998, 1999) [64, 65] proposes a model for trust based on a general modelfor expressing relative uncertain beliefs about the truth of statements. In thesepapers a trust model de�nes trust as an opinion where an opinion is a represen-tation of a belief. An opinion is modelled as a triplet < b; d; u >2 fb; d; ug whereb is a measure of one�s belief in a proposition, d is a measure of one�s disbelief inthe proposition and u is a measure of the uncertainty. A major shortcoming ofthis model is that it does not acknowledge that trust changes over time and thusthe model has no mechanism for monitoring trust relationships to re-evaluatetheir constraints.
Cohen et al. (1997) [14] propose an alternative and more di¤erentiated conceptionof trust called Argument-based Probabilistic Trust model (APT). This modelincludes the more enduring concept as a special case but emphasises instead thespeci�c conditions under which an aid will or will not perform well. According tothe authors the problem of decision aid acceptance is neither under-trust nor over-trust but rather inappropriate trust. The authors de�ne this notion as a failureto understand or properly evaluate the conditions a¤ecting good and bad aidperformance. To aid in this discrepancy the authors propose a simple frameworkfor deriving benchmark models for verifying the performance for situations wherepreviously learned or explicitly identi�ed patterns may be insu¢ cient to guidedecisions about user-aid interaction. The most important use of APT is to charthow trust changes from one user to another, from one decision aid to another,from one situation to another and across phases of decision aid use.
Xiong and Liu (2003) [106] present a coherent adaptive trust model for quanti-fying and comparing the trustworthiness of peers based on a transaction-basedfeedback system. In this paper the authors present three basic trust parameters :peer feedback through transactions, total number of transactions a peer performsand credibility of the feedback sources. The paper addresses some of the factorsthat in�uence peer-to-peer trust, such as reputation systems and misbehaviourof peers by giving false feedback. According to this description, giving a peer�sreputation re�ects the degree of trust that other peers in the community have onthe given peer, based on their past experiences. The paper also provides a trust

19.1 Related work 217
metric for predicting a given peer�s likelihood of a successful transaction in thefuture.
Bacharach and Gambetta (2000) [7] embark on a reorientation of the theory oftrust. In this paper the authors de�ne trust as a particular belief that arises ingames with a certain payo¤ structure. The paper focuses on how to identify thesource of the primary trust problem in the uncertainty about the payo¤s of thetrustee. One major observation made by the authors is that in almost all gamesthe truster sees or observes a trustee before making any decision and thereforeuses these observations as evidence for the trustee�s having or lacking trustworthy-making qualities. According to the authors in such contexts the truster must alsojudge whether apparent signs of trustworthiness are themselves to be trusted.
Purser (2001) [84] presents a simple graphical approach to model trust. In thispaper the author examines the relationship between trust and risk and arguesthat for every trust relationship there is a risk associated with a breach of thetrust. Hence, in this work trust relationships are modelled as directed graphswhere an entity can trust or be trusted by another entity, modelled by nodes inthe graph that is labelled by the names of the entities. Here trust is de�ned asunidirectional and connects two entities, which means that it is represented as adirected edge from the trusting entity to the trusted entity.
All the above trust models either restrict trust decisions to binary outcomes or as-sess trust based on limited information (e.g., only reputation or only experience)about the target entity. As the trust-based information aggregation schema pre-sented in this work combines various information types from various informationsources a more generic model of trust is needed. None of the above mentionedtrust models incorporate techniques for aggregating information like trustee�s be-haviour history, trustee�s attributes or third-party judgment to evaluate the trustlevel of a trustee. When aggregating disparate information as done in the trust-based information aggregation schema all these factors a¤ect the level of trust.Also, a trust model in which trust levels are expressed in terms of numeric valuesfrom a continuous range, is more suitable for expressing trust as an informationsource ability (or performance) measure.
The trust-based information aggregation schema in this work has thereforeadapted the concept of trust used in the trust vector model developed by Rayand Chakraborty (2004) [87]. This model speci�es trust as a vector of numericvalues in the range [�1; 1], which gives the needed granulated expression of trustlevel. The values in the negative region of the range represent distrust while val-ues in the positive region represent trust. The parameters used in the vector are:knowledge, experience and recommendation. In this model trust is de�ned as the�rm belief in the competence of an entity to act dependable and secure within aspeci�c context. Furthermore, the trust relationship is always between a truster;

218 19. Discussion
an entity that trusts the target entity, and a trustee; the target entity that istrusted. The truster is an activity entity such as a human being, an agent or asubject of some type while the trustee can either be an active entity or a passiveentity such as a piece of information or a software. A trust relationship is denoted
AC! B where A is the truster, B is the trustee and C is some context in which
the trust relationship exist.
The trust-based information aggregation schema uses the core of this model bya¢ liating the granulated expression of trust and trust variables. However, theschema is tailored to work e¢ ciently in a security solution decision support con-text and is thus not a general approach as the trust vector model is. Hence, theschema re�nes the de�nition of trust and distrust and uses a set of domain speci�cvariables to measure the level of trust.

20. Concluding Remarks and Suggestions forFurther Work
What is a reasonable security level? How much money is necessary to investto feel reasonable secure? And most importantly: which security solution(s) �tsbest for a particular security problem or challenge? These are the three corequestions that would be nice to answer �rmly and with great level of con�dence.Unfortunately, there is still a long way to go. This work merely proposes anapproach to tackle some of the underlying factors of these three core questionsand a substantial amount of research and practical experiments is still neededbefore any conclusions can be drawn.
The objective of this work has been to help decision makers to better tacklesecurity solution decision situations under the restricted time and budget con-straints that such situations usually are subject to. This work does this by meansof trading o¤ security solutions so that the best-�tted security solution amongalternatives are identi�ed taking not only the �nancial perspective into consider-ation but also security, development and project perspectives. These perspectivesare handled by a set of components and an overall security solution decision sup-port framework called the AORDD framework. The AORDD framework combinesAOM and RDD techniques and consist of the following seven components: (1) Aniterative AORDD process. (2) Security solution aspect repository. (3) Estimationrepository to store experience from estimation of security risks and security so-lution variables involved in security solution decisions. (4) RDD annotation rulesfor security risk and security solution variable estimation. (5) The AORDD se-curity solution trade-o¤ analysis and trade-o¤ tool BBN topology. (6) Rule setfor how to transfer RDD information from the annotated UML diagrams into thetrade-o¤ tool BBN topology. (7) Trust-based information aggregation schema toaggregate disparate information in the trade-o¤ tool BBN topology.
The two core components of the AORDD framework are the AORDD securitysolution trade-o¤ analysis (component 5) and the trust-based information ag-gregation schema (component 7). These two components have been studied andevaluated using an action research work process and consist of the following: C.1:A set of security risk variables. C.2: A set of security solution variables. C.3: A

220 References
set of trade-o¤ parameter variables to represent and measure relevant develop-ment, project and �nancial perspectives. C.4: Methodology and tool-support forcomparing the security solution variables with the security risk variables. C.5:Methodology and tool-support for trading o¤ security solutions and identifyingthe best-�tted one(s) based on security, development, project and �nancial per-spectives.
Plans for further work includes merging the trade-o¤ tool BBN topology and theinformation aggregation schema into one BBN topology, to perform more actionresearch type of �eld studies, to eventually perform a realistic and industrialsize case study and to advance the topic of semi-automatic security solutiondecision support. The latter is important to e¤ectively enable non-security expertsand decision makers to bring their systems to a controlled security level for areasonable cost.
Detailed recommendation for further work on the two core components of theAORDD framework is given as part of the evaluation discussed in Chapter 19.All other components of the AORDD framework is still at an explorative stateand substantial amount of further work is needed before any of these componentscan e¤ectively contribute in security solution decision situations.
References
1. ISO/IEC 27001:2005 Speci�cation for Information Security Management, October2005.
2. A. Abdul-Rahman and S. Hailes. Supporting Trust in Virtual Communities. InProceedings of the 33rd Annual Hawaii International Conference on System Sciences(HICSS-33), Maui, Hawaii, January 2000. IEEE Computer Society.
3. C. Alberts, S. Behrens, R. Pethia, and W. Wilson. Operationally Critical Threat,Asset, and Vulnerability Evaluation (OCTAVE) Framework, Version 1.0. Technicalreport, Software Engineering Institute, Carnegie Mellon University, Pittsburgh, PA,June 1999.
4. Australian/New Zealand Standards. AS/NZS 4360:2004 Risk Management, 2004.
5. T. Aven. Reliability and Risk Analysis. Elsevier Science Publishers LTD, 1992.
6. A. Avizienis, J.-C. Laprie, B. Randell, and C. Landwehr. Basic Concepts and Tax-onomy of Dependable and Secure Computing. IEEE Transactions on Dependable andSecure Computing, 1(1):11�33, January 2004.
7. M. Bacharach and D. Gambetta. Trust as Type Identi�cation. In C. Castelfranchiand Y. Tan, editors, Trust and Deception in Virtual Societies, pages 1�26. Kluwer Aca-demic Publishers, 2000.
8. B. Barber and J. Davey. The Use of the CCTA Risk Analysis and Manage-ment Methodology CRAMM in Health Information Systems. In K. Lun, P. Degoulet,T. Piemme, and O. Rienho¤, editors, Proceedings of MEDINFO�92, pages 1589�1593.North Holland Publishing Co, Amsterdam, 1992.
9. T. Beth, M. Borcherding, and B. Klein. Valuation of Trust in Open Networks.In D. Gollmann, editor, Proceedings of the 3rd European Symposium on Research inComputer Security - ESORICS �94, volume 875 of Lecture Notes in Computer Science,Brighton, UK, November 1994. Springer-Verlag.
10. M. Branchaud and S. Flinn. xTrust: A Scalable Trust Management Infrastructure.In Proceedings of the Second Annual Conference on Privacy, Security and Trust (PST2004), pages 207�218, October 14-15 2004.

222 References
11. M. Burrows, M. Abadi, and R. Needham. A Logic of Authentication. ACM Trans-actions on Computer Systems, 8(1), February 1990.
12. C. Wohlin and P. Runeson and M. Höst and C.O. Ohlsson and B. Regnell and A.Wesslé. Experimentation in Software Engineering: An Introduction. Kluwer AcademicPublishers, 2000.
13. CERT Advisory CA-1996-21. TCP SYN �ooding and IP spoo�ng attacks, No-vember 2000. CERT Coordination Centre, http://www.cert.org/advisories/CA-1996-21.html.
14. M. Cohen et al. Trust in Decision Aids: A Model and a Training Strategy. TechnicalReport USAATCOM TR 97-D-4, Cognitive Technologies Inc., Fort Eustis, VA, 1997.
15. ISO 15408:2006 Common Criteria for Information Technology Security Evaluation,Version 3.1, Revision 1, CCMB-2006-09-001, CCMB-2006-09-002 and CCMB-2006-09-003, September 2006.
16. R. Cooke. Experts in Uncertainty: Opinion and Subjective Probability in Science.Oxford University Press, 1991.
17. R. Cooke and L. Goossens. Procedures Guide for Structured Expert Judgement inAccident Consequence Modelling. Radiation Protection and Dosimetry, 90(3):303�311,2000.
18. R. Cooke and K. Slijkhuis. Expert Judgment in the Uncertainty Analysis of DikeRing Failure Frequency. Case Studies in Reliability and Maintenance, pages 331�350,2003.
19. CORAS (2000�2003). IST-2000-25031 CORAS: A Platform for risk analysis ofsecurity critical systems, Accessed 18 February 2006.
20. CORAS project. The CORAS methodology for model-based risk assessment, De-liverable D2.4, August 2003.
21. P.-J. Courtois, N. Fenton, B. Littlewood, M. Neil, L. Strigini, and D. Wright.Bayesian Belief Network Model for the Safety Assessment of Nuclear Computer-BasedSystems. Second year report part 2, Esprit Long Term Research Project 20072-DeVa,1998.
22. D. Matheson and I. Ray and I. Ray and S.H. Houmb. Building Security RequirementPatterns for Increased E¤ectiveness Early in the Development Process. In Symposium onRequirements Engineering for Information Security (SREIS), Paris, France, 29 August2005.
23. K. Delic, M. Mazzanti, and L. Stringini. Formilizing engineering judgment on soft-ware dependability via belied netowrks. In DCCA-6, Sixth IFIP International WorkingConference on Dependable Computing for Critical Applications, "Can We Rely on Com-puters?", Garmisch-Partenkirchen, Germany, 1997.

References 223
24. Department of Defence. DoD 5200.28-STD: Trusted Computer System EvaluationCriteria, August 15 1985.
25. Department of Trade and Industry. The National Technical Authority for Informa-tion Assurance, June 2003. http://www.itsec.gov.uk/.
26. Department of Trade and Industry (DTI). Information Security Breaches Survey2006, April 2007.
27. European Parliament. Directive 2002/58/EC of the European Parliament and ofthe council of 12 July 2002 concerning the processing of personal data and the protectionof privacy in the electronic communications sector (Directive on privacy and electroniccommunications), July 2002.
28. European Parliament. Directive 2006/24/EC of the European Parliament and ofthe council of 15 March 2006 on the retention of data generated or processed in con-nection with the provision of publicly available electronic communications services orpublic communication networks and amending Directive 2002/58/EC (Directive on dataretention), March 2006.
29. N. Fenton, B. Littlewood, M. Neil, L. Strigini, A. Sutcli¤e, and D. Wright. AssessingDependability of Safety Critical Systems using Diverse Evidence. IEEE Proceedings ofSoftware Engineering, 145(1):35�39, 1998.
30. N. Fenton and M. Neil. A critique of software defect prediction models. IEEETransaction of Software Engineering, 25(5):675�689, 1999.
31. B. D. Finetti. Theory of Probability Volume 1. John Wiley & Sons, 1973.
32. B. D. Finetti. Theory of Probability Volume 2. John Wiley & Sons, 1973.
33. R. France, D.-K. Dim, S. Ghosh, and E. Song. A UML-based pattern speci�cationtechnique. IEEE Transactions on Software Engineering, 3(30):193�206, 2004.
34. R. France, I. Ray, G. Georg, and S. Ghosh. Aspect-oriented approach to designmodeling. IEE Proceedings on Software, 4(151):173�185, 2004.
35. G. Georg, S. Houmb, and I. Ray. Aspect-Oriented Risk Driven Development ofSecure Applications. In E. Damiani and P. Liu, editors, Proceedings of 20th Annual IFIPWG 11.3 Working Conference on Data and Applications Security 2006 (DBSEC�06),pages 282�296, Sophia Antipolis, France, 31 July-2 August 2006. Spinger Verlag. LNCS4127.
36. G. Georg, S.H.Houmb, and R. France. Risk-Driven Development (RDD) Pro�le.CS Technical Report 06-101, Colorado State University, 2006.
37. L. Goossens, R. Cooke, and B. Kraan. Evaluation Of Weighting Schemes For ExpertJudgment Studies. In Joselh and Bari, editors, PSAM 4 Proceedings, pages 1937�1942.Springer, 1998.

224 References
38. L. Goossens, F. Harper, B. Kraan, and H. Meacutetivier. Expert Judgement fora Probabilistic Accident Consequence Uncertainty Analysis. Radiation Protection andDosimetry, 90(3):295�303, 2000.
39. Government of Canada. The Canadian Trusted Computer Product EvaluationCriteria, Januart 1993.
40. B. A. Gran. The use of Bayesian Belief Networks for combining disparate sources ofinformation in the safety assessment of software based systems. Doctoral of engineeringthesis 2002:35, Department of Mathematical Science, Norwegian University of Scienceand Technology, 2002.
41. S. Houmb. Combining Disparate Information Sources When Quantifying Opera-tional Security. In Proceedings of the 9th World Multi-Conference on Systemics, Cyber-netics and Informatics, Volume I, pages 128�131. International Institute of Informaticsand Systemics, July 2005. Orlando, Florida, USA.
42. S. Houmb and G. Georg. The Aspect-Oriented Risk-Driven Development (AORDD)Framework. In O. B. et al., editor, Proceedings of the International Conference onSoftware Development (SWDC-REX), volume SWDC-REX Conference Proceedings,pages 81�91, Reykjavik, Iceland, 2005. University of Iceland Press.
43. S. Houmb, G. Georg, R. France, R. Reddy, and J. Bieman. Predicting Availabilityof Systems using BBN in Aspect-Oriented Risk-Driven Development (AORDD). In Pro-ceedings of the 9th World Multi-Conference on Systemics, Cybernetics and Informatics,Volume X: 2nd Symposium on Risk Management and Cyber-Informatics (RMCI�05),pages 396�403. International Institute of Informatics and Systemics, July 2005. Or-lando, Florida, USA.
44. S. Houmb, G.Georg, R.France, J. Bieman, and J. Jürjens. Cost-Bene�t Trade-O¤Analysis using BBN for Aspect-Oriented Risk-Driven Development. In Proceedings ofTenth IEEE International Conference on Engineering of Complex Computer Systems(ICECCS 2005), Shanghai, China, pages 195�204, June 2005.
45. S. Houmb, I. Ray, and I. Ray. Estimating the Relative Trustworthiness of Informa-tion Sources in Security Solution Evaluation. In Proceedings of the 4th InternationalConference on Trust Management (Itrust 2006), volume LNCS 3986, pages 135�149.Springer Verlag, 16-19 May 2006. Pisa, Italy.
46. S. Houmb and K. Sallhammar. Modelling System Integrity of a Security CriticalSystem Using Colored Petri Nets. In Proceeding of Safety and Security Engineering(SAFE 2005), pages 3�12, Rome, Italy, 2005. WIT Press.
47. S. H. Houmb, G. Georg, R. France, and D. Matheson. Using aspects to managesecurity risks in risk-driven development. In 3rd International Workshop on CriticalSystems Development with UML, number TU-Munich Technical Report number TUM-I0415, pages 71�84. International Institute of Informatics and Systemics, 2004.
48. S. H. Houmb, G. Georg, J. Jürjens, and R. France. An Integrated Security Veri�ca-tion and Security Solution Design Trade-O¤Analysis. Integrating Security and SoftwareEngineering: Advances and Future Visions, Chapter 9, 2006. 288 pages.

References 225
49. S. H. Houmb, O.-A. Johnsen, and T. Stålhane. Combining Disparate InformationSources when Quantifying Security Risks. In 1st Symposium on Risk Management andCyber-Informatics (RMCI�04), Orlando, FL, pages 128�131. International Institute ofInformatics and Systemics, July 2004.
50. HUGIN, Version 6.8, Hugin Expert A/S, Alborg, Denmark, April 19 2007.http://www.hugin.dk.
51. IEC 61508:1998 Functional safety of electical/electronic/progammable electronicsafety-related systems, 1998.
52. IEEE Computer Society/Software & Systems Engineering Standards Committee.IEEE Std 1471-2000 Recommended Practice for Architectural Description of Software�Intensive Systems, 2000.
53. Institute of Electrical and Electronics Engineers. IEEE Computer Dictionary -Compilation of IEEE Standard Computer Glossaries, 610, January 1990.
54. International Organization for Standardization (ISO/IEC). ISO/IEC TR13335:2004 Information technology - Guidelines for management of IT Security, 2004.
55. International Organization for Standardization (ISO/IEC). ISO/IEC 17799:2005Information technology - Code of Practice for information security management, 2005.
56. International Organization for Standardization (ISO)/International Electrotechni-cal Commission (IEC). ISO/IEC 10746: Reference Model for Open Distributed Process-ing, 1995.
57. S. Jajodia, P. Samarati, and V. Subrahmanian. A Logical Language for ExpressingAuthorizations. In Proceedings of the 1997 IEEE Symposium on Security and Privacy,Oakland, CA, USA, May 1997. IEEE Computer Society.
58. J.E. McGrath. Internation and Performance. Prentice Hall, 1984.
59. F. Jensen. An introduction to Bayesian Network. UCL Press, University CollegeLondon, 1996.
60. A. Jones and B. Firozabadi. On the Characterization of a Trusting Agent �Aspectsof a Formal Approach. In C.Castelfranchi and Y.Tan, editors, Trust and Deception inVirtual Societies. Kluwer Academic Publishers, 2000.
61. E. Jonsson. An integrated framework for security and dependability. In NSPW �98:Proceedings of the 1998 workshop on New security paradigms, pages 22�29, New York,NY, USA, 1998. ACM Press.
62. E. Jonsson and T. Olovsson. A quantitative model of the security intrusionprocess based on attacker behavior. IEEE Transactions on Software Engineering, 4(235-245):235, April 1997.
63. A. Jøsang. Arti�cial Reasoning with Subjective Logic. In Proceedings of the 2ndAustralian Workshop on Commonsense Reasoning, Perth, Australia, December 1997.

226 References
64. A. Jøsang. A Subjective Metric of Authentication. In J.-J. Quisquater et al.,editors, Proceedings of the 5th European Symposium on Research in Computer Security(ESORICS�98), volume 1485 of Lecture Notes in Computer Science, Louvain-la-Neuve,Belgium, September 1998. Springer-Verlag.
65. A. Jøsang. An Algebra for Assessing Trust in Certi�cation Chains. In Proceedings ofthe 1999 Network and Distributed Systems Security Symposium(NDSS�99), San Diego,California, February 1999. Internet Society.
66. M. Jouini and R. Clemen. Copula Models for Aggregating Expert Opinions. Oper-ations Research, 44:444�457, 1996.
67. J. Jürjens. Secure Systems Development with UML. Springer Verlag, Berlin Heidel-berg, New York, 2005.
68. M. Kallen and R. Cooke. Expert aggregation with dependence. Probabilistic SafetyAssessment and Management, pages 1287�1294, 2002.
69. R. Kasman, J. Asundi, and M. Klein. Making architecture design deci-sions: An economic approach. Technical report CMU/SEI-2002-TR-035, CMU/SEI,http://www.sei.cmu.edu/pub/documents/02.reorts/pdf/02tr03.pdf, 2002.
70. R. Kazman, M. Klein, and P. Clements. ATAM: Method for ar-chitecture evaluation. Technical report CMU/SEI-2000-TR-004, CMU/SEI,http://www.sei.cmu.edu/pub/document/00.reports/pdf/00tr004.pdf, 2000.
71. G. Kirkebøen. Sjønn, formler og klinisk praksis: Hvorfor vurderer erfarne klinikereså dårlig enda de vet så mye? Tidsskrift for Norsk Psykologforening, 36(6):523�536,1999.
72. B. Kraan and R. Cooke. Processing Expert Judgements in Accident ConsequenceModelling. Radiation Protection Dosimetry (Expert Judgement and Accident Conse-quence Uncertainty Analysis; special issue), 90(3):311�315, 2000.
73. S. Lauritzen and D. Spiegelhalter. Local computations with probabilities on graph-ical structures and their application to expert systems (with discussion). Journal of theRoyal Statistical Society, Series B 50(2):157�224, 1988.
74. B. Littlewood, S. Brocklehurst, N. Fenton, P. Mellor, S. Page, D. Wright, J. Dobson,J. McDermid, and D. Gollmann. Towards Operational Measures of Computer Security.Journal of Computer Security, 2:211�229, 1993.
75. B. Madan, K. Goseva-Popstojanova, K. Vaidyanathan, and K. Trivedi. Modelingand Quanti�cation of Security Attributes of Software Systems. In Proceedings of theInternational Conference on Dependable Systems and Networks (DSN�02), volume 2,pages 505�514. IEEE Computer Society, 2002.
76. G. Munkvold, G. Seland, S. Houmb, and S. Ziemer. Empirical assessment in con-verging space of users and professionals. In Proceedings of the 26th Information SystemesResearch Seminar in Scandinavia (IRIS�26), page 14 pages, Helsinki, August 9-12 2003.

References 227
77. N. Provos. Honeyd - A Virtual Honeypot Daemon. In Proceedings of the 10thDFN-CERT Workshop, Hamburg, Germany, February 2003.
78. NS-EN ISO/IEC 17025:2005 Generelle krav til prøvings- og kalibreringslaboratori-ers kompetanse, 2nd edition, 2005.
79. K. Øien and P. Hokstad. Handbook for performing Expert Judgment. Technicalreport, SINTEF, 1998.
80. R. Ortalo and Y. Deswarte. Experiments with quantitative evaluation tools for mon-itoring operational security. IEEE Transactions on Software Engineering, 5(25):633�650, Sept/Oct 1999.
81. M. Østvang. Using Honeynet as an information source in a business perspective:What are the bene�ts and what are the risks? Master�s thesis, Norwegian University ofScience and Technology, 2004.
82. M. Østvang and S. Houmb. Honeypot technology in a business perspective. In1st Symposium on Risk Management and Cyber-Informatics (RMCI�04), Orlando, FL,pages 123�127. International Institute of Informatics and Systemics, 2004.
83. J. Pearl. Probabilistic Reasoning in Intelligent Systems: Network forPlausible In-ference. Morgan Kaufmann, 1988.
84. S. Purser. A Simple Graphical Tool For Modelling Trust. Computers & Security,20(6), September 2001.
85. P. Rangan. An Axiomatic Basis of Trust in Distributed Systems. In Proceedingsof the 1988 IEEE Computer Society Symposium on Security and Privacy, Oakland,California, April 1988. IEEE Computer Society.
86. Rational Software. The Rational Uni�ed Process. Rational Software, The RationalUni�ed Process, version 5.0, Cupertino, CA, 1998.
87. I. Ray and S. Chakraborty. Vector Trust Model. In Proceedings of the 9th EuropeanSymposium on Research in Computer Security (ESORICS 2005), September 2004.
88. I. Ray and S. Chakraborty. A New Model for Reasoning About Trust in SystemsDeveloped from Semi- or Un-trustworthy Components and Actors. In CSU ComputerScience Research Symposium, April 2005.
89. RTCA. DO-178B: Software Considerations in Airborne Systems and EquipmentCerti�cation, 1985.
90. D. Seibert. Participatory action research and social change. Ithaca, NY: CornellParticipatory Action Research Network, Cornell University, 3rd edition, 1998.
91. SERENE: Safety and Risk Evaluation using Bayesian Nets. ESPIRIT FrameworkIV nr. 22187, 1999. http://www.hugin.dk/serene/.

228 References
92. S. Singh, M. Cukier, and W. Sanders. Probabilistic Validation of an Intrusion-Tolerant Replication System. In J. de Bakker, W.-P. de Roever, and G. Rozenberg,editors, International Conference on Dependable Systems and Networks (DSN�03), page615½U624, San Francisco, CA, USA, June 2003.
93. W. Sonnenreich, J. Albanese, and B. Stout. Return On Security Investment (ROSI)- A Practical Quantitative Model. Journal of Research and Practice in InformationTechnology, 38(1):45�56, February 2006.
94. L. Spitzner. Honeypot ½U- tracking hackers. Addison-Wesley, 2003.
95. W. Stallings. Network Security Essentials: Applications and Standards. PrenticeHall, 2nd edition, 2003.
96. Standards Coordinating Committee 10 (Terms and De�nitions) Jane Radatz(Chair). The IEEE Standard Dictionary of Electrical and Electronics Terms, volumeIEEE Std 100-1996, 1996.
97. K. Stølen, F. den Braber, T. Dimitrakos, R. Fredriksen, B. Gran, S. Houmb, Y. Sta-matiou, and J. Aagedal. Business Component-Based Software Engineering, chapterModel-based Risk Assessment in a Component-Based Software Engineering Process:The CORAS Approach to Identify Security Risks, pages 189�207. Kluwer, 2002.
98. G. Straw, G. Georg, E. Song, S. Ghosh, R. France, and J. Bieman. Model compo-sition directives. In T. Baar, A. Strohmeier, A. Moreira, and S. Mellor, editors, UML2004 - The Uni�ed Modelling Language: Modelling Languages and Applications. 7thInternational Conference, Lisbon, Portugal, October 11-15, 2004. Proceedings, volume3273 of Lecture Notes in Computer Science, pages 84�97. Springer Verlag, 2004.
99. E. Stringer and W. Genat. Action research in health. Upper Saddle River, NJ:Pearson Pretence-Hall, 1st edition, 2004.
100. E. Trauth. Qualitative research in IS: issues and trends. Idea Group, 2001.
101. Usability First Web Site. Usability �rst Usability Glossary, Accessed June 8 2007.
102. D. Vose. Risk Analysis: A Quantitative Guide. John Wiley & Sons Ltd., 2000.
103. Walton-on-Thames: Insight Consulting. CRAMM User Guide, Issue 2.0, January2001.
104. D. Wang, B. Madan, and K. Trivedi. Security Analysis of SITAR Intrusion Tol-erance System. In Proceedings of the 2003 ACM workshop on Survivable and self-regenerative systems: in association with 10th ACM Conference on Computer and Com-munications Security, pages 23�32. ACM Press, 2003.
105. A. Welsh. Aspects of Statistical Inference. Wiley & Sons, 1996.
106. L. Xiong and L. Liu. A Reputation-Based Trust Model For Peer-To-Peer Ecom-merce Communities. In Proceedings of the IEEE Conference on E-Commerce (CEC�03),pages 275�284, Newport Beach, California, June 2003.

References 229
107. R. Yahalom and B. Klein. Trust-based Navigation in Distributed Systems. Com-puting Systems, 7(1), Winter 1994.
108. R. Yahalom, B. Klein, and T. Beth. Trust Relationship in Secure Systems: ADistributed Authentication Perspective. In Proceedings of the 1993 IEEE ComputerSociety Symposium on Security and Privacy, Oakland, California, May 1993. IEEEComputer Society.


Part VII
Appendices


Appendix A: AORDD Concepts
De�nition Accountability means that actions of an entity may be traced uniquelyto the entity [54].
De�nition Assets are entities that has value to one or more of the system stake-holders (modi�ed from [15]).
De�nition Asset value is the value of an asset in terms of its relative impor-tance to a particular stakeholder. This value is usually expressed in terms ofsome potential business impacts. This could in turn lead to �nancial losses,loss of revenue, market share or company image (modi�ed from the risk man-agement standard AS/NZS 4360:2004 [4]).
De�nition Authenticity ensures that the identity of a subject or resource is theone claimed [54].
De�nition Availability means that system services are accessible and usable ondemand by an authorised entity [54].
De�nition Basic security threat is the initial security threat that exploits oneor more vulnerabilities in the ToE or the ToE security environment and leadsto a chain of misuses.
De�nition Conceptual assets are non-physical entities of value to one or morestakeholders, such as people and their skills, training, knowledge and experi-ence, and the reputation, knowledge and experience of an organisation (in-terpretation of de�nition given in [20]).
De�nition Con�dentiality (or secrecy) means that information is made avail-able or disclosed only to authorised individuals, entities or processes [54].
De�nition Development environment is the environment in which the ToE isdeveloped [15].
De�nition Evaluation authority is a body that implements the Common Cri-teria for a speci�c community by means of an evaluation scheme and therebysets the standards and monitors the quality of evaluation conducted by bodieswithin that community [15].

234 Appendix A.1: AORDD Concepts
De�nition Evaluation scheme is the administrative and regulatory frameworkunder which the Common Criteria is applied by an evaluation authoritywithin a speci�c community [15].
De�nition Gain is an increase in the asset value for one asset.
De�nition Information system is a system containing physical and conceptualentities that interacts as a potential target for intended or unintended securityattacks which might a¤ect either the system itself, its data or its stakeholdersand end-users (modi�ed from IEEE Std 1471�2000 [52]).
De�nition Information security comprises all perspectives related to de�n-ing, achieving, and maintaining con�dentiality, integrity, availability, non-repudiation, accountability, authenticity and reliability of an information sys-tem (adapted and modi�ed for information security from ISO/IEC TR 13335[54]).
De�nition Integrity means that information is not destroyed or altered in anunauthorised manner and that the system performs its intended function inan unimpaired manner free from deliberate or accidental unauthorised ma-nipulation of the system [54].
De�nition Loss is a reduction in the asset value for one asset.
De�nition Misuse is an event that a¤ects one or more of the security at-tributes con�dentiality, integrity, availability, authenticity, accountability,non-repudiation or reliability of one or more assets.
De�nition Misuse frequency is a measure of the occurrence rate of a misuseexpressed as either the number of occurrences of a misuse in a given timeframe or the probability of the occurrence of a misuse in a given time frame(modi�ed from AS/NZS 4360:2004 [4]).
De�nition Misuse impact is the non-empty set of either a reduction or an in-crease of the asset value for one asset.
De�nition Non-repudiation is the ability to prove that an action or event hastaken place in order to prevent later repudiation of this event or action [54].
De�nition Operational environment is the environment in which the ToE isoperated [15].
De�nition Physical assets are physical entities of value to one or more stake-holders, such as hardware and other infrastructure entities, operating systems,application and information (interpretation of de�nition given in [20]).
De�nition Protection Pro�le (PP) is an implementation-independent state-ment of security needs for a TOE type [15].

Appendix A.1: AORDD Concepts 235
De�nition Reliability is the ability of an item to perform a required functionunder stated conditions [96] (Please note that the use of the term �item�intentionally allows for the calculation of reliability for individual componentsor for the system as a whole.).
De�nition Safeguard is an existing practice, procedure or security mechanismin the ToE and/or the ToE security environment that reduces or preventssecurity threats from exploiting vulnerabilities and thus reduces the level ofrisk (modi�ed from ISO 13335 [54]).
De�nition Stakeholder is an individual, team or organisation (or classes thereof)with interest in or concerns relative to an information system (modi�ed fromthe software architectural standard IEEE 1471 [52]).
De�nition Security critical information system is an information system wherethere are assets with values for which it is critical to preserve one or more ofthe security properties of(modi�ed from [15]).
De�nition Security Risk Acceptance Criteria is a description of the accept-able level of risk (modi�ed from AS/NZS 4360:2004 [4]).
De�nition Security Risk is the combination of exactly one misuse frequency,one misuse impact, one mean time to misuse (MTTM) and one mean e¤ortto misuse (METM) (modi�ed from AS/NZS 4360:2004 [4] by taking in theconcepts for operational security level from Littlewood et al. [74]).
De�nition Security solution is any construct that increases the level of con�-dentiality, integrity, availability, authenticity, accountability, non-repudiation,and/or reliability of a ToE. Examples of security solutions are security re-quirements, security protocols, security procedures, security processes and se-curity mechanism, such as cryptographic algorithm and anti-virus software.
De�nition Security Target (ST) is an implementation-depend-ent statement of the security needs for a speci�c TOE [15].
De�nition Security Threat is a potential undesired event in the ToE and/orthe ToE security environment that may exploit one or more vulnerabilitiesa¤ecting the capabilities of one or more of the security attributes con�den-tiality, integrity, availability, authenticity, accountability, non-repudiation orreliability of one or more assets (modi�ed from AS/NZS 4360:2004 [4]).
De�nition Target of Evaluation (ToE) is a set of software, �rmware and/orhardware possibly accompanied by guidance [15].
De�nition Trade-o¤ Analysis is making decisions when each choice has bothadvantages and disadvantages. In a simple trade-o¤ it may be enough to listeach alternative and the pros and cons. For more complicated decisions, listthe decision criteria and weight them. Determine how each option rates on

236 Appendix A.1: AORDD Concepts
each of the decision score and compute a weighted total score for each option.The option with the best score is the preferred option. Decision trees may beused when options have uncertain outcomes [101].
De�nition User is any external entity (human user or machine user) to the ToEthat interacts (or may interact) with the ToE [15].
De�nition Vulnerability is a weakness in the ToE and/or the ToE security envi-ronment that if exploited a¤ects the capabilities of one or more of the securityattributes con�dentiality, integrity, availability, authenticity, accountability,non-repudiation or reliability of one or more assets (modi�ed from AS/NZS4360:2004 [4]).

Papers are not included due to copyright.

Appendix B.1: P.16: Houmb and Georg (2005)
Siv Hilde Houmb and Geri Georg. The Aspect-Oriented Risk-Driven Develop-ment (AORDD) Framework. In Proceedings of the International Conference onSoftware Development (SWDC-REX). Pages 81-91, University of Iceland Press.Reykjavik, Iceland, 2005. ISBN 9979-54-648-4.
Appendix B.2: P.26; Houmb et al. (2006)
Siv Hilde Houmb, Geri Georg, Robert France, and Jan Jürjens. An IntegratedSecurity Veri�cation and Security Solution Design Trade-o¤ Analysis. In Har-alambos Mouratidis and Paolo Giorgini (Eds), Integrating Security and SoftwareEngineering: Advances and Future Visions. Chapter 9, Pages 190-219. Idea GroupInc, 2007. ISBN: 1-59904-147-6. 288 pages.

Appendix B.3: P.17; Houmb et al. (2005)
Siv Hilde Houmb, Geri Georg, Robert France, Jim Bieman, and Jan Jürjens. Cost-Bene�t Trade-O¤Analysis Using BBN for Aspect-Oriented Risk-Driven Develop-ment. In Proceedings of the Tenth IEEE International Conference on Engineeringof Complex Computer Systems (ICECCS2005). Pages 195-204, IEEE ComputerSociety Press. Shanghai, China, 2005. ISBN 0-7695-2284-X.


Appendix C: Publication List
P.1: Siv Hilde Houmb, Folker den Braber, Mass Soldal Lund and Ketil Stølen.Towards a UML Pro�le for Model-based Risk Assessment. In Proceedingsof the First Satellite Workshop on Critical System Development with UML(CSDUML�02) at the Fifth International Conference on the Uni�ed ModelingLanguage (UML�2002). Pages 79-92, TU-Munich Technical Report numberTUM-I0208. Dresden, Germany, 2002.
P.2: Theodosis Dimitrakos, Brian Ritchie, Dimitris Raptis, Jan Øyvind Aagedal,Folker den Braber, Ketil Stølen and Siv Hilde Houmb. Integrating model-based security risk management into eBusiness systems development - theCORAS Approach. In Proceedings of the IFIP Conference on Towards TheKnowledge Society: E-Commerce, E-Business, E-Government. Pages 159-175, Vol. 233, Kluwer IFIP Conference Proceedings. Lisbon, Portugal, 2002.ISBN 1-4020-7239-2.
P.3: Ketil Stølen, Folker den Braber, Rune Fredriksen, Bjørn Axel Gran, SivHilde Houmb, Mass Soldal Lund, Yannis C. Stamatiou and Jan ØyvingAagedal. Model-based risk assessment - the CORAS approach. In Proceedingsof Norsk Informatikkonferanse (NIK�2002), Pages 239-249, Tapir, 2002.
P.4: Siv Hilde Houmb, Trond Stølen Gustavsen, Ketil Stølen and Bjørn AxelGran. Model-based Risk Analysis of Security Critical Systems. In Fischer-Hubner and Erland Jonsson (Eds.): Proceedings of the 7th Nordic Workshopon Secure IT Systems. Pages 193-194, Karlstad University Press, Karlstad,Sweden, 2002.
P.5: Ketil Stølen, Folker den Braber, Theodosis Dimitrakos, Rune Fredriksen,Bjørn Axel Gran, Siv Hilde Houmb, Yannis C. Stamatiou, and Jan Øyv-ing Aagedal. Model-Based Risk Assessment in a Component-Based SoftwareEngineering Process: The CORAS Approach to Identify Security Risks. InFranck Barbier (Eds.): Business Component-Based Software Engineering.Chapter 10, pages 189-207, Kluwer, ISBN: 1-4020-7207-4, 2002.

306 Appendix C: Publication List
P.6: Siv Hilde Houmb and Kine Kvernstad Hansen. Towards a UML Pro�le forModel-based Risk Assessment of Security Critical Systems. In Proceedingsof the Second Satellite Workshop on Critical System Development with UML(CSDUML�03) at the Sixth International Conference on the Uni�ed ModelingLanguage (UML�2003). Pages 95-103, TU-Munich Technical Report numberTUM-I0323. San Francisco, CA, USA, 2003.
P.7: Glenn Munkvoll, Gry Seland, Siv Hilde Houmb and Sven Ziemer. Empiricalassessment in converging space of users and professionals. In Proceedings ofthe 26th Information Systems Research Seminar in Scandinavia (IRIS�26).14 Pages. Helsinki, Finland, 9-12 August, 2003.
P.8: Siv Hilde Houmb and Jan Jürjens. Developing Secure Networked Web-basedSystems Using Model-based Risk Assessment and UMLsec. In Proceedings ofIEEE/ACM Asia-Paci�c Software Engineering Conference (APSEC2003).Pages 488-498, IEEE Computer Society. Chiang Mai, Thailand, 2003. ISBN0-7695-2011-1.
P.9: Jan Jürjens and Siv Hilde Houmb. Tutorial on Development of Safety-Critical Systems and Model-Based Risk Analysis with UML. In DependableComputing, First Latin-American Symposium, LADC 2003. Pages 364-365,LNCS 2847, Springer Verlag. Sao Paolo, Brazil, 21-24 October 2003. ISBN3-540-20224-2.
P.10: Siv Hilde Houmb and Ørjan M. Lillevik. Using UML in Risk-Driven De-velopment. In H.R. Arabnia, H. Reza (Eds.): Proceedings of the InternationalConference on Software Engineering Research and Practice, SERP �04. Vol-ume 1, Pages 400-406, CSREA Press. Las Vegas, Nevada, USA, 21-24 June2004. ISBN 1-932415-28-9.
P.11: Siv Hilde Houmb, Geri Georg, Robert France, and Dan Matheson. Usingaspects to manage security risks in risk-driven development. In Proceedingsof the Third International Workshop on Critical Systems Development withUML (CSDUML�04) at the Seventh International Conference on the Uni�edModeling Language (UML�2004). Pages 71-84, TU-Munich Technical Reportnumber TUM-I0415. Lisbon, Portugal, 2004.
P.12: Jingyue Li, Siv Hilde Houmb, and Axel Anders Kvale. A Process to Com-bine AOM and AOP: A Proposal Based on a Case Study. In Proceedingsof the 5th Workshop on Aspect-Oriented Modeling (electronic proceeding)at the Seventh International Conference on the Uni�ed Modeling Language(UML�2004). 8 pages, ACM. Lisbon, Portugal, 11 October 2004.
P.13: Jan Jürjens and Siv Hilde Houmb. Risk-driven development process forsecurity-critical systems using UMLsec. In Ricardo Reis (Ed.): InformationTechnology, Selected Tutorials, IFIP 18th World Computer Congress, Tu-

Appendix C: Publication List 307
torials. Pages 21-54, Kluwer. Toulouse, France, 22-27 August 2004. ISBN1-4020-8158-8.
P.14: Mona Elisabeth Østvang and Siv Hilde Houmb. Honeypot Technology ina Business Perspective. In Proceedings of Symposium on Risk-Managementand Cyber-Informatics (RMCI�04): the 8th World Multi-Conference on Sys-temics, Cybernetics and Informatics (SCI 2004). Pages 123-127, InternationalInstitute of Informatics and Systemics. Orlando, FL, USA, 2004.
P.15: Siv Hilde Houmb, Ole-Arnt Johnsen and Tor Stålhane. Combining Dis-parate Information Sources when Quantifying Security Risks. In Proceedingsof Symposium on Risk-Management and Cyber-Informatics (RMCI�04): the8th World Multi-Conference on Systemics, Cybernetics and Informatics (SCI2004). Pages 128-131, International Institute of Informatics and Systemics.Orlando, FL, USA, 2004.
P.16: Siv Hilde Houmb and Geri Georg. The Aspect-Oriented Risk-Driven De-velopment (AORDD) Framework. In Proceedings of the International Con-ference on Software Development (SWDC-REX). Pages 81-91, University ofIceland Press. Reykjavik, Iceland, 2005. ISBN 9979-54-648-4.
P.17: Siv Hilde Houmb, Geri Georg, Robert France, Jim Bieman, and Jan Jür-jens. Cost-Bene�t Trade-O¤ Analysis Using BBN for Aspect-Oriented Risk-Driven Development. In Proceedings of the Tenth IEEE International Con-ference on Engineering of Complex Computer Systems (ICECCS2005). Pages195-204, IEEE Computer Society Press. Shanghai, China, 2005. ISBN 0-7695-2284-X.
P.18: Siv Hilde Houmb. Combining Disparate Information Sources When Quan-tifying Operational Security. In Proceedings of the 9th World Multi-Conferenceon Systemics, Cybernetics and Informatics, Volume I. Pages 128-131, Inter-national Institute of Informatics and Systemics. Orlando, USA, 2005. ISBN980-6560-53-1.
P.19: Siv Hilde Houmb, Geri Georg, Robert France, Raghu Reddy, and JimBieman. Predicting Availability of Systems using BBN in Aspect-OrientedRisk-Driven Development (AORDD). In Proceedings of 2nd Symposium onRisk Management and Cyber-Informatics (RMCI�05): the 9th World Multi-Conference on Systemics, Cybernetics and Informatics, Volume X. Pages 396-403, International Institute of Informatics and Systemics. Orlando, USA,2005. ISBN 980-6560-62-0.
P.20: Siv Hilde Houmb and Karin Sallhammar. Modeling System Integrity of aSecurity Critical System Using Colored Petri Nets. In Proceedings of Safetyand Security Engineering (SAFE 2005). Pages 3-12, WIT Press. Rome, Italy,2005. ISBN 1-84564-019-5.

308 Appendix C: Publication List
P.21: Jan Jürjens and Siv Hilde Houmb. Dynamic Secure Aspect Modeling withUML: From Models to Code. In Model Driven Engineering Languages andSystems: 8th International Conference, MoDELS 2005. Pages 142-155, LNCS3713, Springer Verlag. Montego Bay, Jamaica, 2-7 October 2005. ISBN 3-540-29010-9.
P.22: Dan Matheson, Indrakshi Ray, Indrajit Ray and Siv Hilde Houmb. Build-ing Security Requirement Patterns for Increased E¤ectiveness Early in theDevelopment Process. Symposium on Requirements Engineering for Informa-tion Security (SREIS). Paris, 29 August, 2005.
P.23: Geri Georg, Siv Hilde Houmb and Dan Matheson. Extending Security Re-quirement Patterns to Support Aspect-Oriented Risk-Driven Development.Workshop on Non-functional Requirement Engineering at the 8th Interna-tional Conference on Model Driven Engineering Languages and Systems,MoDELS 2005. Montego Bay, Jamaica, October 2-7 2005.
P.24: Siv Hilde Houmb, Indrakshi Ray, and Indrajit Ray. Estimating the RelativeTrustworthiness of Information Sources in Security Solution Evaluation. InKetil Stølen, William H. Winsborough, Fabio Martinelli, and Fabio Massacc(Eds.): Proceedings of the 4th International Conference on Trust Management(iTrust 2006). Pages 135-149, LNCS 3986, Springer Verlag, Pisa, Italy, 16-19May 2006.
P.25: Geri Georg, Siv Hilde Houmb, and Indrakshi Ray. Aspect-Oriented RiskDriven Development of Secure Applications. In Damiani Ernesto and PengLiu (Eds.), Proceedings of the 20th Annual IFIP WG 11.3 Working Confer-ence on Data and Applications Security 2006 (DBSEC 2006). Pages 282-296,LNCS 4127, Springer Verlag, Sophia Antipolis, France, 31 July - 2 August2006.
P.26: Siv Hilde Houmb, Geri Georg, Robert France, and Jan Jürjens. An Inte-grated Security Veri�cation and Security Solution Design Trade-o¤ Analysis.In Haralambos Mouratidis and Paolo Giorgini (Eds), Integrating Securityand Software Engineering: Advances and Future Visions. Chapter 9, Pages190-219. Idea Group Inc, 2007. ISBN: 1-59904-147-6. 288 pages.
P.27: Siv Hilde Houmb, Geri Georg, Robert France, Dorina C. Petriu, and JanJürjens (Eds.). In Proceedings of the 5th International Workshop on CriticalSystems Development Using Modeling Languages (CSDUML 2006). 87 pages.Research Report Telenor R&I N 20/2006, 2006.
P.28: Geri Georg, Siv Hilde Houmb, Robert France, Ste¤en Zschaler, DorinaC. Petriu, and Jan Jürjens. Critical Systems Development Using ModelingLanguages �CSDUML 2006 Workshop Report. In Thomas Kühne (Eds.),Models in Software Engineering: Workshops and Symposia at MoDELS 2006,

Appendix C: Publication List 309
Genoa, Italy, October 1-6, 2006, Reports and Revised Selected Papers. Pages27-31, LNCS 4364, Springer Verlag, 2007.
P.29: Dorina C. Petriu, C. Murray Woodside, Dorin Bogdan Petriu, Jing Xu,Toqeer Israr, Geri Georg, Robert B. France, James M. Bieman, Siv HildeHoumb and Jan Jürjens. Performance analysis of security aspects in UMLmodels. In Proceedings of the 6th International Workshop on Software andPerformance, WOSP 2007. Pages 91-102, ACM. Buenes Aires, Argentina,5-8 February 2007. ISBN 1-59593-297-6.