Embed Size (px)
Citation preview

Qazi et al. Supply Chain Risk Network Management (SCRNM)
DECISION SCIENCES INSTITUTE
Supply Chain Risk Network Management (SCRNM): A Paradigm Shift towards Modelling Systemic Risks and Risk Appetite
Abroon Qazi, Alex Dickson, and John Quigley
University of Strathclyde Business School Email: {abroon.qazi; alex.dickson; j.quigley}@strath.ac.uk
ABSTRACT There is a major research gap of developing a supply chain risk management process integrating risk appetite of the decision maker and all stages of the risk management process within an interdependent network of systemic risks. We introduce an iterative process namely Supply Chain Risk Network Management to bridge this gap. We make use of the recently introduced concept of utility indifference curves based risk matrix to capture the risk attitude of the decision maker and demonstrate the application of the proposed process through an illustrative example. KEYWORDS: Risk appetite, Systemic risks, Supply chain risk network management,
Utility indifference curves, Risk matrix INTRODUCTION Risk management is a continuous process comprising sequential stages of risk identification, risk analysis, risk evaluation, risk treatment and risk monitoring (SA, 2009). Supply chain risk management (SCRM) deals with managing risks associated with the entire chain involved in transforming the raw material into the finished product that is finally delivered to the customer. Adapting the established risk management framework (SA, 2009), researchers have been proposing various SCRM frameworks (Heckmann et al., 2015, Ho et al., 2015). Besides these frameworks, a number of models and tools have been developed focusing on different stages of the SCRM process (Fahimnia et al., 2015). Supply chain risks have been generally classified into independent categories like physical, financial, information, relational and innovation (Rao and Goldsby, 2009). The same independent categories of risks are adopted and reflected in the conventional risk matrix based tools used by the practitioners (Norrman and Jansson, 2004). Limited articles in the literature on risk management in general (Ackermann et al., 2014) and SCRM in particular (Badurdeen et al., 2014, Garvey et al., 2015) have focused on the shortcoming of conventional techniques of risk identification and emphasised the need for capturing systemic interactions between risks. Risk assessment/evaluation and risk treatment following the conventional risk identification techniques yield sub-optimal solutions as these techniques fail to account for complex dynamics across the risks and risk sources (Ackermann et al., 2014). Risk appetite of the decision maker drives the tolerance level with respect to the acceptance of risks. Very few frameworks in SCRM have captured the risk appetite of the decision maker (Knemeyer et al., 2009, Lavastre et al., 2012), however, to the best of the authors’ knowledge, no existing study has ever investigated designing a risk management framework within a network setting of interacting risks driven by the risk appetite of the decision maker. Integration of utility indifference curves within the risk matrix has been recently introduced in the literature

Qazi et al. Supply Chain Risk Network Management (SCRNM)
on risk management that results in discretising the risk matrix into five risk zones: Negligible-no need for further concern; Acceptable-need for monitoring the risks with no investment; Controllable-need for adopting emergency plans; Critical-need for mitigating risks as long as the benefits exceed the costs; and Unacceptable-need for bringing the risks down to the critical level at any cost (Ruan et al., 2015). Selection of optimal risk mitigation strategies has also gained limited attention both in the literature on risk management in general (Spackova and Straub, 2015) and SCRM in particular (Tuncel and Alpan, 2010, Micheli et al., 2014, Aqlan and Lam, 2015) but the main challenge is to develop these studies further to capture interdependency between risks and to consider the risk appetite of the decision maker as well. The main research question driving our research project is: How can we design a SCRM process integrating the systemic interaction between risks and the risk appetite of the decision maker? In this study, we aim to contribute to the field of SCRM by introducing a major research gap that has gained limited attention of the researchers. Furthermore, we introduce a new risk management process namely Supply Chain Risk Network Management (SCRNM) and demonstrate why it is important to bridge the identified research gap and to follow our proposed process. We transform the conventional risk matrix in order to make it compatible for assessing interdependent risks in relation to utility indifference curves specific to the decision maker. LITERATURE REVIEW We reviewed the articles focusing on the risk management process/framework within the field of SCRM. We also reviewed the existing literature reviews in order to substantiate our findings. Harland et al. (2003) developed a supply network risk management tool and applied it to the electronics sector through conducting four case studies. The main merit of the tool is its exclusive focus on collaborative risk management achieved through engaging the stakeholders across the supply network. Building on the same concept of network wide management of risks, Hallikas et al. (2004) introduced a risk management process integrating different perspectives of supply chain actors and emphasised the need for adopting Systems approach in order to understand the complex dynamics across the network. Systems-oriented SCRM process is also introduced by Oehmen et al. (2009) that captures the interdependency between risks. Advocating the need for adapting the degree of risk management with regard to the contextual factors, Giunipero and Eltantawy (2004) introduced a risk management framework contingent on four determinants: degree of product technology; need for security; importance of the supplier; and purchaser’s prior experience with the situation. Supply chain operations reference model (SCOR) has also been modified and considered as an important framework for managing supply chain risks (Sinha et al., 2004, Rotaru et al., 2014). The main limitation of the aforementioned studies and other risk management frameworks proposed by Manuj and Mentzer (2008), Khan et al. (2008) and Tummala and Schoenherr (2011) is their limited focus on capturing the interdependency between risks. Only two of the selected studies (Knemeyer et al., 2009, Lavastre et al., 2012) considered risk appetite of the decision maker as an important factor and included it in the SCRM framework. Although risk attitude has been considered in the modelling framework of a number of studies as mentioned in the literature review conducted by Heckmann et al. (2015), these articles fail to meet the selection criterion of this study because of their focus on a specific stage of the risk management process. Among the quantitative studies, Tuncel and Alpan (2010) used a timed petri nets framework to model and analyse a supply chain which is subject to various risks. They
Qazi et al. Supply Chain Risk Network Management (SCRNM)
used Failure Modes and Effects Analysis (FMEA) to identify important risks having higher values of Risk Priority Number (RPN). Elleuch et al. (2014) proposed a comprehensive risk management process integrating the techniques of FMEA, design of experiments, analytical hierarchy process and desirability function approach. Micheli et al. (2014) and Aqlan and Lam (2015) introduced optimisation based techniques for selecting optimal risk mitigation strategies. Although all the mentioned quantitative studies consider interdependency between risks and strategies, critical aspect of modelling interdependency between risks and risk appetite of the decision maker is ignored.
We also reviewed a number of articles focusing on literature reviews and it was surprising to find that only two studies have emphasised the need for modelling interdependency between risks (Colicchia and Strozzi, 2012, Ho et al., 2015). Similarly, despite the fact that existing SCRM frameworks fail to integrate all stages of the risk management process within an interdependent setting of risks and strategies, limited studies have realised the importance of conducting research in this direction. Critical review of the selected articles focusing on the SCRM process/framework and literature reviews reveals an important finding that an integrated risk management framework considering the interdependency between risks and mitigation strategies and risk appetite of the decision maker has neither been explored nor mentioned as a research gap for directing future research. Our study can be considered as an important step towards bridging this major research gap and establishing an agenda for future research. EXISTING SCRM PROCESS AND CONCEPT OF UTILITY INDIFFERENCE CURVES BASED RISK MATRIX There is a consensus among researchers that the SCRM process comprises five sequential stages: risk identification; assessment; analysis; treatment; and monitoring (Giannakis and Papadopoulos, 2016) that are analogous to the stages of the standard risk management process (SA, 2009). We present a very simple example to illustrate these stages and identify the main issue with adopting this process in case of interdependent risks. In the risk identification stage, specific risks must be identified. Let us assume that there are five risks namely R1, R2, R3, R4 and R5 that have been identified for a hypothetical supply chain using standard tools of checklists, risk mapping and taxonomies. In the risk assessment stage, each risk is assigned the probability and impact values and in our example, we assign arbitrary values to the risks as shown in Table 1. These risks are subsequently mapped on a risk matrix for the sake of prioritisation (risk analysis) and selecting risk mitigation actions (risk treatment).
Table 1: Risk parameters
Risk Probability Impact
R1 0.7 1200 R2 0.4 600 R3 0.1 500 R4 0.5 800 R5 0.9 700
Risk matrix is a two-dimensional plot of risks characterised by the corresponding probability and impact values. For a detailed overview of the history of risk matrix based tools and associated shortcomings, interested readers may refer to the study conducted by Duijm (2015). One of the main limitations of these tools is their lack of capturing risk attitude of the decision maker. Using utility theory, Ruan et al. (2015) introduced a three step process for integrating risk attitude in the risk matrix by: (a) describing risk attitudes of decision makers by utility functions; (b)

Qazi et al. Supply Chain Risk Network Management (SCRNM)
introducing utility indifference curves and embedding these into the risk matrix; and (c) discretising utility indifference curves. Firstly, the utility function of the decision maker must be established. In this example, we
assume that the decision maker is risk-neutral (𝑢𝑡𝑖𝑙𝑖𝑡𝑦 𝑜𝑓 𝑙𝑜𝑠𝑠 [𝑢(𝑙)] = −𝑙𝑜𝑠𝑠 ). The utility
indifference curves segregate the entire risk matrix into five regions: unacceptable; critical; controllable; acceptable; and negligible risk zones (Ruan et al., 2015). Therefore, we need a total of four utility indifference curves in order to establish the boundaries of these five regions. On each utility indifference curve, Equations (1) and (2) must hold good for every point (𝑃) and
a pair of points: 𝑃𝑖 and 𝑃𝑗, respectively:
𝑝 ∗ 𝑢(𝑙) + (1 − 𝑝) ∗ 𝑢(𝑙)̅ = 𝑐𝑜𝑛𝑠𝑡𝑎𝑛𝑡 (1)
𝑝𝑖 ∗ 𝑢(𝑙𝑖) + (1 − 𝑝𝑖) ∗ 𝑢(𝑙)̅ = 𝑝𝑗 ∗ 𝑢(𝑙𝑗) + (1 − 𝑝𝑗) ∗ 𝑢(𝑙)̅
𝑝𝑖 ∗ (𝑢(𝑙𝑖) − 𝑢(𝑙)̅) = 𝑝𝑗 ∗ (𝑢(𝑙𝑗) − 𝑢(𝑙)̅) (2)
where 𝑝𝑖 and 𝑙𝑖 are the probability and impact values associated with point ‘𝑃𝑖 ’, respectively,
𝑢(𝑙) is the utility value of the loss resulting from realisation of the risk,
𝑢(𝑙)̅ is the utility value of no loss. Now, if we consider a point (𝑃∗) on each curve having a probability value of 1, the equation for locating other points on the curve is as follows: 𝑝 ∗ (𝑢(𝑙) − 𝑢(𝑙)̅) = 𝑢(𝑙∗) − 𝑢(𝑙)̅ (3)
The value of 𝑢(𝑙∗) is unique for each curve and influenced by the risk appetite of the decision maker. For a detailed discussion on adopting the process, interested readers may refer to Ruan
et al. (2015). In case of a risk-neutral decision maker with 𝑢(𝑙)̅ = 0, Equation (3) is reduced to:
𝑝 ∗ 𝑙 = −𝑢(𝑙∗) = 𝑐𝑜𝑛𝑠𝑡𝑎𝑛𝑡 (4) The five zones representing relative importance of risks are unacceptable (R-I), critical (R-II), controllable (R-III), acceptable (R-IV) and negligible (R-V) as shown in Figure 1. The unacceptable zone also includes the area of the risk matrix beyond the threshold impact (in this case, above the line: Impact=1500). We have assumed that 1500 is the maximum tolerance level of the decision maker beyond which a risk with any probability value must be mitigated. Each risk considered in our example occupies a specific zone. The values of 𝑢(𝑙∗) corresponding to the specific points having probability value of 1 on the four curves (Points A, B, C and D) are assumed as -695, -521, -347 and -174, respectively. As R1 is an unacceptable risk, it must be mitigated at any cost. R5 must be mitigated if the benefit exceeds the cost. We can identify a strategy or combinations of strategies that would either reduce the probability or impact of a risk or a set of risks. It is very easy to conduct the risk treatment as we only need to evaluate the benefits through executing simple arithmetic operations and weigh these against the total cost of implementing strategies. Therefore, we can prioritise risks and select optimal strategies through following a sequential risk management process. During the risk monitoring stage, any new risk(s) and/or changes in the parameters of existing risks must be incorporated in the risk matrix.

Qazi et al. Supply Chain Risk Network Management (SCRNM)
Figure 1: Utility indifference curves based risk matrix
Now let us consider that instead of a set of independent risks, we are dealing with a network of risks where there are interdependencies between risks and a risk might have correlation (positive or negative) with another risk or a set of risks. Similarly, a mitigation strategy can have an association with multiple risks or multiple strategies can influence a single risk. Existing frameworks fail to account for evaluation and treatment of such network of risks. In case of interdependent risks, we need to marginalise the probability values through assigning conditional probability values to the risks. Similarly, the existing risk matrix based tools are not capable of projecting the criticality of interdependent risks. Furthermore, the criterion for conducting cost-benefit analysis for the network of risks and potential strategies taking into account the risk appetite of the decision maker and linking it back to the performance of individual risks on the risk matrix is not established. PROPOSED PROCESS We adapt the established risk management framework (SA, 2009) as it is widely used both by the researchers and practitioners (Ahmed et al., 2007). Although the description of terms and concepts used in the framework is controversial (Aven, 2011), our focus is limited to the stages involved in the process. The proposed process is shown as Figure 2. The main contribution of the proposed process is its exclusive focus on the ‘systemicity of risks’ (Ackermann et al., 2006, Ackermann et al., 2014). Instead of treating risks in silo, we introduce the concept of risk network. The process starts with the specification of context in terms of defining the boundary of the supply chain/network and identifying the stakeholders involved in the risk management process. Risk network identification is a critical stage where there is a need for bringing a paradigm shift as the existing literature is rife with conventional tools and techniques of identifying risk categories and the concept of developing causal risk paths/risk network has gained limited attention (Badurdeen et al., 2014, Garvey et al., 2015). Besides identifying the risks and risk sources, potential risk mitigation strategies must also be included within the network. Risk network analysis involves determining the (conditional) probability values and loss (utility) values associated with risks and the cost related to implementing potential mitigation strategies. The utility values are driven by the risk appetite of the decision maker. In the risk network
R1
R2
R3
R4
R5
0
300
600
900
1200
1500
0 0.2 0.4 0.6 0.8 1
Imp
act
P(Ri=True)
R-I R-II R-III R-IV R-V
A
B
C
D

Qazi et al. Supply Chain Risk Network Management (SCRNM)
evaluation stage, there is a need to explore new risk measures that can be computed easily and are capable of capturing the network wide impact of risks. The measures are also influenced by the risk appetite. In addition to registering the holistic impact of risks within the network setting, there is also a need for visualising the impact of each risk on the network of risks and ensuring that all risks are mitigated to the required level. Therefore, a modified risk matrix capable of evaluating interdependent risks coupled with the mapping of utility indifference curves (Ruan et al., 2015) must be developed and consulted for risk network evaluation.
Figure 2: Supply chain risk network management (SCRNM) Risk network treatment deals with the evaluation of different combinations of risk mitigation strategies within the network setting. The proposed process flow is in contrast with the one established in extant literature as instead of following a unidirectional flow, it is an iterative process where evaluation of each combination of strategies necessitates re-assessing and re-evaluating the risk network. The iterative process results in the selection of an optimal combination of strategies that not only considers the network wide holistic effect of these strategies but also yields an acceptable configuration of risks mapped on the modified risk matrix. The matrix also helps in identifying critical risks that must be monitored periodically. After determining the optimal combination of strategies, these are implemented and as risk management is a continuous process, there is a need for continuously monitoring risks and updating the risk network on a regular basis. PROPOSED APPROACH Based on the efficacy of Bayesian Belief Networks (BBNs) in capturing interdependencies between risks, we consider BBN based modeling of risk network as an effective approach. Such a modeling technique can help managers visualise supply chain risks and take effective
Establishing the Context
Risk Network Identification
Risk Network Analysis
Risk Network Evaluation
Risk Network Treatment
Implementation of Strategies
Risk Network Monitoring
Establishing the Risk Appetite
Modified Risk Matrix
Qazi et al. Supply Chain Risk Network Management (SCRNM)
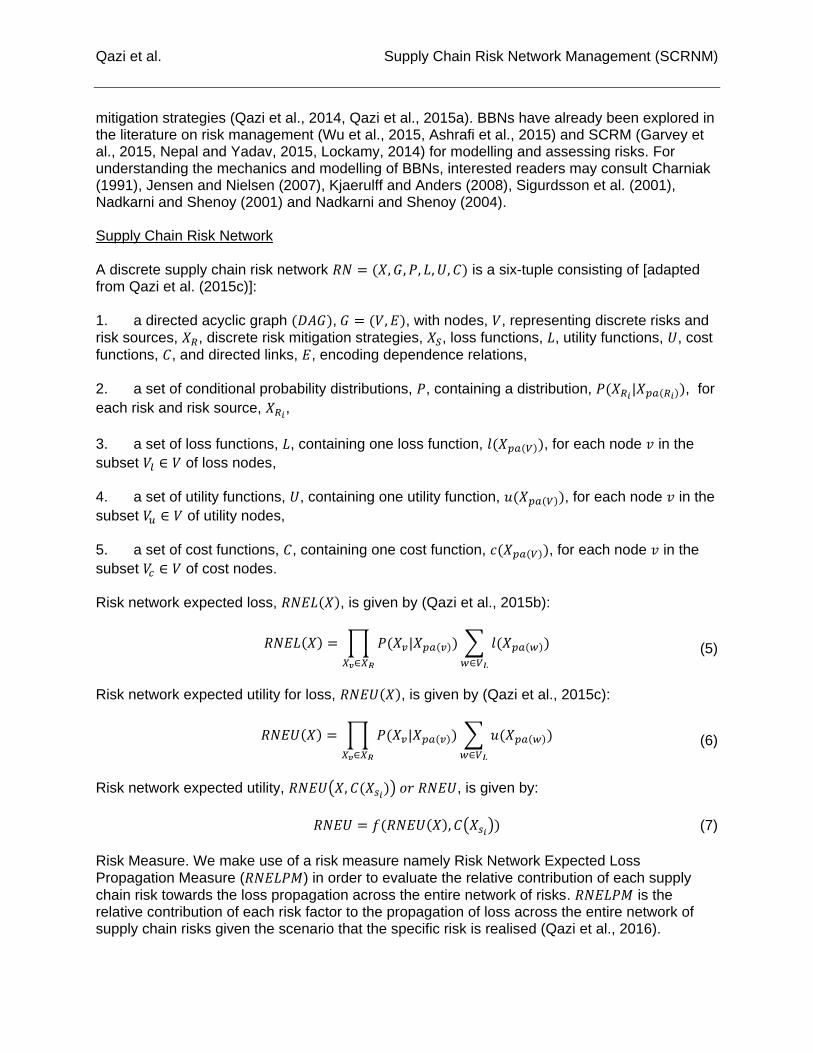
mitigation strategies (Qazi et al., 2014, Qazi et al., 2015a). BBNs have already been explored in the literature on risk management (Wu et al., 2015, Ashrafi et al., 2015) and SCRM (Garvey et al., 2015, Nepal and Yadav, 2015, Lockamy, 2014) for modelling and assessing risks. For understanding the mechanics and modelling of BBNs, interested readers may consult Charniak (1991), Jensen and Nielsen (2007), Kjaerulff and Anders (2008), Sigurdsson et al. (2001), Nadkarni and Shenoy (2001) and Nadkarni and Shenoy (2004). Supply Chain Risk Network A discrete supply chain risk network 𝑅𝑁 = (𝑋, 𝐺, 𝑃, 𝐿, 𝑈, 𝐶) is a six-tuple consisting of [adapted from Qazi et al. (2015c)]: 1. a directed acyclic graph (𝐷𝐴𝐺), 𝐺 = (𝑉, 𝐸), with nodes, 𝑉, representing discrete risks and
risk sources, 𝑋𝑅, discrete risk mitigation strategies, 𝑋𝑆, loss functions, 𝐿, utility functions, 𝑈, cost
functions, 𝐶, and directed links, 𝐸, encoding dependence relations, 2. a set of conditional probability distributions, 𝑃, containing a distribution, 𝑃(𝑋𝑅𝑖
|𝑋𝑝𝑎(𝑅𝑖)), for
each risk and risk source, 𝑋𝑅𝑖,
3. a set of loss functions, 𝐿, containing one loss function, 𝑙(𝑋𝑝𝑎(𝑉)), for each node 𝑣 in the
subset 𝑉𝑙 ∈ 𝑉 of loss nodes, 4. a set of utility functions, 𝑈, containing one utility function, 𝑢(𝑋𝑝𝑎(𝑉)), for each node 𝑣 in the
subset 𝑉𝑢 ∈ 𝑉 of utility nodes, 5. a set of cost functions, 𝐶, containing one cost function, 𝑐(𝑋𝑝𝑎(𝑉)), for each node 𝑣 in the
subset 𝑉𝑐 ∈ 𝑉 of cost nodes. Risk network expected loss, 𝑅𝑁𝐸𝐿(𝑋), is given by (Qazi et al., 2015b): 𝑅𝑁𝐸𝐿(𝑋) = ∏ 𝑃(𝑋𝑣|𝑋𝑝𝑎(𝑣)) ∑ 𝑙(𝑋𝑝𝑎(𝑤))
𝑤∈𝑉𝐿𝑋𝑣∈𝑋𝑅
(5)
Risk network expected utility for loss, 𝑅𝑁𝐸𝑈(𝑋), is given by (Qazi et al., 2015c): 𝑅𝑁𝐸𝑈(𝑋) = ∏ 𝑃(𝑋𝑣|𝑋𝑝𝑎(𝑣)) ∑ 𝑢(𝑋𝑝𝑎(𝑤))
𝑤∈𝑉𝐿𝑋𝑣∈𝑋𝑅
(6)
Risk network expected utility, 𝑅𝑁𝐸𝑈(𝑋, 𝐶(𝑋𝑠𝑖)) 𝑜𝑟 𝑅𝑁𝐸𝑈, is given by:
𝑅𝑁𝐸𝑈 = 𝑓(𝑅𝑁𝐸𝑈(𝑋), 𝐶(𝑋𝑠𝑖
)) (7)
Risk Measure. We make use of a risk measure namely Risk Network Expected Loss Propagation Measure (𝑅𝑁𝐸𝐿𝑃𝑀) in order to evaluate the relative contribution of each supply
chain risk towards the loss propagation across the entire network of risks. 𝑅𝑁𝐸𝐿𝑃𝑀 is the relative contribution of each risk factor to the propagation of loss across the entire network of supply chain risks given the scenario that the specific risk is realised (Qazi et al., 2016).

Qazi et al. Supply Chain Risk Network Management (SCRNM)
𝑅𝑁𝐸𝐿𝑃𝑀𝑋𝑅𝑖
= 𝑅𝑁𝐸𝐿(𝑋|𝑋𝑅𝑖= 𝑡𝑟𝑢𝑒) ∗ 𝑃(𝑋𝑅𝑖
= 𝑡𝑟𝑢𝑒) (8)
Risk Configuration Metric. Risk configuration metric (𝑅𝐶𝑀) represents the preference of the decision maker with regard to the configuration of risks on the modified risk matrix. A pure qualitative metric focusing on the relative number of risks within each risk zone may be represented as follows:
𝑅𝐶𝑀𝑋𝑠𝑖=
𝑛1 ∗ 𝑎1 + 𝑛2 ∗ 𝑎2 + 𝑛3 ∗ 𝑎3 + 𝑛4 ∗ 𝑎4 + 𝑛5 ∗ 𝑎5
𝑁 (9)
where 𝑛𝑖 and 𝑎𝑖 represent the number of risks in the risk zone 𝑖 and the criticality significance of
risk zone 𝑖 on a normalised scale (0-1), respectively,
𝑁 is the total number of risks. However, we consider following risk metric to be appropriate as defined over a range of continuous values and therefore, it will be used in the paper: 𝑅𝐶𝑀𝑋𝑠𝑖
= ∑ −𝑢 (𝑅𝑁𝐸𝐿𝑋𝑠𝑖(𝑋|𝑋𝑅𝑖
= 𝑡𝑟𝑢𝑒)) ∗
𝑋𝑅
𝑃(𝑋𝑅𝑖)
𝑋𝑠𝑖
(10)
The normalised risk metric is defined as follows: 𝑅𝐶𝑀̅̅ ̅̅ ̅̅
𝑋𝑠𝑖= 1 − 𝑅𝐶𝑀𝑋𝑠𝑖
/𝑚𝑎𝑥 (𝑅𝐶𝑀𝑋𝑠) (11)
where it is assumed that the utility of ‘no loss’ is 0 and 𝑅𝐶𝑀𝑋𝑠
is the entire set of 𝑅𝐶𝑀 values for
all combinations of strategies. Modelling Process Following steps must be followed in developing the BBN based risk network of interacting supply chain risks and mitigation strategies: 1. Define the boundaries of the supply network and identify stakeholders. 2. Identify a network of key risks, corresponding risk sources and potential risk mitigation strategies on the basis of input received from each stakeholder through interviews and/or focus group sessions. 3. Refine the qualitative structure of the resulting network involving all stakeholders. 4. Elicit (conditional) probability values, loss (utility) values resulting from risks and cost associated with implementing each potential mitigation strategy and populate the BBN with all values. 5. Run the model corresponding to the risk appetite of the decision maker for assessing and treating risks. 6. Validate the model output involving stakeholders.

Qazi et al. Supply Chain Risk Network Management (SCRNM)
Illustrative Example: Demonstration of Key Concepts In order to demonstrate the key concepts introduced, we present a simple network comprising five risks (𝑅𝑖) and four potential risk mitigation strategies (𝑆𝑖) as shown in Figure 3. It is assumed that each risk is associated with a loss value of 100 units and each strategy can be implemented at a cost of 30 units. Each risk is considered to have binary states: True (T) or False (F). Similarly, each mitigation strategy is assumed to be in one of the binary states: Yes (Y) or No (N). The (conditional) probability values are shown in Table 2. The shaded cells represent the (conditional) probability values once the corresponding mitigation strategy is selected. It is interesting to consider positive correlation of S1 with R2.
Figure 3: Risk network modelled in GeNIe (GeNIe, 2015)
Table 2: (Conditional) probability values [𝑃(𝑟𝑖𝑠𝑘 = 𝐹|𝑝𝑎𝑟𝑒𝑛𝑡𝑠) = 1 − 𝑃(𝑟𝑖𝑠𝑘 = 𝑇|𝑝𝑎𝑟𝑒𝑛𝑡𝑠)]
𝑷𝒂𝒓𝒆𝒏𝒕𝒔 𝑷(𝒓𝒊𝒔𝒌 = 𝑻𝒓𝒖𝒆|𝒑𝒂𝒓𝒆𝒏𝒕𝒔)
𝑅1 𝑅2 𝑅3 𝑅4 𝑆1 𝑆2 𝑆3 𝑆4 𝑅1 𝑅2 𝑅3 𝑅4 𝑅5
N 0.8
Y 0.6
N 0.3
Y 0.6
T N 0.7
Y 0.2
F N 0.1
Y 0.02
T
T
N
0.9
F 0.5
F
T 0.7
F 0.1
T
T
Y
0.6
F 0.3
F
T 0.4
F 0.01
T T
N
0.7
F 0.5
F T 0.2
F 0.1
T T
Y
0.3
F 0.1
F T 0.1
F 0.03

Qazi et al. Supply Chain Risk Network Management (SCRNM)
Risk-Neutral Decision Maker A risk-neutral decision maker interested in maximising reduction in the risk network expected loss less cost does not account for the relative importance of each risk in terms of its relative position on the modified risk matrix. The decision maker would only select a combination of strategies and make an investment if there is an increase in the reduction of risk network expected loss less cost. Under standard configuration, the risks are evaluated with respect to the existing strategies whereas none of the potential strategies is selected. The relative performance of each combination of strategies is mapped in Figure 4. Each point represents a particular combination of strategies with corresponding cost and risk network expected loss. The solid line represents the threshold where the reduction in risk network expected loss is just equal to the cost of implementing strategies. The points (above) below this line represent all such combinations which are (in)feasible. The dotted line in black contains the optimal solution (point E) yielding maximum reduction in the network expected loss less cost whereas the dashed line in blue contains the optimal solution (point A) following the criterion of maximising benefit to cost ratio. Although point K is a feasible solution, it is not optimal as it fails to yield a greater reduction in network expected loss less cost relative to that of point E. A red cross represents an optimal solution. The decision maker will select point A if the available budget is less than 60 units but at least 30 units whereas for budget greater than and inclusive of 60 units, point E is the optimal solution.
Figure 4: Identification of optimal combinations of strategies
Risk-Averse Decision Maker In case of a risk-averse decision maker, we assumed the utility function as represented by Equation (12). We also assumed that the upper threshold for the loss value is 500 units. Similarly, the selected 𝑢(𝑙∗) values corresponding to the four utility indifference curves are -200, -150, -100 and -50, respectively. 𝑢(𝑙) = −(𝑙)2 (12)
A
C
F
K
S
B
D
E
G H
I J
L M
N
O
100
150
200
250
300
0 30 60 90 120
Ris
k n
etw
ork
expecte
d loss
Total cost of implementing mitigation strategies

Qazi et al. Supply Chain Risk Network Management (SCRNM)
Maximising Normalised Risk Configuration Metric subject to Constraints We mapped the risks corresponding to the standard configuration of network as shown in Figure 5 with all risks located in the unacceptable zone. Next, we evaluated the normalised risk configuration metric for all combinations of strategies as shown in Figure 6. As there are risks located in the unacceptable zone, the constraint of risk network expected loss can be ignored. Therefore, point A is the optimal solution corresponding to the cost of 30 units.
Figure 5: Risk network evaluation under standard configuration (Point S)
Figure 6: Identification of optimal solutions
The risk configuration corresponding to point A is shown as Figure 7. As two risks are still in the unacceptable region, we can ignore the constraint of benefit exceeding cost, however, point E
yields the best value corresponding to both criteria (maximising 𝑅𝐶𝑀̅̅ ̅̅ ̅̅ and minimising ‘𝑅𝑁𝐸𝐿 + 𝑐𝑜𝑠𝑡′). The risk configuration relative to point E is shown as Figure 8. There is no risk in the unacceptable region whereas two risks are located in the critical region. Therefore, point K is
R1
R2 R3 R4
R5
0
100
200
300
400
500
0 0.2 0.4 0.6 0.8 1
RN
EL(X
|Ri=
Tru
e)
P(Ri=True)
S
A
C
F
B
D
E
G H
I J
K
L M
N
O
0
0.2
0.4
0.6
0.8
0 30 60 90 120
Norm
alis
ed r
isk c
onfigura
tion m
etr
ic
Total cost of implementing mitigation strategies

Qazi et al. Supply Chain Risk Network Management (SCRNM)
the only feasible solution as benefit must exceed cost for further investment as shown in Figure
4. As point K yields higher value for 𝑅𝐶𝑀̅̅ ̅̅ ̅̅ relative to that of point E, point K is the optimal solution for budget greater than or equal to 90. Point O is not a feasible solution to be considered for optimality. A red coloured cross represents an optimal solution.
Figure 7: Risk network evaluation (point A)
Figure 8: Risk network evaluation (point E)
CONCLUSIONS A number of frameworks and modelling tools have been proposed in the literature on SCRM for identifying, assessing and mitigating risks. These studies have been periodically reviewed for directing future research. Focusing on the theme of risk management process/framework, we selected and critically reviewed quality articles. The hypothesis of our research question was validated that there is no single study focusing on the SCRM process within an integrated framework of interacting risks and the risk appetite of the decision maker. We also reviewed the
R1 R2
R3 R4
R5
0
100
200
300
400
500
0 0.2 0.4 0.6 0.8 1
RN
EL(X
|Ri=
Tru
e)
P(Ri=True)
R1
R2
R3
R4 R5
0
100
200
300
400
500
0 0.2 0.4 0.6 0.8 1
RN
EL(X
|Ri=
Tru
e)
P(Ri=True)

Qazi et al. Supply Chain Risk Network Management (SCRNM)
articles on literature reviews and it was revealed that even these articles have not realised and emphasised the need for conducting research in this direction. On the basis of our finding, we introduced a new risk management process namely SCRNM. We believe that there is a need for bringing paradigm shift in terms of modelling chains/network of interacting risks and risk sources. Instead of modelling and managing supply chain risks in silo, the researchers must embrace the notion of modelling and managing network of risks and develop effective and efficient tools for practitioners to adopt in real scenarios. There is also a need for exploring tools that integrate all stages of the risk management process instead of focusing on separate stages (Ho et al., 2015). We also introduced an important notion of following an iterative process rather than adopting the conventional unidirectional flow. There is a need for introducing risk measures that capture the network wide holistic impact of interacting risks. However, optimising the risk network against these measures alone might result in sub-optimal solutions as it is also important to consider the risk appetite of the decision maker. Although expected utility theory provides a standard procedure for decision making under uncertainty, it is not viable to even assess a simple risk network comprising limited number of risks and strategies. Therefore, we introduced the idea of adapting risk matrix for projecting the configuration of interdependent risks. Risk matrix has already been modified for mapping the risk appetite of the decision maker. However, the main limitation is its exclusive application to independent categories of risks. We proposed its adaptation to the context of interdependent risk network. In order to present a modelling framework for the proposed SCRNM process, we introduced a modelling approach grounded in the framework of BBNs. We made use of an existing risk measure namely 𝑅𝑁𝐸𝐿𝑃𝑀 and introduced a process for managing supply chain risk network with regard to risk-neutral and risk-seeking/risk-averse decision makers. We demonstrated the meaning of key concepts through an illustrative example. The proposed process can help researchers focus on a new stream of research and develop it further. In future, a tool integrating a number of techniques feasible for each stage of the process can be developed and tested in the industry and empirical studies may be conducted for gauging the feasibility of the proposed modelling framework and determining the associated challenges.
REFERENCES References available upon request.