Embed Size (px)
Citation preview

Office of Gas and Electricity Markets
Promoting choice and value for all gas and electricity customers
Document Type: Supplementary Annex (RIIO-T1 and GD1 Overview papers)
Decision on strategy for the next transmission and gas distribution price controls - RIIO-T1 and GD1 Financial issues
Overview:
RIIO-T1 and GD1 are the first transmission and gas distribution price controls to reflect
the new RIIO (Revenue = Incentives + Innovation + Outputs) model. RIIO is designed
to drive real benefits for consumers; providing network companies with strong incentives
to step up and meet the challenges of delivering a low carbon, sustainable energy sector
at a lower cost than would have been the case under our previous approach. RIIO puts
sustainability alongside consumers at the heart of what network companies do. It also
provides a transparent and predictable framework, with appropriate rewards to promote
timely investment in the networks.
Having consulted on our initial strategy for the next transmission and gas distribution
price controls, this supplementary annex to the main decision documents sets out our
decision on financial issues. This document is aimed at those seeking a detailed
understanding of our proposals. Stakeholders wanting a more accessible overview
should refer to the main decision documents.
Date of Publication: 31 March 2011
Target Audience: Consumers and their representatives, transmission companies,
distribution network companies, generators, offshore gas producers/importers,
suppliers, shippers, investors, environmental organisations, government policy
makers, and other interested parties.
Contact name and details: Peter Trafford, Head of Regulatory Finance
Tel: 020 7901 0510
Email: [email protected] or [email protected]
Team: Regulatory Finance, Smarter Grids and Governance

Office of Gas and Electricity Markets
Main decision papers
Decision on strategy for the next transmission price control - RIIO-T1
http://www.ofgem.gov.uk/Networks/Trans/PriceControls/RIIO-
T1/ConRes/Documents1/T1decision.pdf
Decision on strategy for the next gas distribution price control - RIIO-GD1
http://www.ofgem.gov.uk/Networks/GasDistr/RIIO-
GD1/ConRes/Documents1/GD1decision.pdf
Links to supplementary annexes
Decision on strategy for the next transmission price control - RIIO-T1 Outputs
and incentives
http://www.ofgem.gov.uk/Networks/Trans/PriceControls/RIIO-
T1/ConRes/Documents1/T1decisionoutput.pdf
Decision on strategy for the next transmission price control - RIIO-T1 Tools for
cost assessment
http://www.ofgem.gov.uk/Networks/Trans/PriceControls/RIIO-
T1/ConRes/Documents1/T1decisioncosts.pdf
Decision on strategy for the next gas distribution price control - RIIO-GD1
Outputs and incentives
http://www.ofgem.gov.uk/Networks/GasDistr/RIIO-
GD1/ConRes/Documents1/GD1decisionoutput.pdf
Decision on strategy for the next gas distribution price control - RIIO-GD1 Tools
for cost assessment
http://www.ofgem.gov.uk/Networks/GasDistr/RIIO-
GD1/ConRes/Documents1/GD1decisioncosts.pdf
Decision on strategy for the next transmission and gas distribution price controls
- RIIO-T1 and GD1 Business plans, innovation and efficiency incentives
http://www.ofgem.gov.uk/Networks/Trans/PriceControls/RIIO-
T1/ConRes/Documents1/T1decisionbusplan.pdf
Decision on strategy for the next transmission and gas distribution price controls
- RIIO-T1 and GD1 Uncertainty mechanisms
http://www.ofgem.gov.uk/Networks/Trans/PriceControls/RIIO-
T1/ConRes/Documents1/T1decisionuncert.pdf
Links to other associated documents
Providing a greater role for third parties in electricity transmission: Early thinking
and options
http://www.ofgem.gov.uk/Networks/Trans/PriceControls/RIIO-
T1/ConRes/Documents1/thirdpartyrole.pdf
The Weighted Average Cost of Capital for Ofgem‟s Future Price Control (March
2011 update) – Report by Europe Economics on behalf of Ofgem
http://www.ofgem.gov.uk/Networks/GasDistr/RIIO-
GD1/ConRes/Documents1/GD1WACC.pdf
Decision letter on the regulatory asset lives for electricity distribution assets
http://www.ofgem.gov.uk/Networks/Policy/Documents1/assetlivedecision.pdf
Associated Documents

Office of Gas and Electricity Markets
Consultation on strategy for the next transmission price control - RIIO-T1
Overview paper (159/10)
http://www.ofgem.gov.uk/Networks/Trans/PriceControls/RIIO-
T1/ConRes/Documents1/RIIOT1%20overview.pdf
Onshore transmission assets and risks associated with renewable projects with
potentially limited lives - Report by CEPA on behalf of Ofgem
http://www.ofgem.gov.uk/Networks/Trans/PriceControls/RIIO-
T1/ConRes/Documents1/ceparenewablelives.pdf
Consultation on strategy for the next gas distribution price control - RIIO-GD1
Overview paper (160/10)
http://www.ofgem.gov.uk/Networks/GasDistr/RIIO-
GD1/ConRes/Documents1/RIIOGD1%20overview.pdf
Handbook for implementing the RIIO model - Ofgem, October 2010
http://www.ofgem.gov.uk/Networks/rpix20/ConsultDocs/Documents1/RIIO%20h
andbook.pdf
Cost of debt index model for RIIO-T1 and GD1
http://www.ofgem.gov.uk/Networks/Trans/PriceControls/RIIO-
T1/ConRes/Documents1/costofdebtT.xls
Illustrative pension deficit funding model for RIIO-T1 and GD1
http://www.ofgem.gov.uk/Networks/Trans/PriceControls/RIIO-
T1/ConRes/Documents1/Pension%20scenarios%20for%20RIIO%20paper.xls
A glossary of terms for all the RIIO-T1 and GD1 documents is on our website:
http://www.ofgem.gov.uk/Networks/Trans/PriceControls/RIIO-
T1/ConRes/Documents1/T1decisiongloss.pdf

Office of Gas and Electricity Markets
Table of Contents
1. Introduction .................................................................................. 1 2. Asset lives, depreciation and capitalisation ................................... 3
Overview of decisions .................................................................................... 3 Summary of consultation proposals ................................................................. 4 Summary of responses .................................................................................. 5 Our decision ................................................................................................. 6
3. Allowed return ............................................................................. 15 Summary of decisions ................................................................................. 15 Context ..................................................................................................... 15 Gearing ..................................................................................................... 16 Cost of debt ............................................................................................... 18 Cost of equity ............................................................................................. 31
4. Assessing financeability .............................................................. 38 Approach to assessing financeability .............................................................. 38 Return on Regulatory Equity (RoRE) analysis .................................................. 40
5. Taxation ...................................................................................... 44 Summary of decisions ................................................................................. 44 Summary of responses ................................................................................ 45 Our decisions ............................................................................................. 46 Business Rates ........................................................................................... 47
6. Pensions ...................................................................................... 48 Summary of decisions ................................................................................. 48 Summary of responses ................................................................................ 48 Our decisions ............................................................................................. 51 Deficit allocation methodology ...................................................................... 53 Rate of return ............................................................................................. 53 Efficiency review ......................................................................................... 53
7. Regulatory asset value ................................................................ 56 Overview of decision ................................................................................... 56 Summary of consultation proposals ............................................................... 56 Summary of responses ................................................................................ 56 Our decision ............................................................................................... 57
8. Historical return on regulatory equity (RoRE) ............................. 62 Appendices ...................................................................................... 64 Appendix 1 - Financial issues summary of responses ...................... 65 Appendix 2 - Asset lives and depreciation ....................................... 78 Appendix 3 - Mechanism for equity issuance costs allowance ......... 83 Appendix 4 - Tax methodology ........................................................ 85 Appendix 5 - Tax trigger .................................................................. 91 Appendix 6 - Pension methodology ................................................. 96 Appendix 7 - Price control pension principles under RIIO ............. 109 Appendix 8 - Regulatory asset value (RAV) methodology .............. 118
Office of Gas and Electricity Markets 1
RIIO-T1 and GD1 Financial Issues March 2011
1. Introduction
1.1. The next transmission and gas distribution price controls, RIIO-T1 and GD1, will
be the first to reflect the new RIIO model. In December 2010, we consulted on our
initial strategy for the two price control reviews. The overview documents of our
initial strategy for RIIO-T1 and GD11 included a supplementary annex which set out
our proposed approach to financial issues.
1.2. Following consideration of responses received to the initial strategy consultation,
this document sets out our decision on financial issues. This document is aimed at
those seeking a detailed understanding of our decision. Stakeholders wanting a more
accessible overview should refer to the RIIO-T1 and GD1 overview papers2. The price
controls will be set for an eight-year period from 1 April 2013 to 31 March 2021.
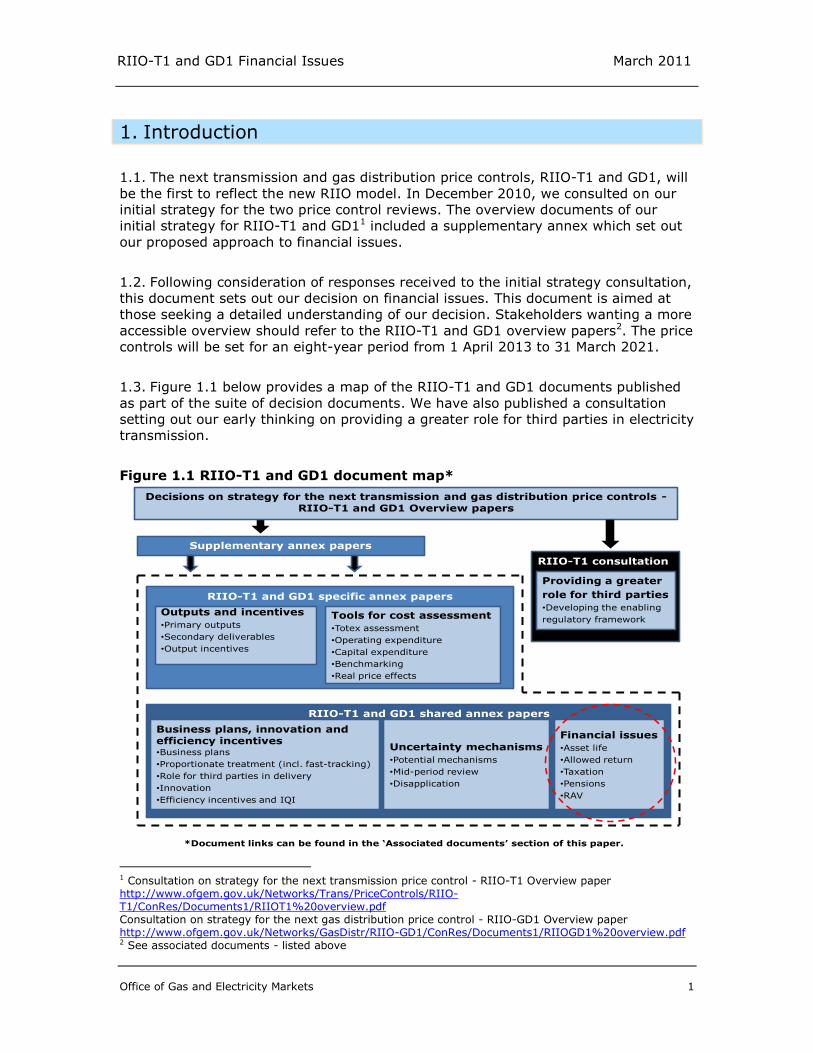
1.3. Figure 1.1 below provides a map of the RIIO-T1 and GD1 documents published
as part of the suite of decision documents. We have also published a consultation
setting out our early thinking on providing a greater role for third parties in electricity
transmission.
Figure 1.1 RIIO-T1 and GD1 document map*
1 Consultation on strategy for the next transmission price control - RIIO-T1 Overview paper http://www.ofgem.gov.uk/Networks/Trans/PriceControls/RIIO-T1/ConRes/Documents1/RIIOT1%20overview.pdf Consultation on strategy for the next gas distribution price control - RIIO-GD1 Overview paper http://www.ofgem.gov.uk/Networks/GasDistr/RIIO-GD1/ConRes/Documents1/RIIOGD1%20overview.pdf 2 See associated documents - listed above
*Document links can be found in the ‘Associated documents’ section of this paper.
RIIO-T1 and GD1 specific annex papers
Outputs and incentives
•Primary outputs
•Secondary deliverables
•Output incentives
Tools for cost assessment
•Totex assessment
•Operating expenditure
•Capital expenditure
•Benchmarking
•Real price effects
RIIO-T1 and GD1 shared annex papers
Business plans, innovation and efficiency incentives•Business plans
•Proportionate treatment (incl. fast-tracking)
•Role for third parties in delivery
•Innovation
•Efficiency incentives and IQI
Uncertainty mechanisms
•Potential mechanisms
•Mid-period review
•Disapplication
Financial issues
•Asset life
•Allowed return
•Taxation
•Pensions
•RAV
Decisions on strategy for the next transmission and gas distribution price controls -RIIO-T1 and GD1 Overview papers
Supplementary annex papers
RIIO-T1 consultation
Providing a greater
role for third parties
•Developing the enabling
regulatory framework
Office of Gas and Electricity Markets 2
RIIO-T1 and GD1 Financial Issues March 2011
1.4. This document sets out the decisions that we have made in respect of financial
issues and in particular our approach to financeability. We remain committed to
ensuring efficient companies are able to finance their businesses. We have listened
to the views expressed by the companies and their investors in response to our
December document. We are establishing a strong financial package which will allow
efficient companies to finance their activities using equity and debt. It will also
ensure the costs of investment are spread appropriately across existing and future
consumers. Specifically:
Asset lives – New electricity assets will be depreciated over 45 years. Existing
electricity assets will continue to be depreciated over current lives. This policy will
also apply to electricity distribution from 2015, the beginning of the next
distribution price control period.
Capitalisation & depreciation – We will add 100 per cent of replacement
expenditure to the regulatory asset value (RAV) and apply front-end loaded
depreciation to post 2002 gas distribution assets. This will mean that all gas
distribution assets will be subject to front-end loaded depreciation.
Cost of equity – We are setting an indicative range of 6.0–7.2 per cent which we
expect to inform the companies‟ business plans.
Cost of debt – We are providing greater certainty by using an index for
determining the allowed cost of debt. We are proposing to use the iBoxx non
financials 10+ maturity index with credit ratings of broad A and broad BBB, which
is more representative of the companies‟ debt costs than our previous proposal.
Transitional arrangements – Any company that considers transitional
arrangements are appropriate will have the opportunity to present its arguments
and propose suitable arrangements in its well-justified business plan.
1.5. We also provide our decisions on issues relating to tax, pensions and RAV. The
major change in our stance from the strategy consultation document concerns the
use of EU-IFRS to model operator's financial positions from 1 April 2014.
1.6. Additional and more detailed material is provided in the appendices to this
document:
Appendix 1 provides more detail on responses received to the questions we
consulted upon in December 2010.
Appendices 2-8 provide more detailed explanation of the methodologies we will
be using.
Office of Gas and Electricity Markets 3
RIIO-T1 and GD1 Financial Issues March 2011
2. Asset lives, depreciation and capitalisation
Chapter Summary
In our RIIO strategy consultation document, we set out proposals for asset lives and
depreciation profiles to be applied in RIIO-T1, GD1 and ED1. In this chapter we
summarise the main points from the December document and our consultants
report, the responses to our consultation and the basis of our decisions.
Overview of decisions
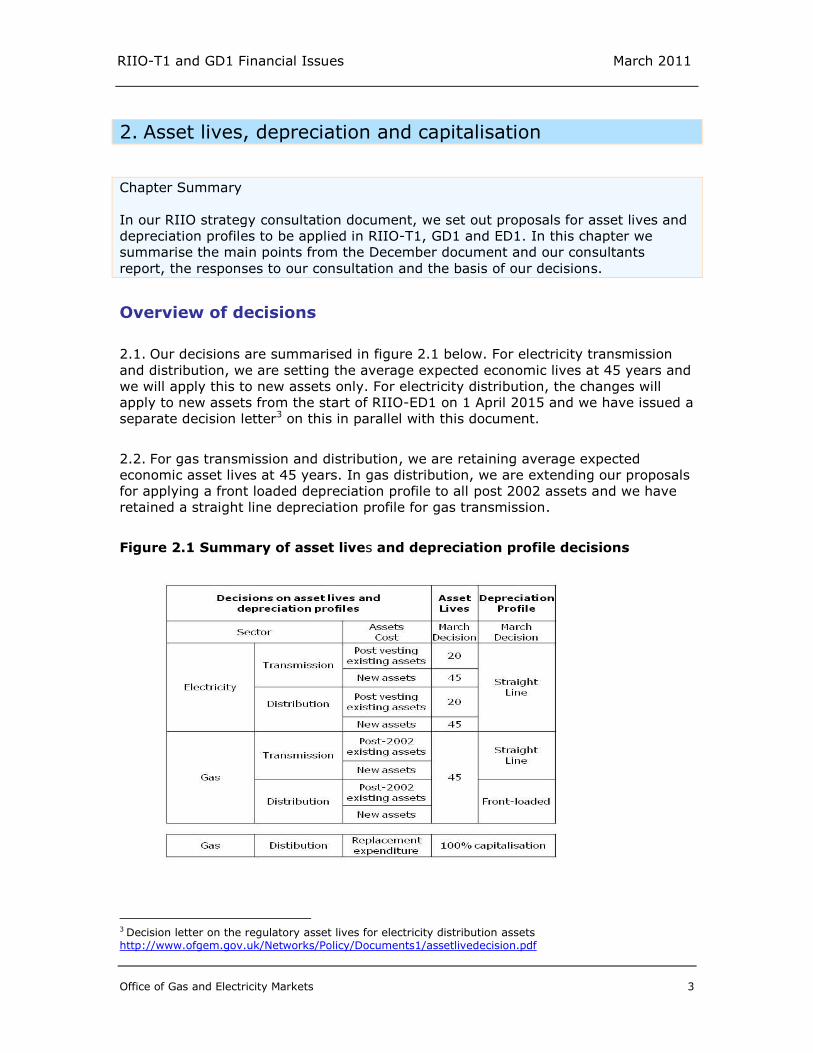
2.1. Our decisions are summarised in figure 2.1 below. For electricity transmission
and distribution, we are setting the average expected economic lives at 45 years and
we will apply this to new assets only. For electricity distribution, the changes will
apply to new assets from the start of RIIO-ED1 on 1 April 2015 and we have issued a
separate decision letter3 on this in parallel with this document.
2.2. For gas transmission and distribution, we are retaining average expected
economic asset lives at 45 years. In gas distribution, we are extending our proposals
for applying a front loaded depreciation profile to all post 2002 assets and we have
retained a straight line depreciation profile for gas transmission.
Figure 2.1 Summary of asset lives and depreciation profile decisions
3 Decision letter on the regulatory asset lives for electricity distribution assets http://www.ofgem.gov.uk/Networks/Policy/Documents1/assetlivedecision.pdf

Office of Gas and Electricity Markets 4
RIIO-T1 and GD1 Financial Issues March 2011
2.3. We are committed to ensuring that efficient network companies are able to raise
the finance they require, both equity and debt, in a timely manner. Network
companies will have the opportunity to demonstrate in their well justified business
plans the arrangements that are necessary to ensure financeability. We will consider
a transition period longer than one price control period, if justified. We recognise that
longer transition may be required by network companies to maintain their
financeability especially where there is rapid growth compared to the existing RAV.
Summary of consultation proposals
RIIO principles
2.4. In December, we consulted on the economic asset lives for the electricity and
gas networks, together with the most appropriate depreciation profiles to use. We
also consulted on our proposed transition approach to the new arrangements.
2.5. Alongside that consultation, we published a report from a consortium led by
CEPA4 whom we had contracted to assess the technical and economic lives of the
energy networks and also to identify the most appropriate depreciation profiles.
2.6. A summary of our December proposals and current regulatory asset lives and
depreciation profiles is set out in figure 2.2 below.
Figure 2.2 Summary of our December consultation on asset lives and
depreciation profile
4 The Economic Lives of the Energy Network Assets – A Report for Ofgem. Cambridge Economic Policy Associates (CEPA), Sinclair Knights Merz (SKM) and GL Noble Denton. December 2010 http://www.ofgem.gov.uk/Networks/Trans/PriceControls/RIIO-T1/ConRes/Documents1/CEPA%20Econ%20Lives.pdf
Office of Gas and Electricity Markets 5
RIIO-T1 and GD1 Financial Issues March 2011
Summary of responses
Gas and electricity transmission
2.7. We received a good response to our consultation from a wide range of
stakeholders. In general, responses on transmission were focussed on electricity
rather than on gas.
2.8. Consumer groups and suppliers were supportive of our proposed approach,
whilst network companies and investors were concerned about the potential impact
on cash flows, particularly if our proposal were to be applied in a single step.
2.9. In general, network companies agreed that actual asset lives are longer than 20
years. Although some commented that we had not taken sufficiently into account
either:
the potential increase in the proportion of shorter life assets as networks become
smarter;
or the impact of the growth in offshore wind generation connected to the system
(which generally has a shorter life than the network).
2.10. Two networks provided information that suggested economic asset lives, which
they caveated had been looked at in isolation of the rest of the price control package,
should be 30 years in one case and 35-40 years in the other.
2.11. Other arguments included that we had failed to demonstrate sufficiently why
existing regulatory asset lives needed to change or, why economic asset lives should
be used. Some also questioned the merit of removing costs from the current
generation of consumers, who had already benefited from discounts on pre-vesting
assets5, and increasing costs for future generations.
2.12. Most of the networks companies suggested our proposals should not be applied
to existing assets, as a transitional arrangement, so as not to affect the legitimate
expectations of investors and to comply with principles of regulatory consistency. A
number quoted from The Department for Business and Skills (BIS) on the 'Principles
for Economic Regulation' and in particular that "the framework of economic
regulation should not unreasonably unravel past decisions....".
2.13. Networks companies also requested flexibility to propose transitional
arrangements including the number of control periods over which they would need to
be applied.
5 At the time of privatisation, electricity assets were sold at a discount to their net modern equivalent asset value.

Office of Gas and Electricity Markets 6
RIIO-T1 and GD1 Financial Issues March 2011
2.14. In respect of gas transmission there was limited comment on the proposals,
other than from National Grid. They suggested that the front-end loading of
depreciation that was proposed for gas distribution should also apply to gas
transmission.
Gas distribution
2.15. We received a good response to our consultation from a wide range of
stakeholders. Consumer groups and suppliers were supportive of our approach.
2.16. Network companies and investors tended to focus on the cash flow implications
of the change in replacement expenditure (repex) treatment. Their focus was on
restoring their cash position through a combination of reducing asset life and/or
extending the use of a front-end loaded depreciation profile. Those who argued for
reduced asset life suggested 20 years, 30 years and 40 years as potential asset lives.
Some also highlighted the uncertainty over the long-term future of gas within the
energy mix as an additional reason for reducing asset lives. However, one network
operator took the opposite view and suggested that it was premature to justify
accelerated depreciation given the scenarios for the gas network.
2.17. There were some comments that changing the treatment of repex would run
counter to investors' legitimate expectations.
Our decision
Rationale for the use of economic asset lives
2.18. We take our financing duty seriously. Our commitment to ensuring that
efficient companies are able to finance their businesses has not changed as a result
of RIIO. It is apparent to us that the current approach to asset lives in electricity (20
years for regulatory depreciation) is not sustainable and will at some point become a
financeability issue in itself.
2.19. A key element of the RIIO principles is the use of economic asset lives as the
basis of the regulatory depreciation period. This places financeability on a long-term
sustainable footing and establishes a policy which investors can rely on and which
provides the basis for appropriate inter-generational equity. However, some network
companies have raised a number of concerns concerning the appropriateness of the
use of economic asset lives.
2.20. We have had extended discussions with stakeholders over the move to using
economic asset lives during RPI-X@20 and the RIIO-T1 and GD1 processes.
2.21. The existing regulatory asset lives in electricity were introduced to address a
specific issue and were not representative of economic asset lives. As long ago as

Office of Gas and Electricity Markets 7
RIIO-T1 and GD1 Financial Issues March 2011
November 2004 in the DPCR4 final proposals6 we stated that in the longer term asset
lives should more closely reflect the useful or economic asset life.
2.22. In summary, we have listened carefully to the issues raised. We remain of the
view that the longer-term benefits are considerable. These include that financeability
will be more assured and sustainable in the longer term as the Regulatory Asset
Value (RAV) trend towards the net modern equivalent asset value (MEAV). This will
also result in improved and sustainable long-term inter-generational equity and more
effective price signals both to network companies and consumers. We have set out
our views more fully in appendix 2.
Electricity transmission
Asset life
2.23. We will use an average expected economic asset life of 45 years for electricity
transmission assets. We considered a number of factors in arriving at our decision to
move away from the current 20 year asset lives and they are set out below.
CEPA's report issued with our December consultation assessed detailed technical
lives for the components of the existing networks. This gave a weighted average
technical asset life of 54-60 years. The technical lives used for existing assets
have not been queried by network operators.
CEPA analysed the average existing age of the network (see appendix 2). This
shows that the current weighted age of the network is already 33 years.
The network operators statutory/regulatory accounts (see appendix 2) use an
assessment of useful economic asset lives of between 10 to 80 years with the
bulk between 30 to 60 years.
CEPA also examined numerous scenarios for the future use of the transmission
network. They concluded that the future use of the electricity network was
increasing under all scenarios based on the UK's future renewables and carbon
emission targets. There was no significant disagreement with this analysis.
Our proposals were supported by consumer representatives.
Although the transmission operators suggested figures of 30, 35-40 and not more
than 40 years, we do not agree with some of the assumptions that reduce the
estimate of average economic life as we discuss later.
Arguments for shorter economic life assets
2.24. A number of network operators argued that CEPA had not taken sufficient
account of the potential increase in the proportion of shorter life assets that will be
deployed in the future as networks become smarter. However, CEPA did make an
allowance for this and other uncertainties in proposing their range for economic asset
lives of 45-55 years. By using an economic life of 45 years at the bottom end of our
proposed range we believe we have created an allowance for and buffer against
future net reductions in economic life.
6 Electricity Distribution Price Control Review: Final Proposals, November 2004 Ofgem. Paragraph 8.13

Office of Gas and Electricity Markets 8
RIIO-T1 and GD1 Financial Issues March 2011
2.25. A number of operators also suggested that lower economic lives should apply
to those assets potentially connecting to shorter-life generation assets (eg wind
farms). They further argued that the relative size of future investments compared to
the existing assets would then produce a lower average economic asset life for their
network. This would primarily affect the Scottish networks.
2.26. We asked CEPA to examine this issue and we have published their further
report alongside this document7. They identified three general types of investment;
sole-use connections to a single source of generation, multi-use connections and
more general North/South power capacity connections.
2.27. They conclude that in general, with the need for renewable energy into the
foreseeable future and the geographical location of the generation sources likely to
remain largely unchanged, most renewable projects can be expected to be re-
powered and redeveloped after the initial 20/25 year period. They also highlight that
developers are granted a 50 year licence for the use of each site.
2.28. However, they also accept that there could be a small number of projects with
dedicated (sole-use) connections assets that might cease to be required before they
have been fully depreciated. If this were to happen, these assets would remain in the
RAV and the network operator would fully recover the cost associated with this asset
(albeit over the remaining period of the 45 years average asset life). CEPA in their
report have modelled the impact on the weighted average economic asset lives of
different proportions of new investment falling into disuse after the initial 20/25 year
period. They have suggested that there would have to be a significant percentage of
new assets falling into disuse (around 70%) to reduce the weighted average asset
life of the network to below 45 years. Therefore they do not recommend a reduction
in the overall economic life of these networks from 45 years. We agree with their
recommendation.
2.29. National Grid suggested that if we were to apply the new asset lives to new
assets then we should only look at the technical lives associated with the new
investment in deriving a network's average economic life. They have submitted
some further analysis which quotes a technical life of 42.8 years for the replacement
expenditure during RIIO-T1. This is close to our proposed economic asset life of 45
years. However, we are not convinced that the expenditure over the next eight years
is fully representative of the whole network as it does not include expenditure of all
of the asset types which comprise the network, for instance it does not include spend
on replacing the longer life assets such as towers and foundations as this was not in
their planned spend over this period.
2.30. We believe that using an economic life of 45 years, which is at the bottom of
the range we consulted on, makes sufficient allowance for the potential future
increase in the mix of shorter life economic assets (either those with inherently
7 Onshore transmission assets and risks associated with renewable projects with potentially limited lives - Report by CEPA on behalf of Ofgem http://www.ofgem.gov.uk/Networks/Trans/PriceControls/RIIO-T1/ConRes/Documents1/ceparenewablelives.pdf

Office of Gas and Electricity Markets 9
RIIO-T1 and GD1 Financial Issues March 2011
shorter economic lives or those who would have their economic lives curtailed for
other reasons).
Applying the new asset life
2.31. We have decided to apply the new asset lives only to new investment from the
start of RIIO-T1. Existing assets, including new expenditure on projects already
started under the transmission investment for renewable generation (TIRG) will
continue to use the existing 20 year asset life.
2.32. In arriving at this decision, we have been mindful of our financing duty and the
RIIO approach of avoiding sudden changes that could create instability. We stated in
our December documents that applying our proposals to new assets only was one of
the transition options available to network operators, if required for financeability
reasons. We noted CEPA's high level analysis for Centrica which suggested that
transition may not be necessary8.
2.33. We have also taken note of respondent's views on regulatory consistency and
acknowledge the inter-generational arguments put forward by the network operators
which we discuss in the section below. While we think there are reasonable grounds
for applying the change in asset life to existing assets, on balance the need to meet
our financing duty and to avoid sudden changes in cash flow persuade us that in this
case we should not apply the new asset lives to existing assets.
Inter-generational equity
2.34. Network operators also suggested that inter-generational equity was not
served by extending asset lives, as current consumers were benefiting from asset
discounts at privatisation.
2.35. We do not believe that it is appropriate or sustainable to balance an "under-
charge" for pre-privatisation assets with an over-charge for recent investment. It is
our intention to shift the sectors onto a long-term sustainable path of inter-
generational equity and fairness.
2.36. We acknowledge that to switch to economic lives on existing assets will
potentially cause a greater short-term inter-generational imbalance. However,
applying this change to new assets only together with any transitional period agreed
with network operators will minimise any short-term impact to deliver the goal of
sustainable long term financeability and inter-generational equity.
8 RIIO-T1 and RIIO-GD1: Financial Issues A report for Centrica, CEPA LLP February 2011. Para 5.8 http://www.ofgem.gov.uk/Networks/Trans/PriceControls/RIIO-T1/ConRes/Documents1/Centrica_Annex_1.pdf

Office of Gas and Electricity Markets 10
RIIO-T1 and GD1 Financial Issues March 2011
Predictable, consistent and transparent decisions
2.37. A key concern for all stakeholders is that predictable, consistent and
transparent decisions are taken. Some respondents have raised concerns that our
proposed change in asset lives fails to meet these requirements.
2.38. We are fully committed to meeting regulatory best practice. We believe we
have shown our commitment to this through the way in which consultation is at the
heart of the regulatory process. Good regulatory practice is not about making
decisions inviolate but rather about ensuring a robust process by which a decision
can be changed if it is appropriate for a change to occur. The RIIO model was
established through such a process - it is underpinned by very extensive consultation
and stakeholder engagement.
Electricity distribution
2.39. On 14th January 2011, we issued a separate open letter consultation on the
regulatory asset life for electricity distribution assets9. In that letter we said that the
Authority may decide to take a decision on this issue along with its decision on
electricity transmission and gas distribution.
2.40. Alongside this document we have published an open letter detailing the
decisions the Authority has made with respect to electricity distribution assets lives.
In summary, the Authority has decided to apply the same approach to asset lives as
for electricity transmission and to use the new economic asset lives for new assets
only.
Gas transmission
Asset life
2.41. We have decided to leave the current asset lives and depreciation profile for
gas transmission unchanged. We considered a number of factors, including the
responses to consultation, in arriving at this decision. These considerations are set
out below.
CEPA's report issued with our December consultation assessed detailed technical
lives for the components of the existing networks. This gave a weighted average
technical asset life of 60 years.
CEPA analysed the existing average age of the network (see appendix 2). This
shows that the current weighted age of the network is already 27 years.
NGG's statutory/regulatory accounts (see appendix 2) use 30 to 100 years for
useful economic asset lives.
9 Open letter consultation on the regulatory asset lives for electricity distribution assets http://www.ofgem.gov.uk/Networks/Policy/Documents1/ED%20asset%20lives%20consultation%2021000114.pdf

Office of Gas and Electricity Markets 11
RIIO-T1 and GD1 Financial Issues March 2011
CEPA also examined numerous scenarios for the future use of the gas network.
Whilst they conclude that there is significant uncertainty over the future of the
gas network they suggest making a change to asset lives at this moment is not
justifiable. There should be more clarity over the future use of gas in the overall
energy mix by the time of RIIO-T2 and we will continue to keep this under
review.
2.42. Respondents to our consultation did not express significant disagreement with
our proposed approach.
Depreciation profile
2.43. As mentioned above, NGG suggested that it may be more appropriate to adopt
a front loaded profile in transmission. However, we have decided to leave the
depreciation profile unchanged for gas transmission.
2.44. We believe there is less risk of lower future utilisation of the gas transmission
network than there is for distribution. This is because it is expected that gas fired
generation with carbon capture and storage is likely to be a significant part of our
energy mix into the future. It is also expected that the UK network will be used to
transport gas into Europe. Therefore the gas transmission network is less exposed to
a potential reduction in the domestic demand arising from low carbon future
scenarios. However, there is still uncertainty over the future utilisation of the gas
transmission network and we will continue to review whether a straight line
depreciation profile is appropriate in future price controls.
Figure 2.3 Illustration of potential per unit charges for the gas transmission
network

Office of Gas and Electricity Markets 12
RIIO-T1 and GD1 Financial Issues March 2011
Gas distribution
Asset life
2.45. We have decided to leave the current asset lives for gas distribution
unchanged. We considered a number of factors in arriving at this decision and they
are set out below.
CEPA's report issued with our December consultation assessed detailed technical
lives for the components of the existing networks. This gave a weighted average
technical asset life of 45 years. However, they stated that this was arrived at
after using conservative assumptions for the technical life of polyethylene (PE)
pipes used in the replacement programme. Their expectation is that this could
rise to 60 or 70 years (or even longer) as the technical ages of these pipes is
shown to be longer.
CEPA also examined numerous scenarios for the future use of the gas network.
Whilst they conclude that there is significant uncertainty over the future of the
network they suggest making a change to asset lives at this moment is not
justifiable. We will continue to keep this under review for subsequent price
control periods.
CEPA analysed the existing age of the network (see appendix 2). This shows that
the current weighted age of the network is already 33 years.
The network operators' statutory/regulatory accounts (see appendix 2) use 30 to
100 years with a core age of around 55 to 65 years.
Depreciation profile
2.46. We proposed using a front loaded depreciation profile for new assets in our
December documents. This was to reflect the lower utilisation of the network that
was likely to occur under the various scenarios for the future of the energy networks.
2.47. The vast majority of network operators accepted this proposal as a good way of
reducing the risk of lower utilisation in the future driving up the unit cost to those
still using the network. Indeed, most suggested that we should extend the front-
loaded profile to all of the RAV so as to help address the potential risk of recovery of
the outstanding RAV on stranded assets should that situation arise.
2.48. We currently use a front loaded profile for pre-2002 assets based on a 56 year
asset life and are not proposing to change this. These assets will have already been
depreciated to around 65% of their cost by the start of RIIO-GD1.
2.49. We have examined the potential scenarios of reducing utilisation in the future
and looked at how the depreciation per unit cost may vary during this period.
Extending the front-loading profile to all of the RAV does help to reduce the risk of
spiralling unit costs as the utilisation of the network falls away as illustrated in the
graph below.

Office of Gas and Electricity Markets 13
RIIO-T1 and GD1 Financial Issues March 2011
Figure 2.4 Illustration of potential per unit charges for the gas distribution
network
2.50. One of the network companies argued that we should reduce the life of the gas
distribution assets to 30 years. As mentioned above, we do not believe that there is
sufficient clarity over the uncertainty of the gas network to propose a lower economic
asset life at this stage. However, we compared the effect of front loaded depreciation
and a reduced asset life. The figure below compares the cumulative depreciation
profile for a single investment at a point in time. It shows that the front loaded
profile based on a 45 year asset life is broadly similar to that of a straight line profile
for a 30 year asset life. Indeed, for the first 22 years of the profile it has a slightly
higher depreciation level.
Figure 2.5 Illustration of different cumulative depreciation profiles on a
single point investment
Office of Gas and Electricity Markets 14
RIIO-T1 and GD1 Financial Issues March 2011
Transition arrangements
2.51. Since we have extended the front loaded depreciation profile to existing post
2002 assets there will be, at the start of RIIO-GD1, an element of catch up
depreciation. Our expectation is that network operators will propose in their well
justified business plan whether they would intend to release this additional amount
or retain it in the RAV.
Capitalisation of replacement expenditure
2.52. We have decided to go ahead with our proposal to capitalise fully (add to RAV)
replacement expenditure from the start of RIIO-GD1. This will apply to new
expenditure only at the start of RIIO-GD1.
2.53. Concerns had been raised that this change would impact investor‟s legitimate
expectations. However, the new rate will apply only to new investment and it is clear
that the rate of capitalisation has been reviewed in each recent price control and that
there has been no commitment from us that the treatment would not be reviewed.
For example, in the 2007 Initial Proposals document we stated that “we intend to
review the 50/50 treatment of repex in light of its increasing contribution to GDN
spending since the current treatment was introduced in 2002.”
2.54. For the reasons set out in the RIIO decisions, we believe that this more
properly reflects the nature of the assets being deployed and removes the regulatory
‟fudge‟ which was included to address financeability issues at the time of GDPCR1.
Including this expenditure in the RAV also removes the uncertainty associated with
the capitalisation percentage currently being open to review at each price control.
Transition
2.55. We have assessed the impact of introducing this proposal across the sector. A
move to capitalising 100 per cent of repex in one step would reduce cash flow over
the price control by about £2.6bn (around 10 per cent of the total revenues) at
current rates of expenditure. This would be offset by approximately £2.1bn from the
front loading of depreciation profile leaving a net impact on cash flow of £0.5bn
before any transition proposals.
2.56. For gas distribution network operators we would expect their transition
proposals to be confined to one control period but companies may in their business
plans justify a longer period if required.

Office of Gas and Electricity Markets 15
RIIO-T1 and GD1 Financial Issues March 2011
3. Allowed return
Chapter Summary
This chapter describes our decisions on cost of debt indexation, presents a narrower
cost of equity range, and provides further detail on our proposals for setting the
notional gearing level. We also address the cost of issuing debt and equity.
Summary of decisions
3.1. Our decision is as follows:
to set notional gearing based on the information in the companies' business
plans. We expect this level of gearing to be consistent with the cash flow risk
each company assesses to be inherent in the package
to estimate the cost of debt based on a 10-year simple trailing average index
(with provision for companies to justify alternative weighting to the trailing
average in exceptional circumstances). To update this allowance annually during
the price control. To use an average of the iBoxx GBP Non-Financials indices of
10+ years maturity with credit ratings of broad A and broad BBB
to deflate the indices by 10-year breakeven inflation data published by the Bank
of England
to make no adjustments in the index for debt issuance fees, liquidity
management fees, new issue premium or the inflation risk premium
to set an indicative range for the cost of equity of 6.0-7.2 per cent (post-tax real)
to set an ex ante allowance for the cost of issuing equity, with an annual ex post
true-up.
3.2. The remainder of this chapter sets out the rationale for our above decisions.
Context
3.3. Regulators have typically made an allowance for the efficient financing of the
companies they regulate. It is set by calculating a return on the value of the capital
employed in the business (the regulatory asset value or RAV) that is at least equal to
the notional company‟s estimated cost of capital.10 As part of the RIIO-T1 and GD1
price controls we will consider the main factors affecting the cost of capital and the
issues surrounding the required calculations.
3.4. We are committed to ensuring that efficient companies are able to finance
themselves through both debt and equity. Consistent with this, the RIIO proposals
outlined four key principles regarding our approach for setting the cost of capital
allowance as part of future price controls:
10 We set the allowed return such that a notional efficient company is able to raise the necessary level of capital to finance its investment programme and, therefore, deliver its required regulatory outputs.

Office of Gas and Electricity Markets 16
RIIO-T1 and GD1 Financial Issues March 2011
we will continue to take a real weighted average cost of capital (WACC) based
approach to setting the allowed return
the cost of debt component of the WACC will be based on a long-term trailing
average and updated mechanistically each year
the cost of equity component of the WACC will continue to be set by reference to
the capital asset pricing model (CAPM), sense-checked by other approaches and
evidence
we will take a principles-based approach to the calculation of notional gearing,
with the level of notional equity reflecting the company's risk exposure and
potentially varying within and between sectors.
We set out below our decisions with regard to the allowed return for RIIO-T1 and
GD1. The decisions are intended to provide clarity for the network companies as they
prepare their well-justified business plans. It will be for the network companies to
assess the overall risk of their business plans in the first instance and to make
realistic bids for the cost of equity and notional gearing if they wish to be fast-
tracked.
Gearing
Summary of consultation proposals
3.5. In the strategy consultation document we reiterated that we will adopt a
principles-based and iterative approach to notional gearing, and that different
gearing levels may be set between sectors and even within sectors if there are
significant differences in cash flow risk.
Summary of responses
3.6. Network companies generally argued that the gearing methodology was not
sufficiently developed in the strategy consultation document. There was a general
agreement that an iterative approach would be appropriate, although the companies
also argued for stress-testing of the gearing value against credible scenarios.
3.7. One supplier expressed opposition to setting different gearing levels for
companies in the same sector, noting that it would have only a modest impact on the
vanilla WACC. In contrast, one investor response argued that sector-wide notional
gearing has had a detrimental impact on company behaviour over the last 10 years
by pushing management towards short-term decisions and taking on additional risk,
at the expense of consumers.
3.8. Network companies were strongly against our suggestion that equity injections
may be needed to address short-term failures to meet key credit metrics. One
network company argued that it would not be appropriate to place the onus on the
companies to resolve such short-term shortfalls. Investors were also largely against
the idea of equity injections, although a few recognised that equity injections would

Office of Gas and Electricity Markets 17
RIIO-T1 and GD1 Financial Issues March 2011
be appropriate given the rapid growth in RAV that some companies are expected to
face during RIIO-T1 and GD1.
Our decision
3.9. We reiterate our view that it is too early to set out a detailed methodology for
setting notional gearing, as we have yet to receive the companies' business plans.
Figure 3.1 sets out the issues that are at play when setting notional gearing - namely
cash flow volatility (as affected by capex spend, incentives and uncertainty
mechanisms), the companies' business plans (including proposed transitional
arrangements and notional equity injections), and the cost of equity.
Figure 3.1: Methodology for setting notional gearing
3.10. We consider that network companies now have the necessary information on
the incentives and uncertainty mechanisms that will apply for RIIO-T1 and GD1 to
assess the above three parameters of the price control. It is now up to the network
companies to assess the overall risk of their business plans and to make realistic bids
for notional gearing if they wish to be fast-tracked.
3.11. Ultimately, the decision on notional gearing will be taken following financial
modelling of expected cash flows (tested under a range of reasonable scenarios) with
reference to what we consider an appropriate notional gearing range for regulated
Equity injectionTransition Arrangements
Cost of equity
Cash flow volatility
Notional gearing
Uncertainty mechanisms

Office of Gas and Electricity Markets 18
RIIO-T1 and GD1 Financial Issues March 2011
network companies given the cash flow risk they face.11 This will include Return on
Regulatory Equity (RoRE) analysis, as described in Chapter 4.
Cost of debt
Summary of consultation proposals
3.12. Under the RIIO proposals, we will index the cost of debt assumption embedded
in the price control to a market measure of the cost of debt for network companies.
In the strategy consultation document we proposed an indexation mechanism, based
on a 10-year trailing average of the yield on Bloomberg's indices for sterling (GBP)
corporates with an A credit rating12 and GBP corporates with a broad BBB credit
rating.13
3.13. We considered a range of other options and noted that:
a weighted average would be difficult to compute and may expose the index to
the network companies' influence
while network utilities typically own debt of longer than 10-years maturity, the
impact of using an index of 10-year maturity is negligible and 10-year bonds
correspond to the standard regulatory precedent
an alternative basis for the allowance could be the pound sterling Non-Financials
A and BBB 10+ year's indices published by iBoxx.
3.14. Over the past 15 years, UK utilities have been able to issue debt consistently
below the proposed Bloomberg index. We deemed the difference between the cost of
issued debt and the index, which in the strategy consultation paper was noted as
30bps, to be sufficient to cover the costs of issuing debt. We, therefore, proposed
that the index provides an implicit allowance for the cost of issuing debt.
Summary of responses
3.15. In general, network companies and investors are against the idea of indexation
and argue that it would make it considerably more difficult to outperform the cost of
debt allowance. While some network companies and investors acknowledge the need
for an uncertainty mechanism on the allowed return given the move to eight-year
price controls, the majority prefer a fixed allowance.
3.16. The main argument against indexation is that no hedging mechanisms exist to
protect the companies against movements in the index, which could push the
companies to "track" the index by issuing 10-year bonds on an annual basis.
11 A range of 50-70 per cent has typically been quoted in regulatory determinations. In RIIO-T1, however, it may be appropriate to set a lower gearing level for one or both of the Scottish TOs. 12 In the strategy consultation paper we erroneously identified this as covering bonds with A-, A and A+ ratings. However, further discussions with Bloomberg have clarified that only bonds with an A rating are included and that separate indices exist for A- and A+ rated bonds. 13 By 'broad BBB' we mean BBB-, BBB and BBB+.

Office of Gas and Electricity Markets 19
RIIO-T1 and GD1 Financial Issues March 2011
Additionally, the companies have voiced a concern about the market cost of debt
rising above the index, although it is not clear to us how this risk would be better
addressed with a fixed allowance.
3.17. In contrast, suppliers, consumer representatives and one investor saw
indexation as a positive move that would reduce the risk faced by consumers and
provide savings for consumers. It was argued that the removal of risk could lower
the overall cost of capital for the network companies. The savings to consumers were
estimated at £50-100m per annum.
3.18. There was no consensus amongst network companies with regard to the length
of the trailing average. Some sought a longer trailing average (for example, 15
years) to reflect the cost of debt issued in the 1990s, while others sought a shorter
trailing average (for example, 5 years), which would be more responsive to recent
market trends. The overall message is that the companies consider they have
different funding profiles, and that a one-size-fits-all index would not be appropriate.
3.19. A number of network companies and investors stated a preference for the
iBoxx index, rather than Bloomberg. The key arguments in support of iBoxx were: it
is based on a more transparent methodology (and hence is more predictable), it is
calculated using more bonds issued by regulated UK energy networks, and the fact
that iBoxx's 10+ years index better reflects the long-term nature of bonds issued by
network companies.
3.20. Technical issues raised with regard to our proposed mechanism centred on
costs that are seen not to be captured in the index. These include debt issuance
costs (such as broker, legal and credit rating agency fees), pre-funding and liquidity
management costs (costs of carry), the new issue premium that is captured in bond
coupons but not reflected in the secondary market yields that are used in our index,
and the inflation risk premium.
Our decision
3.21. In the paragraphs that follow we discuss our decision in light of the points
raised in consultation responses. Specifically, we address the following:
indexation compared to a fixed allowance, and the risk implications
data source - Bloomberg or iBoxx? This also addresses the points made with
regard to the index maturity and credit ratings
deflating the index to calculate the real cost of debt
use of simple or weighted average and the length of the trailing average
issuance costs and liquidity management costs
new issue premium
inflation risk premium.

Office of Gas and Electricity Markets 20
RIIO-T1 and GD1 Financial Issues March 2011
Indexation and risk implications
3.22. Under the RIIO framework we said we would introduce an indexed allowance
for the cost of debt, rather than the fixed allowance that was applied in the RPI-X
regime. In the past, Ofgem tended to look at the 10-year trailing average on 10-year
sterling (GBP) corporate bonds, as well as additional evidence, and then set a fixed
allowance that was higher than observed rates in order to protect the network
companies against the risk of the cost of debt rising during the price control period.
The last 15 years or so have seen a sustained decline in the market cost of debt with
the result that consumers have borne the brunt of a cost of debt allowance that was
higher than the market rates.
3.23. With current risk-free rate rates at historical lows and debt premia on BBB and
A rated UK corporates back to their pre-crisis lows, it is unlikely that the cost of debt
has much scope to decline further. However, it is unclear if and when the market
cost of debt will increase, how fast it will climb and what levels it will reach during
RIIO-T1 and GD1. With that in mind, we do not think that a fixed cost of debt
allowance could be set with any confidence. We consider indexation to be the most
robust option available to us to protect both consumers and the companies.
3.24. This is illustrated in Figure 3.2, in which we use current forward rates to
estimate a profile for the cost of debt through to the end of RIIO-T1 and GD1. It is
important to stress that this is not a forecast or a central scenario. It is an estimation
of how the market currently envisages the yield on 10-year bonds developing over
the next ten years or so. Equally plausible forward estimates could be produced that
show vastly different patterns. It is this great degree of uncertainty that makes
indexation important when setting the cost of debt allowance.
Figure 3.2: Illustration of the cost of debt on 10-year utilities debt
Source: Ofgem analysis of Bloomberg data
0.0
1.0
2.0
3.0
4.0
5.0
6.0
7.0
Cost
of d
ebt (
%)
Market Cost of Debt 10-year Trailing Average Indexed Allowance Fixed Allowance
Forecast period
RIIO-T1 and GD1

Office of Gas and Electricity Markets 21
RIIO-T1 and GD1 Financial Issues March 2011
3.25. It has been argued in consultation responses that indexation would prevent the
network companies from hedging against the risk of underperforming the cost of
debt allowance. We asked Europe Economics to examine the extent to which
networks companies currently hedge against our fixed allowance. This analysis is
published today alongside this paper.14
3.26. Following discussions with banks, and a review of the information we received
in annual regulatory reporting packs, Europe Economics concluded that the
companies predominantly engage in pre-issuance hedging, in which they aim to
secure the reference gilt yield that applies to their bond. Additionally, the companies
may hedge against inflation risk on non index-linked bonds by issuing inflation
swaps. The typical time frame for such hedges is less than one year before the bond
is issued, and usually less than three months.
3.27. As Europe Economics concludes, cost of debt indexation in and of itself does
not preclude the companies from entering into such hedges. Indeed, since indexation
ensures that efficiently financed debt would be funded, even if the market cost of
debt is above the cost of debt allowance at the time of issuance, it can be seen as a
form of insurance for the companies.
3.28. Furthermore, annual indexation of certain components of the cost of capital is a
well-established practice among European regulators.
3.29. Overall, we are not convinced by the arguments that indexation introduces
greater risk for the network companies. Our decision is to set the cost of debt
allowance based on an index that is updated annually.
Bloomberg or iBoxx?
3.30. Our December proposals indicated a preference for Bloomberg as the data
source for the cost of debt index. In light of the preference expressed by
stakeholders for iBoxx, we took a closer look at the two data providers.
3.31. We identified in the December supplementary annex the Bloomberg and iBoxx
indices that we considered most relevant for setting the cost of debt allowance.
These were:
Bloomberg's GBP Corporates bond indices of 10-year maturity, with A and broad
BBB credit ratings
iBoxx's GBP Non-Financials bond indices of 10+ years maturity, with broad A and
broad BBB credit ratings
14 The Weighted Average Cost of Capital for Ofgem‟s Future Price Control (March 2011 update) – Report by Europe Economics on behalf of Ofgem http://www.ofgem.gov.uk/Networks/GasDistr/RIIO-GD1/ConRes/Documents1/GD1WACC.pdf

Office of Gas and Electricity Markets 22
RIIO-T1 and GD1 Financial Issues March 2011
3.32. iBoxx calculates its index through a weighted average of all bonds with the
relevant maturity. In contrast Bloomberg derives a yield curve from bonds of all
available maturities, from which a point (for example 10-years) is picked for the
index. Figure 3.3 provides an overview of the current make-up of the Bloomberg and
iBoxx indices in terms of the number of bonds from each industry.
3.33. The iBoxx BBB index includes a greater proportion of utilities than the
Bloomberg BBB index. The iBoxx A index includes a significantly larger number of
bonds than the Bloomberg index, although we note that iBoxx provides a broad A
rated index while Bloomberg provides separate indices for A, A+ and A- rated bonds.
Figure 3.3: Composition of Bloomberg and iBoxx indices
Source: Ofgem analysis of Bloomberg and iBoxx data
3.34. The average remaining maturity (weighted by outstanding amount) in iBoxx's A
rated index is currently 21.6 years. On the iBoxx BBB rated index it is currently 17.2
years. This is broadly in line with the 18.6 years that we estimated in the strategy
Utilities
Telecommunications
Consumer goods
Consumer services
Health care
Industrials
Oil and gas
Basic materials
Financial
6
1
1
1
10 years, A rated
11
8
5
12
11 2
3
10 years, BBB rated
Bloomberg £ Corporates*
20
8
8
4
3 1
10+ year, BBB rated
iBoxx £ Non-Financials
40
11
3
7
42 1 1
10+ years, A rated
* For Bloomberg, pie charts show the number of bonds with remaining maturity between 7.5 and 12.5 years

Office of Gas and Electricity Markets 23
RIIO-T1 and GD1 Financial Issues March 2011
consultation document as the weighted average tenor of network company debt
issuances.
3.35. Figure 3.4 plots the cost of debt indices and simple 10-year trailing averages
that are derived from Bloomberg and iBoxx. The fact that the two are very close is in
line with our assertion in the strategy consultation document that there is little
material difference in the cost of debt beyond the 10-year maturity.
Figure 3.4: The cost of debt based on Bloomberg and iBoxx indices
Source: Ofgem analysis of Bloomberg and iBoxx data
3.36. Figure 3.5 summarises our views on the suitability of the Bloomberg and iBoxx
indices. The iBoxx indices have the advantage of including bonds of longer than ten
years maturity, thus better capturing the debt profiles of network companies.
Further, the iBoxx broad A rated index provides a larger sample size (and is,
therefore, more reliable) than Bloomberg's A rated index. It is also more
representative of the network companies, none of which currently hold a credit rating
above A-.

Office of Gas and Electricity Markets 24
RIIO-T1 and GD1 Financial Issues March 2011
Figure 3.5: Assessment of Bloomberg and iBoxx indices' suitability
3.37. With the above in mind, and noting that stakeholders have expressed a
preference for iBoxx, our decision is to base the cost of debt index on the iBoxx
indices for GBP Non-Financials of 10+ years maturity, with broad A and broad BBB
credit ratings.
Arriving at a real cost of debt
3.38. The iBoxx indices (and, for that matter, the Bloomberg indices) measure the
nominal cost of debt. We, therefore, need to deflate these indices in order to arrive
at the real cost of debt.
3.39. Our preferred approach is to calculate a risk-free rate (from the yield on index-
linked gilts (ILGs)) and a debt premium (from the spread between the yield on iBoxx
indices and the yield on nominal gilts). However, the iBoxx index for index-linked
gilts of 10+ years maturity only dates back to 2005 and, thus, cannot be used to
construct a 10-year trailing average.
3.40. An alternative approach, which we intend to use, is to deflate the iBoxx indices
by the 10-year breakeven inflation15 index published by the Bank of England16 to
arrive at an estimate of the real cost of debt. While the iBoxx indices include bonds
with a longer maturity than 10 years, the yields on long-dated ILGs are depressed
due to the Minimum Funding Requirement on pension schemes. This, in turn, creates
a distortion in breakeven inflation estimates. The Competition Commission has
typically considered that 10-year ILGs are free of this distortion17 and sufficiently
15 Breakeven inflation is the difference between the yield on nominal gilts and the yield on index-linked gilts of a similar maturity. 16 Series name: 'Yield from British Government Securities, 10 year Inflation Zero Coupon'. Series code: IUDMIZC. Accessible on the Bank of England website at: http://www.bankofengland.co.uk/statistics/index.htm 17 For example, in its recommendation of the cost of capital for Heathrow and Gatwick airports. See: A report on the economic regulation of the London airports companies (Heathrow Airport Ltd and Gatwick Airport Ltd) - Report by the Competition Commission http://www.competition-commission.org.uk/rep_pub/reports/2007/fulltext/532af.pdf

Office of Gas and Electricity Markets 25
RIIO-T1 and GD1 Financial Issues March 2011
reflective of the long-term risk-free rate. This suggests that 10-year breakeven
inflation is sufficiently reflective of inflation expectations on long-dated bonds and
would be appropriate for deflating the iBoxx indices.
Simple or weighted average and length of trailing average
3.41. In the strategy consultation document we expressed our preference for a
simple trailing average to calculate the cost of debt assumption. Although the index
better matches the cost of debt of the network companies, the weakness of a simple
average is that it does not fully reflect the different debt profiles of the network
companies. This is particularly the case where there are significant differences within
a sector (as, for example, may be the case in electricity transmission where
companies with relatively small asset bases have embarked on significant capex
programmes).
3.42. As we note above, the message from our consultation is that a one-size-fits-all
index may not be appropriate given both the variation on current debt profiles and
the different investment programmes that network companies are expected to
undertake during RIIO-T1 and GD1.
3.43. With that in mind, we examined how the index would perform for different
notional companies that broadly reflect TOs and GDNs. We created three notional
companies:
Company 1 has a large RAV at the start of RIIO-T1 and GD1, and undertakes an
investment programme of roughly the same size as its opening RAV during the
price control period.
Company 2 has a small RAV at the start of RIIO-T1 and GD1, and undertakes an
investment programme that is roughly five times larger than its opening RAV.
Company 3 has a medium-sized RAV at the start of RIIO-T1, and GD1 and
undertakes an investment programme that is roughly half of its opening RAV.
3.44. For each of the above notional companies, we assessed the cost of debt in the
period through to 2020-21. This included a consideration of the following:
the real cost of existing debt at the start of the period - we based these figures
on the information provided to us by TOs and GDNs in the Regulatory Reporting
Packages (RRPs)
the proportion of existing debt that is refinanced - this was based on network
companies' typical debt maturities as indicated in the RRPs
the amount and timing of new debt that needs to be raised - this is an output of
our financial model, where we relied on comparable TOs and GDNs.

Office of Gas and Electricity Markets 26
RIIO-T1 and GD1 Financial Issues March 2011
3.45. For new and refinanced debt, we assumed it is issued at the prevailing market
rate at the time, as indicated in Figure 3.2. That is, we made the conservative
assumption of no outperformance on the cost of debt.18
3.46. We compared the cost of debt profiles that we estimated for the three
companies to our proposed 10-year simple trailing average index. As a sense-check,
we also compared it to an index based on a 10-year trailing average weighted by net
RAV additions, and to a 5-year simple trailing average.19 Our findings are illustrated
in Figures 3.6, 3.7 and 3.8.
Figure 3.6: Company 1's cost of debt and indexed allowance
18 This assumption could also be thought of as accounting for the cost of issuing debt 19 Different weights were used for each notional company, based on output from our financial model for comparable TOs and GDNs
2.0%
2.5%
3.0%
3.5%
4.0%
4.5%
5.0%
2011/12 2012/13 2013/14 2014/15 2015/16 2016/17 2017/18 2018/19 2019/20 2020/21
Re
al c
ost
of d
eb
t (%
)
Index (10-year simple average) Index (5-year simple average) Index (10-year weighted average) Network company cost of debt
RIIO-T1 and GD1
RIIO-T1 and GD1 revenue impact of over/under-performance:10-year simple average £31m5-year simple average £374mWeighted average £297m

Office of Gas and Electricity Markets 27
RIIO-T1 and GD1 Financial Issues March 2011
Figure 3.7: Company 2's cost of debt and indexed allowance
Figure 3.8: Company 3's cost of debt and indexed allowance
2.0%
2.5%
3.0%
3.5%
4.0%
4.5%
5.0%
2011/12 2012/13 2013/14 2014/15 2015/16 2016/17 2017/18 2018/19 2019/20 2020/21
Re
al c
ost
of d
eb
t (%
)
Index (10-year simple average) Index (5-year simple average) Index (10-year weighted average) Network company cost of debt
RIIO-T1 and GD1
RIIO-T1 and GD1 revenue impact of over/under-performance:10-year simple average -£117m5-year simple average -£18mWeighted average £11m
2.0%
2.5%
3.0%
3.5%
4.0%
4.5%
5.0%
2011/12 2012/13 2013/14 2014/15 2015/16 2016/17 2017/18 2018/19 2019/20 2020/21
Re
al c
ost
of d
ebt
(%)
Index (10-year simple average) Index (5-year simple average) Index (10-year weighted average) Network company cost of debt
RIIO-T1 and GD1
RIIO-T1 and GD1 revenue impact of over/under-performance:10-year simple average £13m5-year simple average £53mWeighted average £17m

Office of Gas and Electricity Markets 28
RIIO-T1 and GD1 Financial Issues March 2011
3.47. For two of the companies, the 10-year simple average best matches the cost of
debt, while still allowing room for outperformance. For Company 2, the majority of
debt will be taken out during RIIO-T1 and GD1. Given the expectation that market
rates will quickly rise from their current historical lows, a simple 10-year trailing
average is unlikely to rise rapidly enough to capture Company 2's cost of debt.
3.48. With the above in mind, our decision is to use the 10-year simple trailing
average to set the cost of debt assumption for all network companies, with the
following caveat: if a company can show in its business plan that the 10-year simple
average index is not appropriate for its circumstances, it can propose a different
approach to weighting the index and an eventual transition to the 10-year simple
index. We will consider the merits of such a proposal when evaluating the business
plan and would need to satisfy ourselves that the adoption of a different weighting
approach is both robust and justified. The caveat applies only to companies that are
faced with exceptional circumstances, such as those illustrated by Company 2 in the
analysis above.
Issuance and liquidity management costs
3.49. Over the history of the iBoxx index, network companies have been able to
issue debt at coupons that are on average 58bps below the market cost of debt on
the day (as illustrated in Figure 3.9). This is because of the „halo effect‟ that the
network companies enjoy as a result of:
A guaranteed revenue stream
Asset value underpinned by the RAV
No/low competitive pressure
No volume risk
A well-established, well-understood regulatory regime.
3.50. Network companies have argued that RIIO introduces regulatory risk, which
means that the halo effect will not hold in the future. Our view is that the main
reasons for the halo effect are to do with the fundamental nature of regulated
utilities and will remain in place under RIIO.
3.51. The Competition Commission, in its review of Bristol Water, allowed 10bps for
the cost of issuing debt and 20bps for Bristol Water's liquidity management costs
(costs of carry). Our position in both TPCR4 and GDPCR was to make no allowance
for the cost of issuing debt. In DPCR5 we acknowledged an implicit allowance for
debt issuance costs, although it would be incorrect to assume that this was the
purpose of allowing for „headroom‟ above the trailing average at the time. Headroom
exists when a fixed allowance is set in order to account for the risk of the cost of
debt rising during the price control period to the extent that the trailing average rises
above its level at the time of Final Proposals.
Office of Gas and Electricity Markets 29
RIIO-T1 and GD1 Financial Issues March 2011
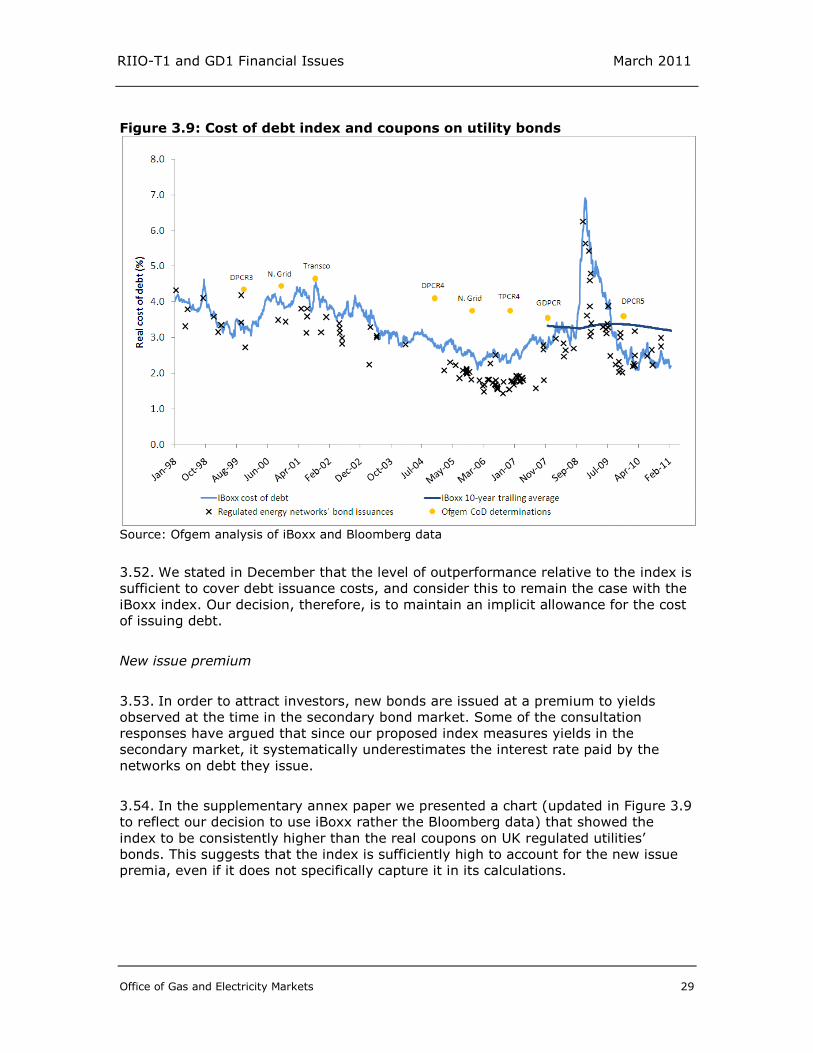
Figure 3.9: Cost of debt index and coupons on utility bonds
Source: Ofgem analysis of iBoxx and Bloomberg data
3.52. We stated in December that the level of outperformance relative to the index is
sufficient to cover debt issuance costs, and consider this to remain the case with the
iBoxx index. Our decision, therefore, is to maintain an implicit allowance for the cost
of issuing debt.
New issue premium
3.53. In order to attract investors, new bonds are issued at a premium to yields
observed at the time in the secondary bond market. Some of the consultation
responses have argued that since our proposed index measures yields in the
secondary market, it systematically underestimates the interest rate paid by the
networks on debt they issue.
3.54. In the supplementary annex paper we presented a chart (updated in Figure 3.9
to reflect our decision to use iBoxx rather the Bloomberg data) that showed the
index to be consistently higher than the real coupons on UK regulated utilities‟
bonds. This suggests that the index is sufficiently high to account for the new issue
premia, even if it does not specifically capture it in its calculations.

Office of Gas and Electricity Markets 30
RIIO-T1 and GD1 Financial Issues March 2011
Inflation risk premium
3.55. The approach used to calculate the cost of debt index implicitly assumes that
all network debt is index-linked. In reality, only a small proportion of the networks‟
debt is index linked and the networks are exposed to inflation risk on the rest of their
debt profile. Nominal bonds carry an „inflation risk premium‟ that is implicitly
incorporated in their coupons. Consultation responses noted that our proposed index
does not capture the inflation risk premium.
3.56. Although there is no question that an inflation risk premium exists, for the
purposes of setting an indexed cost of debt allowance what matters is whether this
premium is material.
3.57. Since the Bank of England began pursuing an explicit inflation target (May
1997), breakeven inflation (ie the difference between the yield on nominal gilts and
the yield on ILGs) has been on average 2.9 per cent at 10-year maturity. Over the
same time period, the difference between Retail Price Index (RPI) inflation and
Consumer Price Index (CPI) inflation was 0.9 per cent. Hence, the Bank of England‟s
2.0 per cent inflation target for CPI would imply 2.9 per cent on RPI – exactly
matching the measure by which we deflate our index.
3.58. The above suggests that the inflation risk premium is countered by a liquidity
premium on ILGs of a similar magnitude. It is reasonable to expect that a small
liquidity premium is paid on ILGs relative to gilts, since the latter represent a
significantly larger market, and ILGs are often held rather than being traded.
Summary of the cost of debt index
3.59. Based on all of the above, our decision is as follows:
to set the cost of debt allowance in the WACC based on a 10-year simple trailing
average index (with provision for companies to justify alternative weighting to
the trailing average in exceptional circumstances)
to update this allowance annually during the price control
to use an average of the iBoxx GBP Non-Financials indices of 10+ years maturity,
with credit ratings of broad A and broad BBB
to deflate the indices by 10-year breakeven inflation data published by the Bank
of England
we are not making adjustments in the index for debt issuance fees, liquidity
management fees, new issue premium or the inflation risk premium.
3.60. Alongside this supplementary annex, we will publish shortly a model in
Microsoft Excel, which shows how the cost of debt allowance calculation would work
with the iBoxx index.

Office of Gas and Electricity Markets 31
RIIO-T1 and GD1 Financial Issues March 2011
Cost of equity
Summary of consultation proposals
3.61. Alongside the strategy consultation paper, we published a report by Europe
Economics on the cost of equity for networks companies in RIIO-T1 and GD1. In the
strategy consultation paper itself we set out a proposed range of 4.0-7.2 per cent for
the cost of equity (post-tax real), which took into account Europe Economics'
recommendation and past regulatory precedents (including the Competition
Commission's (CC‟s) latest determination in the Bristol Water case).
3.62. In the strategy consultation paper we also consulted on whether we should
provide an allowance for the cost of raising equity. We proposed to retain the
mechanism used in TPCR4, in which an ex ante allowance was set as 5 per cent of
the notional amount of equity needed to be raised during the price control (this is an
output of our financial model). The allowance will be subject to an ex post
adjustment.
Summary of responses
3.63. The network companies and investors criticised the lower end of our cost of
equity range. In general investors and the companies considered that the upper end
was more acceptable, although some sought a higher allowance. The following
factors were argued to increase the return on equity sought by investors in the
network companies:
attractive returns are required to raise the level of equity needed to finance the
proposed capex programmes (particularly in electricity transmission)
the introduction of RIIO increases regulatory risk
longer regulatory asset lives and full capitalisation of repex lengthen the duration
of cash flows
cost of debt indexation shifts risk to equity holders
equity injections may be required to address short-term financeability shortfalls.
3.64. A number of companies considered that both our risk-free rate range of 1.4-2.0
per cent and the equity beta range of 0.65-0.95 relied on data from a period that
was not representative of the likely financial market conditions during RIIO-T1 and
GD1, and should be increased. In contrast, suppliers and consumer representatives
argued that the upper end of our range was too high. In particular, the proposed
upper bound of the equity risk premium (5.5 per cent) was deemed unsupported by
regulatory precedents and unjustified in light of economic conditions.
Our decision
3.65. Based on the feedback we have received to the December consultation, we do
not think it would be in the interest of consumers to de-risk companies to the extent

Office of Gas and Electricity Markets 32
RIIO-T1 and GD1 Financial Issues March 2011
necessary to justify a cost of equity towards the bottom of the consultation range.
The RIIO framework is about providing incentives to encourage companies to deliver
their outputs at minimum cost. This requires a level of opportunity and risk that does
not align with a low cost of equity.
3.66. We have, therefore, narrowed the indicative range for the cost of equity from
our December proposals to 6.0-7.2 per cent (post-tax real). In the remainder of this
section we outline our thinking behind this updated cost of equity range.
3.67. We asked Europe Economics (EE) to update its analysis of the cost of equity to
reflect any changes in market data since our strategy consultation document.
3.68. As part of the consultation process we also received reports from Oxera (on
behalf of the Energy Networks Association),20 CEPA (for Centrica)21 and NERA (for
SPTL).22 Figure 3.10 summarises the consultants' views on the cost of equity.
Figure 3.10: Consultant ranges for the cost of equity
Risk-free rate
3.69. Market measures of the real risk-free rate, such as the yield on ILGs, have
risen slightly since the data cut-off point for EE's December report. However, they
remain near historical lows, partly due to the Bank of England's official interest rate
being held at 0.5 per cent and the impact of Quantitative Easing. We, therefore, do
not consider it appropriate to rely on spot rates or short-term averages to set the
risk-free rate. Figure 3.11 summarises five and 10-year average yields on ILGs and
deflated nominal gilts.
20 What is the cost of equity for RIIO-T1 and RIIO-GD1? – a report by Oxera on behalf of the Energy Networks Association http://www.ofgem.gov.uk/Networks/Trans/PriceControls/RIIO-T1/ConRes/Documents1/Energy_Networks_Association_-_Oxera_report.pdf 21 RIIO-T1 & RIIO-GD1: Financial Issues – a report by CEPA on behalf of Centrica http://www.ofgem.gov.uk/Networks/Trans/PriceControls/RIIO-T1/ConRes/Documents1/Centrica_Annex_1.pdf 22 SPT‟s cost of capital – a presentation by NERA for Ofgem http://www.ofgem.gov.uk/NETWORKS/PRICECONTROLS/WEBFORUM/Documents1/NERA%20Cost%20of%20Capital%20110215.pdf
Component Low High Low High Low High Low High**
Risk-free rate 1.3% 1.8% 1.8% 1.5% 2.0% 1.0% 2.0% 2.0%
Equity risk premium 4.5% 5.0% 5.0% 4.5% 5.5% 4.0% 5.0% 5.2%
Equity beta 0.55 0.65 0.9 0.8 1.0 0.65 0.65 0.84
Cost of Equity (post-tax) 3.8% 5.1% 6.3% 5.1% 7.5% 3.6% 5.3% 6.4% 8.4%
Uplift for projected RfR rises 0.7%
Uplift for capex risk 0.5%
Uplift for longer asset lives 0.5%
CoE after uplifts 3.8% 5.1% 6.3% 5.1% 7.5% 3.6% 5.3% 8.1% 8.4%* Equity beta "likely to fall at or below the lower end of Ofgem's initial range"** Based on the Dividend Growth Model (DGM), rather than CAPM parameters
EE recommendation Oxera (ENA) CEPA (Centrica)* NERA (SPTL)EE - precedent-
based
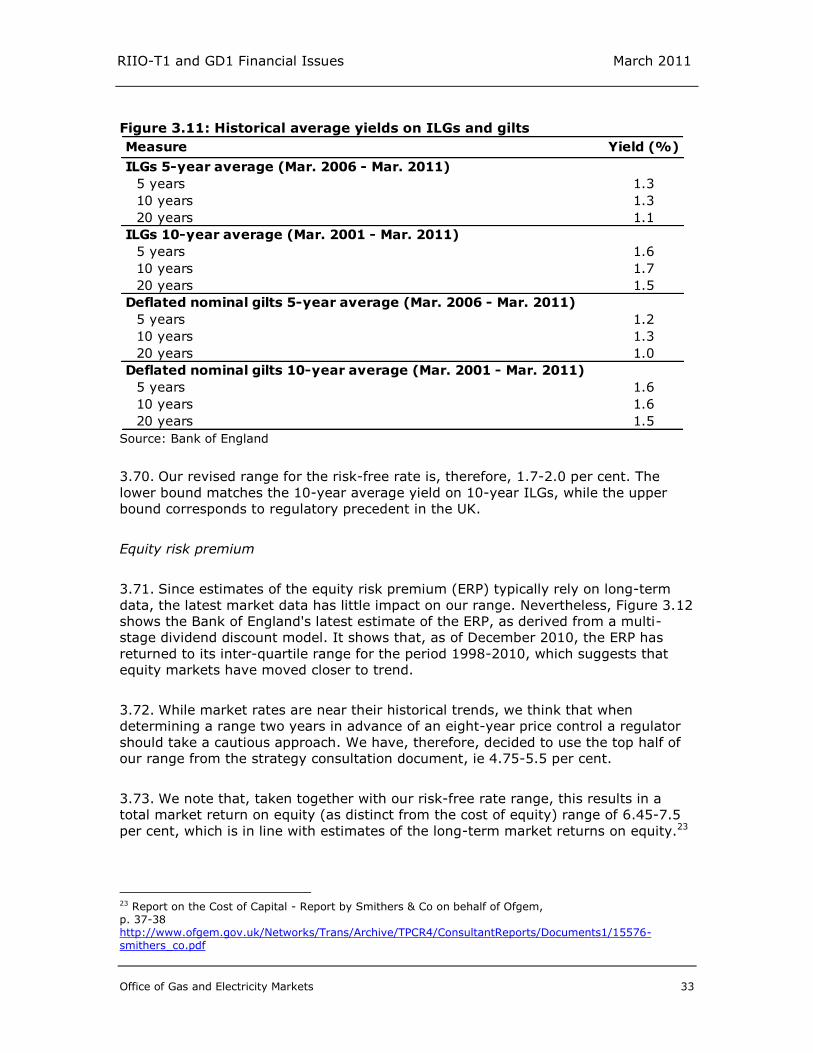
Office of Gas and Electricity Markets 33
RIIO-T1 and GD1 Financial Issues March 2011
Figure 3.11: Historical average yields on ILGs and gilts
Source: Bank of England
3.70. Our revised range for the risk-free rate is, therefore, 1.7-2.0 per cent. The
lower bound matches the 10-year average yield on 10-year ILGs, while the upper
bound corresponds to regulatory precedent in the UK.
Equity risk premium
3.71. Since estimates of the equity risk premium (ERP) typically rely on long-term
data, the latest market data has little impact on our range. Nevertheless, Figure 3.12
shows the Bank of England's latest estimate of the ERP, as derived from a multi-
stage dividend discount model. It shows that, as of December 2010, the ERP has
returned to its inter-quartile range for the period 1998-2010, which suggests that
equity markets have moved closer to trend.
3.72. While market rates are near their historical trends, we think that when
determining a range two years in advance of an eight-year price control a regulator
should take a cautious approach. We have, therefore, decided to use the top half of
our range from the strategy consultation document, ie 4.75-5.5 per cent.
3.73. We note that, taken together with our risk-free rate range, this results in a
total market return on equity (as distinct from the cost of equity) range of 6.45-7.5
per cent, which is in line with estimates of the long-term market returns on equity.23
23 Report on the Cost of Capital - Report by Smithers & Co on behalf of Ofgem, p. 37-38 http://www.ofgem.gov.uk/Networks/Trans/Archive/TPCR4/ConsultantReports/Documents1/15576-smithers_co.pdf
Yield (%)
ILGs 5-year average (Mar. 2006 - Mar. 2011)
5 years 1.3
10 years 1.3
20 years 1.1
ILGs 10-year average (Mar. 2001 - Mar. 2011)
5 years 1.6
10 years 1.7
20 years 1.5
Deflated nominal gilts 5-year average (Mar. 2006 - Mar. 2011)
5 years 1.2
10 years 1.3
20 years 1.0
Deflated nominal gilts 10-year average (Mar. 2001 - Mar. 2011)
5 years 1.6
10 years 1.6
20 years 1.5
Measure

Office of Gas and Electricity Markets 34
RIIO-T1 and GD1 Financial Issues March 2011
Figure 3.12: Bank of England estimate of the ERP
Source: Bank of England
Equity beta
3.74. Europe Economics show that the equity beta for National Grid and SSE has
fallen sharply since the data cut-off point of their December report. With this being a
recent and drastic change, we do not think it would be appropriate for us to rely on
the latest data in determining the equity beta for RIIO-T1 and GD1. However, we will
monitor the situation in the lead-up to final proposals.
3.75. In DPCR5 we used an equity beta of 0.9. At a fundamental level, TOs and GDNs
face a relatively similar level of risk and are clearly less risky than the market
average (ie have an equity beta of less than 1). However, it is worth noting two
unique risks that may come into play in RIIO-T1 and GD1:
for electricity TOs, an extensive investment programme is expected to take place
over the next 10 years or so
for GDNs and, to a lesser extent the gas TO, some risks exist about future
network usage (as addressed in Chapter 2).
3.76. In light of the above we have narrowed our equity beta range to 0.9-0.95.
Cost of equity range
3.77. Figure 3.13 summarises our revised cost of equity range, which is 6.0-7.2 per
cent. Stakeholders should not assume that we will simply select the mid-point (ie 6.6
per cent) for RIIO-T1 and GD1. Any point in the range (and, indeed, outside it) could
be selected depending on information we receive between now and Final Proposals in
December 2012.

Office of Gas and Electricity Markets 35
RIIO-T1 and GD1 Financial Issues March 2011
3.78. It is also worth stressing that in the RIIO framework, companies are able to
propose their cost of equity when they present their business plans to us. We may
accept a proposed cost of equity that is outside our range if it is well justified by the
company.
Figure 3.13: Cost of equity range
International comparison of cost of equity allowances
3.79. An important message from consultation has been that returns on equity must
be attractive in order to attract investors in the face of competing opportunities in
the utilities sector. In order to assess how our indicative range compares to returns
on equity available in other jurisdictions, Figures 3.14 and 3.15 plot the upper and
lower bounds of our cost of equity range against current determinations in the
energy sector by European and US regulators.24
3.80. Since the majority of European determinations and all US determinations are in
nominal terms, it is not always possible to calculate the real cost of equity allowed by
the regulator. In addition, several European determinations and all US
determinations are on pre-tax basis. In order to show comparable figures, Figures
3.14 and 3.15 show the cost of equity in pre-tax nominal terms. We assume inflation
of 2.8 per cent for all UK determinations, and use a corporation tax rate of 25 per
cent for RIIO-T1 and GD1. It is important to note that comparisons using the pre-tax
nominal values need to be carefully interpreted, since different countries have
different corporation tax rates and different inflation levels.
3.81. Figure 3.14 also includes Ofgem's three current price controls: DPCR5, GDPCR
and TPCR4. The figure also includes UK regulatory determinations on the cost of
equity that may be seen as comparators - namely: the CC‟s decisions in the Bristol
Water investigation25 and Heathrow's price control,26 and Ofwat's decision for 2010-
15.27
24 For US allowances we focus on determinations from 2009-10 as listed in Fitch‟s Review of Utility Return On Equity (ROE) Trends (http://www.fitchratings.com/creditdesk/reports/report_frame.cfm?rpt_id=505654), as well as recent determinations for Massachusetts Gas and Niagara Mohawk. 25 Bristol Water plc: a reference under section 12(3)(a) of the Water Industry Act 1991 - Report by the Competition Commission http://www.competition-commission.org.uk/rep_pub/reports/2010/fulltext/558_appendices.pdf 26 A report on the economic regulation of the London airports companies (Heathrow Airport Ltd and Gatwick Airport Ltd) - Report by the Competition Commission http://www.competition-commission.org.uk/rep_pub/reports/2007/fulltext/532af.pdf 27 Future water and sewerage charges 2010-15: final determinations - report by Ofwat
DPCR5 GDPCR TPCR4 CC Bristol Water
Component Low High Low High
Risk-free rate 1.7% 2.0% 1.4% 2.0% 2.0% 2.5% 2.5% 2.0%
Equity risk premium 4.75% 5.5% 4.0% 5.5% 5.25% 4.75% 4.5% 5.0%
Equity beta 0.9 0.95 0.65 0.95 0.9 1.0 1.0 0.92
Cost of Equity (post-tax) 6.0% 7.2% 4.0% 7.2% 6.7% 7.25% 7.0% 6.6%
RIIO-T1/GD1 March RIIO-T1/GD1 December

Office of Gas and Electricity Markets 36
RIIO-T1 and GD1 Financial Issues March 2011
3.82. While some of these determinations will expire by the time RIIO-T1 and GD1
come into effect, the aim of this exercise is to examine the returns on equity that are
currently available to investors in European and US regulated energy network
companies. Unlike our consultants' study on the CAPM components of the cost of
equity, here we are interested in total allowed returns. Therefore, for the purpose of
our comparison, it does not matter that other regulators may use a different notional
gearing assumption (which would affect the equity beta used in the determination).
3.83. The figures show that our indicative range offers attractive returns on equity
compared to European and US regulated utilities. We think that this is appropriate
given the need to attract investment into the sector during RIIO-T1 and GD1 in order
to finance investment that will facilitate achieving the UK's low carbon objectives.
Figure 3.14: European determinations on the cost of equity (pre-tax
nominal)
Source: Various regulatory determinations
http://www.ofwat.gov.uk/pricereview/pr09phase3/det_pr09_finalfull.pdf
0.0
2.0
4.0
6.0
8.0
10.0
12.0
14.0
16.0
Allo
wed
co
st o
f eq
uit
y (p
re-t
ax n
om
inal
) %
Electricity transmission average 10.7% Gas distribution average 11.4% Gas transmission average 11.5%

Office of Gas and Electricity Markets 37
RIIO-T1 and GD1 Financial Issues March 2011
Figure 3.15: US determinations on the return of equity (pre-tax nominal)
Source: Fitch and various regulatory determinations
The cost of raising equity
3.84. In TPCR4 we set an ex ante allowance for the cost of raising equity, with an ex
post true-up to take place as part of the RIIO-T1 review. The allowance was five per
cent of the value of expected notional equity issued during the price control, as
calculated by the TPCR4 financial model.
3.85. In December we proposed to retain this mechanism for TOs in RIIO-T1 and
introduce it for GDNs. Consultation responses have generally supported our proposal.
3.86. Our decision, therefore, is to set an ex ante allowance of five per cent of
notional new equity as calculated by the RIIO-T1 and GD1 financial model ('The
Unified Model'). We consider that eight years is too long a time to wait for an ex post
adjustment and instead will carry out an annual true-up (lagged by two years to
obtain actual data) to reflect differences between actual net RAV additions and
modelled values at the time the control was set. The true-up will by reference to the
modelled notional equity issuance and not companies' actual issuance.
3.87. Appendix 3 provides details of the methodology for calculating the allowance
for equity issuance costs.
0.0
2.0
4.0
6.0
8.0
10.0
12.0
14.0
Allo
wed
ret
urn
on
eq
uit
y (p
re-t
ax n
om
inal
) %
Electricity average 10.5% Gas average 10.1%

Office of Gas and Electricity Markets 38
RIIO-T1 and GD1 Financial Issues March 2011
4. Assessing financeability
Chapter Summary
This chapter sets out how we intend to assess the financeability of the network
companies during RIIO-T1 and GD1, taking on board the consultation responses to
our strategy consultation document. We also set out how we will use return on
regulatory equity (RoRE) analysis.
Approach to assessing financeability
Summary of consultation proposals
4.1. In the strategy consultation document we set out the key equity and credit
metrics that we intended to use in the RIIO-T1 and GD1 financeability analysis.
These included: regulated equity/EBITDA28, regulated equity/regulated earnings, net
debt/RAV, PMICR29, FFO30 interest cover and RCF31/net debt; with a focus on the net
debt/RAV and PMICR measures.
Summary of responses
4.2. Network company responses stressed that they believe there is a need to
include a measure of dividend payments as part of the financeability testing. They
also noted the different approaches adopted by different credit rating agencies and,
therefore, the need to expand the credit metrics used. Some companies questioned
the use of PMICR, noting that it is insensitive to, for example, changes in asset lives
or repex capitalisation.
4.3. Some respondents questioned whether we would look only at long term
performance, ignoring the performance during the coming control.
Our decision
4.4. Central to the RIIO model is that we will base our regulatory settlement on
robust principles that will ensure that network companies are financeable in the long
term. Financeability analysis (ie testing credit and equity metrics) is, however,
focused on the upcoming price control period.
4.5. As noted in a number of the consultation responses, credit rating agencies take
into account a wider range of issues than just credit metrics. And rating decisions
ultimately have a degree of judgement in them. Furthermore, the three major rating
28 EBITDA is 'earnings before interest, tax, depreciation and amortisation'. 29 PMICR is 'post-maintenance interest cover ratio'. 30 FFO is 'funds from operations'. 31 RCF stands for 'retained cash flow'.

Office of Gas and Electricity Markets 39
RIIO-T1 and GD1 Financial Issues March 2011
agencies (Fitch, Moody's and Standard & Poor's (S&P)) tend to focus on different
criteria in their evaluations. It is important, therefore, to understand that our
financeability analysis does not intend to replicate the different rating agencies'
methodologies.
4.6. Certain factors that credit agencies look at are largely common to all network
companies (eg business risk, regulatory environment) and are taken as a given in
our financeability analysis. Other factors are subject to each company's
management's decisions (eg the allocation of debt between holding company and
licensee) and we abstract from these in our analysis by applying a notional financial
structure to the licensees.32 Credit rating agency thresholds33 are then used to inform
target credit ratio levels in our financeability analysis.
4.7. As stated in the strategy consultation document, the RIIO model puts greater
emphasis on the role of equity in delivering the outputs that consumers expect in a
financeable manner. Our decision is, therefore, to include two equity metrics in our
financeability analysis:
Regulated equity/EBITDA
Regulated equity/regulated earnings
4.8. We agree with consultation responses that a wide range of credit ratios is used
by credit rating agencies. Indeed, in DPCR5 we calculated six credit ratios in our
financeability analysis and propose to do so again for RIIO-T1 and GD1. From
experience we note, however, that one or two ratios tend to capture the impact of
the price control package on each company's (notional) financial position.
4.9. Figure 4.1 summarises the key credit metrics and relevant ratios that Fitch,
Moody‟s and S&P expect for regulated network companies of BBB and A ratings (to
the extent that these have been published).34 S&P does not publish target ratios for
each rating category; therefore, the ratios shown for it in Figure 4.1 are those that
S&P observes for specific issuers with an “excellent” business risk operating in the
UK regulated electricity and gas sector. 35 All three rating agencies told us that they
do not expect every issuer to meet every ratio at all times.
32 It is worth stressing that our financeability analysis applies only to the licensee. We do not assess the financeability of any holding company. 33 Fitch and S&P have told us that theirs are observed ratios. We understand that for Moody‟s these represent target thresholds. 34 Sources: Fitch Ratings - Rating EMEA regulated network utilities (http://www.fitchratings.com/creditdesk/reports/report_frame.cfm?rpt_id=541427) Moody's Global Infrastructure Finance - Rating methodology for regulated electric and gas networks (http://www.moodys.com/researchdocumentcontentpage.aspx?docid=PBC_118786). 35 Also note that all S&P ratios are S&P-adjusted, and are fully consolidated to include debt at the holding company and operating company level within each issuer group.

Office of Gas and Electricity Markets 40
RIIO-T1 and GD1 Financial Issues March 2011
Figure 4.1: Credit metric ratios
4.10. We will use the ratios in Figure 4.1 to inform our financeability analysis for
RIIO-T1 and GD1.
4.11. Financeability analysis necessarily involves an element of judgement. Moody‟s
for example has historically had a favourable view of the regulatory framework in the
UK and this has allowed companies to maintain certain credit ratings, even where
key financial metrics may have fallen modestly outside the ranges set out for the
relevant broad rating category under the agency‟s methodology.
4.12. We take a similar approach and do not expect companies to pass all the ratios
in all years. In particular, we seek to understand better any instances in which a
network company:
Fails to meet a target ratio for a sustained period (ie several years)
Deviates significantly from a target ratio (either above or below) for more than
one year in a row
Repeatedly fails one target ratio while passing all others.
4.13. We expect companies to similarly exercise judgement in their business plans
and we do not expect all ratios to be achieved in every year of the price control in
order to produce a financeable plan.
A BBB A Baa A BBB
Net debt / RAV (%) 50 - 65 >65 45 - 60 60 - 75 <70 >70
FFO interest cover (x) 4.0 - 5.0 <4.0 3.5 - 5.0 2.5 - 3.5 >3.5 2.5 - 3.5
PMICR1 (x) >1.7 <1.7 2.0 - 4.0 1.4 - 2.0
FFO / Net debt (%) 12 - 20 8 - 12 >12 8 - 12
RCF / Capex (x) 1.5 - 2.5 2 1.0 - 1.5 2
2 According to Moody's, utilities undergoing a large capex programme who do not benefit from accelerated
depreciation are expected to score this metric at a Ba level, i.e in the range 0.5 - 1.0.
Standard & Poor'sMoody'sFitch
1 Moody's calls this metric 'Adjusted interest cover ratio (ICR)' but the definition it uses is consistent with the
definition of PMICR used by Fitch.

Office of Gas and Electricity Markets 41
RIIO-T1 and GD1 Financial Issues March 2011
Return on Regulatory Equity (RoRE) analysis
Summary of consultation proposals
4.14. In December we stated our intention to use return on regulatory equity (RoRE)
analysis to check the overall implications of the regulatory settlement, as well as in
setting the notional gearing level.
Summary of responses
4.15. Several responses noted our intention to use RoRE analysis in RIIO-T1 and
GD1. No substantive comments were made.
Our decision
4.16. We set out in December that it was important that the notional gearing is
appropriate both for the riskiness of the cash flows and to provide appropriate equity
and credit metrics.
4.17. We also set out that we intend to use the RoRE analysis in the first instance to
establish the level of notional gearing that would allow an efficient company to
achieve good returns and ensure sufficient cover against downside risks.
4.18. We have sought to provide indicative estimates of upside and downside
potential performance in figure 4.2 below, using a mixture of historical performance
and projected plausible values. These estimates will need to be refined in companies‟
business plans in the light of projected performance and any updates to uncertainty
mechanisms. In order to produce the RoRE diagrams we need to make assumptions
about the base cost of equity and the level of notional gearing. We have used for
these illustrative purposes the TPCR4 cost of equity and notional gearing. We have
also shown sensitivities around the level of notional gearing. As these diagrams are
illustrative at this stage we have only shown sector average values.
4.19. Figure 4.2 compares the RoRE for the electricity transmission sector as a whole
at three different levels of notional gearing. On these illustrative assessments a
notional gearing of 50 percent results in a very narrow range of returns suggesting
that there is limited cash flow volatility and a higher level of notional gearing is
appropriate. The level of notional gearing applicable for each company will be subject
to their business plan assessment.

Office of Gas and Electricity Markets 42
RIIO-T1 and GD1 Financial Issues March 2011
Figure 4.2 – Electricity Transmission: Return on Regulatory Equity
4.20. These figures are based on the electricity transmission sector as a whole. The
individual transmission operators are very different to each other in terms of size and
future capex: RAV ratio and so the RoRE diagrams are likely to look different for each
individual company. In particular, the level of notional gearing commensurate with
the cash flow risk is likely to be different.
4.21. It will be for the companies to undertake their own analysis of the overall risk
of the package and to assess the cash flow volatility and the appropriate level of
notional gearing. We would expect this analysis to form part of their overall
financeability assessment and to inform their notional gearing and cost of equity.
Companies will be able to adjust the volatility of returns through changes to
uncertainty mechanisms and through their choice of how much of their expected
capital expenditure projections they include in the base allowances and how much is
covered through revenue drivers and other uncertainty mechanisms.
4.22. Figure 4.3 below shows the similar picture for the gas distribution sector using
the cost of equity in the current price control and for comparability the same notional
gearing levels as in the electricity transmission diagram above. There is less
difference between the individual gas distribution businesses and therefore the sector
average is broadly representative of the individual companies.
0%
2%
4%
6%
8%
10%
12%
14%
ET sector gearing 70% ET sector gearing 60% ET sector gearing 50%
Return On Regulatory Equity -Plausible Range- Electricity Transmission Sector
unplanned outages
tax trigger deadband
under delivery
Broader environmental objectives
SF6, +ive mean value
connections
stakeholders, +ive mean value
customers - broad measure
planned outages, +ive mean value
late delivery
Cost upside
RORE per WACC + non zero incentives
Cost downside
late delivery
planned outages
customers - broad measure
stakeholders
connections
SF6
Broader environmental objectives
under delivery, -ive mean value
tax trigger deadband
unplanned outages

Office of Gas and Electricity Markets 43
RIIO-T1 and GD1 Financial Issues March 2011
Figure 4.3 – Gas distribution: Return on Regulatory Equity
4.23. Compared to the electricity transmission sector this shows a similar (although
asymmetrical) distribution of returns with more upside potential than downside. This
is because network companies have more scope to outperform than underperform on
our proposed repex incentives. As with the illustrative transmission diagram this
would suggest that a 50 percent notional gearing level is not appropriate for the
degree of cash flow volatility and a higher notional gearing would better match the
cash flow risk. The level of notional applicable to each company will be subject to
their business plan assessment.
4.24. The analysis is at this stage provisional and it may be that calibration of
incentives results in a widening of the range of returns. It is also possible that the
gas distribution companies may be able to justify in their business plans a greater
range of incentives that are of value for consumers.
4.25. The current analysis would appear to support the view that the downside risk
of gas distribution as a whole is less than electricity transmission. This might imply
that the cost of equity of the GDNs is lower and that a lower level of credit metrics
would be appropriate. We expect the network companies to undertake their own
RoRE analysis as part of their business plans.
4.26. We recognise that the RoRE analysis is only the first stage in the process and
that in addition, companies will need to test the results of the RoRE analysis against
credit and equity metrics and other factors and that there may need to be an
iteration of the variables in Figure 3.1 in order to achieve a balanced and financeable
business plan.
0%
2%
4%
6%
8%
10%
12%
14%
GD sector gearing 70% GD sector gearing 60% GD sector gearing 50%
Return On Regulatory Equity - Plausible Range for Gas Distribution
loss of supply
tax trigger deadband
Complaints
Shrinkage, +ive mean value
connections
EEI
stakeholders, +ive mean value
Cust sat survey
Repex upside delta
Cost upside
RORE per WACC + non zero incentives
Cost downside
Repex downside delta
Cust sat survey
Stakeholder engagement
EEI
connections, -ive mean value
Shrinkage
Complaints, -ive mean value
tax trigger deadband
loss of supply

Office of Gas and Electricity Markets 44
RIIO-T1 and GD1 Financial Issues March 2011
5. Taxation
Chapter summary
This chapter summarises respondent's views to the options for applying our tax
methodology. It sets out our decisions on how we will apply our methodology in the
RIIO price controls.
Summary of decisions
5.1. Our decisions are:
to model tax based on proposed changes in legislation and the adoption of IFRS
from 1 April 2014
to introduce a tax trigger mechanism to deal with uncertainty
to calibrate the dead-band for the trigger mechanism as the greater of a one per
cent change in the rate of corporation tax or 0.33 per cent of base demand
revenues
to reset allowed revenues from the tax clawback mechanism for excess gearing
every three years; and spread any adjustments from previous controls over eight
years for GDNs (from 1 April 2013) and nine years for TOs (from 1 April 2012)
to calculate the tax treatment of new investment related incentives using vanilla
WACC after allowing for capital allowances with no retrospection for existing
incentive mechanisms
to retain the existing approach to business rates.
Introduction
5.2. In December, we proposed that the methodology for taxation for RIIO-T1 and
GD1 should largely follow that applied at DPCR5. Our proposal included the
introduction of a DPCR5-style tax trigger. It took into consideration specific
transmission and gas distribution issues and, where appropriate, the treatment in
TPCR4 and GDPCR1. Respondents broadly supported the overall proposals although,
in some areas, respondents preferred a different approach to their application. The
methodology is set out in Appendix 4.
5.3. There were a number of issues where we sought views. These were whether
respondents agreed with:
modelling tax based on the proposals in the June 2010 Budget
modelling tax under UK GAAP pending adoption of IFRS reporting with any
changes to be subject to the operation of tax trigger mechanism
the size of the dead-band
the proposal that clawback of the tax benefit of excess gearing in TPCR4 and
GDPCR1 should be spread over the eight years of the RIIO price control

Office of Gas and Electricity Markets 45
RIIO-T1 and GD1 Financial Issues March 2011
that the proposal that clawback of the tax benefit of excess gearing should be
updated every three years during the price control period
the proposal that the tax treatment of new incentives should be calculated using
vanilla WACC.
Summary of responses
Modelling tax under existing legislation or budget proposals
5.4. The majority of respondents agreed with modelling tax based on the June 2010
Budget proposed rates. Respondents proposed that if outturn rates differed from the
proposals then any differences should be treated as a pass through in the tax trigger
mechanism. There was some support for using the June 2010 Budget tax rates with
the DPCR5 type tax trigger and dead-band and for the option of using extant rates
with any changes to CT and CA rates treated as a pass-through.
UK GAAP or IFRS
5.5. The majority of respondents considered that the mandatory adoption of EU
International Financial Reporting Standards36 (EU-IFRS) proposed by the Accounting
Standards Board (ASB) in FRED43 effective from 1 July 201337 was inevitable with no
ability for companies to defer or opt out. Some network operators wanted to retain
the GDPCR1 tax re-opener mechanism which operated to cover only changes arising
from one specific activity. These operators did not want any delay to changes in their
revenue from the proposed operation of the tax trigger for changes arising from
applying new accounting standards. They did not accept that our proposals dealt
equitably with any change in the accounting treatment of any specific item of
expenditure from the adoption of full EU-IFRS based financial statements.
Calibration of dead-band for the tax trigger
5.6. The majority of respondents preferred the DPCR5 basis, which is to calibrate the
trigger around a one per cent change in CT rate on base demand revenues. One
agreed with our proposals and suggested the trigger point is used as a threshold
which, when exceeded would trigger a full adjustment, not just the excess outside
the dead-band as proposed. One preferred no dead-band.
Period for spreading clawback of tax benefit
5.7. The majority of network operators and a consumer group agreed with the
proposal to clawback the tax benefit of excess gearing over the eight years of the
price control period (nine years for transmission including the rollover year). One
network operator was of the view that for regulatory consistency the period should
be five years. They considered that as the previous price controls were set for five
years it was implicit that the clawback should be over a similar period.
36 For the preparation of regulatory and statutory accounts 37 For accounting dates commencing on or after 1 July 2013 with early application allowed

Office of Gas and Electricity Markets 46
RIIO-T1 and GD1 Financial Issues March 2011
Timing of tax clawback adjustments
5.8. The majority of network operators agreed with our proposal to apply the
clawback of the tax benefit of excess gearing every three years, although two
considered it should be at the mid-period review of outputs.
Tax treatment of new incentives
5.9. Respondents did not agree with our proposals. They considered that, as there
are many incentive mechanisms, this would be too complex and that we should
retain the existing pre tax WACC for existing incentives. They also suggested that
there should be no retrospective changes to existing mechanisms.
Our decisions
Modelling tax under existing legislation or budget proposals
5.10. We will apply extant legislation together with the June 2010 and March 2011
Budget proposals to reduce CT rates and CAs. The Finance (No.2) Act 2010 enacted
the first proposed reduction in CT to 27 per cent. The Finance Bill 2011 (the Bill)38
was published on 31 March 2011 and preparers of business plans should take into
account all measures therein affecting their tax burden. These include:
the further reduction of one per cent in CT rates in each year, ie to 26 per
cent from 1 April 2012 and down to 23 per cent in 2014-15
the reduction in CA rates for the Special Rate pool to 8 per cent and 18 per
cent for the General pool from 1 April 2012
the retention of the existing tax treatment for leasing.
The Bill should have passed into legislation in time for initial proposals in 2012.
5.11. Where the changes to CT and CA rates proposed in the March 2011 and June
2010 Budget are not implemented, we will exclude the differences from the actual
rates from the tax trigger and treat them as a pass-through.
UK GAAP or IFRS
5.12. Our decision is to model tax under UK GAAP in 2013-14 and EU-IFRS from 1
April 2014. Delay in adopting EU-IFRS will fall within the scope of the tax trigger.
5.13. We will amend the regulatory accounts licence condition to require their
preparation under EU-adopted full IFRS from 1 April 2014, unless adoption is
delayed. We will specifically preclude applying the Financial Reporting Standard for
38 Finance Bill 2011: http://www.hm-treasury.gov.uk/finance_bill_2011.htm

Office of Gas and Electricity Markets 47
RIIO-T1 and GD1 Financial Issues March 2011
Small and Medium Enterprises for network operators, which under current ASB
proposals would be allowed for small companies with public accountability.
Calibration of dead-band for the tax trigger
5.14. We will calibrate the dead-band for the tax trigger around the greater of a one
per cent change in the CT rate or 0.33 per cent of base demand revenues. We have
done this as most GDNs currently have low levels of taxable profit and, we note that
going forward the transmission companies will likely see taxable profit reduced as a
result of the increased levels of investment.
Period for spreading clawback of tax benefit
5.15. We will spread the clawback of the tax benefit of excess gearing for TPCR4 over
nine years (spanning the one year price control rollover and the duration of RIIO-T1)
and for GDPCR1 over eight years. Previous price controls have usually been for five
years, with the occasional one-year control. While there may have been an
expectation that adjustments would be spread over five years as this has been the
normal price control period, we have made no explicit undertaking to spread the
clawback adjustment over any set period.
Timing of tax clawback adjustments
5.16. We will update and reset the clawback the tax benefit of excess gearing every
three years and spread any clawback over the following three years in line with our
proposals. We stated in the December 2010 proposals that the mid-period review is
not intended to be a full price control, but a strictly limited review of outputs.
Tax treatment of new incentives
5.17. We will calculate the tax treatment of new investment related incentives using
vanilla WACC after allowing for capital allowances. This applies where investment
drives changes in revenue. We will assume the costs are all in the special (long life)
pool unless energy network operators can provide evidence to the contrary. There
will be no retrospection for existing incentive mechanisms.
Business Rates
5.18. Only one respondent commented, agreeing with our proposals to retain the
existing treatment of business rates. We will retain that treatment - see appendix 4.

Office of Gas and Electricity Markets 48
RIIO-T1 and GD1 Financial Issues March 2011
6. Pensions
Chapter summary
This chapter summarises respondent's views to the options for the implementation of
our pension methodology. It sets out our decisions on how we will apply our
methodology in the context of RIIO-T1 and GD1.
Summary of decisions
6.1. Our decisions are to:
spread the true up adjustment of pension costs from previous controls over the
period of the next price control
require updated valuations as at 31 March 2011 and, if no company in a sector is
fast-tracked, 30 June 2012 to inform setting allowances
undertake an efficiency review, true up and reset allowances every three years
set a deficit funding rate of return based on benchmarking licensee's schemes
and to apply the same rate to true up within the RIIO period
set separate allowances for Pension Protection Fund (PPF) levies and scheme
administration costs and true up every three years subject to a de minimis
threshold.
Introduction
6.2. The methodology for RIIO-T1 and GD1 and our pension principles follows that
set out in our 22 June 2010 Pension paper39 and in the DPCR5 final proposals. The
detailed methodology is provided in appendix 6 and our principles (with updated
guidance notes providing additional clarification) in appendix 7.
Summary of responses
6.3. There were a number of issues on which we sought views. These were:
the timing of true up adjustments for existing controls and whether they should
be spread over the eight years of the RIIO price control
whether updated valuations for non fast-tracked companies should be the same
as fast-tracked companies, ie 31 March 2011 unless no network operator is fast-
tracked, in which case we would use updated valuations as at September 2012 in
time for final proposals
the basis for setting the deficit funding rate of return and whether it should be
derived from the range of benchmarked pre-retirement real discount rates
whether a similar discount rate should apply to true up adjustments
39 Price Control Treatment of Network Operators Pension Costs under Regulatory Principles (76/10) http://www.ofgem.gov.uk/Networks/Documents1/Price_Control_Treatment_of_Pension_Costs_final.pdf

Office of Gas and Electricity Markets 49
RIIO-T1 and GD1 Financial Issues March 2011
whether ex ante deficit funding allowances and the true up to date in a RIIO price
control period should be every three years rather than at the next eight year
price control
whether PPF levies should be part of benchmarked total costs
whether the revised guidance to our pension principles is comprehensive and
adequate for licensees and stakeholders to understand how the principles will be
applied in RIIO controls and for NWOs to prepare their business plan.
Spreading of true up adjustments
6.4. There was no consistency of views amongst respondents. Half preferred eight
years, although one believed we should set a de minimis limit below which, the true
up would not be made and, if above, spread it over the period of the next control.
Consumer groups supported using the period of the next price control. The other
network operators disagreed and consider that, as the previous price controls were
set for five years, it was implicit that the clawback should be over a similar period.
Timing of updated valuations
6.5. There was no consistency of view amongst respondents. Half suggested we
should use the latest full valuations on the basis that their deficit funding payments
match their scheme deficits. The remainder broadly agreed using the latest available
data, ie updated valuations, either March 2011 (or September 2012) as proposed.
Deficit funding rate of return
6.6. Only one network respondent agreed with our proposed rate of return and a
further one accepted it as their second choice. Four preferred a scheme specific
alternative to reflect the actual discount rate used by trustees and sponsors in
determining the deficit recovery plan at the last full valuation.
True up funding rate of return
6.7. Respondents had differing views. Two agreed with applying the same ex ante
rate. Two preferred the company's own cost of capital; one preferred vanilla WACC
as, in their view, those rates reflected compensation to investors for cashflow timing
differences. One respondent considered that, where a company funds a deficit at a
faster rate than our 15-year notional funding period, then we should use a company
specific rate to keep them revenue neutral on a NPV basis (as is our policy).
True up every three years or at next control
6.8. Respondents agreed that we should true up every three years as eight years
was too long a time to wait. One suggested this should be undertaken at the mid-
period review. An electricity network operator stated that the true up should also
take place at the end of the price control period. Respondents were also of the view
Office of Gas and Electricity Markets 50
RIIO-T1 and GD1 Financial Issues March 2011
that the timing of the true up should follow the timing of full triennial valuations,
should be consistent across other regulatory price controls with the associated
efficiency reviews undertaken at the same time. It was recognised that companies
have different dates for triennial valuations and therefore it is not possible to set a
common date that suits every company.
Treatment of PPF levies
6.9. None of the energy network operators agreed with our proposals. They
highlighted that these levies are not a controllable cost, that the future framework
for the levy is currently uncertain and the amounts are not adequately quantifiable.
Some emphasised that both the levies and pension scheme administration costs
relate increasingly to non-active scheme members. They also consider that the levies
are not part of ongoing pension costs as the bulk of charge is based on an
assessment of scheme assets. They propose a separate allowance with a true up
(subject to demonstrating that they have taken adequate steps to mitigate the
magnitude of the costs) or, as a pass through.
Revised guidance to our pension principles
6.10. There was broad support for the revised guidance although some considered
that significant changes have been made to accommodate RIIO. Energy network
operators requested greater clarity in some areas including the funding of
incremental liabilities; benchmarking of ongoing costs and the allocation of deficits
between established and incremental liabilities. On the latter, the Energy Networks
Association's (ENA) consultants reported on proposed amendments on our
consultant's40 proposals for monitoring, measuring and reporting movements in the
established and incremental deficits. Companies would also like greater transparency
in the approach to and the mechanics of the efficiency reviews; and how schemes
will be judged.
6.11. Non-network respondents did not address individual questions. Two
stakeholders suggested retained pension surpluses should be returned to consumers
on the same basis as they were funded.
6.12. A supply business suggested that to protect consumers, pension cost
assumptions should be set at the market median or five per cent below to take
account of the stable, low-risk position of network operators and a strong employer
covenant.
40 http://www.ofgem.gov.uk/Networks/Trans/PriceControls/RIIO-T1/ConRes/Documents1/EY%20pension%20deficit%20funding.pdf

Office of Gas and Electricity Markets 51
RIIO-T1 and GD1 Financial Issues March 2011
Our decisions
Spreading of true up adjustments
6.13. Our decision is to spread true up adjustments over the period of the next price
control, ie eight years for GDNs and, for transmission companies, nine years (being
the one year rollover and eight years of RIIO-T1). At the previous price controls
there may have been an expectation that adjustments would be spread over the
period of the next price control which, with the occasional one year control, had been
five years. That period is now eight years plus the rollover year for transmission
companies. We gave no explicit undertaking to spread the true up over any given
period; it was left open. We will use the appropriate vanilla WACC from the relevant
previous control to calculate NPV neutrality.
Timing of updated valuations
6.14. Our decision is that deficit funding allowances for the RIIO price controls will be
determined using the latest updated valuations. We require that all licensees provide
an update as at 31 March 2011 in their business plans. This will match the timing of
setting allowances for fast-tracked companies. If no company in a sector is fast-
tracked, we will request and use updated valuations from all companies in the sector
as at 30 June 2012 in order to base the allowances on the most recent data. We
consider that the merit in this treatment is that it does not disadvantage fast-tracked
companies.
6.15. We require that the updated valuations are based on the same actuarial
assumptions that were adopted in the previous full valuation, updated only for
changes in asset values and market conditions.
Deficit funding rate of return
6.16. We consider that a scheme specific rate based on the scheme's own recovery
plan, with a different period to our notional 15 years, may not be an efficient rate
and in the interest of consumers, without being subject to an efficiency review. For
that reason, our decision is to apply a funding rate of return derived from the range
of benchmarked pre-retirement real discount rates in licensee's schemes as
recommended by our consultants, Ernst & Young41. We will also test this rate against
data published by the Pensions Regulator in its annual Recovery plans - assumptions
and triggers document to ensure that it is not out of line with non-network
comparators.
41 Establishment of pension deficit funding rate of return - Report by Ernst & Young on behalf of Ofgem http://www.ofgem.gov.uk/Networks/Trans/PriceControls/RIIO-T1/ConRes/Documents1/EY%20pension%20deficit%20funding.pdf

Office of Gas and Electricity Markets 52
RIIO-T1 and GD1 Financial Issues March 2011
True up funding rate of return for RIIO controls
6.17. Our decision is to apply the same rate as used for funding deficits. We consider
that using the same rate as used to set allowances has the benefits of consistency,
symmetry and simplicity. Accordingly, we do not accept that either vanilla WACC or
the company's own cost of capital is appropriate.
True up every three years or at next control
6.18. Our decision is to undertake an efficiency review, true up and reset allowances
every three years within a price control. We do not intend to true up at the end of
the each price control period unless this coincides with the rolling three year true up
and reset cycle.
6.19. The efficiency review will be across all energy network operators, as with the
current review and be timed to coincide with the majority of their scheme's triennial
valuations as set out in the pension methodology at appendix 6.
Treatment of PPF levies and scheme administration costs
6.20. In DPCR5, we set ex ante allowances for PPF levies and scheme administration
costs with a true up for efficient costs. We did this as it was too late to include
ongoing pension costs, PPF levies and pension scheme administration costs within
the benchmarking of total cost for that price control. It was a pragmatic approach to
a DPCR5 specific issue in that our decision timetable did not allow time to redo the
benchmarking. At the time our view was that the amounts were not material. We
remain of that view.
6.21. The PPF have confirmed that they will to roll-out their new framework for levies
in 2012-13. Schemes will need to submit data to PPF under this framework on 31
March 2012.The PPF will review the levies and may amend them every three years.
6.22. Our decision is to set a separate allowance for the PPF levies and true up and
reset every three years, subject to review for efficiency. We will also follow this
approach for pension scheme administration costs. Both will be subject to a de
minimis threshold below which there will be no true up, which we will calibrate once
the business plans have been submitted and reviewed.
6.23. In our methodology at appendix 6 we have set out additional scenarios to
illustrate the application of our principles, including the impact of the review,
schemes moving into surplus and the three-year cycle of resetting allowances and
true up over the 15-year funding period.

Office of Gas and Electricity Markets 53
RIIO-T1 and GD1 Financial Issues March 2011
Deficit allocation methodology
6.24. We will maintain our policy of allocating deficits between established and
incremental elements. We will continue discussions with network operators and other
interested parties on the development of a common methodology which will be
applicable across all energy network operators. In our view, this will not impact on
the preparation of business plans. We will incorporate the methodology within the
individual sectors annual cost reporting regulatory instructions and guidance
documents once agreed.
Rate of return
6.25. We have benchmarked the pre-retirement real discount rate in network
operators' pension schemes. We have compared the results to the data published by
the Pensions Regulator (TPR) in its Recovery plans - assumptions and triggers42 to
ensure that it is not out of line with non-network comparators. The TPR report covers
recovery plans received up to 31 August 2010 from defined benefit (DB) PPF-eligible
schemes which were in deficit at their valuation. We have compared both their
Tranche 3 and 4 data. Although that data may not be strictly comparable it remains
a useful check.
Table 6.1 Pre-retirement real discount rates
All network operators schemes:
Lowest rate 1.9%
Median rate 2.6%
Highest rate 2.9%
6.26. The average rate for the network operator's schemes where a rate was given
is 2.5 per cent. The average rate reported by TPR for Tranche 3 is 2.99 per cent and
for Tranche 4 is 3.2 per cent. We conclude that using the median rate of 2.6 per cent
for network operators is reasonable and appropriate. We will review this rate when
all schemes have finalised their outstanding valuations and the efficiency review has
been updated.
Efficiency review
6.27. The Government Actuary's Department (GAD) has provided us with an early
draft report on the initial stage of their review. However, due to the incomplete
status of a number of schemes we have suspended the review. We issued an open
letter on this on 18 March 2011 which can be found on our website43.
42 http://www.thepensionsregulator.gov.uk/docs/recovery-plans-assumptions-triggers-2010.pdf 43 http://www.ofgem.gov.uk/Pages/MoreInformation.aspx?docid=124&refer=Networks

Office of Gas and Electricity Markets 54
RIIO-T1 and GD1 Financial Issues March 2011
6.28. We will recommence the review when most valuations have been finalised
which should be within 15 months of the valuation date of 31 March 2010.
6.29. A second stage in-depth review, if required, will take place after completion of
that updated initial report. Our intention is to complete that review in time for our
decision on whether any company should be considered for fast-tracking.
True up adjustment for over- and under- funding in TPCR4
6.30. We will commence the true up of TPCR4 pension payments during the rollover
year for transmission companies. As noted above, the period of recovery is spread
over the nine years of the rollover and RIIO price control period.
6.31. The adjustment to TPCR4 is split into two parts. One part is the amounts that
have been allowed in the indicative annual RAV calculations; this only applies to
NGET. The second is the amount expensed. The adjustment methodology is set out
in appendix 6 of this document.
6.32. To the extent that regulatory depreciation was foregone in TPCR4, we allow
additional revenue in TPCR4RO and RIIO-T1, with a net present value adjustment to
reflect the delay in revenues. The same approach is taken in respect of the amount
expensed, eg the cash amount in table 6.2 below. These are both funded in
TPCR4RO and RIIO-T1 spread equally over nine years.
6.33. The true up amounts shown in table 6.2 are provisional pending, in particular,
finalisation of the March 2010 valuations for NGET and NGG (both of which may
affect payment forecasts for the remainder of the TPCR4 period) and update of GAD's
review.
Table 6.2 Cash adjustment and amount included in closing TPCR4 RAV
6.34. The cash amount will all be adjusted through fast money spread evenly over
nine years. For NGET there is also an adjustment increasing closing RAV in line with
the policy applied in TPCR4.
£m (2009-10) Cash Additions to/
(clawback of)
closing RAV
National Grid Gas - TO 114.9 0.0
National Grid Gas - SO (1.2) 0.0
Scottish Power Transmission Ltd 1.8 0.0
Scottish Hydro Electric Power Transmission Ltd 2.9 0.0
National Grid Electricity Transmission - TO 8.2 2.4
National Grid Electricity Transmission - SO 5.3 1.1
Total 131.8 3.5

Office of Gas and Electricity Markets 55
RIIO-T1 and GD1 Financial Issues March 2011
True up adjustment for over- and under- funding in GDPCR
6.35. The true up adjustments for gas distribution networks in table 6.3 include the
adjustments for the one year price control 2007-08 which we published in September
200944. The amount is split between fast money and the amount added to RAV (slow
money).
6.36. To the extent that regulatory depreciation was foregone in GDPCR, we allow
additional revenue in RIIO-GD1, with a net present value adjustment to reflect the
delay in revenues. The same approach is taken in respect of the amount expensed,
eg the cash account in table 6.3 below. These are both funded in RIIO-GD1 spread
equally over eight years.
Table 6.3 Cash adjustment and amount included in closing GDPCR RAV
6.37. These adjustments are provisional and we will update this data when we have
received and reviewed the business plans and the efficiency review has been
concluded.
44 http://www.ofgem.gov.uk/Networks/GasDistr/GDPCR7-13/Documents1/Open%20letter%20to%20GDNs%20re%20pensions%20090909.pdf
£m (2009-10) Cash Additions/
(clawback) in
closing RAV
Northern Gas Networks (2.9) (0.6)
Scotia Gas Networks - Scotland 2.0 0.5
Scotia Gas Networks - Southern (6.0) (0.7)
Wales & West Utilities (3.8) (1.0)
NGG - East of England 1.8 0.2
NGG - London (0.4) (0.2)
NGG - North West 0.8 0.1
NGG - West Midlands 0.2 (0.1)
Total (8.4) (1.8)

Office of Gas and Electricity Markets 56
RIIO-T1 and GD1 Financial Issues March 2011
7. Regulatory Asset Value
Chapter summary
This chapter summarises respondents‟ views to the options for calculating the
regulatory asset value (RAV) and sets out our decisions on how we will calculate RAV
for RIIO-T1 and GD1.
Overview of decision
7.1. Our decisions are:
to adopt a total cost (totex) approach to RAV additions.
to calculate the percentage allocation of totex to RAV using an average of future
projected levels, validated by historical evidence.
that the definition of related parties will exclude captive insurance companies.
that GDNs will continue to retain the cash proceeds of disposals but this will be
reviewed at the next price control.
Summary of consultation proposals
7.2. In the December consultation paper we indicated that we would move to a totex
approach to establishing RAV additions. This followed the approach introduced for
DPCR5 where we add a fixed proportion of costs to the RAV, with the rest
remunerated in the year in which we expect the companies to incur them.
7.3. There were some issues upon which we sought views and these were:
how we should calculate the percentage of totex allowed into RAV
whether totex for RAV purposes should include repex, business support costs and
non operational capex
whether the definition of related parties should include captive insurance
companies
whether GDNs should continue to retain the cash proceeds of disposals for five
years in RAV and if so whether this should be extended to TOs and DNOs.
Summary of responses
7.4. The consultation respondents expressed no concerns about the principle of the
use of a totex approach for RAV additions but they were concerned about the
potential impact of the change in capitalisation approach (particularly with regard to
repex in RIIO-GD1) on cashflow and financeability. One respondent suggested that
the capitalisation approach disadvantaged shareholders.

Office of Gas and Electricity Markets 57
RIIO-T1 and GD1 Financial Issues March 2011
7.5. There was only one specific comment regarding calculation of the percentage of
totex allowed into RAV. That respondent agreed with the suggestion that we treat all
expenditure with an asset life of three years or less as fast money with the balance
as slow money and suggested this be used with the company forecast capitalisation
rates. They suggested that future forecast capitalisation rates were more appropriate
than historical rates which may be inappropriate if the mix of fast and slow
expenditure is changing. One respondent commented that the calculation should
recognise financeability constraints.
7.6. Five respondents (including two investors) disagreed with the proposal to treat
repex as 100 per cent capitalised in the calculation of the percentage of totex
allowed into RAV with another agreeing provided the overall capitalisation rate
reflected the current rate of capitalisation. This was said to be a major adverse
change, affecting revenues and impacting financing costs.
7.7. Four respondents agreed that totex for RAV purposes should include repex,
business support costs and non operational capex, with comment made that this will
help to equalise incentives and reduce boundary issues. Two GDNs expressed the
view that shrinkage and NTS exit charges should be excluded from totex. This is
because the items are considered to be outside of the direct control of GDNs and
should therefore be funded purely as pass-through costs.
7.8. Two respondents considered that captive insurance companies should be
excluded from the definition of related parties whilst one took the opposite view.
7.9. Three respondents felt that we should continue to allow retention of the
proceeds of asset disposals for five years in RAV with one suggesting this should be
extended to other price controls.
Our decision
7.10. We will adopt a totex approach to RAV additions as outlined in the December
strategy consultation. We will add a fixed proportion of costs to the RAV, with the
remainder remunerated in the year in which we expect the companies will incur
them. The percentage that we will add to the RAV will be set at the price control
review to strike a fair balance between existing and future consumers, in light of the
proportion of capex-like costs expected during the price control period. Our approach
will be consistent with our objective to equalise incentives between opex and capex
in the overall control.
7.11. Totex will broadly include all costs relating to licensees regulated activities,
with the exception of pension deficit repair payments relating to the established
deficit (which will be funded as fast money as set out in chapter 6), pass-through
costs, related party margins, some specific scheme exemptions (see appendix 7) and
some other minor exceptions.

Office of Gas and Electricity Markets 58
RIIO-T1 and GD1 Financial Issues March 2011
7.12. We will calculate the percentage allocation of totex to RAV by using a selection
of the information available to us:
We will treat all expenditure with an asset life of three years or less as fast
money with the balance as slow money. Within this approach, indirect costs
should follow the asset to which they relate.
We will use network company business plan projected capitalisation rates, using
an average over the eight-year business plan period.
We will review company capitalisation levels in their regulatory accounts over the
past and use the average capitalised as RAV additions as a check against future
forecasts.
7.13. Within this approach we will use an average of future projected levels of
capitalisation, validated by historical evidence. This will enable us to have regard for
the implications of changing levels of capex programmes.
7.14. Where in a well-justified business plan network operators make a case for
technical innovation but with assets having lives slightly longer than three years we
will consider inclusion of such expenditure as fast money.
7.15. We recognise that respondents are concerned about the impact of any
capitalisation change (in particular the treatment of repex). We also note that the
change in depreciation treatment will offset this to a large extent. However, if this
treatment causes any financeability concerns, we will apply transitional
arrangements. Our intention is to complete the transition over one price control
subject to any financeability restrictions.
7.16. Respondents were in favour of the outlined approach that for RAV addition
purposes totex will include the following types of spend:
Repex
Non operational capex
Business support costs
7.17. As outlined in appendix six of the strategy consultation document, the
definition of totex for RAV purposes will exclude all pass-through costs. This includes
Ofgem licence fees and NTS exit costs. For the full definition see appendix 7.
7.18. We describe in Chapter 4 of the RIIO-T1 and GD1 Business plans,
proportionate treatment, innovation and efficiency incentives, the approach to the
implementation of the efficiency incentives, including the interactions with the RAV.

Office of Gas and Electricity Markets 59
RIIO-T1 and GD1 Financial Issues March 2011
7.19. The calculation of the net additions to the RAV will reflect two parameters
which will be set at the price control review:
first, the efficiency incentive rate. The higher the efficiency incentive rate, the
smaller the proportion of any overspend that is passed on to consumers,
including through net additions to the RAV
second, the fixed percentage of totex to be added to the RAV. This is discussed
above and effectively determines the extent to which adjustments made in light
of actual totex are split between fast and slow money.
7.20. This approach will affect our definition of totex in that we will treat the portion
of costs that consumers and licensees share as totex. This means that:
where companies overspend, the actual spend less the amount shared will be
treated as totex and;
where companies underspend, the actual spend plus the amount shared will be
treated as totex.
7.21. Table 7.1 below illustrates this approach, where the RAV additions rate is 80
per cent and the efficiency sharing factor is 50 per cent.
Table 7.1 Illustration of the impact of the sharing mechanism on RAV
additions
7.22. Future incentive schemes are expected to operate on a totex into RAV basis.
Clarification will be provided as each scheme is developed.
7.23. The definition of related parties will exclude captive insurance companies whilst
not allowing any excess losses (to the extent that they are covered by captive
insurers) to be funded by customers. This protects consumers whilst allowing
network operators to act in an efficient manner.
7.24. We will continue to allow GDNs to retain the cash proceeds of disposals for five
years in RAV and will review this incentive at the next price control. The evidence on
the effectiveness of this incentive is inconclusive at this time and we will not,
therefore, extend it to cover TOs.
Forecast at price control
Totex allowance £100
Assumed RAV additions £80 80%
Actual reported in period
Actual totex costs £150
Sharing amount £25
Totex post sharing £125
RAV additions £100 80%

Office of Gas and Electricity Markets 60
RIIO-T1 and GD1 Financial Issues March 2011
Regulatory Asset Values as at 31 March 2010
7.25. The RAV values shown below in tables 7.2, 7.3 and 7.5 are those that we will
use for the opening value of the RAV in the financial model. They have been
prepared using the actual costs as reported but remain provisional pending any
efficiency review that may be carried out as part of the RIIO process.
7.26. The RAV values for the transmission operators showing the movements from
the TPCR4 Final Proposals document45 are:
Table 7.2 Transmission Operators RAV as at 31 March 2010
7.27. The RAV values for the transmission system operators are:
Table 7.3 System Operators RAV as at 31 March 2010
7.28. There is some expenditure for the transmission operators that is not yet
reflected in the RAV values at 31 March 2010. The provisional values are summarised
below:
45 Transmission Price Control: Final Proposals December 2006 (ref 206/06)
2004-05 prices £m
Opening
RAV 1st
April 2004
Net
AdditionsDepreciation
Closing RAV
31st March
2010
Uplifted to
2009-10
prices
NGET 5,042 3,273 (2,269) 6,046 6,934
SHTL 233 209 (98) 345 396
SPTL 575 547 (366) 757 868
NGG 2,424 1,648 (577) 3,496 4,009
Total 8,274 5,678 (3,309) 10,643 12,206
2004-05 prices £m
Opening
RAV 1st
April 2006
Net
AdditionsDepreciation
Closing RAV
31st March
2010
Uplifted to
2009-10
prices
NGET 43 52 (34) 61 70
NGG 40 32 (39) 33 37
Total 84 84 (74) 94 107

Office of Gas and Electricity Markets 61
RIIO-T1 and GD1 Financial Issues March 2011
Table 7.4 Transmission Operators - capex not yet in RAV at 31 March 2010
7.29. The values for the gas distribution companies showing the movement from
those shown in the GDPCR1 Final Proposals46:
Table 7.5 GDN RAV as at 31 March 2010
7.30. These values exclude the element of capex spend that relates to the Fuel Poor
scheme. The value of the necessary adjustment under this scheme will only be
available at the end of GDPCR1.
46 Gas Distribution Price Control Review: Final Proposals Document Supplementary Appendices
2009-10 prices £m TIRG TOI
Items
treated as
logged up
Revenue
driverTotal
NGET 82 13 63 211 368
SPTL 98 0 14 0 113
SHTL 17 9 0 0 25
NGG 0 0 107 316 423
Total 196 22 184 526 928
2005-06 prices £m
Opening
RAV 1st
April 2008
Net
AdditionsDepreciation
Closing RAV
31st March
2010
Uplifted to
2009-10
prices
Northern Gas 1,340 113 (94) 1,360 1,519
Scotland 973 139 (65) 1,046 1,169
Southern 2,245 310 (159) 2,396 2,677
Wales & West 1,235 174 (86) 1,323 1,478
East of England 2,182 168 (156) 2,194 2,452
London 1,241 211 (89) 1,363 1,523
North West 1,410 148 (99) 1,459 1,630
West Midlands 1,090 118 (78) 1,130 1,263
Total 11,716 1,381 (826) 12,271 13,711
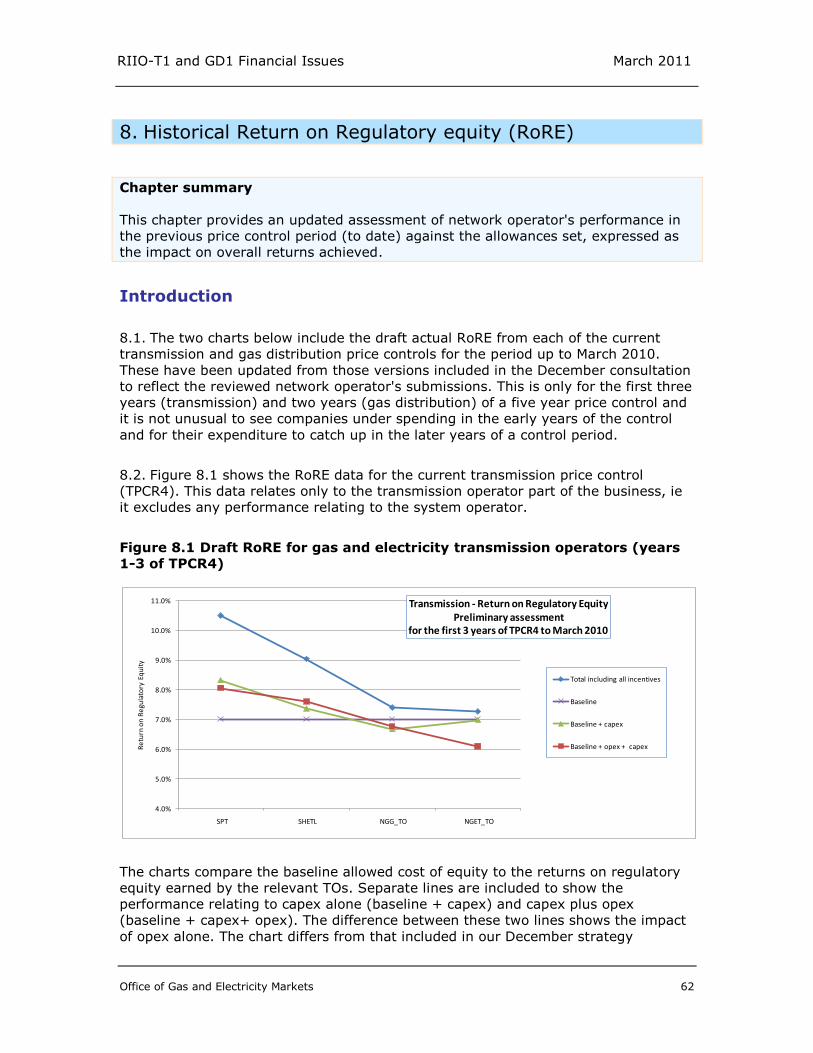
Office of Gas and Electricity Markets 62
RIIO-T1 and GD1 Financial Issues March 2011
8. Historical Return on Regulatory equity (RoRE)
Chapter summary
This chapter provides an updated assessment of network operator's performance in
the previous price control period (to date) against the allowances set, expressed as
the impact on overall returns achieved.
Introduction
8.1. The two charts below include the draft actual RoRE from each of the current
transmission and gas distribution price controls for the period up to March 2010.
These have been updated from those versions included in the December consultation
to reflect the reviewed network operator's submissions. This is only for the first three
years (transmission) and two years (gas distribution) of a five year price control and
it is not unusual to see companies under spending in the early years of the control
and for their expenditure to catch up in the later years of a control period.
8.2. Figure 8.1 shows the RoRE data for the current transmission price control
(TPCR4). This data relates only to the transmission operator part of the business, ie
it excludes any performance relating to the system operator.
Figure 8.1 Draft RoRE for gas and electricity transmission operators (years
1-3 of TPCR4)
The charts compare the baseline allowed cost of equity to the returns on regulatory
equity earned by the relevant TOs. Separate lines are included to show the
performance relating to capex alone (baseline + capex) and capex plus opex
(baseline + capex+ opex). The difference between these two lines shows the impact
of opex alone. The chart differs from that included in our December strategy
4.0%
5.0%
6.0%
7.0%
8.0%
9.0%
10.0%
11.0%
SPT SHETL NGG_TO NGET_TO
Re
turn
on
Re
gula
tory
Eq
uit
y
Transmission - Return on Regulatory Equity Preliminary assessment
for the first 3 years of TPCR4 to March 2010
Total including all incentives
Baseline
Baseline + capex
Baseline + opex + capex

Office of Gas and Electricity Markets 63
RIIO-T1 and GD1 Financial Issues March 2011
consultation as we have now incorporated the estimated impact of outperformance
on TIRG. The results represent our initial estimate of this outperformance and we will
work together with the Transmission Operators to refine the approach.
8.3. Figure 8.2 shows the RoRE data for the current gas distribution price control
(GDPCR1).
Figure 8.2 Draft RoRE for gas distribution operators (years 1 and 2 of
GDPCR1)
8.4. The charts compare the baseline allowed cost of equity to the returns on
regulatory equity earned by the relevant Network Operators. Separate lines show the
performance relating to repex (baseline + repex) and repex, capex and opex
(baseline + repex + capex+ opex).
8.5. This shows that operators have in general made limited improvements in the
repex spend (with the exception of Northern Gas who have deferred a Local
Transmission System project) and more significant returns when opex and capex are
taken into account. All companies have also benefited from interest rate and tax
differentials compared to the price control allowances.
4.0%
5.0%
6.0%
7.0%
8.0%
9.0%
10.0%
11.0%
12.0%
13.0%
Northern Wales & West West Midlands
(NGG)
Southern (SGN)
Total Scotia Gas
Total National Grid Gas
Scotland (SGN)
North West (NGG)
East of England (NGG)
London (NGG)
Re
turn
On
Re
gula
tory
Eq
uit
y
Gas Distribution - Return on Regulatory Equity Preliminary assessment
for price control to March 2010
Total including all imcentives
Baseline + opex + capex + repex
Baseline + repex
Baseline

Office of Gas and Electricity Markets 64
RIIO-T1 and GD1 Financial Issues March 2011
Appendices
Appendices
Index
Appendix Name of Appendix Page Number
1 Financial issues summary of responses 65
2 Asset lives and depreciation 78
3 Mechanism for equity issuance costs allowance 83
4 Tax methodology 85
5 Tax trigger 91
6 Pension methodology 96
7 Price control pension principles under RIIO 109
8 RAV methodology 118

Office of Gas and Electricity Markets 65
RIIO-T1 and GD1 Financial Issues March 2011
Appendices
Appendix 1 - Financial issues summary of responses
Responses received by Ofgem which were not marked as being confidential have
been published on Ofgem‟s website www.ofgem.gov.uk. Copies of non-confidential
responses are also available from Ofgem‟s library.
The following is a summary of those responses which were received.
Chapter Two – Asset lives and depreciation
Chapter: Two
Question 1: Do you agree with our proposed economic asset lives for gas
and electricity transmission and gas distribution?
Gas and electricity transmission
1.1. Two respondents agreed with our asset life range and fully supported our
proposals to use economic asset lives. A number of respondents considered that,
taken by itself, equalising regulatory asset lives with economic lives was not an
unreasonable proposition and that current regulatory asset lives do not currently
reflect expected economic lives. One network operator and one other respondent
acknowledged that there was a strong case for the reform of networks financing.
1.2. A number of network operators suggested that there were problems with
extending asset lives (or estimating expected economic lives) at a time of
considerable uncertainty about the long-term future of energy networks. One
network operator considered it prudent to use economic asset lives of no more than
40 years.
1.3. One network operator suggested that we had failed to sufficiently demonstrate
why existing regulatory asset lives needed to be change and why the principle of
economic asset lives should be used. Another network operator stated that
regulatory asset lives are not the same as statutory or economic asset lives and that
they are a complex financial instrument.
1.4. Several network operators commented on the impact of short life technology
assets and embedded generation would have a material impact on the average
technical lives and stated that they did not believe that the proposed asset life range
was reflective of the future network asset life.
1.5. A number of network operators have suggested that the analysis in the report
was nationally based and was not representative of regional networks. Furthermore
that the MEAV used to calculate the overall average gives undue weight to tower
foundations, which have the longest technical lives.

Office of Gas and Electricity Markets 66
RIIO-T1 and GD1 Financial Issues March 2011
Appendices
1.6. A number of respondents observed that our proposals would remove costs from
the current generation of consumers who had already benefited from pre-vesting
discounts and increase costs for future generations.
1.7. A number of respondents commented that most of the examples quoted from
other jurisdictions were not relevant due to the inherent nature of those jurisdictions.
1.8. In respect of gas transmission, National Grid suggested that the front-end
loading of depreciation being applied to gas distribution should also apply to gas
transmission.
Gas Distribution
1.9. One network operator agreed with the basic tenet of our proposal that gas
distribution network has an asset life of at least 45 years whilst recognising that
there remained some uncertainty over the utilisation of the networks in the longer-
term.
1.10. A number of the network operators suggested lower asset lives, ranging from
20 to 40 years based on restoring cashflows lost by the repex proposals.
1.11. One network company suggested that the absence of certainty was precisely
the reason why asset lives should be reduced. In deferring this decision the current
proposals increased the risk to future customers (who will be reduced in numbers) of
higher per unit charges. Front loading depreciation was also offered as a way of
mitigating these risks.
1.12. One network company suggested exactly the opposite noting that all credible
forecast models currently anticipate significant usage of gas until 2050 so agreed to
continue with asset lives of 45 years.
Repex
1.13. There were some comments that changing the treatment of repex would run
counter to investors legitimate expectations and that it would defer substantial
amounts of cash into later price controls.
1.14. One network operator observed that the 50/50 split on repex had been
introduced for financeability reasons and quoted the 2002 price control. They also
stated that Ofgem had acknowledged that the primary purpose of the programme
was for current customers as it was introduced for safety reasons. They argued that
they could see no justification for placing a greater cost burden on future customers.
1.15. Network companies and investors tended to focus on the cash flow implications
of the change in replacement expenditure (repex) treatment with a focus on

Office of Gas and Electricity Markets 67
RIIO-T1 and GD1 Financial Issues March 2011
Appendices
restoring their cash position through a combination of reducing asset life - 20 years,
30 years and 40 years and/or extending the use of a front-end loaded depreciation
profile.
Chapter: Two
Question 2: Do you agree with our proposals for the depreciation profile?
Electricity and gas transmission
1.16. There was explicit agreement from almost all the respondents that a straight
line profile should be retained. They suggested a back-loaded profile would not be
equitable.
Gas Distribution
1.17. Almost all the network operators suggested that front loading of the
depreciation profile should be extended to all post 2002 assets due to the
uncertainties over the future of the gas network.
1.18. One network operator and two other respondents suggested it was premature
to justify accelerating depreciation and more clarity would exist in 2021.
Chapter: Two
Question 3: We invite views on our proposed approach to transition.
Electricity and Gas transmission
1.19. The transitional arrangements proposals were generally welcomed by most
respondents. Respondents were keen that these proposals were kept as open and
flexible as possible.
1.20. A number of different proposals were put forward for transitional arrangements
from various network operators: applying the new asset lives to new assets only (for
regulatory consistency purposes); transition periods of more than one price control
would be needed; and, an increase in the cost of capital would be needed to
compensate for the increased uncertainties of the cash flows.
1.21. Two respondents were of the view that the onus was on network operators to
demonstrate the need for transitional arrangements. They were not convinced of the
need for transitional arrangements as alternative ways of managing cashflows such
as equity injections existed.
Gas distribution
1.22. As for transmission, a number of different proposals were put forward for
transitional arrangements from various network operators: applying the new asset

Office of Gas and Electricity Markets 68
RIIO-T1 and GD1 Financial Issues March 2011
Appendices
lives to new assets only (for regulatory consistency purposes); transition periods of
more than one price control would be needed; an increase in the cost of capital
would be needed to compensate for the increased uncertainties of the cash flows;
and, changing the fast/slow money split to increase the level of fast money.
Chapter Three - Allowed return
Chapter: Three
Question 1: Is our approach for setting the allowed return appropriate,
particularly in the context of an eight-year price control?
1.23. Network companies generally agreed that a WACC-based approach to setting
the allowed return was appropriate. A number of companies had concerns about the
innovations introduced in the RIIO model - particularly relating to the cost of debt
index.
Chapter: Three
Question 2: What impact do our proposals for RIIO-T1 and GD1 have on the
companies' cashflow risk, and does this have a material impact on how
the allowed return should be set?
1.24. Network companies pointed out that the move from one regulatory approach
(RPI-X) to a new one (RIIO) increases regulatory risk and uncertainty. Some
companies also argued that the RIIO proposals themselves increased risk to the
companies and investors. This was particularly due to longer duration of cash flows
for both electricity TOs and for GDNS, although cost of debt indexation and greater
emphasis on outputs and incentives were also deemed to reduce upside for
investors. Both network companies and investors strongly argued that these changes
required a higher cost of equity assumption.
1.25. Some network companies and investors considered that lengthening the price
control period to eight years would be positive for the companies and investors -
allowing the companies to focus on running their businesses.
Chapter: Three
Question 3: What considerations do we need to take into account when
setting the notional gearing level?
1.26. Network companies' main focus was on ensuring that notional gearing is tested
against downside scenarios, such that investment grade credit ratings are
maintained throughout the price control period. One network company stressed that
gearing should be set following discussions with investors and credit rating agencies.
One company suggested what its own gearing should be.
1.27. One investor response noted that setting a sector-wide notional gearing, as
Ofgem has traditionally done, has encouraged network companies to take short-term

Office of Gas and Electricity Markets 69
RIIO-T1 and GD1 Financial Issues March 2011
Appendices
decisions, increasing risk and having a detrimental effect on consumers. As such, the
possibility of setting company-specific notional gearing was seen as a positive. In
contrast, one supplier argued that there was no reason to depart from setting sector-
wide notional gearing, especially since it would only have a small impact on the
vanilla WACC.
Chapter: Three
Question 4: Is our proposed approach to setting the notional equity wedge
appropriate?
1.28. A number of network companies argued that the proposed approach was not
sufficiently developed for them to comment on. On the whole, both network
companies and investors were strongly against the suggestion that equity issuances
may be needed to address short-term shortfalls in credit metrics. However, one
investor and one credit rating agency noted that equity issuances are reasonable
given the size of the investment programme expected during the next price control
period. The investor also noted that the shift to longer asset lives should underpin
long-term equity commitment.
Chapter: Three
Question 5: Is our proposed mechanism for indexing the cost of debt
assumption appropriate?
1.29. TOs and GDNs were predominantly against indexation and preferred a fixed
allowance, with a few exceptions. DNOs were wholly against indexation. With the
exception of one investor, investors were strongly against indexation.
1.30. The main arguments raised by network companies and investors with regard to
the index were:
That it increases risk by reducing companies' ability to hedge against the index in
order to ensure that they do not underperform it.
That it substantially reduces the scope for outperformance on the cost of debt,
which should be compensated for elsewhere in the settlement.
That it could encourage sub-optimal company behaviour, such as tracking the
index, or issuing bonds of a specific tenor.
That the proposed Bloomberg data series is unrepresentative of the networks and
is based on a non-transparent methodology that makes it difficult to predict.
That the proposed 10-year maturity index does not reflect the long-term nature
of bonds issued by network companies and is inconsistent with the move to
extend regulatory asset lives.
That the proposed index does not account for debt issuance and liquidity
management costs.
As proposed, the index design fails to account for new issue premia on bond
coupons, and for the inflation risk premium on non index-linked bonds.

Office of Gas and Electricity Markets 70
RIIO-T1 and GD1 Financial Issues March 2011
Appendices
1.31. In addition, some network companies argued for longer or shorter trailing
averages, while some also argued for weighted averages to be used.
1.32. Consumer representatives and suppliers were strongly in favour of indexation,
noting that it would protect both the companies and consumers against future
movements in the cost of debt. It was argued that indexation could lower the cost of
capital for network companies by reducing their exposure to movements in the cost
of debt. The removal of "headroom" in the cost of debt allowance was also seen to
save consumers £50-100m per year.
Chapter: Three
Question 6: How should we account for the costs of issuing debt?
1.33. Network companies noted that debt issuance incurs material costs such as
broker fees, legal fees, rating agency costs, new issue premium and loan facility
commitment fees. According to network companies these costs summed up to a
range of 30-80bps, which should be added on top of the index.
1.34. Network companies also argued that past outperformance of the index cannot
be assumed for the future and that they should not be penalised for outperforming
the index in the past by not being given an allowance for issuance costs.
1.35. One network company argued that there is an inconsistency between our
proposed approach to set a specific allowance for the cost of issuing equity, but not
make an explicit allowance for the cost of issuing debt.
1.36. One supplier argued that there was no need to make an additional allowance
for the cost of issuing debt.
Chapter: Three
Question 7: Is our range for the equity beta appropriate for the network
companies? What factors might mean that we should use different equity
betas for the different sectors and/or companies within a sector?
1.37. Responses addressed only the first part of the question, mainly questioning
Europe Economics' methodology or seeking a higher equity beta to account for their
perception that risk has increased for RIIO-T1 and GD1. One supplier argued that the
equity beta is likely to be lower than suggested by our range. Another supplier
suggested that beta should be 0.7 or lower.
Office of Gas and Electricity Markets 71
RIIO-T1 and GD1 Financial Issues March 2011
Appendices
Chapter: Three
Question 8: Does our overall range for the cost of equity correctly capture
probable risk for RIIO-T1 and GD1?
1.38. Both network companies and investors strongly criticised the bottom end of our
cost of equity range (4.0-7.2 per cent). In general, network companies and investors
sought a cost of equity set at the top of our proposed range or above it. Investors in
particular sought the opportunity to earn double-digit returns on equity and some
questioned whether this would be possible even with the cost of equity set at the top
end of our range. Network companies presented analysis by Oxera that estimated
the cost of equity range at 5.1-7.5 per cent, with focus on the upper end.
1.39. Network companies also questioned the assumptions regarding the CAPM
components of the cost of equity. They argued that Europe Economics' analysis relied
on recent market data that has been distorted as a result of the financial crisis and,
thus, would not be representative of the next price control period.
1.40. A consumer representative argued that Europe Economics presented a more
robust range (4.2-5.6 per cent) that was consistent with the Competition
Commission's approach. Both the consumer representative and one supplier claimed
that the upper end of our equity risk premium range (4.0-5.5 per cent) was not
supported by regulatory precedent and or the claim of economic uncertainty.
Chapter: Three
Question 9: Is the ex ante approach to the cost of raising equity, with a
true-up at the next price control review appropriate for RIIO-T1 and
GD1?
1.41. Network companies largely supported the proposed approach of setting an ex
ante allowance, with a true-up. There was a range of views regarding the appropriate
timing of the true-up: one TO sought a single true-up at the end of the price control
period, one network company proposed carrying out true-ups at the mid-period
review and at the end of the price control, and one GDN sought annual true-ups.
1.42. Five per cent was generally deemed an acceptable allowance, although some
network companies sought a higher allowance, with one DNO suggesting that the
allowance should be reviewed in light of the financial crisis.
1.43. One GDN argued that it was more appropriate for investors, rather than
consumers, to bear the risk of equity issuance costs.

Office of Gas and Electricity Markets 72
RIIO-T1 and GD1 Financial Issues March 2011
Appendices
Chapter Four - Assessing financeability
Chapter: Four
Question 1: Have we identified the correct equity and credit metrics?
1.44. Network company responses stressed that they believe there is a need to
include a measure of dividend payments as part of the financeability testing. They
also noted the different approaches adopted by different credit rating agencies and,
therefore, the need to expand the credit metrics used. Some companies questioned
the use of PMICR, noting that it is insensitive to, for example, changes in asset lives
or repex capitalisation. One credit rating agency wrote that we used an incorrect
definition for PMICR.
Chapter: Four
Question 2: Do the rating agency levels quoted provide the most appropriate
levels?
Some network companies suggested that the financeability tests should target
achieving credit ratios consistent with ratings in the upper end of our range.
Chapter: Four
Question 3: We invite views on the approach to assessing the appropriate
level of notional gearing.
1.45. One response noted that, to provide transparency to investors, annual RAV
figures should be published.
Chapter Five - Taxation
Chapter: Five
Question 1: Do you agree with modelling tax based on the proposals in the
June 2010 Budget?
1.46. The majority of respondents agreed with modelling tax based on the June 2010
Budget, ie reduction in corporation tax (CT) rates over time to 24 per cent and to the
rates of capital allowances (CA) for the special rate (long life) and general plant and
machinery pools. Respondents proposed that if the outturn rates differed from the
proposals that any differences should be treated as pass through in the tax trigger
mechanism. There was some support for using the June 2010 Budget tax rates with
the DPCR5 type tax trigger and dead-band and for the option of using extant rates
with any changes to CT and CA rates treated as a pass-through.
Office of Gas and Electricity Markets 73
RIIO-T1 and GD1 Financial Issues March 2011
Appendices
Chapter: Five
Question 2: Do you agree with modelling tax under UK GAAP pending
adoption of IFRS reporting with any changes to be subject to the tax
trigger?
1.47. The majority of respondents considered that the mandatory adoption of
International Financial Reporting Standards47 proposed by the Accounting Standards
Board (ASB) in FRED43, effective from 1 July 201348, was inevitable with no ability
for companies to defer or opt out. Some network operators wanted to retain the
GDPCR1 tax re-opener mechanism which operated to cover only changes arising
from one specific activity. They do not want any delay to changes in their revenue
from the proposed operation of the tax trigger for changes arising from applying new
accounting standards. They did not accept that our proposals dealt equitably with
any change in the accounting (and consequent tax) treatment of any specific item of
expenditure from the adoption of full EU-IFRS based financial statements during the
price control period.
Chapter: Five
Question 3: Views are invited on the size of the dead-band for the tax
trigger?
1.48. The majority of respondents preferred the DPCR5 basis, which is to calibrate
the trigger around a one per cent change in CT rate on base demand revenues. One
agreed with our proposals and suggested the trigger point is used as a threshold
which, when exceeded would trigger a full adjustment, not just the excess outside
the dead-band as proposed. One preferred no dead-band.
Chapter: Five
Question 4: Do you agree that clawback of the tax benefit of excess gearing
in TPCR4 and GDPCR1 should be spread over the 8 years of the RIIO
price control? If not, which alternative option do you prefer?
1.49. The majority of network operators and a consumer group agreed with the
proposal to clawback the tax benefit of the excess gearing over the eight years of the
price control (nine years for transmission including the rollover year). One network
operator was of the view that for regulatory consistency the period should be five
years. They consider that as the previous price controls were set for five years that it
was implicit the clawback should be over a similar period.
Chapter: Five
Question 5: Do you agree that clawback of the tax benefit of excess gearing
should be updated every three years during the price control period?
47 For the preparation of regulatory and statutory accounts 48 For accounting dates commencing on or after 1 July 2013 with early application allowed

Office of Gas and Electricity Markets 74
RIIO-T1 and GD1 Financial Issues March 2011
Appendices
1.50. The majority of network operators agreed with our proposal, although two
considered it should be at the mid-period review of outputs.
Chapter: Five
Question 6: Do you agree that the tax treatment of incentives should be
calculated using vanilla WACC?
1.51. Respondents did not agree with our proposals. They considered that, as there
are many incentive mechanisms, this would be too complex and that we should
retain the existing pre tax WACC for existing incentives. They also suggested that
there should be no retrospective changes to existing mechanisms.
Chapter Six- Pensions
Chapter: Six
Question 1: Do you agree that the timing of true up adjustments for existing
controls should be spread over the eight years of the RIIO price control?
If not, which alternative option do you prefer?
1.52. There was no consistency of views amongst respondents. Half preferred eight
years, although one believed we should set a de minimis limit below which the true
up would be allowed in the first year of the next control and, if above, spread over
the period of the next control. Consumer groups supported the period of the next
price control. The other network operators disagreed. They consider that, as the
previous price controls were set for five years, it was implicit that the clawback
should be over a similar period.
Chapter: Six
Question 2: Do you agree that updated valuations for non fast-tracked
companies should be the same as fast-tracked companies, ie 31 March
2011 unless no network company is fast-tracked, in which case updated
as at September 2012 in time for final proposals?
1.53. There was no consistency of view amongst respondents. Half suggested we
should use the latest full valuations on the basis that their deficit funding payments
matches their schemes deficits. The remainder broadly agreed using the latest
available data, ie updated valuations, either March 2011 (or September 2012) as
proposed.
Chapter: Six
Question 3: Do you agree that the deficit funding rate of return should be
derived from the range of benchmarked pre-retirement real discount
rates? If not, which alternative option do you prefer?
1.54. Only one network respondent agreed with our proposed rate of return and a
further one accepted it as their second choice. Four preferred a scheme specific

Office of Gas and Electricity Markets 75
RIIO-T1 and GD1 Financial Issues March 2011
Appendices
alternative to reflect the actual discount rate used by trustees and sponsors in
determining the deficit recovery plan at the last full valuation.
Chapter: Six
Question 4: Do you agree that same rate should apply to the calculation of
the net present value of the ex post true up adjustments?
1.55. Respondents have differing views. Two agreed to apply the same ex ante rate
while two preferred the company's own cost of capital; and one, post tax vanilla
WACC as, in their view, those rates reflected compensation to investors for cash-flow
timing differences. One respondent considers that, where a company funds a deficit
faster than our 15-year notional funding period, then we can only use a company
specific rate to keep them revenue neutral on a NPV basis (as is our policy).
Chapter: Six
Question 5: Do you agree that ex ante deficit funding allowances and the
true up to date in a RIIO price control period should be every three years
rather than truing up at the next eight-year price control?
1.56. Respondents agreed that we should true up every three years as eight years
was too long a time to wait. One suggested this should be undertaken at the mid-
period review. An electricity network operator stated that the true up should also
take place at the end of the price control period. Respondents were also of the view
that the timing of the true up should follow the timing of full triennial valuations; and
should be consistent across other regulatory price controls and the associated
efficiency reviews undertaken at the same time. It was recognised that companies
have different dates for triennial valuations and therefore it is not possible to set a
common date that suits every company.
Chapter: Six
Question 6: Do you agree that PPF levies should be part of benchmarked
total costs? If not, which should be the alternative option?
1.57. None of the energy network operators agreed with our proposals. They
highlighted that these levies are not a controllable cost, that the future framework
for the levy is currently uncertain and the amounts not adequately quantifiable.
Some emphasised that both the levies and pension scheme administration costs
relate increasingly to non-active scheme members. They also consider that the levies
are not part of ongoing pension costs as the bulk of the charge is based on an
assessment of scheme assets. They propose a separate allowance with a true up
(subject to demonstrating that they have taken adequate steps to mitigate the
magnitude of the costs) or, as a pass through.

Office of Gas and Electricity Markets 76
RIIO-T1 and GD1 Financial Issues March 2011
Appendices
Chapter: Six
Question 7: We invite views on whether the revised guidance to our pension
principles is comprehensive and adequate for licensees and stakeholders
to understand how the principles will be applied in RIIO controls and for
network companies to prepare their business plan?
1.58. There was broad support for the revised guidance although some considered
that significant changes have been made to accommodate RIIO. Energy network
operators requested greater clarity in some areas including the funding of
incremental liabilities; benchmarking of ongoing costs and the allocation of deficits
between established and incremental liabilities. On the latter, the Energy Networks
Association's consultants reported on proposed amendments on our consultant's49
proposals for monitoring, measuring and reporting movements in the established and
incremental deficits. Companies would also like greater transparency in the approach
to and the mechanics of the efficiency reviews; and how schemes will be judged.
1.59. Non-network respondents did not address individual questions. Two
stakeholders suggested retained pension surpluses should be returned to consumers
on the same basis as they were funded.
1.60. A supply business suggested that to protect consumers, pension cost
assumptions should be set at the market median or five per cent below to take
account of the stable, low-risk position of network operators and a strong employer
covenant.
Chapter Seven - Regulatory Asset Value
Chapter: Seven
Question 1: How should we calculate the percentage of totex allowed into
RAV?
1.61. Respondents to the consultation expressed no concerns about the principle of
using a totex approach for RAV additions but they were concerned about the
potential impact of the change in capitalisation approach (particularly with regard to
repex) on cashflow and financeability. One respondent suggested that the proposed
capitalisation approach disadvantaged shareholders.
1.62. There was only one specific comment regarding the calculation of the
percentage of totex allowed into RAV. That respondent agreed with the suggestion
that we treat all expenditure with an asset life of three years or less as fast money
(with the balance as slow money) and suggested this be used with the company
forecast capitalisation rates. They suggested that future forecast capitalisation rates
were more appropriate than historical rates which may be inappropriate if the mix of
49 http://www.ofgem.gov.uk/Networks/Trans/PriceControls/RIIO-T1/ConRes/Documents1/EY%20pension%20deficit%20funding.pdf

Office of Gas and Electricity Markets 77
RIIO-T1 and GD1 Financial Issues March 2011
Appendices
fast and slow expenditure is changing. One respondent commented that the
calculation should recognise financeability constraints.
Chapter: Seven
Question 2: The proposed totex approach includes repex, business support
costs and non-operational capex as part of totex.
1.63. Five respondents (including two investors) disagreed with the proposal to treat
repex as 100 per cent capitalised in the calculation of the percentage of totex
allowed into RAV with another agreeing provided the overall capitalisation rate
reflected the current rate of capitalisation. This was said to be a major adverse
change, affecting revenues and impacting financing costs.
Chapter: Seven
Question 3: We invite views on whether totex should include:
a) Repex
b) Business support costs
c) Non Operational capex
1.64. Four respondents agreed that totex for RAV purposes should include repex,
business support costs and non operational capex, with comment made that this will
help to equalise incentives and reduce boundary issues. Two GDNs expressed the
view that shrinkage and NTS exit charges should be excluded from totex. This is
because the items are considered to be outside of the direct control of GDNs and
should therefore be funded purely as pass through costs.
Chapter: Seven
Question 4: Should the definition of related parties include captive
insurance companies?
1.65. Two respondents considered that captive insurance companies should be
excluded from the definition of related parties whilst one took the opposite view.
Chapter: Seven
Question 5: In GDPCR1 GDNs were allowed to retain the proceeds of asset
disposals in RAV for five years to incentivise GDNs to dispose of assets at
competitive prices. We invite views on whether this treatment should
continue.
1.66. Three respondents felt that we should continue to allow retention of the
proceeds of asset disposals for five years in RAV with one suggesting this should be
extended to other price controls.

Office of Gas and Electricity Markets 78
RIIO-T1 and GD1 Financial Issues March 2011
Appendices
Appendix 2 – Asset lives and depreciation
Rationale for using economic asset lives
1.1. The justification for changing the asset lives has been under discussion for some
time. In November 2004 in the Final Proposals for DPCR4, we stated that “in the
longer term, it would be reasonable to expect the price control treatment of long-
lived assets to more closely approximate to their useful or economic lives, for
example that the customers that pay for an asset are those that derive benefit for
it”50.
1.2. More recently the January 2010 RIIO consultation paper, Embedding
financeability in a new regulatory framework51, clearly noted that the existing
approach to depreciation raised several concerns. These included:
balancing the interests of current and future consumers (starting at paragraph
4.8) – this concern relates to the front-end loading of charges for consumers
which is especially important as the proportion of new assets in the RAV becomes
significant owing to the large investment programmes being undertaken to
facilitate the development of a low carbon energy sector;
price signals (starting at paragraph 4.12) – from an economic perspective the
“correct” price, one based on modern equivalent asset value (MEAV) sends
appropriate signals for consumers and investors and should lead to allocative
efficiency; and
incentives (paragraph 4.14) – the additional cash-flow associated with the
accelerated depreciation may mute the financial impact of operational and quality
incentives.
1.3. These issues were further discussed in section 5 of the CEPA consultancy report
published by Ofgem in May 201052 and we consulted on the use of economic asset
lives in July 2010 and on the actual asset lives in our December document.
Use of economic asset lives
1.4. We have not always used the current levels of accelerated depreciation. Prior to
DPCR3 regulatory asset lives were between 33-38 years. For electricity transmission,
post vesting assets lives were initially between 40-48 years. The shift in regulatory
50 Electricity Distribution Price Control Review: Final Proposals, November 2004 Ofgem. Paragraph 8.13
51 Regulating Energy Networks for the Future: RPI-X@20
Emerging Thinking – Embedding financeability in a new regulatory framework, January 2010 http://www.ofgem.gov.uk/Networks/rpix20/ConsultDocs/Documents1/et%20financeability.pdf 52 RPI-X@20:Providing financeability in a future regulatory framework May 2010, Cambridge Economic Policy Associates Ltd http://www.ofgem.gov.uk/Networks/rpix20/ConsultReports/Documents1/Final%20CEPA%20RPI-X@20%20Financeability%20Report%20May%202010.pdf

Office of Gas and Electricity Markets 79
RIIO-T1 and GD1 Financial Issues March 2011
Appendices
asset lives to 20 years was not made as a result of the underlying asset lives. It was
in response to a financeability issue caused by the 'cliff edge' of depreciation on the
pre-vesting assets. Using regulatory asset lives as a balancing instrument to ensure
financeability is not sustainable in the long term and leads to uncertainty and a lack
of transparency and predictability.
1.5. The new financeability framework under RIIO is implementing a long-term
sustainable solution. A higher equilibrium RAV than would be the case with
accelerated depreciation is one better placed to support the financing of the network
in the long-term. It is more in line with the way that the sectors were expected to
develop following privatisation. See for example the discussion of depreciation and
RAV in the Monopolies and Mergers Commission 1997 report, especially paragraphs
2.104 to 2.137 and section 9.53. The way in which the RAV is updated means that
over time the RAV would approach the MEAV and consequently an equilibrium level
would be achieved that approximated to the net MEAV and so led to allocative
efficiency.
1.6. Using average economic asset lives for regulatory asset lives achieves a
sustainable long term financial model for network operators as it matches the cost of
a network with its average useful service life. Once this mechanism is fully
established the cash flows resulting from the RAV should be in balance with the
funding to be raised, assuming reasonable operational efficiency. This level of RAV
will also address the concerns highlighted in our January 2010 RIIO consultation
paper, in particular by providing for an appropriate balance in the charging of current
and future consumers on a long-term stable basis and through appropriate price
signals for companies and consumers.
1.7. Although the transmission operators have challenged the use of economic asset
lives we note that the Energy Networks Association in its response to the RPI-X@20
recommendations54 accepted these arguments for using economic lives stating that
“Other things being equal, regulatory asset lives should reflect expected economic
lives of the relevant assets”. They also describe the concept of spreading the cost of
asset over their economic lives as 'fair'. In addition they suggested that “this is the
basis on which statutory accounts are prepared and is likely to be broadly aligned
with how a firm in a competitive industry might try to recover its costs from
customers”. We also note that some network operators also support the approach,
for example, UKPN in their response to the separate electricity distribution economic
asset life consultation state "We agree with the analysis presented that shows an
economic asset life of 45-55 years for electricity distribution assets and the general
principle of equalising regulatory asset lives to economic lives."
53 BG Plc: A report under the Gas Act 1986 on the restrictions of prices for gas transportation and storage services, http://www.competition-commission.org.uk/rep_pub/reports/1997/399bg.htm 54 ENA Response to Ofgem's Consultation "Regulating Energy Networks for the Future - RPI-X@20 Recommendations http://www.ofgem.gov.uk/Networks/rpix20/ConsultDocs/Documents1/ENA%20response.pdf

Office of Gas and Electricity Markets 80
RIIO-T1 and GD1 Financial Issues March 2011
Appendices
Age of existing networks
Figure A2.1 shows the Age and MEAV (replacement cost) for the electricity
and gas networks.
Source: CEPA, Ofgem

Office of Gas and Electricity Markets 81
RIIO-T1 and GD1 Financial Issues March 2011
Appendices
Regulatory accounts useful economic asset lives
Table A2.2 Tables of accounting asset lives taken from the respective
regulatory accounts for the year to 31 March 2010.
Electricity Transmission
Network Asset Type
Accounting
useful
economic life
(years)
National Grid Electricity
Transmission plc
Towers
Substation plant, overhead
lines and cables
Protection, control and
communication equipment
40 to 60
40 to 50
15 to 25
Scottish Hydro Electric
Transmission Limited
Transmission assets 10 to 80
SP Transmission Limited Transmission plant
Towers, lines and underground
cables
30 to 40
40 to 60
Electricity Distribution
Network Asset Type
Accounting
useful
economic life
(years)
CE Northern Electric DL and
Yorkshire Electricity DL
Distribution system assets
Information technology
45
up to 10
Central Networks East and
Central Networks West
Distribution network assets 40-70
EDFE EPN, EDFE LPN and EDFE
SPN (now UK Power Networks)
Overhead and Underground
lines
Other network plant and
buildings
45-60
20-60
Electricity North West Infrastructure assets 5-80
SP Distribution and SP Manweb Distribution plant
Towers, lines and underground
cables
30-40
40-60
SSE Hydro Distribution Assets 10-40
SSE Southern Distribution Assets 10-80
WPD S Wales and WPD S West Overhead lines and poles
Underground Cables
Transformers and switchgear
towers and substations
45
60
45
up to 55

Office of Gas and Electricity Markets 82
RIIO-T1 and GD1 Financial Issues March 2011
Appendices
Gas Distribution Network Asset Type
Accounting
useful
economic life
(years)
National Grid Gas - DN Mains, services and regulating
equipment
30 to 100
Southern Gas Networks and
Scotland Gas Networks
Mains and Services
Regulating equipment
60 to 65
30 to 50
Wales & West Utilities Limited Mains, services and regulating
equipment
30 to 65
Northern Gas Networks Limited Mains and Services 55 to 65
Gas Transmission Network Asset Type
Accounting
useful
economic life
(years)
National Grid Gas - NTS Mains, services and regulating
equipment
30 to 100

Office of Gas and Electricity Markets 83
RIIO-T1 and GD1 Financial Issues March 2011
Appendices
Appendix 3 – Mechanism for equity issuance costs allowance
Description of methodology
1.1. In setting price controls, we determine cost allowances consistent with a well
managed and efficient business. Given the large investment expected for some of the
network companies during RIIO-T1 (and, to a lesser extent, GD1) there may, at
times, be a need to bolster equity in order to ensure that credit metrics are
maintained at levels consistent with a 'comfortable investment grade' credit rating.
As discussed above, we expect that companies should be able to raise additional
equity, when necessary, to meet funding requirements and maintain credit quality.
1.2. We will make an ex ante allowance for the cost of raising equity, and carry out a
true-up on an annual basis during the price control. The allowance will be set at five
per cent of the amount of notional new equity needed to be issued during the price
control, as calculated by our model.
1.3. The process for determining the level of equity issuance required will involve an
examination of the credit metrics used in the financeability analysis and will,
therefore, involve an element of judgement. A simplified illustration, in which only
gearing is considered is described below.
Step 1 – The model is run with forecast RAV changes over the price control
period (forecasts for totex, depreciation, tax, incentive revenue, inflation, etc.),
with gearing assumed at the notional level at the start of the price control.
Step 2 – In every year of the price control, the gearing level on nominal RAV is
calculated based on the outcome of step 1.
Step 3 – When the difference exceeds a hurdle rate (for example gearing of
70%), the model assumes an equity issuance such that calculated gearing is
brought back to the notional gearing level. 55
Step 4 – In the years in which new equity needs to be issued according to the
model, an allowance for issuance costs is calculated as 5 per cent of the assumed
amount of equity issued.
Step 5 – The model is re-run annually with actual numbers replacing forecasts for
the financial year just passed. This will give a “corrected” level of equity issuance,
if any.
Step 6 – An adjustment to revenues is made to reflect any differences between
the equity issuance cost allowance calculated in step 4 and the corrected level.
1.4. Figure A3.1 provides an illustrative calculation that shows how steps 1-4 in the
above process operate. Figure A3.2 provides an illustrative example of how step 5
would work, in this case after three years of actual data. These examples ignore
taxes, interest, dividends, sharing factors, etc.
55 In the example shown on the next page, this amount is calculated as the difference between opening calculated net debt and opening notional net debt.

Office of Gas and Electricity Markets 84
RIIO-T1 and GD1 Financial Issues March 2011
Appendices
Figure A3.1: Illustration of equity issuance cost allowance calculation
Figure A3.2: Illustration of equity issuance cost allowance re-calculation
2013/14 2014/15 2015/16 2016/17 2017/18 2018/19 2019/20 2020/21
Opening RAV 2,500 3,246 4,175 4,680 5,073 5,357 5,483 5,606
Additions 800 1,000 600 500 400 250 250 250
Depreciation 143 185 222 245 263 273 280 286
RPI indexation (2.8%) 88 114 127 138 146 149 153 156
Closing RAV 3,246 4,175 4,680 5,073 5,357 5,483 5,606 5,726
Notional gearing 60% 60% 60% 60% 60% 60% 60% 60%
Notional net debt - opening 1,500 1,947 2,505 2,808 3,044 3,214 3,290 3,363
Notional net debt - closing 1,947 2,505 2,808 3,044 3,214 3,290 3,363 3,435
Calculated net debt - opening 1,500 2,157 2,973 2,883 3,138 3,275 3,252 3,222
Calculated net debt - closing 2,157 2,973 2,883 3,138 3,275 3,252 3,222 3,186
Calculated gearing - opening 60% 66% 71% 62% 62% 61% 59% 57%
Calculated gearing - closing 66% 71% 62% 62% 61% 59% 57% 56%
Calculated - notional opening net debt 0 210 468 75 94 61 -38 -141
New equity requirement 0 0 468 0 0 0 0 0
Equity issuance cost allowance 0 0 23 0 0 0 0 0
RAV calculations:
New equity calculations:
Net debt calculations:
2013/14 2014/15 2015/16 2016/17 2017/18 2018/19 2019/20 2020/21
Opening RAV 2,500 3,165 4,287 4,941 5,328 5,605 5,725 5,843
Additions 720 1,190 750 500 400 250 250 250
Depreciation 141 185 231 258 275 286 292 298
RPI indexation (2.8%) 86 117 135 145 153 156 159 162
Closing RAV 3,165 4,287 4,941 5,328 5,605 5,725 5,843 5,957
Notional gearing 60% 60% 60% 60% 60% 60% 60% 60%
Notional net debt - opening 1,500 1,899 2,572 2,964 3,197 3,363 3,435 3,506
Notional net debt - closing 1,899 2,572 2,964 3,197 3,363 3,435 3,506 3,574
Calculated net debt - opening 1,500 2,079 3,084 3,091 3,333 3,458 3,422 3,380
Calculated net debt - closing 2,079 3,084 3,091 3,333 3,458 3,422 3,380 3,333
Calculated gearing - opening 60% 66% 72% 63% 63% 62% 60% 58%
Calculated gearing - closing 66% 72% 63% 63% 62% 60% 58% 56%
Calculated - notional opening net debt 0 180 512 127 137 95 -13 -125
New equity requirement 0 0 512 0 0 0 0 0
Equity issuance cost allowance 0 0 26 0 0 0 0 0
New equity calculations:
RAV calculations:
Net debt calculations:

Office of Gas and Electricity Markets 85
RIIO-T1 and GD1 Financial Issues March 2011
Appendices
Appendix 4 – Tax methodology
Overriding principle
1.1. We model each regulated business for price control purposes as a standalone
entity. We treat all expenditure as incurred directly by the regulated business. For
this purpose, we consider each transmission business and GDN to be individual
regulated businesses. For National Grid, each of the gas and electricity transmission
owner and system operators and each retained gas distribution network are
considered to be individual regulated businesses.
Applicable tax regime and accounting regime
1.2. We will apply the UK standard tax rules that have passed into legislation by the
time of the final proposals together with all the remaining changes to corporation tax
(CT) and capital allowance (CA) rates proposed in the March 2011 and June 2010
Budgets. We are introducing the DPCR5-style tax trigger mechanism. This will cover
future changes in the tax regime. If the budget proposed changes to CT and CA rates
do not materialise or are amended, then any difference between the modelled
amount and the outturn will be treated as pass-through.
1.3. We will model tax under UK GAAP in 2013-14 and under EU-IFRS from 1 April
2014. The tax treatment of opex, capex and repex will follow the existing UK GAAP
treatment for 2013-14 and EU-IFRS thereafter. Any subsequent changes from
adopting, or delays in adopting, EU-IFRS will fall within the scope of the tax trigger.
1.4. We will assume that all capital allowances are claimed at rates in line with these
intentions and in the year that the expenditure is incurred.
Tax losses
1.5. In line with our treatment in GDPCR, where tax losses arise, we do not propose
to give affected network companies (including transmission companies) negative tax
allowances. We will log up any tax losses as calculated on a regulatory basis and
deduct them from expected tax allowances when the timing differences that led to
the loss reverse.
1.6. In computing regulatory losses, we will ignore and reverse any surrender by a
network company of losses to a group company, so that customers benefit from the
full amount of the losses as they reverse.

Office of Gas and Electricity Markets 86
RIIO-T1 and GD1 Financial Issues March 2011
Appendices
Modelling of expenditure allocations to capital allowance pools
1.7. We will use the following capital allowance pools:
Plant and Machinery (for this purpose this includes vehicles, cars and short life
assets)
Special Rate Pool (for long life assets) - and the relevant rates of annual writing
down allowance
Deferred Revenue Expenditure, for costs capitalised in the financial statements
and allowed as deductible when charged to revenue.
1.8. These pools reflect the relevant legislation in place and take into account the
legislative changes to the capital allowances regime since previous reviews.
1.9. We will collect data on expenditure under the old industrial buildings allowance
(IBA) but, reflecting the phasing out of IBAs, set no allowances for these in RIIO-T1
and GD1. We will also identify expenditure that does not qualify for capital
allowances (principally interests in land), or is not deductible for computing taxable
profits.
1.10. We will allow for specific expenditure which qualifies for research and
development allowances, environmentally beneficial technologies, and for
environmental remediation allowances at the relevant rates.
1.11. We will treat all other expenditure not qualifying for capital allowances or
treated as non-qualifying, as a revenue expense, which will attract a 100 per cent
deduction.
1.12. We will derive the allocation of expenditure to individual capital allowance
pools, revenue and expenditure non-qualifying for tax deduction from the regulated
businesses' attributions in each allocation table.
1.13. We will require electricity and gas transmission entities to identify expenditure
(which we funded on a pre-tax basis at previous controls) to project-specific capital
allowance pools. This also applies to expenditure which is initially funded in the SO
control and which is subsequently transferred to the TO control. This includes TIRG,
logged up costs and expenditure under other incentive mechanisms. We will model
these as separate CA pools, so that we transfer the correct tax written down value
on transfer to the TO control.
Allocations to capital allowance pools
1.14. For RIIO-GD1, we will apply a common approach to allocate allowed
expenditure to capital allowance pools. This relies on an average actual allocation
based on the information we received from the GDNs. We have adopted this basis as
all GDNs have similar allocation profiles.

Office of Gas and Electricity Markets 87
RIIO-T1 and GD1 Financial Issues March 2011
Appendices
1.15. For RIIO-T1, we will retain the company specific approach from TPCR4 to
allocate allowed expenditure to capital allowance pools. This will be based on the
allocation forecasts made by the companies and subject to our review and challenge.
1.16. The basis of allocation of the key building blocks to the capital allowances
pools for RIIO-GD1 is set out in table A4.1 below. This is an example based on the
2009-10 regulatory cost reporting pack (RRP). It is for illustrative purpose only and
is subject to review following submission of a network company's business plan and
the impact of reporting under EU-IFRS from 1 April 2014. Companies may update
this in their business plans.
Table A4.1 – Cost allocation to capital allowance pools - RIIO-GD1
Opening capital allowance pool balances
1.17. The opening capital allowance pools will be determined from the latest RRP
received, updated to the price control base year by addition of forecast spend by pool
types from the business plans to 31 March 2013.
1.18. For licensees with a 31 March year-end, we expect to receive the CT600
corporation tax returns and supporting computations (together 'CT600 information')
for the year ended 31 March 2010 with the annual RRP return due by 31 July 2011.
For network companies with a 31 December year-end, we will require CT600
information for the year ended 31 December 2009.
1.19. We will review the closing pools (as shown in the RRP) for consistency with the
CT600 information, and for any adjustments made to exclude non-regulated activity
allowances.
1.20. When the capital allowances pools per the tax returns have been adjusted so
that they are on a comparable basis, we will identify outliers. We will then take a
view as to whether to accept the balances as they stand, or amend them.
1.21. We will roll forward the pools using the allocation methodology described
above.
General
Pool
Long Life
Pool
IBA Deferred
Revenue
Revenue Non-
Qualifying
Total
LTS (Local Transmission System) pipelines 0% 99% 0% 0% 1% 0% 100%
NTS (National Transmission System) Outtakes 0% 100% 0% 0% 0% 0% 100%
PRSs (Pressure Reduction Systems) 0% 100% 0% 0% 0% 0% 100%
LTS (Local Transmission System) Storage 0% 100% 0% 0% 0% 0% 100%
Other Storage 0% 100% 0% 0% 0% 0% 100%
Mains Reinforcement 0% 100% 0% 0% 0% 0% 100%
Governors 0% 100% 0% 0% 0% 0% 100%
Connections - Mains and Services 0% 100% 0% 0% 0% 0% 100%
Connections - Governors 48% 52% 0% 0% 0% 0% 100%
Other Plant & Equipment, Land & Buildings 65% 26% 0% 0% 0% 9% 100%
Gross Replacement Expenditure 0% 0% 0% 0% 100% 0% 100%
Office of Gas and Electricity Markets 88
RIIO-T1 and GD1 Financial Issues March 2011
Appendices
Capitalised indirect costs
1.22. We will use individual licensee-specific capitalisation policies to determine the
treatment of indirect costs and to these we will apply the allocation rates to capital
allowance pools set out above.
Modelling the tax deductibility of pension costs
1.23. The cash payments made by a licensee into a pension scheme are 100 per cent
deductible in the year incurred, except where there are large irregular payments. In
accordance with the irregular payments rules, we spread the latter over the current
and up to three future years in accordance with the legislation, dependent on their
magnitude.
1.24. For modelling and allowance setting, we assume that all pension payments
attributable to the individual regulated business are paid in the year in which the
allowance is given (to take account of the spreading of deficit repair costs). Pension
adjustments relating to earlier price control periods are computed net of tax and will
not attract any further tax relief.
Modelling cashflows of Corporation Tax payments
1.25. We treat all licensees and the regulated business segments as large
companies. Under tax legislation, they are required to pay their tax liabilities for any
given year in instalments commencing in the current year. We will assume that half
the annual charge to CT is paid in the regulatory year, and half in the subsequent
year, regardless of the actual timing of payments by businesses (which could be
affected by a statutory year end different from the regulatory year end of 31 March,
for example) and ignore subventions for surrendered tax losses. We take no account
of additional payments (or receipts) from settling earlier years‟ tax liabilities. For the
first year of the price control, we include 50 per cent of the businesses' estimated tax
liability for the previous year, which will be the subject of a review for
reasonableness.
Interest (payable and receivable)
1.26. We model interest receivable and payable by applying the nominal rate of
interest (the assumed cost of debt plus modelled RPI estimate) to net debt as
determined by the financial model, on an accruals basis year-on-year. We treat
interest for tax purposes as fully deductible/taxable in the period in which it arises,
subject to the tax clawback. We will ignore the forecast movement, if any, in
derivative financial instruments in our modelling as these cannot be predicted with
certainty.

Office of Gas and Electricity Markets 89
RIIO-T1 and GD1 Financial Issues March 2011
Appendices
Tax treatment of incentives
1.27. In previous Transmission price control reviews, some expenditure has been
subject to various incentive mechanisms, held outside of the RAV, and not
remunerated through base demand revenues. Where investment drives changes in
revenue we will calculate the revenue using the vanilla WACC plus other tax effects
after taking account of the benefit of capital allowances. We will assume the costs
are all in the special (long life) pool unless energy network operators can provide
evidence to the contrary. There will be no retrospective allocation for existing
incentive mechanisms from previous price controls.
Tax clawback for excess gearing
1.28. Consistent with our existing policy we will apply an ex post adjustment to claw
back from licensees the tax benefit they obtain from gearing above our notional
gearing level.
1.29. The clawback will operate when in any year: (i) actual gearing exceeds notional
gearing and (ii) interest costs exceed those modelled at the relevant price control. In
the case where both of these conditions are satisfied, we will clawback the tax
benefit which results from the difference between actual and modelled interest costs
in that year. The specific methodology is set out in our open letter of 31 July 200956.
Where notional interest varies from that initially modelled at final proposals, due to
changes to the cost of capital, we will consider this when undertaking these trigger
tests.
1.30. In accordance with the July 2009 methodology, we will treat hybrid financial
instruments that have the characteristics of pseudo equity as debt if the coupon is
tax deductible, or proportionally if not 100 per cent deductible.
1.31. To calculate the adjustment in the previous price controls ending on 31 March
2013, we will use actual data when available together with that forecast in network
companies business plans. If the actual amounts are different, we reserve the right
to make a further ex post adjustment, if required.
1.32. We will spread the clawback for TPCR4 over nine years and for GDPCR over
eight years. In RIIO price controls we will update and reset the clawback every three
years and spread any clawback over the following three years.
Business rates
1.33. We treat business rates as non-controllable operating costs (together with our
licence fee). The Valuation Office Agency in England and Wales and the Scottish
56 Tax gearing clawback letter July 2009 http://www.ofgem.gov.uk/Pages/MoreInformation.aspx?docid=49&refer=Networks

Office of Gas and Electricity Markets 90
RIIO-T1 and GD1 Financial Issues March 2011
Appendices
Assessors Association in Scotland completed a revaluation of the assets of the
transmission and gas distribution networks in 2010 for the purposes of determining
rates until 2015. During RIIO-T1 and GD1, further revaluations in 2015 and 2020 are
expected. Each network company is able to influence the valuation that is given and
hence the business rates that it will incur in the future.
1.34. For the purposes of setting the base price control revenue allowances, business
rates are those from the 2010 valuations. For the period from 1 April 2013 up to 31
March 2015, we are retaining the previous (TPCR4 and GDPCR1) mechanism that
enabled companies to recover the difference between the actual and assumed costs.
After that time, we will switch-off this mechanism pending the outcome of the next
revaluation exercise. Where network companies can demonstrate that they have
taken reasonable actions to minimise the rating valuations, we will then reactivate
the cost adjustment mechanism for the remainder of the period, (ie from 1 April
2015 up to 31 March 2021). We will deal with the 2020 valuation on similar basis.
1.35. We consider that this approach provides incentives on network companies to
minimise costs, whilst recognising that once the rating valuations are concluded the
costs that they incur will be non-controllable.

Office of Gas and Electricity Markets 91
RIIO-T1 and GD1 Financial Issues March 2011
Appendices
Appendix 5 - Tax trigger
Tax trigger mechanism
1.1. The trigger mechanism protects licensees from material effects on their
cashflows of legislative changes and is symmetrical for both licensees and customers.
It fulfils the following key criteria, in that it:
is unambiguously clear when a trigger event has occurred
is measurable by Ofgem with minimal recourse to licensees, subject to ex post
adjustment for those that cannot be determined until tax returns are agreed by
Her Majesty's Revenue and Customs (HMRC)
is simple and transparent to apply.
1.2. We will calculate these changes by re-running the price control financial model
(without profiling, if adopted) to assess the impact on the tax allowance component
of revenues based on the aggregate effect over the remainder of the price control
period of changes in relevant legislation, whether introduced in a Finance Act, other
Act of Parliament, Statutory Instrument or other legislative instrument.
1.3. In accordance with our tax methodology, we model the regulated business for
price control purposes as a standalone entity. We treat all expenditure as if it is
incurred directly in the regulated business. The trigger is only applicable to the
activities for which base demand revenues are set, ie the regulated gas distribution,
TO or SO business. We will not apply the tax trigger to expenditure logged up or held
outside of RAV, until it transfers into RAV.
Scope of the trigger
1.4. The trigger will specifically include effects arising from:
A. changes in the relevant legislation whether introduced in a Finance Act, other Act
of Parliament, Statutory Instrument or other legislative instrument, or
B. changes in, or clarifications to, HMRC interpretation of legislation, or
C. new precedents set under case law, or
D. any changes in accounting standards that have a knock-on effect on the quantum
or timing of taxation,
providing companies have demonstrably taken all requisite steps to reduce their tax
liabilities.
1.5. For RIIO-T1 and GD1, we will model tax under UK GAAP in 2013-14 and under
EU-IFRS from 1 April 2014. The tax treatment of opex, capex and repex will follow

Office of Gas and Electricity Markets 92
RIIO-T1 and GD1 Financial Issues March 2011
Appendices
the existing UK GAAP treatment for 2013-14 and EU-IFRS thereafter. Any delay in
adopting EU-IFRS will fall within the scope of the tax trigger and be a trigger event.
The same approach will apply to any continuation of existing (UK GAAP) tax
treatment where we have modelled a different approach on the basis that tax follows
the accounting treatment.
1.6. Where the changes to CT and CA rates proposed in the June 2010 Budget are
not implemented, the differences from the actual rates will be excluded from the tax
trigger and treated as a pass-through.
1.7. We will specifically exclude from the trigger, effects arising from any changes
that alter the cash tax charge for the regulated business that arise specifically
because the licensee is a member of a group of companies. We will apply tax
legislation to the regulated business as if it was a standalone entity.
Trigger point
1.8. The trigger point is a change or changes that yield a greater than a given per
cent increase or decrease in the total base revenue of an individual regulated
business, measuring it separately for each remaining year (including the year in
which the trigger activates) in the price control period. We will calibrate this
percentage around the greater of (a) a one per cent change in the mainstream rate
of corporation tax, or (b) 0.33 per cent of total base revenues. There will be separate
trigger points for 2013-14 and all years from 1 April 2014 (following the adoption of
EU-IFRS). We may set separate rates for gas distribution and transmission, or
individual rates for each licensee.
1.9. The measurement of this will be the aggregate effect on the tax charge (as
shown by the financial model) of an individual regulated business of all legislative
changes at A in paragraph 1.4 above within a regulatory year; and whether these in
total breach the trigger. The adjustment will be on the excess over the trigger point,
ie the dead-band.
Measurement of changes
1.10. We will re-run the price control financial model to calculate whether the new
outcomes from the prescribed legislative changes above, activate the trigger. We will
not adjust any other assumption in the model including for the cost of debt
indexation57. We do this to ensure that we calculate all changes on a like-for-like
basis. The trigger will be calculated before the set off of brought forward regulatory
tax losses.
1.11. We do not consider that the changes at B, C and D in paragraph 1.4 above are
easily measurable by us without recourse to licensees. Neither we, nor the licensee,
57 Although interest may change overtime the effect on the tax burden will be adjusted through the indexation mechanism within the charge restriction conditions

Office of Gas and Electricity Markets 93
RIIO-T1 and GD1 Financial Issues March 2011
Appendices
can accurately quantify those changes until (a) the licensee has prepared and
submitted its annual corporation tax return to HMRC; and (b) HMRC agrees that
return.
1.12. We will agree the quantum of the effects at B, C and D and, if necessary, we
will require it to be the subject of limited scope audit procedures by an appropriate
auditor58. Licensees must notify us in writing once they have quantified the effects
setting out their supporting calculations. We will ignore B, C and D trigger events
that have not been notified in writing prior to the end of price control period. We will
log up the annual aggregate amount of these items and adjust these after HMRC has
agreed and closed the relevant tax return. Licensees should notify us in writing
within 30 days of that event. At that point, the financial model will be re-run as
above. This will include the effects arising at A above to re-measure the total of all
effects. All ex post adjustments will be NPV neutral.
1.13. Where the effect of changes in B, C and D can be easily measured, they will be
dealt with when known, or as if they were a change defined in A above. We will deal
with these on a case-by-case basis. Licensees may apply in writing for these items to
be adjusted in the period, and will need to:
demonstrate that the effects of the changes are quantifiable
provide evidence that the treatment has been agreed by HMRC or, in the case of
items at B, C and D above, their appropriate auditor
provide evidence of mitigation as far as practicable
Timing of revised revenues
1.14. When the trigger is activated, changes to each regulated businesses' revenues
from A will be implemented from the regulatory year subsequent to that in which the
trigger event or events occurred but will be effective from the date of the trigger
event. Those from B, C and D as ex post adjustments as and when determined (as
above) in the subsequent price control period(s). We will gross up the additional
revenue at the applicable rate of corporation tax for each year so that regulated
businesses do not suffer tax on tax and obtain the net additional tax burden or, if a
reduction in the tax charge, the benefit to customers is net of the tax saved. All
adjustments will be made on a NPV neutral basis.
1.15. The two following tables illustrate the activation of the trigger and the timing of
revised revenues, firstly for the adjustment of A effects, and secondly for the ex post
adjustment where B, C or D effects cannot be quantified until tax submissions are
agreed with HMRC. For simplicity the adjustments in these examples omit the NPV
neutral calculation of deferring revenues by one year.
1.16. In both examples the dead-band trigger point is for illustration only shown as
0.33 per cent; the CT rates (based on the June 2010 Budget proposals); and the
DPCR5 cost of capital, are for illustrative purposes only.
58 An appropriate auditor will be as defined in the relevant Regulatory Accounts licence condition

Office of Gas and Electricity Markets 94
RIIO-T1 and GD1 Financial Issues March 2011
Appendices
Table A5.1: Example of trigger in period straight forward from A effects
Trigger with restriction to adjust only the excess over the trigger point
2009/10 prices RIIO-2
Year 1 Year 2 Year 3 Year 4 Year 5 Year 6 Year 7 Year 8 Year 9
£m £m £m £m £m £m £m £m £m
Impact on accounting tax charge:
Year 1 (2.0) (2.0) (2.0) (2.0) (2.0) (2.0) (2.0) (2.0)
Year 2 (3.0) (3.0) (3.0) (3.0) (3.0) (3.0) (3.0)
Year 3 15.0 15.0 15.0 15.0 15.0 15.0
Year 4 2.0 2.0 2.0 2.0 2.0
Year 5 (10.0) (10.0) (10.0) (10.0)
Year 6 2.0 2.0 2.0
Year 7 1.0 1.0
Year 8 2.5
Sub total (2.0) (5.0) 10.0 12.0 2.0 4.0 5.0 7.5
Adjustment for base amount 2.0 3.3 (3.3) (3.3) (2.0) (3.3) (3.3) (3.3)
Impact 0.0 (1.7) 6.7 8.7 0.0 0.7 1.7 4.2
Additional tax on additional revenue 0.0 (0.4) 1.6 2.1 0.0 0.2 0.4 1.0
Impact on subsequent year's revenue 0.0 (2.1) 8.3 10.8 0.0 0.9 2.1 5.2
Trigger at 0.33% 3.3 3.3 3.3 3.3 3.3 3.3 3.3 3.3
Trigger exceeded NO YES YES YES NO YES YES YES
CT rate 25% 24% 24% 24% 24% 24% 24% 24%
RIIO-2
Year 1 Year 2 Year 3 Year 4 Year 5 Year 6 Year 7 Year 8 Year 9
£m £m £m £m £m £m £m £m £m
Modelled Base Revenue 1000.0 1000.0 1000.0 1000.0 1000.0 1000.0 1000.0 1000.0
Impact on revenues 0.0 (2.1) 8.3 10.8 0.0 0.9 2.1 5.2
Total adjusted Base Revenue 1000.0 1000.0 997.9 1008.3 1010.8 1000.0 1000.9 1002.1 5.2
RIIO-1
RIIO-1

Office of Gas and Electricity Markets 95
RIIO-T1 and GD1 Financial Issues March 2011
Appendices
Table A5.2 Example of trigger to show the deferral working
1.17. In the example in above table A5.2, this shows when B, C and D amounts
cannot be readily quantified and the revenue adjustment is deferred until tax
computations are agreed. In the example, these are in years 8, 9, 10 and 12 with
settlement made for each of years - 8, 9, 10 and 12. The amount settled is the
calculated additional (or reduction in the) tax effect plus any change that this would
make to the trigger, adjusted to be NPV-neutral to the year of settlement.
1.18. We will introduce a term in the special licence conditions to give effect to the
tax trigger.
Trigger with restriction to adjust only the excess over the trigger point
2009/10 prices Year 1 2 3 4 5 6 7 8 9 10 11 12 13 14 15 16
£m £m £m £m £m £m £m £m £m £m £m £m £m £m £m £m
Impact of tax legislation on accounting tax charge:
Year 1 (3.0) (3.0) (3.0) (3.0) (3.0) (3.0) (3.0) (3.0)
Year 2 20.0 20.0 20.0 20.0 20.0 20.0 20.0
Year 3 4.0 4.0 4.0 4.0 4.0 4.0
Year 4 2.0 2.0 2.0 2.0 2.0
Year 5 (16.0) (16.0) (16.0) (16.0)
Year 6 (10.0) (10.0) (10.0)
Year 7 (5.0) (5.0)
Year 8 (15.0)
Deferred settlement 0.0 0.0 25.0 50.0 40.0 0.0 0.0 (25.0)
Sub total (3.0) 17.0 46.0 73.0 47.0 (3.0) (8.0) (48.0) 0.0 0.0 0.0 0.0 0.0 0.0 0.0 0.0
Adjustment for base amount 3.0 (3.3) (3.4) (3.5) (3.6) 3.0 3.3 3.3 0.0 0.0 0.0 0.0 0.0 0.0 0.0 0.0
Impact 0.0 13.7 42.6 69.5 43.4 0.0 (4.7) (44.7) 0.0 0.0 0.0 0.0 0.0 0.0 0.0 0.0
Additional tax on additional revenue 0.0 3.3 10.2 16.7 10.4 0.0 (1.1) (10.7)
Total impact on base revenue 0.0 17.0 52.9 86.2 53.8 0.0 (5.8) (55.5)
Deferred settlement 25.0 50.0 40.0 0.0 0.0 (25.0)
(Value of total less amount settled in following year)
Corporation Tax rate 25% 24% 24% 24% 24% 24% 24% 24%
Years to settlement 5 5 5 4
Year in which revenues adjusted 8 9 10 0 0 12
Deferred settlement (NPV at Cost of Capital) 31.5 62.9 50.3 (30.0)
Trigger at 0.33% 3.3 3.3 3.4 3.5 3.6 3.5 3.3 3.3
Trigger exceeded NO YES YES YES YES NO YES YES
Revised Revenue
Year 1 2 3 4 5 6 7 8 9 10 11 12 13 14 15 16
£m £m £m £m £m £m £m £m £m £m £m £m £m £m £m £m
Base Revenue 1000.0 1000.0 1000.0 1000.0 1000.0 1000.0 1000.0 1000.0
Impacts of change from:
Year 1 (3.0) (3.0) (3.0) (3.0) (3.0) (3.0) (3.0) (3.0)
Year 2 20.0 20.0 20.0 20.0 20.0 20.0 20.0
Year 3 4.0 4.0 4.0 4.0 4.0 4.0
Year 4 2.0 2.0 2.0 2.0 2.0
Year 5 (16.0) (16.0) (16.0) (16.0)
Year 6 (10.0) (10.0) (10.0)
Year 7 (5.0) (5.0)
Year 8 (15.0)
Deferred settled 0.0 0.0 25.0 50.0 40.0 0.0 0.0 (25.0)
Adjustment for base amount 3.0 (3.3) (3.4) (3.5) (3.6) 3.0 3.3 3.3
Tax on tax impact 0.0 3.3 10.2 16.7 10.4 0.0 (1.1) (10.7)
Total adjusted revenue for
calculating trigger 1000.0 1000.0 1017.0 1052.9 1086.2 1053.8 1000.0 994.2 (55.5)
1000.0 1000.0 1013.7 1017.6 1019.5 1003.4 1000.0 995.3 (19.7)
Revenues deferred 31.5 62.9 50.3 0.0 (30.0) 0.0 0.0 0.0 0.0
Tax on tax allowed 7.5 15.1 12.1 0.0 (7.2) 0.0 0.0 0.0 0.0
Total Revenues 1034.3 58.3 62.4 0.0 (37.3) 0.0 0.0 0.0 0.0
RIIO-2
RIIO-2
Actual phasing of adjusted
base revenues:
RIIO-1
RIIO-1

Office of Gas and Electricity Markets 96
RIIO-T1 and GD1 Financial Issues March 2011
Appendices
Appendix 6 - Pension methodology
Scope
1.1. We set out the pension methodology that companies should apply in their
business plan submissions for RIIO-T1 and GD1 and which reflects how we will set
allowances. These methodologies cover:
GDPCR one year price control and GDPCR1 true up for pension costs
allowances for deficit funding
regulatory fraction
early retirement deficiency contributions
RIIO-T1 and GD1 pension deficit true up.
1.2. The RIIO-T1 and GD1 methodology follows that set out in the 22 June 2010
Pension paper59, the DPCR5 final proposals; and our decisions following the
December 2010 RIIO-T1 and GD1 consultations set out in chapter 6.
1.3. TPCR4 pension costs are subject to adjustment at the TPCR4 rollover. We will
reflect these adjustments in revenues in 2012-13 and subsequent years, spreading
them over nine years. There will be a further true up when the outturn position for
years where forecast data was used is known.
1.4. We will not fund any pension costs that relate to unregulated activities of the
licensee (unless these are indistinguishable from the regulated activities), including
the cost of repairing the relevant proportion of any deficit.
True up for GDPCR one year price control and GDPCR1
1.5. We committed at the one-year price control (2007-08) to restore companies to
the position they would have achieved if their actual efficient pension deficit
payments had been used to set allowances. The adjustments for the one-year control
were set out in an open letter dated 10 September 200960.
Ongoing service costs
1.6. The calculation will take the actual costs for GDPCR1 (including 2011-12 and
2012-13 forecast) and compare them to the allowed funding (all in constant prices).
The actual numbers will include payments relating to the PPF levies - fixed and risk
based.
59 Price Control Treatment of Network Operators Pension Costs under Regulatory Principles (76/10) http://www.ofgem.gov.uk/Networks/Documents1/Price_Control_Treatment_of_Pension_Costs_final.pdf 60 GDPCR pensions open letter http://www.ofgem.gov.uk/Networks/GasDistr/GDPCR7-13/Documents1/Open%20letter%20to%20GDNs%20re%20pensions%20090909.pdf

Office of Gas and Electricity Markets 97
RIIO-T1 and GD1 Financial Issues March 2011
Appendices
1.7. For GDPCR1 the impact of the adjustment for ongoing service costs is limited to
changes in contribution as shown in the actuarial valuations, ie the adjustment
equals
(Actual DB cash contribution) – (Actual DB pensionable salary * allowed contribution
rate)
1.8. The allowed contribution rates were set out in Table 3.2 to the GDPCR1 final
proposals61.
1.9. We will true up adjustments for ongoing service costs matching the GDPCR1
treatment in each of opex, capex and repex. Where this adjusts additions to RAV, we
will recalculate regulatory depreciation and return on RAV and adjust future revenues
on a NPV neutral basis.
1.10. These adjustments are both funded over the eight years of RIIO-GD162.
Deficits
1.11. We will subject the true up adjustment of deficit funding contributions to an
efficiency review, in accordance with pension principle one. We will add the cash
amount of the true up of the deficit payments on a NPV neutral basis to revenues in
RIIO-GD1.
True up for forecast years
1.12. The true up is based on actual expenditure and a forecast for 2011-12 and
2012-13. In the event that actual costs in 2011-12 and 2012-13 turn out to be
materially different to the estimate, we would expect to alter revenue at the next
reset of allowances. If the difference is due to genuine efficiencies that were
reasonably foreseeable at the time the forecast was provided, there will be a
clawback of the benefits of any under-spend relative to the estimate used in these
proposals in RIIO-T2 and GD2. We will do likewise if the forecast for the TPCR4
rollover year is materially different from the estimate.
Timing of adjustments
1.13. We are truing-up the adjustments arising from TPCR4 over nine years from 1
April 2012; and, for GDPCR1 and the 2007-08 one year gas distribution price control,
over eight years from 1 April 2013. We will true up the adjustments arising from
differences between forecast and actual for the TPCR4 rollover year and the final
year(s) of TPCR4 and GDPCR1 at the first reset of allowances. These adjustments will
61 GDPCR1 Final Proposals http://www.ofgem.gov.uk/Networks/GasDistr/GDPCR7-13/Documents1/final%20proposals.pdf 62 We are consulting on the period over which the true up funding will be spread; our preference is for eight years

Office of Gas and Electricity Markets 98
RIIO-T1 and GD1 Financial Issues March 2011
Appendices
be spread over the remaining years of the RIIO controls except in exceptional
circumstances.
Unexpected lump sum deficit payments
1.14. These tend to occur in instances of change in corporate control, or through
corporate activity within the network company's wider group. Whilst the trustees
may take the opportunity to repair the deficit faster, it is not clear why customers
should pay an accelerated profile. Under RIIO, we will spread the true up over the
remaining period of the 15-year notional deficit funding period providing the scheme
does not move into surplus. If a surplus does arise, we will review the situation on a
case by case basis in accordance with principle one.
Defined benefit schemes - deficit repair costs
1.15. As set out in our 22 June 2010 Pensions paper, we are committed to funding
the repair of established deficits. Principle 1 sets out our general guidance covering
the funding commitment, the notional deficit funding repair period, efficiency
reviews, PPF levy and scheme administration funding, treatment of stranded surplus
and buy-ins and buy-outs, innovative funding strategies and use of contingent
assets. Principles 3 and 5 set out our general guidance on stewardship and
over/under funding to ensure costs are efficient and there has been no material
failure of stewardship.
1.16. We will base allowances on the latest updated valuations in accordance with
our pension principles. Given the timing of setting allowances for fast-tracked
companies, all licensees are required to submit an update as at 31 March 2011 with
their business plan. If there are no fast-tracked companies in a particular sector we
will require a further update as at 30 June 2012 to inform setting their allowances at
final proposals.
1.17. The methodology for the attribution between established and incremental
deficit was reviewed by licensees and we are currently discussing its implementation
with both licensees and other interested stakeholders. This methodology will apply to
all network operators, not just those subject to the current RIIO controls. We will
publish the final methodology separately from the March 2011 Strategy Paper. Its
implementation should not affect the preparation of RIIO business plans.
1.18. Network companies submit scheme valuations in nominal prices. We will rebase
the deficit into 2009-10 prices used in setting price control allowances by the
relevant average RPI factors.
1.19. We apply the regulatory fraction (see below) to give the regulated element of
the deficit funded by demand revenue customers when setting the allowances at the
start of RIIO-T1 and GD1.

Office of Gas and Electricity Markets 99
RIIO-T1 and GD1 Financial Issues March 2011
Appendices
Pension deficit funding rate of return
1.20. We will continue with our current methodology first used at DPCR5. That is
applying a funding rate of return derived the range of benchmarked pre-retirement
real discount rates as applied in network companies valuations. We will compare this
rate against data published by the Pensions Regulator in its Recovery plans-
assumptions and triggers document to ensure that it is not out of line with non-
network comparators as set out in chapter 6. The rate for RIIO-T1 and GD1 is 2.6
per cent up to the first reset. We will reset this rate at each subsequent triennial
review on a rolling basis.
Determining the established deficit
1.21. The valuations used to inform setting allowances will pre-date the cut-off date
for determining the established deficits. We will finalise the actual amounts during
the RIIO price control period and true up at the first reset as noted above.
1.22. Where there is a difference in the size of a network company's deficit between
the updated valuations (used to set allowances) and that shown by either a full
triennial valuation at 31 March 2013, or updated valuations at that date (for those
with an earlier full valuation date), these will be adjusted in revenue allowances at
the first reset within the RIIO-T1 and GD1 price controls. All true up adjustments will
be NPV neutral, using the same discount rate as used for setting allowances. We will
spread the true up of this difference over the remaining years of the 15-year notional
funding period.
Resetting allowances during the RIIO price control period
1.23. We will true up and reset allowances every three years. We will not specifically
true up at the end of the each price control period unless this coincides with the
rolling three year true up and reset cycle.
1.24. We will undertake an efficiency review at the same time as the true up. This
will determine whether the full difference between companies cash deficit funding
and allowances are adjusted, or there is a restriction because of inefficiency. The
review will be across all energy network operators, as with the current review and be
timed to coincide with the majority of their scheme's triennial valuations.
Timing of resets
1.25. The factors that constrain the timing of the reset cycle are: disparate triennial
valuations dates - March 2011, December 2011, March 2012 and March 2013 and
TPR's timetable that requires schemes to submit valuations and recovery plans within
15 months of the valuation date. The majority of network operators' next full
triennial valuations currently fall on 31 March 2013.

Office of Gas and Electricity Markets 100
RIIO-T1 and GD1 Financial Issues March 2011
Appendices
1.26. Our decision is to undertake an efficiency review in mid-2014, true up and
reset revenues from 1 April 2015 and every three years thereafter. This aligns with
setting allowances for the next electricity distribution price control. For TOs and
GDNs that review will also determine their established deficit. There will be an
additional true up for the difference between the deficit used to set ex ante
allowances and the actual established deficit at 31 March 2012 for TOs and 31 March
2013 for GDNs.
1.27. We will introduce a mechanism in the charge restriction conditions to amend
revenues for all adjustments.
Regulatory fraction
1.28. The regulatory fraction represents the element of licensee‟s pension deficits
that relates solely to the activity of the distribution business (ie the licensed
business) and which, ultimately, under the pension principles, is funded by
customers.
RIIO-GD1 regulatory fractions
1.29. For GDNs, we include the pension deficit funding costs of employees engaged
in the metering business. Normally, we treat this as an excluded service. We do this,
as there are no dedicated metering employees within those licensees; and, this
activity is performed by staff primarily employed in the gas transportation business.
Subject to the conclusion of the review of the pensions data and companies business
plans, the regulatory fraction for Northern Gas Networks and Wales and West Utilities
will be 100 per cent less liabilities for any staff engaged solely in de minimis and
unregulated activities (excluding metering).
1.30. We will set a regulatory fraction for each of Scotland Gas Networks and
Southern Gas Networks as a fraction of the total Scotia Gas Networks pension
scheme when we have reviewed their business plans. We will derive the fraction for
NGG's GDNs, from attributing liabilities in the NGG pension scheme (NGUKPS) to its
business segments and legacy Centrica liabilities. The NGUKPS legacy deficit relating
to the NTS63 will continue to be on the basis adopted in GDPCR1, as pass-through
cost in the GDNs. All regulatory fractions will be subject to review for structural
changes to schemes, in accordance with principle 2.
RIIO-T1 regulatory fractions
1.31. For TOs' structural changes, if any, that occurred in TPCR4 and movements in
unfunded early retirement deficiency contributions (ERDCs) are reviewed to
determine the allowed proportion (regulatory fraction) of each company's pension
costs applicable in RIIO-T1. In TPCR4, these were set out as a percentage of the
deficit costs attributable to each TO irrespective of whether that TO was part of a
63 This includes the liability for the pensioners and deferred pensioners of the GDN businesses sold by NGG in 2005. GDNs only took on the active members and set up new schemes for these

Office of Gas and Electricity Markets 101
RIIO-T1 and GD1 Financial Issues March 2011
Appendices
larger scheme. For NGET, SPTL and SHETL, we will calculate the allowed proportion
as a percentage of the wider scheme to which each TO is a sponsoring employer. For
NGET an element will be attributable to the SO. We make adjustments from that
starting point to take account of scheme restructuring (mergers, and bulk transfers
in and out) in the price control period to arrive at a new fraction.
1.32. At TPCR4, the Scottish TOs64 pension schemes were in surplus and no
regulatory fraction was determined. Since then the schemes have moved into deficit.
These schemes are multi-employer schemes and at DPCR5, fractions were set for the
electricity distribution businesses. This work also identified the indicative fraction
relevant to the transmission business. These are for SPTL 4.8 per cent and for SHETL
7.1 per cent of their respective schemes deficits, subject to potential adjustment for
ERDCs. We will review these fractions and update them where there has been any
significant structural changes identified in the relevant updated valuations.
'Centrica liability'
1.33. The 'Centrica liability' concerns the liabilities relating to non-regulated business
activities carried out in NGG's predecessor companies. These include, in particular,
those relating to the gas trading and supply activities de-merged in 1997 to form
Centrica plc. As at TPCR4, we will only provide an allowance to cover the economic
and efficient deficit repair costs relating to businesses that remain regulated, ie we
will disallow the Centrica liability.
Periodic review of regulatory fractions
1.34. We will review the regulatory fraction at each reset of pension deficit
allowances in the RIIO price control period. At subsequent triennial resets, the
pension deficit allocation methodology will provide the individual amounts for the
notional sub-funds as follows:
regulated established deficit
unregulated established deficit
regulated incremental deficit
unregulated incremental deficit.
1.35. The unregulated amounts will also include movements from bulk transfers, in
accordance with principle 1.
Early Retirement Deficiency Contributions (ERDCs)
1.36. In accordance with pension principle 6, since 31 March 2004, ERDCs whether
fully funded, partially funded or fully unfunded, are a matter solely for shareholders.
In accordance with the principle, we will adjust the allowances in future price
controls to exclude the impact of ERDCs resulting from redundancy and re-
organisation. These have been offset by use of past surpluses, rather than being
funded by increased contributions.
64 SP Transmission Limited (SPTL) and Scottish Hydro Electric Power Transmission Limited (SHETL)

Office of Gas and Electricity Markets 102
RIIO-T1 and GD1 Financial Issues March 2011
Appendices
1.37. In TPCR4, we provided an allowance for 70 per cent of unfunded ERDCs
arising in respect of relevant retirement dates between privatisation and 1 April
2004.
1.38. These unfunded ERDCs still exist for NGET in RIIO-T1 although they will reduce
over time. The reduction arises from the balance of TO and SO funding payments in
excess of the regulatory fraction that fund them. Where schemes are subsequently
taken over and deficits paid off in full at that time, we accept that this may also
include the ERDCs. We will review these on a case-by-case basis. We understand
that SPTL and SHETL have no unfunded ERDCs. For NGG, we do not expect that any
residual ERDC disallowance exists, since the full ERDC disallowance has been
subtracted from payments made into the NGUKPS in TPCR4. In the RIIO controls
after the cut-off date, the ERDCs will need to be reported as part of the unregulated
sub-fund balances (see deficit allocation methodology). There are no unfunded
ERDCs in GDNs at the start of RIIO-GD1.
Computation of residual unfunded ERDCs
1.39. To arrive at the closing unfunded ERDCs we will:
take the TPCR4 position and rebase using RPI to prices at the beginning of the
control (ie 2007-08 prices)
adjust where the scheme deficit has been cleared, by for example a take-over
and subsequent funding in total of the deficit
roll forward the revised sum each year to create a forecast position at the end of
the price control by:
adding expected returns (using the cost of capital for each control as a
proxy for the nominal return that might have been expected). The
expected return is used (rather than actual returns) since this is the
amount on which the original ERDC valuation was based
deducting the proportion of the deficit payments (in nominal prices) that
were disallowed in TPCR4 and assumed to, in part, fund the unfunded
ERDCs, and
compare the resulting values of ERDCs at 2013 (in nominal prices) to the deficits
that are being used as the March 2013 position (again in nominal prices) and
convert to a percentage of the total scheme deficit. We use this to reduce the
regulatory fraction.
Table A6.1 Illustrative ERDC reduction calculation
£m 2005-06 2006-07 2007-08 2008-09 2009-10 Deficit assumed at 31 March 2010 £m
Reduction in Regulatory Fraction
B fwd 60.0 53.3 47.3 43.9 40.3 1,214 3.0%
Return 3.3 3.0 2.6 2.4 2.2
Payments (10.0) (9.0) (6.0) (6.0) (6.0) C fwd 53.3 47.3 43.9 40.3 36.6

Office of Gas and Electricity Markets 103
RIIO-T1 and GD1 Financial Issues March 2011
Appendices
Movements in regulated fraction in closed pipes and wires only schemes
1.40. The ERDC movement calculation will in practise, only apply to the National Grid
section of the electricity supply pension scheme.
1.41. The methodology was set out in the December 2010 consultation paper and is
not repeated here. Following the cut-off dates and at the first reset in RIIO controls
the regulatory fraction will be determined by application of the deficit allocation
methodology, which will incorporate movements in ERDCs.
Efficiency review
1.42. We will carry out triennial efficiency reviews of network company's pension
costs to inform the true up of price control ex ante allowances, setting and resetting
deficit allowances. This will determine whether the full difference between companies
cash deficit funding and allowances are adjusted, or there is a restriction because of
inefficiency. The review will be across all energy network operators, as with the
current review and be timed to coincide with the majority of their scheme's triennial
valuations.
1.43. We will undertake an efficiency review in mid-2014, true up and reset revenues
from 1 April 2015 and every three years thereafter. This will also align with setting
allowances for the next electricity distribution price control. For TOs and GDNs that
review will also determine their established deficit. For this, there will be an
additional true up for the difference between the deficit used to set ex ante
allowances and the actual established deficit at 31 March 2012 for TOs and 31 March
2013 for GDNs.
1.44. It is envisaged, subject to experience and the confidence we derive from the
current review, that each review will be in two stages:
an initial reasonableness review of energy network company's DB pension
schemes and specifically their funding costs, and
where the initial review indicates that there are grounds to believe the company‟s
pension costs fall outside of the expected range, this will trigger a further in-
depth examination to determine whether the company should retain any, or a
proportion of, the apparent efficiency savings if outturn costs are lower than the
allowances.
1.45. The second stage in-depth review will take place after completion of the initial
report. If any network company triggers a second stage review, we will determine
separate terms of reference for any subsequent consultancy support, as appropriate.
Objectives of initial review
1.46. The objectives of the initial review are to highlight those network company DB
schemes:

Office of Gas and Electricity Markets 104
RIIO-T1 and GD1 Financial Issues March 2011
Appendices
where the movement in the deficit (reviewing separately the movement in
underlying assets and liabilities) appears to be out of line with the general market
to identify whether any schemes‟ benefits, investment strategies, funding
methodologies, funding assumptions, funding levels or standard contributions fall
outside of the expected range compared to:
their industry peers, and
publicly available information on other UK private sector DB pension provision.
1.47. The process should identify any scheme (and thus network company‟s pension
costs) that fall outside any of the expected ranges. If so, the initial review will inform
Ofgem‟s determination of whether or not the network company‟s pension costs
should be subject to a second stage in-depth examination.
Objectives of second stage in-depth review
1.48. The second stage review will ascertain whether:
increased balances on deficits should be funded going forward
over-spends against allowances should be made good
under-spends against allowances should be clawed back.
1.49. If any network companies trigger an in-depth review, the detailed methodology
will be determined at that time.
Ongoing service pension contributions
1.50. As set out in the 22 June 2010 Pensions paper, for the RIIO controls, we will
treat ongoing service pension costs as a component of overall total costs (albeit
separately identifiable) and consequently include these in the efficiency
benchmarking of total costs. This will mean that:
pension costs (as part of employment costs) will be subject to any incentive
mechanism applied to employment costs (or total costs), but there will be no
specific pension cost adjustment
scheme administration and PPF levy costs will be excluded from the total cost
benchmarking
employment costs associated with the provision of non-regulated activities, eg
excluded services, metering, LNG storage (subject to not being part of the main
transmission price control) and de minimis business, are not part of base revenue
allowances and so the same treatment will automatically apply to their ongoing
pension service contribution elements.
Pension deficit true up
1.51. The following methodology is subject to the true up of funding to the 31 March
2013 valuations. This is the difference in the deficit between the updated valuations
(used to set allowances) and the deficit shown by either a full triennial valuation at
31 March 2013, or updated valuations (for those with an earlier valuation date). We
will adjust this amount in revenue allowances during the next RIIO price control on

Office of Gas and Electricity Markets 105
RIIO-T1 and GD1 Financial Issues March 2011
Appendices
an NPV neutral basis at the first triennial reset. We will spread this equally over the
remaining period of that price control review period.
1.52. At each reset using the methodologies set out above, any under or over
recovery of efficient pension costs against the allowance in the previous price control
or reset as determined above, will be adjusted in future revenues over the remaining
years of the initial notional 15-year notional funding period. These will be NPV
neutral and we will apply the same discount rate as used for annuitising the ex ante
deficit allowances. This rate will be benchmarked and reset triennially. We do this so
that customers are unaffected by the actual funding period used by companies.
Examples of deficit funding true up
1.53. We will deal with the element of the deficit that relates to regulated activities
as illustrated in the examples below.
1.54. These examples cover the treatment of the established deficit in RIIO price
control periods 1 and 2 only; and are based on the following assumptions:
The established deficit is funded over 15 years in equal annual instalments
Allowances are reset every three years and efficient unfunded payments funded
over the residual years of the initial 15 year notional funding period equally
The default mode is that at a reset the deficit is efficient unless additional
inefficiency is shown in a specific example
We ignore truing up to be NPV neutral for simplicity
We ignore any true up adjustments from the previous price control period
Where a significant efficient increase in the deficit occurs through increase in
longevity (or market movements outside of control and be deemed efficient) near
the end of the 15 years then we reserve the option to fund this over a new
regulatory funding period to protect consumers (as set out in methodology)
Any surplus whenever arising is not dealt with, as in accordance with our
methodology, it will be reviewed on a case-by-case basis at the time
Table A6.2 illustrates the company adopting our notional 15-year funding period; and
future deficit movements match the funding plan expectations. Then there is no need
to reset. The regulatory funding and actual payments match as shown.

Office of Gas and Electricity Markets 106
RIIO-T1 and GD1 Financial Issues March 2011
Appendices
Table A6.2 Matching actual and notional funding periods, no change in
deficit
Table A6.3 illustrates the impact of a company choosing to repair the deficit over a
shorter period than the 15 years (over which the price control funding has been set).
This example assumes no resetting of network company funding or of allowances at
subsequent revaluations on the basis that the deficit moves in line with the actual
funding. In this example the company has chosen 10 years as an appropriate repair
period and, subject to the "economic and efficient" test, the accelerated repair
payments will be funded (including the time value of money) at each triennial reset
over the residual years of both RIIO-1 and RIIO-2. The outcome is £40m allowance
per annum.
Table A6.3: Different repair period - all costs efficient and no subsequent
revaluation changes to deficit
Table A6.4 illustrates the outcome if at each subsequent triennial valuation the
deficits vary through market movements or changes in longevity, all deemed
efficient. Assuming the original 15-year funding period is retained by the scheme the
reset of allowances tracks the actual payments and the revised deficit funded is
£553m, as market movements have reduced the established deficit.
RIIO period 1 (2013-21) RIIO period 2 (2021-29) Total
PCR start (1 Apr) & end date (31 Mar) 2013 2021 2021 2029
Reset dates 1 April 2015 2018 2021 2024 2027
Movements in year ended 31 March 2014 2015 2016 2017 2018 2019 2020 2021 2022 2023 2024 2025 2026 2027 2028 2029
Opening established defict to be funded (450.0) (420.0) (390.0) (360.0) (330.0) (300.0) (270.0) (240.0) (210.0) (180.0) (150.0) (120.0) (90.0) (60.0) (30.0) 0.0
Actual repair payments over (+) 15 30.0 30.0 30.0 30.0 30.0 30.0 30.0 30.0 30.0 30.0 30.0 30.0 30.0 30.0 30.0 0.0 (450.0)
Revised opening deficit to be funded (420.0) (390.0) (360.0) (330.0) (300.0) (270.0) (240.0) (210.0) (180.0) (150.0) (120.0) (90.0) (60.0) (30.0) 0.0 0.0
Change in deficit at end of year(+) 0.0 0.0 0.0 0.0 0.0 0.0 0.0 0.0 0.0 0.0 0.0 0.0 0.0 0.0 0.0 0.0 (450.0)
Actual deficit at end of year (420.0) (390.0) (360.0) (330.0) (300.0) (270.0) (240.0) (210.0) (180.0) (150.0) (120.0) (90.0) (60.0) (30.0) 0.0 0.0
Inefficient deficit not funded (+) 0.0 0.0 0.0 0.0 0.0 0.0 0.0 0.0 0.0 0.0 0.0 0.0 0.0 0.0 0.0 0.0
Reverse inefficiency when deficit revised 0.0 0.0 0.0 0.0 0.0 0.0 0.0 0.0 0.0 0.0 0.0 0.0 0.0 0.0 0.0 0.0
Year opening efficient costs to be funded (450.0) (420.0) (390.0) (360.0) (330.0) (300.0) (270.0) (240.0) (210.0) (180.0) (150.0) (120.0) (90.0) (60.0) (30.0) 0.0
Future regulatory funding over 15 0.0
Notional Deficit allowance 30.0 30.0 30.0 30.0 30.0 30.0 30.0 30.0 30.0 30.0 30.0 30.0 30.0 30.0 30.0 30.0 0.0 450.0
Inefficiency not funded (-) 0.0 0.0 0.0 0.0 0.0 0.0 0.0 0.0 0.0 0.0 0.0 0.0 0.0 0.0 0.0 0.0 0.0
Cumulative underfunding at year end 0.0 0.0 0.0 0.0 0.0 0.0 0.0 0.0 0.0 0.0 0.0 0.0 0.0 0.0 0.0 0.0
Balance of underfunding at previous reset 0.0 0.0 0.0 0.0 0.0 0.0 0.0 0.0 0.0 0.0 0.0 0.0 0.0 0.0 0.0 0.0
Funding over remaining notional years 0.0 0.0 0.0 0.0 0.0 0.0 0.0 0.0 0.0 0.0 0.0 0.0 0.0 0.0 0.0 0.0
0.0
Total regulatory funding 30.0 30.0 30.0 30.0 30.0 30.0 30.0 30.0 30.0 30.0 30.0 30.0 30.0 30.0 30.0 0.0 450.0
Inefficiency borne by shareholders 0.0
Yrs
RIIO period 1 (2013-21) RIIO period 2 (2021-29) Total
PCR start (1 Apr) & end date (31 Mar) 2013 2021 2021 2029
Reset dates 1 April 2015 2018 2021 2024 2027
Movements in year ended 31 March 2014 2015 2016 2017 2018 2019 2020 2021 2022 2023 2024 2025 2026 2027 2028 2029
Opening established defict to be funded (600.0) (540.0) (480.0) (420.0) (360.0) (300.0) (240.0) (180.0) (120.0) (60.0) 0.0 0.0 0.0 0.0 0.0 0.0
Actual repair payments over (+) 10 60.0 60.0 60.0 60.0 60.0 60.0 60.0 60.0 60.0 60.0 0.0 0.0 0.0 0.0 0.0 0.0 (600.0)
Revised opening deficit to be funded (540.0) (480.0) (420.0) (360.0) (300.0) (240.0) (180.0) (120.0) (60.0) 0.0 0.0 0.0 0.0 0.0 0.0 0.0
Change in deficit at end of year(+) 0.0 0.0 0.0 0.0 0.0 0.0 0.0 0.0 0.0 0.0 0.0 0.0 0.0 0.0 0.0 0.0 (600.0)
Actual deficit at end of year (540.0) (480.0) (420.0) (360.0) (300.0) (240.0) (180.0) (120.0) (60.0) 0.0 0.0 0.0 0.0 0.0 0.0 0.0
Inefficient deficit not funded (+) 0.0 0.0 0.0 0.0 0.0 0.0 0.0 0.0 0.0 0.0 0.0 0.0 0.0 0.0 0.0 0.0
Reverse inefficiency when deficit revised 0.0 0.0 0.0 0.0 0.0 0.0 0.0 0.0 0.0 0.0 0.0 0.0 0.0 0.0 0.0 0.0
Year opening efficient costs to be funded (600.0) (540.0) (480.0) (420.0) (360.0) (300.0) (240.0) (180.0) (120.0) (60.0) 0.0 0.0 0.0 0.0 0.0 0.0
Future regulatory funding over 15 0.0
Notional Deficit allowance 40.0 40.0 40.0 40.0 35.0 35.0 35.0 26.7 26.7 26.7 10.0 10.0 10.0 0.0 0.0 0.0 0.0 335.0
Inefficiency not funded (-) 0.0 0.0 0.0 0.0 0.0 0.0 0.0 0.0 0.0 0.0 0.0 0.0 0.0 0.0 0.0 0.0 0.0
Cumulative underfunding at year end 20.0 40.0 60.0 80.0 100.0 120.0 140.0 160.0 180.0 200.0 160.0 120.0 80.0 40.0 0.0 0.0
Balance of underfunding at previous reset 0.0 0.0 60.0 0.0 0.0 120.0 0.0 0.0 180.0 0.0 0.0 120.0 0.0 0.0 0.0 0.0
Funding over remaining notional years 0.0 0.0 5.0 5.0 5.0 13.3 13.3 13.3 30.0 30.0 30.0 40.0 40.0 40.0 0.0 265.0
0.0
Total regulatory funding 40.0 40.0 40.0 40.0 40.0 40.0 40.0 40.0 40.0 40.0 40.0 40.0 40.0 40.0 40.0 0.0 600.0
Inefficiency borne by shareholders 0.0
Yrs

Office of Gas and Electricity Markets 107
RIIO-T1 and GD1 Financial Issues March 2011
Appendices
Table A6.4: Deficits fluctuate at each valuation, all costs efficient
Table A6.5 illustrates the possible outcome if the company has a shorter funding
period (which is retained at subsequent reviews) and at subsequent triennial
valuations the deficits vary; and each efficiency review triggers a second stage in-
depth review and we deem different amounts to be inefficient. If deemed efficient
the funding would continue as shown. If judged inefficient there would be a reduction
in the funding at the reset as shown. In this example, we consider £40m as
inefficient at the first reset, £10m at the second and £5m at the third. Each
inefficient amount is clawed back over three years until the next reset when the
inefficient amount is amended. Over the 15 years it is the £20m of inefficient costs
that shareholders bear and also receive a net recovery of £3.7m more than the
opening established deficit from increases in, for example longevity, less the
inefficient costs .
Table A6.5: Shorter funding period and deficit initially increases and then
decrease and some costs are considered inefficient
Table A6.6 illustrates the possible outcome if the company has the same 15-year
funding period (which is retained at subsequent reviews) and at subsequent triennial
valuations the deficits vary, including a surplus at the first reset. Inefficiency has
been considered the reductions in funding at each reset are as shown. In this
example, we consider £20m as inefficient at the second reset (being the increase
over the surplus), £40m at the third (being £20m for the first reset and £20m
additional at the third); the £32.6m at the fourth being the residual inefficient costs.
Each inefficient amount is clawed back over three years until the next reset when the
RIIO period 1 (2013-21) RIIO period 2 (2021-29) Total
PCR start (1 Apr) & end date (31 Mar) 2013 2021 2021 2029
Reset dates 1 April 2015 2018 2021 2024 2027
Movements in year ended 31 March 2014 2015 2016 2017 2018 2019 2020 2021 2022 2023 2024 2025 2026 2027 2028 2029
Opening established defict to be funded (600.0) (560.0) (470.0) (433.8) (397.7) (391.5) (352.4) (313.2) (254.1) (217.8) (181.5) (135.2) (101.4) (67.6) (36.8) 0.0
Actual repair payments over (+) 15 40.0 40.0 36.2 36.2 36.2 39.2 39.2 39.2 36.3 36.3 36.3 33.8 33.8 33.8 36.8 0.0 (553.0)
Revised opening deficit to be funded (560.0) (520.0) (433.8) (397.7) (361.5) (352.4) (313.2) (274.1) (217.8) (181.5) (145.2) (101.4) (67.6) (33.8) 0.0 0.0
Change in deficit at end of year(+) 0.0 50.0 0.0 0.0 (30.0) 0.0 0.0 20.0 0.0 0.0 10.0 0.0 0.0 (3.0) 0.0 0.0 (553.0)
Actual deficit at end of year (560.0) (470.0) (433.8) (397.7) (391.5) (352.4) (313.2) (254.1) (217.8) (181.5) (135.2) (101.4) (67.6) (36.8) 0.0 0.0
Inefficient deficit not funded (+) 0.0 0.0 0.0 0.0 0.0 0.0 0.0 0.0 0.0 0.0 0.0 0.0 0.0 0.0 0.0 0.0
Reverse inefficiency when deficit revised 0.0 0.0 0.0 0.0 0.0 0.0 0.0 0.0 0.0 0.0 0.0 0.0 0.0 0.0 0.0 0.0
Year opening efficient costs to be funded (600.0) (560.0) (470.0) (433.8) (397.7) (391.5) (352.4) (313.2) (254.1) (217.8) (181.5) (135.2) (101.4) (67.6) (36.8) 0.0
Future regulatory funding over 15 0.0
Notional Deficit allowance 40.0 40.0 40.0 36.2 36.2 36.2 39.2 39.2 39.2 36.3 36.3 36.3 33.8 33.8 33.8 36.8 0.0 553.0
Inefficiency not funded (-) 0.0 0.0 0.0 0.0 0.0 0.0 0.0 0.0 0.0 0.0 0.0 0.0 0.0 0.0 0.0 0.0 0.0
Cumulative underfunding at year end 0.0 0.0 0.0 0.0 0.0 0.0 0.0 0.0 0.0 0.0 0.0 0.0 0.0 0.0 0.0 0.0
Balance of underfunding at previous reset 0.0 0.0 0.0 0.0 0.0 0.0 0.0 0.0 0.0 0.0 0.0 0.0 0.0 0.0 0.0 0.0
Funding over remaining notional years 0.0 0.0 0.0 0.0 0.0 0.0 0.0 0.0 0.0 0.0 0.0 0.0 0.0 0.0 0.0 0.0
0.0
Total regulatory funding 40.0 40.0 36.2 36.2 36.2 39.2 39.2 39.2 36.3 36.3 36.3 33.8 33.8 33.8 36.8 0.0 553.0
Inefficiency borne by shareholders 0.0
Yrs
RIIO period 1 (2013-21) RIIO period 2 (2021-29) Total
PCR start (1 Apr) & end date (31 Mar) 2013 2021 2021 2029
Reset dates 1 April 2015 2018 2021 2024 2027
Movements in year ended 31 March 2014 2015 2016 2017 2018 2019 2020 2021 2022 2023 2024 2025 2026 2027 2028 2029
Opening established defict to be funded (600.0) (540.0) (530.0) (465.0) (400.0) (315.0) (252.0) (189.0) (116.0) (54.0) 0.0 0.0 0.0 0.0 0.0 0.0
Actual repair payments over (+) 10 60.0 60.0 65.0 65.0 65.0 63.0 63.0 63.0 62.0 54.0 0.0 0.0 0.0 0.0 0.0 0.0 (620.0)
Revised opening deficit to be funded (540.0) (480.0) (465.0) (400.0) (335.0) (252.0) (189.0) (126.0) (54.0) 0.0 0.0 0.0 0.0 0.0 0.0 0.0
Change in deficit at end of year(+) 0.0 (50.0) 0.0 0.0 20.0 0.0 0.0 10.0 0.0 0.0 0.0 0.0 0.0 0.0 0.0 0.0 (620.0)
Actual deficit at end of year (540.0) (530.0) (465.0) (400.0) (315.0) (252.0) (189.0) (116.0) (54.0) 0.0 0.0 0.0 0.0 0.0 0.0 0.0
Inefficient deficit not funded (+) 0.0 40.0 0.0 0.0 10.0 0.0 0.0 5.0 0.0 0.0 0.0 0.0 0.0 0.0 0.0 0.0
Reverse inefficiency when deficit revised 0.0 0.0 0.0 0.0 (40.0) 0.0 0.0 (10.0) 0.0 0.0 (5.0) 0.0 0.0 0.0 0.0 0.0
Year opening efficient costs to be funded (600.0) (500.0) (490.0) (425.0) (350.0) (305.0) (242.0) (174.0) (111.0) (49.0) 5.0 0.0 0.0 0.0 0.0 0.0
Future regulatory funding over 15 0.0
Notional Deficit allowance 40.0 40.0 40.0 40.8 40.8 40.8 31.5 31.5 31.5 16.6 16.6 16.6 0.0 0.0 0.0 0.0 0.0 346.5
Inefficiency not funded (-) 0.0 (2.9) (2.9) (2.9) (0.9) (0.9) (0.9) (0.6) (0.6) (0.6) 0.0 0.0 0.0 0.0 0.0 0.0 (13.2)
Cumulative underfunding at year end 20.0 40.0 64.2 88.5 112.7 132.9 153.2 173.4 194.0 206.7 165.4 124.0 82.7 41.3 0.0 0.0
Balance of underfunding at previous reset 0.0 0.0 0.0 0.0 112.7 0.0 0.0 173.4 0.0 0.0 165.4 0.0 0.0 41.3 0.0 0.0
Funding over remaining notional years 0.0 0.0 0.0 0.0 11.3 11.3 11.3 24.8 24.8 24.8 41.3 41.3 41.3 41.3 0.0 273.5
0.0
Total regulatory funding 40.0 37.1 37.9 37.9 39.9 41.9 41.9 42.1 40.7 40.7 41.3 41.3 41.3 41.3 41.3 0.0 603.7
Inefficiency borne by shareholders (16.3)
Yrs

Office of Gas and Electricity Markets 108
RIIO-T1 and GD1 Financial Issues March 2011
Appendices
inefficient amount is amended. Over the 15 years it is the £40m of inefficient costs
that shareholders bear but this is offset by the £20m increase deemed efficient.
Table A6.6: Actual deficits vary, including a surplus, which subsequently
reverses and there are inefficiencies
1.55. The model from which these examples are taken is available on our website65.
1.56. Whilst normal contribution rates are set at a level to secure future liabilities, it
is likely that new deficits will arise for many different reasons. In this eventuality, we
look to fund this new deficit in accordance with the established pension principles,
although not necessarily within the original 15-year notional funding period.
65 Illustrative pension deficit funding model for RIIO-T1 and GD1 http://www.ofgem.gov.uk/Networks/Trans/PriceControls/RIIO-T1/ConRes/Documents1/Pension%20scenarios%20for%20RIIO%20paper.xls
RIIO period 1 (2013-21) RIIO period 2 (2021-29) Total
PCR start (1 Apr) & end date (31 Mar) 2013 2021 2021 2029
Reset dates 1 April 2015 2018 2021 2024 2027
Movements in year ended 31 March 2014 2015 2016 2017 2018 2019 2020 2021 2022 2023 2024 2025 2026 2027 2028 2029
Opening established defict to be funded (600.0) (560.0) 0.0 0.0 0.0 (550.0) (495.0) (440.0) (405.0) (347.1) (289.3) (201.4) (151.1) (100.7) (50.4) 0.0
Actual repair payments over (+) 15 40.0 40.0 0.0 0.0 0.0 55.0 55.0 55.0 57.9 57.9 57.9 50.4 50.4 50.4 50.4 0.0 (620.0)
Revised opening deficit to be funded (560.0) (520.0) 0.0 0.0 0.0 (495.0) (440.0) (385.0) (347.1) (289.3) (231.4) (151.1) (100.7) (50.4) 0.0 0.0
Change in deficit at end of year(+) 0.0 530.0 0.0 0.0 (550.0) 0.0 0.0 (20.0) 0.0 0.0 30.0 0.0 0.0 0.0 0.0 0.0 (610.0)
Actual deficit at end of year (560.0) 10.0 0.0 0.0 (550.0) (495.0) (440.0) (405.0) (347.1) (289.3) (201.4) (151.1) (100.7) (50.4) 0.0 0.0
Inefficient deficit not funded (+) 0.0 0.0 0.0 0.0 20.0 0.0 0.0 40.0 0.0 0.0 32.6 0.0 0.0 0.0 0.0 0.0
Reverse inefficiency when deficit revised 0.0 0.0 0.0 0.0 0.0 0.0 0.0 (20.0) 0.0 0.0 (40.0) 0.0 0.0 (32.6) 0.0 0.0
Year opening efficient costs to be funded (600.0) (560.0) 0.0 0.0 20.0 (530.0) (475.0) (380.0) (365.0) (307.1) (216.7) (168.8) (118.5) (68.1) (50.4) 0.0
Future regulatory funding over 15 0.0
Notional Deficit allowance 40.0 40.0 40.0 0.0 0.0 0.0 55.0 55.0 55.0 57.9 57.9 57.9 50.4 50.4 50.4 50.4 0.0 620.0
Inefficiency not funded (-) 0.0 0.0 0.0 0.0 (1.8) (1.8) (1.8) (5.0) (5.0) (5.0) (6.5) (6.5) (6.5) 0.0 0.0 0.0 (40.0)
Cumulative underfunding at year end 0.0 0.0 0.0 0.0 0.0 0.0 0.0 0.0 0.0 0.0 0.0 0.0 0.0 0.0 0.0 0.0
Balance of underfunding at previous reset 0.0 0.0 0.0 0.0 0.0 0.0 0.0 0.0 0.0 0.0 0.0 0.0 0.0 0.0 0.0 0.0
Funding over remaining notional years 0.0 0.0 0.0 0.0 0.0 0.0 0.0 0.0 0.0 0.0 0.0 0.0 0.0 0.0 0.0 0.0
0.0
Total regulatory funding 40.0 40.0 0.0 0.0 (1.8) 53.2 53.2 50.0 52.9 52.9 51.3 43.8 43.8 50.4 50.4 0.0 580.0
Inefficiency borne by shareholders (40.0)
Yrs

Office of Gas and Electricity Markets 109
RIIO-T1 and GD1 Financial Issues March 2011
Appendices
Appendix 7 – Price control pension principles under RIIO
1.1. Under RIIO, our pension principles remain the same as previously set out. These
revised guidance notes for each principle take into account how we intend to apply
them to defined benefit (DB) pension schemes under RIIO price controls.
Principle 1 - Efficient and Economic Employment and Pension
Costs
Customers of network monopolies should expect to pay the efficient cost of
providing a competitive package of pay and other benefits, including
pensions, to staff of the regulated business, in line with comparative
benchmarks.
1.2. We should not expect customers to pay the excess costs of providing benefits
that are out of line with the wider private sector practice, nor for excess costs
avoidable by efficient management action. We will, unless inappropriate, benchmark
total employment costs within total costs, to ensure companies have correct
incentives to manage their costs, including pension costs, efficiently.
Funding Commitment
1.3. For each network company, customers will fund the established deficit as at the
end of the relevant price controls (ie DPCR4, TPCR4 and GDPCR1). The established
deficit means the difference between assets and liabilities attributable to pensionable
service up to the end of each respective price control period set out below and
relating to the regulated business under principle 2:
for DNOs – the price control period ending on 31 March 2010
for GDNs – the price control period ending on 31 March 2013
For Transmission owners and system operators – the price control period ending
on 31 March 2012.
1.4. In accordance with principle 5, subject to an adjustment for the regulatory
fraction, the funding commitment covers:
The quantum of the established deficit at the respective cut-off dates in 1.3
above
Changes in the amount of the established deficit at the end of the price control
period (for example caused by a fall in the value of stock markets or changes in
longevity assumptions) provided that the scheme or schemes have been
efficiently managed in accordance with principle 3 and costs are efficient and
economic in accordance with this principle 1, even if there has been an interim
period during which a funding surplus has been reported

Office of Gas and Electricity Markets 110
RIIO-T1 and GD1 Financial Issues March 2011
Appendices
1.5. Conversely, the funding commitment does not cover any element of deficit
falling outside the scope of the established deficit. For example, non–regulated
activities and bulk transfers at the end of the price control period or future service of
those employees still active in the scheme after the relevant cut-off date. We will not
make any future allowance for such deficit elements, ie the incremental deficit, other
than through the benchmarking process.
1.6. We will treat any deficit payments that arise because of service after the
relevant cut-off dates above, as part of the benchmarked employment (or total)
costs. These are subject to the same incentive as employment costs in general.
Notional deficit repair funding period
1.7. The deficit will be funded over the notional 15-year deficit funding period. We
will apply a flat profile over the deficit funding period allowing a rate of return. We do
not reset the 15-year period, other than in exceptional circumstances, at each
subsequent control. The intention is that the deficit at the cut-off dates for each
control will be fully funded over the following 15 years.
Efficiency reviews
1.8. We will carry out triennial efficiency reviews of network companies' pension
costs to inform the true up of price control ex ante allowances, setting and resetting
deficit allowances.
Pension Protection Fund (PPF) levy and scheme administration costs
1.9. We will standardise the treatment of both pension scheme administration costs
and PPF levies whether paid directly by licensees or funded through increased
employer contributions to the scheme in setting allowances. We will set a separate
allowance for each of these, and will true up and reset these allowances every three
years. Both will be subject to a de minimis threshold below which there will be no
true up. Above the threshold they will be subject to review for efficiency.
Stranded surplus
1.10. In the event that a surplus arises (ie assets exceed the full buy-out cost of
accrued liabilities as shown by an appropriate actuarial valuation), only the trustees
have the power to decide whether it is in the interests of scheme members to repay
it to the employer (in accordance with the scheme rules and other legal
requirements). Trustees have obligations to protect the benefits of scheme members.
Network company schemes are generally closed mature schemes with the majority
of members either pensioners or deferred pensioners and with the average age of
active members around 47 (based on 2009-10 data). As such, we understand that
over time they may generally seek to match their assets and revenues to their
liabilities, which are becoming easier to forecast. In doing this their investment
strategies will move from riskier to less risky assets, and they will likely use hedging

Office of Gas and Electricity Markets 111
RIIO-T1 and GD1 Financial Issues March 2011
Appendices
strategies. Any potential for a surplus is very unlikely to arise. If this is the case,
customers may indirectly benefit as investing in less risky assets will protect them
from increased deficits on riskier assets, which are subject to market volatility.
1.11. We will monitor each scheme's position on an annual basis. In the event that a
scheme was in surplus for a period, we consider that there is a reasonable
expectation for symmetry in the treatment for funding of deficits and use of a
surplus. We would therefore expect to share the benefit across members and
customers. We would consider our options when setting allowances such that
customers would benefit and the shareholders would cover the cost in the event that
contribution levels remain the same.
1.12. We will review each instance on a case-by-case basis. Where a surplus in the
established deficit was used to offset or reduce contributions in the incremental
deficit, then this may be taken at face value as evidence that consumers should also
benefit from its use. We will need to consider whether the annual funding was faster
than necessary, as the build up of the surplus may have been observed at annual
updates.
Buy-ins and buy-outs of pension schemes liabilities
1.13. These currently fall within the scope of principles 1, 2 and 5. Buy-ins and buy-
outs are effectively a de-risking of future liabilities. It will be necessary to determine
how such de-risking is shared between customers and shareholders, to facilitate
efficient management of the schemes and to remove uncertainty as to the regulatory
treatment. It is difficult to be prescriptive as to how they should be spread between
different generations of customers. For guidance, an equitable option is to spread
these costs over the same deficit repair period used to set ex ante allowances. We
will deal with these, if they occur, applying these pension principles on a case-by-
case basis.
Innovative investment strategies
1.14. As the closed DB schemes reach maturity, trustees may seek to use innovative
investment strategies to manage their liabilities and hedge risks. Such strategies
may include liability-driven investments, longevity swaps (bespoke or index-based)
and insurance policies to help protect the scheme from adverse death-in-service
experience. We consider these are an appropriate approach to managing risk. We
consider that, unless there is evidence to the contrary, the costs of these strategies
would be reasonable costs. We would expect to identify and seek to understand
these strategies where a scheme's costs are identified as an outlier at an efficiency
review.
Contingent assets
1.15. The Pensions Regulator (TPR) has issued guidance about how contingent assets
such as parent or group company guarantees, bank letters of credit, charging assets

Office of Gas and Electricity Markets 112
RIIO-T1 and GD1 Financial Issues March 2011
Appendices
to the trustees or security over cash holdings may be used to support a recovery
plan or technical provisions. These may not be taken directly into account in
determining whether the statutory funding objective is met, or when estimating
solvency. Energy network operator's licences restrict the use of network assets as
security.
1.16. In principal, the costs of a contingent asset may be allowed if considered to be
in consumers' interest. In order not to preclude the use of innovative solutions in
future, we will review each case on its merits.
Principle 2 - Attributable Regulated Fraction Only
Liabilities in respect of the provision of pension benefits that do not relate
to the regulated business should not be taken into account in assessing the
efficient level of costs for which allowance is made in a price control.
1.17. It is for shareholders, rather than customers of the regulated services, to fund
liabilities associated with businesses carried on by the wider non-regulated group.
This includes businesses that were formerly carried on by the same ownership group
and have been sold, separated and/or ceased to be subject to the main price control
review. In principle this may include costs related to self-financing excluded services,
distributed generation, metering, de minimis activities of the network company and
of unregulated businesses in the same scheme in the context of a transportation
and/or distribution price control. These will be dealt with on a case-by-case basis as
in some cases the costs of such businesses are not readily separable from the
regulated business. For DPCR5 and all RIIO controls, this includes pension costs
related to active service members from the cut-off dates in the regulated business,
which form part of the incremental deficit.
1.18. At DPCR4, there was a general assumption of a 20 per cent disallowance for
non-regulated activities for most licensees. For DPCR5, we retained this split as a
starting point. At TPCR4, we disallowed the proportion of ongoing contributions and
existing deficit that related to unregulated activities. This basis will be used to set the
opening regulatory fraction at the cut-off date for TPCR4 rollover.
1.19. The regulatory fraction determined in setting ex ante allowances will be
reviewed to assess the ex post adjustment when there have been structural changes
to a scheme within a price control period, at each reset. We will also review and
adjust for movements, including cash funding by sponsors to the previously
unfunded Early Retirement Deficiency Contributions.
1.20. Structural changes may occur when:
schemes merge or demerge
members are transferred in or out in bulk
there is a change of ultimate controller
there is a buy-in/buy-out of any part of the scheme membership.

Office of Gas and Electricity Markets 113
RIIO-T1 and GD1 Financial Issues March 2011
Appendices
1.21. The non-regulated component of pension liabilities should logically reduce over
time in a closed pension scheme for a predominantly wires or pipes only business.
Thus, the allowed regulated fraction should increase. We will calculate this up to the
relevant cut-off dates by determining the liabilities attributed to the active scheme
members in the regulated business and the movement from the position determined
at the previous price control.
1.22. After the relevant cut-off dates, for DPCR5, TPCR4 rollover and RIIO price
controls, it is necessary to attribute scheme assets and liabilities separately to the
established deficits at the respective cut-off dates and the incremental deficits
attributable to active members‟ service and bulk transfers after the cut-off dates. In
effect, this attribution will be used to update the regulatory fraction. Guidance on the
mechanism is being finalised with stakeholders and will be issued separately. We will
include this in the guidance notes to the initial and final proposals documents.
1.23. We will review the regulatory fraction at each reset of pension deficit
allowances in the RIIO price control period. At subsequent triennial resets, the
pension deficit allocation methodology will provide the individual amounts for the
notional sub-funds as follows:
regulated established deficit
unregulated established deficit
regulated incremental deficit
unregulated incremental deficit
1.24. The unregulated amounts will also include movements from bulk transfers in, in
accordance with principle 1.
Bulk transfers
1.25. During a price control period, there may be bulk transfers of members in or out
of a DB scheme through corporate activity (bulk transfers). These transfers are
usually only accepted when the transfer value finances the deficit, if any, of the
transferees. Bulk transfers in to a scheme require approval by trustees and as
specified by TPR66, they must be fully funded (in all but exceptional circumstances).
TPR guidance states: "There is no statutory obligation for a trust-based scheme to
accept transfers-in and provide benefits in exchange. Some schemes do offer defined
benefit transfer credits, typically in the form of added years counting for benefits on
the scheme's normal formula. Other schemes offer money purchase benefits in
exchange for transfers, in which case no issues arise as to assumptions for
determining benefits". It also states, "A transfer credit should not be expected to
require additional funding from the employer in the long term unless agreed by the
employer in advance”.
1.26. Under our commitment to fund the established deficits, movements in deficits
arising from bulk transfers67 that result from corporate transactions, whether fully
66 http://www.thepensionsregulator.gov.uk/guidance/guidance-transfer-values.aspx#s1806 67 Even if they include members other than active members

Office of Gas and Electricity Markets 114
RIIO-T1 and GD1 Financial Issues March 2011
Appendices
funded or not, are a risk for shareholders and not customers. This applies even
where the transferred protected person‟s pension liability is underfunded where it
arises from a corporate transaction.
1.27. Trustees may accept bulk transfers in to a scheme. These may include
protected persons who may or, may not, be considered part of the regulated
activities. We consider that these are not part of the established deficit and therefore
shareholders, not customers, will fund any increase related to the transferees at
future price controls. These must be reported as part of the incremental deficit.
1.28. This clarification covers only bulk transfers where individuals or groups of
individuals (but not whole, or substantially, whole schemes) are transferred as part
of a smaller transaction to acquire an activity rather than a licensee. We exclude a
full merger between two existing DB schemes because of a corporate transaction. We
will deal with this as a structural change (see above).
1.29. We cannot predict whether this treatment will be equitable to all situations. If
we are satisfied that there are exceptional circumstances, we retain the option to
deal with these on a case-by-case basis.
Principle 3 - Stewardship - Ante/Post Investment
Adjustments may be necessary to ensure that the costs for which allowance
is made do not include excess costs arising from a material failure of
stewardship.
1.30. We will disallow any excess costs arising from material failure in the
responsibility for taking good care of entrusted pension scheme resources. Examples
might include items such as recklessness, negligence, fraud or breach of fiduciary
duty. We will review stewardship and reserve our position to make adjustments to
allowances if we observe, for example, any of the following:
poor investment returns over a long period, eg longer than a single price control
whether the scheme investment managers are underperforming against their
peers or the market expectations and their performance has not been reviewed
or benchmarked at appropriate intervals
not matching investment/returns to fund future liabilities as they fall due
material increase in deficits and need for increasing the funding
maintaining a higher balance of investments in riskier assets compared to
investment returns which do not match future liabilities
accepting transfers in at under value
making transfers out at over value.
1.31. In determining whether pension costs are reasonable, we may compare the
level of funding rate recommended by periodic actuarial valuations to the actual
funding rate adopted by the licensee. As long as a funding valuation uses actuarial
assumptions, which are in line with best practice the costs will be included without
adjustment in the benchmarking of employment (or total) costs and be subject to

Office of Gas and Electricity Markets 115
RIIO-T1 and GD1 Financial Issues March 2011
Appendices
any incentivisation adjustment and the efficiency review set out in principle 1. This is
one potential indicator of whether there has been a material failure in stewardship.
We reserve our position to examine investment and administration costs to see
whether these are materially out of line with industry figures.
1.32. The choice of investment strategy is one for trustees and necessarily involves
the exercise of judgement, which, for any particular scheme and at any particular
point in time, the trustees are best placed to make. These pension principles make
clear that we do not think it is appropriate, given our statutory remit, for us to make
judgements about investment strategies. In particular, the success or otherwise of
any particular strategy can only be measured in hindsight, whereas trustees must
make ex ante choices. Moreover, the strategy, which optimises outcomes over the
whole life of a scheme, may produce inferior results over any particular shorter
period (and vice versa). Therefore, it would be inappropriate for us to make
judgements about investment strategies based on outcomes over the period of one
price control.
1.33. We will review investment returns over at least 10 years and investment
strategies as part of our efficiency reviews. Our review will also consider the effect
over time of scheme funding strategies.
Principle 4 - Actuarial Valuation/Scheme Specific Funding
Pension costs should be assessed using actuarial methods, on the basis of
reasonable assumptions in line with current best practice.
1.34. We expect the level of scheme funding to be assessed on the basis of forward
looking assumptions regarding long-run investment returns and other key variables.
Network operators are required to provide up-to-date actuarial calculations (including
the most recent formal actuarial valuation of the relevant schemes) to support their
business plan estimates. During an eight-year price control period, licensees are
required to provide annual up-dated valuations and triennial valuations to enable
resetting of ex ante and truing up ex post of opening adjustments on a rolling three-
year cycle. The cycle for all controls commences with full triennial and updated
valuations as at 31 March 2013.
1.35. We would not expect substantial differences between companies. However, if
an efficiency review identified an outlier, we will investigate as part of the second in-
depth stage of the efficiency review the reasons for this. If these investigations
reveal evidence of material differences, and these differences have contributed to an
increase in funding required we might adjust the recommended funding rate for the
purposes of setting the price control.

Office of Gas and Electricity Markets 116
RIIO-T1 and GD1 Financial Issues March 2011
Appendices
Principle 5 - Under Funding/Over Funding
In principle, each price control should make allowance for the ex ante cost
of providing pension benefits accruing during the period of the control, and
similarly for any increase or decrease in the cost of providing benefits
accrued in earlier periods resulting from changes in the ex ante
assumptions on which these were estimated on a case-by-case basis.
1.36. We will not make specific ex ante allowances or ex post adjustments for
ongoing pension service costs (which excludes scheme administration costs and PPF
levies). Instead, ongoing service costs form part of the overall benchmarking of costs
and as such are subject to the same incentive mechanisms for sharing under- or
over-spend.
1.37. The funding of any incremental deficit in excess of the established deficit at
the end of the DPCR5, TPCR4 and GDPCR1 price controls would be subject to the
same incentive mechanism as all other costs (including ongoing pension service
costs).
1.38. In principle we will apply the following guidelines to the funding of the
established deficit:
An attribution must be made of the deficit and its constituent assets and liabilities
between the established deficit and the incremental deficit
There will be a true up and reset of allowances every three years within a price
control. We will not specifically true up at the end of the each price control period
unless this coincides with the rolling three year true up and reset cycle.
We will undertake an efficiency review at the same time as the true up, as this
will determine whether the full difference between companies cash deficit funding
and allowances are adjusted, or whether there is a restriction because of
inefficiency. The review will be across all energy network operators and be timed
to coincide with the majority of scheme's triennial valuations.
The efficiency review will inform us as to whether a company‟s pension costs are
efficient, so that under principle 5, the network company can recover its
economic and efficient deficit funding costs irrespective of the allowance set at
the start of the control (and each subsequent reset). Where that initial review
indicates that the company‟s costs may be inefficient this may trigger a further
in-depth examination. That will determine the level of any additional funding if
either the outturn costs are higher than the allowances, or where the deficit has
increased and either is demonstrably due to inefficiencies. Conversely, where
outturn costs are lower than the ex ante allowances it will determine whether the
licensee should retain any, or a proportion of, the savings.
At each reset, deficit funding allowances will be reset based on our
methodologies.
Any under or over recovery of efficient pension costs against the allowance will
be adjusted in future revenues over the remaining years of the initial notional 15-
year funding period and be NPV neutral using the same discount rate as used for
annuitising the ex ante deficit allowances. The discount rate will be reset at the

Office of Gas and Electricity Markets 117
RIIO-T1 and GD1 Financial Issues March 2011
Appendices
same time as allowances. Customers will be unaffected by the actual funding
period used by companies.
As noted under principle 2, we will apply a revised regulatory fraction based on
the deficit allocation methodology at each reset. This will take into account when
there have been structural changes to a scheme in the price control period on a
case-by-case basis. We will change the element of the fraction related to
movements in unfunded ERDCs at each reset.
Unexpected lump sum deficit payments
1.39. These tend to occur in instances of change in corporate control, or through
corporate activity within the network company's wider group. Whilst the trustees
may take the opportunity to repair the deficit faster, it is not clear why customers
should pay an accelerated profile. Under RIIO, we will spread the true up over the
remaining period of the 15-year notional deficit funding period.
Principle 6 - Severance - Early Retirement Deficiency Contributions
Companies will also be expected to absorb any increase (and may retain the
benefit of any decrease) in the cost of providing enhanced pension benefits
granted under severance arrangements which have not been fully matched
by increased contributions.
1.40. Since 31 March 2004, Early Retirement Deficiency Contributions (ERDCs)
whether fully funded, partially funded or totally, unfunded, are a matter solely for
shareholders.
1.41. The principle requires that an adjustment be made to the allowances for future
price controls to exclude the impact of ERDCs resulting from redundancy and re-
organisation, which have been offset by use of surpluses, rather than being funded
by increased contributions.
1.42. This provides for consistent treatment with other restructuring and
rationalisation costs. For this purpose, it will be necessary to roll forward the
previously agreed amounts of unfunded ERDCs arising prior to 1 April 2004.

Office of Gas and Electricity Markets 118
RIIO-T1 and GD1 Financial Issues March 2011
Appendices
Appendix 8 – Regulatory asset value (RAV) methodology
Computing the regulatory asset value (RAV)
1.1. The RAV is a key building block of the price control review. RAV represents the
value upon which the companies earn a return in accordance with the regulatory cost
of capital and receive a depreciation allowance. In DPCR5, as a key element in our
approach to equalising incentives, we made a fundamental review of the means by
which costs are included in the RAV. We will follow this approach for all network
companies. The speed of money will be as follows:
an agreed percentage of totex (see below) will be funded as slow money (ie as an
addition to RAV)
the remainder will be funded as fast money (ie which is expensed and funded in
the year of expenditure)
1.2. At the end of each year of a price control, we will publish an indicative updated
RAV for each network company with a view to confirming the effective RAV at the
end of the period (March 2021). In ascertaining these values it is important that the
treatment of expenditure that network companies incur in this period is consistent
with the principles and specific issues set out in the final proposals – that is, the
same constituents of costs are added to the RAV (ie as the slow money). We add all
costs on a normal accruals basis. This excludes provisions, except for the actual cash
utilisation thereof. The definition of normal accruals will be set out in the Reporting
Instructions and Guidance document, prepared and amended in accordance with the
licence conditions.
Definition of totex
1.3. The annual net additions to RAV will be calculated as a percentage of totex.
Totex consists of all the expenditure relating to a licensees regulated activities with
the exception of:
all costs relating to de minimis activities
all costs relating to excluded services activities
pension deficit repair payments relating to the established deficit (see chapter 6)
and for the avoidance of doubt, all unfunded early retirement deficiency costs
(ERDC) post 1 April 2004
costs associated with specific incentive schemes (eg TIRG - see below)
all statutory or regulatory depreciation and amortisation
profit margins from related parties (except where permitted as defined below)
all additional costs relating to rebranding a company‟s assets or vehicles following
a name or logo change
fines and penalties incurred by the network company (including all tax penalties,
fines and interest)

Office of Gas and Electricity Markets 119
RIIO-T1 and GD1 Financial Issues March 2011
Appendices
compensation payments made in relation to standards of performance
bad debt costs and receipts (subject to an ex post adjustment to allowed
revenues)
any asset revaluation amounts
costs related to the SF6 incentive
reversing, where appropriate, any cost reporting which is not on a normal
accruals basis as referred to in paragraph 1.2 above
costs in relation to pass-through items, including business rates (except for
business rates on non-operational buildings). Pass through items include NTS exit
charges and Ofgem licence fees
interest, other financing and tax costs68 (except for business rates on non-
operational buildings and stamp duty land tax)
1.4. In addition, the incentive payment/deduction given/taken under the IQI sharing
mechanism where licensees have spent less/more than their allowance is included in
totex.
1.5. For avoidance of doubt, in each case normal ongoing pension service costs,
pension scheme administration costs and PPF levies will follow employment costs in
each activity to RAV. As with all categories of costs (and their component activities)
these are intended to be mutually exclusive.
1.6. Costs added to RAV are all intended to refer to costs incurred by the licensee or
a related party of the licensee undertaking regulated business activities. Where those
costs are recharged to the licensee, they should not include any internal profit
margins of the licensee or related party, except where permitted. The treatment of
related party margins is set out in paragraphs 1.12 to 1.23 below.
1.7. Costs that are eligible for logging up or reopener mechanisms will follow the
totex treatment as set out above at the time that they are allowed. However, there
will also be a separate table in the annual cost reporting returns (RRP) so that the
value of these items are separately recorded to facilitate any adjustment to revenue
as part of the review of logged up costs or any reopeners that have been triggered.
Deductions from RAV
1.8. The following items are not included in the costs added to the RAV but are
netted off additions to the relevant cost categories in carrying out the RAV roll
forward calculation:
cash proceeds of sale (or market value of intra-group transfer) of operational
assets – by netting off the proceeds from the calculated additions to RAV
cash proceeds of sale of assets as scrap – by netting off the proceeds from the
calculated additions to RAV
68 Tax costs include corporation tax, capital gains tax, payroll taxes, recoverable valued added tax and network rates

Office of Gas and Electricity Markets 120
RIIO-T1 and GD1 Financial Issues March 2011
Appendices
amounts recovered from third parties in respect of damage to the network – by
netting off the proceeds from the calculated additions to RAV
Spend not included as RAV additions
1.9. For the avoidance of doubt expenditure relating to the following areas is not
added to RAV:
LNG storage (except in limited instances where agreement is given in advance)
Metering
Other RAV requirements
Efficient costs
1.10. Ofgem reserves the option to disallow costs from the RAV for any of these
categories if they do not relate to the regulated business or are demonstrably
inefficient or wasteful. We will specifically review all costs in relation to restructuring
of a company‟s business or operations in relation to corporate transactions, including
the associated redundancy costs to satisfy ourselves that these costs are efficient
and will deliver future savings for the benefit of the consumer.
Restated costs
1.11. For all costs, in whatever category, activity or exclusion, where a company
makes any restatement of costs, we will apply these in to the year in which they
were originally incurred rather than in the year of the restatement.
Related party costs
1.12. Costs are only included to the extent they represent the cost of services
required by the licensees business. Costs for services recharged to the licensee by a
related party69 will only be admissible if the licensee would otherwise have needed to
carry out the service itself or procure it from a third party. We will expect these
services and associated costs to be itemised and justified. Such costs are only
included to the extent that they satisfy the criteria regarding the prohibition on
cross-subsidy in the relevant standard or standard special licence condition. Where
licensees already hold derogations to cover the charging and reporting of specified
shared services between two or more licensees under common ownership, then the
derogations have preference over these requirements.
1.13. All companies and related parties charging the licensee should be able to
demonstrate they have a robust and transparent framework governing the
attribution, allocation and inter-business recharging of revenues, expenses, assets
and liabilities. There should be documented procedures to demonstrate compliance
69 A related party is a term used to cover both Affiliate and Related Undertakings as defined in Standard Licence Condition 1 for electricity transmission and standard special licence condition for gas transportation

Office of Gas and Electricity Markets 121
RIIO-T1 and GD1 Financial Issues March 2011
Appendices
with EU Procurement directives and implementing national legislation where these
apply.
1.14. We would expect the network company to be able to justify the charge by
reference to external benchmarking, or by reference to market-related testing, or
tendering. We would expect related parties to be able to support their charges by
either service level agreements or contracts; and that such contracts would be
finalised on a timely basis and not remain in draft for an unreasonable period70.
1.15. The attribution of costs relating to shared services must be on a demonstrably
objective basis, not unduly benefiting the regulated company or any other company
or organisation and be based on the levels of service or activity consumed by each
entity. We expect licensees to document the basis on which they approve these at
board level and provide evidence of this together with details of how the continuing
assessment and challenge, annually takes place.
1.16. The basis should be consistent from year to year and where there are changes
the licensee should both document and justify them.
1.17. The method used to attribute costs from the related party to the licensee and
to activities should be transparent and the revenues, costs, profits, assets and
liabilities separately distinguishable from each other.
Related party margins
1.18. We will exclude related party profit margins from costs added to RAV unless
the related party concerned earns at least 75 per cent of its turnover from sources
other than related parties and charges to the licensed entity are consistent with
charges to external customers. For this purpose, we consider an entity to be a
related party if it is an affiliate or related undertaking or if that entity and the
network company have any other form of common ownership. A key indicator of
entities being in common ownership is that they are affiliates of the ultimate
controller (or controllers where there is more than one).
1.19. Where network operators utilise captive insurance companies, these shall be
excluded from the related party exclusion. We will not allow any excess losses
relating to these captive insurers (to the extent that they are covered by captive
insurers) to be funded by customer.
1.20. When an entity ceases to be a related party, for example on a change in
ultimate controller, then from the time it ceases to be a related party its margins will
be allowable, if it meets the following requirement. There must be an unambiguous
demonstration that its charges to the distribution business (in the original or
amended contract) remain competitive and are in line with market rates, or the
contract was re-tendered and that there was more than one bidder.
70 Whilst not defined, we expect licensees to demonstrate to our satisfaction why a period in excess of 6 months was reasonable

Office of Gas and Electricity Markets 122
RIIO-T1 and GD1 Financial Issues March 2011
Appendices
1.21. Whilst not precluding other demonstrations of competiveness, we consider that
an open competitive tender is likely to be the clearest indicator. In the absence of an
open competitive tendering exercise, we will seek strong evidence that the terms of
any contract are competitive.
1.22. Irrespective of whether the network company demonstrates competition and
they no longer disallow margins, the licensee must arrange to comply with the
requirements of the relevant standard or standard special licence condition (on the
maintenance and provision of information). It must continue to report the former
related party‟s costs and margins as if it were still a related party for the remainder
of the price control period. The data is required in order for us to be able to monitor
performance against the price control and carry out cost analysis to inform future
reviews.
1.23. Where a principal related party resource provider71 ceases to be a related
party during a price control period, for example on the restructuring of a group, we
shall continue to treat them as a related party until the end of that price control
period and we will continue to disallow the margins charged. At the next price control
period the margins will be allowed provided that there is unambiguous demonstration
that the charges to the regulated business (in the original or amended contract)
remain competitive and are in line with market rates, or that the contract is re-
tendered and that there is more than one bidder.
RAV calculation 2011-12 and 2012-13
1.24. The RAV additions used in determining prices for RIIO-T1 and GD1 will rely on
company forecasts for 2011-12 and 2012-13. The companies will provide this in their
business plan forecasts.
1.25. In the event that actual RAV additions for these years turn out to be materially
different to the estimates, we will restate the RAV and alter revenues two years after
the close of the TPCR4 rollover or GDPCR1. We will clawback the benefits of any
under-spend in 2011-12 and 2012-13 relative to the estimates used in the final
proposals at this time and alter the revenue accordingly.
1.26. An assessment of the efficiency of any capex spend will be carried out as part
of the price control review work. We will make adjustments relating to TPCR4 and
GDPCR1 at that time, if appropriate.
1.27. We shall also restate the RAV to take into account any over or under spends
relating to the previous price control periods for both the GDNs and for the TOs
where RAV additions have to date been based on forecast expenditure. We shall
adjust revenue as necessary to reflect any over or under funding that may have
occurred.
71 A principal related party resource provider is one that has a contract to operate or manage a substantial part of a licensee's day-to-day operations, and that the licensee entered into the contract before or as part of the arrangements for a change in ultimate controller, or controllers, where there is more than one

Office of Gas and Electricity Markets 123
RIIO-T1 and GD1 Financial Issues March 2011
Appendices
Gas Distribution specific RAV items
1.28. This section details issues specific to gas distribution licensees.
1.29. In the December document (see RIIO-GD1 Outputs and incentives document)
we consulted on the future approach to the Fuel Poor Network Extensions scheme.
The additions to RAV under the existing arrangement are logged up and we deal with
these at the end of the price control. In certain cases, an additional amount is added
to the RAV as an incentive payment. This incentive amount is removed from the RAV
after five years. This approach will cease in RIIO-GD1 and future additions under this
scheme will be added to RAV in the same manner that we deal with other totex.
1.30. We also consulted within the policy section on the future of Xoserve. We will
deal with the costs relating to Xoserve in a consistent manner with the totex
approach. We will detail this when the policy approach is confirmed.
Transmission specific RAV items
1.31. Within transmission, there are various schemes that deal with the funding of
costs that are considered uncertain at the time of the last price control. Where
specific scheme funding is applicable (eg Transmission Incentive for Renewable
Generation (TIRG) projects) we will continue to deal with these in accordance with
the conditions under which they were established. Where we revise or introduce new
incentives we expect these to be on a totex basis so that existing incentives will be
appropriate. If we consider that there are good reasons why applying the totex
approach to incentive funding will cause unintended consequences we will either not
use this approach or will restate the percentage allocation to totex.
1.32. TIRG covers a finite number of schemes for which licensees report the
expenditure separately, where the scheme allows efficiently incurred expenditure
into RAV five years after completion of construction, and the agreed outputs have
been delivered. In the interim, we consider the costs to be in a shadow72 RAV. We
will add the capex under this scheme to RAV as already established (subject to the
efficiency review).
1.33. TO Incentive expenditure is a scheme that provides funding for agreed major
schemes between price controls. In RIIO-T1, we will add the efficiently incurred
capex for these schemes to RAV on a totex basis. For schemes that commence in
TPCR4 we will continue the existing approach until the schemes have concluded.
1.34. Regulatory work in progress (WIP) relates to expenditure by NGET only. It
relates to situations where they have incurred revenue driver expenditure but the
project is incomplete and the outputs are yet to be delivered. To avoid penalising
72 Shadow RAV: a notional pool of expenditure relating to specific schemes where it has been agreed that the expenditure will be added to RAV at a later time.

Office of Gas and Electricity Markets 124
RIIO-T1 and GD1 Financial Issues March 2011
Appendices
non-delivery of outputs, we match the addition of the WIP to RAV upon delivery of
the outputs and we will make this on a totex basis.
1.35. We treat some costs, which may be uncertain in nature and size at the price
review, as logged up for RAV purposes (subject to agreement). Network companies
report these costs separately and we will review them prior to the next price control
period for efficiency. In the interim, we will add the assessed values on a totex basis
to RAV, two years in arrears on an NPV neutral basis.
1.36. Critical national infrastructure expenditure is added to RAV on completion of
the work subject to the agreement of DECC. This will be on a totex basis.
1.37. Revenue drivers refer to a scheme for electricity TO load related capex. For
SHETL and SPTL, we treat the expenditure under these schemes as an immediate
addition to RAV with a full efficiency review at the end of the price control. The
allowed revenue of the licensees is uplifted each year by the additional return and
depreciation allowable. In these circumstances, no further adjustment to RAV should
be necessary.
1.38. The scale of generation capacity added or removed complicates revenue drivers
for NGET. To date the additions to RAV have been determined at the end of the price
control period. The treatment of revenue drivers is discussed within the policy
document and the RAV treatment will be clarified according to the outcome of that
review.
1.39. The gas capacity investment incentive scheme relates only to NGG. Under this
scheme, RAV additions occur relative to the date of release of capacity. Where
projects already exist under this scheme, we will deal with them in accordance with
the existing RAV arrangements. We will treat future schemes in RIIO-T1 on a totex
basis for RAV additions.
SO RAV
1.40. The two system operators (NGET and NGG) have their own RAVs. We will use a
totex approach for RIIO-T1 calculating the percentage allocation to RAV on the same
basis as for the TO licensees.
1.41. The existing SO gas revenue driver incentive for Entry and Exit will continue for
TPCR4 schemes.
1.42. Future incentive schemes are expected to adopt a totex approach but the effect
on RAV will be clarified as each incentive is confirmed.