Embed Size (px)
Citation preview

Decision-Making Under Uncertainty in ResearchSynthesis: Designing for the Garden of Forking Paths
Alex KaleUniversity of Washington
Seattle, [email protected]
Matthew KayUniversity of MichiganAnn Arbor, [email protected]
Jessica HullmanNorthwestern University
Evanston, [email protected]
ABSTRACTTomake evidence-based recommendations to decision-makers,researchers conducting systematic reviews andmeta-analysesmust navigate a garden of forking paths: a series of analyticaldecision-points, each of which has the potential to influencefindings. To identify challenges and opportunities related todesigning systems to help researchers manage uncertaintyaround which of multiple analyses is best, we interviewed11 professional researchers who conduct research synthe-sis to inform decision-making within three organizations.We conducted a qualitative analysis identifying 480 analyt-ical decisions made by researchers throughout the scien-tific process. We present descriptions of current practices inapplied research synthesis and corresponding design chal-lenges: making it more feasible for researchers to try andcompare analyses, shifting researchers’ attention from ratio-nales for decisions to impacts on results, and supporting com-munication techniques that acknowledge decision-makers’aversions to uncertainty. We identify opportunities to designsystems which help researchers explore, reason about, andcommunicate uncertainty in decision-making about possibleanalyses in research synthesis.
CCS CONCEPTS• Information systems → Decision support systems; •Human-centered computing → Visualization theory,concepts and paradigms.
KEYWORDSRepresenting Uncertainty, Research Synthesis
Permission to make digital or hard copies of all or part of this work forpersonal or classroom use is granted without fee provided that copiesare not made or distributed for profit or commercial advantage and thatcopies bear this notice and the full citation on the first page. Copyrightsfor components of this work owned by others than the author(s) mustbe honored. Abstracting with credit is permitted. To copy otherwise, orrepublish, to post on servers or to redistribute to lists, requires prior specificpermission and/or a fee. Request permissions from [email protected] 2019, May 4–9, 2019, Glasgow, Scotland UK© 2019 Copyright held by the owner/author(s). Publication rights licensedto ACM.ACM ISBN 978-1-4503-5970-2/19/05. . . $15.00https://doi.org/10.1145/3290605.3300432
ACM Reference Format:Alex Kale, Matthew Kay, and Jessica Hullman. 2019. Decision-Making Under Uncertainty in Research Synthesis: Designing for theGarden of Forking Paths. In Proceedings of CHI Conference on HumanFactors in Computing Systems Proceedings (CHI 2019). ACM, NewYork, NY, USA, 14 pages. https://doi.org/10.1145/3290605.3300432
1 INTRODUCTIONOrganizations routinely rely on prepared summaries of em-pirical evidence to support decision-making. For example,the Navy employs scientists who review scientific literatureand collect data internally in order to recommend improve-ments in training practices. Similarly, Veterans’ Affairs em-ploys researchers who meta-analyze the scientific literatureon treatments for post-traumatic stress disorder (PTSD) andother conditions in order to recommend the best possibletreatment options for veterans struggling with trauma.When compiling and communicating a summary of sci-
entific evidence, researchers make a series of analytical de-cisions such as how to combine information from studiesconducted with different measures or in different settings.Recent work in reproducible statistics [64, 65, 67, 69, 77],driven by concerns about a “replication crisis”, demonstrateshow flexibility in decision-making produces multiple pos-sible sequences of analytical decisions, which an analystchooses between at their discretion. In the context of re-search synthesis, alternative possible analyses may lead toalternative understandings of empirical evidence and conse-quently, opposite or inconclusive recommendations. Facedwith a “garden of forking paths” [26], researchers cannoteliminate subjectivity and uncertainty from the scientificprocess. Instead, scholars suggest that researchers shouldattempt to understand which analytical decisions impactresults [67, 69].By identifying researcher degrees of freedom [77] as a
cause of the “replication crisis”, prior work seems to focusblame on the indiscretions of individual researchers. How-ever, with existing software to tools, it is difficult for re-searchers to deliberate about and explore the consequencesof alternative analyses (e.g., [67, 69]), such that even re-searchers with honest intentions may struggle to perceivethe implications of different choices. In this study, we seek an

in-depth understanding of how researchers make analyticaldecisions in research synthesis, and where they struggle withuncertainty in the process, in order to identify opportunitiesto design for decision-making in the garden of forking paths.
We contribute the results of a qualitative analysis of open-ended conversational interviews we conducted with 11 re-searchers who work to support evidence-based decision-making at three institutions: the Navy, the Medical Centerat a large public university, and the Veterans’ Affairs Medi-cal Center in a major US city. In our interviews we eliciteddetailed descriptions of experiences conducting scientificreview and analysis, emphasizing the reasoning behind an-alytical decisions and the strategies that researchers use tomanage uncertainty. Based on these interviews, we identifya set of challenges around managing uncertainty in researchsynthesis: the tension between surveying analysis paths andimplementing a specific path, the disconnect between re-searchers’ rationales for analytical decisions and the actualimpact of those decisions on findings, and the balance be-tween researchers’ skepticism and the need for compellingrecommendations. We draw on utility theory [75] and priorwork on reliable statistics and uncertainty visualization, incombination with our interviews, to identify opportunitiesto address these challenges by designing systems which en-courage exploration of alternative analyses, elicit and repre-sent researchers’ reasoning about analytical decisions, andprovide researchers with techniques to communicate uncer-tainty in the research process.
2 BACKGROUNDManaging Uncertainty in Decision-MakingA large body of research on judgment and decision-making(JDM) has examined how people reason with and make deci-sions under uncertainty. Canonical work by Tversky and Kah-neman [37, 73] established that people often seek to reduceuncertainty, sometimes by substituting heuristic judgmentsfor more complex reasoning. A drive to reduce uncertaintycan lead to unwarranted expressions of certainty [52], whichhas consequences for decision-making individually and atan organizational level (e.g., in public policy).Decision-making under uncertainty is characterized by
feelings of conflict and doubt which block or delay a choicebetween alternative courses of action [55]. As such uncer-tainty is broadly defined and associated with a variety ofterms [10, 47] such as ambiguity [32, 54], risk [1, 3, 49], unre-liability, imprecision, incompleteness, and contradiction [44],as well as error and subjectivity [50]. Based on a literaturereview of work describing real world decision-making undervarying forms of uncertainty, Lipshitz and Strauss [47] devel-oped a framework for understanding how decision-makersin organizations like the military cope with uncertainty. In
their framework uncertainty is either acknowledged throughpreemptive action and planning, reduced through rule- orassumption-based reasoning, or suppressed through ignor-ing information or guesswork. We borrow these strategiesfrom Lipshitz and Strauss to characterize analytical decisionsdescribed by our participants during interviews.
Systematic Review and Meta-AnalysisSystematic review andmeta-analysis are methodologies usedto produce a rigorous summary of existing evidence on atopic. Using systematic review, researchers account for sci-entific literature within a consistent framework and char-acterize the research to date on a particular topic [58]. Asan extension of systematic review, researchers sometimeschoose to aggregate quantitative results from studies througha meta-analysis [17, 46, 58]. Meta-analysis produces an esti-mate of the effect size of an intervention by pooling statisticaloutcomes from studies conducted under similar conditions.
Ideally, when prescribed procedures are followed, system-atic review and meta-analysis offer more robust findings 1
than regular literature review and quantitative analysis, re-spectively [58]. A typical systematic review starts with aquestion about the effect of some intervention and databasequeries to find all the relevant literature. Researchers inde-pendently judge which articles to include and exclude fromthe review and then resolve disagreements. Since workingin pairs is standard practice, this is sometimes called dual-review. For each study, researchers document informationon effect sizes and contextual factors (e.g., research design,subject populations) in spreadsheets, sometimes called ev-idence tables. The data collected in evidence tables is thenstatistically aggregated in meta-analysis. Following theseprocedures helps researchers answer a targeted researchquestion while to mitigating potential biases (e.g., selectionbias, confirmation bias) that might otherwise accrue.
In practice, researchers sometimes do not adhere strictly tothese standards. Researchers under time pressure may takeshortcuts (i.e., rapid review [24, 40, 76]) by surveying theliterature through citation trails or by making inclusion andexclusion decisions individually. If the literature on a topicis sparse or studies cover a variety of populations and con-texts, it is difficult to follow conventions of systematic reviewand conventional meta-analysis may be inadvisable [17, 46].Researchers may choose to conduct a scoping study [2, 45]in which they survey the breadth of literature to identifygaps in knowledge. The impacts of rapid review and scopingstudy methods on quality of findings have only been studiedrecently [60, 72], and there is disagreement about best prac-tices. We contribute a characterization of the gap betweenbest practice and actual practice.
1See Manski’s critique [53] about difficulty interpreting meta-analyses.

Softare for Research SynthesisInteractive systems for research synthesis offer relativelylittle support for reasoning about possible analysis paths.Software tends to provide features for common steps inthe analysis process such as forms for risk of bias assess-ment [16, 71], data extraction [16, 71], or creating forest andfunnel plots of meta-analytic results [6, 9, 16, 71, 74]. Addi-tionally, most tools focus exclusively on a single stage in theanalysis process [5] such as study screening [59] or meta-analysis [6, 9, 74]. Designing research software as a set ofisolated optional procedures forces the researcher to conductalternative analyses sequentially and separately. Further, thisdesign fails to represent the motivations and constraints thatdrive researchers’ decision-making.
Three tools in particular—RevMan [16], Eppi-Reviewer [71],and Rayyan [59]— offer collaboration features, such as roleassignment [16], review flow diagrams [71], and coding dis-agreement overviews [59], which help researchers coordi-nate and review their work. However, with the exception ofhighlighting disagreements about study inclusion/exclusion(a decision with implicit alternatives), these features do nothelp researchers identify and weigh alternative analyses.Eppi-Reviewer [71] allows users to create custom “codesets”and annotations to code the status of studies under reviewand take notes. However, researchers may overlook the ben-efits of using these features to document motivations andconstraints that guide their analyses in order to support laterrecall or scrutiny, instead using them inconsistently or notat all. Rayyan [59] uses a pulldown interface to enable re-searchers to select or create a reason for their decision toinclude/exclude a study. While this elicitation technique isa promising way of linking reasoning to decisions, Rayyandoes not document competing motivations or constraintsunless they are provided by different users who disagreeabout study screening.We point to opportunities for tools to better support re-
searchers in exploring, reasoning about, and communicatinguncertainty about alternative analyses.
3 METHODWe conducted open-ended conversational interviews withprofessional researchers to investigate practices in appliedresearch synthesis. The goals of these interviews were to(1) characterize how researchers manage possible analysispaths, (2) gather information about the reasoning behindtheir choices, and (3) study how interactive systems can sup-port awareness of uncertainty in analytical decision-making.
Sampling ParticipantsWe employed convenience and snowball sampling [19] tofind 11 professional scientists to interview for our study.
First, we reached out to four professors at the Medical Cen-ter of a large public university who had recently published atleast one systematic review or meta-analysis to advocate forevidence-based practices, such as utilitarian healthcare poli-cies. Through these professors, we were able to interviewone additional postdoctoral researcher studying teachingstrategies in STEM. Second, we recruited two PhDs from theVeterans’ Affairs Medical Center in a major US city work-ing on systematic review and meta-analysis to recommendtreatments for veterans with post-traumatic stress disorder(PTSD) and substance use disorder (SUD). Last, we used con-nections in the Navy to recruit four scientists using researchsynthesis to recommend improvements in training practicesfor military pilots. Of all the 13 people we contacted, onlytwo declined to interview. Our sample represents peopledoing research synthesis in formal professional settings.
Interview GuideWe created an open-ended conversational interview guide [48,56] with the objective of getting participants to discuss theirresearch practices in terms of specific examples. The inter-view guide was a list of topics of interest regarding decision-points at different stages of the research process: scopingresearch questions, sampling literature, assessing and orga-nizing evidence, analysis and visualization, and communicat-ing findings (see Supplemental Material 2). For the first fiveinterviews, the guide was formatted as a list of questions, butwe abridged these questions to a list of topics [48] coveringthe same content in order to better accommodate the needto ask questions in terms of the experiences of individualresearchers [56], whose work varied in methods and settings.Most often the interviewer broached a topic by asking aquestion of the form, “How did you...” For example, “Whenyou conducted that literature review, how did you decidewhich papers to include or exclude from your review?” Theinterviewer also asked follow-up questions to seek clarifica-tion or greater detail about particular analytical decisions.The interview guide structured our conversations around aconsistent set of topics while allowing flexibility to probe fora greater depth of description when necessary.
Qualitative Coding ProcessAll interviews, transcription, qualitative coding, and analysiswere conducted by the first author, with iterative feedbackon the coding and analysis framework from the other twoauthors. The analyses presented in this paper represent theperspectives of our participants systematically curated inan interpretive framework which was developed throughdiscussions among the authors.
2https://github.com/kalealex/analysis_paths_research_synthesis/tree/master/interview
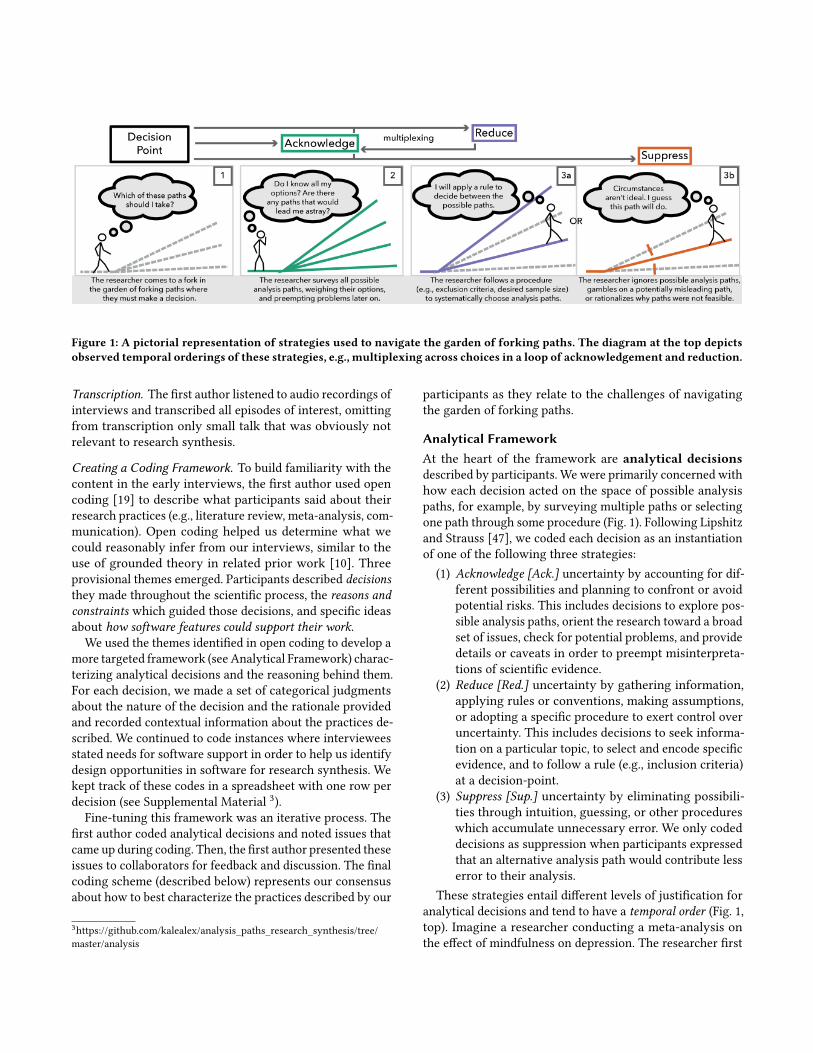
Figure 1: A pictorial representation of strategies used to navigate the garden of forking paths. The diagram at the top depictsobserved temporal orderings of these strategies, e.g., multiplexing across choices in a loop of acknowledgement and reduction.
Transcription. The first author listened to audio recordings ofinterviews and transcribed all episodes of interest, omittingfrom transcription only small talk that was obviously notrelevant to research synthesis.
Creating a Coding Framework. To build familiarity with thecontent in the early interviews, the first author used opencoding [19] to describe what participants said about theirresearch practices (e.g., literature review, meta-analysis, com-munication). Open coding helped us determine what wecould reasonably infer from our interviews, similar to theuse of grounded theory in related prior work [10]. Threeprovisional themes emerged. Participants described decisionsthey made throughout the scientific process, the reasons andconstraints which guided those decisions, and specific ideasabout how software features could support their work.
We used the themes identified in open coding to develop amore targeted framework (see Analytical Framework) charac-terizing analytical decisions and the reasoning behind them.For each decision, we made a set of categorical judgmentsabout the nature of the decision and the rationale providedand recorded contextual information about the practices de-scribed. We continued to code instances where intervieweesstated needs for software support in order to help us identifydesign opportunities in software for research synthesis. Wekept track of these codes in a spreadsheet with one row perdecision (see Supplemental Material 3).
Fine-tuning this framework was an iterative process. Thefirst author coded analytical decisions and noted issues thatcame up during coding. Then, the first author presented theseissues to collaborators for feedback and discussion. The finalcoding scheme (described below) represents our consensusabout how to best characterize the practices described by our
3https://github.com/kalealex/analysis_paths_research_synthesis/tree/master/analysis
participants as they relate to the challenges of navigatingthe garden of forking paths.
Analytical FrameworkAt the heart of the framework are analytical decisionsdescribed by participants. We were primarily concerned withhow each decision acted on the space of possible analysispaths, for example, by surveying multiple paths or selectingone path through some procedure (Fig. 1). Following Lipshitzand Strauss [47], we coded each decision as an instantiationof one of the following three strategies:(1) Acknowledge [Ack.] uncertainty by accounting for dif-
ferent possibilities and planning to confront or avoidpotential risks. This includes decisions to explore pos-sible analysis paths, orient the research toward a broadset of issues, check for potential problems, and providedetails or caveats in order to preempt misinterpreta-tions of scientific evidence.
(2) Reduce [Red.] uncertainty by gathering information,applying rules or conventions, making assumptions,or adopting a specific procedure to exert control overuncertainty. This includes decisions to seek informa-tion on a particular topic, to select and encode specificevidence, and to follow a rule (e.g., inclusion criteria)at a decision-point.
(3) Suppress [Sup.] uncertainty by eliminating possibili-ties through intuition, guessing, or other procedureswhich accumulate unnecessary error. We only codeddecisions as suppression when participants expressedthat an alternative analysis path would contribute lesserror to their analysis.
These strategies entail different levels of justification foranalytical decisions and tend to have a temporal order (Fig. 1,top). Imagine a researcher conducting a meta-analysis onthe effect of mindfulness on depression. The researcher first
decides to search the “gray literature” (i.e., unpublished orunconventional sources), orienting the scope of their searchbefore engaging in targeted information retrieval, an exam-ple of the acknowledgement strategy. Decisions which ac-knowledge uncertainty often steer research broadly, survey-ing possible analysis paths and associated trade-offs prior todefinitive choices about how to implement the analysis. Next,while reviewing the gray literature for their meta-analysis,the researcher decides to search unpublished dissertationsfor relevant data, an example of the reduction strategy. Deci-sions which reduce uncertainty use specific procedures tonavigate analysis paths, sometimes pruning away possiblepaths by omission. Reduction often builds on acknowledge-ment by implementing the broad goals identified in acknowl-edgement through a specific approach to analysis. Whilestill engaged in data collection for their meta-analysis onmindfulness, the researcher chooses not to examine the riskof bias in individual studies in their sample. The researcherknows this is not ideal but rationalizes this decision becausethey have limited time to conduct their analysis. Decisionswhich suppress uncertainty are often necessary but unjusti-fiable compromises in response to situational factors whichare sometimes beyond the researcher’s control. Suppressionsubstitutes for acknowledgment or reduction strategies.
We also coded aspects of decision context.We recorded thestage in the research process (e.g., question formation, lit-erature review, meta-analysis) for each decision. This allowedus to compare the relative frequencies of different strategiesat different stages in the research process, roughly followingthe way that Wicherts et al. [77] break up researcher degreesof freedom into different phases of analysis.
We coded the reason given for each decision (e.g., striv-ing for reproducibility, limited availability of information,standard practices). Sometimes these reasons were not ex-plicitly stated, and we had to infer them from the broadercontext of our discussions with participants. Coding the rea-sons for each decision allowed us to examine what factorsmotivated participants to engage in each strategy.
We extended the notion of the garden of forking paths tocommunicative andorganizational decisions.We codeda distinction between decisions which have a direct impacton the final written report of results and decisions whichhave an indirect impact on results through interpretive andcommunicative aspects of the scientific process. This dis-tinction allowed us to highlight analytical decisions withimpacts that may be difficult or impossible to quantify.
We also codedmetadata such as the participant, their fieldof study, and the goal of their project. Lastly, we noted whena decision was associated with a particular need for softwarefeatures or a particular threat to validity. These passagesinformed our discussion of challenges and opportunities indesigning for the garden of forking paths.
4 RESULTS
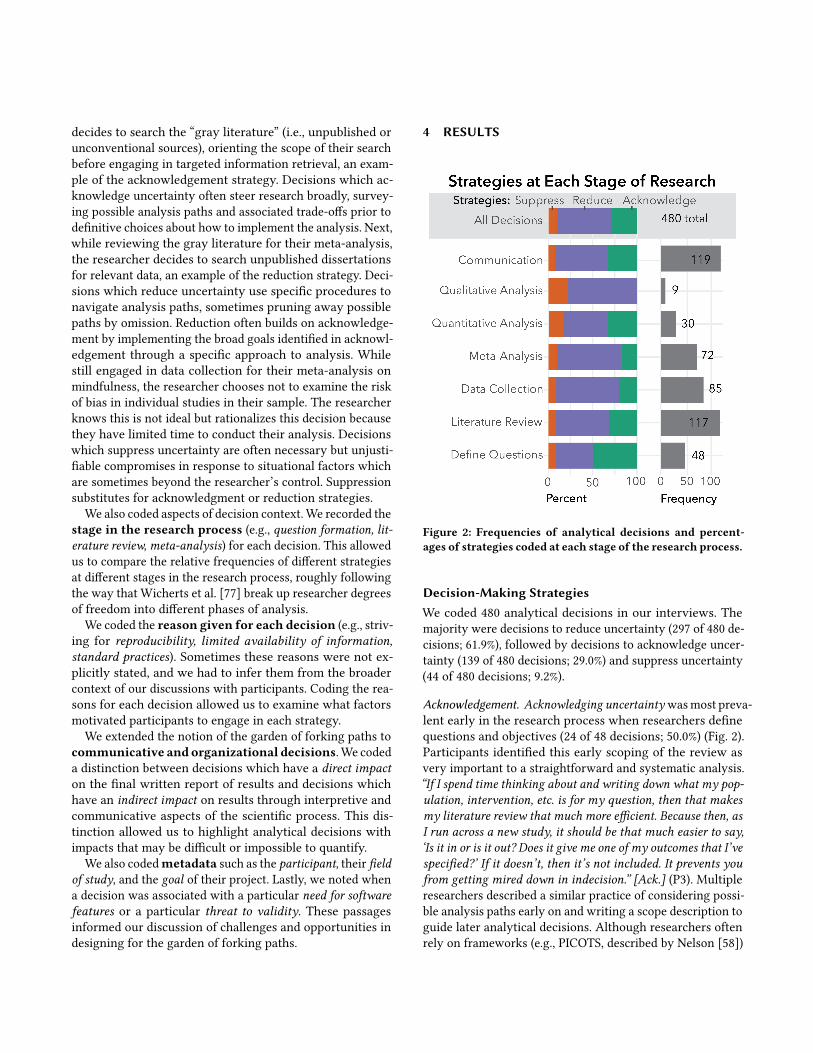
Figure 2: Frequencies of analytical decisions and percent-ages of strategies coded at each stage of the research process.
Decision-Making StrategiesWe coded 480 analytical decisions in our interviews. Themajority were decisions to reduce uncertainty (297 of 480 de-cisions; 61.9%), followed by decisions to acknowledge uncer-tainty (139 of 480 decisions; 29.0%) and suppress uncertainty(44 of 480 decisions; 9.2%).
Acknowledgement. Acknowledging uncertaintywasmost preva-lent early in the research process when researchers definequestions and objectives (24 of 48 decisions; 50.0%) (Fig. 2).Participants identified this early scoping of the review asvery important to a straightforward and systematic analysis.“If I spend time thinking about and writing down what my pop-ulation, intervention, etc. is for my question, then that makesmy literature review that much more efficient. Because then, asI run across a new study, it should be that much easier to say,‘Is it in or is it out? Does it give me one of my outcomes that I’vespecified?’ If it doesn’t, then it’s not included. It prevents youfrom getting mired down in indecision.” [Ack.] (P3). Multipleresearchers described a similar practice of considering possi-ble analysis paths early on and writing a scope description toguide later analytical decisions. Although researchers oftenrely on frameworks (e.g., PICOTS, described by Nelson [58])

to guide scope development, links between scope and subse-quent decisions are maintained in digital or paper notes ifthey are documented at all.
We also see relatively more acknowledgement during litera-ture review (37 of 117 decisions; 31.6%), quantitative analysis(10 of 30 decisions; 33.3%), and communication (39 or 119decisions; 32.8%) than in data collection (17 of 85 decisions;20.0%) and meta-analysis (12 of 72 decisions; 16.7%) (Fig. 2).Researchers acknowledge uncertainty in later stages of re-search mostly to confront irreducible sources of uncertainty.For example, one researcher in the Navy described usingcaveats to qualify information gathered through interviewswith Navy personnel. “Usually it ends up being a time issueor access. [We] did not have time to go out and validate thatthis is how they actually perform the work on the job. Wejust take people’s word for it.” [Ack.] (P2). In a similar case ofacknowledgement to avoid potential misunderstandings ofevidence, another researcher described checking the qual-ity of available data. “I’ll use data visualization as I’m goingthrough the process to see if there are things that look reallyweird. Like, I’ll make a little ggplot and look to see if things arefalling in the range that I expect them to.” [Ack.] (P9). Whenavailable information or resources constrain analysis paths,researchers tend to rely on acknowledgement to communi-cate limitations or check impacts on data quality.
Reduction vs Suppression. The high frequency of strategies toreduce uncertainty at every stage in analysis (Fig. 2) suggeststhat researchers often employ rule-based reasoning when im-plementing their scientific review and analysis. These rulesare a mix of standard practices and lab-specific procedures.For example, one researcher studying behavioral treatmentsfor PTSD augmented the common practice of meta-analyzingonly between-subjects experiments by looking separately atwithin-subjects evaluations to validate the treatment effectwithin an individual. “Most meta-analyses only look at thebetween-group [studies], and they just assume that there issufficient within-subject change to warrant doing any of it. Idon’t think that is as useful. That’s the other big thing we areadding with this meta-analysis are these within-subjects teststo contextualize the between-group [effect]. I’ve never seen ameta-analysis in my area that does both, but systematic re-views do.” [Red.] (P10). All researchers expressed awarenessof best practices and deviated from them at times, but re-searchers had different attitudes about when and how muchit was appropriate to bend the rules.Sometimes researchers have little choice but to follow a
path which they know is not ideal. For example, a Navy sci-entist measuring in-flight blood-oxygen levels to fill a gap inexisting evidence described a decision to use finger-mountedmonitors rather than more precise head-mounted monitors.“Constraints of the experiment make it so that you can’t get
big head-mounted monitors and have a pilot wear their helmetat the same time. You have to make concessions where youcan and realize that there’s going to be some variability anderror in your data just based on where your monitors are at.”[Sup.] (P5). The participant went on to describe how theywould acknowledge this measurement error in their writtenreport. When the best option available to researchers addsa source of error to analysis, the line between strategies ofreduction and suppression is blurred, and researchers needto document how their analysis is constrained in order toalert stakeholders to potential suppression of uncertainty.
Although we code suppression of uncertainty infrequently(44 of 480 decisions; 9.2%), we suspect that suppression isunderrepresented in our sample because researchers may notrecognize or admit when decisions introduce greater errorthan other viable alternatives. For example, “We are for surenot including any qualitative research. The only two outcomemeasures we are interested in are exam score and failure rate.So maybe active learning changed how students feel about [theclassroom climate], and maybe they have qualitative data froma survey. We are not including that either, and that’s drivencompletely by our research question.” [Red.] (P4). Althoughthe researcher attributed the decision to ignore qualitativework to their research question, earlier in our interview theydescribed potential biases in the framing of their researchquestion. “Before we started this meta-analysis, we wonderedif maybe class size would be an explanatory variable in howwell active learning works, or subject area, or whether it’s anintro class or an upper-division class. Things like that, ourrelatively small research team came up with those things, sothere’s totally a bias present in the things that we omitted andthe things that we included.” [Sup.] (P4). Researchers needways to represent and keep track of the reasoning behindanalytical decisions in part because, as this researcher putit, “Defining where the personal bias is coming in and wherespecifically it’s problematic would be important.” (P4). Weargue that helping researchers document sources of bias,and how they influence analytical decisions throughout aresearch project, would serve to identify situational sourcesof uncertainty which are opaque in current research practice.
Communicative and Organizational PracticesWe made a distinction between decisions which have directimpact on the content presented in the written report of find-ings and decisions which have indirect impact on findings.Decisions with indirect impact do not change the quantita-tive or qualitative evidence presented in the written reportof findings, but they change the way evidence is recorded inwork documents and framed in meetings with collaboratorsor presentations to stakeholders. These social and commu-nicative aspects of the research process have the potential toimpact how findings and recommendations are interpreted.

Decisions with indirect impact rely more on acknowledginguncertainty (79 of 201 decisions; 39.3%) than decisions withdirect impact (60 of 279 decisions; 21.5%). Often these aredecisions about how to organize or manage a review. “Wecreate a timeline and meet once a week to share what we’velearned... and see where we have some challenges that we needto work on. If we’ve got to jump in and help someone else, thenwe’ll do that too.” [Ack.] (P6). Decisions to discuss issues withcollaborators often serve to acknowledge possible ways ofhandling subsequent decisions with direct impact, such ashow to sample the literature. “When the [search] term isn’tclear, it’s a nightmare... That’s sort of this ongoing iterativeprocess, and honestly I don’t think there’s a way around it...The conversations with collaborators have been the best wayto [narrow the scope] in my experience.” [Ack.] (P9).
Other times, decisionswith indirect impact are about check-ing the evidence in the review to preempt potential problemslater on. “Before the literature search is a tenth over, you shouldrevisit your template against the literature you’ve examined.You can double-check your template [for the evidence table] tomake sure it’s right, and you adjust it.” [Ack.] (P7). By check-ing that the columns of the evidence table adequately reflectimportant themes in the literature, the researcher ensuresthat their review is comprehensive. Decisions with indirectimpact are scattered across notes, spreadsheets, and personalcorrespondences, yet they play an important role in shapingthe scientific process behind the scenes.
In contrast, decisions with direct impact tend to rely moreon the reduction strategy (190 of 279 decisions; 68.1%) thandecisions with indirect impact (107 of 201 decisions; 53.2%).For example, one participant described a relaxed approachto systematic review which did not rely on evidence tables.“We were kind of looking for whether a study was really soundor not. Some were more easily brushed aside because it seemedlike their research design was not something we would havefollowed, so we trusted each other to weed some of those outearly on.” [Red.] (P6). This researcher’s team excluded andreviewed studies outside the context of a consistent tem-plate. When asked if they would use an evidence table, thisparticipant said, “If there was a spreadsheet already created,and I could tailor it to what might be most important for ourparticular project, then I think I would use that. But as far asusing it every time and pulling out every piece of [informa-tion], I would literally have to have an intern do that for mebecause I don’t have time.” (P6). Shortcuts, such as forgoingdual-review and evidence tables, are essential to researchersin the Navy because they operate on tight timelines.
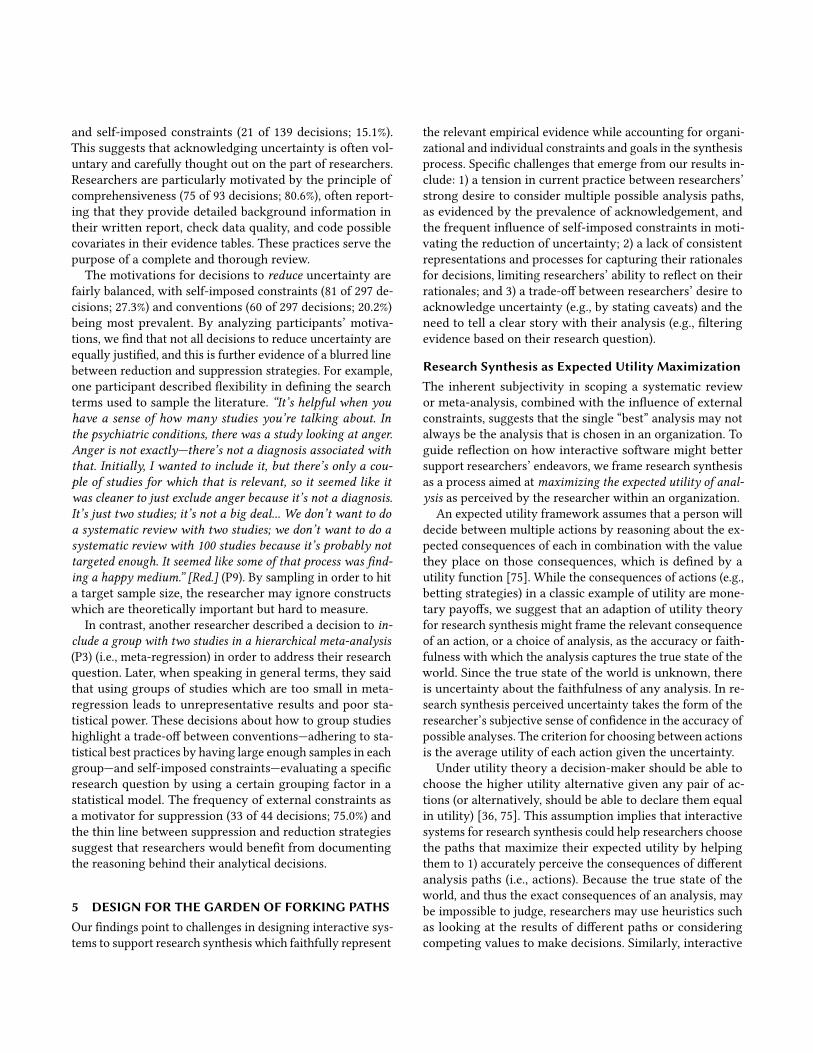
MotivationsDuring our qualitative analysis we inductively coded 21 dif-ferent reasons for researchers’ decisions. We then grouped
Figure 3: Categorized reasons for analytical decisions.
these 21 reasons into six themes which capture the motiva-tions behind researchers’ decision-making (Fig. 3).
• Principles (93 of 480 decisions; 19.4%): ideals whichresearchers adhere to such as comprehensiveness ofthe review, reproducibility in judgments, consistencyin how evidence is evaluated.
• Social Factors (55 of 480 decisions; 11.5%): strictlycommunicative or interpersonal influences on decision-making such as a desire for ease of understanding orbuilding confidence through consensus.
• Domain-Specific Factors (67 of 480 decisions; 14.0%):concerns related to the domain under study such ascases where the researcher relies on domain knowledgeor seeks conceptual clarity regarding key constructs.
• Conventions (73 of 480 decisions; 15.2%): standardpractices which often reflect established knowledgeabout how to deal with issues like statistical power.
• Self-ImposedConstraints (107 of 480 decisions; 22.3%):factors which are under the control of the individualresearcher such as research questions, preferences, oracting on a sense of caution or a lack of knowledgeabout research procedures.
• External Constraints (85 of 480 decisions; 17.7%):factors beyond the researchers’ control such as limitedavailability of information, limited time and attentionfor the review, limited control of research objectives, orlimited alternatives to the chosen analysis path.
In our interviews, decisions to acknowledge uncertaintywere most often motivated by principles (46 of 139 decisions;33.1%), domain-specific factors (32 of 139 decisions; 23.0%),
and self-imposed constraints (21 of 139 decisions; 15.1%).This suggests that acknowledging uncertainty is often vol-untary and carefully thought out on the part of researchers.Researchers are particularly motivated by the principle ofcomprehensiveness (75 of 93 decisions; 80.6%), often report-ing that they provide detailed background information intheir written report, check data quality, and code possiblecovariates in their evidence tables. These practices serve thepurpose of a complete and thorough review.The motivations for decisions to reduce uncertainty are
fairly balanced, with self-imposed constraints (81 of 297 de-cisions; 27.3%) and conventions (60 of 297 decisions; 20.2%)being most prevalent. By analyzing participants’ motiva-tions, we find that not all decisions to reduce uncertainty areequally justified, and this is further evidence of a blurred linebetween reduction and suppression strategies. For example,one participant described flexibility in defining the searchterms used to sample the literature. “It’s helpful when youhave a sense of how many studies you’re talking about. Inthe psychiatric conditions, there was a study looking at anger.Anger is not exactly—there’s not a diagnosis associated withthat. Initially, I wanted to include it, but there’s only a cou-ple of studies for which that is relevant, so it seemed like itwas cleaner to just exclude anger because it’s not a diagnosis.It’s just two studies; it’s not a big deal... We don’t want to doa systematic review with two studies; we don’t want to do asystematic review with 100 studies because it’s probably nottargeted enough. It seemed like some of that process was find-ing a happy medium.” [Red.] (P9). By sampling in order to hita target sample size, the researcher may ignore constructswhich are theoretically important but hard to measure.
In contrast, another researcher described a decision to in-clude a group with two studies in a hierarchical meta-analysis(P3) (i.e., meta-regression) in order to address their researchquestion. Later, when speaking in general terms, they saidthat using groups of studies which are too small in meta-regression leads to unrepresentative results and poor sta-tistical power. These decisions about how to group studieshighlight a trade-off between conventions—adhering to sta-tistical best practices by having large enough samples in eachgroup—and self-imposed constraints—evaluating a specificresearch question by using a certain grouping factor in astatistical model. The frequency of external constraints asa motivator for suppression (33 of 44 decisions; 75.0%) andthe thin line between suppression and reduction strategiessuggest that researchers would benefit from documentingthe reasoning behind their analytical decisions.
5 DESIGN FOR THE GARDEN OF FORKING PATHSOur findings point to challenges in designing interactive sys-tems to support research synthesis which faithfully represent
the relevant empirical evidence while accounting for organi-zational and individual constraints and goals in the synthesisprocess. Specific challenges that emerge from our results in-clude: 1) a tension in current practice between researchers’strong desire to consider multiple possible analysis paths,as evidenced by the prevalence of acknowledgement, andthe frequent influence of self-imposed constraints in moti-vating the reduction of uncertainty; 2) a lack of consistentrepresentations and processes for capturing their rationalesfor decisions, limiting researchers’ ability to reflect on theirrationales; and 3) a trade-off between researchers’ desire toacknowledge uncertainty (e.g., by stating caveats) and theneed to tell a clear story with their analysis (e.g., filteringevidence based on their research question).
Research Synthesis as Expected Utility MaximizationThe inherent subjectivity in scoping a systematic reviewor meta-analysis, combined with the influence of externalconstraints, suggests that the single “best” analysis may notalways be the analysis that is chosen in an organization. Toguide reflection on how interactive software might bettersupport researchers’ endeavors, we frame research synthesisas a process aimed at maximizing the expected utility of anal-ysis as perceived by the researcher within an organization.
An expected utility framework assumes that a person willdecide between multiple actions by reasoning about the ex-pected consequences of each in combination with the valuethey place on those consequences, which is defined by autility function [75]. While the consequences of actions (e.g.,betting strategies) in a classic example of utility are mone-tary payoffs, we suggest that an adaption of utility theoryfor research synthesis might frame the relevant consequenceof an action, or a choice of analysis, as the accuracy or faith-fulness with which the analysis captures the true state of theworld. Since the true state of the world is unknown, thereis uncertainty about the faithfulness of any analysis. In re-search synthesis perceived uncertainty takes the form of theresearcher’s subjective sense of confidence in the accuracy ofpossible analyses. The criterion for choosing between actionsis the average utility of each action given the uncertainty.Under utility theory a decision-maker should be able to
choose the higher utility alternative given any pair of ac-tions (or alternatively, should be able to declare them equalin utility) [36, 75]. This assumption implies that interactivesystems for research synthesis could help researchers choosethe paths that maximize their expected utility by helpingthem to 1) accurately perceive the consequences of differentanalysis paths (i.e., actions). Because the true state of theworld, and thus the exact consequences of an analysis, maybe impossible to judge, researchers may use heuristics suchas looking at the results of different paths or consideringcompeting values to make decisions. Similarly, interactive

systems could also support researchers directly in 2) identi-fying how much they value the accuracy of different paths.
Acknowledging Alternative AnalysesChallenge: Trying a set of analyses instead of just one. Our in-terviews suggest that one of the core challenges in designingfor research synthesis is supporting judgments about whena given analysis is justified. The pitfall for researchers is thethin line between exploratory analysis and using researcherdegrees of freedom to select an analysis path which confirmsa particular hypothesis or point of view. An episode from oneof our interviews illustrates this ambiguity: “Through thosediscussions that we have, we’ll have suggestions for differenttypes of analysis we can conduct that might split the hair alittle bit differently and give us additional information that wecan then decide, ‘Okay, what is the best way to report this nowthat we’ve looked at it both of these ways?”’ (P6). In cases likethis, we argue that any reduction strategy used to select aparticular analysis may actually be suppressing uncertaintybecause presenting one analysis path among multiple pathsobserved may reflect confirmation bias as much as the truestate of the world.Prior work on reliable statistics [67, 69] suggests that re-
searchers should survey possible analysis paths and multi-plex across them by exploring and reporting a reasonablesubset of analyses. Because comprehensiveness was the mostprevalent motivation for analytical decisions in our analysis,we suspect that researchers are naturally incentivized to ex-plore possible analyses and that they will do so to the extentthat tools make it feasible. Being able to directly evaluatehow different paths impact results would provide researcherswith relevant information for determining what paths havehigher utility given their various motivations and constraints.For example, when the differences in results between pathsare minimal, the researcher may decide to choose a paththat “trades-off” accuracy with other desirable propertieslike minimizing time or resources spent, or maximizing con-sensus or interpretability 4. When results are highly variable,the researcher should exercise extreme caution and considerreporting multiple analyses if possible.Of course, researchers may not always be motivated re-
port on multiple analyses paths if they prefer a certain re-sult, raising the ethical dilemma that developing tools whichmake it easier to explore alternative analyses may facilitatethe cherry-picking of results. The need to explore multipleanalyses and the risk that this multiplexing will facilitatecherry-picking remains a tension in the broader set of rec-ommendations in the literature on reducing bias in analysis.
4An alternative framing of decisions about paths in our study results coulddefine utility as a function of path accuracy alone, and choices of non-optimal paths as “satisficing” under bounded rationality [66]
Opportunity: Multiverse analysis. Each possible analysis inthe garden of forking paths produces a distribution of esti-mates which represents error in the analysis process. This isdistinct from uncertainty about which path most accuratelyrepresents the evidence (i.e., the true underlying effect). Priorwork [67, 69] suggests that, ideally, researchers should quan-tify and report uncertainty about analytical decisions byrunning a subset of possible analyses to see which decisionsimpact results, a procedure called multiverse analysis. Simi-lar work on model comparison techniques (e.g., [51, 53, 61])suggests that researchers should build and compare multi-ple models expressing assumptions of varying strength inorder to separate uncertainty of evidence from uncertaintyof assumptions in their analysis. These convergent lines ofresearch suggest an opportunity for interactive systems toelicit a set of analysis paths under consideration and sup-port researchers in interactively comparing outcomes frommultiple quantitative analyses.
Opportunity: Visualizing the garden of forking paths. In orderto support researchers in exploring, comparing, and report-ing on multiple possible analyses, interactive systems needan explicit way to represent analytical decisions and elicitinformation about possible analyses from researchers. Basedon prior work on interactive visualization of scientific work-flows [12], we point out the opportunity to represent thegarden of forking paths using interactive diagrams whichhelp researchers map out decision-points and their influenceon one another as nodes and edges. We propose other op-portunities related to reasoning with and communicatinguncertainty which build on this representation.
Representing Reasoning About AnalysisChallenge: Shifting attention from rationales to impacts. Whenprompted to describe the reasoning behind analytical deci-sions, researchers tend to focus on factors which rationalizetheir choices, often appealing to standard practices and re-search questions rather than examining the impacts of theirchoices on the results of analysis. For instance, we comparetwo cases where researchers made opposite decisions aboutwhether or not to include a group of two studies in a meta-regression (see Results: Motivations). Both researchers wereaware that two studies would not give them enough statisti-cal power to make a precise effect size estimate, but insteadthey rationalized their decisions by appealing to conventions(P9) and research questions (P3). We observe that researchersdocument their rationales inconsistently across personal cor-respondences, notes, and work documents. This may con-tribute to difficulty weighing these motivations alongsidethe outcomes of alternative analysis paths. Considering ra-tionales in the absence of information about outcomes leadsto a sense of utility that is driven primarily by the perceived

value of a choice independent of its consequences. We arguethat this problem would be mitigated by interactive systemsthat formally represent researchers’ reasoning about analy-sis paths and attempt to shift researchers’ attention to theimpacts of decisions on the results of analysis.
Opportunity: Attributing rationale. While researchers oftenhave a rationale for their decisions, they seem to lack thetools to externalize and review the motivations and con-straints which shape their analysis. For example, one re-searcher expressed the need for a way to track conceptualuncertainty when coding evidence tables in Excel. “If [aflag or annotation is] associated with the value in a cell, Ithink that would help coders feel more confident even if you’renot ultimately going to do anything about it. And it mighthelp your quality control checks at the end.” (P4). In agree-ment with this researcher, prior work on how uncertaintyis represented in visual analytics systems [62] suggests thathelping users maintain awareness of sources of uncertaintyimproves the calibration of confidence in the accuracy ofthe analysis. Given an interactive visualization of the gar-den of forking paths, a system could enable researchers tocreate custom flags associated with factors which influenceanalytical decision-making such as rules, assumptions, andconventions, as well as guidelines (e.g., scope descriptionsand research questions) and constraints (e.g., limited timeand attention). Researchers could use these flags to representtheir reasoning at a given decision-point by attributing theirchoice to a set of rationales. We speculate that mapping outrationales for alternative analyses might highlight trade-offsbetween different motivations and thus prompt researchersto reflect on and potentially update their decisions.
Opportunity: Aligning subjective and statistical uncertainty.Since the true state of the world is unknown, researchersmust rely on their subjective sense of the accuracy of anal-yses (i.e., confidence) to decide between alternative paths.However, some of the rationales given by researchers (e.g.,conventions) are essentially appeals to authority, suggestingthat researchers sometimes feel uncomfortable with theirability to judge the consequences of alternative analyses.Prior work [33] shows that comparing predicted effect sizedistributions to observed outcomes helps some form expec-tations about effects that better align with statistical uncer-tainty. Expressing subjective expectations promotes moreactive reasoning [41, 42], and using visual representationsoffloads information from working memory [18, 57], freeingup attention for metacognitive reflection [63] about how ef-fects are understood. This suggests an opportunity to helpresearchers calibrate their expectations about the impacts ofanalytical decisions through comparisons of subjective uncer-tainty, elicited by a system using graphical or other formats(e.g., [28, 33, 41–43]), and statistical uncertainty, achieved
through computation. Based on prior work [15], we specu-late that the experiential learning that occurs through suchprediction can ultimately help foster confidence as well asaccuracy in one’s predictions.
Communicating UncertaintyChallenge: Varying tolerance for uncertainty. Researchers weinterviewed tend to remain skeptical about their findings,but they often need to present findings in a way that offersconvincing support for recommendations. Contributing tothis tension, it has been argued that decision-makers [4, 8,11, 52, 70, 78, 79] (and people in general [21, 22, 25]) havelimited tolerance for uncertainty. “They want a visualizationthat shows gross effect, it gets down to the point, so they areno longer wanting a string of visualizations to illustrate everypoint. If you write about the methodology, you write aboutyour data crunching, and then you show your visualizationfor your final result, that is what decision-makers are hungryfor and are expecting now... They do care about the fidelity ofthe data, they just don’t want a chart on it.” (P11). In practice,this Navy researcher told a simplified and compelling storyadvocating for a promising training program. They empha-sized the trade-off between downplaying uncertainty to getdecisions made and doing just the opposite when there wasconcern about the safety of Navy personnel. “If it’s a reallyimportant decision that you need to impress upon them, thatthere is a significant thing to consider, then I will sometimes dothe findings a disservice by presenting the problem and buryingthe potential compelling use case or storyline.” (P11).
Opportunity: Visualizing possible outcomes. We argue thatinteractive systems for research synthesis should provide aset of visualizations for distributions of possible outcomes,which attempt to alleviate specific aversions that decision-makers have toward uncertainty. One major aversion to un-certainty is that many people, even experts [7, 68], find ithard to understand [37]. Prior work in psychology [29, 30],statistical reasoning [27, 28, 31], and data visualization [23,33, 34, 38, 39] suggests a remedy to this problem: people rea-son about uncertainty most accurately when it is framed asfrequencies of events, rather than probabilities or summarystatistics. As such, visualizations of quantitative uncertaintyshould convey the possibility of multiple outcomes usingfrequency framing to circumvent misunderstandings of un-certainty. When it is important to convey uncertainty inpossible outcomes with high fidelity, hypothetical outcomeplots [34, 38, 43] and quantile dotplots [23, 33, 39] are valu-able visualization formats. By presenting discrete outcomes,these formats align with results from prior work in statisticspedagogy suggesting that people develop better statisticalintuitions via simulations [13, 14, 20, 35, 68].

In contrast, when decision-makers have low tolerance foruncertainty because they want a clear yes-or-no answer, vi-sualizations could be designed to emphasize modal resultswhile still displaying uncertainty, as supported by most staticrepresentations of distributions, including intervals. Addi-tionally, propagating uncertainty in the effect distributionto derived measures that may be more closely aligned withthe decision-maker’s utility function, such as money or timesaved, might help decision-makers appreciate uncertaintyinformation for the purpose of making more informed de-cisions. “There are these situations where you face the moralquandary of having to tell a company that you wasted theirtime [on inconclusive results] or giving them information thatisn’t very useful to them [because the analysis misrepresentsavailable evidence to give an exaggerated sense of certainty].”(P5). We argue that providing researchers with communica-tion techniques which counteract decision-makers’ specificaversions to uncertainty would mitigate the misconceptionthat an uncertain result is not presentable and does not con-tain useful information. Of course, the best way to iden-tify the impact of the techniques we propose is to evaluatedecision-making given different communication strategies.
Opportunity: Conveying qualitative uncertainties. In our inter-views we find that researchers express qualitative forms ofuncertainty such as the assumptions and constraints behindtheir analysis by writing caveats in limitations sections orpreparing supplemental presentation slides. Descriptive ac-counts of uncertainty help researchers align the expectationsof decision-makers with the quality of available scientific ev-idence. In the words of one researcher, “There is no such thingas a perfect study, but maybe if there was some way to makethat information more readily available to researchers so that Iclearly see a trend in limitations that are going on in this areaof research. How am I not going to let that affect mine, or howcan I at least convey that skepticism to my potential employerso that they know what might impact their results?” (P5). Priorwork [52, 53] suggests that uncertainty about assumptionsis often overlooked by decision-makers, leading to an exag-gerated sense of certainty about analytical results. Drawingon the opportunities we identify for representing reasoningabout analytical decisions, a system could use rationales andtheir associations with decisions to create summary repre-sentations of assumptions, constraints, and limitations whichshould inform the decision-maker’s sense of utility. Futurework should explore the design space for representing andcommunicating these qualitative uncertainties.
LimitationsLimitations of our procedure for sampling analytical deci-sions introduce imprecision into the frequencies of decision-making strategies presented in our results. The sample of
researchers we interviewed may not be representative ofthe broader population of researchers working in appliedsettings. Additionally, we rely on each participant’s accountof whether decisions are justified to inform our coding ofsuppression. While this means that our data reflect the per-spectives of our participants rather than our opinions, it alsomeans that suppression may be relatively underrepresentedin our sample because researchers may feel disinclined toadmit to choosing less-than-ideal analysis paths.
We draw on expected utility theory to provide a basis foridentifying “better” ways of supporting research synthesisdespite the inevitability of organizational constraints theprocess. However, our treatment is not intended to be aformal model. How to characterize research synthesis as itoccurs in organizations using theories like expected utilitymaximization or bounded rationality is left to future work.
6 CONCLUSIONWe present a qualitative analysis of how researchers conduct-ing applied research synthesis navigate the garden of forkingpaths: a series of analytical decision-points, each of whichhas the potential to influence findings. Based on our inter-views and analysis, we identify a set of design challengesaround making it more feasible for researchers to try andreport multiple analyses, shifting researchers’ attention fromrationales for decisions to impacts of decisions, and support-ing uncertainty communication techniques which addressspecific aversions to uncertainty among decision-makers.Considering evidence from our interviews in light of priorwork, we point out opportunities for interactive systems tosupport research synthesis by helping researchers map thegarden of forking paths, document their reasoning aboutanalysis paths, and effectively communicate uncertaintiesimpacting their analytical decision-making.
7 ACKNOWLEDGEMENTSThis work was funded by US Navy STTR Contract N68335-17-C-0410 in partnership with Stottler Henke Assoc, and NSFaward #1749266.
REFERENCES[1] B. F. Anderson, D. H. Deane, K. R. Hammond, and G. H. McClelland.
1981. Concepts in judgment and decision research. Praeger, New York.[2] H Arksey and L O’Malley. 2005. Scoping Studies: Towards a Method-
ological Framework. International Journal of Social Research Methodol-ogy 8, 1 (2005), 19–25.
[3] Kenneth J. (Kenneth Joseph) Arrow. 1965. Aspects of the theory ofrisk-bearing. (1965).
[4] Maya Bar-hillel and Efrat Neter. 1993. How Alike Is It Versus HowLikely Is It: A Disjunction Fallacy in Probability Judgments. Journal ofPersonality and Social Psychology 65, 6 (1993), 1119–1131.
[5] Leon Bax, Ly Mee Yu, Noriaki Ikeda, and Karel G.M. Moons. 2007.A systematic comparison of software dedicated to meta-analysis of

causal studies. BMC Medical Research Methodology 7, February 2007(2007). https://doi.org/10.1186/1471-2288-7-40
[6] Leon Bax, Ly Mee Yu, Noriaki Ikeda, Harukazu Tsuruta, and Karel G.M.Moons. 2006. Development and validation of MIX: Comprehensivefree software for meta-analysis of causal research data. BMC Medi-cal Research Methodology 6, 50 (2006), 1–11. https://doi.org/10.1186/1471-2288-6-50
[7] Sarah Belia, Fiona Fidler, Jennifer Williams, and Geoff Cumming. 2005.Researchers misunderstand confidence intervals and standard errorbars. Psychological methods 10, 4 (2005), 389.
[8] Silvia Bonaccio and Reeshad S Dalal. 2006. Advice taking and decision-making: An integrative literature review, and implications for theorganizational sciences. Organizational Behavior and Human DecisionProcesses 101 (2006), 127–151. https://doi.org/10.1016/j.obhdp.2006.07.001
[9] M Borenstein, L Hedges, J Higgins, and H Rothstein. 2005. Compre-hensive Meta-Analysis 2. Engelwood, NJ, Biostat. (2005).
[10] Nadia Boukhelifa, Marc-Emmanuel Perrin, Samuel Huron, and JamesEagan. 2017. How Data Workers Cope with Uncertainty : A Task Char-acterisation Study. Proceedings of the SIGCHI Conference on HumanFactors in Computing Systems (2017). https://doi.org/10.1145/3025453.3025738
[11] David V Budescu and Adrian K Rantilla. 2000. Confidence in aggrega-tion of expert opinions. Acta Psychologica 104 (2000), 371–398.
[12] Steven P Callahan, Juliana Freire, Emanuele Santos, Carlos E Schei-degger, Cláudio T Silva, and Huy T Vo. 2006. VisTrails: visualizationmeets data management. In Proceedings of the 2006 ACM SIGMODinternational conference on Management of data. ACM, 745–747.
[13] Beth Chance, Robert del Mas, and Joan Garfield. 2004. Reasoning aboutsampling distribitions. In The challenge of developing statistical literacy,reasoning and thinking. Springer, 295–323.
[14] B Chance, J Garfield, and B delMas. 1999. A model of classroomresearch in action: Developing simulation activities to improve stu-dentsâĂŹ statistical reasoning. 52nd Session of the International Statis-tical Institute, Helsinki, Finland (1999).
[15] Beth Chance, Joan Garfield, and Robert delMas. 2000. Developing Sim-ulation Activities To Improve Students’ Statistical Reasoning. (2000).
[16] The Cochrane Collaboration. 2014. Review Manager (RevMan) 5.1.0.Copenhagen: The Nordic Cochrane Centre. (2014).
[17] Harris Cooper, Larry V. Hedges, and Jeffrey C. Valentine. 2009. TheHandbook of Research Synthesis and Meta-Analysis. Russell Sage Foun-dation.
[18] Richard Cox. 1999. Representation construction, externalised, cogni-tion and individual differences. Learning and Instruction 9, 4 (1999),343–363. https://doi.org/10.1016/S0959-4752(98)00051-6
[19] J. W. Creswell and C. N. Poth. 2018. Qualitative inquiry & researchdesign: Choosing among five approaches. SAGE Publications, Inc.
[20] Geoff Cumming and Neil Thomason. 1998. Statplay: Multimedia forstatistical understanding, in pereira-mendoza (ed. In Proceedings of theFifth International Conference on Teaching Statistics, ISI. Citeseer.
[21] Shawn P. Curley and J. Frank Yates. 1985. The Center and Range ofthe Probability Interval as Factors Affecting Ambiguity Preferences.Organizational Behavior and Human Decision Processes 36 (1985), 273—-287.
[22] Hillel J Einhorn and Robin M Hogarth. 1985. Ambiguity and Uncer-tainty in Probabilistic Inference. Psychological Review 92, 4 (1985).
[23] Michael Fernandes, Logan Walls, Sean Munson, Jessica Hullman, andMatthew Kay. 2018. Uncertainty Displays Using Quantile Dotplotsor CDFs Improve Transit Decision-Making. In Conference on HumanFactors in Computing Systems - CHI ’18. https://doi.org/10.1145/3173574.3173718
[24] R Ganann, D Ciliska, and H Thomas. 2010. Expediting systematicreviews: methods and implications of rapid reviews. ImplementationScience (2010), 5–56. https://doi.org/10.1186/1748-5908-5-56
[25] P. Gardenfors and N. Sahlin. 1983. Decision making with unreliableprobabilities. Brit. J. Math. Statist. Psych. 36 (1983), 240–251.
[26] Andrew Gelman and Eric Loken. 2014. The statistical crisis in science.American Scientist 102, 6 (2014). https://doi.org/10.1511/2014.111.460
[27] Gerd Gigerenzer and Ulrich Hoffrage. 1995. How to improve Bayesianreasoning without instruction: Frequency formats. Psychological Re-view 102 (1995), 684–704.
[28] Daniel G Goldstein and David Rothschild. 2014. Lay understanding ofprobability distributions. Judgment and Decision Making 9, 1 (2014), 1.
[29] L Hasher and R T Zacks. 1984. Automatic processing of fundamentalinformation: the case of frequency of occurrence. The American psy-chologist 39, 12 (1984), 1372–1388. https://doi.org/10.1037/0003-066X.39.12.1372
[30] Ralph Hertwig, Greg Barron, Elke U Weber, and Ido Erev. 2004. De-cisions from experience and the effect of rare events in risky choice.Psychological science 15, 8 (2004), 534–539.
[31] U. Hoffrage and G. Gigerenzer. 1998. Using natural frequencies toimprove diagnostic inferences. Academic Medicine: Journal of theAssociation of American Medical Colleges 73, 5 (May 1998), 538–540.
[32] Robin M Hogarth. 1987. Judgement and choice: The psychology ofdecision. (1987).
[33] Jessica Hullman, Matthew Kay, Yea-Seul Kim, and Samana Shrestha.2018. Imagining Replications: Graphical Prediction & Discrete Visu-alizations Improve Recall & Estimation of Effect Uncertainty. IEEETrans. Visualization & Comp. Graphics (Proc. InfoVis) (2018). http://idl.cs.washington.edu/papers/imagining-replications
[34] Jessica Hullman, Paul Resnick, and Eytan Adar. 2015. HypotheticalOutcome Plots Outperform Error Bars and Violin Plots for Inferencesabout Reliability of Variable Ordering. PloS one 10, 11 (2015).
[35] D Mills Jamie. 2002. Using computer simulation methods to teachstatistics: A review of the literature. Journal of Statistics Education 10,1 (2002).
[36] Niels Erik Jensen. 1967. An introduction to Bernoullian utility theory:I. Utility functions. The Swedish journal of economics (1967), 163–183.
[37] D. Kahneman. 2011. Thinking, fast and slow. Farrar, Straus and Giroux,New York.
[38] Alex Kale, Francis Nguyen, Matthew Kay, and Jessica Hullman. 2019.Hypothetical Outcome Plots Help Untrained Observers Judge Trendsin Ambiguous Data. IEEE Trans. Visualization & Comp. Graphics (Proc.InfoVis) (2019). http://idl.cs.washington.edu/papers/hops-trends
[39] Matthew Kay, Tara Kola, Jessica Hullman, and Sean Munson. 2016.When (ish) is my bus? User-centered visualizations of uncertainty ineveryday, mobile predictive systems. In Proceedings of the 34th AnnualACM Conference on Human Factors in Computing Systems (CHI ’16).
[40] S Khangura, K Konnyu, R Cushman, J Grimshaw, and D Moher. 2012.Evidence summaries: the evolution of a rapid review approach. SystRev (2012), 1–10. https://doi.org/10.1186/2046-4053-1-10
[41] Yea-Seul Kim, Katharina Reinecke, and Jessica Hullman. 2017. Ex-plaining the Gap: Visualizing One’s Predictions Improves Recall andComprehension of Data. Proceedings of the 2017 CHI Conference onHuman Factors in Computing Systems - CHI ’17 (2017), 1375–1386.https://doi.org/10.1145/3025453.3025592
[42] Yea-Seul Kim, Katharina Reinecke, and Jessica Hullman. 2018. DataThrough Others’ Eyes: The Impact of Visualizing Others’ Expectationson Visualization Interpretation. IEEE Trans. Visualization & Comp.Graphics (Proc. InfoVis) (2018). http://idl.cs.washington.edu/papers/others-expectations

[43] Yea-Seul Kim, Logan Walls, Peter Krafft, and Jessica Hullman. 2019.A Bayesian Cognition Approach to Improve Data Visualization. Pro-ceedings of the 2019 CHI Conference on Human Factors in ComputingSystems (2019).
[44] George J. Klir and Bo Yuan. 1995. Fuzzy Sets and Fuzzy Logic: Theoryand Applications. Prentice-Hall, Inc., Upper Saddle River, NJ, USA.
[45] D Levac, H Colquhoun, and K K O’Brien. 2010. Scoping studes: ad-vancing the methodology. Implementation Science 5, 69 (2010), 1–9.https://doi.org/10.1186/1748-5908-5-69 arXiv:arXiv:1011.1669v3
[46] M.W. Lipsey and D.B. Wilson. 2001. Practical Meta-Analysis. SAGEPublications.
[47] Raanan Lipshitz and Orna Strauss. 1997. Coping with Uncertainty:A Naturalistic Decision-Making Analysis. Organizational Behaviorand Human Decision Processes 69, 2 (1997), 149–163. https://doi.org/10.1006/obhd.1997.2679
[48] John Lofland, David Snow, Leon Anderson, and Lyn H. Lofland. 2006.Analyzing social settings: A guide to qualitative observation and analysis.Wadsworth, Cengage Learning, Belmond=t, CA.
[49] K. R. MacCrimmon and D. A. Wehrung. 1986. Taking risks. Free Press,New York.
[50] Alan M MacEachren, Anthony Robinson, Susan Hopper, Steven Gard-ner, Robert Murray, Mark Gahegan, and Elisabeth Hetzler. 2005. Visu-alizing Geospatial Information Uncertainty: What We Know andWhatWe Need to Know. Cartography and Geographic Information Science32, 3 (2005), 139–160. https://doi.org/10.1559/1523040054738936
[51] Charles F. Manski. 2003. Partial Identification of Probability Distribu-tions: Springer Series in Statistics. Springer.
[52] Charles F Manski. 2018. Communicating uncertainty in policy analysis.Proceedings of the National Academy of Sciences of the United States ofAmerica (2018). https://doi.org/10.1073/pnas.1722389115
[53] Charles F Manski. 2018. The Lure of Incredible Certitude. WorkingPaper 24905. National Bureau of Economic Research. https://doi.org/10.3386/w24905
[54] James G March. 1976. Ambiguity and choice in organizations. (1976).[55] J. G. March and H. A. Simon. 1958. Organizations. Wiley, New York.[56] M Miles, M Huberman, and J Saldana. 2014. Qualitative Data Analysis:
A Methods Sourcebook (3 ed.). SAGE Publications Inc., Thousand Oaks,CA, Chapter 2.
[57] Hedwig M. Natter and Dianne C. Berry. 2005. Effects of active infor-mation processing on the understanding of risk information. AppliedCognitive Psychology 19, 1 (2005), 123–135. https://doi.org/10.1002/acp.1068
[58] Heidi D. Nelson. 2014. Systematic Reviews to Answer Health CareQuestions. Wolters Kluwer Health/Lippincott Williams & Wilkins,Philadelphia, PA.
[59] Mourad Ouzzani, Hossam Hammady, Zbys Fedorowicz, and AhmedElmagarmid. 2016. Rayyan - a web and mobile app for systematicreviews. (2016). https://doi.org/10.1186/s13643-016-0384-4
[60] Mai T. Pham, Andrijana Rajić, Judy D. Greig, Jan M. Sargeant, An-drew Papadopoulos, and Scott A. Mcewen. 2014. A scoping re-view of scoping reviews: Advancing the approach and enhancingthe consistency. Research Synthesis Methods 5, 4 (2014), 371–385.https://doi.org/10.1002/jrsm.1123 arXiv:arXiv:1011.1669v3
[61] Juho Piironen and Aki Vehtari. 2017. Comparison of Bayesian predic-tive methods for model selection. Statistics and Computing 27, 3 (01May 2017), 711–735. https://doi.org/10.1007/s11222-016-9649-y
[62] Dominik Sacha, Hansi Senaratne, Bum Chul Kwon, Geoffrey Ellis, andDaniel A. Keim. 2016. The Role of Uncertainty, Awareness, and Trustin Visual Analytics. IEEE Transactions on Visualization and ComputerGraphics 22, 1 (2016). https://doi.org/10.1109/TVCG.2015.2467591
[63] Gregory Schraw, Kent J. Crippen, and Kendall Hartley. 2006. Promotingself-regulation in science education: Metacognition as part of a broader
perspective on learning. Research in Science Education 36, 1-2 (2006),111–139. https://doi.org/10.1007/s11165-005-3917-8
[64] R. Silberzahn, E. L. Uhlmann, D. P. Martin, P. Anselmi, F. Aust, E.Awtrey, Š. Bahník, F. Bai, C. Bannard, E. Bonnier, R. Carlsson, F. Cheung,G. Christensen, R. Clay, M. A. Craig, A. Dalla Rosa, L. Dam,M. H. Evans,I. Flores Cervantes, N. Fong, M. Gamez-Djokic, A. Glenz, S. Gordon-McKeon, T. J. Heaton, K. Hederos, M. Heene, A. J. Hofelich Mohr, F.Högden, K. Hui, M. Johannesson, J. Kalodimos, E. Kaszubowski, D. M.Kennedy, R. Lei, T. A. Lindsay, S. Liverani, C. R. Madan, D. Molden,E. Molleman, R. D. Morey, L. B. Mulder, B. R. Nijstad, N. G. Pope, B.Pope, J. M. Prenoveau, F. Rink, E. Robusto, H. Roderique, A. Sandberg,E. Schlüter, F. D. Schönbrodt, M. F. Sherman, S. A. Sommer, K. Sotak,S. Spain, C. Spörlein, T. Stafford, L. Stefanutti, S. Tauber, J. Ullrich,M. Vianello, E.-J. Wagenmakers, M. Witkowiak, S. Yoon, and B. A.Nosek. 2018. Many Analysts, One Data Set: Making Transparent HowVariations in Analytic Choices Affect Results. Advances in Methodsand Practices in Psychological Science (2018). https://doi.org/10.1177/2515245917747646
[65] Joseph P Simmons, Leif D Nelson, and Uri Simonsohn. 2011. False-Positive Psychology : Undisclosed Flexibility in Data Collectionand Analysis Allows Presenting Anything as Significant. Psycho-logical Science 22, 11 (2011), 1359–1366. https://doi.org/10.1177/0956797611417632
[66] Herbert A Simon. 1972. Theories of bounded rationality. Decision andorganization 1, 1 (1972), 161–176.
[67] Uri Simonsohn, Joseph P. Simmons, and Leif D. Nelson. 2015. Specifi-cation Curve: Descriptive and Inferential Statistics on All ReasonableSpecifications. SSRN (Nov 2015). https://doi.org/10.2139/ssrn.2694998
[68] Emre Soyer and Robin M Hogarth. 2012. The illusion of predictability:How regression statistics mislead experts. International Journal ofForecasting 28, 3 (2012), 695–711.
[69] Sara Steegen, Francis Tuerlinckx, Andrew Gelman, and Wolf Van-paemel. 2016. Increasing Transparency Through a Multiverse Anal-ysis. Perspectives on Psychological Science 11, 5 (2016), 702–712.https://doi.org/10.1177/1745691616658637
[70] Lyn M Van Swol and Janet A Sniezek. 2005. Factors affecting theacceptance of expert advice. British Journal of Social Psychology 44(2005), 443–461. https://doi.org/10.1348/014466604X17092
[71] J Thomas, J Brunton, and S Graziosi. 2010. EPPI-Reviewer 4: softwarefor research synthesis. EPPI-Centre Software. London: Social ScienceResearch Unit, UCL Institute of Education. (2010).
[72] Andrea C. Tricco, Jesmin Antony, Wasifa Zarin, Lisa Strifler, MarcoGhassemi, John Ivory, Laure Perrier, Brian Hutton, David Moher, andSharon E. Straus. 2015. A scoping review of rapid review methods.BMC Medicine 13, 1 (2015). https://doi.org/10.1186/s12916-015-0465-6arXiv:arXiv:1011.1669v3
[73] Amos Tversky and Daniel Kahneman. 1975. Judgment under uncer-tainty: Heuristics and biases. In Utility, probability, and human decisionmaking. Springer, 141–162.
[74] Wolfgang Viechtbauer. 2010. Conducting meta-analyses in R withthe metafor package. Journal of Statistical Software 36, 3 (2010), 1–48.http://www.jstatsoft.org/v36/i03/
[75] John von Neumann, Oskar Morgenstern, and Ariel Rubinstein. 1944.Theory of Games and Economic Behavior (60th Anniversary Commem-orative Edition). Princeton University Press. http://www.jstor.org/stable/j.ctt1r2gkx
[76] A Watt, A Cameron, L Sturm, T Lathlean, W Babidge, S Blamey, KFacey, D Hailey, I Norderhaug, and G Maddern. 2008. Rapid reviewsversus full systematic reviews: an inventory of current methods andpractice in health technology assessment. Int J Technol Assess HealthCare 24 (2008), 133–139. https://doi.org/10.1017/S0266462308080185

[77] JelteM.Wicherts, Coosje L.S. Veldkamp, Hilde E.M. Augusteijn, MarjanBakker, Robbie C.M. van Aert, and Marcel A.L.M. van Assen. 2016.Degrees of freedom in planning, running, analyzing, and reportingpsychological studies: A checklist to avoid P-hacking. Frontiers inPsychology 7, Nov (2016). https://doi.org/10.3389/fpsyg.2016.01832
[78] Ilan Yaniv and Dean P Foster. 1995. Graininess of Judgment UnderUncertainty: An Accuracy-Informativeness Trade-Off. Journal of Ex-perimental Psychology: General 124, 4 (1995), 424–432.
[79] Ilan Yaniv and Dean P. Foster. 1997. Precision and Accuracy of Judg-mental Estimation. Journal of Behavioral Decision Making 10 (1997),21–32.