Embed Size (px)
Citation preview
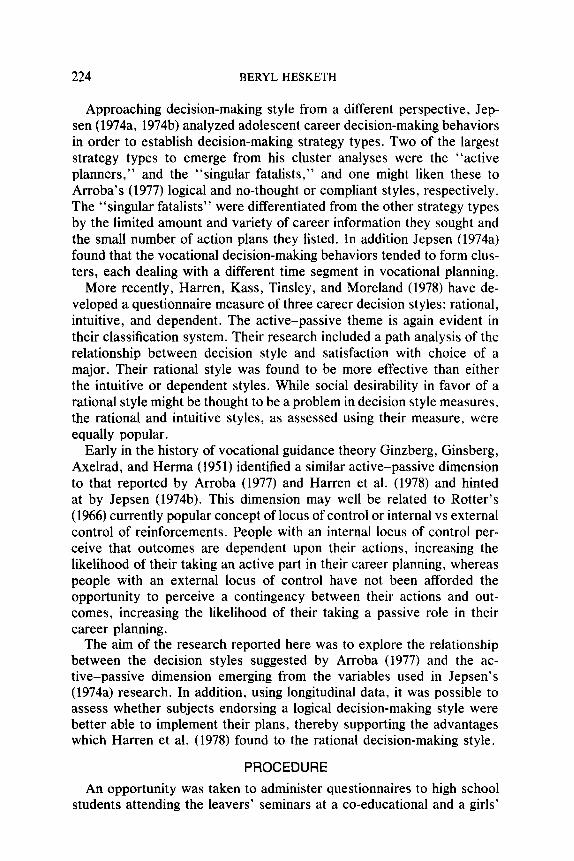
Journal of Vocational Behavior 20, 223-234 (1982)
Decision-Making Style and Career Decision-Making Behaviors among School Leavers
BERYL HESKETH
Department of Psychology, Massey University, New Zealand
This study examines the relationship of self-rated decision style to vocational decision-making behaviors among school leavers before leaving school and to the implementation of their plans after leaving school. Support was found for the active-passive dimension in decision style and for the advantage of using an active logical style. It is suggested that future research examine the relationship of style to locus of control and social desirability.
It has long been thought that the decision theory approach to vocational choice offers a potentially useful framework to the vocational counseling process, not necessarily in a formal sense, but as a means of structuring the generating of alternatives, outlining of associated outcomes, and the application of values to these. Jepsen (1974a) states that “when treated as a conceptual framework rather than a formal theory psychological decision-making appears to have promise in vocational psychology” (p. 284). However, while decision-making has been taught as part of career education programs for a number of years, there has been little research to support the assumption that the logical style upon which decision models are based is better than other styles.
Arroba (1977), in response to the lack of research in the area, produced an empirically derived classification of decision styles. She defined style “as a way of approaching, responding to and acting in a decision-making situation” (p. 150). The six decision styles which she derived from in- depth interviews were labeled emotional, hesitant, intuitive, no-thought, compliant, and logical. A cluster analysis of the degree of confusion evidenced by the judges in the process of allocating decisions to styles showed that the emotional and intuitive styles were the closest, followed by a link between the logical and hesitant styles, while the no-thought and compliant styles were independent. Arroba suggested that the styles formed an active-passive dimension with the logical and hesitant styles representing the active end, while the no-thought and compliant styles represented the passive end.
223
OOOl-8791/82/020223-12$02.00/O Copyright @ 1982 by Academic F’ress, Inc.
All rights of reproduction in any form reserved.
224 BERYLHESKETH
Approaching decision-making style from a different perspective, Jep- sen (1974a, 1974b) analyzed adolescent career decision-making behaviors in order to establish decision-making strategy types. Two of the largest strategy types to emerge from his cluster analyses were the “active planners,” and the “singular fatalists,” and one might liken these to Arroba’s (1977) logical and no-thought or compliant styles, respectively. The “singular fatalists” were differentiated from the other strategy types by the limited amount and variety of career information they sought and the small number of action plans they listed. In addition Jepsen (1974a) found that the vocational decision-making behaviors tended to form clus- ters, each dealing with a different time segment in vocational planning.
More recently, Hat-r-en, Kass, Tinsley, and Moreland (1978) have de- veloped a questionnaire measure of three career decision styles: rational, intuitive, and dependent. The active-passive theme is again evident in their classification system. Their research included a path analysis of the relationship between decision style and satisfaction with choice of a major. Their rational style was found to be more effective than either the intuitive or dependent styles. While social desirability in favor of a rational style might be thought to be a problem in decision style measures, the rational and intuitive styles, as assessed using their measure, were equally popular.
Early in the history of vocational guidance theory Ginzberg, Ginsberg, Axelrad, and Herma (1951) identified a similar active-passive dimension to that reported by Arroba (1977) and Harren et al. (1978) and hinted at by Jepsen (1974b). This dimension may well be related to Rotter’s (1966) currently popular concept of locus of control or internal vs external control of reinforcements. People with an internal locus of control per- ceive that outcomes are dependent upon their actions, increasing the likelihood of their taking an active part in their career planning, whereas people with an external locus of control have not been afforded the opportunity to perceive a contingency between their actions and out- comes, increasing the likelihood of their taking a passive role in their career planning.
The aim of the research reported here was to explore the relationship between the decision styles suggested by Arroba (1977) and the ac- tive-passive dimension emerging from the variables used in Jepsen’s (1974a) research. In addition, using longitudinal data, it was possible to assess whether subjects endorsing a logical decision-making style were better able to implement their plans, thereby supporting the advantages which Han-en et al. (1978) found to the rational decision-making style.
PROCEDURE
An opportunity was taken to administer questionnaires to high school students attending the leavers’ seminars at a co-educational and a girls’
DECISION-MAKING AND SCHOOL LEAVERS 225
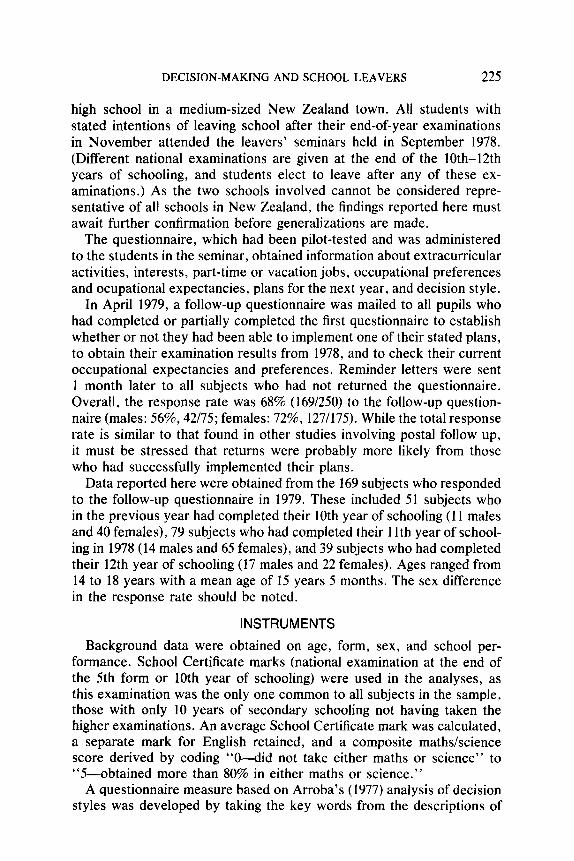
high school in a medium-sized New Zealand town. All students with stated intentions of leaving school after their end-of-year examinations in November attended the leavers’ seminars held in September 1978. (Different national examinations are given at the end of the lOth-12th years of schooling, and students elect to leave after any of these ex- aminations.) As the two schools involved cannot be considered repre- sentative of all schools in New Zealand, the findings reported here must await further confirmation before generalizations are made.
The questionnaire, which had been pilot-tested and was administered to the students in the seminar, obtained information about extracurricular activities, interests, part-time or vacation jobs, occupational preferences and ocupational expectancies, plans for the next year, and decision style.
In April 1979, a follow-up questionnaire was mailed to all pupils who had completed or partially completed the first questionnaire to establish whether or not they had been able to implement one of their stated plans, to obtain their examination results from 1978, and to check their current occupational expectancies and preferences. Reminder letters were sent 1 month later to all subjects who had not returned the questionnaire. Overall, the response rate was 68% (169/250) to the follow-up question- naire (males: 56%, 42/75; females: 72%, 127/175). While the total response rate is similar to that found in other studies involving postal follow up, it must be stressed that returns were probably more likely from those who had successfully implemented their plans.
Data reported here were obtained from the 169 subjects who responded to the follow-up questionnaire in 1979. These included 51 subjects who in the previous year had completed their 10th year of schooling (11 males and 40 females), 79 subjects who had completed their 1 lth year of school- ing in 1978 (14 males and 65 females), and 39 subjects who had completed their 12th year of schooling (17 males and 22 females). Ages ranged from 14 to 18 years with a mean age of 15 years 5 months. The sex difference in the response rate should be noted.
INSTRUMENTS
Background data were obtained on age, form, sex, and school per- formance. School Certificate marks (national examination at the end of the 5th form or 10th year of schooling) were used in the analyses, as this examination was the only one common to all subjects in the sample, those with only 10 years of secondary schooling not having taken the higher examinations. An average School Certificate mark was calculated, a separate mark for English retained, and a composite maths/science score derived by coding “O-did not take either maths or science” to “5-obtained more than 80% in either maths or science.”
A questionnaire measure based on Arroba’s (1977) analysis of decision styles was developed by taking the key words from the descriptions of
226 BERYL HESKETH
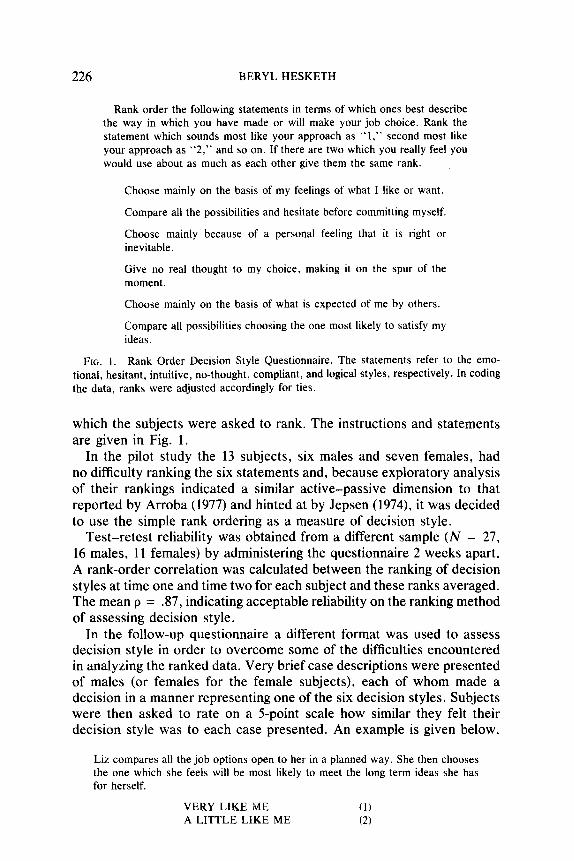
Rank order the following statements in terms of which ones best describe the way in which you have made or will make your job choice. Rank the statement which sounds most like your approach as “I,” second most like your approach as “2,” and so on. If there are two which you really feel you would use about as much as each other give them the same rank.
Choose mainly on the basis of my feelings of what I like or want.
Compare all the possibilities and hesitate before committing myself.
Choose mainly because of a personal feeling that it is right or inevitable.
Give no real thought to my choice, making it on the spur of the moment.
Choose mainly on the basis of what is expected of me by others,
Compare all possibilities choosing the one most likely to satisfy my ideas.
FIG. 1. Rank Order Decision Style Questionnaire. The statements refer to the emo- tional, hesitant, intuitive, no-thought, compliant, and logical styles, respectively. In coding the data, ranks were adjusted accordingly for ties.
which the subjects were asked to rank. The instructions and statements are given in Fig. 1.
In the pilot study the 13 subjects, six males and seven females, had no difficulty ranking the six statements and, because exploratory analysis of their rankings indicated a similar active-passive dimension to that reported by Arroba (1977) and hinted at by Jepsen (1974), it was decided to use the simple rank ordering as a measure of decision style.
Test-retest reliability was obtained from a different sample (N = 27, 16 males, 11 females) by administering the questionnaire 2 weeks apart. A rank-order correlation was calculated between the ranking of decision styles at time one and time two for each subject and these ranks averaged. The mean p = .87, indicating acceptable reliability on the ranking method of assessing decision style.
In the follow-up questionnaire a different format was used to assess decision style in order to overcome some of the difficulties encountered in analyzing the ranked data. Very brief case descriptions were presented of males (or females for the female subjects), each of whom made a decision in a manner representing one of the six decision styles. Subjects were then asked to rate on a 5point scale how similar they felt their decision style was to each case presented. An example is given below.
Liz compares all the job options open to her in a planned way. She then chooses the one which she feels will be most likely to meet the long term ideas she has for herself.
VERY LIKE ME (1) A LITTLE LIKE ME (2)
DECISION-MAKING AND SCHOOL LEAVERS 227
UNDECIDED (3) NOT REALLY LIKE ME (4) NOT AT ALL LIKE ME (5)
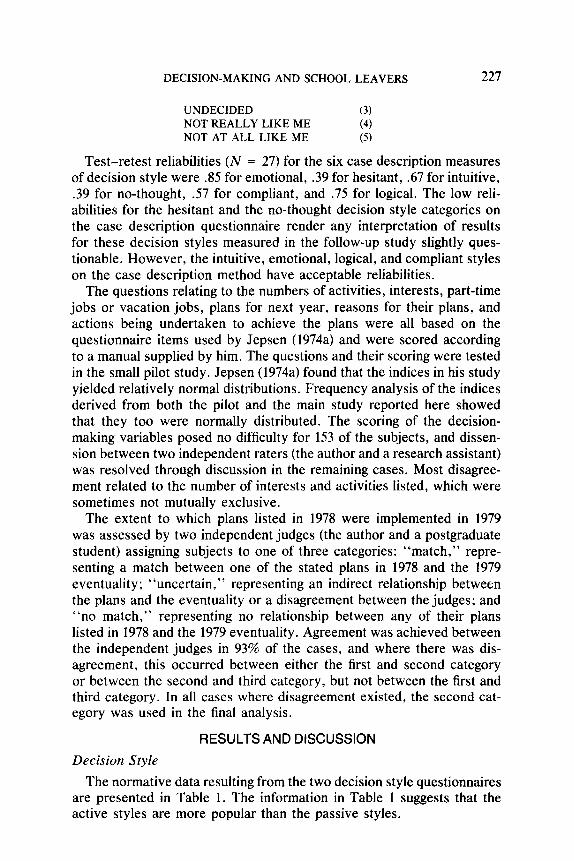
Test-retest reliabilities (N = 27) for the six case description measures of decision style were .85 for emotional, .39 for hesitant, .67 for intuitive, .39 for no-thought, 57 for compliant, and .75 for logical. The low reli- abilities for the hesitant and the no-thought decision style categories on the case description questionnaire render any interpretation of results for these decision styles measured in the follow-up study slightly ques- tionable. However, the intuitive, emotional, logical, and compliant styles on the case description method have acceptable reliabilities.
The questions relating to the numbers of activities, interests, part-time jobs or vacation jobs, plans for next year, reasons for their plans, and actions being undertaken to achieve the plans were all based on the questionnaire items used by Jepsen (1974a) and were scored according to a manual supplied by him. The questions and their scoring were tested in the small pilot study. Jepsen (1974a) found that the indices in his study yielded relatively normal distributions. Frequency analysis of the indices derived from both the pilot and the main study reported here showed that they too were normally distributed. The scoring of the decision- making variables posed no difficulty for 153 of the subjects, and dissen- sion between two independent raters (the author and a research assistant) was resolved through discussion in the remaining cases. Most disagree- ment related to the number of interests and activities listed, which were sometimes not mutually exclusive.
The extent to which plans listed in 1978 were implemented in 1979 was assessed by two independent judges (the author and a postgraduate student) assigning subjects to one of three categories: “match,” repre- senting a match between one of the stated plans in 1978 and the 1979 eventuality; “uncertain,” representing an indirect relationship between the plans and the eventuality or a disagreement between the judges; and “no match,” representing no relationship between any of their plans listed in 1978 and the 1979 eventuality. Agreement was achieved between the independent judges in 93% of the cases, and where there was dis- agreement, this occurred between either the first and second category or between the second and third category, but not between the first and third category. In all cases where disagreement existed, the second cat- egory was used in the final analysis.
Decision Style
RESULTS AND DISCUSSION
The normative data resulting from the two decision style questionnaires are presented in Table 1. The information in Table 1 suggests that the active styles are more popular than the passive styles.
228 BERYL HESKETH
TABLE 1 Normative Data from the Case Description and Rank Order Decision Style
Questionnaires”
Style Case mean Description SD Rank median
Emotional 2.19 1.24 1.63 Hesitant 3.36 1.23 3.12 Intuitive 3.12 1.29 3.72 No-thought 4.23 .95 5.13 Compliant 4.42 .95 4.87 Logical 2.24 1.13 1.49
Order mode
1.0 3.0 4.0 6.0 5.0 1.0
’ N = 169.
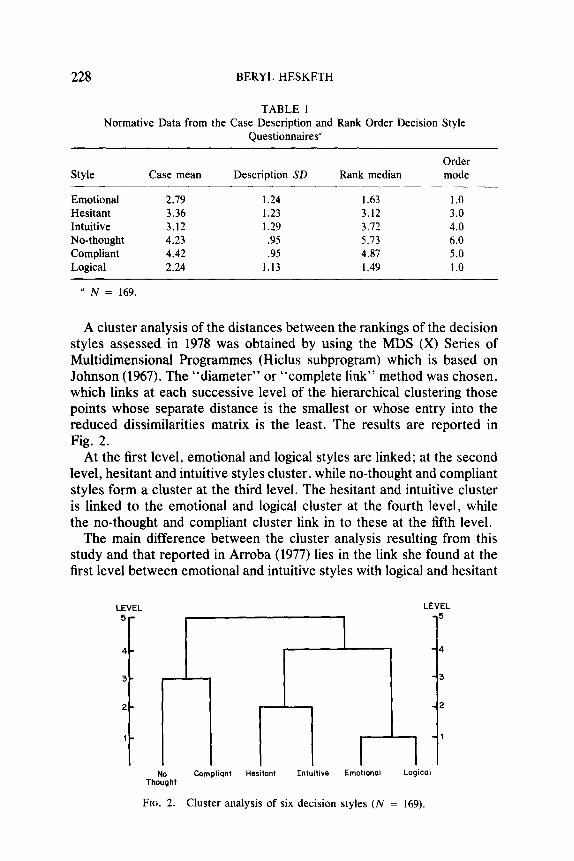
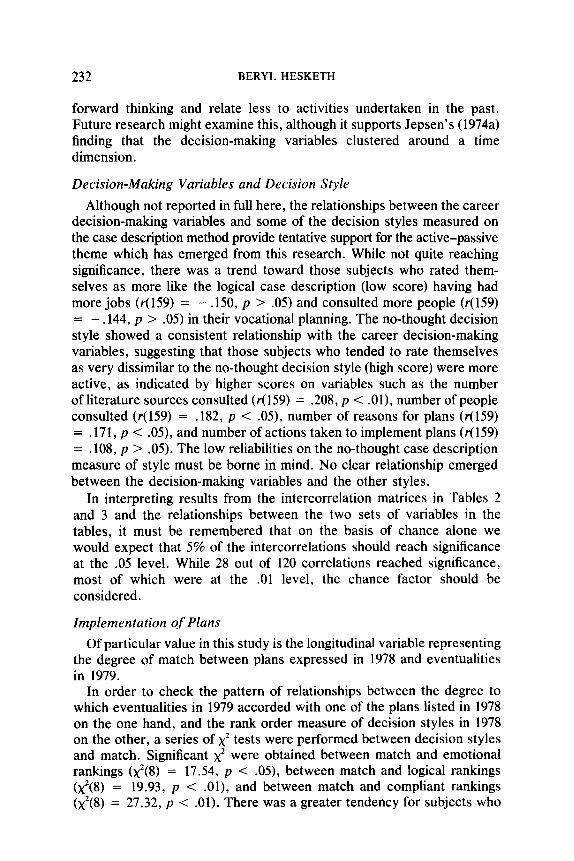
A cluster analysis of the distances between the rankings of the decision styles assessed in 1978 was obtained by using the MDS (X) Series of Multidimensional Programmes (Hiclus subprogram) which is based on Johnson (1967). The “diameter” or “complete link” method was chosen, which links at each successive level of the hierarchical clustering those points whose separate distance is the smallest or whose entry into the reduced dissimilarities matrix is the least. The results are reported in Fig. 2.
At the first level, emotional and logical styles are linked; at the second level, hesitant and intuitive styles cluster, while no-thought and compliant styles form a cluster at the third level. The hesitant and intuitive cluster is linked to the emotional and logical cluster at the fourth level, while the no-thought and compliant cluster link in to these at the fifth level.
The main difference between the cluster analysis resulting from this study and that reported in Arroba (1977) lies in the link she found at the first level between emotional and intuitive styles with logical and hesitant
LEVEL LEVEL 5-
4-
3-
2-
l-
1
-C
-1
-2
NO Thought
Compliant Hesitant Intuitw Emotlonol LogIcal
FIG. 2. Cluster analysis of six decision styles (N = 169).
DECISION-MAKING AND SCHOOL LEAVERS 229
styles being linked at the second level. The remaining linkages were the same. Given the different nature of the source of data (questionnaire vs interview) and that Arroba’s distance matrix was based on the degree of confusion between judges in assigning a decision to a style while the current distance matrix relates to distances between ranks, it is not surprising that minor differences emerged.
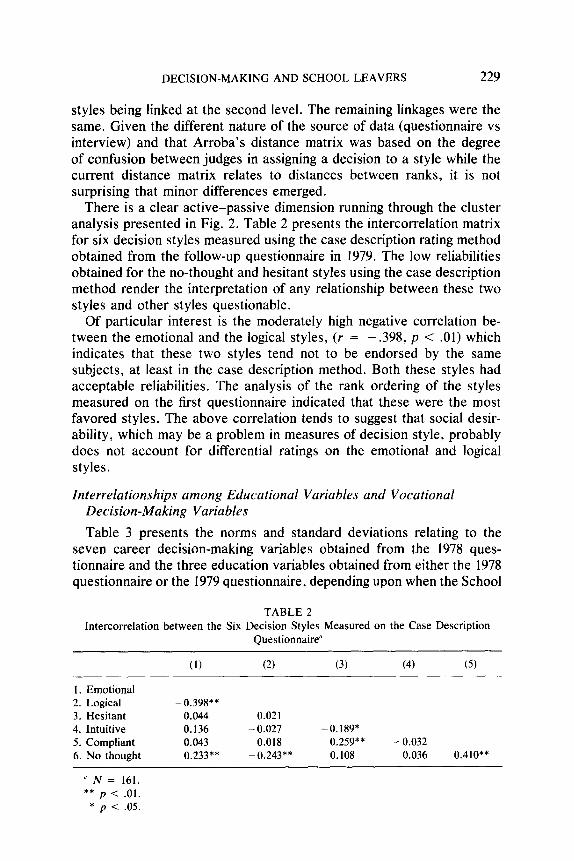
There is a clear active-passive dimension running through the cluster analysis presented in Fig. 2. Table 2 presents the intercorrelation matrix for six decision styles measured using the case description rating method obtained from the follow-up questionnaire in 1979. The low reliabilities obtained for the no-thought and hesitant styles using the case description method render the interpretation of any relationship between these two styles and other styles questionable.
Of particular interest is the moderately high negative correlation be- tween the emotional and the logical styles, (r = - .398, p < .Ol) which indicates that these two styles tend not to be endorsed by the same subjects, at least in the case description method. Both these styles had acceptable reliabilities. The analysis of the rank ordering of the styles measured on the first questionnaire indicated that these were the most favored styles. The above correlation tends to suggest that social desir- ability, which may be a problem in measures of decision style, probably does not account for differential ratings on the emotional and logical styles.
Interrelationships among Educational Variables and Vocational Decision-Making Variables
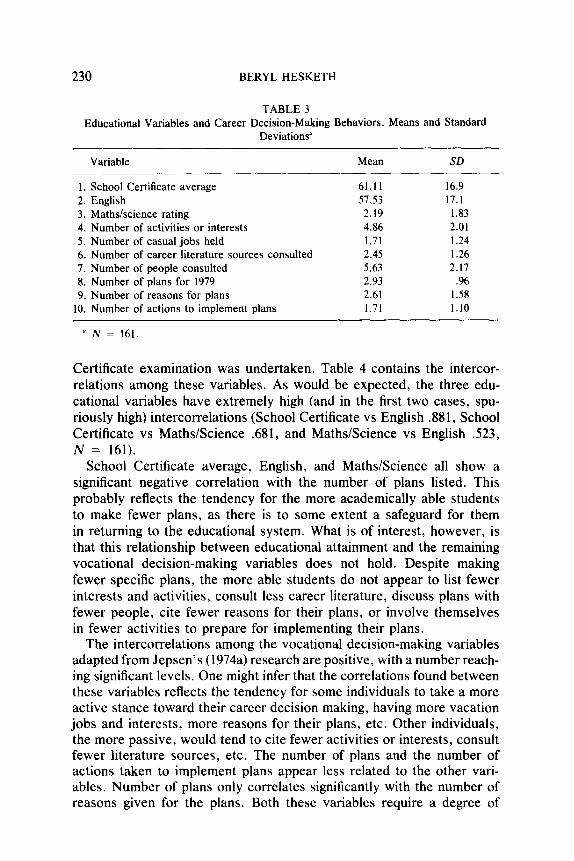
Table 3 presents the norms and standard deviations relating to the seven career decision-making variables obtained from the 1978 ques- tionnaire and the three education variables obtained from either the 1978 questionnaire or the 1979 questionnaire, depending upon when the School
TABLE 2 Intercorrelation between the Six Decision Styles Measured on the Case Description
Questionnaire”
(1) (2) (3) (4) (5)
1. Emotional 2. Logical - 0.398** 3. Hesitant 0.044 0.021 4. Intuitive 0.136 - 0.027 -0.189* 5. Compliant 0.043 0.018 0.259** - 0.032 6. No thought 0.233** -0.243** 0.108 0.036 0.410**
a N = 161. ** p < .Ol.
* p < .05.
230 BERYL HESKETH
TABLE 3 Educational Variables and Career Decision-Making Behaviors. Means and Standard
Deviations”
Variable
1. School Certificate average 2. English 3. Maths/science rating 4. Number of activities or interests 5. Number of casual jobs held 6. Number of career literature sources consulted 7. Number of people consulted 8. Number of plans for 1979 9. Number of reasons for plans
10. Number of actions to implement plans
’ N = 161.
Mean SD
61.11 16.9 57.53 17.1 2.19 1.83 4.86 2.01 1.71 1.24 2.45 1.26 5.63 2.17 2.93 .96 2.61 1.58 1.71 1.10
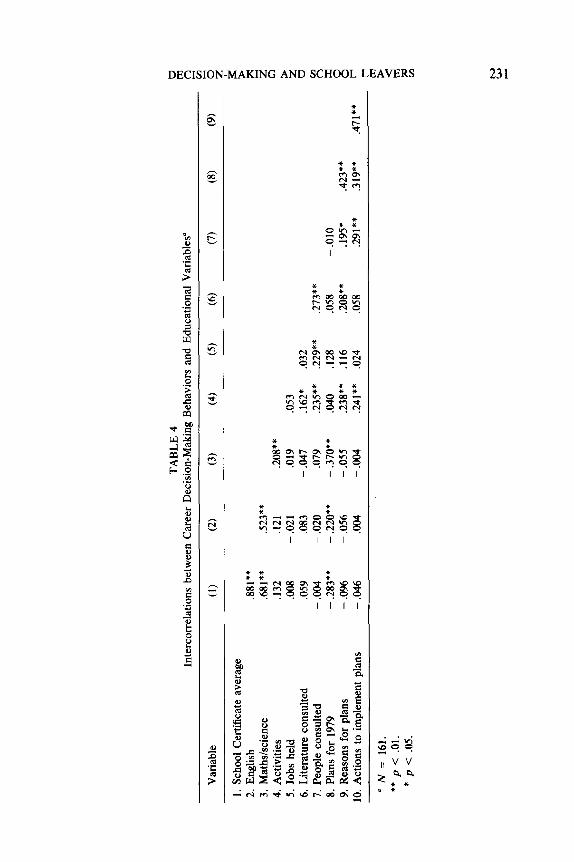
Certificate examination was undertaken. Table 4 contains the intercor- relations among these variables. As would be expected, the three edu- cational variables have extremely high (and in the first two cases, spu- riously high) intercorrelations (School Certificate vs English .881, School Certificate vs Maths/Science .681, and Maths/Science vs English S23, N = 161).
School Certificate average, English, and Maths/Science all show a significant negative correlation with the number of plans listed. This probably reflects the tendency for the more academically able students to make fewer plans, as there is to some extent a safeguard for them in returning to the educational system. What is of interest, however, is that this relationship between educational attainment and the remaining vocational decision-making variables does not hold. Despite making fewer specific plans, the more able students do not appear to list fewer interests and activities, consult less career literature, discuss plans with fewer people, cite fewer reasons for their plans, or involve themselves in fewer activities to prepare for implementing their plans.
The intercorrelations among the vocational decision-making variables adapted from Jepsen’s (1974a) research are positive, with a number reach- ing significant levels. One might infer that the correlations found between these variables reflects the tendency for some individuals to take a more active stance toward their career decision making, having more vacation jobs and interests, more reasons for their plans, etc. Other individuals, the more passive, would tend to cite fewer activities or interests, consult fewer literature sources, etc. The number of plans and the number of actions taken to implement plans appear less related to the other vari- ables. Number of plans only correlates significantly with the number of reasons given for the plans. Both these variables require a degree of
TABL
E 4
Inte
rcor
rela
tions
be
twee
n Ca
reer
De
cisio
n-M
akin
g Be
havio
rs
and
Educ
atio
nal
Varia
bles
” t;
Varia
ble
(1)
(2)
(3)
(4)
(5)
(6)
(7)
(8)
(9)
g
1. S
choo
l C
ertif
icat
e av
erag
e 2.
Eng
lish
.881
**
5 E 3.
Mat
hs/s
cienc
e .6
81**
.5
23**
4.
Act
iviti
es
.132
.1
21
.208
**
3 5.
Job
s he
ld ~3
08
- .0
21
.019
.0
53
> 6.
Lite
ratu
re
cons
ulte
d .0
59
,083
-
.047
.1
62*
.032
3
7. P
eople
co
nsul
ted
-.004
-
.020
.0
79
.235
**
.229
**
.273
**
x 8.
Pla
ns f
or 1
979
- .2
83**
-
.220
**
- .3
70**
.0
40
.128
.0
58
- .O
lO
9. R
easo
ns f
or p
lans
-
.096
-
.056
-
.055
.2
38**
.I1
6 .2
08**
.1
95*
.423
+*
E 10
. Act
ions
to
impl
emen
t pl
ans
-.046
.0
04
-.004
.2
41**
.0
24
.058
.2
91**
.3
19**
.4
71**
r is
a N
= 16
1.
** p
<
.Ol.
5 *
p <
.05.
z
232 BERYL HESKETH
forward thinking and relate less to activities undertaken in the past. Future research might examine this, although it supports Jepsen’s (1974a) finding that the decision-making variables clustered around a time dimension.
Decision-Making Variables and Decision Style
Although not reported in full here, the relationships between the career decision-making variables and some of the decision styles measured on the case description method provide tentative support for the active-passive theme which has emerged from this research. While not quite reaching significance, there was a trend toward those subjects who rated them- selves as more like the logical case description (low score) having had more jobs (r(159) = - .150, p > .05) and consulted more people (r(159) = - .144, p > .05) in their vocational planning. The no-thought decision style showed a consistent relationship with the career decision-making variables, suggesting that those subjects who tended to rate themselves as very dissimilar to the no-thought decision style (high score) were more active, as indicated by higher scores on variables such as the number of literature sources consulted (r(159) = .208, p < .Ol), number of people consulted (r( 159) = .182, p < .05), number of reasons for plans (r( 159) = .171, p < .05), and number of actions taken to implement plans (r(159) = .108, p > .05). The low reliabilities on the no-thought case description measure of style must be borne in mind. No clear relationship emerged between the decision-making variables and the other styles.
In interpreting results from the intercorrelation matrices in Tables 2 and 3 and the relationships between the two sets of variables in the tables, it must be remembered that on the basis of chance alone we would expect that 5% of the intercorrelations should reach significance at the .05 level. While 28 out of 120 correlations reached significance, most of which were at the .Ol level, the chance factor should be considered.
Implementation of Plans
Of particular value in this study is the longitudinal variable representing the degree of match between plans expressed in 1978 and eventualities in 1979.
In order to check the pattern of relationships between the degree to which eventualities in 1979 accorded with one of the plans listed in 1978 on the one hand, and the rank order measure of decision styles in 1978 on the other, a series of x2 tests were performed between decision styles and match. Significant x2 were obtained between match and emotional rankings (x’(8) = 17.54, p < .05), between match and logical rankings (x*(S) = 19.93, p < .Ol), and between match and compliant rankings (x2(8) = 27.32, p < .Ol). There was a greater tendency for subjects who
DECISION-MAKING AND SCHOOL LEAVERS 233
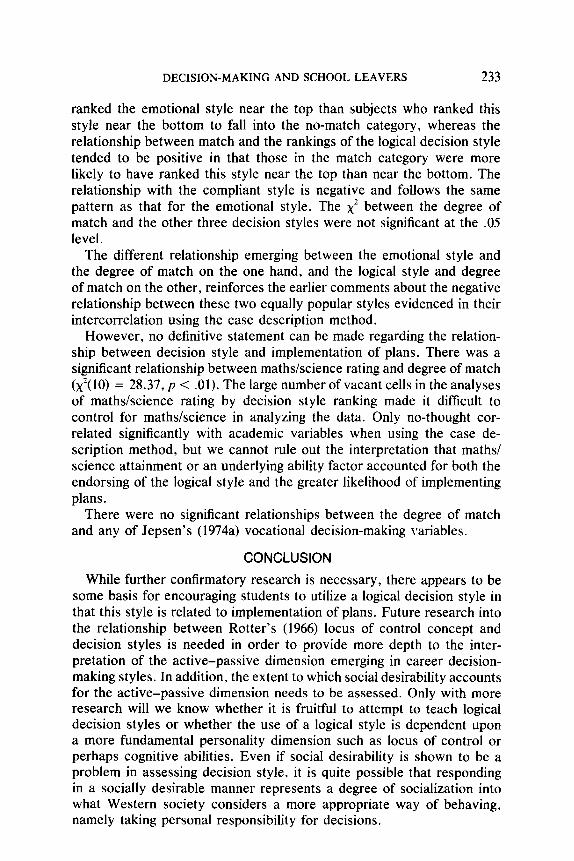
ranked the emotional style near the top than subjects who ranked this style near the bottom to fall into the no-match category, whereas the relationship between match and the rankings of the logical decision style tended to be positive in that those in the match category were more likely to have ranked this style near the top than near the bottom. The relationship with the compliant style is negative and follows the same pattern as that for the emotional style. The xZ between the degree of match and the other three decision styles were not significant at the .05 level.
The different relationship emerging between the emotional style and the degree of match on the one hand, and the logical style and degree of match on the other, reinforces the earlier comments about the negative relationship between these two equally popular styles evidenced in their intercorrelation using the case description method.
However, no definitive statement can be made regarding the relation- ship between decision style and implementation of plans. There was a significant relationship between maths/science rating and degree of match (~‘(10) = 28.37, p < .Ol). The large number of vacant cells in the analyses of maths/science rating by decision style ranking made it difficult to control for maths/science in analyzing the data. Only no-thought cor- related significantly with academic variables when using the case de- scription method, but we cannot rule out the interpretation that maths/ science attainment or an underlying ability factor accounted for both the endorsing of the logical style and the greater likelihood of implementing plans.
There were no significant relationships between the degree of match and any of Jepsen’s (1974a) vocational decision-making variables.
CONCLUSION
While further confirmatory research is necessary, there appears to be some basis for encouraging students to utilize a logical decision style in that this style is related to implementation of plans. Future research into the relationship between Rotter’s (1966) locus of control concept and decision styles is needed in order to provide more depth to the inter- pretation of the active-passive dimension emerging in career decision- making styles. In addition, the extent to which social desirability accounts for the active-passive dimension needs to be assessed. Only with more research will we know whether it is fruitful to attempt to teach logical decision styles or whether the use of a logical style is dependent upon a more fundamental personality dimension such as locus of control or perhaps cognitive abilities. Even if social desirability is shown to be a problem in assessing decision style, it is quite possible that responding in a socially desirable manner represents a degree of socialization into what Western society considers a more appropriate way of behaving, namely taking personal responsibility for decisions.
234 BERYL HESKETH
REFERENCES Arroba, T. Styles of decision-making and their use: An empirical study. British Journal
of Guidance and Counseling, 1977, 5(2), 149-158. Ginzberg, E., Ginsberg, S. W., Axelrad, S., & Herma, J. L. Occupational Choice; An
approach fo general theory. New York: Columbia Univ. Press, 1951. Harren, V. A., Kass, R. A., Tinsley, H. E. A., and Moreland, J. R. Influence of sex role
attitudes and cognitive styles on career decision making. Journal of Counseling Psy- chology, 1978, 25, 5, 390-398.
Jepsen, D. A. Vocational decision-making patterns among noncollege-aspiring adolescents. Journal of Vocational Behavior, 1974, 4, 284-293. (a)
Jepsen, D. A. Vocational decision-making strategy-types: An exploratory study. Vocational
Guidance Quarterly, 1974, 23, 1, 17-23. (b) Johnson, S. C. Hierarchical clustering schemes. Psychometrica, 1967, 32, 241-251. Rotter, J. B. Generalised expectancies for internal versus external locus of control of
reinforcement. Psycho/ogica/ Monographs: General and Applied, 1966, SO(l), (Whole No. 609), l-27.
Received: March 23, 1981.