Embed Size (px)
Citation preview
DECISION MAKING
IN SUPPLY RISK AND
SUPPLY DISRUPTION MANAGEMENT
Inauguraldissertation
zur Erlangung des akademischen Grades
eines Doktors der Wirtschaftswissenschaften
der Universität Mannheim
vorgelegt von
Maximilian Merath
Mannheim

ii
Dekan: Prof. Dr. Dieter Truxius
Referent: Prof. Dr. Christoph Bode
Korreferentin: Prof. Dr. Laura Marie Edinger-Schons
Tag der mündlichen Prüfung: 7. Dezember 2018
iii
Acknowledgements
First of all, I would like to express my sincere gratitude to my supervisor Prof. Dr.
Christoph Bode. Christoph taught me everything I needed to know about conducting
research and presenting one’s work in an adequate fashion. He provided valuable
feedback and guidance throughout the time I spent at his Chair. Most importantly, I highly
appreciate the positive and goal-oriented working atmosphere Christoph established right
from the beginning. This fostered productivity and progress regarding my work on the
dissertation. Moreover, I could always rely on Christoph regarding issues that extended
beyond the usual work-related matters.
Special thanks go to my colleagues, especially Michael Westerburg and Sebastian
Gehrlein, for valuable discussions, fun lunch breaks, and the distractions from the daily
work. In addition, I would like to thank and Helke Naujok and Judith Fuhrmann.
Furthermore, I owe a deep debt of gratitude to my parents, Esther and Franz, my
fiancée, Danica, and my brother, Janosch. I could always rely on their support and
suggestions.
Finally, an exciting part of the time I spent working on the dissertation has been
made possible by John R. Macdonald and Lynn M. Shore who invited me to Colorado
State University (Fort Collins, Colorado). John provided excellent advice on chapter 2 of
this dissertation and played a decisive role in making my stay in Fort Collins a great
experience.
iv
Contents
List of figures ............................................................................................. vii
List of tables .............................................................................................. viii
List of abbreviations .................................................................................. ix
Chapter 1 Introduction and research overview ....................................... 1
1.1 Motivation ......................................................................................................... 1
1.2 Research questions ........................................................................................... 2
1.2.1 Research question 1: Supply risk management ...................................... 3
1.2.2 Research question 2: The influence of supply risk management on the
impact of disruptions .............................................................................. 4
1.2.3 Research question 3: Supply disruption management ............................ 6
Chapter 2 Supply disruptions and protection motivation: Why some
managers act proactively (and others don’t) ......................... 8
2.1 Introduction ...................................................................................................... 9
2.2 Protection motivation theory and propositions ........................................... 10
2.2.1 Coping appraisal ................................................................................... 13
2.2.2 Threat appraisal ..................................................................................... 13
2.2.3 Individual characteristics ...................................................................... 15
2.3 Methodology .................................................................................................... 16
2.3.1 Experimental design ............................................................................. 17
2.3.2 Study participants ................................................................................. 20
2.4 Results .............................................................................................................. 23
2.4.1 Estimation strategy ............................................................................... 23
2.4.2 Model estimation .................................................................................. 25
2.5 Discussion ........................................................................................................ 28
2.5.1 Theoretical implications ....................................................................... 29
2.5.2 Managerial implications ....................................................................... 31
2.5.3 Limitations and future research opportunities ...................................... 32
v
Chapter 3 Substantive and symbolic corporate social responsibility:
Blessing or curse in case of misconduct? .............................. 34
3.1 Introduction .................................................................................................... 35
3.2 Conceptual background and hypotheses development ............................... 36
3.2.1 Substantive and symbolic management of corporate social
responsibility expectations .................................................................... 36
3.2.2 Corporate social irresponsibility ........................................................... 39
3.2.3 Assimilation and contrast effects subsequent to CSIR ......................... 41
3.3 Method ............................................................................................................. 44
3.3.1 Development of vignettes and experimental design ............................. 45
3.3.2 Study participants ................................................................................. 48
3.3.3 Measures ............................................................................................... 48
3.3.4 Manipulation checks ............................................................................. 50
3.4 Results .............................................................................................................. 51
3.5 Discussion ........................................................................................................ 54
3.5.1 Theoretical implications ....................................................................... 54
3.5.2 Managerial implications ....................................................................... 57
3.5.3 Limitations and future research opportunities ...................................... 58
Chapter 4 Supply disruption management: The early bird catches the
worm, but the second mouse gets the cheese? ...................... 61
4.1 Introduction .................................................................................................... 62
4.2 Supply disruption management and resilience ............................................ 63
4.3 How managers should behave in supply disruption response situations .. 65
4.3.1 A model of supply disruption recovery ................................................ 65
4.3.2 The environment ................................................................................... 66
4.3.3 Organizational adaptation to environmental change ............................ 67
4.3.4 Supply disruptions and uncertainty ....................................................... 68
4.3.5 Disruption response strategies .............................................................. 69
4.3.6 Path dependence ................................................................................... 72
4.3.7 Results ................................................................................................... 73
4.3.8 Robustness of simulation results ........................................................... 80
4.3.9 Discussion ............................................................................................. 81
4.4 How managers actually intend to behave in supply disruption response
situations .......................................................................................................... 82
vi
4.4.1 Development of the vignettes ............................................................... 83
4.4.2 Study participants ................................................................................. 85
4.4.3 Dependent variable ............................................................................... 85
4.4.4 Manipulation checks ............................................................................. 85
4.4.5 Results ................................................................................................... 86
4.4.6 Discussion ............................................................................................. 88
4.5 General discussion .......................................................................................... 89
4.5.1 Implications for research ...................................................................... 89
4.5.2 Implications for practice ....................................................................... 91
4.5.3 Limitations and future research opportunities ...................................... 92
Chapter 5 Conclusion and future research directions .......................... 94
5.1 Summary ......................................................................................................... 94
5.1.1 Research question 1: Supply risk management .................................... 94
5.1.2 Research question 2: The influence of supply risk management on the
impact of disruptions ............................................................................ 96
5.1.3 Research question 3: Supply disruption management .......................... 97
5.2 Limitations ...................................................................................................... 98
5.3 Outlook ............................................................................................................ 99
References ................................................................................................ 101
Curriculum vitae ..................................................................................... 120
vii
List of figures
Figure 1: Overview of research questions ....................................................................... 3
Figure 2: Overall model of protection motivation theory (based on Rogers (1983)) .... 12
Figure 3: Relative importance of DCE response alternative variables .......................... 27
Figure 4: Perceived relative importance of DCE response alternative variables ........... 28
Figure 5: Enriched model of protection motivation theory ........................................... 30
Figure 6: Interaction effect of CSR reputation and CSIR severity ................................ 53
Figure 7: Typical supply disruption profile ................................................................... 64
Figure 8: An individual simulation run .......................................................................... 71
Figure 9: Summary of results ......................................................................................... 75
Figure 10: Post-disruption performance (PDP) ............................................................. 76
Figure 11: Final performance (FP) ................................................................................ 78
Figure 12: Uncertainty resolution performance (URP) ................................................. 79
Figure 13: Number of time periods required to reach long-term configuration (NTP) . 80
Figure 14: The effects of response uncertainty, complexity, and path dependence on
ITA ............................................................................................................... 88
viii
List of tables
Table 1: Scenario descriptions ....................................................................................... 19
Table 2: Attribute level descriptions .............................................................................. 20
Table 3: Multi-item measurement scales ....................................................................... 22
Table 4: Bivariate correlations and descriptive statistics ............................................... 22
Table 5: Estimated MNL models ................................................................................... 26
Table 6: Vignette module text descriptions ................................................................... 47
Table 7: Frequencies, cell means, standard distributions, and correlation for the
dependent variables ......................................................................................... 51
Table 8: ANOVA results with purchase intention (PI) as dependent variable .............. 51
Table 9: ANOVA results with intention to engage in negative word-of-mouth (nWOM)
as dependent variable ....................................................................................... 52
Table 10: Summary of hypotheses and results ............................................................... 53
Table 11: Parameter values determining the experimental conditions .......................... 74
Table 12: Frequencies, cell means, and standard distributions for ITA ......................... 87
Table 13: ANOVA results .............................................................................................. 87
Table 14: Summary of propositions ............................................................................... 90
ix
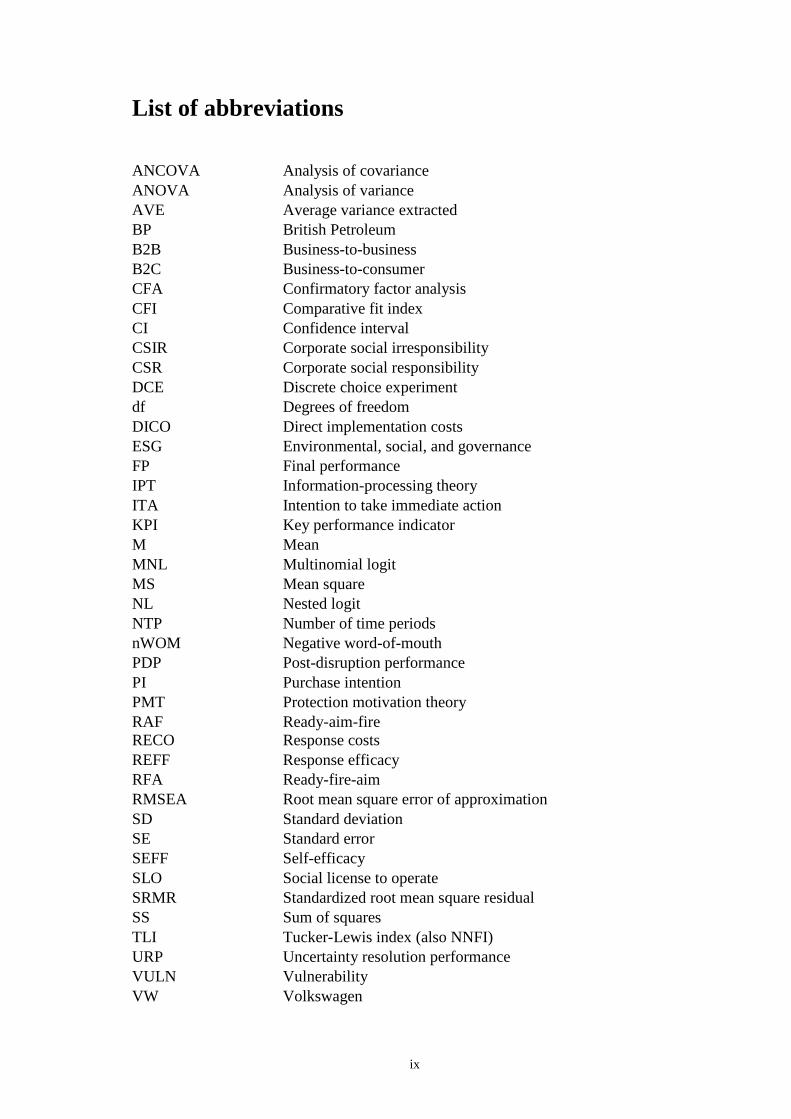
List of abbreviations
ANCOVA Analysis of covariance
ANOVA Analysis of variance
AVE Average variance extracted
BP British Petroleum
B2B Business-to-business
B2C Business-to-consumer
CFA Confirmatory factor analysis
CFI Comparative fit index
CI Confidence interval
CSIR Corporate social irresponsibility
CSR Corporate social responsibility
DCE Discrete choice experiment
df Degrees of freedom
DICO Direct implementation costs
ESG Environmental, social, and governance
FP Final performance
IPT Information-processing theory
ITA Intention to take immediate action
KPI Key performance indicator
M Mean
MNL Multinomial logit
MS Mean square
NL Nested logit
NTP Number of time periods
nWOM Negative word-of-mouth
PDP Post-disruption performance
PI Purchase intention
PMT Protection motivation theory
RAF Ready-aim-fire
RECO Response costs
REFF Response efficacy
RFA Ready-fire-aim
RMSEA Root mean square error of approximation
SD Standard deviation
SE Standard error
SEFF Self-efficacy
SLO Social license to operate
SRMR Standardized root mean square residual
SS Sum of squares
TLI Tucker-Lewis index (also NNFI)
URP Uncertainty resolution performance
VULN Vulnerability
VW Volkswagen
Introduction and research overview 1
Chapter 1 Introduction and research overview
1.1 Motivation
“The ultimate measure of a man is not where he stands in moments of comfort and
convenience, but where he stands at times of challenge and controversy.”
– Martin Luther King, Jr.
Supply chains are exposed to a myriad of risks that pose considerable challenges to
managers. In case a risk materializes and creates a subsequent disruption, the potential
negative consequences are devastating. Recent developments foster the vulnerability of
firms to suffer from supply chain risks and add considerable relevance to the threat of
being severely harmed by them. First, modern supply chains have become more complex
and interconnected due to globalization and intensified competition (Bode & Wagner,
2015; Business Continuity Institute, 2016). Second, many supply chain management
initiatives that appear to provide enhanced efficiency or responsiveness in stable
environments turn out to be a burden for firms in turbulent ones (Norrman & Jansson,
2004). Third, the pressure that stakeholders can exert on firms to comply with ethical
standards and commit to environmental and social values, especially by holding them
accountable for misconduct within their supply chains, has grown (Hartmann & Moeller,
2014). Finally, not only the frequency of natural catastrophes but also their intensity has
increased (Munich Re, 2017).
Prior research has shown that supply chain disruptions tend to be “more critical
when they occur upstream in the chain” (Pereira, Christopher, & Lago Da Silva, 2014, p.
627). Hence, this dissertation research focuses on upstream supply chain risks (hereafter:
Supply risks) and disruptions (hereafter: Supply disruptions). To manage a firm’s
exposure to supply risks and better prepare for supply disruptions, the responsible
managers can employ two basic approaches. On the one hand, they can act proactively
and aim at reducing the probability of a supply disruption to occur or mitigating the
consequences of such adverse events (supply risk management). On the other hand, they
can decide to cope with the aftermath of a materialized risk in a reactive fashion (supply
disruption management) (Craighead, Blackhurst, Rungtusanatham, & Handfield, 2007).
Various proactive and reactive activities have been delineated in prior research and the
negative consequences of supply disruptions are well-known (Hendricks & Singhal,
Introduction and research overview 2
2005b). However, and although most executives make supply risk management a top
priority, many firms appear to be unprepared to cope with supply disruptions (A.T.
Kearney & RapidRatings, 2018).
Certain types of supply disruptions – especially those characterized by high impact
but low probability – cannot be avoided or resolved as part of daily operations
management. These events need to be appropriately addressed to mitigate their
potentially severe negative consequences, as highlighted by recent industry examples: An
explosion at a steel supplier’s plant in Nagoya, Japan, forced Toyota to halt production at
all of their Japanese factories for one week (Tovey, 2016), online fashion company ASOS
was exposed to massive criticism due to the identification of child workers in its supply
chain (J. Webb, 2016a), and BASF suffered from a natural gas shortage that required a
shutdown of one of its major factories in China (Bradsher, 2017). To effectively prepare
for such sudden disruptions and mitigate their negative repercussions is a complex task.
In this regard, relatively little is known about the behavior of individuals within
supply risk and supply disruption management (Macdonald & Corsi, 2013). Given the
circumstance that a large fraction of the decisions concerning crisis situations is typically
made by single decision makers with centralized authority (Dubrovski, 2004), it is
surprising that behavioral aspects have been neglected in research on supply risk and
disruptions, so far. Thus, the aim of this dissertation research is to shed light on specific
research questions that cover behavioral aspects of managing supply risks and disruptions
to improve our understanding of how to effectively address them. The results not only
provide novel implications for theory and practice but also reveal certain fruitful avenues
for future research.
1.2 Research questions
The research questions addressed in the course of this dissertation revolve around
important issues of decision making in supply risk and supply disruption management.
These issues have received only limited research attention and benefit from novel insights
to improve our understanding of how supply risks and disruptions can effectively be
addressed. In the extant literature on supply risks and disruptions, there is an agreement
that supply disruptions follow a typical profile with regard to their impact on firm
performance over time (Sheffi, 2005). In case that a supply risk materializes, a subsequent
Introduction and research overview 3
supply disruption leads to a sudden drop in operating performance. This disturbance
causes firms to initiate recovery efforts to return to normal performance levels.
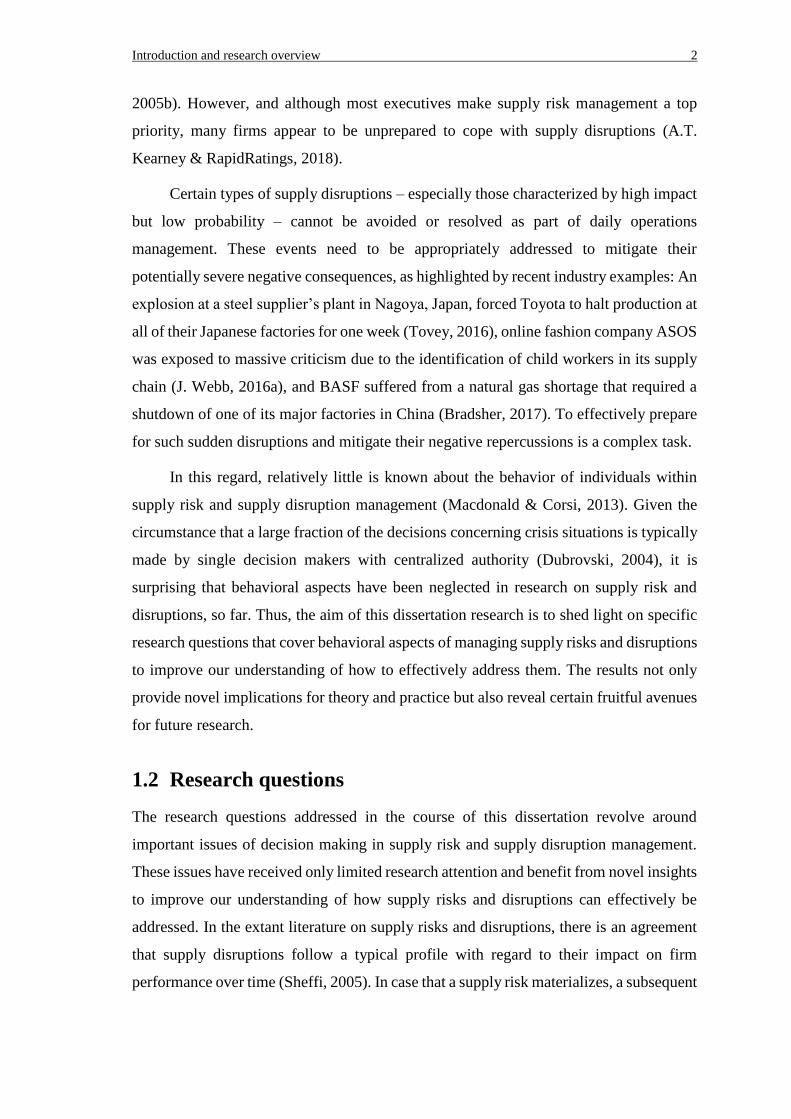
Figure 1 depicts this typical supply disruption profile and provides an overview of
how the three research questions addressed by this dissertation are linked to it. In
particular, the first research question explores why some managers act proactively to
mitigate the potential loss from future supply disruptions while others do not. The second
research question aims to shed light on how prior engagement in corporate social
responsibility (CSR) affects negative stakeholder reactions to a materialized CSR-related
risk. Finally, the third research question addresses the issue of how quickly decision
makers should and do actually initiate recovery efforts after their firm has been hit by a
supply disruption. Each of these research questions was approached by means of carefully
designed and executed experiments to enable a controlled test of the relationships
investigated. In the following, the three research questions are delineated in more detail.
Figure 1: Overview of research questions
Note. CSIR refers to corporate social irresponsibility.
1.2.1 Research question 1: Supply risk management
The overarching aim of supply risk management is to pursue a combination of activities
for which the remaining amount of risk complies with the firm’s risk preference and
corporate strategy (Hofmann, Busse, Bode, & Henke, 2014). Although it is well-known
that supply risk management is associated with certain benefits (Mitroff & Alpaslan,
2003; Norrman & Jansson, 2004), it remains largely unexplored how and why some
Introduction and research overview 4
managers decide to take proactive action to mitigate the impact of future supply
disruptions while others do not. The related managerial choices strongly influence to
which degree firms are able to cope with supply disruptions. Hence, to contribute to an
improved understanding of this issue, it is vital to unravel behavioral components of
supply risk management.
A relatively similar problem has been investigated by health-related research.
Analyzing the factors that shape an individual’s decision to adopt certain preventive
health behaviors, Rogers (1975, 1983) developed protection motivation theory (PMT).
PMT is based on the idea that when individuals are exposed to a threat, their probability
to adopt a certain coping response depends on two cognitive appraisal processes. These
appraisal processes take factors into account that are associated with the costs and impact
of a potential proactive action (coping appraisal) as well as the characteristics of a threat
and the consequences of not taking proactive action (threat appraisal). Although PMT
has initially been developed to study the effects of fear appeals on health behavior, it has
moved far beyond them and is considered generalizable to “apply to any situation
involving threat” (Rogers, 1983, p. 172).
PMT serves as an insightful framework to study decisions on whether or not
managers proactively address supply risks and contributes to a better understanding of
the role that individual managers’ behaviors play within the process of managing supply
risks. Hence, Study 1 in Chapter 2 employs PMT to examine proactive decision making
to provide an answer to the following research question:
Research
Question 1
Why do some decision makers decide to proactively act to mitigate
the impact of future supply disruptions while others do not?
1.2.2 Research question 2: The influence of supply risk management on the impact
of disruptions
Despite the growing pressure that stakeholders can exert on firms to adhere to ethical
standards and behave in socially responsible ways (Campbell, 2007), the amplified public
awareness and availability of information on environmental and social misconduct
(Fiaschi, Giuliani, & Nieri, 2017), and the increasingly difficult challenge for firms to
prevent irresponsible behavior in their supply chains (Hartmann & Moeller, 2014), the
issue of corporate social irresponsibility (CSIR) in supply chains has been neglected in
the academic discussion of CSR. In the academic literature on CSR, there is a strong focus
on equating CSR with “doing good”, although it has been shown that “avoiding bad” also
Introduction and research overview 5
constitutes an important precondition for a firm to successfully position itself as socially
responsible (Lin-Hi & Müller, 2013).
Prior research has predominantly assumed that a firm’s ex ante CSR activities may
serve as a “reservoir of goodwill” among the firm’s stakeholders that mitigates negative
reactions to CSIR (e.g., Flammer, 2013; Godfrey, Merrill, & Hansen, 2009; Jones, Jones,
& Little, 2000; Klein & Dawar, 2004). However, there are reasons to seriously doubt that
these insurance-like effects of ex ante CSR in case of CSIR universally apply. Several
studies suggest that firms which engage in CSR experience more negative reactions to
CSIR compared to firms which do not promote themselves as socially responsible (e.g.,
Sen & Bhattacharya, 2001; Swaen & Vanhamme, 2003; Vanhamme & Grobben, 2009).
Moreover, examples like Volkswagen (VW) that won numerous awards for CSR but
recently faced severe criticism due to the “Dieselgate” scandal contradict the idea of
insurance-like effects of prior CSR (Lynn, 2015).
Some researchers argue that a possible explanation for these contrary effects might
be that, similar to brand commitment (Germann, Grewal, Ross, & Srivastava, 2014), a
reputation for CSR provides a goodwill buffer in case of non-severe CSIR but also serves
as an expectation burden in case of severe CSIR (e.g., Janssen, Sen, & Bhattacharya,
2015; Kang, Germann, & Grewal, 2016). Moreover, these effects of ex ante CSR
reputations in times of crises might be subject to the nature of the employed activities to
gain a CSR reputation, which can either be substantive or symbolic (Ashforth & Gibbs,
1990). Substantive CSR is typically perceived as intrinsically motivated while symbolic
CSR is associated with extrinsic motives. In case of CSIR, instead of assuming a lack of
proper management or even malevolence, stakeholders are more willing to develop
alternative explanations for CSIR if they perceive a firm’s CSR engagement to be
intrinsically motivated rather than extrinsically driven (Janssen et al., 2015).
Study 2 focusses on the role of the purchasing function as gatekeeper to CSIR-
related risks in the supply chain of a focal firm and contributes to a better understanding
of negative stakeholder reactions to CSIR. More specifically, this research investigates
whether the effect of a CSR reputation on negative stakeholder reactions to CSIR in
professional buying contexts depends on CSIR severity and the reputation’s nature
(substantive vs. symbolic). Thereby, we explore the influence of proactive CSR
engagement on negative stakeholder reactions to a realized CSIR-related risk. Thus, the
Introduction and research overview 6
research presented in Chapter 3 aims to provide an answer to the following research
question:
Research
Question 2
How are negative stakeholder reactions to CSIR in industrial
buying contexts shaped by the type of CSR reputation and the CSIR
severity?
1.2.3 Research question 3: Supply disruption management
Decision making in supply disruption response and recovery situations is often difficult,
because choices have to be made dynamically in complex environments that are
characterized by uncertainty and limited information. Under these conditions, there are
two basic approaches of taking recovery decisions. Some firms defer actions until reliable
information is available for a sound judgment; other firms respond immediately, even
though the information at hand is cloudy or fragmented (Kleinmuntz & Thomas, 1987).
Using the analogy of shooting, the first approach can be termed “ready-aim-fire” (RAF)
and the second “ready-fire-aim” (RFA). Intuitively, RAF may lead to more precise
actions and a better solution quality than RFA, but the time required to gather additional
information may allow quicker competitors to obtain superior positions. Conversely,
RFA carries the inefficiencies of trial and error and, when decisions are irreversible and
path-dependent, the risk of pursuing an inferior recovery path. Hence, the key question
for managers concerned with supply disruptions is: Under which conditions should a
decision maker delay its recovery decision until more evidence is acquired?
It is not always trivial to select one of the two presented approaches (RAF and RFA)
as highlighted by the often-cited Albuquerque fire (Latour, 2001). On March 17, 2000, a
Philips plant in Albuquerque, New Mexico, was hit by lightning and caught fire (Lee,
2004). Initially, it seemed that the damage would be limited. Philips informed the two
main customers of the chips produced at this plant, Nokia and Ericsson, about an expected
delivery delay of one week. Yet, the responses of the two competitors were completely
different. Nokia immediately put pressure on Philips and quickly collaborated with
alternative suppliers to recover from the disruption with merely limited negative
consequences. Ericsson adopted a “wait and see” approach and delayed remedial action
until more evidence about the supply disruption had been acquired. By the time it became
obvious that the damage to the clean rooms was far more severe than expected, Ericsson
was not able to find an alternative supplier on short notice. As a result, Ericsson had to
Introduction and research overview 7
delay the launch of a new product and, finally, also ceased its own handset production as
a further consequence of this incident (Latour, 2001; Sheffi, 2005).
This example highlights that a firm’s ability to effectively respond to supply
disruptions is not only vital to its short-term performance but also essential for its long-
term competitiveness. However, supply disruption management has received only limited
research attention. In particular, there is a need to gain a better understanding of how the
responsible managers should respond to disruptive events in their firm’s upstream supply
chain to quickly recover from their negative consequences (Bode, Wagner, Petersen, &
Ellram, 2011; Macdonald & Corsi, 2013). Moreover, there is a need to investigate how
and to which extent the responsible decision makers’ intended choices deviate from how
they should behave. Hence, the following research question is addressed by Study 3 as
presented in Chapter 4:
Research
Question 3
Under which conditions should a manager delay its response
actions until more evidence is acquired and how do managers
actually intend to behave?
Supply disruptions and protection motivation: Why some managers act proactively (and others don’t) 8
Chapter 2 Supply disruptions and protection
motivation: Why some managers act
proactively (and others don’t)
Co-authors:
Christoph Bode
Endowed Chair of Procurement, Business School, University of Mannheim, Germany
John R. Macdonald
Department of Management, Colorado State University, Fort Collins, USA
Abstract1
Supply disruptions present considerable managerial challenges and have severe
consequences. To protect their firms from disturbances, managers must decide whether
or not to take proactive measures. However, little is known about how they make these
decisions. Protection motivation theory suggests that an individual’s intention to respond
to a threat by acting proactively results from cognitive appraisal processes. These
processes evaluate the characteristics of a potential coping response (e.g., its effectiveness
in averting the threat) and the threat itself (e.g., its severity). Building on this framework,
this study presents an analysis of what drives managers to or deters them from responding
to the threat of a supply chain disruption. The exploratory results from a discrete choice
experiment show that decision makers have a strong subconscious focus on cost-related
aspects of a specific proactive action, while consciously prioritizing the efficacy of the
action over its costs. Thus, the study provides interesting and novel insights into
behavioral aspects of supply chain risk management by revealing that decision makers’
perceptions of the relative importance of proactive action attributes deviate considerably
from their actual choice behavior. Additionally, proactive personality, risk attitude,
control appraisal, and experience had significant effects on the relative importance of
certain proactive action attributes.
1 Merath, M., Bode, C., and Macdonald, J. R., 2018. Supply disruptions and protection motivation: Why
some managers act proactively (and others don’t). Unpublished Working Paper, 1-38. An earlier version
was nominated for the “ISM Best Paper in Supply Chain Management Award” of the Operations and
Supply Chain Management Division of the Academy of Management at the Annual Meeting in Chicago,
IL, in 2018.
Supply disruptions and protection motivation: Why some managers act proactively (and others don’t) 9
2.1 Introduction
Supply chain disruptions are “unplanned and unanticipated events that disrupt the normal
flow of goods and materials within a supply chain […] and, as a consequence, expose
firms within the supply chain to operational and financial risks” (Craighead et al., 2007,
p. 132). Minor disruptions can often be resolved within day-to-day operations, but high
impact–low probability disruptions pose serious challenges for managers. Moreover,
disruptions tend to be “more critical when they occur upstream in the chain” (Pereira et
al., 2014, p. 627). For example, BMW suspended production in China for one week due
to supplier parts shortages (Moriyasu, 2017), BASF’s U.S. plant was temporarily shut
down following a disruption at an external supplier (Burger & Sheahan, 2018), and
Toyota suffered from the interruptions in the supply of raw materials after a major
earthquake in Japan (Tajitsu & Yamazaki, 2016). Hence, this study examines disruptions
in a focal firm’s upstream supply chain that cannot be resolved within daily operations
management (hereafter: Supply disruptions).
There are two ways to address and manage a firm’s exposure to such disruptions.
Managers can either decide to proactively tackle supply disruptions with measures aimed
at minimizing the probability of their occurrence or mitigating their damage (hereafter:
Supply risk management), or reactively cope with the adverse effects of a materialized
risk (hereafter: Supply disruption management) (Craighead et al., 2007). The overall goal
of both approaches is to determine a mix of activities for which the remaining amount of
risk is in line with the firm’s risk preference and corporate strategy (Hofmann et al.,
2014). The related choices considerably affect the degree to which firms can recover from
supply disruptions (e.g., Habermann, Blackhurst, & Metcalf, 2015; Yildiz, Yoon, Talluri,
& Ho, 2016), but behavioral aspects of supply risk management remain relatively unclear
(Bode & Macdonald, 2017). More specifically, although the negative consequences of
supply disruptions (Hendricks & Singhal, 2005a,b) and the benefits of supply risk
management are well-known (Mitroff & Alpaslan, 2003; Norrman & Jansson, 2004),
little is known about why some decision makers proactively act to mitigate the impact of
future supply disruptions while others do not.
Health-related research faces a similar problem. Analyzing the factors that shape
the decision to engage in a certain preventive health behavior, Rogers (1975, 1983)
developed protection motivation theory (PMT). PMT centers upon two cognitive
appraisal processes that account for the impact and costs of a potential proactive action
Supply disruptions and protection motivation: Why some managers act proactively (and others don’t) 10
(coping appraisal) as well as the components of a threat and the consequences of not
taking proactive action (threat appraisal). These appraisal processes ultimately affect a
person’s propensity of adopting a coping response. Although PMT was developed to
discern the effects of fear appeals (appeals using fear as the driving motivation) on health
attitudes and behavior, it has moved far beyond them and is considered applicable “to any
situation involving threat” (Rogers, 1983, p. 172).
This study applies PMT to understand why managers do or do not decide to take
proactive action in preparation for supply disruptions. More specifically, an extended
version of the PMT framework is proposed which also integrates and accounts for certain
individual characteristics that have been identified to influence proactive behavior. The
proposed model was subjected to empirical scrutiny by means of discrete choice
experiments, which emulated a decision making situation under uncertainty and the threat
of a future supply disruption. In order to explore which factors predict managers’ intent
to take proactive action, the participating managers were provided with systematically
manipulated choice scenarios and response options. The empirical results reveal the
relative importance of specific proactive action attributes, highlight a mismatch between
managers’ choice behavior and perceptions, and show relationships between individual-
specific characteristics and proactive action attributes. Thereby, this study contributes to
a better understanding of managers’ behavior when managing supply chain risks.
2.2 Protection motivation theory and propositions
There is consensus among scholars that proactive behavior involves “anticipatory action
that employees take to impact themselves and/or their environments” (Grant & Ashford,
2008, p. 8). Two characteristics that distinguish proactive from reactive behavior are
acting in advance and intended impact (Grant & Ashford, 2008). Proactivity means being
future-focused by planning and selecting specific measures to modify the environment
before certain events occur (Bandura, 2006). Moreover, proactive behavior is goal-driven
and intended to bring about environmental change (Bateman & Crant, 1993).
To better understand an individual’s proactive motivation, most attention has been
devoted to how humans assess the likely outcomes of their behavior (S. K. Parker,
Williams, & Turner, 2006) and the reasons for them to strive for a certain proactive goal
(Griffin, Neal, & Parker, 2007). In the supply risk context, the purpose of taking proactive
action is to protect the focal firm from future damage. Numerous studies, mostly in the
Supply disruptions and protection motivation: Why some managers act proactively (and others don’t) 11
field of health, have been conducted to understand how people decide to behave when
exposed to various threats (e.g., Grothmann & Reusswig, 2006; Sheeran, Harris, & Epton,
2013). In line with these research efforts, several cognitive behavioral theories attempt to
explain how proactive behavior is initiated, but they vary with regard to the assumed
mediating processes and their applicability to different contexts. All major cognitive
behavioral models originated in expectancy-value theories (Hovland, Janis, & Kelley,
1953). The premise of the family of expectancy-value theories is that an individual’s
intention to adopt a specific behavior depends on his or her expectations of its
consequences and its value. Expectancy-value theories were used to shed light on the
effects of fear appeals, which are “persuasive messages with the intent to motivate
individuals to comply with a recommended course of action through the arousal of fear
associated with a threat” (A. C. Johnston & Warkentin, 2010, pp. 550-551).
Three stimuli form a typical fear appeal. The first constitutes a value component
and the other two shape expectations: (1) The magnitude of an event’s harmfulness (value
component), (2) the probability that this event will occur given that no protective behavior
is adopted or existing behavior is modified (expectancy component), and (3) the
availability and effectiveness of a coping response that might prevent adverse
consequences of the event (expectancy component).
Based on expectancy-value theories, PMT was originally developed to study the
impact of fear appeals on health-related behavior and support their effective design
(Rogers, 1975). Its revised version (Rogers, 1983) has enabled the theory to evolve and
encompass not only health-related threats – where it has been successfully applied (Floyd,
Prentice‐Dunn, & Rogers, 2000) – but also nuclear actions (Axelrod & Newton, 1991),
and, more recently, technological or environmental hazards (Boss, Galletta, Lowry,
Moody, & Polak, 2015; Y. Chen & Zahedi, 2016). PMT has become “sufficiently broad
to apply to any situation involving threat” (Rogers, 1983, p. 172) and is considered “an
established, robust theoretical foundation for the analysis and exploration of
recommended actions or behaviors to avert the consequences of threats” (A. C. Johnston
& Warkentin, 2010, p. 552). In line with this, we suggest that PMT offers an adequate
and insightful framework to improve our understanding of how the threat of an impending
supply disruption translates into proactive action. More specifically, it allows us to
investigate the drivers of, and impediments to, an individual’s motivation to take
proactive action. PMT has received widespread empirical support (A. C. Johnston &
Supply disruptions and protection motivation: Why some managers act proactively (and others don’t) 12
Warkentin, 2010) and provides an effective theory for human behavior which overcomes
many conceptual problems leading to low correlations between attitudes and behavior
(McGuire, 1985).
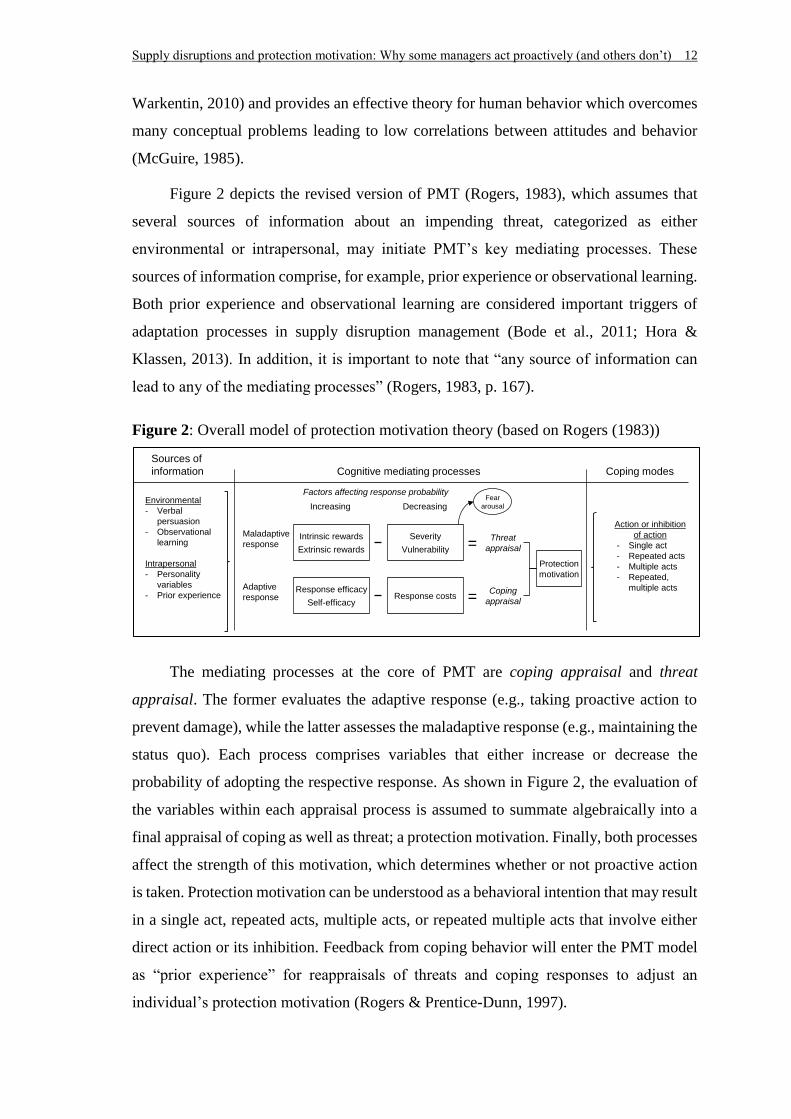
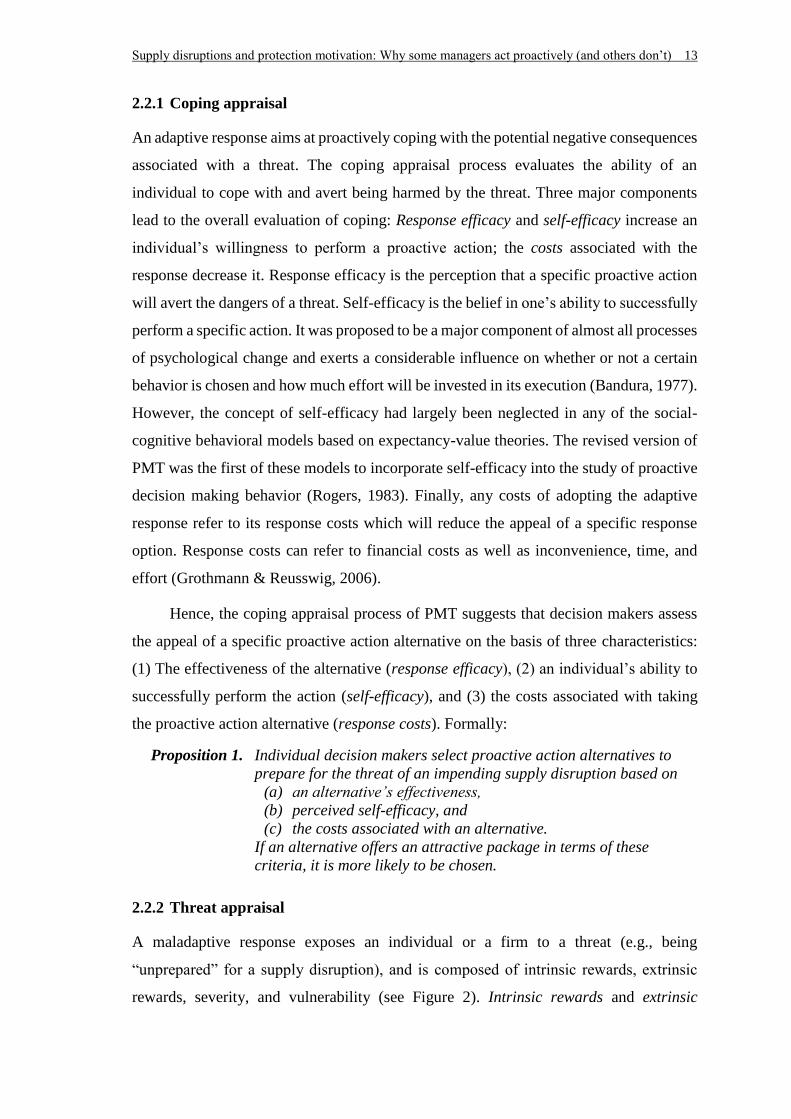
Figure 2 depicts the revised version of PMT (Rogers, 1983), which assumes that
several sources of information about an impending threat, categorized as either
environmental or intrapersonal, may initiate PMT’s key mediating processes. These
sources of information comprise, for example, prior experience or observational learning.
Both prior experience and observational learning are considered important triggers of
adaptation processes in supply disruption management (Bode et al., 2011; Hora &
Klassen, 2013). In addition, it is important to note that “any source of information can
lead to any of the mediating processes” (Rogers, 1983, p. 167).
Figure 2: Overall model of protection motivation theory (based on Rogers (1983))
The mediating processes at the core of PMT are coping appraisal and threat
appraisal. The former evaluates the adaptive response (e.g., taking proactive action to
prevent damage), while the latter assesses the maladaptive response (e.g., maintaining the
status quo). Each process comprises variables that either increase or decrease the
probability of adopting the respective response. As shown in Figure 2, the evaluation of
the variables within each appraisal process is assumed to summate algebraically into a
final appraisal of coping as well as threat; a protection motivation. Finally, both processes
affect the strength of this motivation, which determines whether or not proactive action
is taken. Protection motivation can be understood as a behavioral intention that may result
in a single act, repeated acts, multiple acts, or repeated multiple acts that involve either
direct action or its inhibition. Feedback from coping behavior will enter the PMT model
as “prior experience” for reappraisals of threats and coping responses to adjust an
individual’s protection motivation (Rogers & Prentice-Dunn, 1997).
Sources of
information Cognitive mediating processes Coping modes
Environmental
- Verbal
persuasion
- Observational
learning
Intrapersonal
- Personality
variables
- Prior experience
Action or inhibition
of action
- Single act
- Repeated acts
- Multiple acts
- Repeated,
multiple acts
Factors affecting response probability
Maladaptive
response
Adaptive
response
Increasing Decreasing
Intrinsic rewards
Extrinsic rewards
Severity
Vulnerability
Response efficacy
Self-efficacyResponse costs
=
=
Protection
motivation
Fear
arousal
Threat
appraisal
Coping
appraisal
Supply disruptions and protection motivation: Why some managers act proactively (and others don’t) 13
2.2.1 Coping appraisal
An adaptive response aims at proactively coping with the potential negative consequences
associated with a threat. The coping appraisal process evaluates the ability of an
individual to cope with and avert being harmed by the threat. Three major components
lead to the overall evaluation of coping: Response efficacy and self-efficacy increase an
individual’s willingness to perform a proactive action; the costs associated with the
response decrease it. Response efficacy is the perception that a specific proactive action
will avert the dangers of a threat. Self-efficacy is the belief in one’s ability to successfully
perform a specific action. It was proposed to be a major component of almost all processes
of psychological change and exerts a considerable influence on whether or not a certain
behavior is chosen and how much effort will be invested in its execution (Bandura, 1977).
However, the concept of self-efficacy had largely been neglected in any of the social-
cognitive behavioral models based on expectancy-value theories. The revised version of
PMT was the first of these models to incorporate self-efficacy into the study of proactive
decision making behavior (Rogers, 1983). Finally, any costs of adopting the adaptive
response refer to its response costs which will reduce the appeal of a specific response
option. Response costs can refer to financial costs as well as inconvenience, time, and
effort (Grothmann & Reusswig, 2006).
Hence, the coping appraisal process of PMT suggests that decision makers assess
the appeal of a specific proactive action alternative on the basis of three characteristics:
(1) The effectiveness of the alternative (response efficacy), (2) an individual’s ability to
successfully perform the action (self-efficacy), and (3) the costs associated with taking
the proactive action alternative (response costs). Formally:
Proposition 1. Individual decision makers select proactive action alternatives to
prepare for the threat of an impending supply disruption based on
(a) an alternative’s effectiveness,
(b) perceived self-efficacy, and
(c) the costs associated with an alternative.
If an alternative offers an attractive package in terms of these
criteria, it is more likely to be chosen.
2.2.2 Threat appraisal
A maladaptive response exposes an individual or a firm to a threat (e.g., being
“unprepared” for a supply disruption), and is composed of intrinsic rewards, extrinsic
rewards, severity, and vulnerability (see Figure 2). Intrinsic rewards and extrinsic
Supply disruptions and protection motivation: Why some managers act proactively (and others don’t) 14
rewards increase the probability of choosing a maladaptive response. In contrast, the
severity of a threat and the expectancy of being exposed to the threat (vulnerability)
reduce the attractiveness of a maladaptive response. Severity is the potential amount of
physical or economic damage associated with a threat (Rogers & Prentice-Dunn, 1997).
At the same time, although fear was initially seen as an essential mediating variable of
the effect of fear appeals on behavior, it is not considered to have a direct influence on
protection motivation. It merely has an indirect impact through the evaluation of a threat’s
severity; therefore, fear is treated as “an insignificant byproduct of threat appraisal”
(Tanner, Hunt, & Eppright, 1991, p. 37) to underline the “importance of cognitive
processes rather than visceral ones” (Rogers, 1983, p. 169). PMT posits that the
motivation of an individual to take a maladaptive response will decrease if the threat is
severe, the vulnerability to the threat is high, one is able to successfully perform a
proactive action, and this response can effectively avert the threat’s potential negative
consequences. A maladaptive response’s likelihood will increase if the response is
accompanied by rewards and performing the proactive action is costly.
Prior research using the PMT framework revealed serious difficulties in
operationalizing the rewards of a maladaptive response as distinct from the costs of a
proactive action. For this reason, the vast majority of PMT research has neglected the
rewards component and response costs have to date not been extensively researched.
Although these components are delineated as conceptually different (Rogers, 1983), the
distinction between them might not be clear to managers who could perceive them as
equal (maladaptive response rewards could be perceived as avoiding the costs of a
proactive action). In line with prior research, to avoid duplicating the same factor, we
focus on response costs (Grothmann & Reusswig, 2006; A. C. Johnston & Warkentin,
2010; Tanner et al., 1991).
The vulnerability to a specific threat may affect the relative importance of response
costs. In other words, the vulnerability of a firm to a specific supply disruption might
moderate the influence of a proactive measure’s costs on the decision whether to take
action. If a proactive measure is very costly, a high vulnerability to an impending
disruption may also increase intentions to act proactively due to the higher expected loss
associated with the materialized risk (Knemeyer, Zinn, & Eroglu, 2009; Norrman &
Jansson, 2004). Thus, we propose the following:
Supply disruptions and protection motivation: Why some managers act proactively (and others don’t) 15
Proposition 2. The relative importance of response costs for the probability of
choosing a specific proactive action to cope with a supply disruption
is reduced by the vulnerability of a firm to a supply disruption.
Although PMT presents the two appraisal processes in an unordered fashion, later
studies suggest that threat appraisal precedes coping appraisal (Scherer, 1984, 1988;
Tanner et al., 1991). We follow the notion of an ordered sequence between the two
mediating processes in our experimental design, which will be explained in the
methodology section.
2.2.3 Individual characteristics
Finally, certain characteristics of individual decision makers and of the situation arguably
influence proactive behavior in organizations (S. K. Parker et al., 2006). Based on the
results of a cross-cultural longitudinal study that revealed several key antecedents of
proactive behavior, Frese and Fay (2001) theorized that those antecedents associated with
individual decision makers can be categorized as (1) personality, (2) orientations, and (3)
knowledge, skills, and abilities.
First, personality refers to individual differences that represent proclivity for action
and cross-situational tendencies that activate decision makers. It has been argued that
proactive personality is the most relevant individual predictor of proactive behavior. It
is defined as a disposition toward taking action to bring about change and influence the
environment (Bateman & Crant, 1993; S. K. Parker et al., 2006). In addition, since this
study investigates a decision involving risk, we argue that an individual’s risk attitude
specifies how important a certain risk is to an individual and has a strong influence on
his or her proactive decision making behavior (Heckmann, Comes, & Nickel, 2015).
Different perceptions of the importance of a certain risk may considerably influence
decision making processes and resulting outcomes. Generally, three manifestations of a
decision maker’s risk attitude are distinguished: Risk-averse, risk-neutral, and risk-
seeking (Weber & Milliman, 1997). Prior research has shown that, depending on their
risk attitude, different decision makers may perceive the same risk situation quite
differently which has repercussions on choice behavior (March & Shapira, 1987).
Second, in contrast to the cross-situational and rather general personality factors,
orientations are “behavior tendencies of moderate situational specificity” (Fay & Frese,
2001, p. 106). Orientations motivate proactive behavior by making a person believe that
Supply disruptions and protection motivation: Why some managers act proactively (and others don’t) 16
such behavior is possible and can produce the desired results. Frese and Fay (2001)
proposed that an important orientation for promoting proactivity is a person’s control
appraisal: An individual’s expectation of his or her impact on work outcomes. Decision
makers who assume that their own decisions have a strong effect on their work outcomes
are more likely to engage in proactive action while low levels of control appraisal inhibit
proactive action (Aspinwall & Taylor, 1997).
Finally, knowledge, skills, and abilities capture an individual’s capacity to identify
work-related challenges, analyze them, and develop appropriate solutions (Hunter,
1986). Hence, a person’s understanding of a task determines the ability to act proactively.
As an indicator of an individual’s knowledge, skills, and abilities, experience
considerably affects intention to act proactively. Work experience has been identified as
a main driver of knowledge, and hence, of the development of skills and techniques that
improve job performance (F. L. Schmidt, Hunter, & Outerbridge, 1986). Following prior
research, more experienced decision makers might be more likely to act proactively,
because they possess the requisite knowledge and skills to successfully engage in
proactive behavior (Grant & Ashford, 2008; Grant, Parker, & Collins, 2009).
Based on the framework developed by Frese and Fay (2001), it is proposed that
these four characteristics affect proactive behavior by influencing the relative importance
of PMT’s coping appraisal components:
Proposition 3. The relative importance of PMT’s coping appraisal components for
the probability of choosing a specific proactive action is influenced
by characteristics of individual decision makers, namely their
(a) proactive personality,
(b) risk attitude,
(c) control appraisal, and
(d) experience.
2.3 Methodology
To evaluate the developed propositions and analyze the factors influencing decisions to
engage in proactive preparation for supply disruptions, a discrete choice experiment
(DCE) was developed. DCEs are considered an effective way to analyze complex
decision making tasks and choice behavior (Louviere, Hensher, & Swait, 2000; Moore,
Gray-Lee, & Louviere, 1998). Although they have successfully been applied to analyze
choice behavior in fields such as marketing, economics, or health research, they have only
rarely been used in operations management (e.g., E. J. Anderson, Coltman, Devinney, &
Supply disruptions and protection motivation: Why some managers act proactively (and others don’t) 17
Keating, 2011; Coltman & Devinney, 2013; Pullman, Verma, & Goodale, 2001; Verma,
Louviere, & Burke, 2006). DCEs expose participants to multiple choice situations with
at least two possible response alternatives. Each specific choice situation (comprised of
several choice alternatives) is referred to as choice set. The response alternatives in a
choice set consist of a set of attributes. If no alternative option outperforms the others on
all attributes, decision makers must perform trade-offs between these observed
characteristics of response alternatives. This is described in further detail in the
experimental design section. Regardless of whether these trade-offs are determined
consciously or subconsciously, stated choice preferences reveal the underlying weight or
importance assigned to specific attributes (E. J. Anderson et al., 2011).
2.3.1 Experimental design
The developed experimental design exposed all participants to nine choice sets
comprising three possible response options. The order of choice sets presented was
randomized for each participant to control for order effects (Potoglou & Kanaroglou,
2007). For each choice set, two of the presented alternatives were generic proactive
response actions: “Proactive action A” and “proactive action B”. These alternatives varied
along one or more attributes of interest. Since decisions involving supply risk in practice
also allow individuals to refrain from taking proactive action, a third “no choice”
alternative labelled “neither” was included.2 Whether to include an opt-out alternative is
an important methodological issue and is becoming the norm in choice experiments (J.
R. Parker & Schrift, 2011). Failure to include a “no choice” option may distort the results
by overestimating participation by forcing some participants to choose (Boyle, Holmes,
Teisl, & Roe, 2001). In addition, offering an opt-out option improves the realism of
experiments (Louviere et al., 2000).
A D-optimal3 design allows for an analysis of the attributes’ main effects and the
proposed interactions. To ensure participants’ understanding of the discrete choice
format, an additional tenth choice set was included as a consistency check (Green &
2 We also included the following description to add a more nuanced and realistic notion of what choosing
the “no choice” option actually meant: “Neither, because none of the other response alternatives seem
appropriate.” 3 D-optimality (or D-efficiency) is a widely used and well-established metric in the design of choice
experiments. In order to construct statistically efficient designs, D-optimal designs maximize the Fisher
information matrix (the determinant of the variance-covariance matrix of the model to be estimated)
(Hensher, Rose, & Greene, 2005).
Supply disruptions and protection motivation: Why some managers act proactively (and others don’t) 18
Gerard, 2009). In this tenth set, one of the two proactive actions was clearly constructed
as the dominant alternative (i.e., all attribute levels were more desirable). Thus, to “pass”
the consistency check, respondents had to choose either the dominant or the “no choice”
alternative. At the end of the experiment, participants responded to a brief survey to
collect individual-specific data.
Scenario Design.4 To ensure that the participants were provided with the same
contextual information, they were given a carefully designed introductory paragraph to
read before they were shown the choice sets. This common module delineated the
underlying choice scenario from the perspective of a third person to limit demand
characteristics and effects of social desirability (Fisher, 1993; Thomas, Thomas, Manrodt,
& Rutner, 2013). In this scenario, a procurement manager observes that an earthquake in
Asia has caused a serious supply disruption to a competitor. This manager also sources
parts from Asia so his or her firm is vulnerable to a similar supply disruption. Hence, the
manager needs to decide whether or not to mitigate future potential losses by taking
proactive action. By framing the choice situation in a vicarious learning context, we
account for the relevance of observing other firms as an important source of information
in supply risk and disruption management and increase the experiment’s realism (Hora &
Klassen, 2013). Moreover, supply disruptions due to natural disasters frequently inflict
substantial damage on firms involved (e.g., Helft & Bunkley, 2011; Tajitsu & Yamazaki,
2016; J. Webb, 2016b).
The description of the underlying choice situation discusses the threat appraisal
variables of PMT. First, the potential damage of disruption caused by an earthquake was
described as severe (severity). This is important, because of the focus on high-impact
supply disruptions that cannot be resolved in daily operations management. Second, we
systematically manipulated the probability that the disruption will harm the decision
maker’s firm (vulnerability). We distinguished low from high vulnerability by varying
the earthquake-proneness of the Asian supplier’s location in the description. Participants
were randomly assigned to one of these two treatment conditions to assess whether or not
vulnerability moderates the effect of response costs on choice behavior. In this way we
4 Although DCEs and vignette-based experiments pursue different aims (DCEs: Interested in trade-offs
between attributes; Vignette-based experiments: Investigate the impact of certain variables on observed
intentions or actual behavior), both approaches share similarities with regard to how information about
an a priori defined role and/or situation is presented to respondents. Hence, scenario design and validation
was partly based on recommendations for vignette-experiments (e.g., Aguinis & Bradley, 2014;
Rungtusanatham, Wallin, & Eckerd, 2011).
Supply disruptions and protection motivation: Why some managers act proactively (and others don’t) 19
eliminate systematic differences in the respondents to be able to attribute differences in
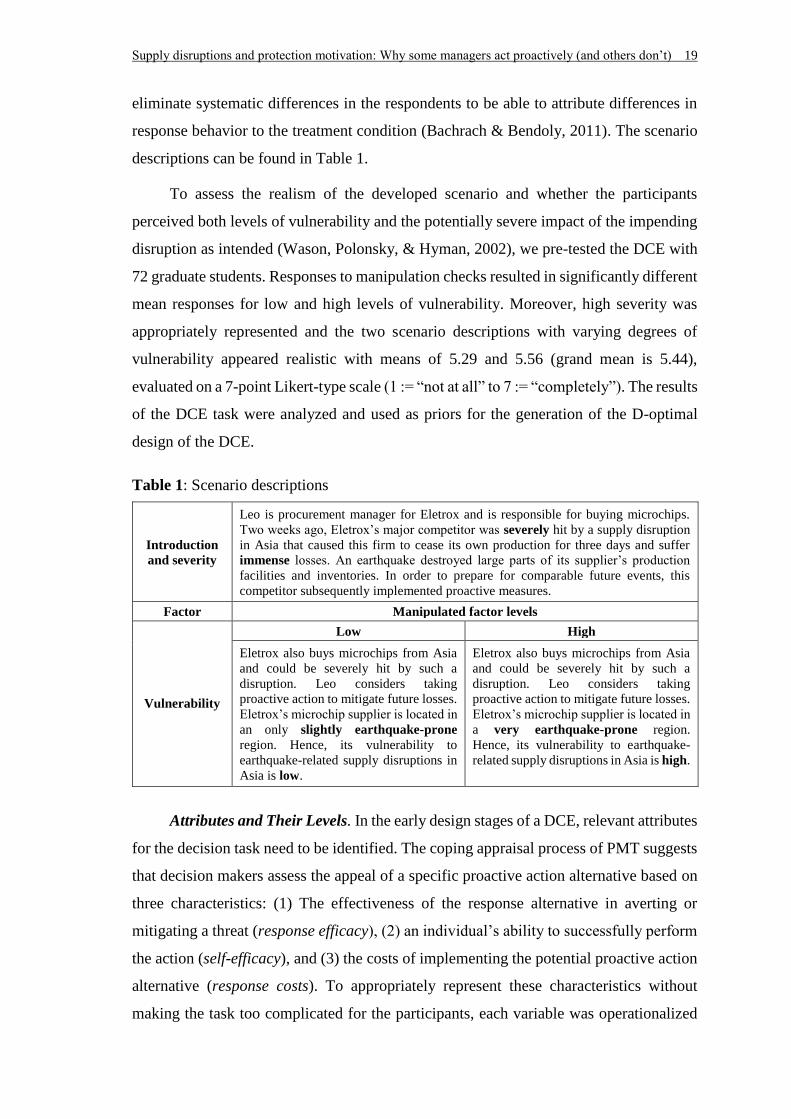
response behavior to the treatment condition (Bachrach & Bendoly, 2011). The scenario
descriptions can be found in Table 1.
To assess the realism of the developed scenario and whether the participants
perceived both levels of vulnerability and the potentially severe impact of the impending
disruption as intended (Wason, Polonsky, & Hyman, 2002), we pre-tested the DCE with
72 graduate students. Responses to manipulation checks resulted in significantly different
mean responses for low and high levels of vulnerability. Moreover, high severity was
appropriately represented and the two scenario descriptions with varying degrees of
vulnerability appeared realistic with means of 5.29 and 5.56 (grand mean is 5.44),
evaluated on a 7-point Likert-type scale (1 := “not at all” to 7 := “completely”). The results
of the DCE task were analyzed and used as priors for the generation of the D-optimal
design of the DCE.
Table 1: Scenario descriptions
Introduction
and severity
Leo is procurement manager for Eletrox and is responsible for buying microchips.
Two weeks ago, Eletrox’s major competitor was severely hit by a supply disruption
in Asia that caused this firm to cease its own production for three days and suffer
immense losses. An earthquake destroyed large parts of its supplier’s production
facilities and inventories. In order to prepare for comparable future events, this
competitor subsequently implemented proactive measures.
Factor Manipulated factor levels
Vulnerability
Low High
Eletrox also buys microchips from Asia
and could be severely hit by such a
disruption. Leo considers taking
proactive action to mitigate future losses.
Eletrox’s microchip supplier is located in
an only slightly earthquake-prone
region. Hence, its vulnerability to
earthquake-related supply disruptions in
Asia is low.
Eletrox also buys microchips from Asia
and could be severely hit by such a
disruption. Leo considers taking
proactive action to mitigate future losses.
Eletrox’s microchip supplier is located in
a very earthquake-prone region.
Hence, its vulnerability to earthquake-
related supply disruptions in Asia is high.
Attributes and Their Levels. In the early design stages of a DCE, relevant attributes
for the decision task need to be identified. The coping appraisal process of PMT suggests
that decision makers assess the appeal of a specific proactive action alternative based on
three characteristics: (1) The effectiveness of the response alternative in averting or
mitigating a threat (response efficacy), (2) an individual’s ability to successfully perform
the action (self-efficacy), and (3) the costs of implementing the potential proactive action
alternative (response costs). To appropriately represent these characteristics without
making the task too complicated for the participants, each variable was operationalized
Supply disruptions and protection motivation: Why some managers act proactively (and others don’t) 20
as binary with a low and a high level, by means of appropriate descriptions. Since prior
research indicates that proactive measures are not only accompanied by direct financial
costs but also have the potential to harm the relationship with a supplier (e.g., Heide,
Wathne, & Rokkan, 2007; Zsidisin & Ritchie, 2008), we distinguished two types of
response costs: Direct implementation costs and negative side effects on the respective
buyer-supplier relationship (relationship costs). For instance, if a supplier formerly used
as a single source for a specific part loses a considerable fraction of the demand to a
second source because the buying firm seeks to reduce its risk associated with single
sourcing, the original supplier might be less willing to develop new innovations for this
customer “because of a smaller possibility to amortise the expenses” (Zsidisin & Ritchie,
2008, p. 131). Accordingly, we describe relationship costs as decreased investments of
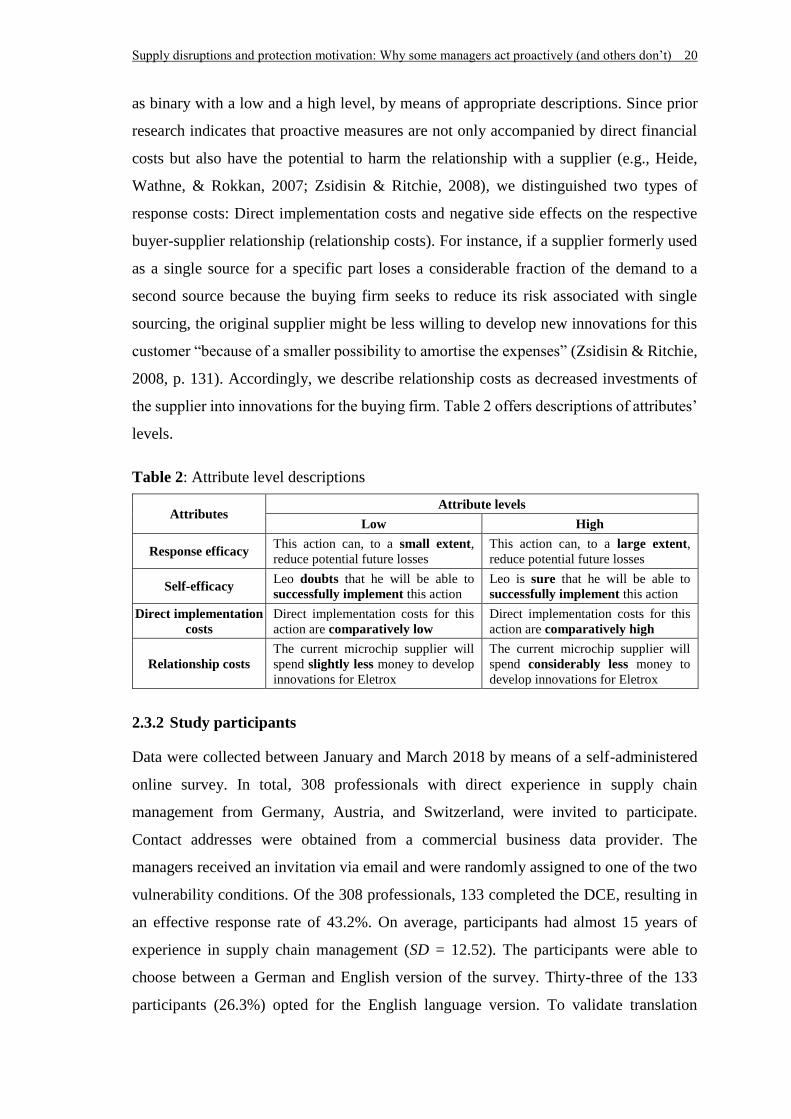
the supplier into innovations for the buying firm. Table 2 offers descriptions of attributes’
levels.
Table 2: Attribute level descriptions
Attributes Attribute levels
Low High
Response efficacy This action can, to a small extent,
reduce potential future losses
This action can, to a large extent,
reduce potential future losses
Self-efficacy Leo doubts that he will be able to
successfully implement this action
Leo is sure that he will be able to
successfully implement this action
Direct implementation
costs
Direct implementation costs for this
action are comparatively low
Direct implementation costs for this
action are comparatively high
Relationship costs
The current microchip supplier will
spend slightly less money to develop
innovations for Eletrox
The current microchip supplier will
spend considerably less money to
develop innovations for Eletrox
2.3.2 Study participants
Data were collected between January and March 2018 by means of a self-administered
online survey. In total, 308 professionals with direct experience in supply chain
management from Germany, Austria, and Switzerland, were invited to participate.
Contact addresses were obtained from a commercial business data provider. The
managers received an invitation via email and were randomly assigned to one of the two
vulnerability conditions. Of the 308 professionals, 133 completed the DCE, resulting in
an effective response rate of 43.2%. On average, participants had almost 15 years of
experience in supply chain management (SD = 12.52). The participants were able to
choose between a German and English version of the survey. Thirty-three of the 133
participants (26.3%) opted for the English language version. To validate translation
Supply disruptions and protection motivation: Why some managers act proactively (and others don’t) 21
equivalence, the complete experimental material was carefully translated into German by
native speakers and then back-translated into English to ensure equivalent meaning (Craig
& Douglas, 2005). Each participant responded to nine choice sets (and an additional tenth
choice set as a consistency check). The responses of one participant were excluded due
to unrealistically short participation duration. Further data were excluded because nine
participants consistently chose the same alternative, resulting in a full sample of 1107
observations. Hence, the data set comprises 123 participants (58 of these completed the
low-vulnerability condition).
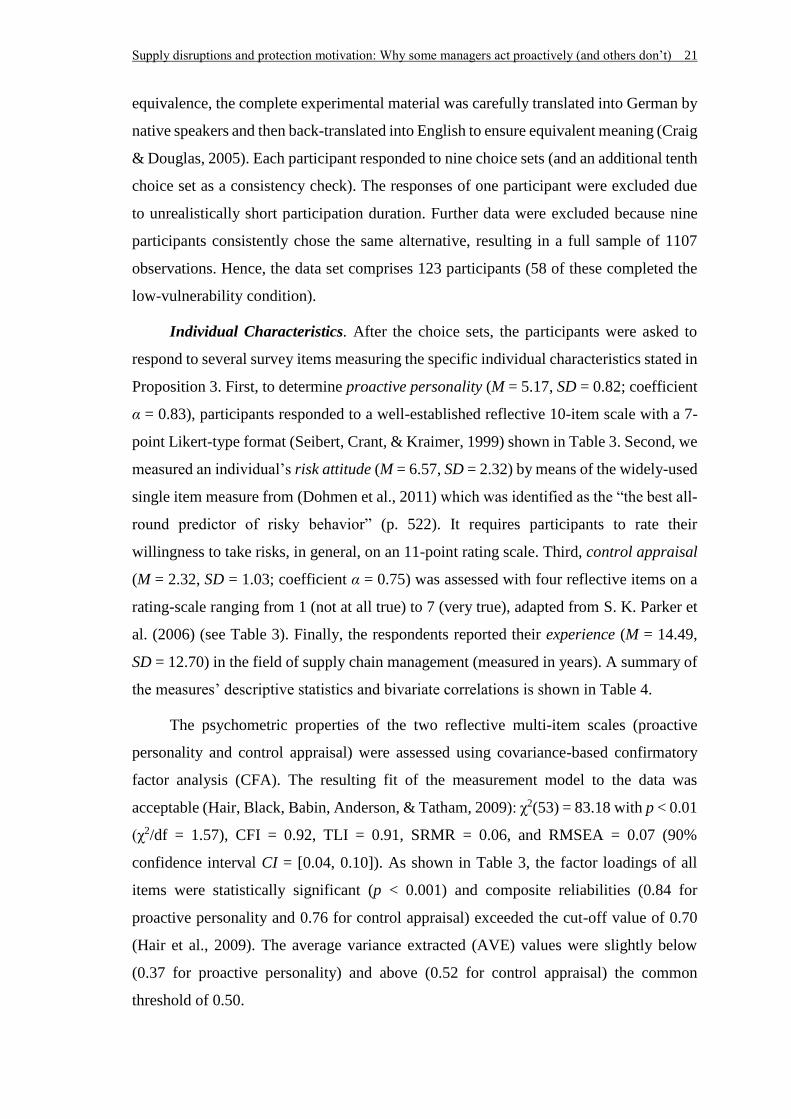
Individual Characteristics. After the choice sets, the participants were asked to
respond to several survey items measuring the specific individual characteristics stated in
Proposition 3. First, to determine proactive personality (M = 5.17, SD = 0.82; coefficient
α = 0.83), participants responded to a well-established reflective 10-item scale with a 7-
point Likert-type format (Seibert, Crant, & Kraimer, 1999) shown in Table 3. Second, we
measured an individual’s risk attitude (M = 6.57, SD = 2.32) by means of the widely-used
single item measure from (Dohmen et al., 2011) which was identified as the “the best all-
round predictor of risky behavior” (p. 522). It requires participants to rate their
willingness to take risks, in general, on an 11-point rating scale. Third, control appraisal
(M = 2.32, SD = 1.03; coefficient α = 0.75) was assessed with four reflective items on a
rating-scale ranging from 1 (not at all true) to 7 (very true), adapted from S. K. Parker et
al. (2006) (see Table 3). Finally, the respondents reported their experience (M = 14.49,
SD = 12.70) in the field of supply chain management (measured in years). A summary of
the measures’ descriptive statistics and bivariate correlations is shown in Table 4.
The psychometric properties of the two reflective multi-item scales (proactive
personality and control appraisal) were assessed using covariance-based confirmatory
factor analysis (CFA). The resulting fit of the measurement model to the data was
acceptable (Hair, Black, Babin, Anderson, & Tatham, 2009): χ2(53) = 83.18 with p < 0.01
(χ2/df = 1.57), CFI = 0.92, TLI = 0.91, SRMR = 0.06, and RMSEA = 0.07 (90%
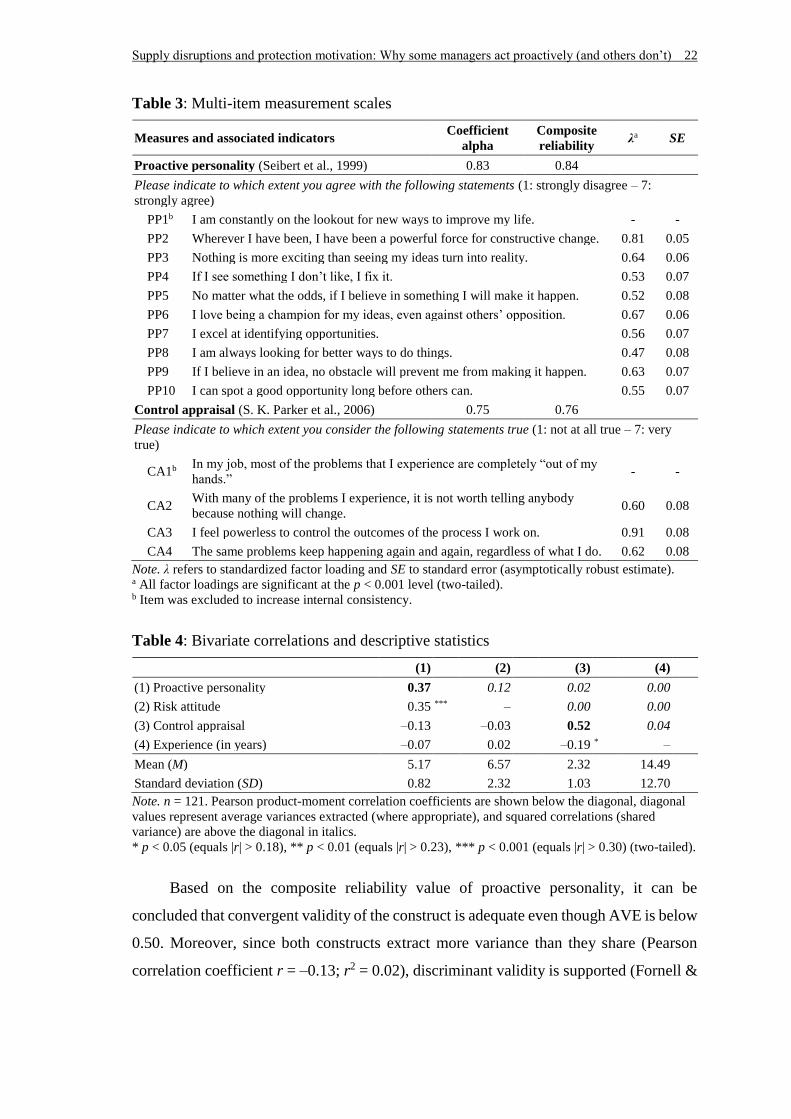
confidence interval CI = [0.04, 0.10]). As shown in Table 3, the factor loadings of all
items were statistically significant (p < 0.001) and composite reliabilities (0.84 for
proactive personality and 0.76 for control appraisal) exceeded the cut-off value of 0.70
(Hair et al., 2009). The average variance extracted (AVE) values were slightly below
(0.37 for proactive personality) and above (0.52 for control appraisal) the common
threshold of 0.50.
Supply disruptions and protection motivation: Why some managers act proactively (and others don’t) 22
Table 3: Multi-item measurement scales
Measures and associated indicators Coefficient
alpha
Composite
reliability λa SE
Proactive personality (Seibert et al., 1999) 0.83 0.84
Please indicate to which extent you agree with the following statements (1: strongly disagree – 7:
strongly agree)
PP1b I am constantly on the lookout for new ways to improve my life. - -
PP2 Wherever I have been, I have been a powerful force for constructive change. 0.81 0.05
PP3 Nothing is more exciting than seeing my ideas turn into reality. 0.64 0.06
PP4 If I see something I don’t like, I fix it. 0.53 0.07
PP5 No matter what the odds, if I believe in something I will make it happen. 0.52 0.08
PP6 I love being a champion for my ideas, even against others’ opposition. 0.67 0.06
PP7 I excel at identifying opportunities. 0.56 0.07
PP8 I am always looking for better ways to do things. 0.47 0.08
PP9 If I believe in an idea, no obstacle will prevent me from making it happen. 0.63 0.07
PP10 I can spot a good opportunity long before others can. 0.55 0.07
Control appraisal (S. K. Parker et al., 2006) 0.75 0.76
Please indicate to which extent you consider the following statements true (1: not at all true – 7: very
true)
CA1b In my job, most of the problems that I experience are completely “out of my
hands.” - -
CA2 With many of the problems I experience, it is not worth telling anybody
because nothing will change. 0.60 0.08
CA3 I feel powerless to control the outcomes of the process I work on. 0.91 0.08
CA4 The same problems keep happening again and again, regardless of what I do. 0.62 0.08
Note. λ refers to standardized factor loading and SE to standard error (asymptotically robust estimate). a All factor loadings are significant at the p < 0.001 level (two-tailed). b Item was excluded to increase internal consistency.
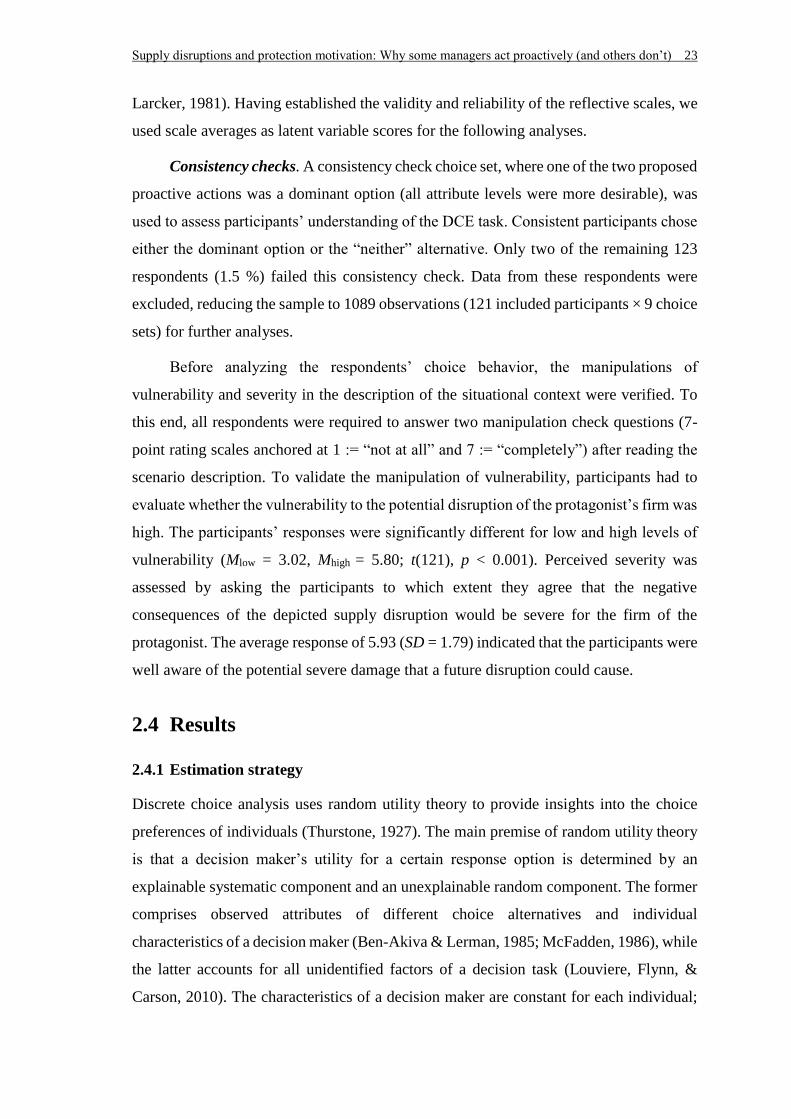
Table 4: Bivariate correlations and descriptive statistics
(1) (2) (3) (4)
(1) Proactive personality 0.37 0.12 0.02 0.00
(2) Risk attitude 0.35 *** – 0.00 0.00
(3) Control appraisal –0.13 –0.03 0.52 0.04
(4) Experience (in years) –0.07 0.02 –0.19 * –
Mean (M) 5.17 6.57 2.32 14.49
Standard deviation (SD) 0.82 2.32 1.03 12.70
Note. n = 121. Pearson product-moment correlation coefficients are shown below the diagonal, diagonal
values represent average variances extracted (where appropriate), and squared correlations (shared
variance) are above the diagonal in italics.
* p < 0.05 (equals |r| > 0.18), ** p < 0.01 (equals |r| > 0.23), *** p < 0.001 (equals |r| > 0.30) (two-tailed).
Based on the composite reliability value of proactive personality, it can be
concluded that convergent validity of the construct is adequate even though AVE is below
0.50. Moreover, since both constructs extract more variance than they share (Pearson
correlation coefficient r = –0.13; r2 = 0.02), discriminant validity is supported (Fornell &
Supply disruptions and protection motivation: Why some managers act proactively (and others don’t) 23
Larcker, 1981). Having established the validity and reliability of the reflective scales, we
used scale averages as latent variable scores for the following analyses.
Consistency checks. A consistency check choice set, where one of the two proposed
proactive actions was a dominant option (all attribute levels were more desirable), was
used to assess participants’ understanding of the DCE task. Consistent participants chose
either the dominant option or the “neither” alternative. Only two of the remaining 123
respondents (1.5 %) failed this consistency check. Data from these respondents were
excluded, reducing the sample to 1089 observations (121 included participants × 9 choice
sets) for further analyses.
Before analyzing the respondents’ choice behavior, the manipulations of
vulnerability and severity in the description of the situational context were verified. To
this end, all respondents were required to answer two manipulation check questions (7-
point rating scales anchored at 1 := “not at all” and 7 := “completely”) after reading the
scenario description. To validate the manipulation of vulnerability, participants had to
evaluate whether the vulnerability to the potential disruption of the protagonist’s firm was
high. The participants’ responses were significantly different for low and high levels of
vulnerability (Mlow = 3.02, Mhigh = 5.80; t(121), p < 0.001). Perceived severity was
assessed by asking the participants to which extent they agree that the negative
consequences of the depicted supply disruption would be severe for the firm of the
protagonist. The average response of 5.93 (SD = 1.79) indicated that the participants were
well aware of the potential severe damage that a future disruption could cause.
2.4 Results
2.4.1 Estimation strategy
Discrete choice analysis uses random utility theory to provide insights into the choice
preferences of individuals (Thurstone, 1927). The main premise of random utility theory
is that a decision maker’s utility for a certain response option is determined by an
explainable systematic component and an unexplainable random component. The former
comprises observed attributes of different choice alternatives and individual
characteristics of a decision maker (Ben-Akiva & Lerman, 1985; McFadden, 1986), while
the latter accounts for all unidentified factors of a decision task (Louviere, Flynn, &
Carson, 2010). The characteristics of a decision maker are constant for each individual;
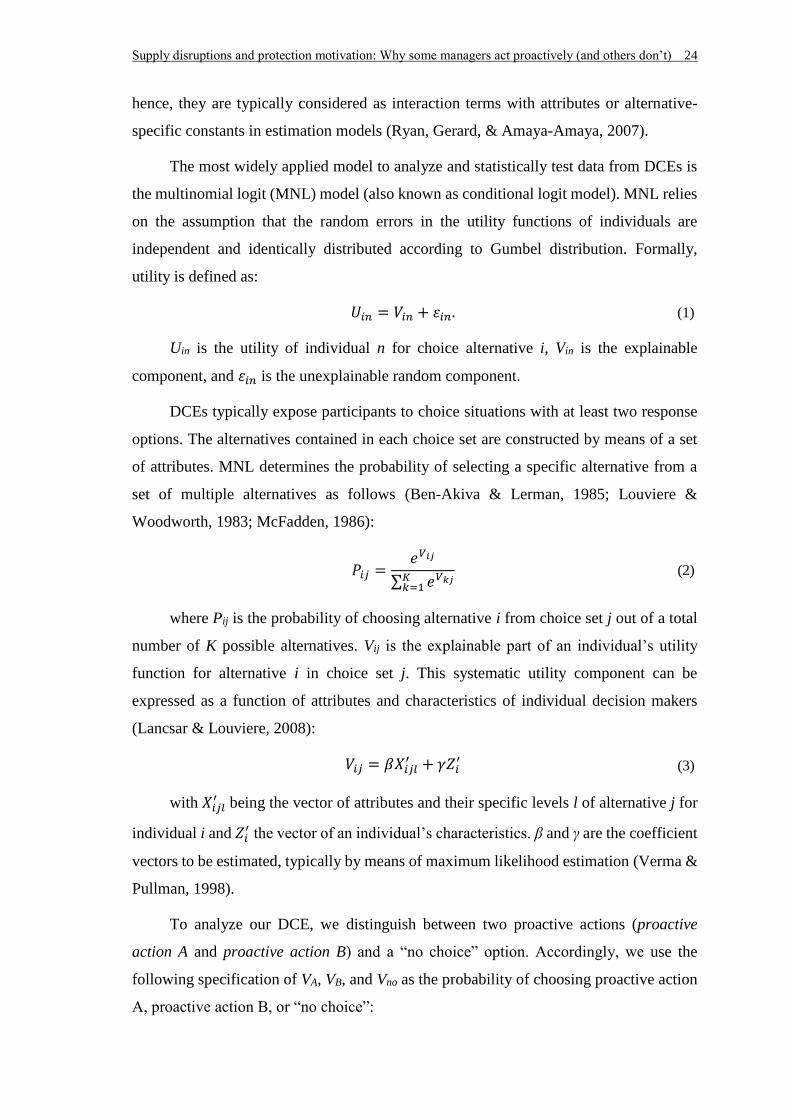
Supply disruptions and protection motivation: Why some managers act proactively (and others don’t) 24
hence, they are typically considered as interaction terms with attributes or alternative-
specific constants in estimation models (Ryan, Gerard, & Amaya-Amaya, 2007).
The most widely applied model to analyze and statistically test data from DCEs is
the multinomial logit (MNL) model (also known as conditional logit model). MNL relies
on the assumption that the random errors in the utility functions of individuals are
independent and identically distributed according to Gumbel distribution. Formally,
utility is defined as:
𝑈𝑖𝑛 = 𝑉𝑖𝑛 + 𝜀𝑖𝑛. (1)
Uin is the utility of individual n for choice alternative i, Vin is the explainable
component, and 𝜀𝑖𝑛 is the unexplainable random component.
DCEs typically expose participants to choice situations with at least two response
options. The alternatives contained in each choice set are constructed by means of a set
of attributes. MNL determines the probability of selecting a specific alternative from a
set of multiple alternatives as follows (Ben-Akiva & Lerman, 1985; Louviere &
Woodworth, 1983; McFadden, 1986):
𝑃𝑖𝑗 =𝑒𝑉𝑖𝑗
∑ 𝑒𝑉𝑘𝑗𝐾𝑘=1
(2)
where Pij is the probability of choosing alternative i from choice set j out of a total
number of K possible alternatives. Vij is the explainable part of an individual’s utility
function for alternative i in choice set j. This systematic utility component can be
expressed as a function of attributes and characteristics of individual decision makers
(Lancsar & Louviere, 2008):
𝑉𝑖𝑗 = 𝛽𝑋𝑖𝑗𝑙′ + 𝛾𝑍𝑖
′ (3)
with 𝑋𝑖𝑗𝑙′ being the vector of attributes and their specific levels l of alternative j for
individual i and 𝑍𝑖′ the vector of an individual’s characteristics. β and γ are the coefficient
vectors to be estimated, typically by means of maximum likelihood estimation (Verma &
Pullman, 1998).
To analyze our DCE, we distinguish between two proactive actions (proactive
action A and proactive action B) and a “no choice” option. Accordingly, we use the
following specification of VA, VB, and Vno as the probability of choosing proactive action
A, proactive action B, or “no choice”:
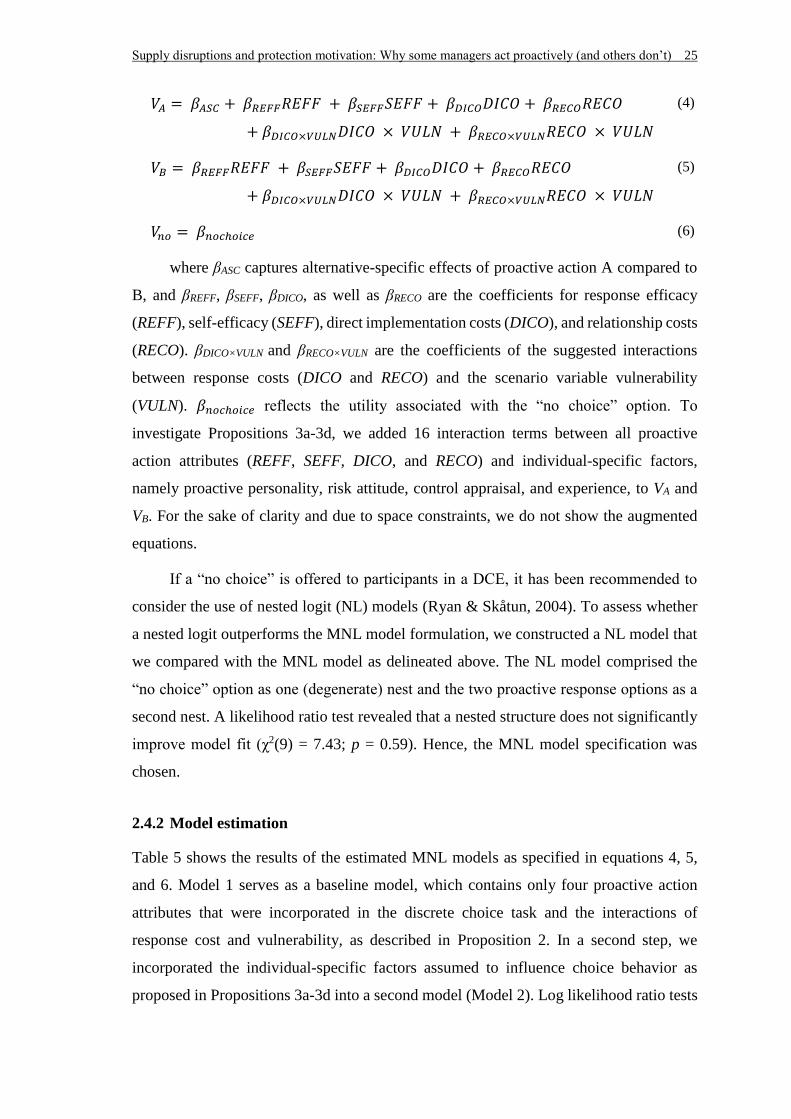
Supply disruptions and protection motivation: Why some managers act proactively (and others don’t) 25
𝑉𝐴 = 𝛽𝐴𝑆𝐶 + 𝛽𝑅𝐸𝐹𝐹𝑅𝐸𝐹𝐹 + 𝛽𝑆𝐸𝐹𝐹𝑆𝐸𝐹𝐹 + 𝛽𝐷𝐼𝐶𝑂𝐷𝐼𝐶𝑂 + 𝛽𝑅𝐸𝐶𝑂𝑅𝐸𝐶𝑂
+ 𝛽𝐷𝐼𝐶𝑂×𝑉𝑈𝐿𝑁𝐷𝐼𝐶𝑂 × 𝑉𝑈𝐿𝑁 + 𝛽𝑅𝐸𝐶𝑂×𝑉𝑈𝐿𝑁𝑅𝐸𝐶𝑂 × 𝑉𝑈𝐿𝑁
(4)
𝑉𝐵 = 𝛽𝑅𝐸𝐹𝐹𝑅𝐸𝐹𝐹 + 𝛽𝑆𝐸𝐹𝐹𝑆𝐸𝐹𝐹 + 𝛽𝐷𝐼𝐶𝑂𝐷𝐼𝐶𝑂 + 𝛽𝑅𝐸𝐶𝑂𝑅𝐸𝐶𝑂
+ 𝛽𝐷𝐼𝐶𝑂×𝑉𝑈𝐿𝑁𝐷𝐼𝐶𝑂 × 𝑉𝑈𝐿𝑁 + 𝛽𝑅𝐸𝐶𝑂×𝑉𝑈𝐿𝑁𝑅𝐸𝐶𝑂 × 𝑉𝑈𝐿𝑁
(5)
𝑉𝑛𝑜 = 𝛽𝑛𝑜𝑐ℎ𝑜𝑖𝑐𝑒 (6)
where βASC captures alternative-specific effects of proactive action A compared to
B, and βREFF, βSEFF, βDICO, as well as βRECO are the coefficients for response efficacy
(REFF), self-efficacy (SEFF), direct implementation costs (DICO), and relationship costs
(RECO). βDICO×VULN and βRECO×VULN are the coefficients of the suggested interactions
between response costs (DICO and RECO) and the scenario variable vulnerability
(VULN). 𝛽𝑛𝑜𝑐ℎ𝑜𝑖𝑐𝑒 reflects the utility associated with the “no choice” option. To
investigate Propositions 3a-3d, we added 16 interaction terms between all proactive
action attributes (REFF, SEFF, DICO, and RECO) and individual-specific factors,
namely proactive personality, risk attitude, control appraisal, and experience, to VA and
VB. For the sake of clarity and due to space constraints, we do not show the augmented
equations.
If a “no choice” is offered to participants in a DCE, it has been recommended to
consider the use of nested logit (NL) models (Ryan & Skåtun, 2004). To assess whether
a nested logit outperforms the MNL model formulation, we constructed a NL model that
we compared with the MNL model as delineated above. The NL model comprised the
“no choice” option as one (degenerate) nest and the two proactive response options as a
second nest. A likelihood ratio test revealed that a nested structure does not significantly
improve model fit (χ2(9) = 7.43; p = 0.59). Hence, the MNL model specification was
chosen.
2.4.2 Model estimation
Table 5 shows the results of the estimated MNL models as specified in equations 4, 5,
and 6. Model 1 serves as a baseline model, which contains only four proactive action
attributes that were incorporated in the discrete choice task and the interactions of
response cost and vulnerability, as described in Proposition 2. In a second step, we
incorporated the individual-specific factors assumed to influence choice behavior as
proposed in Propositions 3a-3d into a second model (Model 2). Log likelihood ratio tests
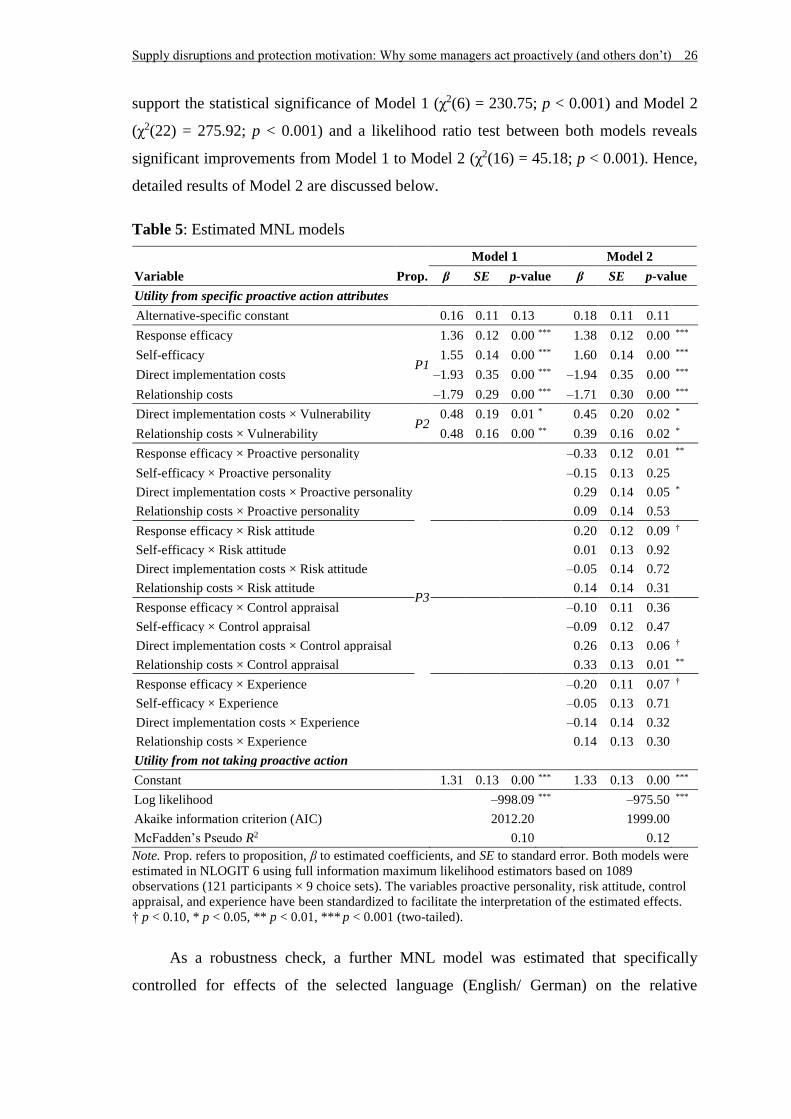
Supply disruptions and protection motivation: Why some managers act proactively (and others don’t) 26
support the statistical significance of Model 1 (χ2(6) = 230.75; p < 0.001) and Model 2
(χ2(22) = 275.92; p < 0.001) and a likelihood ratio test between both models reveals
significant improvements from Model 1 to Model 2 (χ2(16) = 45.18; p < 0.001). Hence,
detailed results of Model 2 are discussed below.
Table 5: Estimated MNL models
Model 1 Model 2
Variable Prop. β SE p-value β SE p-value
Utility from specific proactive action attributes
Alternative-specific constant 0.16 0.11 0.13 0.18 0.11 0.11
Response efficacy
P1
1.36 0.12 0.00 *** 1.38 0.12 0.00 ***
Self-efficacy 1.55 0.14 0.00 *** 1.60 0.14 0.00 ***
Direct implementation costs –1.93 0.35 0.00 *** –1.94 0.35 0.00 ***
Relationship costs –1.79 0.29 0.00 *** –1.71 0.30 0.00 ***
Direct implementation costs × Vulnerability P2
0.48 0.19 0.01 * 0.45 0.20 0.02 *
Relationship costs × Vulnerability 0.48 0.16 0.00 ** 0.39 0.16 0.02 *
Response efficacy × Proactive personality
P3
–0.33 0.12 0.01 **
Self-efficacy × Proactive personality –0.15 0.13 0.25
Direct implementation costs × Proactive personality 0.29 0.14 0.05 *
Relationship costs × Proactive personality 0.09 0.14 0.53
Response efficacy × Risk attitude 0.20 0.12 0.09 †
Self-efficacy × Risk attitude 0.01 0.13 0.92
Direct implementation costs × Risk attitude –0.05 0.14 0.72
Relationship costs × Risk attitude 0.14 0.14 0.31
Response efficacy × Control appraisal –0.10 0.11 0.36
Self-efficacy × Control appraisal –0.09 0.12 0.47
Direct implementation costs × Control appraisal 0.26 0.13 0.06 †
Relationship costs × Control appraisal 0.33 0.13 0.01 **
Response efficacy × Experience –0.20 0.11 0.07 †
Self-efficacy × Experience –0.05 0.13 0.71
Direct implementation costs × Experience –0.14 0.14 0.32
Relationship costs × Experience 0.14 0.13 0.30
Utility from not taking proactive action
Constant 1.31 0.13 0.00 *** 1.33 0.13 0.00 ***
Log likelihood –998.09 *** –975.50 ***
Akaike information criterion (AIC) 2012.20 1999.00
McFadden’s Pseudo R2 0.10 0.12
Note. Prop. refers to proposition, β to estimated coefficients, and SE to standard error. Both models were
estimated in NLOGIT 6 using full information maximum likelihood estimators based on 1089
observations (121 participants × 9 choice sets). The variables proactive personality, risk attitude, control
appraisal, and experience have been standardized to facilitate the interpretation of the estimated effects.
† p < 0.10, * p < 0.05, ** p < 0.01, *** p < 0.001 (two-tailed).
As a robustness check, a further MNL model was estimated that specifically
controlled for effects of the selected language (English/ German) on the relative
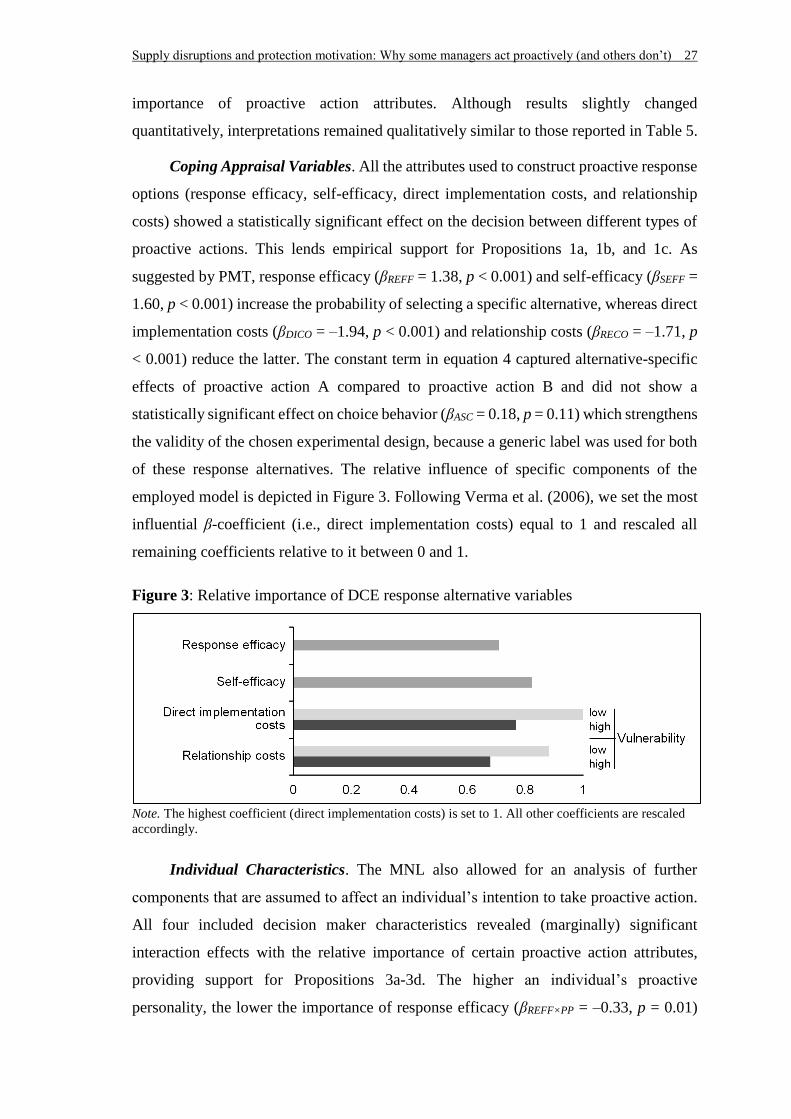
Supply disruptions and protection motivation: Why some managers act proactively (and others don’t) 27
importance of proactive action attributes. Although results slightly changed
quantitatively, interpretations remained qualitatively similar to those reported in Table 5.
Coping Appraisal Variables. All the attributes used to construct proactive response
options (response efficacy, self-efficacy, direct implementation costs, and relationship
costs) showed a statistically significant effect on the decision between different types of
proactive actions. This lends empirical support for Propositions 1a, 1b, and 1c. As
suggested by PMT, response efficacy (βREFF = 1.38, p < 0.001) and self-efficacy (βSEFF =
1.60, p < 0.001) increase the probability of selecting a specific alternative, whereas direct
implementation costs (βDICO = –1.94, p < 0.001) and relationship costs (βRECO = –1.71, p
< 0.001) reduce the latter. The constant term in equation 4 captured alternative-specific
effects of proactive action A compared to proactive action B and did not show a
statistically significant effect on choice behavior (βASC = 0.18, p = 0.11) which strengthens
the validity of the chosen experimental design, because a generic label was used for both
of these response alternatives. The relative influence of specific components of the
employed model is depicted in Figure 3. Following Verma et al. (2006), we set the most
influential β-coefficient (i.e., direct implementation costs) equal to 1 and rescaled all
remaining coefficients relative to it between 0 and 1.
Figure 3: Relative importance of DCE response alternative variables
Note. The highest coefficient (direct implementation costs) is set to 1. All other coefficients are rescaled
accordingly.
Individual Characteristics. The MNL also allowed for an analysis of further
components that are assumed to affect an individual’s intention to take proactive action.
All four included decision maker characteristics revealed (marginally) significant
interaction effects with the relative importance of certain proactive action attributes,
providing support for Propositions 3a-3d. The higher an individual’s proactive
personality, the lower the importance of response efficacy (βREFF×PP = –0.33, p = 0.01)
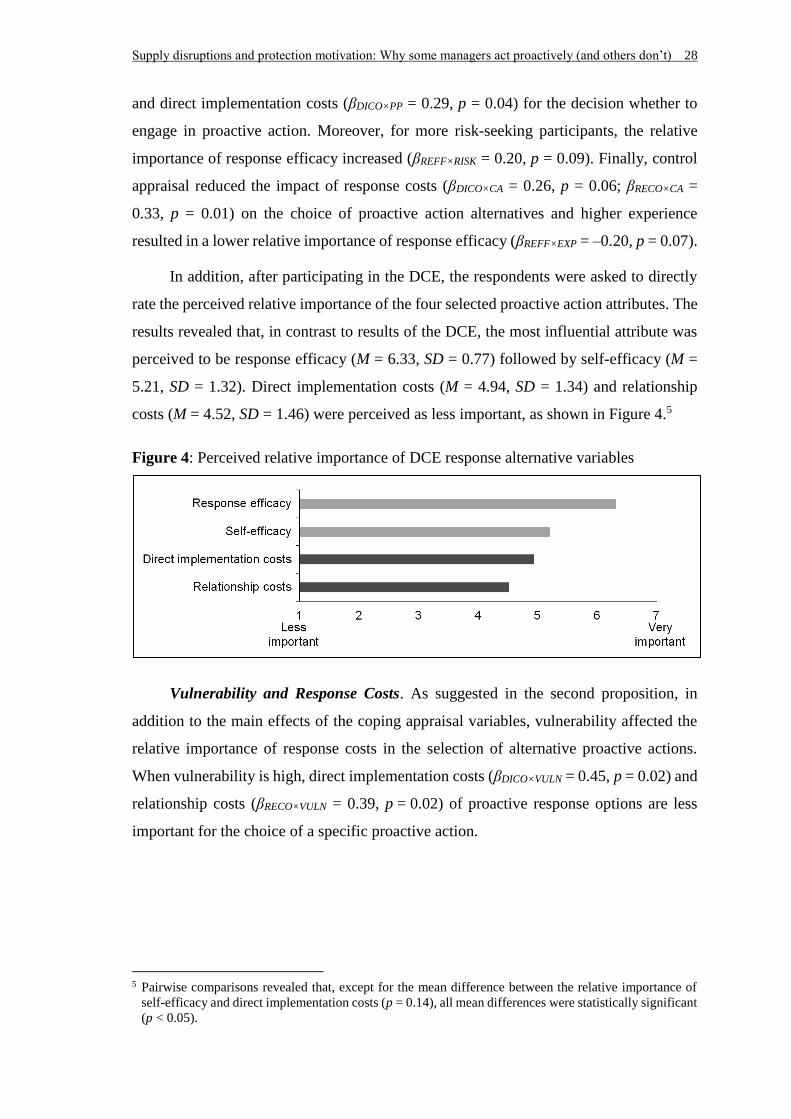
Supply disruptions and protection motivation: Why some managers act proactively (and others don’t) 28
and direct implementation costs (βDICO×PP = 0.29, p = 0.04) for the decision whether to
engage in proactive action. Moreover, for more risk-seeking participants, the relative
importance of response efficacy increased (βREFF×RISK = 0.20, p = 0.09). Finally, control
appraisal reduced the impact of response costs (βDICO×CA = 0.26, p = 0.06; βRECO×CA =
0.33, p = 0.01) on the choice of proactive action alternatives and higher experience
resulted in a lower relative importance of response efficacy (βREFF×EXP = –0.20, p = 0.07).
In addition, after participating in the DCE, the respondents were asked to directly
rate the perceived relative importance of the four selected proactive action attributes. The
results revealed that, in contrast to results of the DCE, the most influential attribute was
perceived to be response efficacy (M = 6.33, SD = 0.77) followed by self-efficacy (M =
5.21, SD = 1.32). Direct implementation costs (M = 4.94, SD = 1.34) and relationship
costs (M = 4.52, SD = 1.46) were perceived as less important, as shown in Figure 4.5
Figure 4: Perceived relative importance of DCE response alternative variables
Vulnerability and Response Costs. As suggested in the second proposition, in
addition to the main effects of the coping appraisal variables, vulnerability affected the
relative importance of response costs in the selection of alternative proactive actions.
When vulnerability is high, direct implementation costs (βDICO×VULN = 0.45, p = 0.02) and
relationship costs (βRECO×VULN = 0.39, p = 0.02) of proactive response options are less
important for the choice of a specific proactive action.
5 Pairwise comparisons revealed that, except for the mean difference between the relative importance of
self-efficacy and direct implementation costs (p = 0.14), all mean differences were statistically significant
(p < 0.05).
Supply disruptions and protection motivation: Why some managers act proactively (and others don’t) 29
2.5 Discussion
2.5.1 Theoretical implications
This study has several important theoretical implications for decision making in the
context of supply risks and disruptions. First, PMT has primarily been applied to health-
related threats that directly concern an individual. This research supports the idea that
PMT is more widely applicable and an insightful framework for situations involving
almost any kind of threat. Instead of using a threat to individuals that would involve direct
emotional or physical harm, we applied PMT to investigate choice behavior of individuals
facing a threat to an organization. As per our propositions, the DCE revealed that trade-
offs are made in supply risk management to select the most attractive proactive measures.
All main variables of PMT’s coping appraisal showed statistically significant effects on
the participants’ choice behavior. The estimated utility that individuals obtain from
evaluating the supply disruption scenario and potential proactive measures is an indicator
of their protection motivation.
As shown in Figure 3, the most important variables when selecting proactive
measures in supply risk management are the two types of response costs variables. High
direct implementation or relationship costs can render a proactive measure so unappealing
that even high response efficacy or high self-efficacy alone cannot offset this burden. The
DCE results, nevertheless, emphasize that self-efficacy is a crucial component that affects
the behavior of individuals within organizations, as delineated by prior research
(Bandura, 1977). Most surprisingly, the perceived effectiveness of a response alternative
in mitigating future loss, which is the main aim of implementing proactive measures, has
the lowest relative importance among the included attributes. Finally, although “doing
nothing” might appear socially undesirable at first sight, the “no choice” option was the
preferred choice in 51.2% of all 1089 choice sets in the final sample.
Second, the role of individual characteristics in the DCE and subsequent analyses
demonstrate that there is a need to account for the role of individuals within decision
making processes in supply chain risk management. Figure 5 shows an enriched version
of PMT, which includes an additional layer depicting the identified interactions of coping
appraisals with individual-specific characteristics as a more comprehensive model of
proactive behavior.
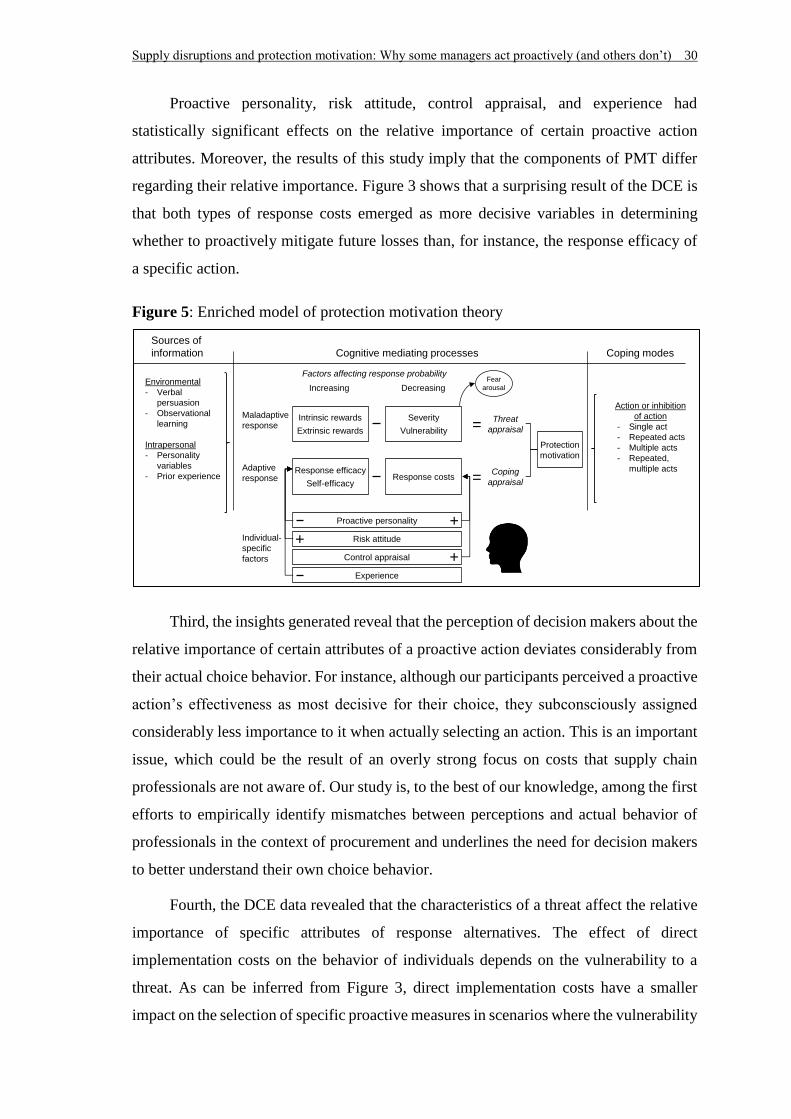
Supply disruptions and protection motivation: Why some managers act proactively (and others don’t) 30
Proactive personality, risk attitude, control appraisal, and experience had
statistically significant effects on the relative importance of certain proactive action
attributes. Moreover, the results of this study imply that the components of PMT differ
regarding their relative importance. Figure 3 shows that a surprising result of the DCE is
that both types of response costs emerged as more decisive variables in determining
whether to proactively mitigate future losses than, for instance, the response efficacy of
a specific action.
Figure 5: Enriched model of protection motivation theory
Third, the insights generated reveal that the perception of decision makers about the
relative importance of certain attributes of a proactive action deviates considerably from
their actual choice behavior. For instance, although our participants perceived a proactive
action’s effectiveness as most decisive for their choice, they subconsciously assigned
considerably less importance to it when actually selecting an action. This is an important
issue, which could be the result of an overly strong focus on costs that supply chain
professionals are not aware of. Our study is, to the best of our knowledge, among the first
efforts to empirically identify mismatches between perceptions and actual behavior of
professionals in the context of procurement and underlines the need for decision makers
to better understand their own choice behavior.
Fourth, the DCE data revealed that the characteristics of a threat affect the relative
importance of specific attributes of response alternatives. The effect of direct
implementation costs on the behavior of individuals depends on the vulnerability to a
threat. As can be inferred from Figure 3, direct implementation costs have a smaller
impact on the selection of specific proactive measures in scenarios where the vulnerability
Response efficacy
Self-efficacy
Sources of
information Cognitive mediating processes Coping modes
Environmental
- Verbal
persuasion
- Observational
learning
Intrapersonal
- Personality
variables
- Prior experience
Action or inhibition
of action
- Single act
- Repeated acts
- Multiple acts
- Repeated,
multiple acts
Factors affecting response probability
Maladaptive
response
Adaptive
response
Increasing Decreasing
Intrinsic rewards
Extrinsic rewards
Severity
Vulnerability
Response costs
=
=
Protection
motivation
Fear
arousal
Threat
appraisal
Coping
appraisal
Proactive personality
Risk attitude
Control appraisal
Experience
+
++Individual-
specific
factors
Supply disruptions and protection motivation: Why some managers act proactively (and others don’t) 31
to a threat is high rather than low. This is intuitive in the sense that greater vulnerability
might lead to a greater tolerance for higher response costs because, in this case, a threat
arising from a supply disruption could appear more unavoidable.
2.5.2 Managerial implications
In addition to the delineated theoretical implications, this study’s findings entail
considerable implications for managerial practice. One implication of this study is the
way in which individuals process insights from observing competitors exposed to supply
disruptions to adjust their own management of supply risk. Prior research has already
suggested that vicarious learning is a relevant issue in the management of supply risk and
disruptions (Hora & Klassen, 2013). We contribute to these insights by adding new details
on how exactly information on someone else’s misfortune and an impending disruption
can be translated into proactive action.
Individual managers focus on the costs of a specific action when they decide
whether or not to act proactively, although they perceive self-efficacy and the action’s
effectiveness as more important. This mismatch between perceptions and actual behavior
underlines the need for decision makers to improve their understanding of how they make
choices. Moreover, although the DCE focused on the example of a severe disruption that
might lead to tremendous (financial) loss, the costs of a measure instead of its ability to
mitigate future loss were extremely decisive for individual decision makers. This might
reveal a tendency to admit too much relevance to the costs of a response in the selection
process of proactive measures which might not always be desirable. The estimated loss
associated with a supply disruption is often difficult to discern; this makes it challenging
to weigh the costs of a proactive measure against the potential damage.
Finally, in supply risk management, firms depend to a large part on the self-efficacy
of their employees (as seen in Figures 3 and 4), which is even more important than the
perceived effectiveness of a response option in avoiding the dangers of a threat. Hence,
firms benefit from being aware of this circumstance and training their employees to
appropriately assess their own abilities and build confidence. Otherwise, a manager who,
mistakenly, does not feel capable of successfully performing a certain proactive action
will avoid selecting it, which might result in an unnecessarily high exposure to future
damage through supply disruptions for a firm. In addition, the results depict several
Supply disruptions and protection motivation: Why some managers act proactively (and others don’t) 32
effects of individual characteristics on proactive behavior. Thus, these insights might be
helpful in recruiting decisions and personnel allocation.
2.5.3 Limitations and future research opportunities
Several limitations constrain the contribution of this study, but, at the same time, also
highlight fruitful avenues for future research. First and foremost, the choice experiment
relies on stated intentions of individuals instead of their real-life behavior. Prior research
indicates that intentions can be reliable indicators of actual behavior (Ajzen, 1991; T. L.
Webb & Sheeran, 2006). However, in the event of an actual impending supply disruption,
individuals might behave differently than indicated in response to the hypothetical choice
situation, such as environmental factors or time pressures unaccounted for in our DCE.
Furthermore, the experimental task is limited to decision makers with centralized
authority because we assume that this is a basic characteristic of risk management
processes. This means that, at the same time, we did not consider many factors that might
also influence the selection process of proactive measures, such as the presence of a
hierarchy (Mihm, Loch, Wilkinson, & Huberman, 2010), the need to coordinate with
others (Lounamaa & March, 1987), or adding other characteristics of an individual
manager’s work environment (S. K. Parker et al., 2006).
Following previous research, we refrained from explicitly distinguishing response
costs and probable extrinsic as well as intrinsic rewards from maladaptive behavior.
However, since these rewards are part of the PMT’s threat appraisal process, the
consideration and implementation of specific rewards of, for example, not taking
proactive action within an experimental design might provide an even more sophisticated
picture of proactive risk management decisions. In addition, we used four two-level key
variables of PMT as attributes to construct response options. As this was the first attempt
to model the selection process of proactive actions in supply risk management using
discrete choice modelling, this study has an exploratory character and adding attributes
or distinguishing among further levels to describe response alternatives in the DCE seems
a promising way to generate additional insights.
Another limitation is that choice behavior might vary with the cultural background
of respondents as demonstrated by S. C. Schneider and De Meyer (1991). They showed
that Latin European managers were more likely to respond proactively to strategic issues
than their North American, British, northern European, or Nordic counterparts. Hence, to
Supply disruptions and protection motivation: Why some managers act proactively (and others don’t) 33
make the generated insights more generalizable, we encourage the validation of our
results by means of a larger sample comprising supply chain professionals from several
cultural regions.
The identification of the main drivers of proactive behavior in supply risk
management provides insights into decision making behavior. The results of this study
show that PMT is an insightful framework to analyze the selection of proactive measures.
Moreover, the identified mismatch between perceptions and actual choice behavior is an
interesting topic for future research. The designed DCE can serve as a starting point for
future research to further improve our understanding of how managers cope with the
threat of supply disruptions and for practitioners to develop training tools for proactive
decision making in supply risk management.
Finally, this research focused on supply disruptions that are accompanied by a
potentially severe negative impact on the performance of a firm and cannot be solved
within day-to-day operations. Choice behavior and the underlying relative importance of
specific attributes might considerably diverge between exposure to less severe instead of
very severe threats, as already suggested by prior research (Cismaru & Lavack, 2007). It
is important to understand the performance implications of these choices when the threat
is minor and severe.
Substantive and symbolic corporate social responsibility: Blessing or curse in case of misconduct? 34
Chapter 3 Substantive and symbolic corporate
social responsibility: Blessing or curse in
case of misconduct?
Co-author:
Christoph Bode
Endowed Chair of Procurement, Business School, University of Mannheim, Germany
Abstract
Often, corporate social responsibility (CSR) is associated solely with “doing good,” but
firms also have to prevent corporate social irresponsibility (CSIR) (i.e., “avoiding bad”).
Many firms engage in CSR – either substantively or only symbolically – in the hopes that
a reputation for CSR mitigates negative stakeholder reactions in case the firms suddenly
become involved in a CSIR incident. Yet, research on the effects of a CSR reputation on
stakeholder reactions to CSIR is equivocal. Some studies have theorized insurance-like
effects of ex ante CSR, whereas others have suggested the exact opposite, namely that a
reputation for CSR may even aggravate negative reactions to CSIR. Moreover, extant
research on stakeholder reactions to CSIR has focused chiefly on consumers and
investors, although stakeholders increasingly hold firms accountable for misconduct
within their supply chains, which has repercussions on supplier selection decisions. The
present study is innovative in that it focuses on the business-to-business (B2B) context
from a purchasing perspective and proposes a model that explains the conditions under
which CSR acts as an insurance or a liability subsequent to CSIR. The empirical results
from a vignette experiment with supply chain managers add to the understanding of the
effects of CSR activities on negative stakeholder reactions to CSIR and provide important
theoretical and practical implications.
Substantive and symbolic corporate social responsibility: Blessing or curse in case of misconduct? 35
3.1 Introduction
The issue of corporate social irresponsibility (CSIR) has only rarely been addressed in
the corporate social responsibility (CSR) literature, although stakeholders devote growing
attention to environmental and social misconduct (Fiaschi et al., 2017). Stakeholders exert
increased pressure on firms to behave in socially responsible ways (Campbell, 2007) and
increasingly hold them responsible for misconduct in their supply chains (Hartmann &
Moeller, 2014; Y. H. Kim & Davis, 2016). The academic literature has strongly focused
on linking CSR with the concept of “doing good,” while “avoiding bad” also constitutes
an important condition for firms to be perceived as socially responsible (Lin-Hi & Müller,
2013). CSIR applies to all industries and it can take various forms from environmental
disasters (e.g., the Deepwater Horizon oil spill in 2010) and workplace disasters (e.g., the
Rana Plaza building collapse in 2013) all the way to corruption and collusion scandals
(e.g., the price-fixing cartel of the truck makers DAF, Daimler, Iveco, and Volvo-Renault
between 1997 and 2011). The globalization of markets and increasing interconnectedness
of supply networks have recently added to the complexity that firms face and made it
even more challenging for managers to prevent CSIR. In the light of this development, it
is important to understand that consumers not only blame firms for CSIR that occurs
inside their own barriers but also hold buying firms responsible for their suppliers’
environmental and social misconduct (Hartmann & Moeller, 2014). Subsequent negative
stakeholder reactions pose substantial risks that need to be addressed (Lin-Hi &
Blumberg, 2018). Since firms are perceived to be only as responsible as their supply
network (Andersen & Skjoett-Larsen, 2009), the purchasing function plays a key role in
preventing CSIR and addressing these risks. This study focusses on the role of the
purchasing function as gatekeeper to CSIR in the supply chain of the focal firm.
Research has been concerned with whether a firm’s ex ante CSR activities affect
negative stakeholder reactions to CSIR. Most studies have focused on consumer or
investor reactions and theorized an insurance-like mechanism of a firm’s reputation for
CSR, which builds a “reservoir of goodwill” among the firm’s stakeholders and mitigates
negative responses to bad news (e.g., Flammer, 2013; Godfrey et al., 2009). But there are
also studies purporting the exact opposite, namely that firms engaging in CSR experience
more negative reactions to CSIR incidents than firms that do not promote themselves as
socially responsible (e.g., Sen & Bhattacharya, 2001; Swaen & Vanhamme, 2003;
Vanhamme & Grobben, 2009). Indeed, recent examples, such as the German car
Substantive and symbolic corporate social responsibility: Blessing or curse in case of misconduct? 36
manufacturer Volkswagen (VW) that won numerous CSR awards but currently faces
severe public criticism due to the “Dieselgate” scandal, cast doubts on insurance-like
effects of ex ante CSR (Lynn, 2015).
Like brand commitment or consumer-company identification, a CSR reputation
might serve as a goodwill buffer in case of non-severe CSIR, but also an expectation
burden in case of severe CSIR (e.g., Einwiller, Fedorikhin, Johnson, & Kamins, 2006;
Germann et al., 2014; Janssen et al., 2015; Kang et al., 2016). Based on assimilation-
contrast theory, this research contributes to identifying the boundary conditions of the
“insurance effect” of a CSR reputation thereby addressing recent calls for more research
on how ex ante CSR affects negative stakeholder reactions in the aftermath of CSIR (e.g.,
Kang et al., 2016; S. Kim & Choi, 2016; Lenz, Wetzel, & Hammerschmidt, 2017). More
specifically, this study investigates how negative stakeholder reactions to CSIR in
industrial buying contexts are shaped by the type of CSR reputation and the CSIR
severity. To this end, the employed research design (randomized vignette experiment)
accounts for different approaches to build a CSR reputation (substantive vs. symbolic).
The empirical results suggest that CSR mitigates negative reactions to non-severe CSIR
but that CSR reputations driven by symbolic actions aggravate negative stakeholder
reactions in case of severe CSIR. In addition, the results provide important and innovative
insights for managers who are concerned with stakeholder management and the allocation
of resources to CSR activities while facing the risk of CSIR.
3.2 Conceptual background and hypotheses development
3.2.1 Substantive and symbolic management of corporate social responsibility
expectations
Although the literature on CSR is vast, there are still controversies revolving around the
definition of CSR (e.g., Colombo, Guerci, & Miandar, 2017; Sheehy, 2015). As Lin-Hi
and Müller (2013) stated, “despite the growing interest in this topic, there is still no
general agreement on the precise meaning of CSR” (p. 1928). CSR has often been used
as an umbrella term for concepts, such as sustainability, business ethics, or corporate
citizenship (de Jong & van der Meer, 2017; Freeman & Hasnaoui, 2011). Nevertheless,
the accepted idea of CSR is that society and business are not autonomous but
interdependent and that “society has certain expectations for appropriate business
behavior and outcomes” (Wood, 1991, p. 695). For the purpose of this study, following

Substantive and symbolic corporate social responsibility: Blessing or curse in case of misconduct? 37
McWilliams and Siegel (2001), we define CSR as a firm’s actions that appear to “advance
some social good, beyond the interests of the firm and what is required by the law” (p.
117). Moreover, we adopt a holistic, multidimensional view of CSR. Typically,
environmental, social, and governance (ESG) activities are captured to determine the
degree to which a firm lives up to its CSR (Arvidsson, 2010; Cheng, Ioannou, & Serafeim,
2014). Examples of such activities include the use of renewable raw materials (Ketola,
2010), the establishment of corporate foundations (Westhues & Einwiller, 2006), and the
presence of an external auditor to examine, verify, and validate a CSR report (Lynes &
Andrachuk, 2008). However, research concerned with CSR has often focused only on
single dimensions (e.g., Walls, Berrone, & Phan, 2012) and neglected this
multidimensionality (e.g., Bénabou & Tirole, 2010; Carroll, 1979; Waddock & Graves,
1997).
Firms may establish and maintain a reputation for CSR by engaging in CSR-related
activities (McWilliams & Siegel, 2001; Vanhamme & Grobben, 2009). More specifically,
from a stakeholder perspective, firms have to address their stakeholders’ demands, such
as customers, suppliers, employees, or local communities, who have expectations with
regard to a firm’s social responsibility. A firm can obtain support for its operations and,
from an institutional perspective, maintain its “social license to operate” (SLO)
(Demuijnck & Fasterling, 2016, p. 675) only when the behavior of a firm is in line with
these demands. In addition, buying firms are increasingly held responsible for their
suppliers’ behavior and criticized as soon as this behavior deviates from the stakeholders’
expectations (Hartmann & Moeller, 2014). This “chain liability” adds to the challenge of
maintaining an SLO, because it implies that a buying firm is only as socially responsible
as its supply network (Andersen & Skjoett-Larsen, 2009; Krause, Vachon, & Klassen,
2009). Consequently, the purchasing function plays a key role in implementing a firm’s
CSR strategy by mitigating risks associated with environmental or social misconduct of
suppliers (Hajmohammad & Vachon, 2016; L. Schneider & Wallenburg, 2012).
An SLO provides a basis for firm’s activities to be perceived as legitimate in the
eyes of stakeholders (Demuijnck & Fasterling, 2016). Legitimacy is typically defined as
“a generalized perception or assumption that the actions of an entity are desirable, proper,
or appropriate within some socially constructed system of norms, values, beliefs, and
definitions” (Suchman, 1995, p. 574). According to institutional theory, firms can use two
strategies to address their stakeholders’ demands and obtain legitimacy. They can pursue
Substantive and symbolic corporate social responsibility: Blessing or curse in case of misconduct? 38
either a substantive or a symbolic adaptation approach (Ashforth & Gibbs, 1990). From a
stakeholder management perspective, the overall aim of these approaches is to manage
stakeholders’ perceptions of meeting societal expectations by either engaging in actions
entailing real change or claims/ promises providing representations of such actions
(Wickert, Scherer, & Spence, 2016). Highhouse, Brooks, and Gregarus (2009) developed
a model showing that these activities serve as cues about a firm’s CSR policy, which are
processed by individuals to form a perception about a firm’s reputation.
The substantive adaptation approach involves considerable changes in core
procedures or long-term investments, which entail certain risks but ensure actual
compliance with the expectations imposed by the external environment (Eccles, Ioannou,
& Serafeim, 2014). Substantive actions include, for example, the use of renewable energy,
the development of products that provide specific health or safety benefits, and the
acquisition of an above-average percentage of independent board members. In contrast,
the symbolic adaptation approach is based on activities that seek to decouple the firm’s
actual practices from the external demands by means of superficial actions that merely
show “ceremonial conformity” but do not necessarily have any substance (Ashforth &
Gibbs, 1990; Meyer & Rowan, 1977). Examples are the formation of a CSR committee,
a membership in a voluntary initiative that aims to reduce CO2 emissions, and the mere
claim to provide flexible working hours to employees. These actions do not necessarily
entail real and concrete change in business processes, but they have the potential to be
utilized as a cover for poor actual CSR performance (Russo & Harrison, 2005). Symbolic
responses to stakeholder demands aim at producing “impressions of more material
change” (Durand, Hawn, & Ioannou, 2017, p. 5) and managing stakeholder perceptions
of environmental and social commitment (Bansal & Clelland, 2004). Despite the
circumstance that symbolic activities do not involve concrete changes in organizational
procedures, they may suffice to promote a firm’s legitimacy because the “appearance
rather than the fact of conformity is often presumed to be sufficient for the attainment of
legitimacy” (Oliver, 1991, p. 155). In line with this, several empirical studies have
suggested that the use of symbolic CSR actions, decoupled from concrete change,
positively affects a firm’s legitimacy (e.g., Weaver, Trevino, & Cochran, 1999; Westphal
& Zajac, 2001; Zott & Huy, 2007). However, although both substantive and symbolic
CSR engagement may translate into being perceived as legitimate, further empirical
research shows that substantive and symbolic CSR activities may differ with regard to
Substantive and symbolic corporate social responsibility: Blessing or curse in case of misconduct? 39
their implications for stakeholder attributions and behavior (e.g., Donia, Ronen, Sirsly, &
Bonaccio, 2017; Godfrey et al., 2009; McShane & Cunningham, 2012; Vlachos,
Panagopoulos, & Rapp, 2013).
It is not surprising that, all else equal, managers tend to prefer to pursue the less
time-consuming and resource-intensive stakeholder management via symbolic
assurances (Ashforth & Gibbs, 1990). This preference for symbolic assurances carries a
risk, because stakeholders typically demand substantive action. If noticed, the use of
symbols, claims, and promises without actually providing a social good could lead to a
loss of all benefits generated from previous CSR activities (Hawn & Ioannou, 2016). If
symbolic CSR actions were interpreted as “greenwashing” for the mere sake of being
granted legitimacy, firms may be perceived as untrustworthy and manipulative (Walker
& Wan, 2012). Being one of the most prominent industry examples of the last decades,
British Petroleum’s (BP) symbolic commitment to CSR before the Deepwater Horizon
catastrophe highlights that such decoupling can be enough to obtain legitimacy. However,
this example also highlights that whether substantive or symbolic activities have been
chosen to achieve legitimacy has important repercussions in case of severe misconduct
because the “beyond petroleum” campaign based on symbolic CSR engagement first
helped BP to be perceived as socially responsible, “before being turned against it as a
testament of perceived greenwashing” (Matejek & Gössling, 2014, p. 579).
3.2.2 Corporate social irresponsibility
The examination of CSIR in the academic literature started with Armstrong (1977) and
the topic has been only rarely addressed since, although “avoiding bad” is considered a
precondition for a firm to be perceived as a responsible actor (Lin-Hi & Müller, 2013). In
line with Lin-Hi and Müller (2013), we define CSIR as firm-induced incident “that results
in (potential) disadvantages and/ or harm to other actors” (p. 1932). This includes, for
instance, the release of toxic chemicals into waterways (Greenpeace, 2014), corruption
scandals (Clark, 2010), and labor law violations (Reuters, 2014). Such events are frequent
and widespread across industries, and the probability of the occurrence of CSIR is a
function of the complexity of a firm’s business (Vanessa, Jijun, & Bansal, 2006). CSIR
incidents may trigger various consequential negative stakeholder reactions such as
penalties, compensation payments, sales bans, and decreased employee motivation, but
also reputational damage and customer losses, which can even lead to the demise of firms
Substantive and symbolic corporate social responsibility: Blessing or curse in case of misconduct? 40
(e.g., Jin, 2016; Sims & Brinkmann, 2003). To manage the risk of CSIR in their supply
chains and curb the chain liability effect, firms can choose from a broad range of actions
to respond to misconduct of suppliers. Contractual agreements between a focal firm and
its suppliers (e.g., phase-out of a supplier instead of immediate termination of the
relationship) might constrain these response actions.
Many firms pursue CSR-related actions in the belief that this protects them from
future reputational damage (Janssen et al., 2015; Vanhamme, Swaen, Berens, & Janssen,
2015). Still, several industry examples of CSIR have demonstrated that the effects of a
reputation for CSR on stakeholder reactions to irresponsible behavior are more complex
than a simple “insurance mechanism” would suggest. VW was highly praised for its
strong commitment to CSR until the public was informed that in fall 2015 that the firm
cheated on the pollution tests of their diesel vehicles by using an illegally manipulating
software. This scandal has already cost VW several billions of U.S. dollars, but the
corresponding negative consequences might still not be discernible to the full extent. The
firm has been heavily criticized in public, although other car manufacturers were, and still
are, exposed to similar accusations (Mehrotra, 2018). Another example concerns the
“Deepwater Horizon” oil spill of BP. For years prior to the disaster, BP has spent many
resources on its “Beyond Petroleum” campaign to be perceived as a socially responsible
firm. Nevertheless, the firm has suffered tremendously from the disaster in 2010. It is
argued that a driver of the stakeholder criticism was the firm’s CSR engagement prior to
the event (Janssen et al., 2015).
Moreover, several published studies obtained results that the “insurance
mechanism” is not able to explain. These studies suggest that under certain conditions,
mitigating effects resulting from a CSR reputation are fragile, and ex ante CSR
engagement may even lead to more negative stakeholder reactions subsequent to CSIR
compared to firms that do not have a CSR reputation. For instance, if the domain of the
CSIR incident is related to a firm’s prior CSR activities, a CSR reputation acts as a
liability that aggravates negative reactions (Wagner, Lutz, & Weitz, 2009). The recent
study by S. Kim and Choi (2016) complements this finding, demonstrating that the effect
of post-crisis communication of CSR activities on negative stakeholder reactions depends
on the domain of pre-crisis CSR initiatives conducted by the firm facing the crisis. The
domain of a firm’s post-crisis CSR engagement is also decisive for its implications on
firm value. If the engagement is related to the domain of a firm’s CSIR, it is perceived as
Substantive and symbolic corporate social responsibility: Blessing or curse in case of misconduct? 41
insincere while it may enhance firm value if it is related to other domains (Lenz et al.,
2017). In addition, it is important to consider the channels through which firms
communicate CSR activities prior to CSIR, especially when these activities do not relate
to the domain of the CSIR incident. CSR activities that are communicated through highly
credible third-party sources augment negative stakeholder reactions while CSR
information that is communicated using firm-controlled sources is able to attenuate
adverse responses compared to firms that do not at all communicate their CSR activities
(Vanhamme et al., 2015). Finally, the results of an experimental study revealed that firms
with a brief CSR history may experience more negative stakeholder reactions to corporate
crises when they use their CSR engagement in their post-CSIR communication, whereas
firms with a long CSR history can benefit from mentioning their involvement
(Vanhamme & Grobben, 2009). All these research efforts highlight that insurance-like
effects from ex ante CSR cannot be taken for granted.
3.2.3 Assimilation and contrast effects subsequent to CSIR
Previous research has strongly focused on theorizing an insurance-like mechanism of a
firm’s reputation for CSR in case of misconduct, however, the boundary conditions of
insurance-like effects of ex ante CSR on negative stakeholder reactions to CSIR remain
unclear. CSR-related activities do not necessarily need to translate into positive effects
for a firm, especially if this involvement is perceived as insincere (Sen & Bhattacharya,
2001). When a firm with a reputation for CSR is involved in CSIR, customers can lose
their more positive perception and trust this firm less than if it would have not been
promoted as socially responsible (Swaen & Vanhamme, 2003).
Assimilation-contrast theory describes how individuals evaluate new information.
Its underlying idea is that an individual’s initial expectations towards an issue serve as a
reference point to which the new information is compared (Hovland, Harvey, & Sherif,
1957; Sherif & Hovland, 1961). Depending on the extent to which the new information
violates the initial expectations, the disparity will either be assimilated towards the
reference point or contrasted away from it. In line with this, Kang et al. (2016) argued
that in a fashion similar to that of brand commitment in case of product recalls (Germann
et al., 2014) or consumer-company identification in times of negative publicity (Einwiller
et al., 2006), a reputation for CSR might attenuate negative stakeholders’ reactions to
light, non-severe CSIR but augment negative responses to severe CSIR. Put differently,
Substantive and symbolic corporate social responsibility: Blessing or curse in case of misconduct? 42
stakeholders might respond more negatively to severe CSIR than if they would have not
perceived this firm as socially responsible. Based on insights from research on
assimilation-contrast theory (e.g., R. E. Anderson, 1973), the framework for
understanding the roles of CSR in crisis situations developed by Janssen et al. (2015)
suggests that assimilation and contrast effects are not only driven by the characteristics
of CSIR (e.g., its severity) but also by stakeholder perceptions of CSR motives. These
motives are either extrinsic (akin to symbolic CSR) or intrinsic (akin to substantive CSR).
Intrinsically motivated CSR engagement is perceived as acting out of profit-driven self-
interest while extrinsically motivated CSR activities are interpreted as genuine concern
for environmental and social concerns (Batson, 1998). Assimilation-contrast theory
provides valuable insight into how reputations for CSR affect negative stakeholder
reactions to CSIR and, more specifically, into the boundary conditions of the insurance-
like mechanism of ex ante CSR.
To operationalize the reactions of customers to CSIR, we focus on two important
customer outcomes of buying situations, purchase intention (PI) and the intention to
engage in negative word-of-mouth (nWOM) (Maxham & Netemeyer, 2003). They cover
two facets of customer behavior, and they are well-established and validated in the B2B
marketing literature (Leroi-Werelds, Streukens, Brady, & Swinnen, 2014). Purchase
intentions depict how a customer intends to act in a specific buying situation while
intentions to engage in nWOM represent customers’ behavior after the buying situation.
Two unique characteristics distinguish nWOM from purchase intentions, the effect of
nWOM tends to last longer and nWOM is a potential source of information (Ham & Kim,
2017). Hence, nWOM can have tremendous consequences and may affect the purchase
decisions of not only a supplier’s existing, but also potential customers (Ferguson &
Johnston, 2011; Money, Gilly, & Graham, 1998). In industrial buying contexts, nWOM
could be shared through, for instance, supplier-selected referrals (Hada, Grewal, & Lilien,
2014). Industrial buyers tend to rely on referrals even more than consumers (Wangenheim
& Bayón, 2007) and considerable empirical evidence shows that both purchase intention
and nWOM are related to actual behavior (E. W. Anderson, Fornell, & Lehmann, 1994;
Morgan & Rego, 2006). A joint focus on both variables captures a thorough picture of
the behavior of professional buyers.
As an important characteristic of CSIR, the severity of environmental or social
misconduct might moderate the link between CSIR and negative stakeholder reactions.
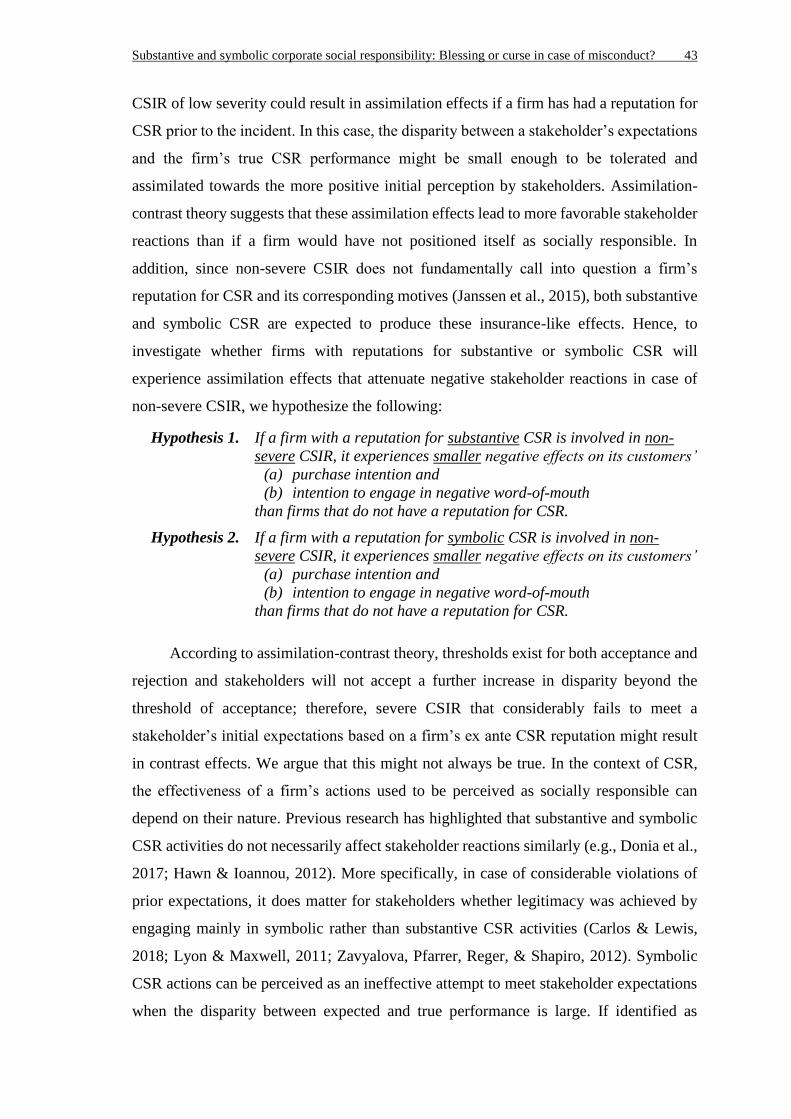
Substantive and symbolic corporate social responsibility: Blessing or curse in case of misconduct? 43
CSIR of low severity could result in assimilation effects if a firm has had a reputation for
CSR prior to the incident. In this case, the disparity between a stakeholder’s expectations
and the firm’s true CSR performance might be small enough to be tolerated and
assimilated towards the more positive initial perception by stakeholders. Assimilation-
contrast theory suggests that these assimilation effects lead to more favorable stakeholder
reactions than if a firm would have not positioned itself as socially responsible. In
addition, since non-severe CSIR does not fundamentally call into question a firm’s
reputation for CSR and its corresponding motives (Janssen et al., 2015), both substantive
and symbolic CSR are expected to produce these insurance-like effects. Hence, to
investigate whether firms with reputations for substantive or symbolic CSR will
experience assimilation effects that attenuate negative stakeholder reactions in case of
non-severe CSIR, we hypothesize the following:
Hypothesis 1. If a firm with a reputation for substantive CSR is involved in non-
severe CSIR, it experiences smaller negative effects on its customers’
(a) purchase intention and
(b) intention to engage in negative word-of-mouth
than firms that do not have a reputation for CSR.
Hypothesis 2. If a firm with a reputation for symbolic CSR is involved in non-
severe CSIR, it experiences smaller negative effects on its customers’
(a) purchase intention and
(b) intention to engage in negative word-of-mouth
than firms that do not have a reputation for CSR.
According to assimilation-contrast theory, thresholds exist for both acceptance and
rejection and stakeholders will not accept a further increase in disparity beyond the
threshold of acceptance; therefore, severe CSIR that considerably fails to meet a
stakeholder’s initial expectations based on a firm’s ex ante CSR reputation might result
in contrast effects. We argue that this might not always be true. In the context of CSR,
the effectiveness of a firm’s actions used to be perceived as socially responsible can
depend on their nature. Previous research has highlighted that substantive and symbolic
CSR activities do not necessarily affect stakeholder reactions similarly (e.g., Donia et al.,
2017; Hawn & Ioannou, 2012). More specifically, in case of considerable violations of
prior expectations, it does matter for stakeholders whether legitimacy was achieved by
engaging mainly in symbolic rather than substantive CSR activities (Carlos & Lewis,
2018; Lyon & Maxwell, 2011; Zavyalova, Pfarrer, Reger, & Shapiro, 2012). Symbolic
CSR actions can be perceived as an ineffective attempt to meet stakeholder expectations
when the disparity between expected and true performance is large. If identified as
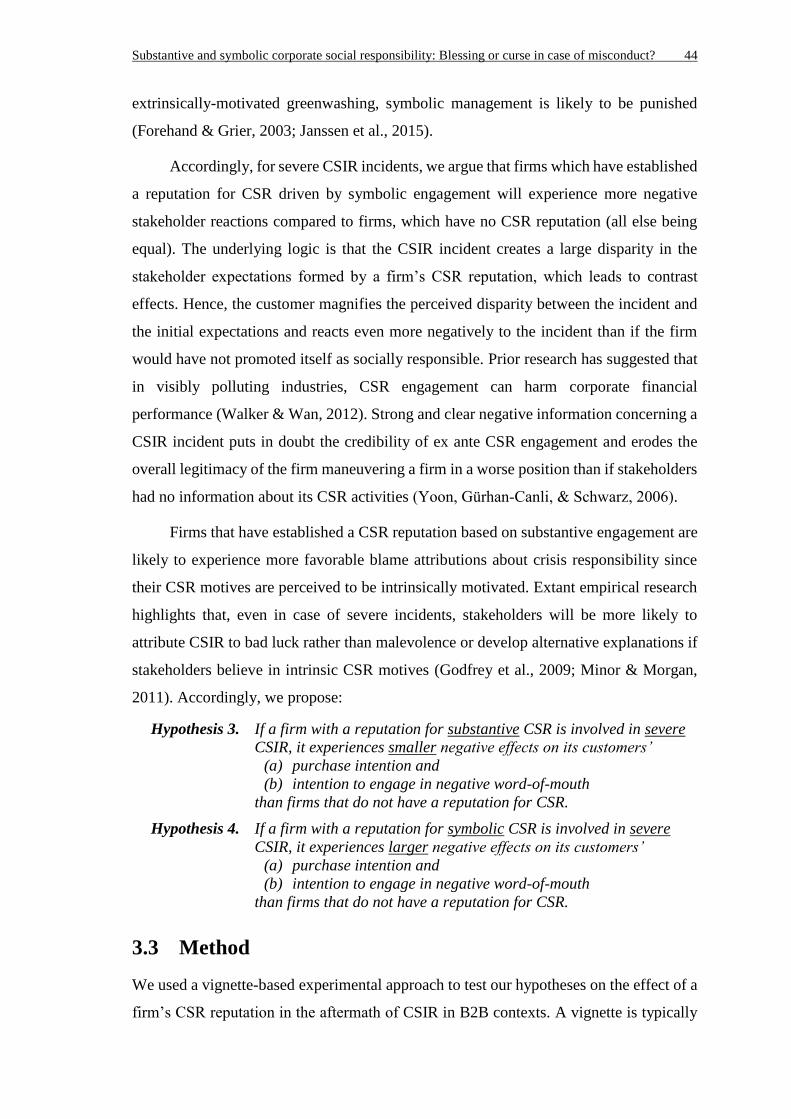
Substantive and symbolic corporate social responsibility: Blessing or curse in case of misconduct? 44
extrinsically-motivated greenwashing, symbolic management is likely to be punished
(Forehand & Grier, 2003; Janssen et al., 2015).
Accordingly, for severe CSIR incidents, we argue that firms which have established
a reputation for CSR driven by symbolic engagement will experience more negative
stakeholder reactions compared to firms, which have no CSR reputation (all else being
equal). The underlying logic is that the CSIR incident creates a large disparity in the
stakeholder expectations formed by a firm’s CSR reputation, which leads to contrast
effects. Hence, the customer magnifies the perceived disparity between the incident and
the initial expectations and reacts even more negatively to the incident than if the firm
would have not promoted itself as socially responsible. Prior research has suggested that
in visibly polluting industries, CSR engagement can harm corporate financial
performance (Walker & Wan, 2012). Strong and clear negative information concerning a
CSIR incident puts in doubt the credibility of ex ante CSR engagement and erodes the
overall legitimacy of the firm maneuvering a firm in a worse position than if stakeholders
had no information about its CSR activities (Yoon, Gürhan‐Canli, & Schwarz, 2006).
Firms that have established a CSR reputation based on substantive engagement are
likely to experience more favorable blame attributions about crisis responsibility since
their CSR motives are perceived to be intrinsically motivated. Extant empirical research
highlights that, even in case of severe incidents, stakeholders will be more likely to
attribute CSIR to bad luck rather than malevolence or develop alternative explanations if
stakeholders believe in intrinsic CSR motives (Godfrey et al., 2009; Minor & Morgan,
2011). Accordingly, we propose:
Hypothesis 3. If a firm with a reputation for substantive CSR is involved in severe
CSIR, it experiences smaller negative effects on its customers’
(a) purchase intention and
(b) intention to engage in negative word-of-mouth
than firms that do not have a reputation for CSR.
Hypothesis 4. If a firm with a reputation for symbolic CSR is involved in severe
CSIR, it experiences larger negative effects on its customers’
(a) purchase intention and
(b) intention to engage in negative word-of-mouth
than firms that do not have a reputation for CSR.
3.3 Method
We used a vignette-based experimental approach to test our hypotheses on the effect of a
firm’s CSR reputation in the aftermath of CSIR in B2B contexts. A vignette is typically
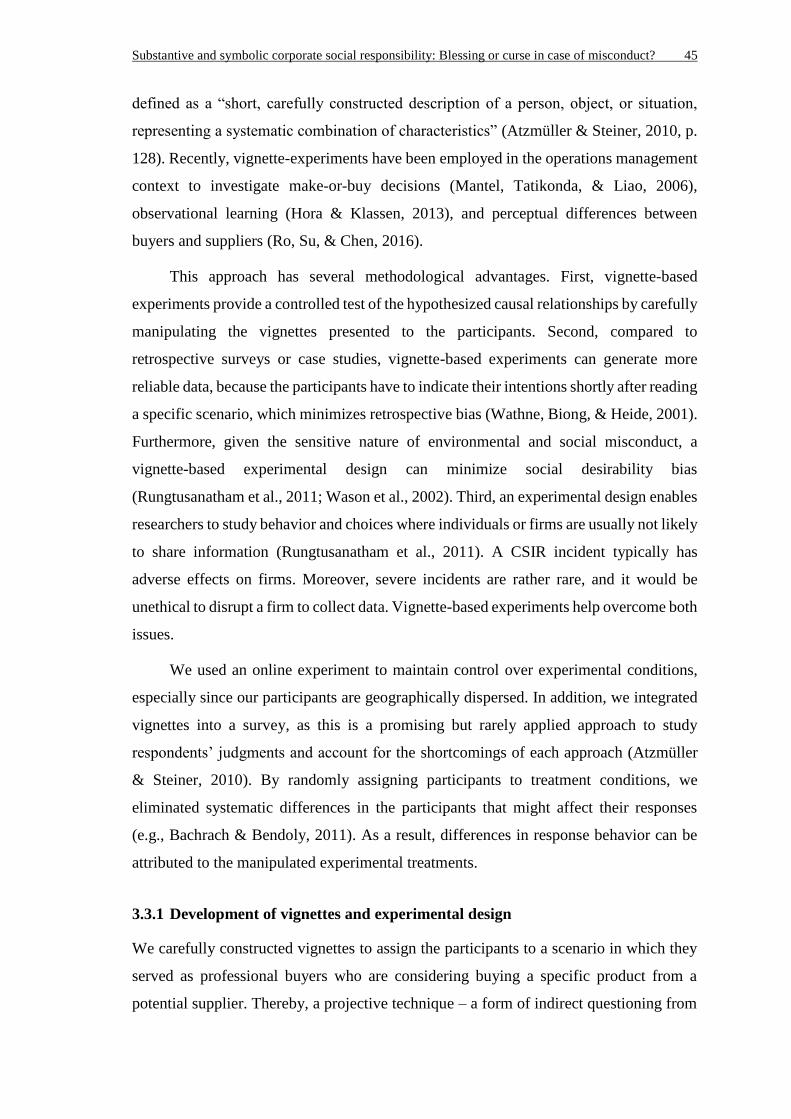
Substantive and symbolic corporate social responsibility: Blessing or curse in case of misconduct? 45
defined as a “short, carefully constructed description of a person, object, or situation,
representing a systematic combination of characteristics” (Atzmüller & Steiner, 2010, p.
128). Recently, vignette-experiments have been employed in the operations management
context to investigate make-or-buy decisions (Mantel, Tatikonda, & Liao, 2006),
observational learning (Hora & Klassen, 2013), and perceptual differences between
buyers and suppliers (Ro, Su, & Chen, 2016).
This approach has several methodological advantages. First, vignette-based
experiments provide a controlled test of the hypothesized causal relationships by carefully
manipulating the vignettes presented to the participants. Second, compared to
retrospective surveys or case studies, vignette-based experiments can generate more
reliable data, because the participants have to indicate their intentions shortly after reading
a specific scenario, which minimizes retrospective bias (Wathne, Biong, & Heide, 2001).
Furthermore, given the sensitive nature of environmental and social misconduct, a
vignette-based experimental design can minimize social desirability bias
(Rungtusanatham et al., 2011; Wason et al., 2002). Third, an experimental design enables
researchers to study behavior and choices where individuals or firms are usually not likely
to share information (Rungtusanatham et al., 2011). A CSIR incident typically has
adverse effects on firms. Moreover, severe incidents are rather rare, and it would be
unethical to disrupt a firm to collect data. Vignette-based experiments help overcome both
issues.
We used an online experiment to maintain control over experimental conditions,
especially since our participants are geographically dispersed. In addition, we integrated
vignettes into a survey, as this is a promising but rarely applied approach to study
respondents’ judgments and account for the shortcomings of each approach (Atzmüller
& Steiner, 2010). By randomly assigning participants to treatment conditions, we
eliminated systematic differences in the participants that might affect their responses
(e.g., Bachrach & Bendoly, 2011). As a result, differences in response behavior can be
attributed to the manipulated experimental treatments.
3.3.1 Development of vignettes and experimental design
We carefully constructed vignettes to assign the participants to a scenario in which they
served as professional buyers who are considering buying a specific product from a
potential supplier. Thereby, a projective technique – a form of indirect questioning from
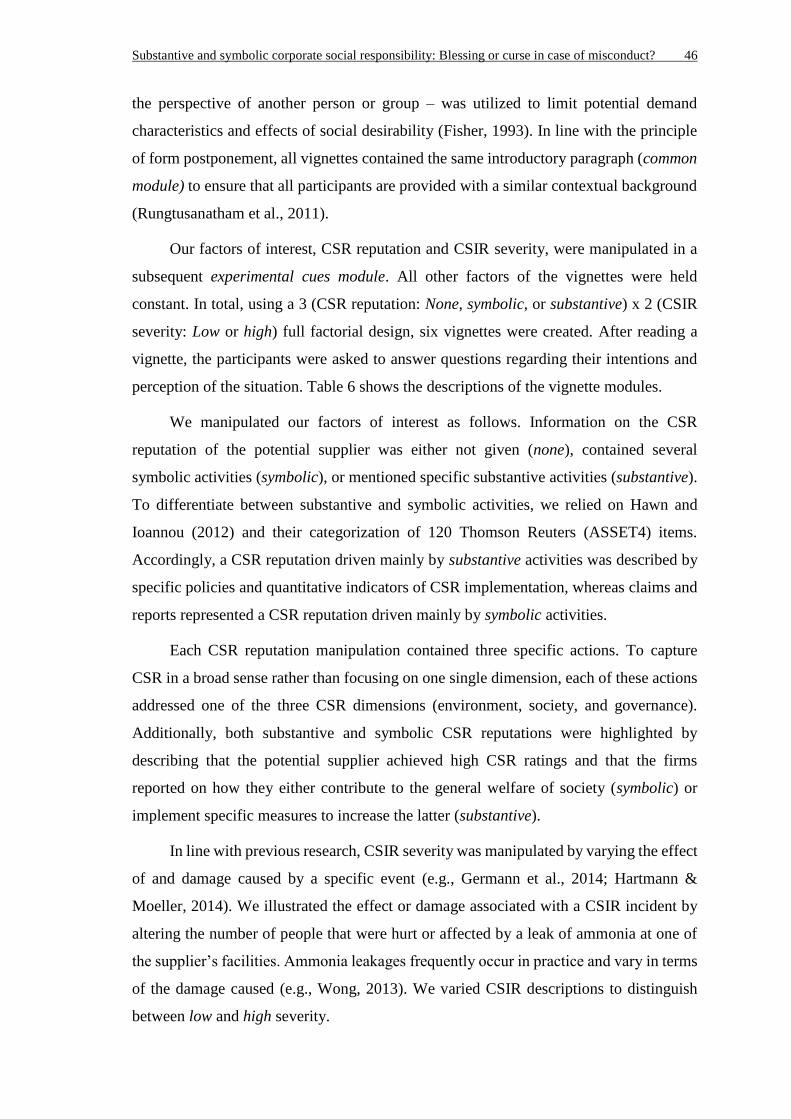
Substantive and symbolic corporate social responsibility: Blessing or curse in case of misconduct? 46
the perspective of another person or group – was utilized to limit potential demand
characteristics and effects of social desirability (Fisher, 1993). In line with the principle
of form postponement, all vignettes contained the same introductory paragraph (common
module) to ensure that all participants are provided with a similar contextual background
(Rungtusanatham et al., 2011).
Our factors of interest, CSR reputation and CSIR severity, were manipulated in a
subsequent experimental cues module. All other factors of the vignettes were held
constant. In total, using a 3 (CSR reputation: None, symbolic, or substantive) x 2 (CSIR
severity: Low or high) full factorial design, six vignettes were created. After reading a
vignette, the participants were asked to answer questions regarding their intentions and
perception of the situation. Table 6 shows the descriptions of the vignette modules.
We manipulated our factors of interest as follows. Information on the CSR
reputation of the potential supplier was either not given (none), contained several
symbolic activities (symbolic), or mentioned specific substantive activities (substantive).
To differentiate between substantive and symbolic activities, we relied on Hawn and
Ioannou (2012) and their categorization of 120 Thomson Reuters (ASSET4) items.
Accordingly, a CSR reputation driven mainly by substantive activities was described by
specific policies and quantitative indicators of CSR implementation, whereas claims and
reports represented a CSR reputation driven mainly by symbolic activities.
Each CSR reputation manipulation contained three specific actions. To capture
CSR in a broad sense rather than focusing on one single dimension, each of these actions
addressed one of the three CSR dimensions (environment, society, and governance).
Additionally, both substantive and symbolic CSR reputations were highlighted by
describing that the potential supplier achieved high CSR ratings and that the firms
reported on how they either contribute to the general welfare of society (symbolic) or
implement specific measures to increase the latter (substantive).
In line with previous research, CSIR severity was manipulated by varying the effect
of and damage caused by a specific event (e.g., Germann et al., 2014; Hartmann &
Moeller, 2014). We illustrated the effect or damage associated with a CSIR incident by
altering the number of people that were hurt or affected by a leak of ammonia at one of
the supplier’s facilities. Ammonia leakages frequently occur in practice and vary in terms
of the damage caused (e.g., Wong, 2013). We varied CSIR descriptions to distinguish
between low and high severity.
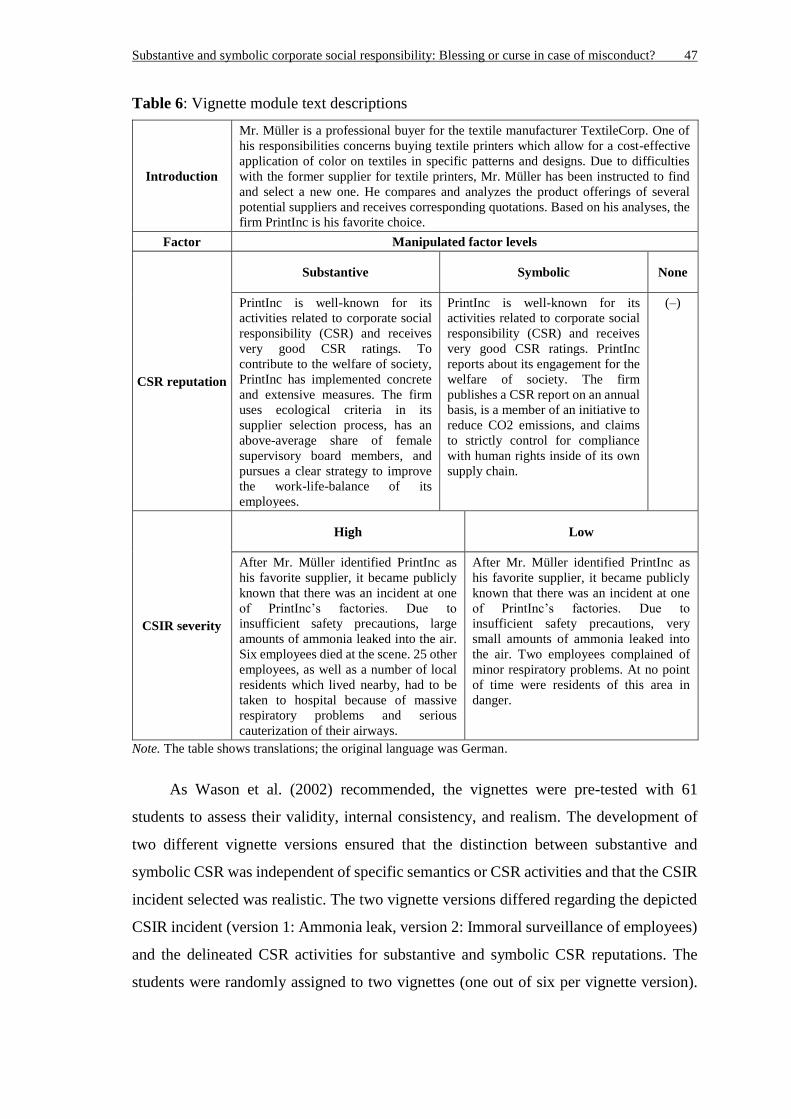
Substantive and symbolic corporate social responsibility: Blessing or curse in case of misconduct? 47
Table 6: Vignette module text descriptions
Introduction
Mr. Müller is a professional buyer for the textile manufacturer TextileCorp. One of
his responsibilities concerns buying textile printers which allow for a cost-effective
application of color on textiles in specific patterns and designs. Due to difficulties
with the former supplier for textile printers, Mr. Müller has been instructed to find
and select a new one. He compares and analyzes the product offerings of several
potential suppliers and receives corresponding quotations. Based on his analyses, the
firm PrintInc is his favorite choice.
Factor Manipulated factor levels
CSR reputation
Substantive Symbolic None
PrintInc is well-known for its
activities related to corporate social
responsibility (CSR) and receives
very good CSR ratings. To
contribute to the welfare of society,
PrintInc has implemented concrete
and extensive measures. The firm
uses ecological criteria in its
supplier selection process, has an
above-average share of female
supervisory board members, and
pursues a clear strategy to improve
the work-life-balance of its
employees.
PrintInc is well-known for its
activities related to corporate social
responsibility (CSR) and receives
very good CSR ratings. PrintInc
reports about its engagement for the
welfare of society. The firm
publishes a CSR report on an annual
basis, is a member of an initiative to
reduce CO2 emissions, and claims
to strictly control for compliance
with human rights inside of its own
supply chain.
(–)
CSIR severity
High Low
After Mr. Müller identified PrintInc as
his favorite supplier, it became publicly
known that there was an incident at one
of PrintInc’s factories. Due to
insufficient safety precautions, large
amounts of ammonia leaked into the air.
Six employees died at the scene. 25 other
employees, as well as a number of local
residents which lived nearby, had to be
taken to hospital because of massive
respiratory problems and serious
cauterization of their airways.
After Mr. Müller identified PrintInc as
his favorite supplier, it became publicly
known that there was an incident at one
of PrintInc’s factories. Due to
insufficient safety precautions, very
small amounts of ammonia leaked into
the air. Two employees complained of
minor respiratory problems. At no point
of time were residents of this area in
danger.
Note. The table shows translations; the original language was German.
As Wason et al. (2002) recommended, the vignettes were pre-tested with 61
students to assess their validity, internal consistency, and realism. The development of
two different vignette versions ensured that the distinction between substantive and
symbolic CSR was independent of specific semantics or CSR activities and that the CSIR
incident selected was realistic. The two vignette versions differed regarding the depicted
CSIR incident (version 1: Ammonia leak, version 2: Immoral surveillance of employees)
and the delineated CSR activities for substantive and symbolic CSR reputations. The
students were randomly assigned to two vignettes (one out of six per vignette version).
Substantive and symbolic corporate social responsibility: Blessing or curse in case of misconduct? 48
After reading a vignette, the students were supposed to indicate their purchase intention
(PI) and intention to engage in nWOM.
In addition, the students responded to manipulation check items to ensure that the
representations of different levels of CSR reputation and CSIR severity were appropriate.
For both vignette versions, the mean responses differed significantly across different
levels of our manipulated variables. In the pre-test, the students also rated the degree of
realism of the vignettes on a seven-point scale (1 = “not at all” to 7 = “totally”). The
results suggested that the scenarios appeared realistic and the six different vignettes of
version 1 were perceived as slightly more realistic compared to the vignettes of version
2. The mean responses to the six different vignettes of version 1 ranged from 4.8 to 6.1
(5.6 on average) while the means for those of version 2 ranged from 4.4 to 6.0 (5.2 on
average). Consequently, vignette version 1 was selected for data collection. Minor
modifications after the pre-test refined the clarity and wording of manipulations.
3.3.2 Study participants
Between March and June 2017, the data were collected by means of a self-administered
online experiment. Contact addresses were obtained from a commercial business data
provider. The participants of our experiment were full-time working professionals with
direct experience in supply chain management working for firms from 15 different
industries in Germany, Austria, and Switzerland. The subjects received an invitation via
e-mail and they were randomly assigned to one of the six treatment conditions. Out of the
1064 managers invited, 153 managers (16.3% female) completed the experiment,
resulting in an effective response rate of 14.4%. Inconsistent participation duration led to
the exclusion of five observations. Box plots of the outcome variables showed 13 visible
outliers (Tukey, 1977). In line with prior research (Aguinis, Gottfredson, & Joo, 2013;
Raaijmakers, Vermeulen, Meeus, & Zietsma, 2015), these were excluded from further
analyses resulting in a full sample of 135 usable scenarios. On average, the participants
had almost 17 years of experience in supply chain management (SD = 10.62).
3.3.3 Measures
We focused on two distinct customer outcomes as dependent variables, purchase
intention and intention to engage in nWOM. The measures described in the following
Substantive and symbolic corporate social responsibility: Blessing or curse in case of misconduct? 49
subsection utilize seven-point rating scales (ranging from 1 := “not at all” to 7 :=
“totally”).
Purchase intention (PI). Purchase decisions are typically binary, as one can either
buy or not buy. The use of a binary variable in an experiment, however, results in a
dependent variable with little variance to explain. This would considerably limit the
ability to understand the effects of our independent variables on the participants’
intentions (McKelvie, Haynie, & Gustavsson, 2011). In line with previous research, we
therefore operationalized PI as one of our dependent variables measured on a Likert-type
scale and asked the participants to indicate how likely they would be to buy the respective
product if they were the decision maker described in the scenario (e.g., Sen &
Bhattacharya, 2001; Wilcox, Kim, & Sen, 2009). We thereby followed the
recommendations to use single-item measures for doubly concrete constructs, such as PI
(Bergkvist & Rossiter, 2007). Doubly concrete constructs have both a clear object (e.g.,
a product) and a single-meaning attribute (e.g., willingness to buy).
Intention to engage in nWOM. As a further dependent variable, we measured the
extent to which participants would be willing to engage in nWOM (M = 1.96, SD = 1.23;
α = 0.82) after reading a given scenario (Richins, 1983; Singh, 1990). To this end, the
participants responded to three items, which we adapted to our vignettes from recent
research in the CSR context (Antonetti & Maklan, 2016). The three items reflect an
individual’s willingness to spread negative information about the specific supplier
involved in CSIR.
Given the sensitivity of the investigated topic, and to be able to investigate the
influence of personal attitudes towards CSR on the behavior of the participants, we also
measured their level of CSR support (M = 5.15, SD = 1.12; α = 0.75) using an adapted
five-item scale at the end of the experiment (e.g., Ramasamy, Yeung, & Au, 2010). The
participants had to indicate the degree to which they were (1) willing to pay more to buy
products from a socially responsible firm, (2) considering the ethical reputation of
business when they shop, (3) avoiding to buy products from firms that have engaged in
immoral actions, (4) willing to pay more to buy products of a company that shows
engagement for the well-being of our society, and (5) willing to rather buy from a firm
with a socially responsible reputation, if the price and quality of two products are similar.
Finally, the respondents provided standard demographic information (gender), firm
Substantive and symbolic corporate social responsibility: Blessing or curse in case of misconduct? 50
related information (industry), and their experience in the field of supply chain
management (in years).
The psychometric properties of the two reflective scales (nWOM and CSR support)
were assessed using a covariance-based confirmatory factor analysis (CFA). The
measurement model resulted in an acceptable fit to the data, given the relatively small
sample size (Hair et al., 2009): χ2(19) = 45.76 with p = 0.001 (χ2/df = 2.41), CFI= 0.94,
TLI = 0.91, SRMR = 0.083, and RMSEA = 0.102 (90% confidence interval CI = [0.065,
0.140]). Moreover, all items showed large and statistically significant factor loadings on
their hypothesized factor (p < 0.05 for all loadings). Composite reliability for both
constructs (0.86 for nWOM and 0.75 for CSR support) exceeded the cut-off value of 0.70.
The average variance extracted (AVE) values were 0.67 for nWOM and 0.42 for CSR
support; thus, above or slightly below the 0.5-threshold. Since both constructs extracted
more variance than they share with each other (Pearson correlation coefficient r = –0.10;
r2 = 0.01), discriminant validity was supported. Given these results, the following
analyses use scale averages.
3.3.4 Manipulation checks
As in the pre-test, we verified that our manipulations of the independent variables worked
as intended. To this end, all participants responded to several manipulation check
questions after reading a vignette. The item for CSIR severity asked participants to rate
whether the incident was very severe or not on a seven-point Likert-type scale. The
respondents’ perception of CSIR severity was significantly lower for vignettes that
described a CSIR incident with low severity than for vignettes containing a description
of a CSIR incident of high severity (Mlow = 3.92, Mhigh = 6.58; t(133), p < 0.001). Another
item asked the participants whether they had received information on the supplier’s CSR
reputation before the CSIR incident happened. Almost 84% of the participants who had
received information on CSR correctly responded to this question. If a respondent
answered this question with yes, another item appeared on the screen, which specifically
asked for the perceived nature of the CSR reputation on a seven-point scale (1 := “mainly
symbolic” to 7 := “mainly substantive”). To ensure that all participants had the same
information on how to distinguish substantive from symbolic CSR activities, we provided
a brief explanation to delineate that substantive CSR does involve concrete change of
business practices while symbolic CSR does not. The participants’ responses were
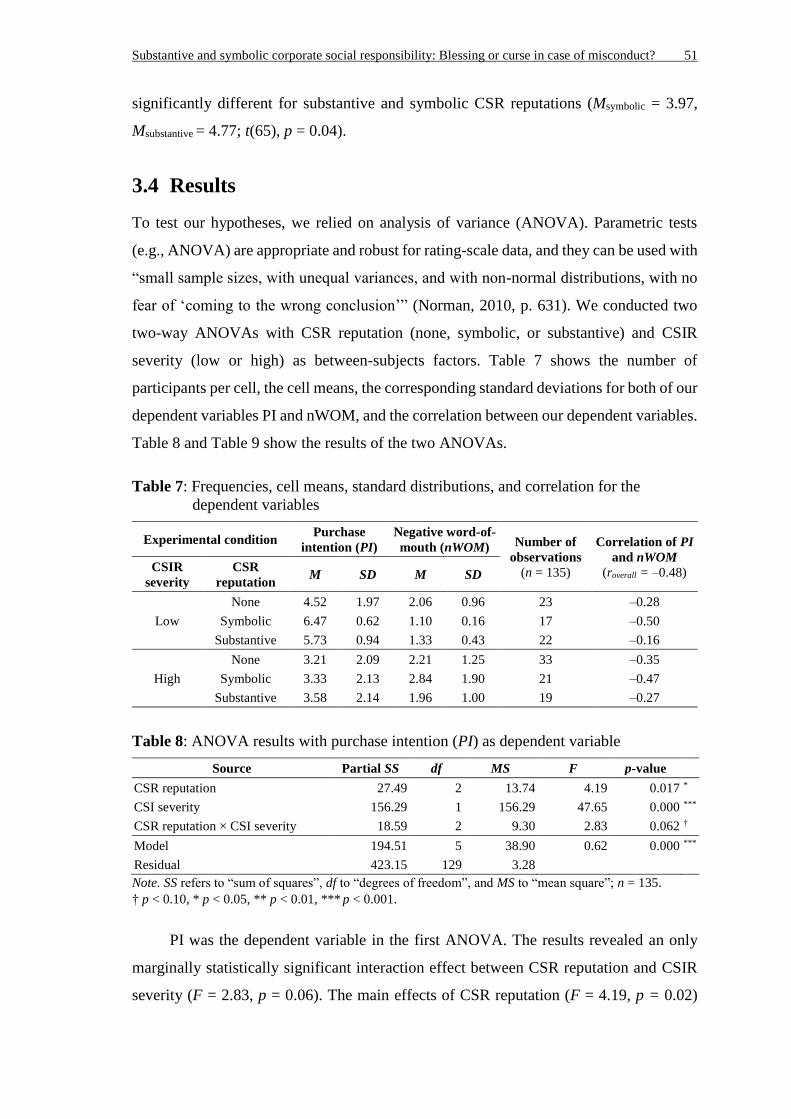
Substantive and symbolic corporate social responsibility: Blessing or curse in case of misconduct? 51
significantly different for substantive and symbolic CSR reputations (Msymbolic = 3.97,
Msubstantive = 4.77; t(65), p = 0.04).
3.4 Results
To test our hypotheses, we relied on analysis of variance (ANOVA). Parametric tests
(e.g., ANOVA) are appropriate and robust for rating-scale data, and they can be used with
“small sample sizes, with unequal variances, and with non-normal distributions, with no
fear of ‘coming to the wrong conclusion’” (Norman, 2010, p. 631). We conducted two
two-way ANOVAs with CSR reputation (none, symbolic, or substantive) and CSIR
severity (low or high) as between-subjects factors. Table 7 shows the number of
participants per cell, the cell means, the corresponding standard deviations for both of our
dependent variables PI and nWOM, and the correlation between our dependent variables.
Table 8 and Table 9 show the results of the two ANOVAs.
Table 7: Frequencies, cell means, standard distributions, and correlation for the
dependent variables
Experimental condition Purchase
intention (PI)
Negative word-of-
mouth (nWOM) Number of
observations
(n = 135)
Correlation of PI
and nWOM
(roverall = –0.48) CSIR
severity
CSR
reputation M SD M SD
Low
None 4.52 1.97 2.06 0.96 23 –0.28
Symbolic 6.47 0.62 1.10 0.16 17 –0.50
Substantive 5.73 0.94 1.33 0.43 22 –0.16
High
None 3.21 2.09 2.21 1.25 33 –0.35
Symbolic 3.33 2.13 2.84 1.90 21 –0.47
Substantive 3.58 2.14 1.96 1.00 19 –0.27
Table 8: ANOVA results with purchase intention (PI) as dependent variable
Source Partial SS df MS F p-value
CSR reputation 27.49 2 13.74 4.19 0.017 *
CSI severity 156.29 1 156.29 47.65 0.000 ***
CSR reputation × CSI severity 18.59 2 9.30 2.83 0.062 †
Model 194.51 5 38.90 0.62 0.000 ***
Residual 423.15 129 3.28
Note. SS refers to “sum of squares”, df to “degrees of freedom”, and MS to “mean square”; n = 135.
† p < 0.10, * p < 0.05, ** p < 0.01, *** p < 0.001.
PI was the dependent variable in the first ANOVA. The results revealed an only
marginally statistically significant interaction effect between CSR reputation and CSIR
severity (F = 2.83, p = 0.06). The main effects of CSR reputation (F = 4.19, p = 0.02)
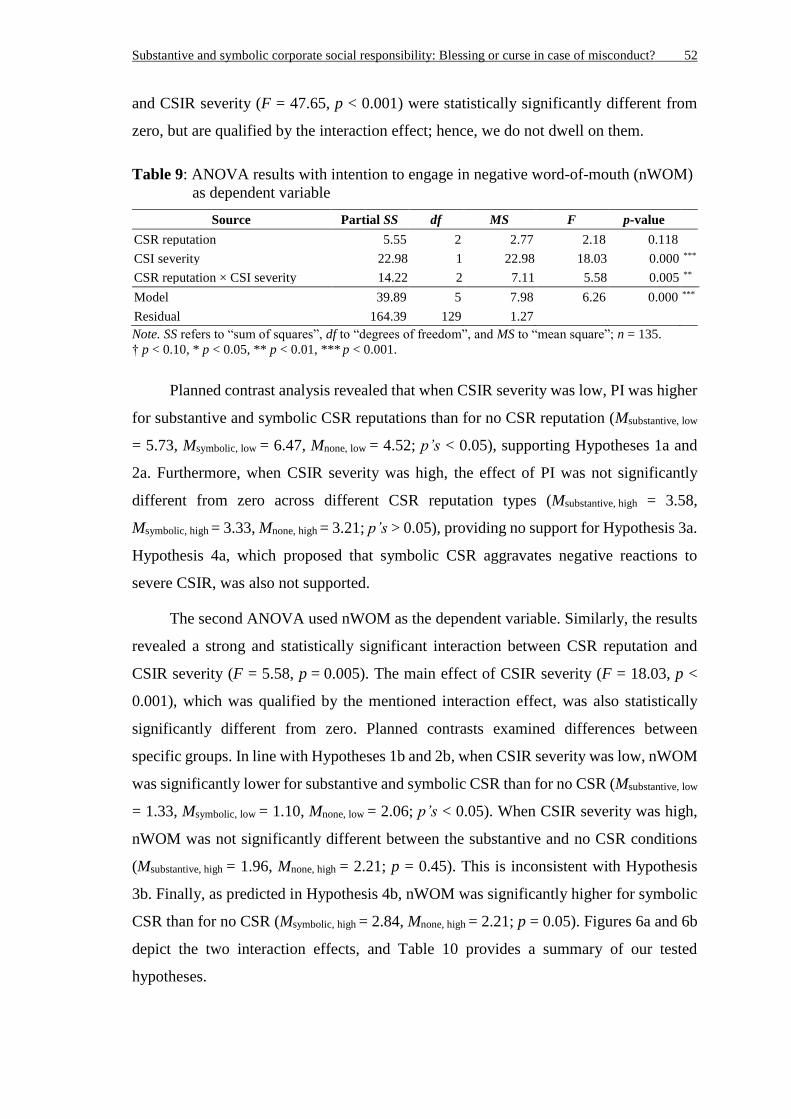
Substantive and symbolic corporate social responsibility: Blessing or curse in case of misconduct? 52
and CSIR severity (F = 47.65, p < 0.001) were statistically significantly different from
zero, but are qualified by the interaction effect; hence, we do not dwell on them.
Table 9: ANOVA results with intention to engage in negative word-of-mouth (nWOM)
as dependent variable
Source Partial SS df MS F p-value
CSR reputation 5.55 2 2.77 2.18 0.118
CSI severity 22.98 1 22.98 18.03 0.000 ***
CSR reputation × CSI severity 14.22 2 7.11 5.58 0.005 **
Model 39.89 5 7.98 6.26 0.000 ***
Residual 164.39 129 1.27
Note. SS refers to “sum of squares”, df to “degrees of freedom”, and MS to “mean square”; n = 135.
† p < 0.10, * p < 0.05, ** p < 0.01, *** p < 0.001.
Planned contrast analysis revealed that when CSIR severity was low, PI was higher
for substantive and symbolic CSR reputations than for no CSR reputation (Msubstantive, low
= 5.73, Msymbolic, low = 6.47, Mnone, low = 4.52; p’s < 0.05), supporting Hypotheses 1a and
2a. Furthermore, when CSIR severity was high, the effect of PI was not significantly
different from zero across different CSR reputation types (Msubstantive, high = 3.58,
Msymbolic, high = 3.33, Mnone, high = 3.21; p’s > 0.05), providing no support for Hypothesis 3a.
Hypothesis 4a, which proposed that symbolic CSR aggravates negative reactions to
severe CSIR, was also not supported.
The second ANOVA used nWOM as the dependent variable. Similarly, the results
revealed a strong and statistically significant interaction between CSR reputation and
CSIR severity (F = 5.58, p = 0.005). The main effect of CSIR severity (F = 18.03, p <
0.001), which was qualified by the mentioned interaction effect, was also statistically
significantly different from zero. Planned contrasts examined differences between
specific groups. In line with Hypotheses 1b and 2b, when CSIR severity was low, nWOM
was significantly lower for substantive and symbolic CSR than for no CSR (Msubstantive, low
= 1.33, Msymbolic, low = 1.10, Mnone, low = 2.06; p’s < 0.05). When CSIR severity was high,
nWOM was not significantly different between the substantive and no CSR conditions
(Msubstantive, high = 1.96, Mnone, high = 2.21; p = 0.45). This is inconsistent with Hypothesis
3b. Finally, as predicted in Hypothesis 4b, nWOM was significantly higher for symbolic
CSR than for no CSR (Msymbolic, high = 2.84, Mnone, high = 2.21; p = 0.05). Figures 6a and 6b
depict the two interaction effects, and Table 10 provides a summary of our tested
hypotheses.
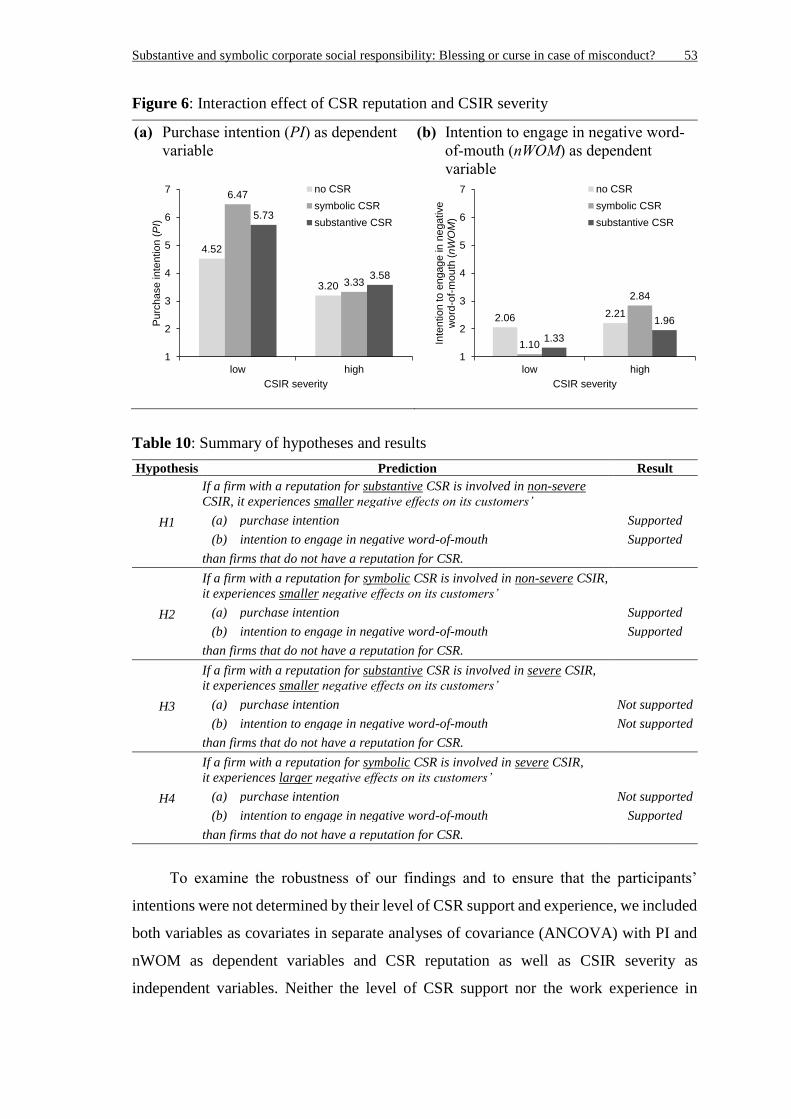
Substantive and symbolic corporate social responsibility: Blessing or curse in case of misconduct? 53
Figure 6: Interaction effect of CSR reputation and CSIR severity
(a) Purchase intention (PI) as dependent
variable
(b) Intention to engage in negative word-
of-mouth (nWOM) as dependent
variable
Table 10: Summary of hypotheses and results
Hypothesis Prediction Result
H1
If a firm with a reputation for substantive CSR is involved in non-severe
CSIR, it experiences smaller negative effects on its customers’
(a) purchase intention Supported
(b) intention to engage in negative word-of-mouth Supported
than firms that do not have a reputation for CSR.
H2
If a firm with a reputation for symbolic CSR is involved in non-severe CSIR,
it experiences smaller negative effects on its customers’
(a) purchase intention Supported
(b) intention to engage in negative word-of-mouth Supported
than firms that do not have a reputation for CSR.
H3
If a firm with a reputation for substantive CSR is involved in severe CSIR,
it experiences smaller negative effects on its customers’
(a) purchase intention Not supported
(b) intention to engage in negative word-of-mouth Not supported
than firms that do not have a reputation for CSR.
H4
If a firm with a reputation for symbolic CSR is involved in severe CSIR,
it experiences larger negative effects on its customers’
(a) purchase intention Not supported
(b) intention to engage in negative word-of-mouth Supported
than firms that do not have a reputation for CSR.
To examine the robustness of our findings and to ensure that the participants’
intentions were not determined by their level of CSR support and experience, we included
both variables as covariates in separate analyses of covariance (ANCOVA) with PI and
nWOM as dependent variables and CSR reputation as well as CSIR severity as
independent variables. Neither the level of CSR support nor the work experience in
4.52
3.20
6.47
3.33
5.73
3.58
1
2
3
4
5
6
7
low high
Pu
rcha
se
inte
ntio
n(P
I)
CSIR severity
no CSR
symbolic CSR
substantive CSR
2.06 2.21
1.10
2.84
1.33
1.96
1
2
3
4
5
6
7
low high
Inte
ntio
n to
en
gage
in n
egative
wo
rd-o
f-m
ou
th(n
WO
M)
CSIR severity
no CSR
symbolic CSR
substantive CSR
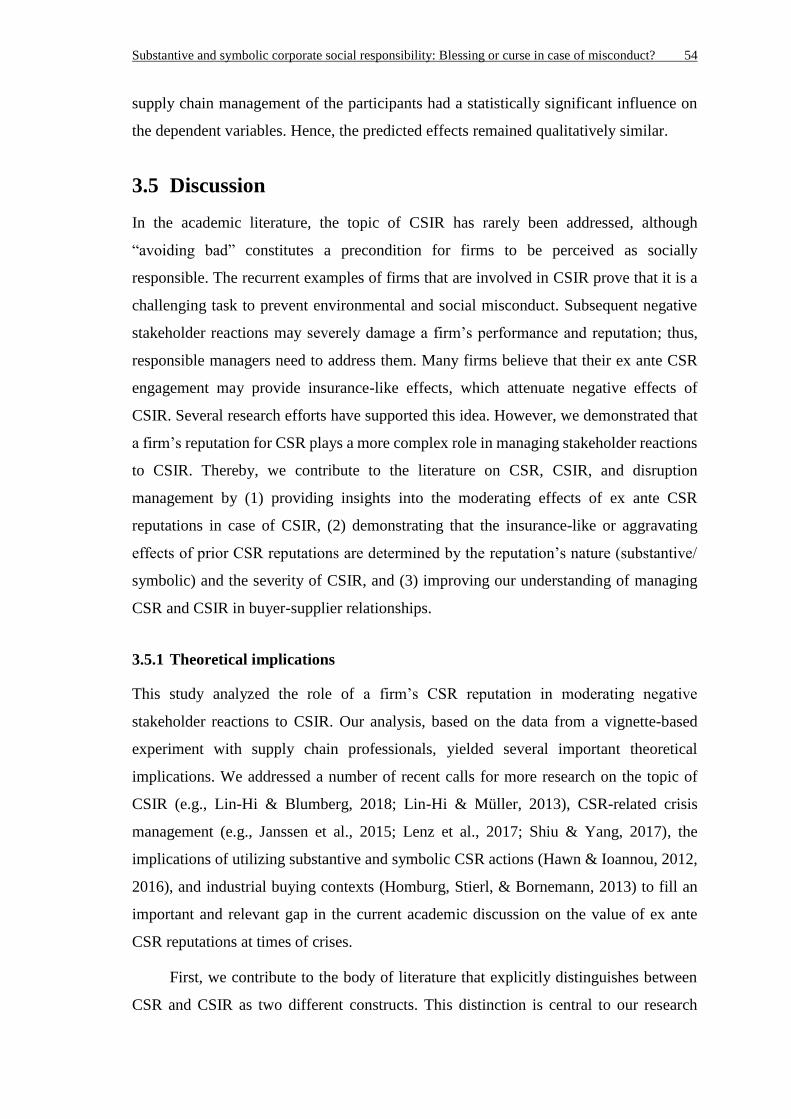
Substantive and symbolic corporate social responsibility: Blessing or curse in case of misconduct? 54
supply chain management of the participants had a statistically significant influence on
the dependent variables. Hence, the predicted effects remained qualitatively similar.
3.5 Discussion
In the academic literature, the topic of CSIR has rarely been addressed, although
“avoiding bad” constitutes a precondition for firms to be perceived as socially
responsible. The recurrent examples of firms that are involved in CSIR prove that it is a
challenging task to prevent environmental and social misconduct. Subsequent negative
stakeholder reactions may severely damage a firm’s performance and reputation; thus,
responsible managers need to address them. Many firms believe that their ex ante CSR
engagement may provide insurance-like effects, which attenuate negative effects of
CSIR. Several research efforts have supported this idea. However, we demonstrated that
a firm’s reputation for CSR plays a more complex role in managing stakeholder reactions
to CSIR. Thereby, we contribute to the literature on CSR, CSIR, and disruption
management by (1) providing insights into the moderating effects of ex ante CSR
reputations in case of CSIR, (2) demonstrating that the insurance-like or aggravating
effects of prior CSR reputations are determined by the reputation’s nature (substantive/
symbolic) and the severity of CSIR, and (3) improving our understanding of managing
CSR and CSIR in buyer-supplier relationships.
3.5.1 Theoretical implications
This study analyzed the role of a firm’s CSR reputation in moderating negative
stakeholder reactions to CSIR. Our analysis, based on the data from a vignette-based
experiment with supply chain professionals, yielded several important theoretical
implications. We addressed a number of recent calls for more research on the topic of
CSIR (e.g., Lin-Hi & Blumberg, 2018; Lin-Hi & Müller, 2013), CSR-related crisis
management (e.g., Janssen et al., 2015; Lenz et al., 2017; Shiu & Yang, 2017), the
implications of utilizing substantive and symbolic CSR actions (Hawn & Ioannou, 2012,
2016), and industrial buying contexts (Homburg, Stierl, & Bornemann, 2013) to fill an
important and relevant gap in the current academic discussion on the value of ex ante
CSR reputations at times of crises.
First, we contribute to the body of literature that explicitly distinguishes between
CSR and CSIR as two different constructs. This distinction is central to our research
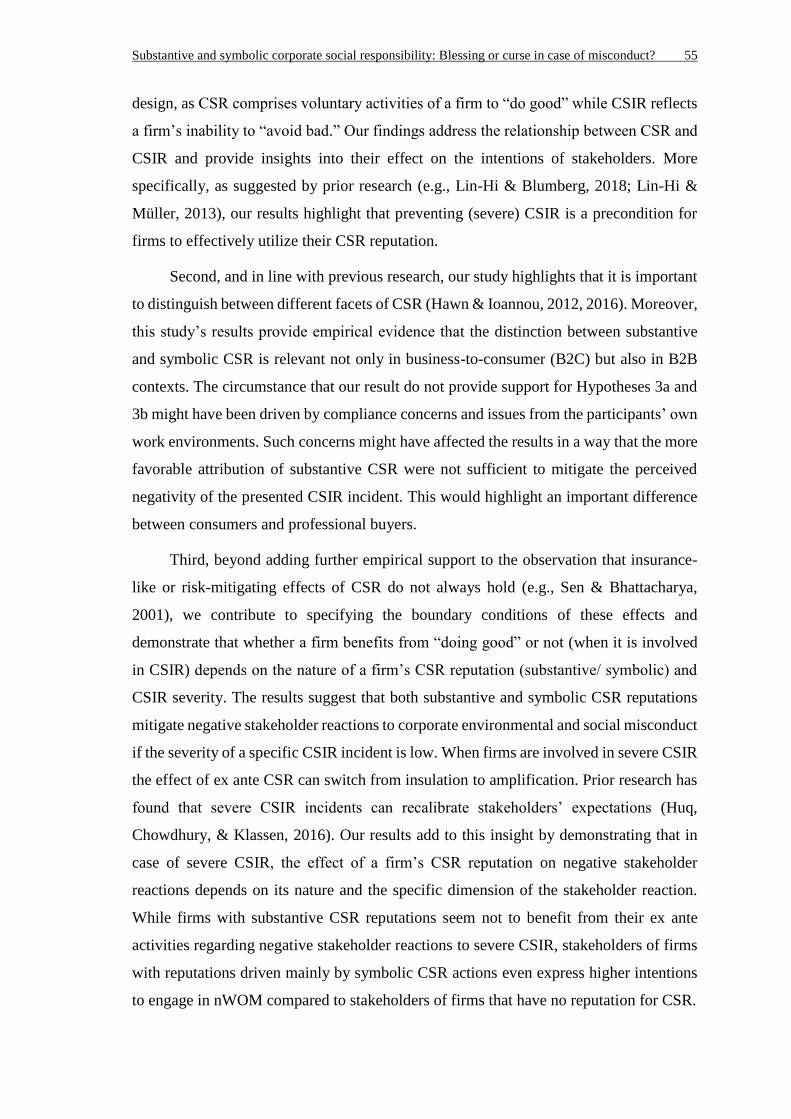
Substantive and symbolic corporate social responsibility: Blessing or curse in case of misconduct? 55
design, as CSR comprises voluntary activities of a firm to “do good” while CSIR reflects
a firm’s inability to “avoid bad.” Our findings address the relationship between CSR and
CSIR and provide insights into their effect on the intentions of stakeholders. More
specifically, as suggested by prior research (e.g., Lin-Hi & Blumberg, 2018; Lin-Hi &
Müller, 2013), our results highlight that preventing (severe) CSIR is a precondition for
firms to effectively utilize their CSR reputation.
Second, and in line with previous research, our study highlights that it is important
to distinguish between different facets of CSR (Hawn & Ioannou, 2012, 2016). Moreover,
this study’s results provide empirical evidence that the distinction between substantive
and symbolic CSR is relevant not only in business-to-consumer (B2C) but also in B2B
contexts. The circumstance that our result do not provide support for Hypotheses 3a and
3b might have been driven by compliance concerns and issues from the participants’ own
work environments. Such concerns might have affected the results in a way that the more
favorable attribution of substantive CSR were not sufficient to mitigate the perceived
negativity of the presented CSIR incident. This would highlight an important difference
between consumers and professional buyers.
Third, beyond adding further empirical support to the observation that insurance-
like or risk-mitigating effects of CSR do not always hold (e.g., Sen & Bhattacharya,
2001), we contribute to specifying the boundary conditions of these effects and
demonstrate that whether a firm benefits from “doing good” or not (when it is involved
in CSIR) depends on the nature of a firm’s CSR reputation (substantive/ symbolic) and
CSIR severity. The results suggest that both substantive and symbolic CSR reputations
mitigate negative stakeholder reactions to corporate environmental and social misconduct
if the severity of a specific CSIR incident is low. When firms are involved in severe CSIR
the effect of ex ante CSR can switch from insulation to amplification. Prior research has
found that severe CSIR incidents can recalibrate stakeholders’ expectations (Huq,
Chowdhury, & Klassen, 2016). Our results add to this insight by demonstrating that in
case of severe CSIR, the effect of a firm’s CSR reputation on negative stakeholder
reactions depends on its nature and the specific dimension of the stakeholder reaction.
While firms with substantive CSR reputations seem not to benefit from their ex ante
activities regarding negative stakeholder reactions to severe CSIR, stakeholders of firms
with reputations driven mainly by symbolic CSR actions even express higher intentions
to engage in nWOM compared to stakeholders of firms that have no reputation for CSR.
Substantive and symbolic corporate social responsibility: Blessing or curse in case of misconduct? 56
For PI, we were not able to find sufficient statistical evidence to show that the
reactions of stakeholders to severe CSIR depend on the CSR reputation. This must not be
interpreted as evidence that there is no effect. Methodological reasons might have
influenced this result. For example, in case of symbolic CSR, contrast effects resulting in
a change of both PI and nWOM might require higher levels of CSIR severity. Similarly,
the chosen description of high severity might already represent a level too high for
substantive CSR to result in assimilation effects. The incident described in our
experimental material might have been too severe to be attenuated by favorable
attributions of a firm’s CSR motives. However, a possible explanation for the lack of
evidence to support Hypothesis 4a is that for an individual’s PI, it might not be relevant
whether substantive or symbolic CSR engagement has formed stakeholder expectations.
In case of severe CSIR, the disparity between a customer’s expectations and a firm’s true
performance might be perceived as similar for both substantive and symbolic actions
since they can also be equally successful in gaining legitimacy and fostering expectations.
Customers might be more willing to share the disconfirmation of their expectations if
firms used symbolic actions instead of no CSR engagement to affect their expectations
based on the perceived motives of a firm’s CSR engagement. Once ex ante CSR efforts
are identified as greenwashing, they cast doubt on a customer’s prior expectations. To
prevent others within their peer group from building high expectations based on symbolic
CSR engagement, customers seem to be more willing to engage in nWOM than if the
expectations were based on substantive CSR or no CSR engagement at all.
Finally, our findings enhance our understanding of the impact of CSR on industrial
buying situations. To the best of our knowledge, this is the first study that explicitly
addresses the role played by ex ante CSR reputations on CSIR-related disruption
management in a B2B environment. Previous research has highlighted that many decision
makers might not be aware of the benefits associated with CSR-related activities along
their firms’ supply chains (Paulraj, Chen, & Blome, 2017), but we provide empirical
support for implementing CSR based on instrumental rather than moral motives.
Moreover, prior studies have focused on the B2C perspective and important consumer
outcomes, such as satisfaction and loyalty. Although these findings may partially hold
true in B2B contexts, it is well-researched that professional buyers differ considerably
from consumers. Thus, we focused on customer outcomes, considered characteristics of
industrial buying, and addressed a highly relevant topic because our research is among
Substantive and symbolic corporate social responsibility: Blessing or curse in case of misconduct? 57
the first studies to empirically analyze positive effects of CSR actions in industrial buying
contexts (Homburg et al., 2013). As firms are increasingly held responsible for
misconduct within their supply chain, the implications of our study extend previous work
by emphasizing that not only firms which are positioned downstream the supply chain
can considerably benefit from CSR but also those which are further upstream and less
visible to consumers (C. G. Schmidt, Foerstl, & Schaltenbrand, 2017).
3.5.2 Managerial implications
Several implications for managerial practice can be deduced from the results. Given the
study’s focus on industrial buying contexts, a key insight is that CSR engagement is
worthwhile not only in B2C but also in B2B contexts. Both substantive and symbolic
CSR reputations can have insurance-like effects in case of non-severe CSIR in industrial
buying situations. This provides a strong justification for managers to pursue an
intensified engagement in CSR to benefit from mitigated negative stakeholder reactions
in case of misconduct. In addition, the study’s findings underline the necessity of
managers to proactively reflect on different stakeholders and their expectations, as
delineated in previous work (Gualandris, Klassen, Vachon, & Kalchschmidt, 2015).
However, our results suggest that engaging in CSR without considering the nature of the
specific actions can backfire in times of crises. Customers can distinguish between
substantive and symbolic actions, which has important repercussions on their behavior.
CSR reputations based on symbolic actions cannot fully avoid more intense negative
stakeholder reactions when a firm is involved in severe CSIR. Thus, managers should be
aware of the nature of their firm’s own CSR engagement. Prior research highlights that
the decision to pursue substantive or symbolic CSR activities depends on cost-benefit
considerations (e.g., Christmann & Taylor, 2006; Durand et al., 2017; Kaul & Luo, 2018).
However, based on our results, if the expected probability of severe environmental or
social misconduct is considerably high, managers should be careful about addressing
stakeholder demands with potentially backfiring symbolic CSR actions. In this case,
managers might rather decide to invest in substantive CSR activities instead. Compared
to merely symbolic CSR claims that do not entail specific changes in business processes,
substantive CSR has the potential to mitigate environmental and social risk while offering
insurance-like effects if a firm is involved in non-severe CSIR.
Substantive and symbolic corporate social responsibility: Blessing or curse in case of misconduct? 58
In addition, our findings suggest that managers who decide to engage merely in
“doing good” to develop a firm’s reputation for CSR might not always benefit from a
competitive advantage over firms that provide similar products but do not have a
reputation for CSR. When (potential) customers are confronted with a supplier’s
involvement in severe CSIR, firms with CSR reputations driven by substantive CSR
actions seem to perform just as good as firms that do not have a reputation for CSR. Firms
that engage mainly in symbolic actions might even have a disadvantage and suffer more
than do firms that do not promote themselves as socially responsible. This underlines the
need for managers to also consider “avoiding bad” as a precondition to benefit from
voluntary CSR engagement. Hence, more attention, effort, and resources should be
invested in mitigating the risk that CSIR occurs within their firms’ supply network to
effectively utilize a firm’s reputation for CSR, since engaging in CSR does not
automatically provide protection against negative stakeholder reactions.
3.5.3 Limitations and future research opportunities
This study and its findings are subject to certain limitations, which provide fruitful
avenues for future research. The participants examined scenarios containing information
about a specific one-shot buying situation describing a potential supplier’s CSR
reputation and involvement in CSIR. In real industrial buying processes, the participants
are likely to receive such information in a more fragmented fashion, perhaps over multiple
time periods. Moreover, we focused on individuals with centralized decision making
authority and one single supplier option to choose from, which might often deviate from
organizational practice. Thus, further research should account for the dynamics of
organizational buying processes and buying decisions of teams while considering
multiple supplier options would add to further support the validity and generalizability of
our findings. In addition, field experiments investigating the effect of CSR reputations on
stakeholder reactions to CSIR would also contribute an increased generalizability of our
findings, although we carefully designed our experiment to provide externally valid
results. This is especially important, because the use of vignettes enabled us to analyze
only the participants’ intentions rather than their actual behaviors. Still, ample empirical
evidence suggests that intentions may serve as reliable indicators of actual behavior (e.g.,
Ajzen, 1991; T. L. Webb & Sheeran, 2006).

Substantive and symbolic corporate social responsibility: Blessing or curse in case of misconduct? 59
In the manipulations of CSR reputations, we have focused on describing firms with
and without a reputation for CSR. This means that we kept the “strength” of a reputation
for CSR constant. Future research might investigate whether the effects described in our
study can be replicated with reputations of different strength. To generate insurance-like
effects, reputations for CSR might have to exceed a certain threshold of power. Prior
research, for instance, has highlighted that short histories of CSR engagement are not
sufficient to mitigate negative stakeholder reactions to CSIR (Vanhamme & Grobben,
2009).
This study took a single episode perspective, although firms might be involved in
several recurring incidents of environmental and social misconduct over time. A
promising direction for future research is to investigate whether and how a reputation for
CSR immunizes against CSIR in multi-period settings. For example, initial insurance-
like effects of reputations for CSR could end up having an aggravation effect in case of
recurring involvement in CSIR. Customers might tolerate minor isolated performance
deviations from their expectations, but once a firm is involved in several cascading CSIR
incidents, its CSR reputation might not provide protection anymore and could, on the
contrary, lead to aggravated negative reactions. Just recently, Shiu and Yang (2017)
reported diminishing insurance-like effects of CSR. However, as they did not distinguish
between substantive and symbolic CSR engagement and focused on investors, some open
questions regarding the evanescence of the insurance-like mechanism of ex ante CSR
remain.
Moreover, the effects of substantive and symbolic CSR on negative stakeholder
reactions might be closely related to trust. Trust might affect an individual’s effort used
to distinguish substantive from merely symbolic CSR while a customer’s perception of a
firm’s CSR might influence the effect of service failure on customer trust (Bozic, 2017;
Choi & La, 2013). Hence, exploring how trust affects the moderating role of CSR
regarding the link between CSIR and negative stakeholder reactions is a promising
avenue for future research.
Another interesting avenue for future research could be to investigate whether
professional buyers differ considerably from consumers regarding how they react to firms
with a reputation for CSR that are involved into CSIR. On the one hand, consumers might
react even more negatively to severe misconduct, regardless of the nature of a firm’s CSR
reputation, especially if switching costs are low. On the other hand, whether a large
Substantive and symbolic corporate social responsibility: Blessing or curse in case of misconduct? 60
disparity between expectations and a firm’s true performance will be tolerated might
depend on the loyalty of a consumer. In addition, the behavior of professional buyers is
subject to corporate governance rules and standard operating procedures that determine
compliant behavior. These constraints might limit the response options or even dictate a
specific behavior. This aspect has not been considered in our experimental design.
Another limitation of this study is the relatively moderate sample size. Of special
interest for future research could be the potential boomerang effects regarding Hypothesis
4b. This study indicates that symbolic CSR engagement can potentially backfire
following CSIR but it does not analyze the underlying cause of this effect in more detail.
More specifically, subsequent studies might investigate why symbolic CSR merely led to
more negative stakeholder reactions concerning nWOM but not PI. In addition and
closely related to the aforementioned issue, for PI as dependent variable, conclusions
based on our results need to be drawn with caution due to the limited evidence provided
by the only marginally significant interaction effect of CSR reputation and CSIR severity.
Hence, to achieve a higher generalizability regarding the generated insights, we
encourage the validation of our results using a larger sample.
Finally, choice behavior might also vary with the cultural background of
respondents. We chose to limit the empirical study to Germany, Austria, and Switzerland,
because from a cultural perspective, these three countries are usually considered to be
very similar and homogeneous (Hofstede, 1984, 2003). A relevant next step would be to
scrutinize the robustness of the effects across different cultural regions. People from
North America, for example, differ from the population sampled in this study in that they
display lower uncertainty avoidance and higher degree of individualism. It could be
conjectured that North American supply chain professionals are less affected by the
uncertainty created by the discrepancy between a firm’s CSR reputation a case of
misconduct (lower uncertainty avoidance), although at the same time, they could be less
willing to engage in negative word-of-mouth (higher degree of individualism).
Supply disruption management: The early bird catches the worm, but the second mouse gets the cheese? 61
Chapter 4 Supply disruption management: The
early bird catches the worm, but the
second mouse gets the cheese?
Co-author:
Christoph Bode
Endowed Chair of Procurement, Business School, University of Mannheim, Germany
Abstract6
In the direct aftermath of supply disruptions, managers typically face uncertainty in the
form of incomplete or unreliable information about the consequences of possible response
actions. To gain a better understanding of how to recover from disruptions and support
effective disruption management, this study pursues a multi-method research approach.
First, we propose an agent-based simulation model of supply disruption responses and
recovery processes to reveal how managers should behave. Based on this model, we
analyze the performance outcomes of a decision maker’s tendency to reduce uncertainty
by collecting further information before taking action (ready-aim-fire) or to act
immediately (ready-fire-aim) under different conditions. Second, vignette-based
experiments with supply chain professionals are conducted to show how managers
actually intend to behave in supply disruption recovery. The findings suggest that
managers' intentions deviate from how they should behave and that quick reactions to
disruptions can be beneficial, even if the exact consequences of a response action cannot
precisely be determined. Furthermore, in complex environments, ready-fire-aim leads to
a better average performance than ready-aim-fire, if response uncertainty is not very high.
The derived insights provide novel theoretical and managerial implications for effective
disruption management.
6 Merath, M. and Bode, C., 2018. Supply disruption management: The early bird catches the worm, but the
second mouse gets the cheese? Unpublished Working Paper, 1-45. An earlier version won the “Chan Hahn
Best Paper Award” of the Operations and Supply Chain Management Division of the Academy of
Management at the Annual Meeting in Atlanta, GA, in 2017.
Supply disruption management: The early bird catches the worm, but the second mouse gets the cheese? 62
4.1 Introduction
Supply chain disruptions are defined as “unplanned and unanticipated events that disrupt
the normal flow of goods and materials within a supply chain […] and, as a consequence,
expose firms within the supply chain to operational and financial risks” (Craighead et al.,
2007, p. 132). In the last decades, firms’ risk of being harmed by disruptions seems to
have increased (Sodhi, Son, & Tang, 2012). On the one hand, modern supply chains have
evolved into more complex and vulnerable interconnected networks (Bode & Wagner,
2015). On the other hand, natural disasters are becoming more frequent (Munich Re,
2015).
Many types of supply chain disruptions – especially those characterized by high
impact and low probability – cannot be completely avoided. The decisions that managers
take in response to severe disruptions inevitably affect the success of a firm’s recovery,
as demonstrated by the often-cited Albuquerque fire (Latour, 2001). On March 17, 2000,
a Philips plant in Albuquerque, New Mexico, was hit by lightning and caught fire.
Initially, it seemed that the damage would be limited. Philips informed the two main
customers of the chips produced in this plant, Nokia and Ericsson, about an expected
delivery delay of one week. Yet, the responses of the two competitors were completely
different. Nokia reacted directly, put pressure on Philips, and collaborated with
alternative suppliers to rebound from the disruption with minimal negative consequences.
Ericsson adopted a “wait and see” approach and delayed remedial action until more
information became available. When it was clear that the damage to the clean rooms was
far more substantial than expected, Ericsson was not able to find an alternative supplier
on short notice and had to delay the launch of a new product while losing market share to
Nokia (Latour, 2001; Sheffi, 2005).
The possible losses that supply chain disruptions may entail are well-researched
(Hendricks & Singhal, 2005a,b), but the process of reactive supply disruption
management has received only limited research attention. In particular, our understanding
of how firms should respond to supply chain disruptions in order to quickly recover is
weak (Bode et al., 2011; Macdonald & Corsi, 2013). This issue is important, because a
firm’s ability to effectively respond to sudden disruptions is critical to both its short-term
performance and long-term competitiveness.
Supply disruption management: The early bird catches the worm, but the second mouse gets the cheese? 63
Responding to disruptions usually requires decision making in complex
environments characterized by uncertainty and limited information. Under these
conditions, some firms defer actions until (most of) the uncertainty has been resolved and
reliable information is available, while other firms respond immediately, even though the
information at hand is cloudy (Kleinmuntz & Thomas, 1987). Using the analogy of
shooting, the first approach can be termed ready-aim-fire (RAF) and the second ready-
fire-aim (RFA). Intuitively, RAF may lead to more precise actions than RFA, but loss is
typically a function of time and RAF may also allow quicker competitors to obtain
superior positions. Conversely, RFA carries the inefficiencies of trial and error and, when
decisions are irreversible and path-dependent, the risk of pursuing an inferior recovery
path. Hence, the key question is: Under which circumstances should a manager delay its
response actions until more evidence is acquired and how do managers actually intend to
behave?
This study addresses this issue by means of a multi-method research approach.
First, we develop an agent-based model to perform simulation experiments and delineate
how managers should theoretically behave in disruption response situations. Second, we
conduct vignette-based experiments with supply chain managers to adopt a more
behavioral perspective and demonstrate how managers actually intend to approach
disruption recovery as opposed to how they should behave. The results provide insights
into effective decision making in the aftermath of supply chain disruptions and contribute
to the knowledge of supply chain disruptions management.
4.2 Supply disruption management and resilience
The complexity and interconnectedness of modern supply chains create vulnerabilities
that expose firms to the risk of being affected by severe disruptions of the flows of
materials, information, and funds (Sheffi, 2005). A supply chain disruption is a
combination of an unforeseen event that interrupts these flows and a subsequent situation
that distorts the normal course of a focal firm’s business operations. We focus on
disruptive events that cannot be resolved in the course of daily operations management
and that occur in a focal firm’s upstream supply chain (in the following: Supply
disruptions). It has been suggested that supply chain disruptions “are more critical when
they occur upstream in the chain” (Pereira et al., 2014, p. 627).
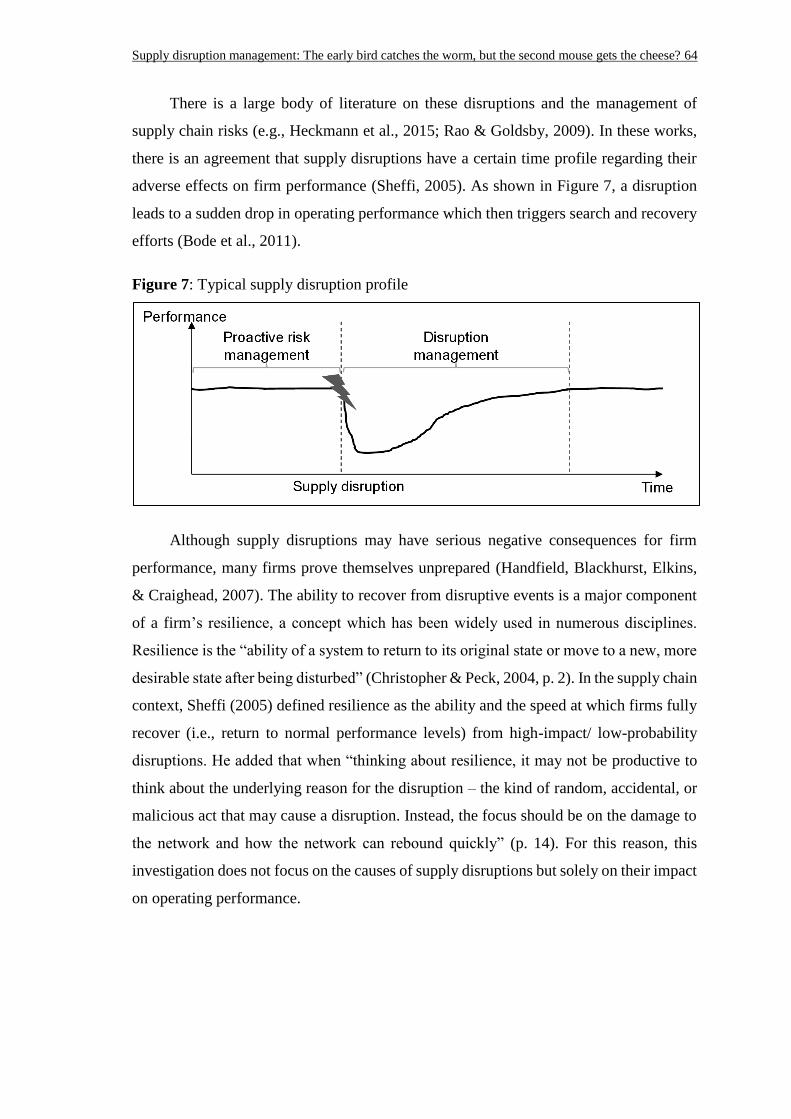
Supply disruption management: The early bird catches the worm, but the second mouse gets the cheese? 64
There is a large body of literature on these disruptions and the management of
supply chain risks (e.g., Heckmann et al., 2015; Rao & Goldsby, 2009). In these works,
there is an agreement that supply disruptions have a certain time profile regarding their
adverse effects on firm performance (Sheffi, 2005). As shown in Figure 7, a disruption
leads to a sudden drop in operating performance which then triggers search and recovery
efforts (Bode et al., 2011).
Figure 7: Typical supply disruption profile
Although supply disruptions may have serious negative consequences for firm
performance, many firms prove themselves unprepared (Handfield, Blackhurst, Elkins,
& Craighead, 2007). The ability to recover from disruptive events is a major component
of a firm’s resilience, a concept which has been widely used in numerous disciplines.
Resilience is the “ability of a system to return to its original state or move to a new, more
desirable state after being disturbed” (Christopher & Peck, 2004, p. 2). In the supply chain
context, Sheffi (2005) defined resilience as the ability and the speed at which firms fully
recover (i.e., return to normal performance levels) from high-impact/ low-probability
disruptions. He added that when “thinking about resilience, it may not be productive to
think about the underlying reason for the disruption – the kind of random, accidental, or
malicious act that may cause a disruption. Instead, the focus should be on the damage to
the network and how the network can rebound quickly” (p. 14). For this reason, this
investigation does not focus on the causes of supply disruptions but solely on their impact
on operating performance.
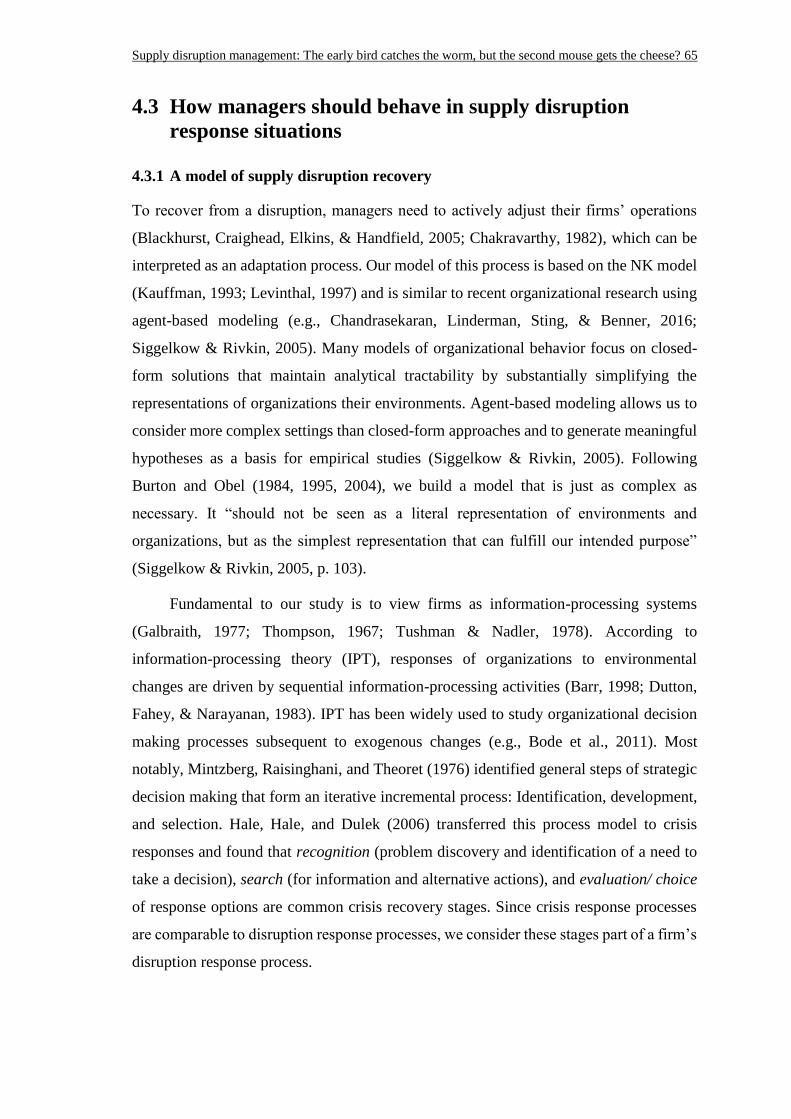
Supply disruption management: The early bird catches the worm, but the second mouse gets the cheese? 65
4.3 How managers should behave in supply disruption
response situations
4.3.1 A model of supply disruption recovery
To recover from a disruption, managers need to actively adjust their firms’ operations
(Blackhurst, Craighead, Elkins, & Handfield, 2005; Chakravarthy, 1982), which can be
interpreted as an adaptation process. Our model of this process is based on the NK model
(Kauffman, 1993; Levinthal, 1997) and is similar to recent organizational research using
agent-based modeling (e.g., Chandrasekaran, Linderman, Sting, & Benner, 2016;
Siggelkow & Rivkin, 2005). Many models of organizational behavior focus on closed-
form solutions that maintain analytical tractability by substantially simplifying the
representations of organizations their environments. Agent-based modeling allows us to
consider more complex settings than closed-form approaches and to generate meaningful
hypotheses as a basis for empirical studies (Siggelkow & Rivkin, 2005). Following
Burton and Obel (1984, 1995, 2004), we build a model that is just as complex as
necessary. It “should not be seen as a literal representation of environments and
organizations, but as the simplest representation that can fulfill our intended purpose”
(Siggelkow & Rivkin, 2005, p. 103).
Fundamental to our study is to view firms as information-processing systems
(Galbraith, 1977; Thompson, 1967; Tushman & Nadler, 1978). According to
information-processing theory (IPT), responses of organizations to environmental
changes are driven by sequential information-processing activities (Barr, 1998; Dutton,
Fahey, & Narayanan, 1983). IPT has been widely used to study organizational decision
making processes subsequent to exogenous changes (e.g., Bode et al., 2011). Most
notably, Mintzberg, Raisinghani, and Theoret (1976) identified general steps of strategic
decision making that form an iterative incremental process: Identification, development,
and selection. Hale, Hale, and Dulek (2006) transferred this process model to crisis
responses and found that recognition (problem discovery and identification of a need to
take a decision), search (for information and alternative actions), and evaluation/ choice
of response options are common crisis recovery stages. Since crisis response processes
are comparable to disruption response processes, we consider these stages part of a firm’s
disruption response process.
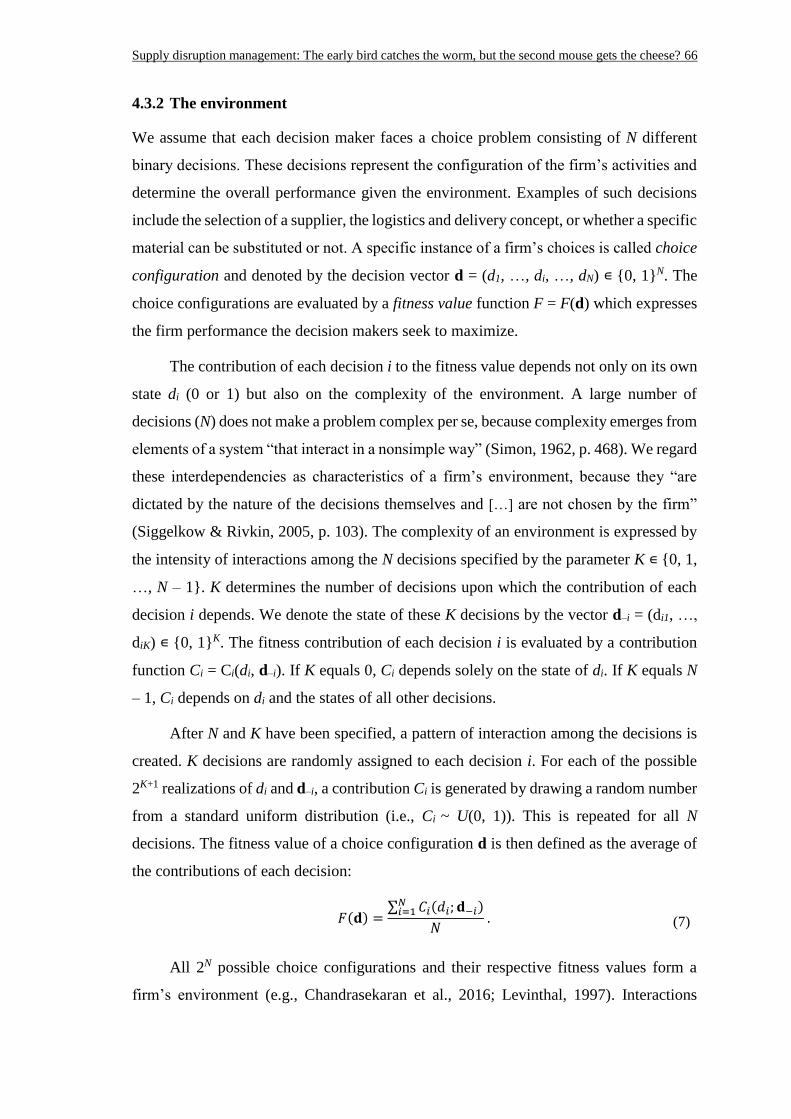
Supply disruption management: The early bird catches the worm, but the second mouse gets the cheese? 66
4.3.2 The environment
We assume that each decision maker faces a choice problem consisting of N different
binary decisions. These decisions represent the configuration of the firm’s activities and
determine the overall performance given the environment. Examples of such decisions
include the selection of a supplier, the logistics and delivery concept, or whether a specific
material can be substituted or not. A specific instance of a firm’s choices is called choice
configuration and denoted by the decision vector d = (d1, …, di, …, dN) ∊ {0, 1}N. The
choice configurations are evaluated by a fitness value function F = F(d) which expresses
the firm performance the decision makers seek to maximize.
The contribution of each decision i to the fitness value depends not only on its own
state di (0 or 1) but also on the complexity of the environment. A large number of
decisions (N) does not make a problem complex per se, because complexity emerges from
elements of a system “that interact in a nonsimple way” (Simon, 1962, p. 468). We regard
these interdependencies as characteristics of a firm’s environment, because they “are
dictated by the nature of the decisions themselves and […] are not chosen by the firm”
(Siggelkow & Rivkin, 2005, p. 103). The complexity of an environment is expressed by
the intensity of interactions among the N decisions specified by the parameter K ∊ {0, 1,
…, N – 1}. K determines the number of decisions upon which the contribution of each
decision i depends. We denote the state of these K decisions by the vector d–i = (di1, …,
diK) ∊ {0, 1}K. The fitness contribution of each decision i is evaluated by a contribution
function Ci = Ci(di, d–i). If K equals 0, Ci depends solely on the state of di. If K equals N
– 1, Ci depends on di and the states of all other decisions.
After N and K have been specified, a pattern of interaction among the decisions is
created. K decisions are randomly assigned to each decision i. For each of the possible
2K+1 realizations of di and d–i, a contribution Ci is generated by drawing a random number
from a standard uniform distribution (i.e., Ci ~ U(0, 1)). This is repeated for all N
decisions. The fitness value of a choice configuration d is then defined as the average of
the contributions of each decision:
𝐹(𝐝) =∑ 𝐶𝑖(𝑑𝑖; 𝐝−𝑖)𝑁
𝑖=1
𝑁 . (7)
All 2N possible choice configurations and their respective fitness values form a
firm’s environment (e.g., Chandrasekaran et al., 2016; Levinthal, 1997). Interactions
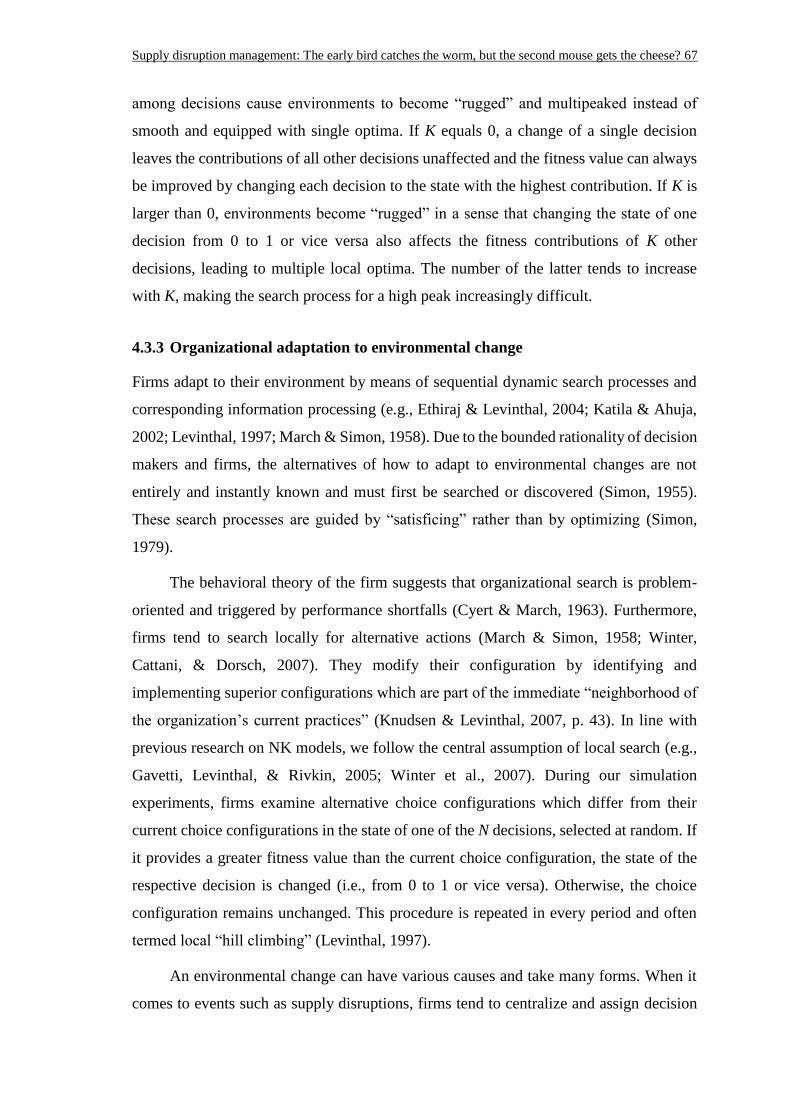
Supply disruption management: The early bird catches the worm, but the second mouse gets the cheese? 67
among decisions cause environments to become “rugged” and multipeaked instead of
smooth and equipped with single optima. If K equals 0, a change of a single decision
leaves the contributions of all other decisions unaffected and the fitness value can always
be improved by changing each decision to the state with the highest contribution. If K is
larger than 0, environments become “rugged” in a sense that changing the state of one
decision from 0 to 1 or vice versa also affects the fitness contributions of K other
decisions, leading to multiple local optima. The number of the latter tends to increase
with K, making the search process for a high peak increasingly difficult.
4.3.3 Organizational adaptation to environmental change
Firms adapt to their environment by means of sequential dynamic search processes and
corresponding information processing (e.g., Ethiraj & Levinthal, 2004; Katila & Ahuja,
2002; Levinthal, 1997; March & Simon, 1958). Due to the bounded rationality of decision
makers and firms, the alternatives of how to adapt to environmental changes are not
entirely and instantly known and must first be searched or discovered (Simon, 1955).
These search processes are guided by “satisficing” rather than by optimizing (Simon,
1979).
The behavioral theory of the firm suggests that organizational search is problem-
oriented and triggered by performance shortfalls (Cyert & March, 1963). Furthermore,
firms tend to search locally for alternative actions (March & Simon, 1958; Winter,
Cattani, & Dorsch, 2007). They modify their configuration by identifying and
implementing superior configurations which are part of the immediate “neighborhood of
the organization’s current practices” (Knudsen & Levinthal, 2007, p. 43). In line with
previous research on NK models, we follow the central assumption of local search (e.g.,
Gavetti, Levinthal, & Rivkin, 2005; Winter et al., 2007). During our simulation
experiments, firms examine alternative choice configurations which differ from their
current choice configurations in the state of one of the N decisions, selected at random. If
it provides a greater fitness value than the current choice configuration, the state of the
respective decision is changed (i.e., from 0 to 1 or vice versa). Otherwise, the choice
configuration remains unchanged. This procedure is repeated in every period and often
termed local “hill climbing” (Levinthal, 1997).
An environmental change can have various causes and take many forms. When it
comes to events such as supply disruptions, firms tend to centralize and assign decision
Supply disruption management: The early bird catches the worm, but the second mouse gets the cheese? 68
making responsibility to a single manager (“troubleshooter”) or team (Dubrovski, 2004).
Accordingly, agents in our simulation model can be seen as individual decision makers
or teams that have been tasked with the recovery decisions. Their behavior is predefined
by a set of rules.
4.3.4 Supply disruptions and uncertainty
Uncertainty is a central concept for research concerned with the relationship between
organizations and their environments (e.g., Dill, 1958; Duncan, 1972; Thompson, 1967).
In congruence with the information-processing perspective, we build on the notion that
uncertainty and information are closely interrelated. Uncertainty is defined “as a
manifestation of some information deficiency, while information is viewed as the
capacity to reduce uncertainty” (Klir, 2005, p. xiii). For decision makers, uncertainty is
the “difference between the amount of information required to perform a task and the
amount of information already possessed” (Galbraith, 1973, p. 5). Gathering information
to reduce uncertainty is a critical activity for decision making (Cooper, Folta, & Woo,
1995).
Three types of environmental uncertainty can be distinguished: State, effect, and
response uncertainty. State uncertainty involves the inability to understand or predict the
state of the environment, while effect uncertainty impairs an individual’s ability to predict
the impact of environmental changes on organizations (Milliken, 1987). For actions,
response uncertainty is the most prevailing issue (McMullen & Shepherd, 2006). It is
defined as a “lack of knowledge of response options and/or an inability to predict the
likely consequences of a response choice” (Milliken, 1987, p. 137) and is salient in almost
every supply disruption recovery process. It is experienced when there is a perceived need
to act or formulate “a response to an immediate threat in the environment” (Milliken,
1987, p. 138). Especially in the early stages of a disruption response, information on
causes and effects tends to be incomplete or inaccurate (M. Chen, Xia, & Wang, 2010).
From a behavioral perspective, uncertainty is associated with “a sense of doubt that
blocks or delays action” (Lipshitz & Strauss, 1997, p. 150). The potential costs of an
incorrect response may deter a decision maker from taking action (Milliken, 1987).
However, delaying a decision is also costly and may allow competitors to respond faster
to disruptions. Research on disruption management has provided anecdotal evidence that
the disruption recovery performance is time-dependent (Macdonald & Corsi, 2013). Yet,
Supply disruption management: The early bird catches the worm, but the second mouse gets the cheese? 69
we still lack convincing evidence on the link between response speed and recovery
performance.
In previous research on organizational search behavior, the problem of evaluating
response alternatives has been treated as being trivial (Knudsen & Levinthal, 2007). To
address this criticism, we investigate the impact of response uncertainty on the evaluation
of response alternatives. During every simulation run, the environment is replaced by a
new randomly generated environment to represent the effect of a supply disruption.
However, the latter is accompanied by response uncertainty and fitness values of
alternative configurations are distorted by a uniformly distributed random error. The
firms differ in the way they react to this response uncertainty as described in the next
sections.
4.3.5 Disruption response strategies
Search processes of firms are affected by preferences and characteristics of individuals.
Decision makers may differ in the degree of risk avoidance (e.g., depending on cultural
differences (Hofstede, 1993)) or the preferred amount of information collected to solve a
problem (O'Reilly, 1982). Accordingly, some organizations penetrate their environment
more than others. Daft and Weick (1984) noted that “organizations may leap before they
look” (p. 288). Against this backdrop, we distinguish two disruption response strategies
under response uncertainty: Ready-aim-fire and ready-fire-aim. These strategies7 have
been mentioned in the fields of management, strategy, and decision theory (e.g., Cox,
2000; Peters & Waterman, 1982), but, to the best of our knowledge, have not been clearly
delineated.
Ready-aim-fire (RAF). In the face of uncertainty, some firms may prefer to delay
a decision until more information becomes available (Kleinmuntz & Thomas, 1987). A
firm can receive additional information passively (e.g., via media announcements) or
actively (e.g., through its own investigations) (Milliken, 1987). Action is delayed in the
hopes that less uncertainty makes the choice of an appropriate alternative easier and more
accurate. Borrowing an analogy from marksmanship, we call this strategy ready-aim-fire.
Its main idea is to reduce response uncertainty and purse accurate analysis before action
is taken (Lipshitz & Strauss, 1997; Mintzberg & Westley, 2001; Peters & Waterman,
7 Similar terms that can be found in the literature are “look before you leap” vs. “leap before you look”,
“judgment-oriented” vs. “action-oriented”, or “wait and see”/ ”watchful waiting” vs. action.
Supply disruption management: The early bird catches the worm, but the second mouse gets the cheese? 70
1982) and it can be seen as the rational or “proper” sequence to problem solving. In
general, the rational decision making approach consists of the stages problem definition,
diagnosis, design of alternatives, and selection of the preferred option (Mintzberg &
Westley, 2001). These steps are conducted sequentially, with diagnosis as an action-
enabling step. As organizational decision making processes tend to be incremental, they
involve iterative cycles of design and readjustment (Mintzberg et al., 1976).
Ready-fire-aim (RFA). In practice, firms often do not follow the rational RAF
strategy. Empirical insights reveal that managers are inclined to prefer quick action to
analysis (Isenberg, 1984; Mintzberg et al., 1976). The studies of Mintzberg (1973) about
what managers actually do, as opposed to what they are supposed to do or what they say
they do, indicate that rational problem solving was rarely employed. Instead, an action-
orientation has frequently been observed (Isenberg, 1986; Mintzberg & Westley, 2001).
Taking action provides orientation and information that enables to learn and adjust
response efforts (Rudolph, Morrison, & Carroll, 2009). We call this strategy ready-fire-
aim. It has been recognized in innovative firms, which tend to act rather than analyze,
plan, and postpone action (Peters & Waterman, 1982). Weick (1979) argued that
“postponing action while planning continues could prove dangerous [...] and any chance
of clarifying the situation will decrease, simply because there is nothing available to be
clarified or made meaningful” (p. 103). In case of dramatic change, he suggested that
“chaotic action is preferable to orderly inaction” (p. 245). Daft and Weick (1984) added
that “feedback from organizational actions may provide new collective insights” (p. 286)
which may improve both the understanding of a situation as well as the ability to
implement an effective response. Accordingly, RFA is based on Weick’s (1979) idea of
organizations engaging in iterative cycles of action and reaction to gradually reduce
uncertainty related to environmental information.
In our model, a firm that applies RAF uses the first period after a supply disruption
to collect information and resolve the response uncertainty while its choice configuration
remains unchanged. Afterwards, the firm engages in local search and is able to perfectly
predict the fitness values of alternative configurations. In contrast, a firm that applies
RFA immediately starts local search after a supply disruption and faces noisy information
due to response uncertainty. In line with G. Wu (1999) – who suggested that “uncertainty
about the outcome of a particular state of nature is often not resolved immediately after
an act is selected” (p. 159) – we assume that response uncertainty is dynamic and does
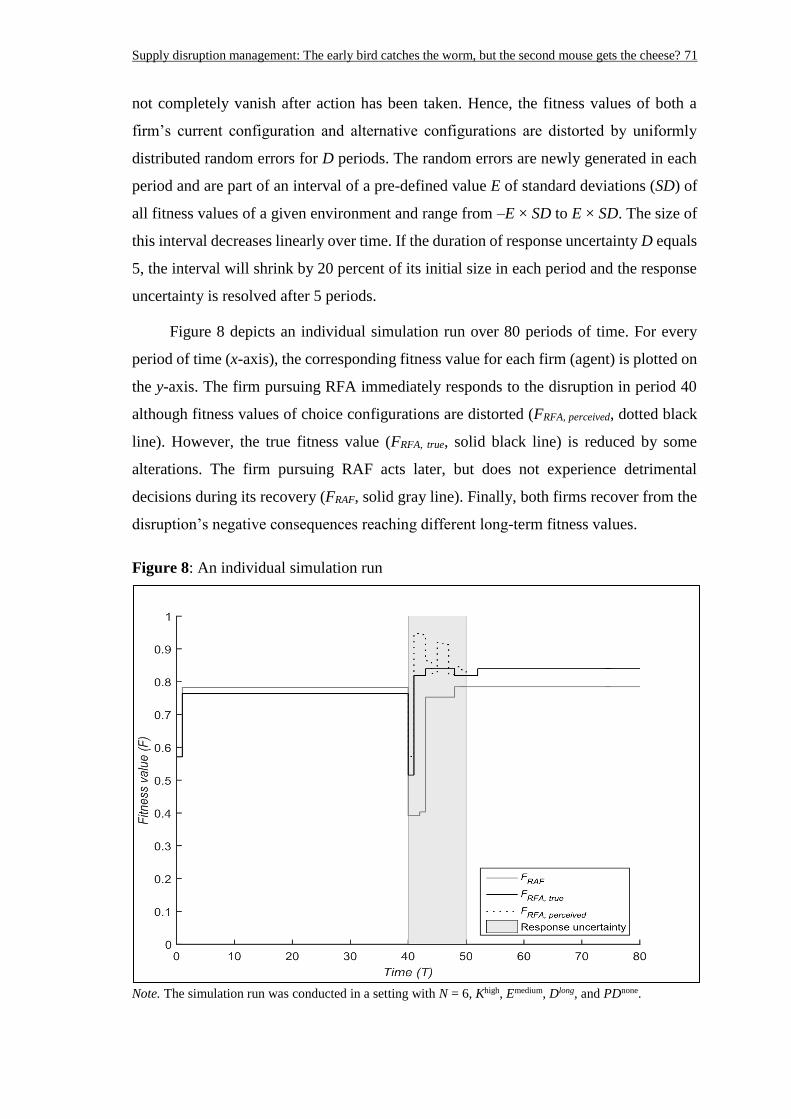
Supply disruption management: The early bird catches the worm, but the second mouse gets the cheese? 71
not completely vanish after action has been taken. Hence, the fitness values of both a
firm’s current configuration and alternative configurations are distorted by uniformly
distributed random errors for D periods. The random errors are newly generated in each
period and are part of an interval of a pre-defined value E of standard deviations (SD) of
all fitness values of a given environment and range from –E × SD to E × SD. The size of
this interval decreases linearly over time. If the duration of response uncertainty D equals
5, the interval will shrink by 20 percent of its initial size in each period and the response
uncertainty is resolved after 5 periods.
Figure 8 depicts an individual simulation run over 80 periods of time. For every
period of time (x-axis), the corresponding fitness value for each firm (agent) is plotted on
the y-axis. The firm pursuing RFA immediately responds to the disruption in period 40
although fitness values of choice configurations are distorted (FRFA, perceived, dotted black
line). However, the true fitness value (FRFA, true, solid black line) is reduced by some
alterations. The firm pursuing RAF acts later, but does not experience detrimental
decisions during its recovery (FRAF, solid gray line). Finally, both firms recover from the
disruption’s negative consequences reaching different long-term fitness values.
Figure 8: An individual simulation run
Note. The simulation run was conducted in a setting with N = 6, Khigh, Emedium, Dlong, and PDnone.
Supply disruption management: The early bird catches the worm, but the second mouse gets the cheese? 72
4.3.6 Path dependence
An important characteristic of actual organizational adaptation processes is path
dependence (Beinhocker, 1999). Path dependence means that “where we go next depends
not only on where we are now, but also upon where we have been” (Liebowitz &
Margolis, 2000, p. 981). Adaptation decisions may influence the available range of future
options and future flexibility (Nelson, Adger, & Brown, 2007). Serious problems may
occur if actions that cannot be reversed in the short term prove to be a “shadow of the
past” which results in inferior outcomes creating lock-in situation (J.-P. Vergne &
Durand, 2011). Hence, in the face of environmental change, path dependence can force
firms on a suboptimal course of action (Noda & Collis, 2001). Recent research has
emphasized the need for a better understanding of path dependence (e.g., Sydow,
Schreyögg, & Koch, 2009; J. P. Vergne & Durand, 2010).
Recovery from supply disruptions may involve supply chain reconfigurations that
are partly or completely irreversible. Moreover, organizational inertia can prevent firms
from making possible changes. Imagine that one choice of a firm’s decision set concerns
a supplier selection decision. It is unrealistic to assume that the decision for a specific
supplier can immediately be reversed in the following period without excessive switching
costs and time. Against this backdrop, we adopt the view of path-dependent
organizational action in the context of adaptation to environmental change. To this end,
we include the parameter PD in our model. PD determines the number of a firm’s first
alterations that are irreversible. If PD equals 0, all decisions can be reversed in subsequent
periods. However, if, for example, PD equals 2, this means that the first two conducted
changes cannot be reversed again and keep their state for the rest of the simulation. Due
to this path dependency through irreversible actions, firms can find themselves “locked-
in” and not reaching any peak of an environment.
In sum, our model extends the standard NK model as used in previous research. We
include response uncertainty in the evaluation of fitness values by means of the
parameters E and D, and incorporate irreversible actions via the parameter PD. Thus, the
model allows the investigation of response uncertainty, complexity, and path dependence
in the context of disruption recovery.
Supply disruption management: The early bird catches the worm, but the second mouse gets the cheese? 73
4.3.7 Results
The goal of our simulation experiments is to analyze the conditions under which a firm
should decide to delay the initial recovery decision to a point where more accurate
information has been accumulated. We generate two firms (agents) with identical initial
configurations d (without loss of generality) at the beginning of each individual
simulation run of 80 periods of time (T). Both firms face six decisions (N = 6) and operate
in the same environment with either low (Klow = 1) or high complexity (Khigh = 5). This
environment is stable until it is disrupted in period 40. The disruption results in an
environmental change and the firms’ environment is replaced by a randomly generated
new one. The parameters N and K are not altered by the disruption. Subsequently, one
firm applies purely RAF to eliminate response uncertainty before it takes action, while
the other applies purely RFA facing distorted fitness values to a pre-defined degree E for
a certain number of time periods D. Furthermore, a certain number of the firms’ first
alterations PD is irreversible.
By varying the four parameters K, D, E, and PD, the simulation model enables
sophisticated analyses under a variety of conditions. We focus on parameter values that
create diverse settings to derive the implications of RAF and RFA for the recovery
performance of firms. The parameter values used in the simulation experiments are
depicted in Table 11.
Given this setup, we compare the average recovery performance of RAF and RFA
in different settings of our simulation experiments based on four measures which address
two main dimensions: Effectiveness and speed. The performance measures we report
constitute averages of 10,000 runs to eliminate the stochastic component that any single
run is sensitive to. 8
Effectiveness. The effectiveness of a firm’s recovery efforts is a relevant
performance indicator, because it reflects the extent to which negative effects on firm
performance have been minimized (Bode et al., 2011; Handfield et al., 2007). We
8 Two additional performance measures – “average first improvement” and “alterations required to recover”
– were scrutinized, but did not reveal interesting results beyond the rather obvious insight that RAF always
leads to more precise initial actions and requires less changes to recover from disruptions than RFA. For
the rest of this paper, we focus on measures that identify different dominant strategies depending on the
environmental conditions. Since the degree of complexity influences the absolute levels of fitness in NK
landscapes, we measure fitness values in relation to the global optimum of an environment (Skellett,
Cairns, Geard, Tonkes, & Wiles, 2005).
Supply disruption management: The early bird catches the worm, but the second mouse gets the cheese? 74
construct two effectiveness-related performance measures: Post-disruption performance
(PDP) and final performance (FP).
Speed. Anecdotal evidence suggests that the speed of completing the recovery
reduces costs and losses. For example, Macdonald and Corsi (2013) argued that “the
longer it takes to fully recover, the more expensive the entire recovery process is likely
to be” (p. 272). Two measures are used to capture speed: Uncertainty resolution
performance (URP) and number of time periods (NTP). Whenever we report that one
response strategy (RAF/ RFA) performs better than the other, the difference in mean
performance is statistically significant with p < 0.05 or better.
Table 11: Parameter values determining the experimental conditions
(1) Number of decisions (N), one value
(i) N = 6
(2) Complexity (K), two values
(i) Low: Klow = 1
(ii) High: Khigh = 5
(3) Duration of response uncertainty (D), in time periods, two values
(i) Short: Dshort = 5
(ii) Long: Dlong = 10
(4) Response uncertainty (E), in standard deviations of an environment’s fitness values, three values
(i) Low: Elow = 0.5
(ii) Medium: Emedium = 1
(iii) High: Ehigh = 2
(5) Path dependence (PD), in decisions, two values
(i) None: PDnone = 0
(ii) Strong: PDstrong = 4
Figure 9 summarizes the conditions under which a certain response strategy
dominates the other on a given performance dimension (effectiveness or speed).
Managers should be aware that RAF is more precise in the first period of search and
requires less alteration and related investment to find a long-term configuration than RFA
in all depicted settings. However, from interviews with procurement executives that we
conducted as part of this study, the perception that, in case of a supply disruption, costs
are regarded as “necessary evil” became apparent, because the goal of a recovery process
is “to maintain the supply of customers, whatever the cost.”
Post-Disruption Performance (PDP). In our simulation, the PDP is the average
fitness value of a firm from period 40 to the end of the simulation run. It demonstrates the
extent to which negative disruption effects have been minimized. Figure 10 depicts the
PDPs of RAF and RFA under various conditions.
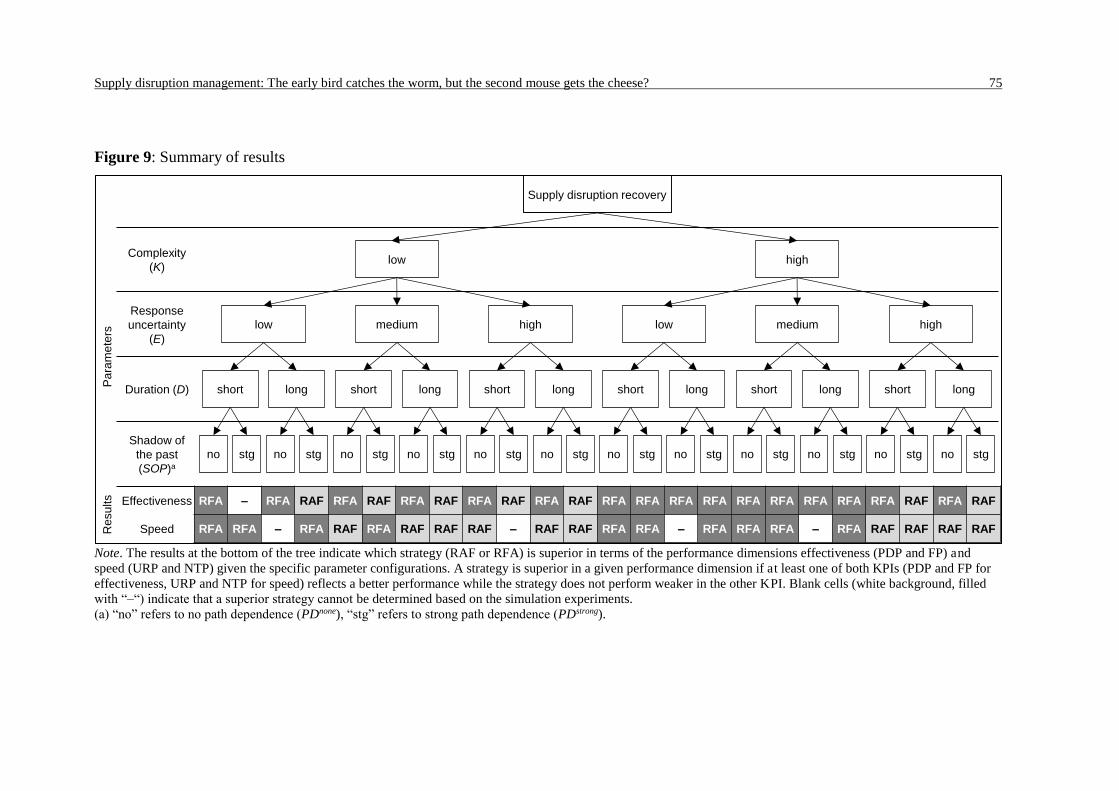
Supply disruption management: The early bird catches the worm, but the second mouse gets the cheese? 75
Figure 9: Summary of results
Note. The results at the bottom of the tree indicate which strategy (RAF or RFA) is superior in terms of the performance dimensions effectiveness (PDP and FP) and
speed (URP and NTP) given the specific parameter configurations. A strategy is superior in a given performance dimension if at least one of both KPIs (PDP and FP for
effectiveness, URP and NTP for speed) reflects a better performance while the strategy does not perform weaker in the other KPI. Blank cells (white background, filled
with “–“) indicate that a superior strategy cannot be determined based on the simulation experiments. (a) “no” refers to no path dependence (PDnone), “stg” refers to strong path dependence (PDstrong).
Effectiveness
Speed
Complexity
(K)
Response
uncertainty
(E)
Duration (D)
Shadow of
the past
(SOP)a
low
no stg no stg
low
short long
no stg no stg
medium
short long
no stg no stg
high
short long
no stg no stg
low
short long
no stg no stg
medium
short long
no stg no stg
high
short long
high
Supply disruption recovery
RFA – RFA RAF RFA RAF RFA RAF RFA RAF RFA RAF RFA RFA RFA RFA RFA RFA RFA RFA RFA RAF RFA RAF
RFA RFA – RFA RAF RFA RAF RAF RAF – RAF RAF RFA RFA – RFA RFA RFA – RFA RAF RAF RAF RAFResu
lts
Pa
ram
ete
rs
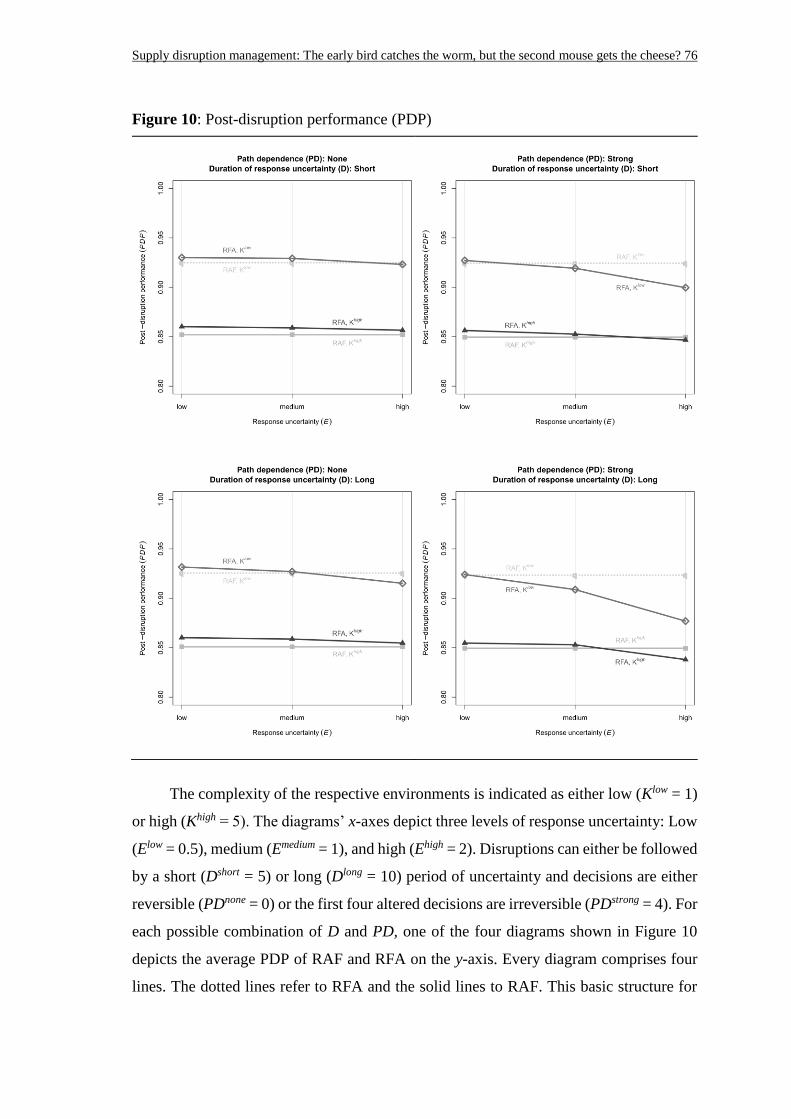
Supply disruption management: The early bird catches the worm, but the second mouse gets the cheese? 76
Figure 10: Post-disruption performance (PDP)
The complexity of the respective environments is indicated as either low (Klow = 1)
or high (Khigh = 5). The diagrams’ x-axes depict three levels of response uncertainty: Low
(Elow = 0.5), medium (Emedium = 1), and high (Ehigh = 2). Disruptions can either be followed
by a short (Dshort = 5) or long (Dlong = 10) period of uncertainty and decisions are either
reversible (PDnone = 0) or the first four altered decisions are irreversible (PDstrong = 4). For
each possible combination of D and PD, one of the four diagrams shown in Figure 10
depicts the average PDP of RAF and RFA on the y-axis. Every diagram comprises four
lines. The dotted lines refer to RFA and the solid lines to RAF. This basic structure for
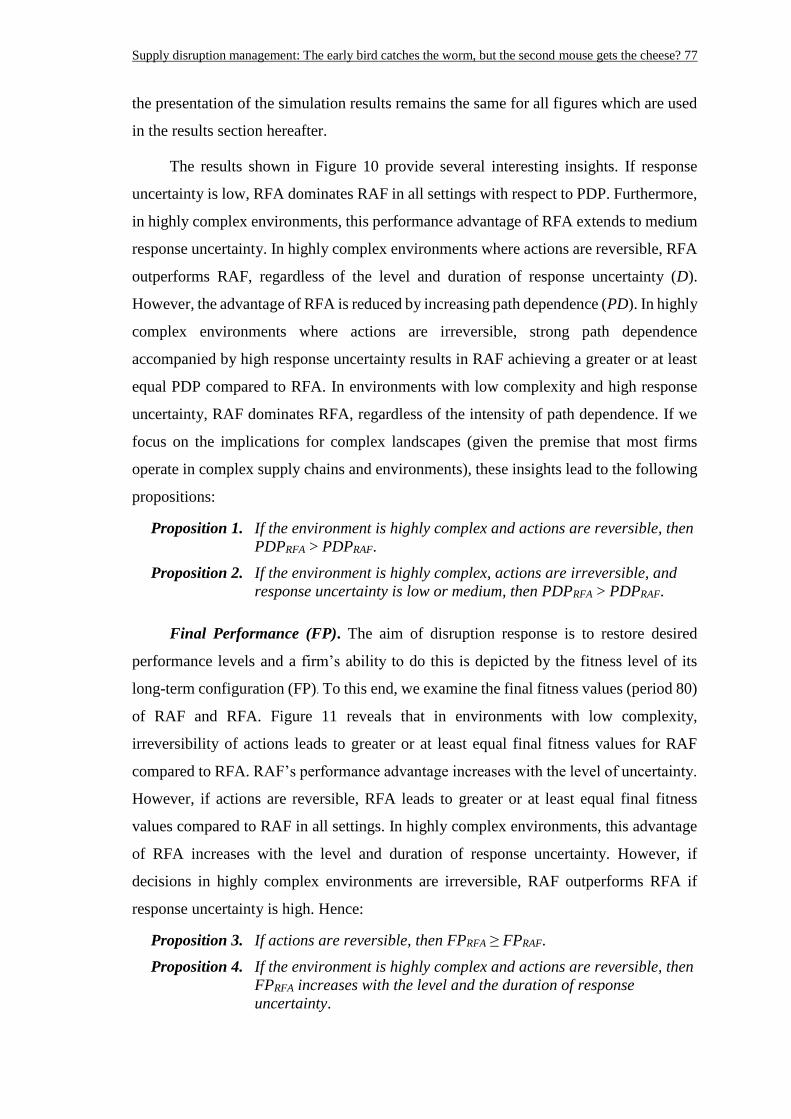
Supply disruption management: The early bird catches the worm, but the second mouse gets the cheese? 77
the presentation of the simulation results remains the same for all figures which are used
in the results section hereafter.
The results shown in Figure 10 provide several interesting insights. If response
uncertainty is low, RFA dominates RAF in all settings with respect to PDP. Furthermore,
in highly complex environments, this performance advantage of RFA extends to medium
response uncertainty. In highly complex environments where actions are reversible, RFA
outperforms RAF, regardless of the level and duration of response uncertainty (D).
However, the advantage of RFA is reduced by increasing path dependence (PD). In highly
complex environments where actions are irreversible, strong path dependence
accompanied by high response uncertainty results in RAF achieving a greater or at least
equal PDP compared to RFA. In environments with low complexity and high response
uncertainty, RAF dominates RFA, regardless of the intensity of path dependence. If we
focus on the implications for complex landscapes (given the premise that most firms
operate in complex supply chains and environments), these insights lead to the following
propositions:
Proposition 1. If the environment is highly complex and actions are reversible, then
PDPRFA > PDPRAF.
Proposition 2. If the environment is highly complex, actions are irreversible, and
response uncertainty is low or medium, then PDPRFA > PDPRAF.
Final Performance (FP). The aim of disruption response is to restore desired
performance levels and a firm’s ability to do this is depicted by the fitness level of its
long-term configuration (FP). To this end, we examine the final fitness values (period 80)
of RAF and RFA. Figure 11 reveals that in environments with low complexity,
irreversibility of actions leads to greater or at least equal final fitness values for RAF
compared to RFA. RAF’s performance advantage increases with the level of uncertainty.
However, if actions are reversible, RFA leads to greater or at least equal final fitness
values compared to RAF in all settings. In highly complex environments, this advantage
of RFA increases with the level and duration of response uncertainty. However, if
decisions in highly complex environments are irreversible, RAF outperforms RFA if
response uncertainty is high. Hence:
Proposition 3. If actions are reversible, then FPRFA ≥ FPRAF.
Proposition 4. If the environment is highly complex and actions are reversible, then
FPRFA increases with the level and the duration of response
uncertainty.
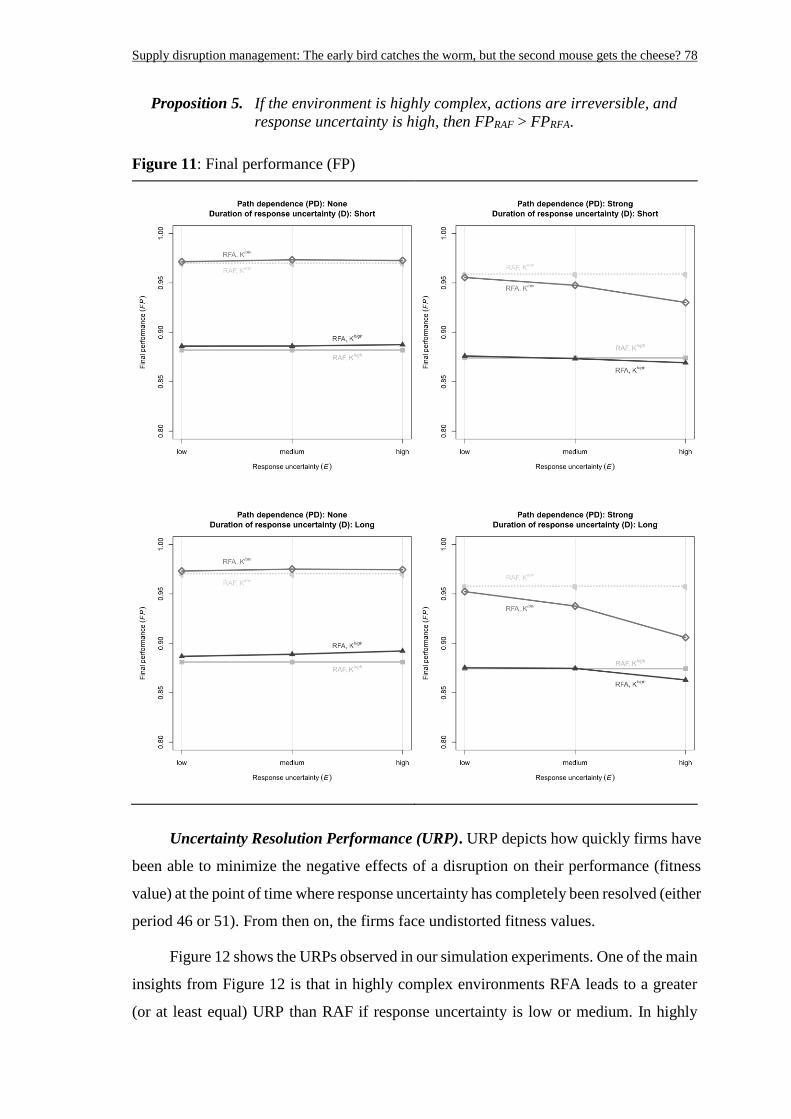
Supply disruption management: The early bird catches the worm, but the second mouse gets the cheese? 78
Proposition 5. If the environment is highly complex, actions are irreversible, and
response uncertainty is high, then FPRAF > FPRFA.
Figure 11: Final performance (FP)
Uncertainty Resolution Performance (URP). URP depicts how quickly firms have
been able to minimize the negative effects of a disruption on their performance (fitness
value) at the point of time where response uncertainty has completely been resolved (either
period 46 or 51). From then on, the firms face undistorted fitness values.
Figure 12 shows the URPs observed in our simulation experiments. One of the main
insights from Figure 12 is that in highly complex environments RFA leads to a greater
(or at least equal) URP than RAF if response uncertainty is low or medium. In highly
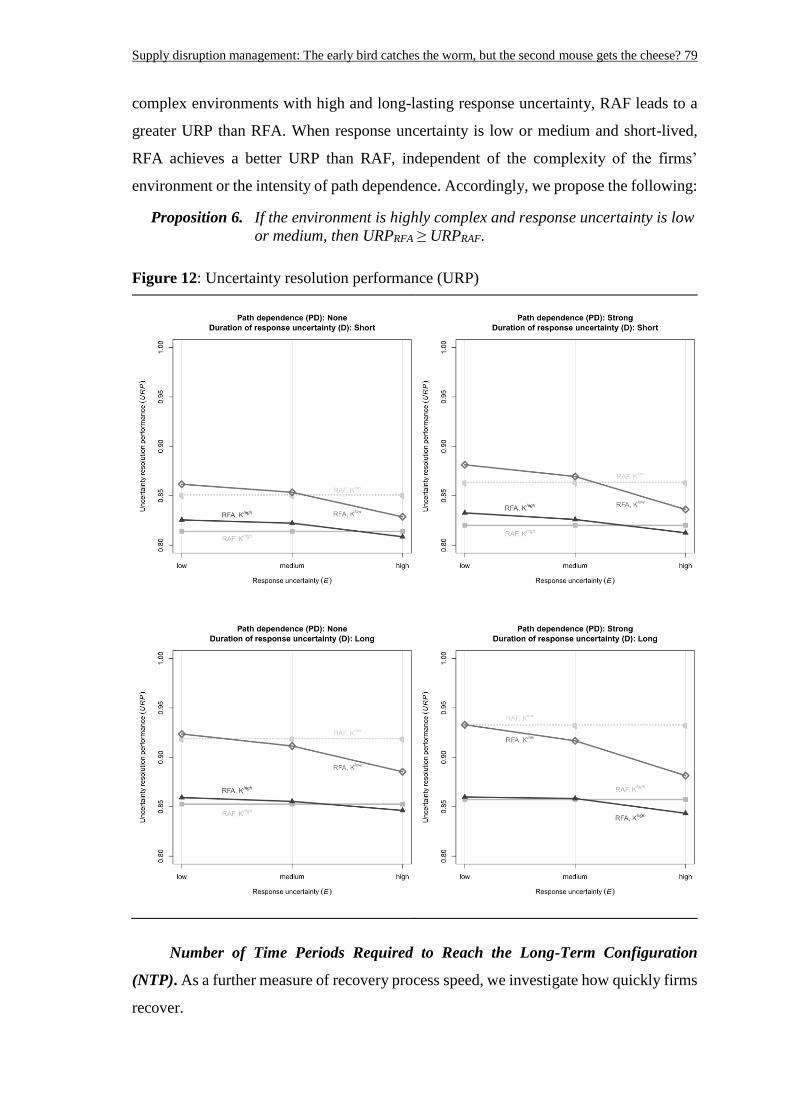
Supply disruption management: The early bird catches the worm, but the second mouse gets the cheese? 79
complex environments with high and long-lasting response uncertainty, RAF leads to a
greater URP than RFA. When response uncertainty is low or medium and short-lived,
RFA achieves a better URP than RAF, independent of the complexity of the firms’
environment or the intensity of path dependence. Accordingly, we propose the following:
Proposition 6. If the environment is highly complex and response uncertainty is low
or medium, then URPRFA ≥ URPRAF.
Figure 12: Uncertainty resolution performance (URP)
Number of Time Periods Required to Reach the Long-Term Configuration
(NTP). As a further measure of recovery process speed, we investigate how quickly firms
recover.
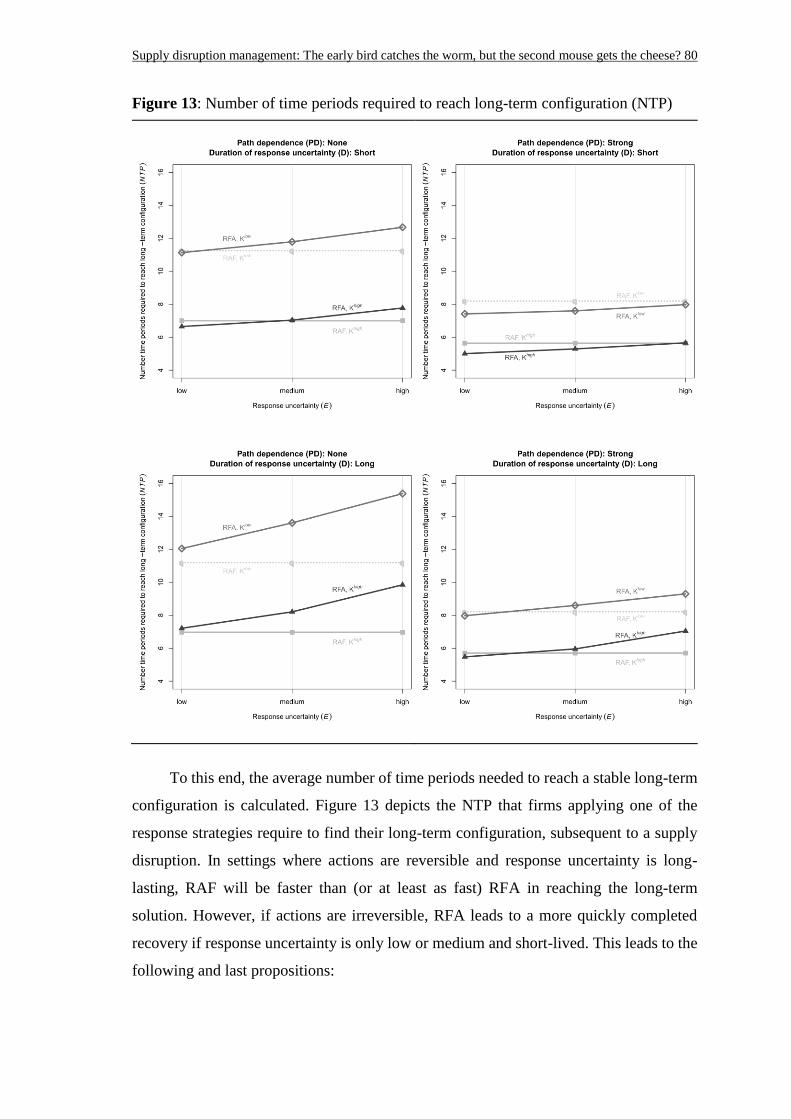
Supply disruption management: The early bird catches the worm, but the second mouse gets the cheese? 80
Figure 13: Number of time periods required to reach long-term configuration (NTP)
To this end, the average number of time periods needed to reach a stable long-term
configuration is calculated. Figure 13 depicts the NTP that firms applying one of the
response strategies require to find their long-term configuration, subsequent to a supply
disruption. In settings where actions are reversible and response uncertainty is long-
lasting, RAF will be faster than (or at least as fast) RFA in reaching the long-term
solution. However, if actions are irreversible, RFA leads to a more quickly completed
recovery if response uncertainty is only low or medium and short-lived. This leads to the
following and last propositions:
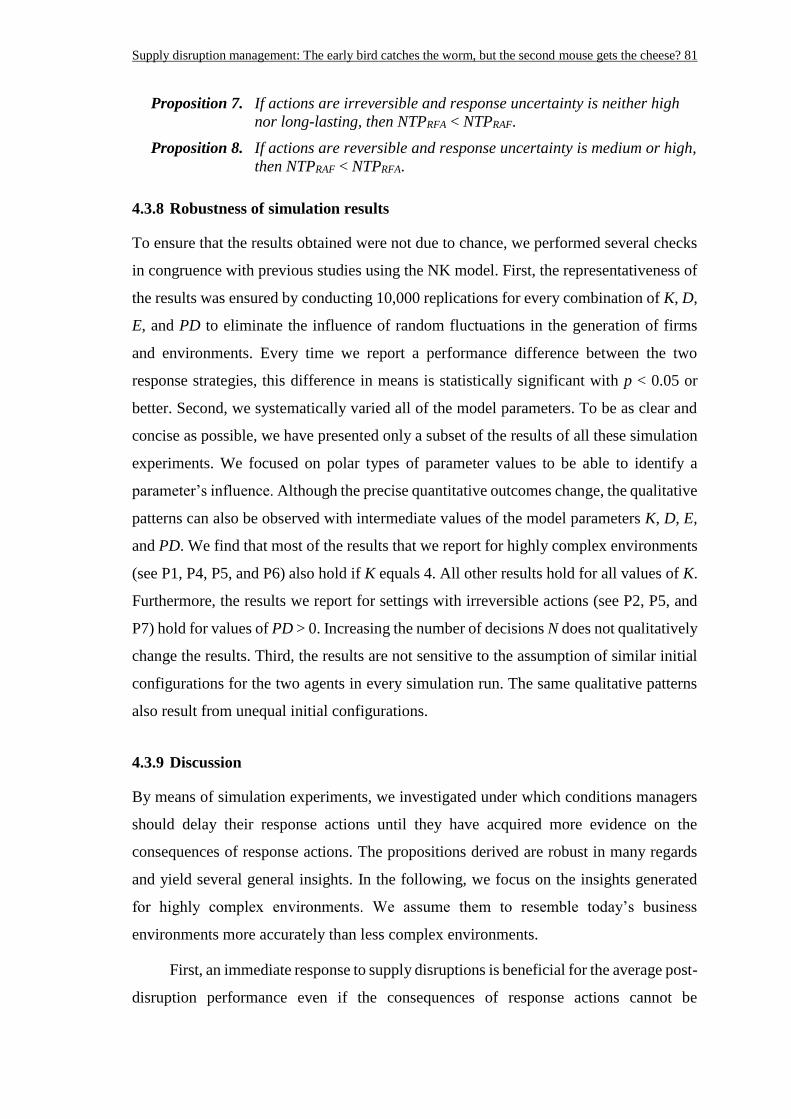
Supply disruption management: The early bird catches the worm, but the second mouse gets the cheese? 81
Proposition 7. If actions are irreversible and response uncertainty is neither high
nor long-lasting, then NTPRFA < NTPRAF.
Proposition 8. If actions are reversible and response uncertainty is medium or high,
then NTPRAF < NTPRFA.
4.3.8 Robustness of simulation results
To ensure that the results obtained were not due to chance, we performed several checks
in congruence with previous studies using the NK model. First, the representativeness of
the results was ensured by conducting 10,000 replications for every combination of K, D,
E, and PD to eliminate the influence of random fluctuations in the generation of firms
and environments. Every time we report a performance difference between the two
response strategies, this difference in means is statistically significant with p < 0.05 or
better. Second, we systematically varied all of the model parameters. To be as clear and
concise as possible, we have presented only a subset of the results of all these simulation
experiments. We focused on polar types of parameter values to be able to identify a
parameter’s influence. Although the precise quantitative outcomes change, the qualitative
patterns can also be observed with intermediate values of the model parameters K, D, E,
and PD. We find that most of the results that we report for highly complex environments
(see P1, P4, P5, and P6) also hold if K equals 4. All other results hold for all values of K.
Furthermore, the results we report for settings with irreversible actions (see P2, P5, and
P7) hold for values of PD > 0. Increasing the number of decisions N does not qualitatively
change the results. Third, the results are not sensitive to the assumption of similar initial
configurations for the two agents in every simulation run. The same qualitative patterns
also result from unequal initial configurations.
4.3.9 Discussion
By means of simulation experiments, we investigated under which conditions managers
should delay their response actions until they have acquired more evidence on the
consequences of response actions. The propositions derived are robust in many regards
and yield several general insights. In the following, we focus on the insights generated
for highly complex environments. We assume them to resemble today’s business
environments more accurately than less complex environments.
First, an immediate response to supply disruptions is beneficial for the average post-
disruption performance even if the consequences of response actions cannot be
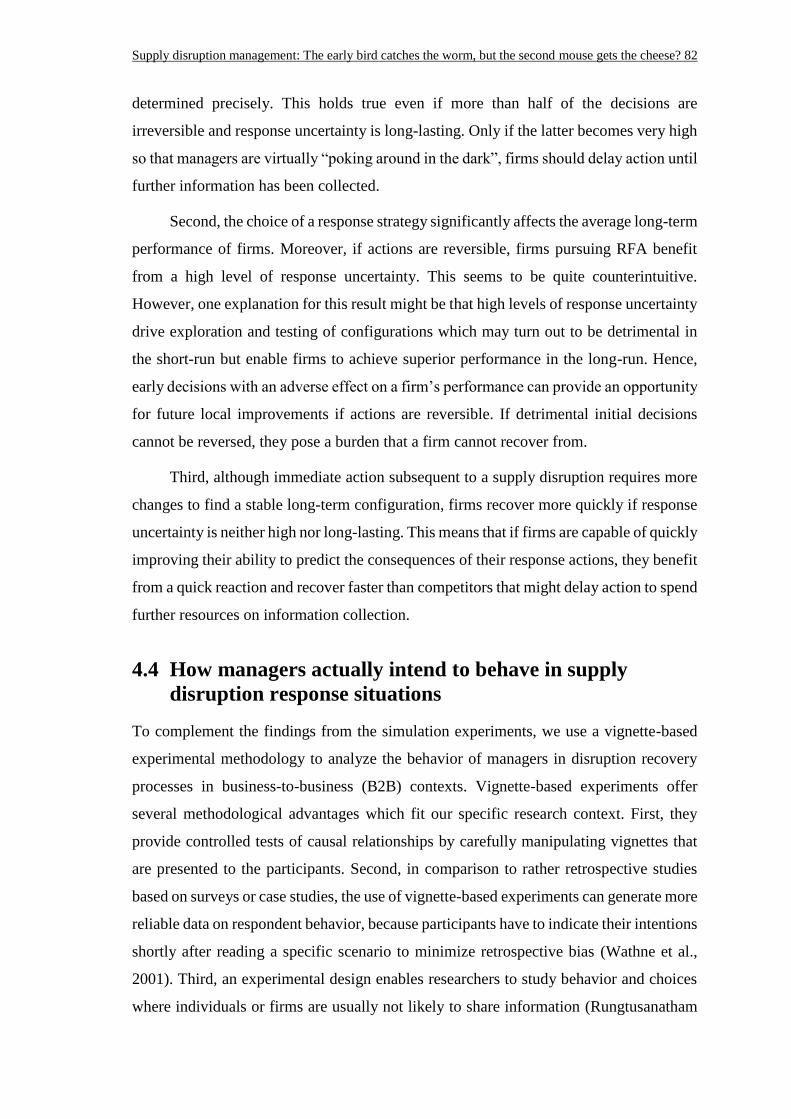
Supply disruption management: The early bird catches the worm, but the second mouse gets the cheese? 82
determined precisely. This holds true even if more than half of the decisions are
irreversible and response uncertainty is long-lasting. Only if the latter becomes very high
so that managers are virtually “poking around in the dark”, firms should delay action until
further information has been collected.
Second, the choice of a response strategy significantly affects the average long-term
performance of firms. Moreover, if actions are reversible, firms pursuing RFA benefit
from a high level of response uncertainty. This seems to be quite counterintuitive.
However, one explanation for this result might be that high levels of response uncertainty
drive exploration and testing of configurations which may turn out to be detrimental in
the short-run but enable firms to achieve superior performance in the long-run. Hence,
early decisions with an adverse effect on a firm’s performance can provide an opportunity
for future local improvements if actions are reversible. If detrimental initial decisions
cannot be reversed, they pose a burden that a firm cannot recover from.
Third, although immediate action subsequent to a supply disruption requires more
changes to find a stable long-term configuration, firms recover more quickly if response
uncertainty is neither high nor long-lasting. This means that if firms are capable of quickly
improving their ability to predict the consequences of their response actions, they benefit
from a quick reaction and recover faster than competitors that might delay action to spend
further resources on information collection.
4.4 How managers actually intend to behave in supply
disruption response situations
To complement the findings from the simulation experiments, we use a vignette-based
experimental methodology to analyze the behavior of managers in disruption recovery
processes in business-to-business (B2B) contexts. Vignette-based experiments offer
several methodological advantages which fit our specific research context. First, they
provide controlled tests of causal relationships by carefully manipulating vignettes that
are presented to the participants. Second, in comparison to rather retrospective studies
based on surveys or case studies, the use of vignette-based experiments can generate more
reliable data on respondent behavior, because participants have to indicate their intentions
shortly after reading a specific scenario to minimize retrospective bias (Wathne et al.,
2001). Third, an experimental design enables researchers to study behavior and choices
where individuals or firms are usually not likely to share information (Rungtusanatham
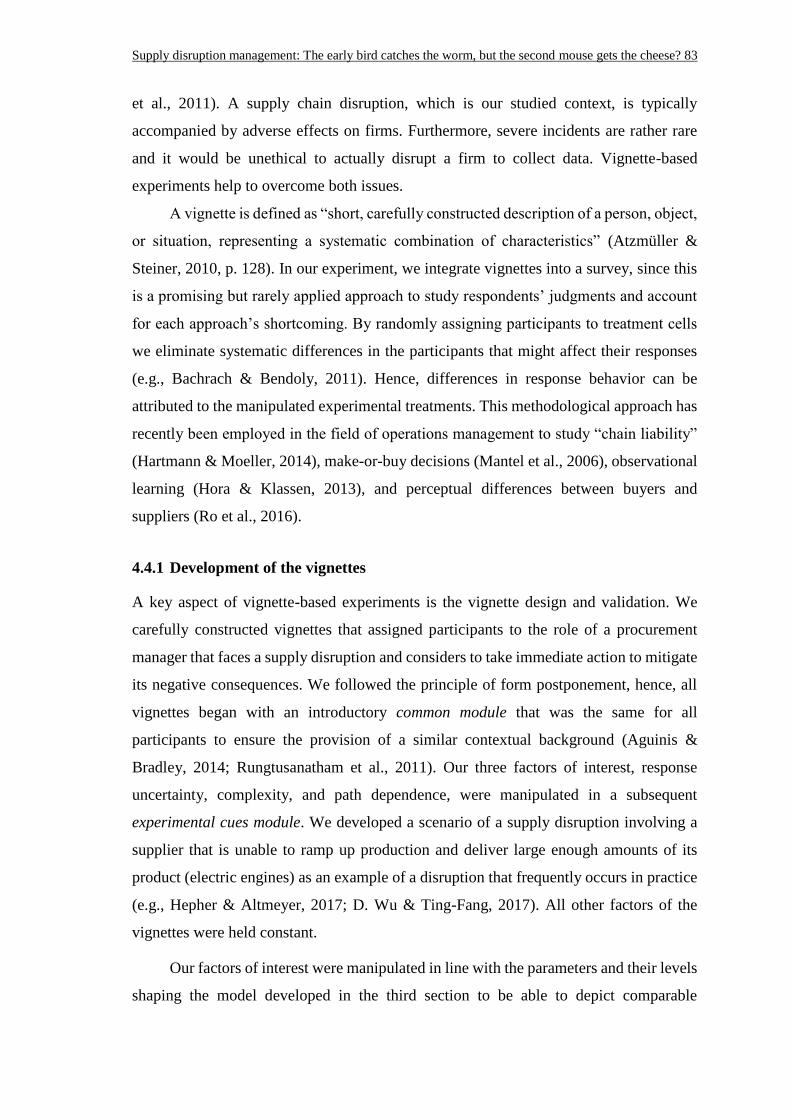
Supply disruption management: The early bird catches the worm, but the second mouse gets the cheese? 83
et al., 2011). A supply chain disruption, which is our studied context, is typically
accompanied by adverse effects on firms. Furthermore, severe incidents are rather rare
and it would be unethical to actually disrupt a firm to collect data. Vignette-based
experiments help to overcome both issues.
A vignette is defined as “short, carefully constructed description of a person, object,
or situation, representing a systematic combination of characteristics” (Atzmüller &
Steiner, 2010, p. 128). In our experiment, we integrate vignettes into a survey, since this
is a promising but rarely applied approach to study respondents’ judgments and account
for each approach’s shortcoming. By randomly assigning participants to treatment cells
we eliminate systematic differences in the participants that might affect their responses
(e.g., Bachrach & Bendoly, 2011). Hence, differences in response behavior can be
attributed to the manipulated experimental treatments. This methodological approach has
recently been employed in the field of operations management to study “chain liability”
(Hartmann & Moeller, 2014), make-or-buy decisions (Mantel et al., 2006), observational
learning (Hora & Klassen, 2013), and perceptual differences between buyers and
suppliers (Ro et al., 2016).
4.4.1 Development of the vignettes
A key aspect of vignette-based experiments is the vignette design and validation. We
carefully constructed vignettes that assigned participants to the role of a procurement
manager that faces a supply disruption and considers to take immediate action to mitigate
its negative consequences. We followed the principle of form postponement, hence, all
vignettes began with an introductory common module that was the same for all
participants to ensure the provision of a similar contextual background (Aguinis &
Bradley, 2014; Rungtusanatham et al., 2011). Our three factors of interest, response
uncertainty, complexity, and path dependence, were manipulated in a subsequent
experimental cues module. We developed a scenario of a supply disruption involving a
supplier that is unable to ramp up production and deliver large enough amounts of its
product (electric engines) as an example of a disruption that frequently occurs in practice
(e.g., Hepher & Altmeyer, 2017; D. Wu & Ting-Fang, 2017). All other factors of the
vignettes were held constant.
Our factors of interest were manipulated in line with the parameters and their levels
shaping the model developed in the third section to be able to depict comparable
Supply disruption management: The early bird catches the worm, but the second mouse gets the cheese? 84
scenarios. To maintain an adequate degree of complexity for the participants, we
restricted the experiment to a static one-shot decision, focused on low and high levels of
response uncertainty, and abstained from including duration of response uncertainty as a
further factor. In total, using a 2 (response uncertainty: Low or high) x 2 (complexity:
Low or high) x 2 (path dependence: None or strong) full factorial design, we created eight
vignettes. After reading a vignette, participants were asked to imagine themselves in the
role of the procurement manager in the described scenario and indicate their willingness
to take immediate action. We utilized a form of indirect questioning (projective
technique) to limit potential demand characteristics and effects of social desirability
(Thomas et al., 2013). In addition, respondents were supposed to report their risk attitude.
In order to measure the latter, we employed the general risk question (Dohmen et al.,
2011) which is widely used and requires participants to rate their individual willingness
to take risks on a 11-point Likert-type scale. It has been shown to be a very good predictor
of risk-related behavior.
Two different levels of response uncertainty were described by varying how
uncertain it was that the proposed action positively influenced the depicted supply
disruption’s negative consequences. It was either quite certain (low) or very uncertain
(high) that the consequences of taking action could be predicted. Complexity was varied
by manipulating the independence of the decision. In the low complexity setting, the
decision needed to be taken in a slightly complex environment with minor impact on other
internal processes and its success was almost independent of the actions of colleagues. In
the high complexity setting, the decision needed to be taken in a very complex
environment with a very large impact on other internal processes and its success was very
much dependent on the actions of colleagues. Path dependence was manipulated by
varying the extent to which future options were limited by the decision to immediately
act or not. They were either not (none) or heavily (strong) limited.
As recommended by Wason et al. (2002), the vignettes were pre-tested with 85
students that were randomly assigned to one of the eight treatment condition to assess the
vignettes’ validity, internal consistency, and realism. After reading the vignettes, students
were asked to indicate their willingness to act and responded to manipulation checks to
ensure that different levels of the independent variables were appropriately represented.
Average responses for complexity and path dependence were significantly different
between low and high treatment groups. We included three levels of response uncertainty
Supply disruption management: The early bird catches the worm, but the second mouse gets the cheese? 85
in our pretest (Low, medium, and high), however, there were no significant differences
between medium and high response uncertainty. In order to address this shortcoming and
reduce the complexity for our participants, we focused on low and high levels of response
uncertainty in the final experiment. The students also rated the realism for the scenario
description on a seven-point scale (1 = “not at all” to 7 = “totally”). The vignettes
appeared realistic with mean responses ranging from 4.50 to 6.29 (grand mean is 5.61).
4.4.2 Study participants
Data were collected by means of a self-administered online experiment. Between June
and September 2017, 1056 managers with direct experience in supply chain management
from Germany, Austria, and Switzerland, have been invited to participate in our
experiment. Contact addresses were obtained from a commercial business data provider.
The managers received an invitation via e-mail and were randomly assigned to one of the
eight treatment conditions. 112 of them completed the experiment, resulting in an
effective response rate of 10.61%. On average, participants had almost 18 years of
experience in supply chain management (SD = 10.33). Two observations were dropped
due to outlier analysis, resulting in 110 usable vignettes.
4.4.3 Dependent variable
By means of our vignette experiments, we aim to reveal how response uncertainty,
complexity, and path dependence affect the intentions of managers to take immediate
action in response to supply disruptions. The decision to take immediate action can be
seen as being binary, however, binary outcomes provide only little variance to explain
and understand the effects of response uncertainty, complexity, and path dependence on
such decisions. We follow McKelvie et al. (2011) and Cantor, Blackhurst, and Cortes
(2014) by operationalizing our dependent variable as the participant’s intention to take
immediate action (ITA), on a nine-point scale (anchored at 1 := “not at all likely” to 9 :=
“totally likely”). The specific action to be considered is described in detail in each
vignette.
4.4.4 Manipulation checks
As in the pre-test, we verified that each participant perceived differences in our
manipulations of the independent variables, as intended. To this end, all participants were
Supply disruption management: The early bird catches the worm, but the second mouse gets the cheese? 86
asked to respond to several manipulation checks, on seven-point scales (1 := “not at all”
to 7 := “totally”), after reading and responding to a vignette. To assess the perceived level
of response uncertainty, participants were asked to indicate to which extent they agree
that the consequences of the proposed action were very uncertain. The respondents’
perception of low and high levels of response uncertainty were significantly different
(Mlow = 2.61, Mhigh = 5.92; t(108), p < 0.001). To validate the manipulation of complexity,
we asked participants to evaluate whether the decision had to be taken in a very complex
environment. The participants’ responses were significantly different for low and high
levels of complexity (Mlow = 1.85, Mhigh = 6.04; t(108), p < 0.001). Finally, to check
whether the two levels of path dependence were perceived to be different, participants
rated to which extent they agree that the depicted decision limited future opportunities to
a very large extent. Respondents reported higher degrees of agreement when path
dependence was strong compared to when it was absent (Mnone = 2.17, Mstrong = 5.49;
t(108), p < 0.001).
4.4.5 Results
We relied on analysis of variance (ANOVA) to dissect our participants’ intentions.
Parametric tests (e.g., ANOVA) are appropriate and robust for Likert-type data and can
be used with “small sample sizes, with unequal variances, and with non-normal
distributions, with no fear of ‘coming to the wrong conclusion’” (Norman, 2010, p. 631).
A three-way ANOVA with response uncertainty (low or high), complexity (low or high),
and path dependence (none or strong) as between-subjects factors and ITA as dependent
variable was conducted. Table 12 contains information on the number of participants per
cell, cell means, and corresponding standard deviations for our dependent variable ITA.
The results revealed significant main effects of response uncertainty (F = 25.07, p
< 0.001), complexity (F = 17.19, p < 0.001), and path dependence (F = 4.77, p = 0.03) on
ITA. Low response uncertainty led to higher levels of ITA (Mlow = 5.02, SD = 2.60) than
high response uncertainty (Mhigh = 2.94, SD = 1.91). The low complexity treatment
revealed higher levels of ITA (Mlow = 5.00, SD = 2.46) than the high complexity treatment
(Mhigh = 3.14, SD = 2.24). Finally, the absence of path dependence resulted in a higher
willingness to take immediate action (Mnone = 4.58, SD = 2.53) than its presence (Mstrong
= 3.56, SD = 2.43). No statistically significant interaction effects between these three
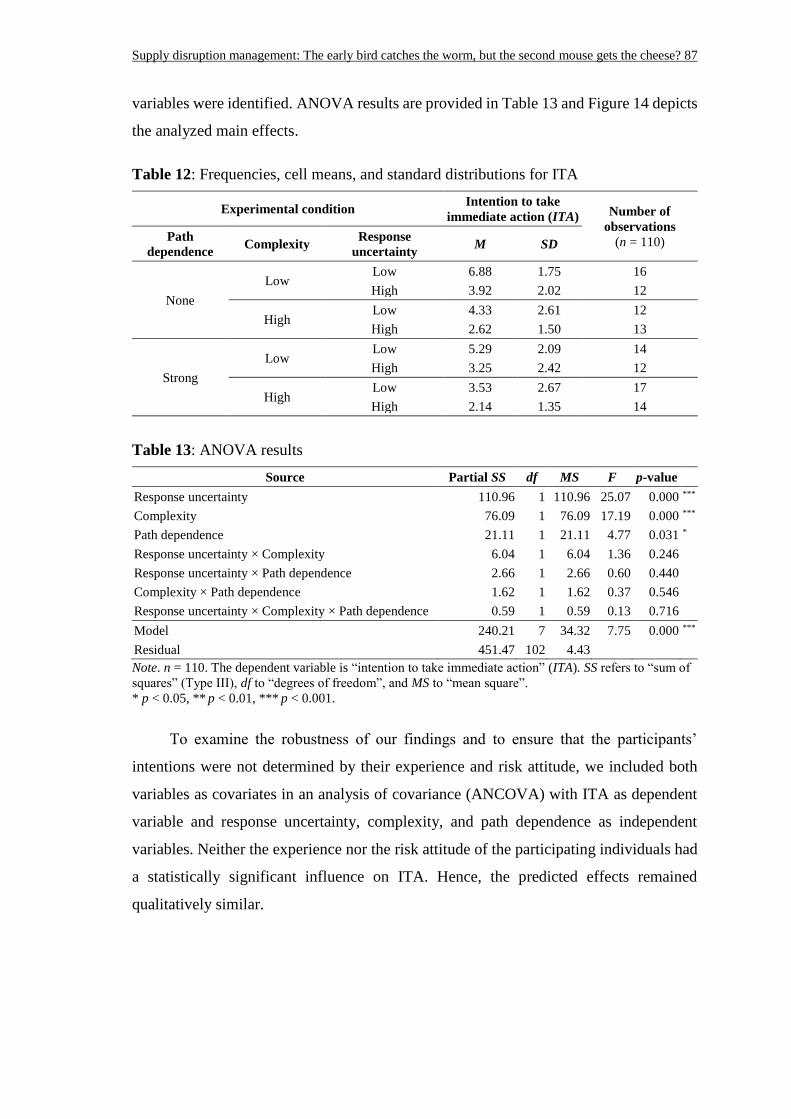
Supply disruption management: The early bird catches the worm, but the second mouse gets the cheese? 87
variables were identified. ANOVA results are provided in Table 13 and Figure 14 depicts
the analyzed main effects.
Table 12: Frequencies, cell means, and standard distributions for ITA
Experimental condition Intention to take
immediate action (ITA) Number of
observations
(n = 110) Path
dependence Complexity
Response
uncertainty M SD
None
Low Low 6.88 1.75 16
High 3.92 2.02 12
High Low 4.33 2.61 12
High 2.62 1.50 13
Strong
Low Low 5.29 2.09 14
High 3.25 2.42 12
High Low 3.53 2.67 17
High 2.14 1.35 14
Table 13: ANOVA results
Source Partial SS df MS F p-value
Response uncertainty 110.96 1 110.96 25.07 0.000 ***
Complexity 76.09 1 76.09 17.19 0.000 ***
Path dependence 21.11 1 21.11 4.77 0.031 *
Response uncertainty × Complexity 6.04 1 6.04 1.36 0.246
Response uncertainty × Path dependence 2.66 1 2.66 0.60 0.440
Complexity × Path dependence 1.62 1 1.62 0.37 0.546
Response uncertainty × Complexity × Path dependence 0.59 1 0.59 0.13 0.716
Model 240.21 7 34.32 7.75 0.000 ***
Residual 451.47 102 4.43
Note. n = 110. The dependent variable is “intention to take immediate action” (ITA). SS refers to “sum of
squares” (Type III), df to “degrees of freedom”, and MS to “mean square”.
* p < 0.05, ** p < 0.01, *** p < 0.001.
To examine the robustness of our findings and to ensure that the participants’
intentions were not determined by their experience and risk attitude, we included both
variables as covariates in an analysis of covariance (ANCOVA) with ITA as dependent
variable and response uncertainty, complexity, and path dependence as independent
variables. Neither the experience nor the risk attitude of the participating individuals had
a statistically significant influence on ITA. Hence, the predicted effects remained
qualitatively similar.
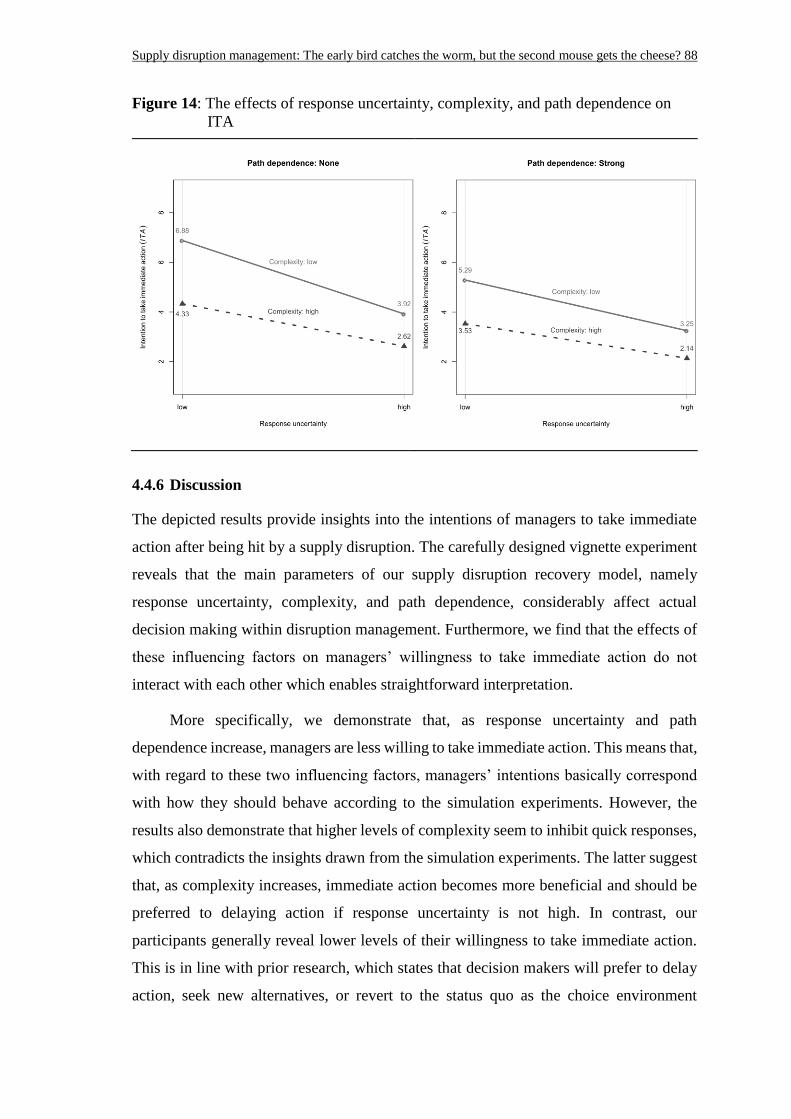
Supply disruption management: The early bird catches the worm, but the second mouse gets the cheese? 88
Figure 14: The effects of response uncertainty, complexity, and path dependence on
ITA
4.4.6 Discussion
The depicted results provide insights into the intentions of managers to take immediate
action after being hit by a supply disruption. The carefully designed vignette experiment
reveals that the main parameters of our supply disruption recovery model, namely
response uncertainty, complexity, and path dependence, considerably affect actual
decision making within disruption management. Furthermore, we find that the effects of
these influencing factors on managers’ willingness to take immediate action do not
interact with each other which enables straightforward interpretation.
More specifically, we demonstrate that, as response uncertainty and path
dependence increase, managers are less willing to take immediate action. This means that,
with regard to these two influencing factors, managers’ intentions basically correspond
with how they should behave according to the simulation experiments. However, the
results also demonstrate that higher levels of complexity seem to inhibit quick responses,
which contradicts the insights drawn from the simulation experiments. The latter suggest
that, as complexity increases, immediate action becomes more beneficial and should be
preferred to delaying action if response uncertainty is not high. In contrast, our
participants generally reveal lower levels of their willingness to take immediate action.
This is in line with prior research, which states that decision makers will prefer to delay
action, seek new alternatives, or revert to the status quo as the choice environment
Supply disruption management: The early bird catches the worm, but the second mouse gets the cheese? 89
becomes complex (Dhar, 1997). However, we thereby identify and provide empirical
support for an important mismatch between how managers should behave and how they
actually intend to act.
4.5 General discussion
Recovering from supply disruptions is a challenging task for the responsible managers.
Typically, the subsequent decision making process is characterized by response
uncertainty, complexity, and path dependence. Response uncertainty results from a lack
of being able to precisely predict the consequences of response alternatives, complexity
is driven by interactions among decisions, and path dependence stems from considerable
expenditures required to change the operational setting of a firm. Against this backdrop,
our multi-method study contributes to the emerging literature on supply disruption
management by (1) providing insights into disruption recovery processes, (2) clearly
defining RAF and RFA and delineating their implications for the recovery performance
of firms by providing testable propositions, (3) revealing actual intentions of managers
regarding their willingness to take immediate action in response to supply disruptions,
and (4) considering distorted performance evaluations in the NK model by incorporating
uncertainty.
4.5.1 Implications for research
This research analyzes the conditions under which a firm should decide to delay the initial
recovery action to a point where more accurate information has been accumulated and
investigates how managers actually intend to act. In this context, we have identified two
archetypical approaches of organizational decision making: RAF and RFA. The former
characterizes firms that tend to collect further information before taking action in the
hopes of being able to make better informed decisions by eliminating response
uncertainty. This means that analysis precedes and enables action. Thus, RAF resembles
the rather rational approach to problem solving, similar to what one of the procurement
executives that we interviewed explained: “Discovery, then we collected information.
[…] Then you consider, what can you do? You develop options and alternatives.
Afterwards you try to decide which one can be applied. Then, implementation and
monitoring.”
Supply disruption management: The early bird catches the worm, but the second mouse gets the cheese? 90
RFA represents firms that respond immediately to a supply disruption, even if
response uncertainty is present. Procurement executives stated the following when asked
about their response to supply disruptions: “We immediately started bottleneck-
management, before we exactly knew how the situation really is”, “acting started
immediately after the discovery”, and that they “did not initially build large teams to
discuss it, we rather needed to act very quickly.” Based on imprecise or incomplete
information on the consequences of response alternatives, they took action to be able to
observe results that enable further adjustment. One respondent described such a process:
“We tried to find short-term solutions first. We took action and when we […] did not
reach the performance that was supposed to be reached, we decided to take another
path.” Following Weick’s (1979) idea, these firms emphasize the use of action to make
sense of observable outcomes. Thus, action is assumed to clarify the situation and create
meaningful insights to guide and enable subsequent decisions.
Table 14: Summary of propositions
P1 If the environment is highly complex and actions are reversible, then PDPRFA > PDPRAF.
P2 If the environment is highly complex, actions are irreversible, and response uncertainty is low or
medium, then PDPRFA > PDPRAF.
P3 If actions are reversible, then FPRFA ≥ FPRAF.
P4 If the environment is highly complex and actions are reversible, then FPRFA increases with the
level and the duration of response uncertainty.
P5 If the environment is highly complex, actions are irreversible, and response uncertainty is high,
then FPRAF > FPRFA.
P6 If the environment is highly complex and response uncertainty is low or medium, then URPRFA ≥
URPRAF.
P7 If actions are irreversible and response uncertainty is neither high nor long-lasting, then NTPRFA
< NTPRAF.
P8 If actions are reversible and response uncertainty is medium or high, then NTPRAF < NTPRFA.
Different authors have advocated either RAF (e.g., Kepner & Tregoe, 1965) or RFA
(e.g., Peters & Waterman, 1982), but the implications of both approaches on a firm’s
disruption recovery performance in complex settings accompanied by response
uncertainty and path dependence have not yet been examined. The findings of our
simulation experiments, summarized in eight testable propositions shown in Table 14,
address this important research gap. Obviously, firms that apply RFA are exposed to the
risk of erroneously altering their operating procedures in the belief that the change will
lead to better firm performance. Although the expected performance of an alternative
configuration might be greater than the performance of the current configuration, the true
performance might be reduced, because the performance values of alternative
Supply disruption management: The early bird catches the worm, but the second mouse gets the cheese? 91
configurations are distorted by response uncertainty in the early stages of a recovery
process.
In line with the insights provided in the third section, we furthermore demonstrate
that response uncertainty and path dependence reduce the actual willingness of managers
to take immediate action. However, higher levels of complexity have a similar effect,
although managers should actually respond quickly to supply disruptions in complex
environment if response uncertainty is not high. This circumstance illustrates a
considerable mismatch between managers’ intentions and their optimal behavior
according to our findings. Moreover, we do not find evidence for an action bias in post
supply disruption decision making (Bar-Eli, Azar, Ritov, Keidar-Levin, & Schein, 2007).
On the contrary, managers react sensitively to high levels of response uncertainty,
complexity, and path dependence and reduce their willingness to take immediate action.
4.5.2 Implications for practice
In addition to the theoretical implications discussed above, the results of our research also
have important implications for practice. Managers responding to supply disruptions need
to be aware of the conditions that characterize their environment. The level of response
uncertainty that firms face considerably affects the ramifications of delaying action or
immediately responding to a supply disruption. In complex environments, only if
response uncertainty is perceived to be high and long-lasting, waiting for more
information can be advisable, based on our results. Furthermore, managers are required
to trade off the accuracy of their actions against the speed of their reaction. On the one
hand, delaying a response results in more precise first improvements and requires less
changes to be made. On the other hand, immediate responses on average result in quicker
recovery of firm performance. Moreover, the long-term performance of firms is, on
average, not weakened but rather strengthened by response uncertainty if detrimental
decisions can be reversed. In complex environments, firms may also benefit from quick
responses in the short run and may increase their market share as Nokia did in did in the
aftermath of the aforementioned disruption.
Furthermore, previous research on decision making behavior highlighted the
influence of cognitive biases on the decision to act or not to act. Managers should be
aware of these biases to avoid being misled in their decision of when to respond to a
supply disruption. Some decision makers tend to be biased towards analysis (Kerstholt,
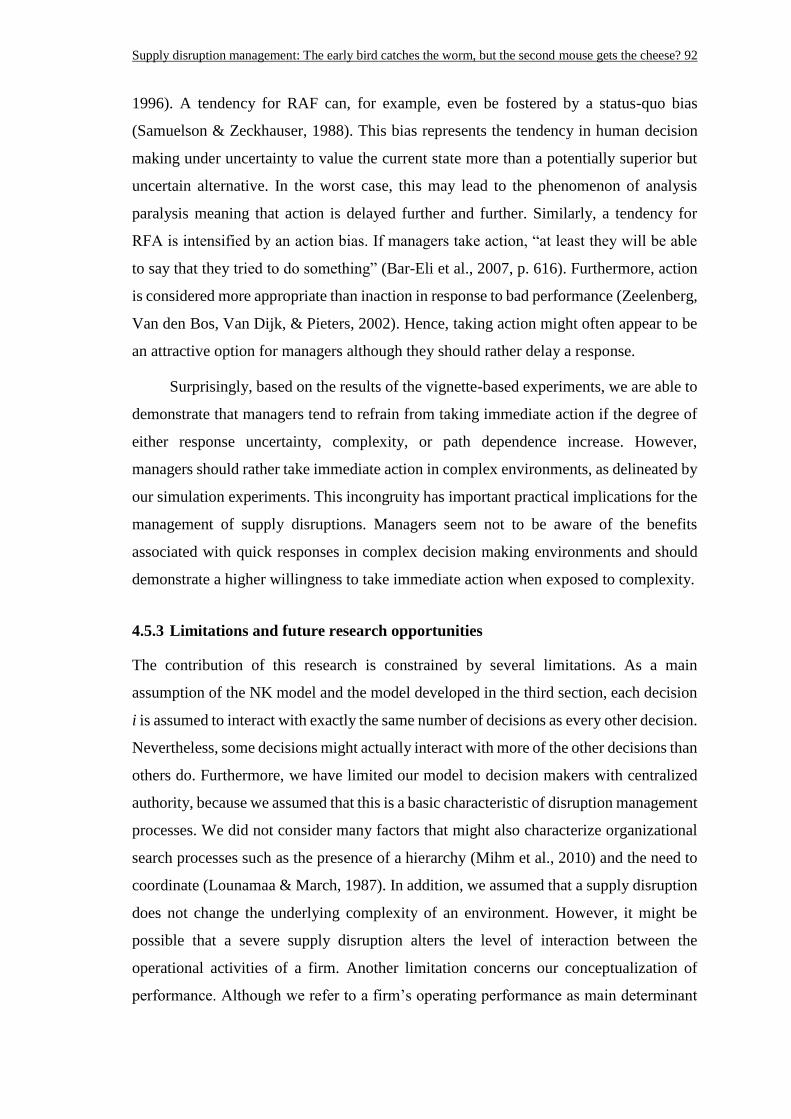
Supply disruption management: The early bird catches the worm, but the second mouse gets the cheese? 92
1996). A tendency for RAF can, for example, even be fostered by a status-quo bias
(Samuelson & Zeckhauser, 1988). This bias represents the tendency in human decision
making under uncertainty to value the current state more than a potentially superior but
uncertain alternative. In the worst case, this may lead to the phenomenon of analysis
paralysis meaning that action is delayed further and further. Similarly, a tendency for
RFA is intensified by an action bias. If managers take action, “at least they will be able
to say that they tried to do something” (Bar-Eli et al., 2007, p. 616). Furthermore, action
is considered more appropriate than inaction in response to bad performance (Zeelenberg,
Van den Bos, Van Dijk, & Pieters, 2002). Hence, taking action might often appear to be
an attractive option for managers although they should rather delay a response.
Surprisingly, based on the results of the vignette-based experiments, we are able to
demonstrate that managers tend to refrain from taking immediate action if the degree of
either response uncertainty, complexity, or path dependence increase. However,
managers should rather take immediate action in complex environments, as delineated by
our simulation experiments. This incongruity has important practical implications for the
management of supply disruptions. Managers seem not to be aware of the benefits
associated with quick responses in complex decision making environments and should
demonstrate a higher willingness to take immediate action when exposed to complexity.
4.5.3 Limitations and future research opportunities
The contribution of this research is constrained by several limitations. As a main
assumption of the NK model and the model developed in the third section, each decision
i is assumed to interact with exactly the same number of decisions as every other decision.
Nevertheless, some decisions might actually interact with more of the other decisions than
others do. Furthermore, we have limited our model to decision makers with centralized
authority, because we assumed that this is a basic characteristic of disruption management
processes. We did not consider many factors that might also characterize organizational
search processes such as the presence of a hierarchy (Mihm et al., 2010) and the need to
coordinate (Lounamaa & March, 1987). In addition, we assumed that a supply disruption
does not change the underlying complexity of an environment. However, it might be
possible that a severe supply disruption alters the level of interaction between the
operational activities of a firm. Another limitation concerns our conceptualization of
performance. Although we refer to a firm’s operating performance as main determinant
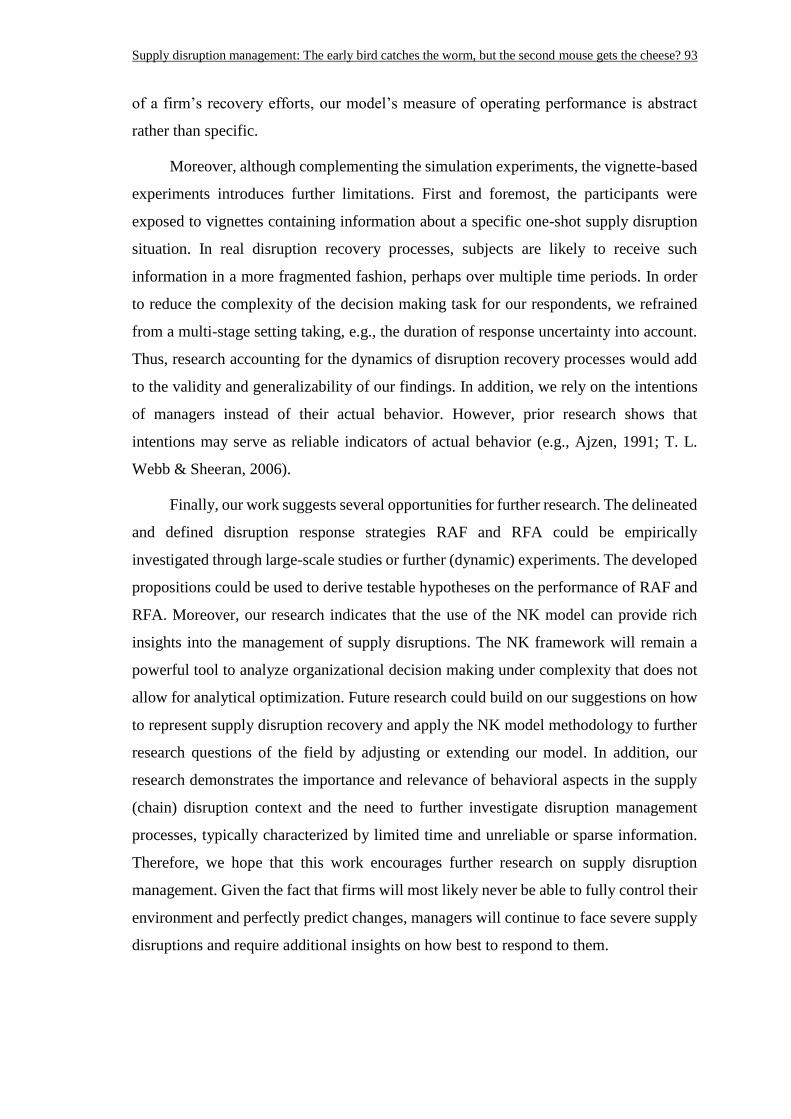
Supply disruption management: The early bird catches the worm, but the second mouse gets the cheese? 93
of a firm’s recovery efforts, our model’s measure of operating performance is abstract
rather than specific.
Moreover, although complementing the simulation experiments, the vignette-based
experiments introduces further limitations. First and foremost, the participants were
exposed to vignettes containing information about a specific one-shot supply disruption
situation. In real disruption recovery processes, subjects are likely to receive such
information in a more fragmented fashion, perhaps over multiple time periods. In order
to reduce the complexity of the decision making task for our respondents, we refrained
from a multi-stage setting taking, e.g., the duration of response uncertainty into account.
Thus, research accounting for the dynamics of disruption recovery processes would add
to the validity and generalizability of our findings. In addition, we rely on the intentions
of managers instead of their actual behavior. However, prior research shows that
intentions may serve as reliable indicators of actual behavior (e.g., Ajzen, 1991; T. L.
Webb & Sheeran, 2006).
Finally, our work suggests several opportunities for further research. The delineated
and defined disruption response strategies RAF and RFA could be empirically
investigated through large-scale studies or further (dynamic) experiments. The developed
propositions could be used to derive testable hypotheses on the performance of RAF and
RFA. Moreover, our research indicates that the use of the NK model can provide rich
insights into the management of supply disruptions. The NK framework will remain a
powerful tool to analyze organizational decision making under complexity that does not
allow for analytical optimization. Future research could build on our suggestions on how
to represent supply disruption recovery and apply the NK model methodology to further
research questions of the field by adjusting or extending our model. In addition, our
research demonstrates the importance and relevance of behavioral aspects in the supply
(chain) disruption context and the need to further investigate disruption management
processes, typically characterized by limited time and unreliable or sparse information.
Therefore, we hope that this work encourages further research on supply disruption
management. Given the fact that firms will most likely never be able to fully control their
environment and perfectly predict changes, managers will continue to face severe supply
disruptions and require additional insights on how best to respond to them.
Conclusion and future research directions 94
Chapter 5 Conclusion and future research
directions
This chapter summarizes the research delineated in the previous chapters and highlights
the main answers to the research questions formulated in Chapter 1. In addition, the main
limitations of this dissertation research and avenues for future research are discussed.
5.1 Summary
The extant research has focused on supply risk and disruption management from a firm
perspective, however, a firm’s responsible decision makers play a key role in addressing
supply risk and disruptions. In the first chapter of this dissertation, three important but yet
unclear behavioral issues have been identified in this context. They have been addressed
by the studies presented in Chapters 2, 3, and 4. Their results are summarized in the
following.
5.1.1 Research question 1: Supply risk management
The increasing complexity and interconnectedness of modern supply chains have added
to the vulnerability of many firms to suffer from supply disruptions. Although most
supply chain managers are well-aware of their potentially severe negative consequences,
recent major disruptions have revealed that many supply chain managers prove
unprepared to effectively recover their firms’ operational performance (A.T. Kearney &
RapidRatings, 2018). Given that there is a need to better understand why some managers
proactively prepare for supply disruptions and others do not, Research Question 1 was
formulated.
To provide answers to Research Question 1, the research presented in Chapter 2
builds on PMT and its underlying idea of cognitive appraisal processes that determine an
individual’s intention to adopt a specific proactive measure. In addition, based on a
framework delineating key antecedents of proactive work behavior developed by Frese
and Fay (2001), this research accounts for the effects of certain individual-specific factors
on proactivity. By means of a carefully designed DCE, empirical data were collected to
explore the choice behavior of supply chain managers in the context of supply risk
management and evaluate the developed propositions. The data enabled an assessment of
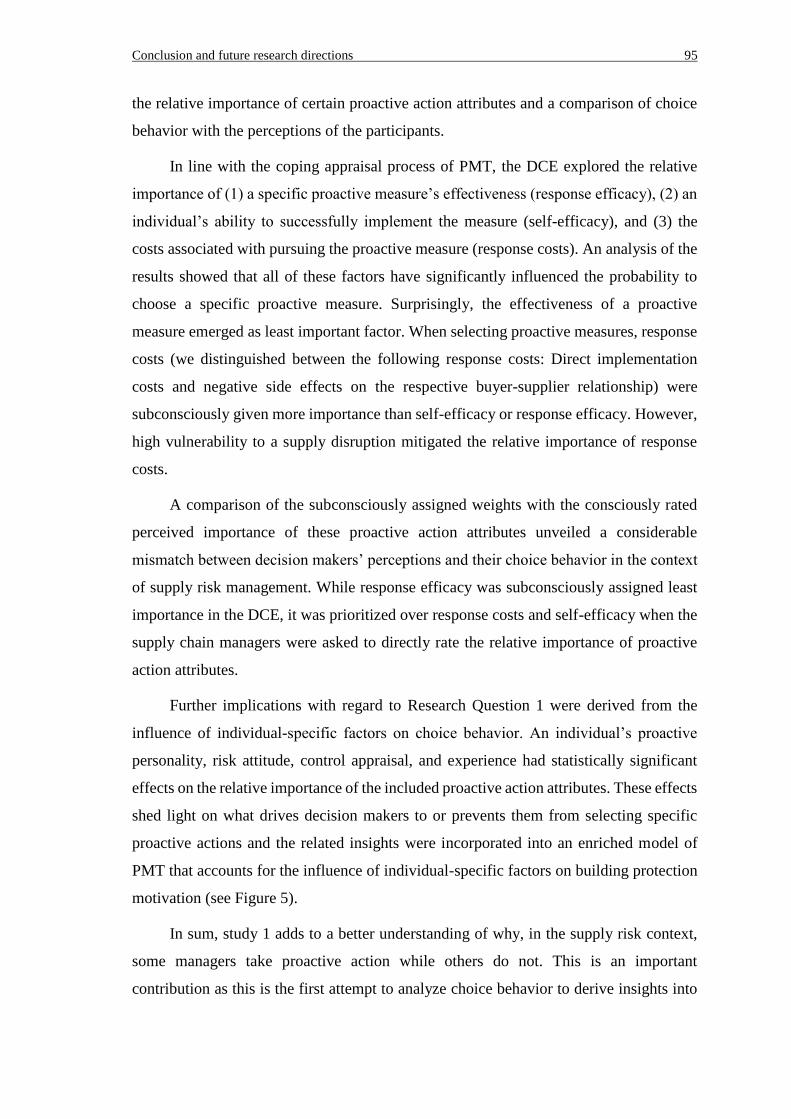
Conclusion and future research directions 95
the relative importance of certain proactive action attributes and a comparison of choice
behavior with the perceptions of the participants.
In line with the coping appraisal process of PMT, the DCE explored the relative
importance of (1) a specific proactive measure’s effectiveness (response efficacy), (2) an
individual’s ability to successfully implement the measure (self-efficacy), and (3) the
costs associated with pursuing the proactive measure (response costs). An analysis of the
results showed that all of these factors have significantly influenced the probability to
choose a specific proactive measure. Surprisingly, the effectiveness of a proactive
measure emerged as least important factor. When selecting proactive measures, response
costs (we distinguished between the following response costs: Direct implementation
costs and negative side effects on the respective buyer-supplier relationship) were
subconsciously given more importance than self-efficacy or response efficacy. However,
high vulnerability to a supply disruption mitigated the relative importance of response
costs.
A comparison of the subconsciously assigned weights with the consciously rated
perceived importance of these proactive action attributes unveiled a considerable
mismatch between decision makers’ perceptions and their choice behavior in the context
of supply risk management. While response efficacy was subconsciously assigned least
importance in the DCE, it was prioritized over response costs and self-efficacy when the
supply chain managers were asked to directly rate the relative importance of proactive
action attributes.
Further implications with regard to Research Question 1 were derived from the
influence of individual-specific factors on choice behavior. An individual’s proactive
personality, risk attitude, control appraisal, and experience had statistically significant
effects on the relative importance of the included proactive action attributes. These effects
shed light on what drives decision makers to or prevents them from selecting specific
proactive actions and the related insights were incorporated into an enriched model of
PMT that accounts for the influence of individual-specific factors on building protection
motivation (see Figure 5).
In sum, study 1 adds to a better understanding of why, in the supply risk context,
some managers take proactive action while others do not. This is an important
contribution as this is the first attempt to analyze choice behavior to derive insights into
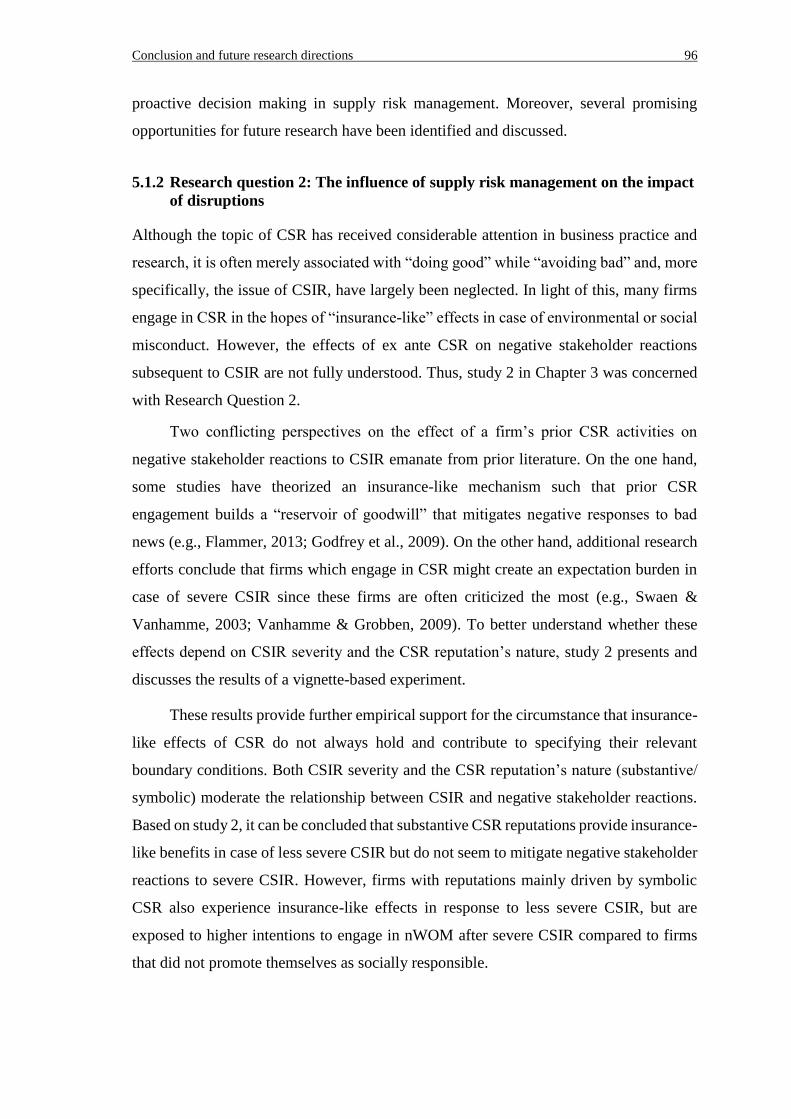
Conclusion and future research directions 96
proactive decision making in supply risk management. Moreover, several promising
opportunities for future research have been identified and discussed.
5.1.2 Research question 2: The influence of supply risk management on the impact
of disruptions
Although the topic of CSR has received considerable attention in business practice and
research, it is often merely associated with “doing good” while “avoiding bad” and, more
specifically, the issue of CSIR, have largely been neglected. In light of this, many firms
engage in CSR in the hopes of “insurance-like” effects in case of environmental or social
misconduct. However, the effects of ex ante CSR on negative stakeholder reactions
subsequent to CSIR are not fully understood. Thus, study 2 in Chapter 3 was concerned
with Research Question 2.
Two conflicting perspectives on the effect of a firm’s prior CSR activities on
negative stakeholder reactions to CSIR emanate from prior literature. On the one hand,
some studies have theorized an insurance-like mechanism such that prior CSR
engagement builds a “reservoir of goodwill” that mitigates negative responses to bad
news (e.g., Flammer, 2013; Godfrey et al., 2009). On the other hand, additional research
efforts conclude that firms which engage in CSR might create an expectation burden in
case of severe CSIR since these firms are often criticized the most (e.g., Swaen &
Vanhamme, 2003; Vanhamme & Grobben, 2009). To better understand whether these
effects depend on CSIR severity and the CSR reputation’s nature, study 2 presents and
discusses the results of a vignette-based experiment.
These results provide further empirical support for the circumstance that insurance-
like effects of CSR do not always hold and contribute to specifying their relevant
boundary conditions. Both CSIR severity and the CSR reputation’s nature (substantive/
symbolic) moderate the relationship between CSIR and negative stakeholder reactions.
Based on study 2, it can be concluded that substantive CSR reputations provide insurance-
like benefits in case of less severe CSIR but do not seem to mitigate negative stakeholder
reactions to severe CSIR. However, firms with reputations mainly driven by symbolic
CSR also experience insurance-like effects in response to less severe CSIR, but are
exposed to higher intentions to engage in nWOM after severe CSIR compared to firms
that did not promote themselves as socially responsible.
Conclusion and future research directions 97
Being the first study that explicitly addressed the role of ex ante CSR reputations
on negative stakeholder reactions to CSIR in a B2B environment, the results contribute
to an improved understanding of CSIR-related risk and disruption management. In
addition, this study provides valuable empirical support for CSR engagement based on
instrumental rather than moral motives.
5.1.3 Research question 3: Supply disruption management
Supply disruptions pose considerable challenges to managers that seek to recover from
their negative consequences. After being exposed to supply disruptions, managers
typically face unreliable information about the consequences of possible response actions.
In this context, it is not trivial to decide on whether to wait until more reliable information
are available or directly launch response actions. Hence, to gain a better understanding of
how to effectively respond to supply disruptions, the research presented in Chapter 4 has
addressed Research Question 3 by means of a multi-method approach.
In a first step, simulation experiments with an agent-based model of supply
disruption recovery revealed how managers should behave in response to supply
disruptions. The model was developed based on complexity, response uncertainty, and
path dependence as main determinants of a supply chain manager’s environment in the
aftermath of a supply disruption. The results highlight that high complexity favors quick
action to be able to make sense of observable outcomes, but if response uncertainty is
high, more reliable information should be acquired before action is taken. Further key
insights were summarized in eight testable propositions which provide promising
opportunities for future research.
In a second step, the actual willingness of managers to take immediate action
subsequent to being affected by a supply disruption was explored. An analysis of data
from vignette-based experiments showed that response uncertainty and path dependence
reduced the participants’ intention to quickly respond to supply disruptions. Moreover,
although managers should actually respond quickly to supply disruptions in highly
complex environments if response uncertainty is not high, the results reveal that managers
tend to refrain from a quick response in case of high complexity. Hence, the multi-method
approach enabled the identification of a considerable mismatch between managers’
intentions and the recommended behavior based on the simulation experiments. Thereby,
Study 3 contributes to the emerging literature on supply disruption recovery and adds to
Conclusion and future research directions 98
a better understanding of decision making behavior in the context of supply disruption
management.
5.2 Limitations
As with any empirical research, the results presented in this dissertation must be viewed
in light of certain overarching limitations concerning the data and the research designs.
First, the behavioral experiments conducted in Study 1 (discrete choice), Study 2
(vignette-based), and Study 3 (vignette-based) rely on intentions instead of actual
behavior as their outcome criteria. Stated intentions are considered the best predictors of
actual behavior (Ajzen, 1991; T. L. Webb & Sheeran, 2006). However, research has
shown that intentions are not perfectly correlated with future behavior, especially if there
is a large time lapse between measuring intentions and behavior or if an individual is
unable to act on an intention due to a lack of skills or unanticipated barriers (Fishbein,
2008; Morwitz, 1997). Hence, replicating the experiments with actual behavior as
outcome variable would enhance the explanatory power of the results presented.
Second, this dissertation focusses on individuals with centralized decision making
authority to investigate the behavior of purchasing professionals. Hence, the studies
conducted did not account for certain characteristics of industrial buying situations such
as hierarchical structures (W. J. Johnston & Bonoma, 1981), codes of conduct (Wotruba,
Chonko, & Loe, 2001), and the need to coordinate with other functions (Kocabasoglu &
Suresh, 2006). Thus, a worthwhile next step would be to develop research designs that
incorporate these characteristics and more comprehensively examine decision making
behavior in industrial buying situations.
Finally, the experiments with purchasing professionals conducted in Study 1, Study
2, and Study 3 mostly relied on respondents from German-speaking countries (Austria,
Germany, and Switzerland) which have relatively similar cultures (Hofstede, 1984,
2003). Their responses were treated as a single data set in the statistical analyses, since
previous research did not indicate any differences among these countries. However, it has
been shown that culture may influence behavior (e.g., Money et al., 1998). In addition,
the frequency and severity of natural disasters in Austria, Germany, and Switzerland are
very low compared to other countries or regions (e.g., Asia or the US) (Helferich &
Robert, 2002) which may have repercussions on the behavior of purchasing professionals.
Conclusion and future research directions 99
Hence, replicating the experiments conducted as part of this dissertation research with
respondents from other cultural regions or from countries with different risk profiles
would be a promising next step to disentangle the influence of culture and environmental
conditions on choice behavior in the context of supply risks and supply disruptions.
5.3 Outlook
In addition to addressing the limitations mentioned above, several fruitful avenues for
future research in the area of supply risks and disruptions emerge from this dissertation
research.
First, the model of supply disruption recovery presented in Study 3 could serve as
a basis for further research on managing supply disruptions. Using an adjusted or
extended version of the model might provide additional insights into decision making
behavior of purchasing professionals. For example, although Study 3 focusses on whether
to delay a response subsequent to supply disruptions, the model could be used to
investigate the recovery performance implications of teams instead of single respondents
or account for different organizational structures. Moreover, the simulation experiments
in Study 3 have led to eight testable propositions which could be empirically investigated
by means of large-scale studies or dynamic experiments.
Second, although this dissertation provides important contributions to the academic
discussion on behavioral issues of managing supply risks and disruptions, many relevant
questions remain unanswered. Despite the growing scholarly interest in individual level
behavior in the supply risk literature, research on behavioral aspects of managing supply
risks and disruptions is still scant especially in light of the fact that coping with supply
risks poses several managerial challenges. Study 1 has highlighted that certain individual-
specific factors affect proactive risk management decisions. However, it is likely that
further personality-related factors, such as measures of ambition and extraversion, could
also considerably impact the decisions of the responsible managers. In addition, the
influence of an individual’s cultural background or organizational codes of conduct on
the behavior of purchasing professionals remain largely unclear. Given that many firms
have considerably increased their degree of globalization during the last decades and
comprise a multi-cultural set of employees, these issues might have important
repercussions on decision making in supply risk and disruption management.
Conclusion and future research directions 100
Finally, this dissertation research strongly relies on experiments as methodological
approach to address the identified research questions. The studies’ results contribute
valuable insights into the behavior of purchasing professionals and, hence, highlight the
unique advantages of using experiments to study behavioral issues of supply risk and
disruption management such as control, efficiency, and responsiveness (Siemsen, 2011).
Nevertheless, supply chain researchers have only begun to exploit these benefits to, for
instance, augment or weaken the confidence in the validity of a theory by complementing
results of surveys or archival research with insights from behavioral experiments. Thus,
a promising avenue for future research on behavioral issues in supply risk and disruption
management is the intensified and innovative use of experiments.
References 101
References
A.T. Kearney, & RapidRatings. (2018). Managing supply risk: Are you prepared for a
black swan event? Retrieved from https://www.atkearney.com/analytics/article?
%2Fa%2Fmanaging-supply-risk-are-you-prepared-for-a-black-swan-event=&
utm_source=PRNewswire&utm_medium=PR&utm_campaign=2018americasat
kRR (accessed August 27, 2018).
Aguinis, H., & Bradley, K. J. (2014). Best practice recommendations for designing and
implementing experimental vignette methodology studies. Organizational
Research Methods, 17(4), 351-371.
Aguinis, H., Gottfredson, R. K., & Joo, H. (2013). Best-practice recommendations for
defining, identifying, and handling outliers. Organizational Research Methods,
16(2), 270-301.
Ajzen, I. (1991). The theory of planned behavior. Organizational Behavior and Human
Decision Processes, 50(2), 179-211.
Andersen, M., & Skjoett-Larsen, T. (2009). Corporate social responsibility in global
supply chains. Supply Chain Management: An International Journal, 14(2), 75-
86.
Anderson, E. J., Coltman, T., Devinney, T. M., & Keating, B. (2011). What drives the
choice of a third‐party logistics provider? Journal of Supply Chain Management,
47(2), 97-115.
Anderson, E. W., Fornell, C., & Lehmann, D. R. (1994). Customer satisfaction, market
share, and profitability: Findings from Sweden. Journal of Marketing, 58(3), 53-
66.
Anderson, R. E. (1973). Consumer dissatisfaction: The effect of disconfirmed
expectancy on perceived product performance. Journal of Marketing Research,
10(1), 38-44.
Antonetti, P., & Maklan, S. (2016). An extended model of moral outrage at corporate
social irresponsibility. Journal of Business Ethics, 135(3), 429-444.
Armstrong, J. S. (1977). Social irresponsibility in management. Journal of Business
Research, 5(3), 185-213.
Arvidsson, S. (2010). Communication of corporate social responsibility: A study of the
views of management teams in large companies. Journal of Business Ethics,
96(3), 339-354.
Ashforth, B. E., & Gibbs, B. W. (1990). The double-edge of organizational legitimation.
Organization Science, 1(2), 177-194.
Aspinwall, L. G., & Taylor, S. E. (1997). A stitch in time: Self-regulation and proactive
coping. Psychological Bulletin, 121(3), 417-436.
Atzmüller, C., & Steiner, P. M. (2010). Experimental vignette studies in survey
research. Methodology, 6(3), 128-138.
References 102
Axelrod, L. J., & Newton, J. W. (1991). Preventing nuclear war: Beliefs and attitudes as
predictors of disarmist and deterrentist behavior. Journal of Applied Social
Psychology, 21(1), 29-40.
Bachrach, D. G., & Bendoly, E. (2011). Rigor in behavioral experiments: A basic
primer for supply chain management researchers. Journal of Supply Chain
Management, 47(3), 5-8.
Bandura, A. (1977). Self-efficacy: Toward a unifying theory of behavioral change.
Psychological Review, 84(2), 191-215.
Bandura, A. (2006). Toward a psychology of human agency. Perspectives on
Psychological Science, 1(2), 164-180.
Bansal, P., & Clelland, I. (2004). Talking trash: Legitimacy, impression management,
and unsystematic risk in the context of the natural environment. Academy of
Management Journal, 47(1), 93-103.
Bar-Eli, M., Azar, O. H., Ritov, I., Keidar-Levin, Y., & Schein, G. (2007). Action bias
among elite soccer goalkeepers: The case of penalty kicks. Journal of Economic
Psychology, 28(5), 606-621.
Barr, P. S. (1998). Adapting to unfamiliar environmental events: A look at the evolution
of interpretation and its role in strategic change. Organization Science, 9(6),
644-669.
Bateman, T. S., & Crant, J. M. (1993). The proactive component of organizational
behavior: A measure and correlates. Journal of Organizational Behavior, 14(2),
103-118.
Batson, C. D. (1998). Altruism and prosocial behavior. In S. T. Fiske, D. T. Gilbert, &
L. Gardner (Eds.), The Handbook of Social Psychology (pp. 282-316). New
York, NY: McGraw-Hill.
Beinhocker, E. D. (1999). Robust adaptive strategies. MIT Sloan Management Review,
40(3), 95-106.
Ben-Akiva, M. E., & Lerman, S. R. (1985). Discrete Choice Analysis: Theory and
Application to Travel Demand. Cambridge, MA: MIT Press.
Bénabou, R., & Tirole, J. (2010). Individual and corporate social responsibility.
Economica, 77(305), 1-19.
Bergkvist, L., & Rossiter, J. R. (2007). The predictive validity of multiple-item versus
single-item measures of the same constructs. Journal of Marketing Research,
44(2), 175-184.
Blackhurst, J., Craighead, C. W., Elkins, D., & Handfield, R. B. (2005). An empirically
derived agenda of critical research issues for managing supply-chain disruptions.
International Journal of Production Research, 43(19), 4067-4081.
Bode, C., & Macdonald, J. R. (2017). Stages of supply chain disruption response:
Direct, constraining, and mediating factors for impact mitigation. Decision
Sciences, 48(5), 836-874.
Bode, C., & Wagner, S. M. (2015). Structural drivers of upstream supply chain
complexity and the frequency of supply chain disruptions. Journal of Operations
Management, 36, 215-228.
References 103
Bode, C., Wagner, S. M., Petersen, K. J., & Ellram, L. M. (2011). Understanding
responses to supply chain disruptions: Insights from information processing and
resource dependence perspectives. Academy of Management Journal, 54(4),
833-856.
Boss, S. R., Galletta, D. F., Lowry, P. B., Moody, G. D., & Polak, P. (2015). What do
users have to fear? Using fear appeals to engender threats and fear that motivate
protective security behaviors. MIS Quarterly, 39(4), 837-864.
Boyle, K. J., Holmes, T. P., Teisl, M. F., & Roe, B. (2001). A comparison of conjoint
analysis response formats. American Journal of Agricultural Economics, 83(2),
441-454.
Bozic, B. (2017). Consumer trust repair: A critical literature review. European
Management Journal, 35(4), 538-547.
Bradsher, K. (2017). Shivering children, pricier spandex: The impact of China’s energy
stumble. Retrieved from https://www.nytimes.com/2017/12/12/business/energy-
environment/china-gas-coal.html (accessed August 27, 2018).
Burger, L., & Sheahan, M. (2018). BASF shuts down U.S. TDI plant as feedstock
supply disrupted. Retrieved from https://www.reuters.com/article/basf-tdi/basf-
shuts-down-u-s-tdi-plant-as-feedstock-supply-disrupted-idUSFWN1PR0CN
(accessed August 27, 2018).
Burton, R., & Obel, B. (1984). Designing Efficient Organizations: Modelling and
Experimentation. Amsterdam, Netherlands: North-Holland.
Burton, R., & Obel, B. (1995). The validity of computational models in organization
science: From model realism to purpose of the model. Computational &
Mathematical Organization Theory, 1(1), 57-71.
Burton, R., & Obel, B. (2004). Strategic Organizational Diagnosis and Design: The
Dynamics of Fit. Boston, MA: Kluwer.
Business Continuity Institute. (2016). Supply Chain Resilience Report 2016.
Caversham, UK: Business Continuity Institute.
Campbell, J. L. (2007). Why would corporations behave in socially responsible ways?
An institutional theory of corporate social responsibility. Academy of
Management Review, 32(3), 946-967.
Cantor, D. E., Blackhurst, J. V., & Cortes, J. D. (2014). The clock is ticking: The role of
uncertainty, regulatory focus, and level of risk on supply chain disruption
decision making behavior. Transportation Research Part E: Logistics and
Transportation Review, 72, 159-172.
Carlos, W. C., & Lewis, B. W. (2018). Strategic silence: Withholding certification
status as a hypocrisy avoidance tactic. Administrative Science Quarterly, 63(1),
130-169.
Carroll, A. B. (1979). A three-dimensional conceptual model of corporate performance.
Academy of Management Review, 4(4), 497-505.
Chakravarthy, B. S. (1982). Adaptation: A promising metaphor for strategic
management. Academy of Management Review, 7(1), 35-44.
References 104
Chandrasekaran, A., Linderman, K., Sting, F. J., & Benner, M. J. (2016). Managing
R&D project shifts in high‐tech organizations: A multi‐method study.
Production and Operations Management, 25(3), 390-416.
Chen, M., Xia, Y., & Wang, X. (2010). Managing supply uncertainties through
Bayesian information update. IEEE Transactions on Automation Science and
Engineering, 7(1), 24-36.
Chen, Y., & Zahedi, F. M. (2016). Individuals' internet security perceptions and
behaviors: Polycontextual contrasts between the United States and China. MIS
Quarterly, 40(1), 205-222.
Cheng, B., Ioannou, I., & Serafeim, G. (2014). Corporate social responsibility and
access to finance. Strategic Management Journal, 35(1), 1-23.
Choi, B., & La, S. (2013). The impact of corporate social responsibility (CSR) and
customer trust on the restoration of loyalty after service failure and recovery.
Journal of Services Marketing, 27(3), 223-233.
Christmann, P., & Taylor, G. (2006). Firm self-regulation through international
certifiable standards: Determinants of symbolic versus substantive
implementation. Journal of International Business Studies, 37(6), 863-878.
Christopher, M., & Peck, H. (2004). Building the resilient supply chain. The
International Journal of Logistics Management, 15(2), 1-14.
Cismaru, M., & Lavack, A. M. (2007). Interaction effects and combinatorial rules
governing protection motivation theory variables: A new model. Marketing
Theory, 7(3), 249-270.
Clark, A. (2010). Daimler settles US bribery charges. Retrieved from https://www.
theguardian.com/business/2010/mar/24/daimler-settles-us-bribery-charges
(accessed August 27, 2018).
Colombo, S., Guerci, M., & Miandar, T. (2017). What do unions and employers
negotiate under the umbrella of Corporate Social Responsibility? Comparative
evidence from the Italian metal and chemical industries. Journal of Business
Ethics, 1-18.
Coltman, T., & Devinney, T. M. (2013). Modeling the operational capabilities for
customized and commoditized services. Journal of Operations Management,
31(7), 555-566.
Cooper, A. C., Folta, T. B., & Woo, C. (1995). Entrepreneurial information search.
Journal of Business Venturing, 10(2), 107-120.
Cox, G. (2000). Ready-Aim-Fire Problem Solving: A Strategic Approach to Decision
Making. Dublin, Ireland: Oak Tree Press.
Craig, C. S., & Douglas, S. P. (2005). International Marketing Research. Chichester,
UK: John Wiley & Sons.
Craighead, C. W., Blackhurst, J., Rungtusanatham, M. J., & Handfield, R. B. (2007).
The severity of supply chain disruptions: Design characteristics and mitigation
capabilities. Decision Sciences, 38(1), 131-156.
Cyert, R. M., & March, J. G. (1963). A Behavioral Theory of the Firm. Englewood
Cliffs, NJ: Prentice Hall.
References 105
Daft, R. L., & Weick, K. E. (1984). Toward a model of organizations as interpretation
systems. Academy of Management Review, 9(2), 284-295.
de Jong, M. D., & van der Meer, M. (2017). How does it fit? Exploring the congruence
between organizations and their corporate social responsibility (CSR) activities.
Journal of Business Ethics, 143(1), 71-83.
Demuijnck, G., & Fasterling, B. (2016). The social license to operate. Journal of
Business Ethics, 136(4), 675-685.
Dhar, R. (1997). Consumer preference for a no-choice option. Journal of Consumer
Research, 24(2), 215-231.
Dill, W. R. (1958). Environment as an influence on managerial autonomy.
Administrative Science Quarterly, 2(4), 409-443.
Dohmen, T., Falk, A., Huffman, D., Sunde, U., Schupp, J., & Wagner, G. G. (2011).
Individual risk attitudes: Measurement, determinants, and behavioral
consequences. Journal of the European Economic Association, 9(3), 522-550.
Donia, M. B., Ronen, S., Sirsly, C.-A. T., & Bonaccio, S. (2017). CSR by any other
name? The differential impact of substantive and symbolic CSR attributions on
employee outcomes. Journal of Business Ethics, 1-21.
Dubrovski, D. (2004). Peculiarities of managing a company in crisis. Total Quality
Management & Business Excellence, 15(9/10), 1199-1207.
Duncan, R. B. (1972). Characteristics of organizational environments and perceived
environmental uncertainty. Administrative Science Quarterly, 17(3), 313-327.
Durand, R., Hawn, O., & Ioannou, I. (2017). Willing and able: A general model of
organizational responses to normative pressures. Academy of Management
Review, forthcoming.
Dutton, J. E., Fahey, L., & Narayanan, V. K. (1983). Toward understanding strategic
issue diagnosis. Strategic Management Journal, 4(4), 307-323.
Eccles, R. G., Ioannou, I., & Serafeim, G. (2014). The impact of corporate sustainability
on organizational processes and performance. Management Science, 60(11),
2835-2857.
Einwiller, S. A., Fedorikhin, A., Johnson, A. R., & Kamins, M. A. (2006). Enough is
enough! When identification no longer prevents negative corporate associations.
Journal of the Academy of Marketing Science, 34(2), 185-194.
Ethiraj, S. K., & Levinthal, D. (2004). Bounded rationality and the search for
organizational architecture: An evolutionary perspective on the design of
organizations and their evolvability. Administrative Science Quarterly, 49(3),
404-437.
Fay, D., & Frese, M. (2001). The concept of personal initiative: An overview of validity
studies. Human Performance, 14(1), 97-124.
Ferguson, J. L., & Johnston, W. J. (2011). Customer response to dissatisfaction: A
synthesis of literature and conceptual framework. Industrial Marketing
Management, 40(1), 118-127.
References 106
Fiaschi, D., Giuliani, E., & Nieri, F. (2017). Overcoming the liability of origin by doing
no-harm: Emerging country firms’ social irresponsibility as they go global.
Journal of World Business, 52(4), 546-563.
Fishbein, M. (2008). A reasoned action approach to health promotion. Medical Decision
Making, 28(6), 834-844.
Fisher, R. J. (1993). Social desirability bias and the validity of indirect questioning.
Journal of Consumer Research, 20(2), 303-315.
Flammer, C. (2013). Corporate social responsibility and shareholder reaction: The
environmental awareness of investors. Academy of Management Journal, 56(3),
758-781.
Floyd, D. L., Prentice‐Dunn, S., & Rogers, R. W. (2000). A meta‐analysis of research
on protection motivation theory. Journal of Applied Social Psychology, 30(2),
407-429.
Forehand, M. R., & Grier, S. (2003). When is honesty the best policy? The effect of
stated company intent on consumer skepticism. Journal of Consumer
Psychology, 13(3), 349-356.
Fornell, C., & Larcker, D. F. (1981). Evaluating structural equation models with
unobservable variables and measurement error. Journal of Marketing Research,
18(1), 39-50.
Freeman, I., & Hasnaoui, A. (2011). The meaning of corporate social responsibility:
The vision of four nations. Journal of Business Ethics, 100(3), 419-443.
Frese, M., & Fay, D. (2001). 4. Personal initiative: An active performance concept for
work in the 21st century. Research in Organizational Behavior, 23, 133-187.
Galbraith, J. (1973). Designing Complex Organizations. Reading, MA: Addison-
Wesley.
Galbraith, J. (1977). Organization Design. Reading, MA: Addison-Wesley.
Gavetti, G., Levinthal, D. A., & Rivkin, J. W. (2005). Strategy making in novel and
complex worlds: The power of analogy. Strategic Management Journal, 26(8),
691-712.
Germann, F., Grewal, R., Ross, W. T., Jr, & Srivastava, R. K. (2014). Product recalls
and the moderating role of brand commitment. Marketing Letters, 25(2), 179-
191.
Godfrey, P. C., Merrill, C. B., & Hansen, J. M. (2009). The relationship between
corporate social responsibility and shareholder value: An empirical test of the
risk management hypothesis. Strategic Management Journal, 30(4), 425-445.
Grant, A. M., & Ashford, S. J. (2008). The dynamics of proactivity at work. Research in
Organizational Behavior, 28, 3-34.
Grant, A. M., Parker, S., & Collins, C. (2009). Getting credit for proactive behavior:
Supervisor reactions depend on what you value and how you feel. Personnel
Psychology, 62(1), 31-55.
Green, C., & Gerard, K. (2009). Exploring the social value of health‐care interventions:
A stated preference discrete choice experiment. Health Economics, 18(8), 951-
976.
References 107
Greenpeace. (2014). A monstrous mess: Toxic water pollution in China. Retrieved from
http://www.greenpeace.org/international/en/news/features/A-Monstrous-Mess-
toxic-water-pollution-in-China/ (accessed August 27, 2018).
Griffin, M. A., Neal, A., & Parker, S. K. (2007). A new model of work role
performance: Positive behavior in uncertain and interdependent contexts.
Academy of Management Journal, 50(2), 327-347.
Grothmann, T., & Reusswig, F. (2006). People at risk of flooding: Why some residents
take precautionary action while others do not. Natural Hazards, 38(1), 101-120.
Gualandris, J., Klassen, R. D., Vachon, S., & Kalchschmidt, M. (2015). Sustainable
evaluation and verification in supply chains: Aligning and leveraging
accountability to stakeholders. Journal of Operations Management, 38, 1-13.
Habermann, M., Blackhurst, J., & Metcalf, A. Y. (2015). Keep your friends close?
Supply chain design and disruption risk. Decision Sciences, 46(3), 491-526.
Hada, M., Grewal, R., & Lilien, G. L. (2014). Supplier-selected referrals. Journal of
Marketing, 78(2), 34-51.
Hair, J. F., Black, W. C., Babin, B. J., Anderson, R. E., & Tatham, R. L. (2009).
Multivariate Data Analysis (7th ed.). Upper Saddle River, NJ: Prentice Hall.
Hajmohammad, S., & Vachon, S. (2016). Mitigation, avoidance, or acceptance?
Managing supplier sustainability risk. Journal of Supply Chain Management,
52(2), 48-65.
Hale, J. E., Hale, D. P., & Dulek, R. E. (2006). Decision processes during crisis
response: An exploratory investigation. Journal of Managerial Issues, 18(3),
301-320.
Ham, C.-D., & Kim, J. (2017). The role of CSR in crises: Integration of situational
crisis communication theory and the persuasion knowledge model. Journal of
Business Ethics, 1-20.
Handfield, R. B., Blackhurst, J., Elkins, D., & Craighead, C. W. (2007). A framework
for reducing the impact of disruptions to the supply chain: Observations from
multiple executives. In R. B. Handfield & K. McCormack (Eds.), Supply Chain
Risk Management (pp. 29-49). New York, NY: Taylor and Francis.
Hartmann, J., & Moeller, S. (2014). Chain liability in multitier supply chains?
Responsibility attributions for unsustainable supplier behavior. Journal of
Operations Management, 32(5), 281-294.
Hawn, O., & Ioannou, I. (2012). Do actions speak louder than words? The case of
corporate social responsibility (CSR). Academy of Management Proceedings
2012.
Hawn, O., & Ioannou, I. (2016). Mind the gap: The interplay between external and
internal actions in the case of corporate social responsibility. Strategic
Management Journal, 37(13), 2569-2588.
Heckmann, I., Comes, T., & Nickel, S. (2015). A critical review on supply chain risk –
Definition, measure and modeling. Omega, 52, 119-132.
Heide, J. B., Wathne, K. H., & Rokkan, A. I. (2007). Interfirm monitoring, social
contracts, and relationship outcomes. Journal of Marketing Research, 44(3),
425-433.
References 108
Helferich, O. K., & Robert, L. C. (2002). Securing the Supply Chain. Oak Brook, IL:
Council of Logistics Management.
Helft, M., & Bunkley, N. (2011). Disaster in Japan batters suppliers. Retrieved from
http://www.nytimes.com/2011/03/15/business/global/15supply.html?mcubz=1
(accessed August 27, 2018).
Hendricks, K. B., & Singhal, V. R. (2005a). Association between supply chain glitches
and operating performance. Management Science, 51(5), 695-711.
Hendricks, K. B., & Singhal, V. R. (2005b). An empirical analysis of the effect of
supply chain disruptions on long-run stock price performance and equity risk of
the firm. Production and Operations Management, 14(1), 35-52.
Hensher, D. A., Rose, J. M., & Greene, W. H. (2005). Applied Choice Analysis: A
Primer. New York, NY: Cambridge University Press.
Hepher, T., & Altmeyer, C. (2017). Airbus first-quarter profit slides on engine delays,
price squeeze. Retrieved from https://www.reuters.com/article/us-airbus-results-
idUSKBN17T0JE (accessed August 27, 2018).
Highhouse, S., Brooks, M. E., & Gregarus, G. (2009). An organizational impression
management perspective on the formation of corporate reputations. Journal of
Management, 35(6), 1481-1493.
Hofmann, H., Busse, C., Bode, C., & Henke, M. (2014). Sustainability‐related supply
chain risks: Conceptualization and management. Business Strategy and the
Environment, 23(3), 160-172.
Hofstede, G. (1984). Culture's Consequences: International Differences in Work-
Related Values. Beverly Hills, CA: Sage Publications.
Hofstede, G. (1993). Cultural constraints in management theories. The Executive, 7(1),
81-94.
Hofstede, G. (2003). Culture's Consequences: Comparing Values, Behaviors,
Institutions, and Organizations Across Nations. Thousand Oaks, CA: Sage
Publications.
Homburg, C., Stierl, M., & Bornemann, T. (2013). Corporate social responsibility in
business-to-business markets: How organizational customers account for
supplier corporate social responsibility engagement. Journal of Marketing,
77(6), 54-72.
Hora, M., & Klassen, R. D. (2013). Learning from others’ misfortune: Factors
influencing knowledge acquisition to reduce operational risk. Journal of
Operations Management, 31(1), 52-61.
Hovland, C. I., Harvey, O., & Sherif, M. (1957). Assimilation and contrast effects in
reactions to communication and attitude change. Journal of Abnormal and
Social Psychology, 55(2), 244-252.
Hovland, C. I., Janis, I. L., & Kelley, H. H. (1953). Communication and Persuasion.
New Haven, CT: Yale University Press.
Hunter, J. E. (1986). Cognitive ability, cognitive aptitudes, job knowledge, and job
performance. Journal of Vocational Behavior, 29(3), 340-362.
References 109
Huq, F. A., Chowdhury, I. N., & Klassen, R. D. (2016). Social management capabilities
of multinational buying firms and their emerging market suppliers: An
exploratory study of the clothing industry. Journal of Operations Management,
46, 19-37.
Isenberg, D. J. (1984). How senior managers think. Harvard Business Review, 84(6),
81-90.
Isenberg, D. J. (1986). Thinking and managing: A verbal protocol analysis of
managerial problem solving. Academy of Management Journal, 29(4), 775-788.
Janssen, C., Sen, S., & Bhattacharya, C. (2015). Corporate crises in the age of corporate
social responsibility. Business Horizons, 58(2), 183-192.
Jin, H. (2016). VW hit with £12m fine and sales ban on 80 models in South Korea.
Retrieved from http://www.independent.co.uk/news/business/news/vw-
volkswagen-south-korea-sales-ban-emissions-scandal-fine-audi-bentley-
dieselgate-a7167601.html (accessed August 27, 2018).
Johnston, A. C., & Warkentin, M. (2010). Fear appeals and information security
behaviors: An empirical study. MIS Quarterly, 34(3), 549-566.
Johnston, W. J., & Bonoma, T. V. (1981). The buying center: Structure and interaction
patterns. Journal of Marketing, 45(3), 143-156.
Jones, G. H., Jones, B. H., & Little, P. (2000). Reputation as reservoir: Buffering
against loss in times of economic crisis. Corporate Reputation Review, 3(1), 21-
29.
Kang, C., Germann, F., & Grewal, R. (2016). Washing away your sins? Corporate
social responsibility, corporate social irresponsibility, and firm performance.
Journal of Marketing, 80(2), 59-79.
Katila, R., & Ahuja, G. (2002). Something old, something new: A longitudinal study of
search behavior and new product introduction. Academy of Management
Journal, 45(6), 1183-1194.
Kauffman, S. A. (1993). The Origins of Order: Self-Organization and Selection in
Evolution. New York, NY: Oxford University Press.
Kaul, A., & Luo, J. (2018). An economic case for CSR: The comparative efficiency of
for‐profit firms in meeting consumer demand for social goods. Strategic
Management Journal, 39(6), 1650-1677.
Kepner, C. H., & Tregoe, B. B. (1965). The Rational Manager. New York, NY:
McGraw-Hill.
Kerstholt, J. H. (1996). The effect of information costs on strategy selection in dynamic
tasks. Acta Psychologica, 94(3), 273-290.
Ketola, T. (2010). Five leaps to corporate sustainability through a corporate
responsibility portfolio matrix. Corporate Social Responsibility and
Environmental Management, 17(6), 320-336.
Kim, S., & Choi, S. M. (2016). Congruence effects in post-crisis CSR communication:
The mediating role of attribution of corporate motives. Journal of Business
Ethics, 1-17.
References 110
Kim, Y. H., & Davis, G. F. (2016). Challenges for global supply chain sustainability:
Evidence from conflict minerals reports. Academy of Management Journal,
59(6), 1896-1916.
Klein, J., & Dawar, N. (2004). Corporate social responsibility and consumers'
attributions and brand evaluations in a product–harm crisis. International
Journal of Research in Marketing, 21(3), 203-217.
Kleinmuntz, D. N., & Thomas, J. B. (1987). The value of action and inference in
dynamic decision making. Organizational Behavior and Human Decision
Processes, 39(3), 341-364.
Klir, G. J. (2005). Uncertainty and Information: Foundations of Generalized
Information Theory. Hoboken, NJ: John Wiley & Sons.
Knemeyer, A. M., Zinn, W., & Eroglu, C. (2009). Proactive planning for catastrophic
events in supply chains. Journal of Operations Management, 27(2), 141-153.
Knudsen, T., & Levinthal, D. A. (2007). Two faces of search: Alternative generation
and alternative evaluation. Organization Science, 18(1), 39-54.
Kocabasoglu, C., & Suresh, N. C. (2006). Strategic sourcing: An empirical investigation
of the concept and its practices in US manufacturing firms. Journal of Supply
Chain Management, 42(2), 4-16.
Krause, D. R., Vachon, S., & Klassen, R. D. (2009). Special topic forum on sustainable
supply chain management: Introduction and reflections on the role of purchasing
management. Journal of Supply Chain Management, 45(4), 18-25.
Lancsar, E., & Louviere, J. J. (2008). Conducting discrete choice experiments to inform
healthcare decision making. Pharmacoeconomics, 26(8), 661-677.
Latour, A. (2001). Trial by fire: A blaze in Albuquerque sets off major crisis for cell-
phone giants. Wall Street Journal, January 29, 2001.
Lee, H. L. (2004). The triple-A supply chain. Harvard Business Review, 82(10), 102-
113.
Lenz, I., Wetzel, H. A., & Hammerschmidt, M. (2017). Can doing good lead to doing
poorly? Firm value implications of CSR in the face of CSI. Journal of the
Academy of Marketing Science, 45(5), 677-697.
Leroi-Werelds, S., Streukens, S., Brady, M. K., & Swinnen, G. (2014). Assessing the
value of commonly used methods for measuring customer value: A multi-setting
empirical study. Journal of the Academy of Marketing Science, 42(4), 430-451.
Levinthal, D. A. (1997). Adaptation on rugged landscapes. Management Science, 43(7),
934-950.
Liebowitz, S., & Margolis, S. (2000). Path dependence. In B. Bouckaert & G. De Geest
(Eds.), Encyclopedia of Law and Economics (pp. 981-998). Cheltenham, UK;
Northampton, MA: Edward Elgar.
Lin-Hi, N., & Blumberg, I. (2018). The link between (not) practicing CSR and
corporate reputation: Psychological foundations and managerial implications.
Journal of Business Ethics, 150(1), 185-198.
Lin-Hi, N., & Müller, K. (2013). The CSR bottom line: Preventing corporate social
irresponsibility. Journal of Business Research, 66(10), 1928-1936.
References 111
Lipshitz, R., & Strauss, O. (1997). Coping with uncertainty: A naturalistic decision-
making analysis. Organizational Behavior and Human Decision Processes,
69(2), 149-163.
Lounamaa, P. H., & March, J. G. (1987). Adaptive coordination of a learning team.
Management Science, 33(1), 107-123.
Louviere, J. J., Flynn, T. N., & Carson, R. T. (2010). Discrete choice experiments are
not conjoint analysis. Journal of Choice Modelling, 3(3), 57-72.
Louviere, J. J., Hensher, D. A., & Swait, J. D. (2000). Stated Choice Methods: Analysis
and Applications. Cambridge, UK: Cambridge University Press.
Louviere, J. J., & Woodworth, G. (1983). Design and analysis of simulated consumer
choice or allocation experiments: An approach based on aggregate data. Journal
of Marketing Research, 20(4), 350-367.
Lynes, J. K., & Andrachuk, M. (2008). Motivations for corporate social and
environmental responsibility: A case study of Scandinavian Airlines. Journal of
International Management, 14(4), 377-390.
Lynn, M. (2015). Corporate Social Responsibility has become a racket - and a
dangerous one. Retrieved from http://www.telegraph.co.uk/finance/
newsbysector/industry/11896546/Corporate-Social-Responsibility-has-become-
a-racket-and-a-dangerous-one.html (accessed August 27, 2018).
Lyon, T. P., & Maxwell, J. W. (2011). Greenwash: Corporate environmental disclosure
under threat of audit. Journal of Economics and Management Strategy, 20(1), 3-
41.
Macdonald, J. R., & Corsi, T. M. (2013). Supply chain disruption management: Severe
events, recovery, and performance. Journal of Business Logistics, 34(4), 270-
288.
Mantel, S. P., Tatikonda, M. V., & Liao, Y. (2006). A behavioral study of supply
manager decision-making: Factors influencing make versus buy evaluation.
Journal of Operations Management, 24(6), 822-838.
March, J. G., & Shapira, Z. (1987). Managerial perspectives on risk and risk taking.
Management Science, 33(11), 1404-1418.
March, J. G., & Simon, H. A. (1958). Organizations. New York, NY: John Wiley &
Sons.
Matejek, S., & Gössling, T. (2014). Beyond legitimacy: A case study in BP’s “green
lashing”. Journal of Business Ethics, 120(4), 571-584.
Maxham, J. G., III, & Netemeyer, R. G. (2003). Firms reap what they sow: The effects
of shared values and perceived organizational justice on customers’ evaluations
of complaint handling. Journal of Marketing, 67(1), 46-62.
McFadden, D. (1986). The choice theory approach to market research. Marketing
Science, 5(4), 275-297.
McGuire, W. J. (1985). Attitudes and attitude change. In G. Lindzey & E. Aronson
(Eds.), Handbook of Social Psychology (pp. 233-346). New York, NY: Random
House.
References 112
McKelvie, A., Haynie, J. M., & Gustavsson, V. (2011). Unpacking the uncertainty
construct: Implications for entrepreneurial action. Journal of Business
Venturing, 26(3), 273-292.
McMullen, J. S., & Shepherd, D. A. (2006). Entrepreneurial action and the role of
uncertainty in the theory of the entrepreneur. Academy of Management Review,
31(1), 132-152.
McShane, L., & Cunningham, P. (2012). To thine own self be true? Employees’
judgments of the authenticity of their organization’s corporate social
responsibility program. Journal of Business Ethics, 108(1), 81-100.
McWilliams, A., & Siegel, D. (2001). Corporate social responsibility: A theory of the
firm perspective. Academy of Management Review, 26(1), 117-127.
Mehrotra, K. (2018). BMW sued by U.S. diesel drivers over emissions-test cheating.
Retrieved from https://www.bloomberg.com/news/articles/2018-03-27/bmw-
sued-for-installing-defeat-devices-in-u-s-diesel-cars (accessed August 27, 2018).
Meyer, J. W., & Rowan, B. (1977). Institutionalized organizations: Formal structure as
myth and ceremony. American Journal of Sociology, 83(2), 340-363.
Mihm, J., Loch, C. H., Wilkinson, D., & Huberman, B. A. (2010). Hierarchical structure
and search in complex organizations. Management Science, 56(5), 831-848.
Milliken, F. J. (1987). Three types of perceived uncertainty about the environment:
State, effect, and response uncertainty. Academy of Management Review, 12(1),
133-143.
Minor, D., & Morgan, J. (2011). CSR as reputation insurance: Primum non nocere.
California Management Review, 53(3), 40-59.
Mintzberg, H. (1973). The Nature of Managerial Work. New York, NY: Harper & Row
Publishers.
Mintzberg, H., Raisinghani, D., & Theoret, A. (1976). The structure of "unstructured"
decision processes. Administrative Science Quarterly, 21(2), 246-275.
Mintzberg, H., & Westley, F. (2001). Decision making: It's not what you think. MIT
Sloan Management Review, 42(3), 89-93.
Mitroff, I. I., & Alpaslan, M. C. (2003). Preparing for evil. Harvard Business Review,
81(4), 109-115.
Money, R. B., Gilly, M. C., & Graham, J. L. (1998). Explorations of national culture
and word-of-mouth referral behavior in the purchase of industrial services in the
United States and Japan. Journal of Marketing, 62(4), 76-87.
Moore, W. L., Gray-Lee, J., & Louviere, J. J. (1998). A cross-validity comparison of
conjoint analysis and choice models at different levels of aggregation. Marketing
Letters, 9(2), 195-207.
Morgan, N. A., & Rego, L. L. (2006). The value of different customer satisfaction and
loyalty metrics in predicting business performance. Marketing Science, 25(5),
426-439.
Moriyasu, K. (2017). BMW closes major China assembly line for the week. Retrieved
from http://asia.nikkei.com/Business/Companies/BMW-closes-major-China-
assembly-line-for-the-week (accessed August 27, 2018).
References 113
Morwitz, V. (1997). Why consumers don't always accurately predict their own future
behavior. Marketing Letters, 8(1), 57-70.
Munich Re. (2015). NAT CATS 2014: What's going on with the weather? Retrieved
from https://www.munichre.com/site/mram/get/documents_E-1959049670/
mram/assetpool.munichreamerica.wrap/PDF/2014/MunichRe_III_NatCatWebin
ar_01072015w.pdf (accessed August 27, 2018).
Munich Re. (2017). Natural catastrophes 2016. Retrieved from https://www.munichre.c
om/site/mram-mobile/get/documents_E-253943638/mram/assetpool.mr_
america/PDFs/3_Publications/TOPICS_GEO/TOPICS_GEO_2017.pdf
(accessed August 27, 2018).
Nelson, D. R., Adger, W. N., & Brown, K. (2007). Adaptation to environmental change:
Contributions of a resilience framework. Annual Review of Environment and
Resources, 32(1), 395-419.
Noda, T., & Collis, D. J. (2001). The evolution of intraindustry firm heterogeneity:
Insights from a process study. Academy of Management Journal, 44(4), 897-
925.
Norman, G. (2010). Likert scales, levels of measurement and the “laws” of statistics.
Advances in Health Sciences Education, 15(5), 625-632.
Norrman, A., & Jansson, U. (2004). Ericsson's proactive supply chain risk management
approach after a serious sub-supplier accident. International Journal of Physical
Distribution and Logistics Management, 34(5), 434-456.
O'Reilly, C. A. (1982). Variations in decision makers' use of information sources: The
impact of quality and accessibility of information. Academy of Management
Journal, 25(4), 756-771.
Oliver, C. (1991). Strategic responses to institutional processes. Academy of
Management Review, 16(1), 145-179.
Parker, J. R., & Schrift, R. Y. (2011). Rejectable choice sets: How seemingly irrelevant
no-choice options affect consumer decision processes. Journal of Marketing
Research, 48(5), 840-854.
Parker, S. K., Williams, H. M., & Turner, N. (2006). Modeling the antecedents of
proactive behavior at work. Journal of Applied Psychology, 91(3), 636-652.
Paulraj, A., Chen, I. J., & Blome, C. (2017). Motives and performance outcomes of
sustainable supply chain management practices: A multi-theoretical perspective.
Journal of Business Ethics, 145(2), 239-258.
Pereira, C. R., Christopher, M., & Lago Da Silva, A. (2014). Achieving supply chain
resilience: The role of procurement. Supply Chain Management: An
International Journal, 19(5/6), 626-642.
Peters, T. J., & Waterman, R. H. (1982). In Search of Excellence: Lessons from
America's best-run Companies. New York, NY: Harper & Row.
Potoglou, D., & Kanaroglou, P. S. (2007). Household demand and willingness to pay
for clean vehicles. Transportation Research Part D: Transport and
Environment, 12(4), 264-274.
References 114
Pullman, M. E., Verma, R., & Goodale, J. C. (2001). Service design and operations
strategy formulation in multicultural markets. Journal of Operations
Management, 19(2), 239-254.
Raaijmakers, A. G., Vermeulen, P. A., Meeus, M. T., & Zietsma, C. (2015). I need
time! Exploring pathways to compliance under institutional complexity.
Academy of Management Journal, 58(1), 85-110.
Ramasamy, B., Yeung, M. C., & Au, A. K. (2010). Consumer support for corporate
social responsibility (CSR): The role of religion and values. Journal of Business
Ethics, 91(1), 61-72.
Rao, S., & Goldsby, T. J. (2009). Supply chain risks: A review and typology.
International Journal of Logistics Management, 20(1), 97-123.
Reuters. (2014). Wal-Mart must pay $188 million in workers' class action. Retrieved
from http://www.reuters.com/article/us-walmart-lawsuit-idUSKBN0JU1X
J20141216 (accessed August 27, 2018).
Richins, M. L. (1983). Negative word-of-mouth by dissatisfied consumers: A pilot
study. Journal of Marketing, 47(1), 68-78.
Ro, Y. K., Su, H. C., & Chen, Y. S. (2016). A tale of two perspectives on an impending
supply disruption. Journal of Supply Chain Management, 52(1), 3-20.
Rogers, R. W. (1975). A protection motivation theory of fear appeals and attitude
change. The Journal of Psychology, 91(1), 93-114.
Rogers, R. W. (1983). Cognitive and psychological processes in fear appeals and
attitude change: A revised theory of protection motivation. In J. Cacioppo & R.
Petty (Eds.), Social Psychophysiology (pp. 153-176). New York, NY: Guildford
Press.
Rogers, R. W., & Prentice-Dunn, S. (1997). Protection motivation theory. In D. S.
Gochman (Ed.), Handbook of Health Behavior Research I: Personal and Social
Determinants (pp. 113-132). New York, NY: Plenum Press.
Rudolph, J. W., Morrison, J. B., & Carroll, J. S. (2009). The dynamics of action-
oriented problem solving: Linking interpretation and choice. Academy of
Management Review, 34(4), 733-756.
Rungtusanatham, M., Wallin, C., & Eckerd, S. (2011). The vignette in a scenario‐based
role‐playing experiment. Journal of Supply Chain Management, 47(3), 9-16.
Russo, M. V., & Harrison, N. S. (2005). Organizational design and environmental
performance: Clues from the electronics industry. Academy of Management
Journal, 48(4), 582-593.
Ryan, M., Gerard, K., & Amaya-Amaya, M. (2007). Using Discrete Choice
Experiments to Value Health and Health Care. Dordrecht, Netherlands:
Springer.
Ryan, M., & Skåtun, D. (2004). Modelling non‐demanders in choice experiments.
Health Economics, 13(4), 397-402.
Samuelson, W., & Zeckhauser, R. (1988). Status quo bias in decision making. Journal
of Risk and Uncertainty, 1(1), 7-59.
References 115
Scherer, K. R. (1984). Emotion as a multicomponent process: A model and some cross-
cultural data. In P. Scherer (Ed.), Review of Personality and Social Psychology
(pp. 37-63). Beverly Hills, CA: Sage Publications.
Scherer, K. R. (1988). Criteria for emotion-antecedent appraisal: A review. In V.
Hamiltion, G. H. Bower, & N. H. Frijda (Eds.), Cognitive Perspectives on
Emotion and Motivation (pp. 89-126). Norwell, MA: Kluwer Academic
Publishers.
Schmidt, C. G., Foerstl, K., & Schaltenbrand, B. (2017). The supply chain position
paradox: Green practices and firm performance. Journal of Supply Chain
Management, 53(1), 3-25.
Schmidt, F. L., Hunter, J. E., & Outerbridge, A. N. (1986). Impact of job experience and
ability on job knowledge, work sample performance, and supervisory ratings of
job performance. Journal of Applied Psychology, 71(3), 432-439.
Schneider, L., & Wallenburg, C. M. (2012). Implementing sustainable sourcing—Does
purchasing need to change? Journal of Purchasing and Supply Management,
18(4), 243-257.
Schneider, S. C., & De Meyer, A. (1991). Interpreting and responding to strategic
issues: The impact of national culture. Strategic Management Journal, 12(4),
307-320.
Seibert, S. E., Crant, J. M., & Kraimer, M. L. (1999). Proactive personality and career
success. Journal of Applied Psychology, 84(3), 416-427.
Sen, S., & Bhattacharya, C. B. (2001). Does doing good always lead to doing better?
Consumer reactions to corporate social responsibility. Journal of Marketing
Research, 38(2), 225-243.
Sheehy, B. (2015). Defining CSR: Problems and solutions. Journal of Business Ethics,
131(3), 625-648.
Sheeran, P., Harris, P. R., & Epton, T. (2013). Does heightening risk appraisals change
people’s intentions and behavior? A meta-analysis of experimental studies.
Psychological Bulletin, 140(2), 511-543.
Sheffi, Y. (2005). The Resilient Enterprise: Overcoming Vulnerability for Competitive
Advantage. Cambridge, MA: MIT Press.
Sherif, M., & Hovland, C. I. (1961). Social Judgment: Assimilation and Contrast Effects
in Communication and Attitude Change. New Haven, CT: Yale University
Press.
Shiu, Y. M., & Yang, S. L. (2017). Does engagement in corporate social responsibility
provide strategic insurance‐like effects? Strategic Management Journal, 38(2),
455-470.
Siemsen, E. (2011). The usefulness of behavioral laboratory experiments in supply
chain management research. Journal of Supply Chain Management, 47(3), 17-
18.
Siggelkow, N., & Rivkin, J. W. (2005). Speed and search: Designing organizations for
turbulence and complexity. Organization Science, 16(2), 101-122.
Simon, H. A. (1955). A behavioral model of rational choice. The Quarterly Journal of
Economics, 69(1), 99-118.
References 116
Simon, H. A. (1962). The architecture of complexity. Proceedings of the American
Philosophical Society, 106(6), 467-482.
Simon, H. A. (1979). Rational decision making in business organizations. The American
Economic Review, 69(4), 493-513.
Sims, R. R., & Brinkmann, J. (2003). Enron ethics (or: Culture matters more than
codes). Journal of Business Ethics, 45(3), 243-256.
Singh, J. (1990). Voice, exit, and negative word-of-mouth behaviors: An investigation
across three service categories. Journal of the Academy of Marketing Science,
18(1), 1-15.
Skellett, B., Cairns, B., Geard, N., Tonkes, B., & Wiles, J. (2005). Maximally rugged
NK landscapes contain the highest peaks. Paper presented at the Proceedings of
the 2005 Genetic and Evolutionary Computation Conference.
Sodhi, M. S., Son, B. G., & Tang, C. S. (2012). Researchers' perspectives on supply
chain risk management. Production and Operations Management, 21(1), 1-13.
Suchman, M. C. (1995). Managing legitimacy: Strategic and institutional approaches.
Academy of Management Review, 20(3), 571-610.
Swaen, V., & Vanhamme, J. (2003). Do accusations of irresponsible acts hurts
companies more when they promote themselves as socially responsible? In G.
D. Laurent, D. Merunka, & J. Zaichowsky (Eds.), Marketing Communications
and Consumer Behavior Proceedings (pp. 175-188).
Sydow, J., Schreyögg, G., & Koch, J. (2009). Organizational path dependence: Opening
the black box. Academy of Management Review, 34(4), 689-709.
Tajitsu, N., & Yamazaki, M. (2016). Toyota, other major Japanese firms hit by quake
damage, supply disruptions. Retrieved from https://www.reuters.com/article/us-
japan-quake-toyota/toyota-other-major-japanese-firms-hit-by-quake-damage-
supply-disruptions-idUSKCN0XE08O (accessed August 27, 2018).
Tanner, J. F. J., Hunt, J. B., & Eppright, D. R. (1991). The protection motivation model:
A normative model of fear appeals. Journal of Marketing, 55(3), 36-45.
Thomas, S. P., Thomas, R. W., Manrodt, K. B., & Rutner, S. M. (2013). An
experimental test of negotiation strategy effects on knowledge sharing intentions
in buyer–supplier relationships. Journal of Supply Chain Management, 49(2),
96-113.
Thompson, J. D. (1967). Organizations in Action. New York, NY: McGraw-Hill.
Thurstone, L. L. (1927). A law of comparative judgment. Psychological Review, 34(4),
273-286.
Tovey, A. (2016). Toyota to halt production after explosion at steel factory. Retrieved
from http://www.telegraph.co.uk/finance/newsbysector/industry/12137595/
Toyota-halts-production-after-explosion-at-steel-factory.html (accessed August
27, 2018).
Tukey, J. W. (1977). Exploratory Data Analysis. Reading, MA: Addison-Wesley.
Tushman, M. L., & Nadler, D. A. (1978). Information processing as an integrating
concept in organizational design. Academy of Management Review, 3(3), 613-
624.
References 117
Vanessa, M. S., Jijun, G., & Bansal, P. (2006). Being good while being bad: Social
responsibility and the international diversification of US firms. Journal of
International Business Studies, 37(6), 850-862.
Vanhamme, J., & Grobben, B. (2009). “Too good to be true!”. The effectiveness of
CSR history in countering negative publicity. Journal of Business Ethics, 85(2),
273-283.
Vanhamme, J., Swaen, V., Berens, G., & Janssen, C. (2015). Playing with fire:
Aggravating and buffering effects of ex ante CSR communication campaigns for
companies facing allegations of social irresponsibility. Marketing Letters, 26(4),
565-578.
Vergne, J.-P., & Durand, R. (2011). The path of most persistence: An evolutionary
perspective on path dependence and dynamic capabilities. Organization Studies,
32(3), 365-382.
Vergne, J. P., & Durand, R. (2010). The missing link between the theory and empirics
of path dependence: Conceptual clarification, testability issue, and
methodological implications. Journal of Management Studies, 47(4), 736-759.
Verma, R., Louviere, J. J., & Burke, P. (2006). Using a market-utility-based approach to
designing public services: A case illustration from United States Forest Service.
Journal of Operations Management, 24(4), 407-416.
Verma, R., & Pullman, M. E. (1998). An analysis of the supplier selection process.
Omega, 26(6), 739-750.
Vlachos, P. A., Panagopoulos, N. G., & Rapp, A. A. (2013). Feeling good by doing
good: Employee CSR-induced attributions, job satisfaction, and the role of
charismatic leadership. Journal of Business Ethics, 118(3), 577-588.
Waddock, S. A., & Graves, S. B. (1997). The corporate social performance-financial
performance link. Strategic Management Journal, 18(4), 303-319.
Wagner, T., Lutz, R. J., & Weitz, B. A. (2009). Corporate hypocrisy: Overcoming the
threat of inconsistent corporate social responsibility perceptions. Journal of
Marketing, 73(6), 77-91.
Walker, K., & Wan, F. (2012). The harm of symbolic actions and green-washing:
Corporate actions and communications on environmental performance and their
financial implications. Journal of Business Ethics, 109(2), 227-242.
Walls, J. L., Berrone, P., & Phan, P. H. (2012). Corporate governance and
environmental performance: Is there really a link? Strategic Management
Journal, 33(8), 885-913.
Wangenheim, F. V., & Bayón, T. (2007). The chain from customer satisfaction via
word-of-mouth referrals to new customer acquisition. Journal of the Academy of
Marketing Science, 35(2), 233-249.
Wason, K. D., Polonsky, M. J., & Hyman, M. R. (2002). Designing vignette studies in
marketing. Australasian Marketing Journal, 10(3), 41-58.
Wathne, K. H., Biong, H., & Heide, J. B. (2001). Choice of supplier in embedded
markets: Relationship and marketing program effects. Journal of Marketing,
65(2), 54-66.
References 118
Weaver, G. R., Trevino, L. K., & Cochran, P. L. (1999). Integrated and decoupled
corporate social performance: Management commitments, external pressures,
and corporate ethics practices. Academy of Management Journal, 42(5), 539-
552.
Webb, J. (2016a). Child workers found in clothing supply chain: ASOS, Marks &
Spencer implicated. Retrieved from https://www.forbes.com/sites/jwebb/2016/
10/25/child-workers-found-in-clothing-supply-chain-asos-marks-spencer-
implicated/#6ebce1e04b12 (accessed August 27, 2018).
Webb, J. (2016b). The Taiwanese earthquake that nearly flattened the Apple iPhone 7.
Retrieved from https://www.forbes.com/sites/jwebb/2016/02/29/the-taiwanese-
earthquake-that-nearly-cancelled-the-apple-iphone-7/#36e51f854da7 (accessed
August 27, 2018).
Webb, T. L., & Sheeran, P. (2006). Does changing behavioral intentions engender
behavior change? A meta-analysis of the experimental evidence. Psychological
Bulletin, 132(2), 249.
Weber, E. U., & Milliman, R. A. (1997). Perceived risk attitudes: Relating risk
perception to risky choice. Management Science, 43(2), 123-144.
Weick, K. E. (1979). The Social Psychology of Organizing. New York, NY: McGraw-
Hill.
Westhues, M., & Einwiller, S. (2006). Corporate foundations: Their role for corporate
social responsibility. Corporate Reputation Review, 9(2), 144-153.
Westphal, J. D., & Zajac, E. J. (2001). Decoupling policy from practice: The case of
stock repurchase programs. Administrative Science Quarterly, 46(2), 202-228.
Wickert, C., Scherer, A. G., & Spence, L. J. (2016). Walking and talking corporate
social responsibility: Implications of firm size and organizational cost. Journal
of Management Studies, 53(7), 1169-1196.
Wilcox, K., Kim, H. M., & Sen, S. (2009). Why do consumers buy counterfeit luxury
brands? Journal of Marketing Research, 46(2), 247-259.
Winter, S. G., Cattani, G., & Dorsch, A. (2007). The value of moderate obsession:
Insights from a new model of organizational search. Organization Science,
18(3), 403-419.
Wong, E. (2013). Poultry plant in deadly fire won plaudits from Chinese. Retrieved
from http://www.nytimes.com/2013/06/05/world/asia/chinese-poultry-factory-
was-considered-a-model.html (accessed August 27, 2018).
Wood, D. J. (1991). Corporate social performance revisited. Academy of Management
Review, 16(4), 691-718.
Wotruba, T. R., Chonko, L. B., & Loe, T. W. (2001). The impact of ethics code
familiarity on manager behavior. Journal of Business Ethics, 33(1), 59-69.
Wu, D., & Ting-Fang, C. (2017). Amid hype, iPhone suppliers scramble to ready new
parts. Retrieved from https://asia.nikkei.com/Business/Trends/Amid-hype-
iPhone-suppliers-scramble-to-ready-new-parts (accessed August 27, 2018).
Wu, G. (1999). Anxiety and decision making with delayed resolution of uncertainty.
Theory and Decision, 46(2), 159-199.
References 119
Yildiz, H., Yoon, J., Talluri, S., & Ho, W. (2016). Reliable supply chain network
design. Decision Sciences, 47(4), 661-698.
Yoon, Y., Gürhan‐Canli, Z., & Schwarz, N. (2006). The effect of corporate social
responsibility (CSR) activities on companies with bad reputations. Journal of
Consumer Psychology, 16(4), 377-390.
Zavyalova, A., Pfarrer, M. D., Reger, R. K., & Shapiro, D. L. (2012). Managing the
message: The effects of firm actions and industry spillovers on media coverage
following wrongdoing. Academy of Management Journal, 55(5), 1079-1101.
Zeelenberg, M., Van den Bos, K., Van Dijk, E., & Pieters, R. (2002). The inaction
effect in the psychology of regret. Journal of Personality and Social Psychology,
82(3), 314-327.
Zott, C., & Huy, Q. N. (2007). How entrepreneurs use symbolic management to acquire
resources. Administrative Science Quarterly, 52(1), 70-105.
Zsidisin, G. A., & Ritchie, B. (2008). Supply Chain Risk: A Handbook of Assessment,
Management, and Performance. New York, NY: Springer.
Curriculum vitae 120
Curriculum vitae
Academic employment
08/2017 – Visiting Researcher
10/2017 Colorado State University, Fort Collins, Colorado, USA
on invitation by Dr. Lynn M. Shore and Dr. John R. Macdonald
08/2015 – Doctoral Candidate/ Research Assistant
09/2018 University of Mannheim, Business School, Mannheim, Germany
Endowed Chair of Procurement
Education
08/2015 – Doctoral Studies in Business Administration (Dr. rer. pol.)
09/2018 University of Mannheim, Business School, Mannheim, Germany
Thesis: ”Decision Making in Supply Risk and Supply Disruption
Management”
Advisor: Prof. Dr. Christoph Bode
09/2013 – M.Sc. in Mannheim Master in Management
07/2015 University of Mannheim, Business School, Mannheim, Germany
09/2012 – ERASMUS Semester abroad
01/2013 NOVA School of Business and Economics, Lisbon, Portugal
10/2010 – B.Sc. in Business Administration
09/2013 University of Cologne, Faculty of Management, Economics, and Social
Sciences, Cologne, Germany