Embed Size (px)
Citation preview
ORIGINAL ARTICLE
Deciphering transmissivity and hydraulic conductivityof the aquifer by vertical electrical sounding (VES) experimentsin Northwest Bangladesh
Golam Shabbir Sattar • Mumnunul Keramat •
Shamsuddin Shahid
Received: 2 September 2013 / Accepted: 21 May 2014 / Published online: 11 June 2014
� The Author(s) 2014. This article is published with open access at Springerlink.com
Abstract The vertical electrical soundings (VESs) are
carried out in 24 selective locations of Chapai-Nawabganj
area of northwest Bangladesh to determine the transmis-
sivity and hydraulic conductivity of the aquifer. Initially,
the transmissivity and hydraulic conductivity are deter-
mined from the pumping data of nearby available pro-
duction wells. Afterwards, the T and K are correlated with
geoelectrical resistance and the total resistivity of the
aquifer. The present study deciphers the functional analo-
gous relations of the geoelectrical resistance with the
transmissivity and the total resistivity with the hydraulic
conductivity of the aquifer in northwest Bangladesh. It has
been shown that the given equations provide reasonable
values of transmissivity and hydraulic conductivity where
pumping test information is unavailable. It can be expected
that the aquifer properties viz. transmissivity and hydraulic
conductivity of geologically similar area can be determined
with the help of the obtained equations by conducting VES
experiments.
Keywords VES � Transmissivity � Hydraulicconductivity � Aquifer � Chapai-Nawabganj
Introduction
Basic elements of groundwater investigation involve
determination of transmissivity and storage coefficient of
the aquifers along with the geometry of the water-bearing
zone. Pumping test is one of the suitable means for com-
puting reliable and representative values of the hydraulic
characteristics in aquifers (Ayers 1989; Kruseman and de
Ridder 1994). Pumping test is an expensive process and
therefore, long duration pump test is rarely carried out in
practice. Surface geoelectric measurements provide an
alternative approach for the estimation of some of the
aquifer properties (Ahamed and deMarsily 1987; Khan
et al. 2002). Though the geoelectrical methods alone, even
under favorable conditions, do not replace test drilling to
ascertain groundwater condition, yet in many cases can
reduce the number of test drillings by giving a better
selection of test borehole locations (Yadav and Abolfazli
1998). In past three decades, several investigators have
studied the relations between aquifer parameters and geo-
electric properties (Ponzini et al. 1984; Kelly and Frohlich
1985; Onuoha and Mbazi 1988; Mbonu et al. 1991; Ka-
linski et al. 1993; Frohlich et al. 1996; Dasargues 1997;
Singhal et al. 1998; Niwas and De Lima 2006; Shevnin
et al. 2006; Batte et al. 2010; Egbai 2011; Ezeh 2011;
Majumdar and Das 2011; Sikandar and Christen 2012;
Asfahani 2012; Niwas and Celik 2012; Nwosu et al. 2013;
Ugada et al. 2013). Batte et al. (2010) correlated geoelec-
tric data with aquifer parameters to delineate the ground-
water potential of hard rock terrain in central Uganda.
Egbai (2011) used information from vertical electrical
sounding (VES) for the determination of the transmissivity
of aquifers in Anwai, Delta State of Nigeria. Majumdar and
Das (2011) characterized and estimated aquifer properties
from electrical sounding data in Sagar Island region in
G. S. Sattar � M. Keramat
Geophysics Laboratory, Department of Applied Physics and
Electronics, University of Rajshahi, Rajshahi 6205, Bangladesh
S. Shahid (&)
Department of Hydraulics and Hydrology, Faculty of Civil
Engineering, Universiti Teknologi Malaysia (UTM), 81310
Johor Bahru, Malaysia
e-mail: [email protected]
123
Appl Water Sci (2016) 6:35–45
DOI 10.1007/s13201-014-0203-9
south 24 Parganas of West Bengal, India. Sikandar and
Christen (2012) estimated hydraulic conductivity using
geoelectrical method in alluvial aquifers of Pakistan. As-
fahani (2012) derived transmissivity of Quaternary aquifer
from vertical electrical sounding measurements in the
semiarid Khanasser valley region of Syria. Niwas and
Celik (2012) estimated porosity and hydraulic conductivity
of Ruhrtal aquifer in Germany using near-surface geo-
physical methods. Ugada et al. (2013) determined aquifer
hydraulic characteristics of Umuahia area from Dar Zar-
rouk parameters. Nwosu et al. (2013) measured the
hydraulic properties of the aquiferous zones using geo-
electrical method for the evaluation of groundwater
potentials in the complex geological area of Imo state,
Nigeria. In all the above studies, mathematical equations
were developed to estimate hydraulic aquifer property from
surface electrical measurements. All the studies suggested
that estimation of hydraulic conductivity and transmissivity
from surface resistivity measurements is feasible. How-
ever, these relationships are area-specific and have limited
applications in other area (Purvance and Andricevic 2000a,
b; Niwas and De Lima 2006).
Groundwater is a major component of people’s liveli-
hood and agro-based economy in Northwest Bangladesh
(Shahid and Hazarika 2010). About 75 % water for irri-
gation in the region comes from groundwater (Shahid
2010). However, overexploitation of groundwater in recent
years has caused the groundwater level falls to the extent of
not getting fully replenished in the recharge season.
Actions are necessary to regulate the abstraction of
groundwater in the area for sustaining rechargeable
groundwater aquifers (Shahid and Hazarika 2010). Cost-
effective estimation of aquifer properties is essential for
this purpose. Therefore, the present study is carried out to
GODAGARI
Powrashava
L E G E N D
River
P
A
D
MA
M A H
A
ANA
ND
01 02
03
04
05
0607
08
09
10
11
12
13
14
15
16
17
18
19
2021
2223
24
01
NACHOLE
| | |||88 05 E
_
_
_
_
88 10 E 88 15 E 88 20 E 88 25 E
24 40 N
24 35 N
24 30 N
24 25 N
_
_
_
_
| | | | |
SIBGANJ
VES Location
Upazila Boundary
I ND
I A
Pumping Well
0
Scale
4 km
CHAPAI-NAWABGANJ
BARIND
PADMA
PADMA
FLOODPLAIN
MAHANANDA
FLOODPLAIN
Physiographic Boundary
TRACT
MAHANANDAFLOODPLAIN
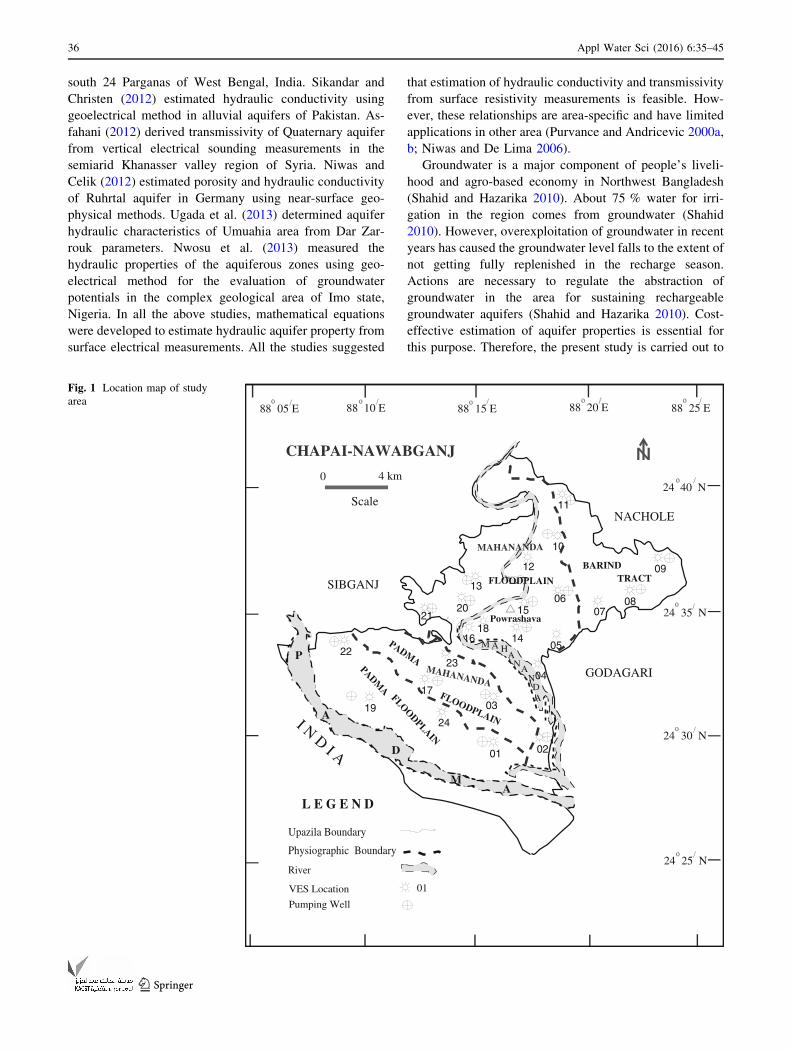
Fig. 1 Location map of study
area
36 Appl Water Sci (2016) 6:35–45
123
establish the physical relationship between aquifer prop-
erties and geoelectrical properties of the area obtained by
VES experiments.
The VES experiments have been conducted in Chapai-
Nawabganj area located in the northwestern part of Ban-
gladesh. It lies between the geographical coordinates hav-
ing latitude 24�250N and 25�430N and longitude 88�060Eand 88�250E (Fig. 1). The area covers about 475 km2 with
population over 0.38 million, among which more than 60
percent depend directly or indirectly on agricultural work.
The total cultivable land is about 340 km2. More than 55 %
of cultivated land requires irrigation, which totally fulfilled
from groundwater.
Geology of the area
Geomorphology of the area can be broadly divided into two
zones (Rashid 1991) viz. western floodplain (70 % of total
area) and the northeastern Pleistocene Terrace (30 % of total
area), which is also known as the Barind Tract (Morgan and
McIntire 1959). The uplifted terraces of Pleistocene sedi-
ments of Barind Tracts are more strongly weathered than the
surrounding alluvium. In the areas with alluvial, the Barind
Tract sediments can be found at depths of the order of
150–200 m or more. Four distinct physiographic sub-divi-
sions are identified in the present study area (Sattar 2005).
These are Padma floodplain, Padma–Mahananda floodplain,
Mahananda floodplain, and the Barind Tract. The Padma and
the Mahananda are that two prominent rivers and control the
overall hydrogeomorphological activity. The upper aquifers
in the region are unconfined or semi-confined in nature. The
thickness of the exploitable aquifer ranges from 10 to 40 m.
Jahan et al. (1994) computed that the specific yield of the
aquifer in the area varies from 8 to 32 % with a general
decreasing trend from north toward central portion. The
maximum depth to groundwater table from land surface
varies from 7 to 30 m (Asaduzzaman and Rushton 2006). The
topography of the area ismainly flat with an average elevation
of 25 m above the mean sea level. There is a mild surface
gradient toward southeast (Shahid and Hazarika 2010).
Materials and methods
Theoretical background
From well-known Darcy’s law, the water discharge, Q (m3/
s), may be expressed in the form (Nath et al. 2000):
Q ¼ KI0A ð1Þ
and the differential form of Ohm’s law can be written as
(Nath et al. 2000):
J ¼ rE ð2Þ
where K = hydraulic conductivity (m/day), I0= hydraulic
gradient, A = area of cross-section perpendicular to the
direction of flow, J = current density (A/m2), r = elec-
trical conductivity (inverse of resistivity in a homogeneous,
isotopic medium), and E = applied electrical field. These
two fundamental laws of fluid flow and current flow may
be utilized to find a probable relationship between elec-
trical and hydraulic characters of the formation.
The geoelectrical resistivity, q, appears as the material
specific constant of proportionality in the expression for the
total resistivity (A) of the cylinder of length L and cross-
sectional area D of uniform composition (Nath et al. 2000),
A ¼ q L=D ð3Þ
The total resistivity can be obtained experimentally
through Ohm’s law, R = V/I, where V is the potential
difference between the ends of the cylinder and I is the
total current flowing through the cylinder. The resistivity of
the material is an intrinsic property of the material, that can
be calculated as the product of the apparent resistance
Rapp = V/I and a geometric factor K = A/L that carries
information about geometry of the cylinder (Islami 2011).
Now if we consider a prism of unit cross-section, with
thickness h and resistivity q, the resistance (R) normal to
the face of the prism, and the conductance (S) parallel to
the face of the prism can be given as (Patra and Nath 1999),
R ¼ hq ð4Þ
and
S ¼ h
q¼ hr ð5Þ
This is when considering of a prism of aquifer material
having unit cross-sectional area and thickness h. R and S
are Dar Zarrouk parameters with R as transverse resistance
and S as longitudinal conductance (Zohdy 1974 and 1975).
The transmissivity T (the product of hydraulic conductivity
and aquifer thickness) can be derived in terms of R and S as
(Patra and Nath 1999),
T ¼ KrR ð6Þ
and
T ¼ K
r
� �S ð7Þ
It has been observed (Niwas and Singhal 1981) that either
of the two propositions, Kr = constant or K=r = constant
could be true for an area under study, also valid for other
areas with similar geological setting and water quality.
Dasargues (1997) have used the overall resistivity of
aquifer material to correlate it with hydraulic conductivity
(K) using the relation (Patra and Nath 1999),
Appl Water Sci (2016) 6:35–45 37
123
K 1 A ð8Þ
where
A ¼X
qi ð9Þ
where i represent different layers of aquifer. It is well-
established fact that the variations in resistivity are due to
the variations of geological formations with their charac-
teristics’ compositions.
Several investigations have been carried out in the past
to relate aquifer parameters with geoelectric properties for
different geological setup which have been discussed in
detail in introduction section. In the present study,
transverse resistance is correlated with aquifer transmis-
sivity and the total resistivity is correlated with hydraulic
conductivity to decipher the functional analogous rela-
tionships for Northwest Bangladesh.
Field survey and data processing
For the proposed study, 24 VES experiments were per-
formed at pre-selected stations (Fig. 1) employing Sch-
lumberger array. These stations were selected on the basis
of reconnaissance survey, where emphasis was given on
the proximity to the existing production wells. The field
measurements were made with a minimum and maximum
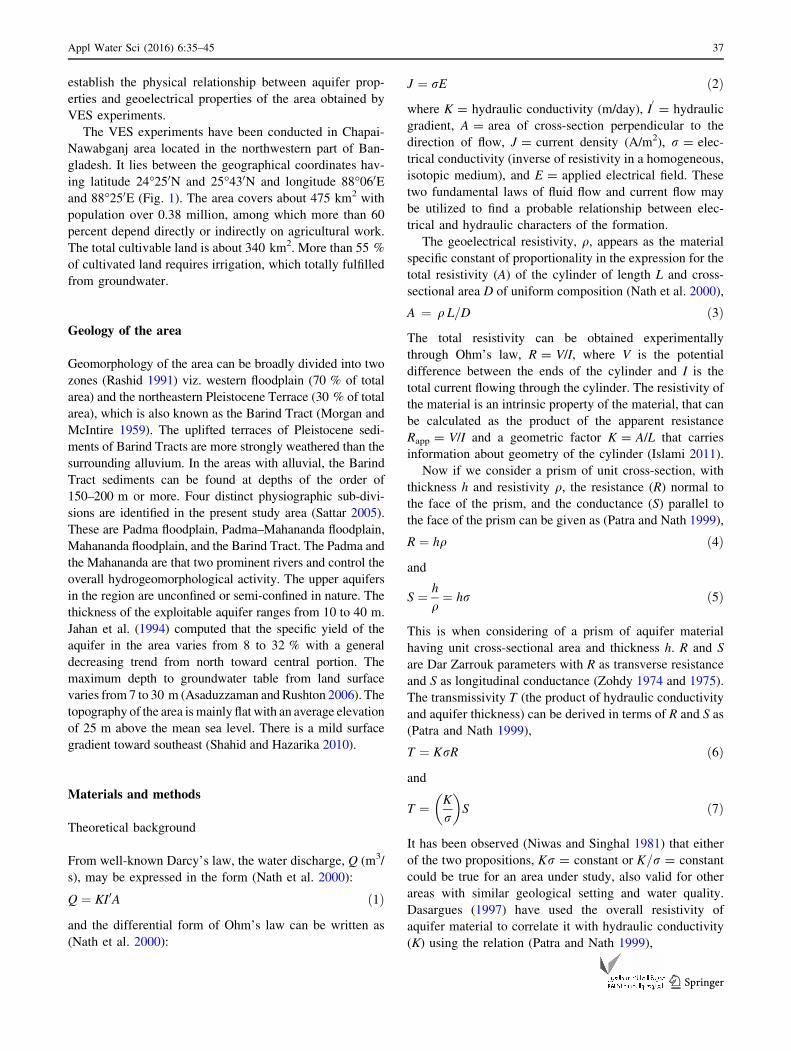
Fig. 2 Comparison of VES logs and lithologs in a Padma–Mahananda floodplain area; b Padma Floodplain; cMahananda Floodplain; and d The
Barind Tract
38 Appl Water Sci (2016) 6:35–45
123
current electrode spacing (AB) of 400 and 1,000 m,
respectively. The collected VES data were interpreted
using both the multi-layer forward (Zohdy and Bisdorf
1989) and Inverse (Cooper 2001) methods. The intentions
of the use of two models were to increase the acceptability
of interpretation and hence furnish accurate information on
groundwater-bearing formation underneath.
The pumping test data at 15 locations were collected
from Barind Multi-purpose Development Authority
(BMDA) and used for the estimation of aquifer hydraulic
properties. Location of pumping test is also shown in
Fig. 1. Same number is used in Fig. 1 to represent VES and
pumping location. At each location, three-step pumping
test for the period of 1,080 min, each step being of 360 min
was conducted to study aquifer properties. The discharging
rates of the steps were 4,893, 6,116 and 7,339 m3/day,
respectively. However, drawdown data were collected at
regular time intervals. Pumping test data available in the
study area were ‘single-well test’. Considering the nature
of data and their applicability to comply the different rel-
evant equations, the Eden and Hazel (1973) method
available in software StepMaster (version 2.0) was used to
estimate transmissivity. The details of Eden and Hazel
method can be found in Eden and Hazel (1973).
Result and discussions
Analysis of lithologs
On the basis of borehole information, the groundwater-
bearing sedimentary sequences of the floodplain and Barind
areas can be divided into several recognizable hydrostrati-
graphic units. The top clayey layer mainly consists of recent
(floodplain) to older alluvium (Barind Tract) of Quaternary
age. The textural characteristics of this unit are mainly clay,
silt, and silty clay to very fine sand. Thickness of the zone
also varies in accordance with its geomorphologic situation.
In the floodplain area, the thickness ranges from 6 to 12 m.
In and around the Barind region, thickness increases with the
increase in elevation from 12 to 24 m.
The second layer is a composite aquifer. This is a
common sandy unit of fine to medium-grained sand present
just below the top layer in the floodplain area. Some times
this zone is absent in the Barind region. Thickness of this
zone varies from 5 to 15 m, and 3 to 10 m in the floodplain
and Barind area, respectively.
The third layer is the main aquifer consisting of medium
to coarse-grained sand, and coarse sand with gravels which
serve as potential zones for groundwater storage, distribu-
tion and exploration. The main hydrogeological constrains
of this porous zone is its uneven distribution below the
composite aquifer layer. This zone is very thick (25–35 m)
at few places around the floodplain area, and is relatively
thin (10–15 m) in the Barind Tract. This indicates that the
main water-bearing unit is gradually thinning from flood-
plain to the Barind area and is regarded as the ultimate
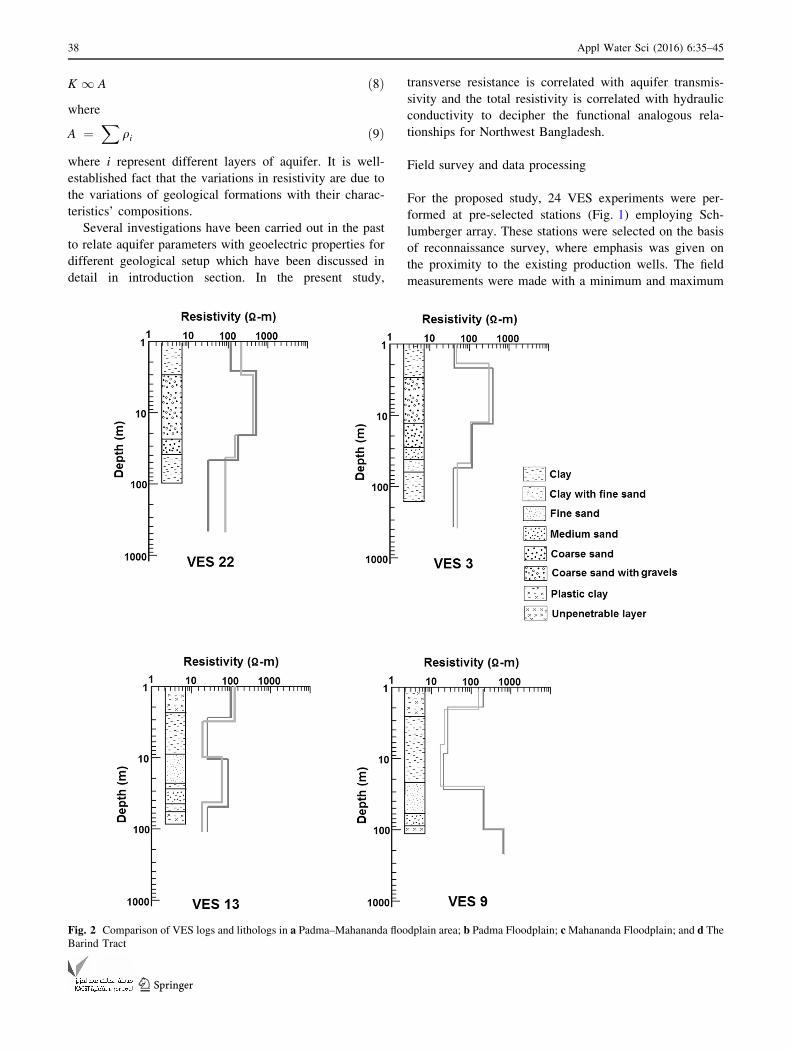
Fig. 3 Spatial distribution of aquifer thickness prepared from litho-
log data
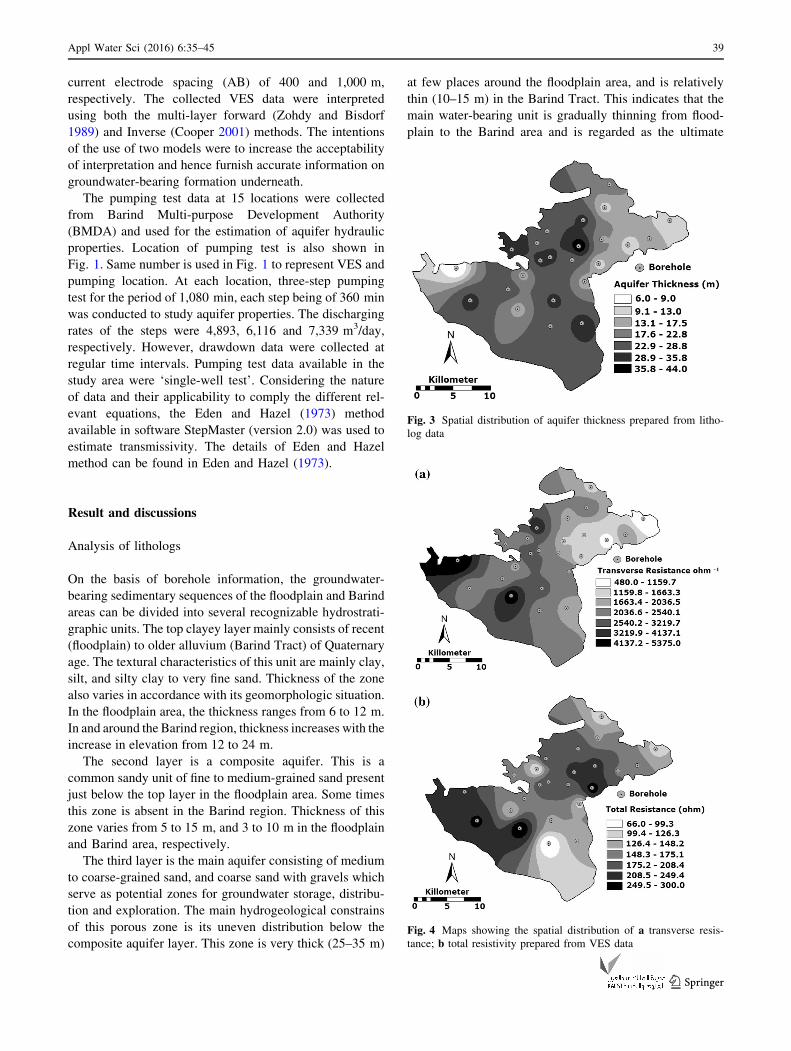
Fig. 4 Maps showing the spatial distribution of a transverse resis-
tance; b total resistivity prepared from VES data
Appl Water Sci (2016) 6:35–45 39
123
constrain of water scarcity of the Barind Tract. Considering
the development potential of groundwater in the area of
study, this zone can be considered as most productive zone
at both floodplain and the Barind Tract.
The bottom layer in the region is commonly the Barind
clay particularly at the Barind Tract. This clay is very
hard and compact when it is dried. Its normal color is
black but at places it varies from strong brown to very
pale brown. Usually in the floodplain this lies just below
main aquifer layer but at few places, especially in the
Barind, it appears below the top aquitard layer or even
very close to the surface and also to a considerable depth
(40–45 m).
Water table in the area lies below the top aquiclude and
hence developed a favorable confined condition for the
main aquifer. The water in the aquifer is usually fresh.
Correlation between lithologs and VES logs
It is well recognized that the VES signature reflects the
underground lithology up to which it reaches. The VES
models have been compared with the available lithologs of
the nearby location to observe the relation between them.
The VES logs along with the nearest lithologs of different
physiographic sub-divisions are presented in Fig. 2. It can
be observed that in most cases the Forward models show
better relation with the lithologs than those of the Inversion
model. Vertical distributions of the VES logs are in good
agreement with the lithologs having negligible discrepancy
among them.
Aquifer thickness
Aquifer thicknesses from borehole data are interpolated
using krigging method to prepare the map of aquifer
thickness of the study area as shown in Fig. 3. Aquifer
thickness is more than 10 m in most parts of the study area.
The thickness is found to be less in Barind tract where it
varies between 9.1 and 22.8 m. Aquifer thickness in other
geomorphic region is more compared to Barind tract. In
some parts of floodplain regions, aquifer thickness is found
to be more than 35 m.
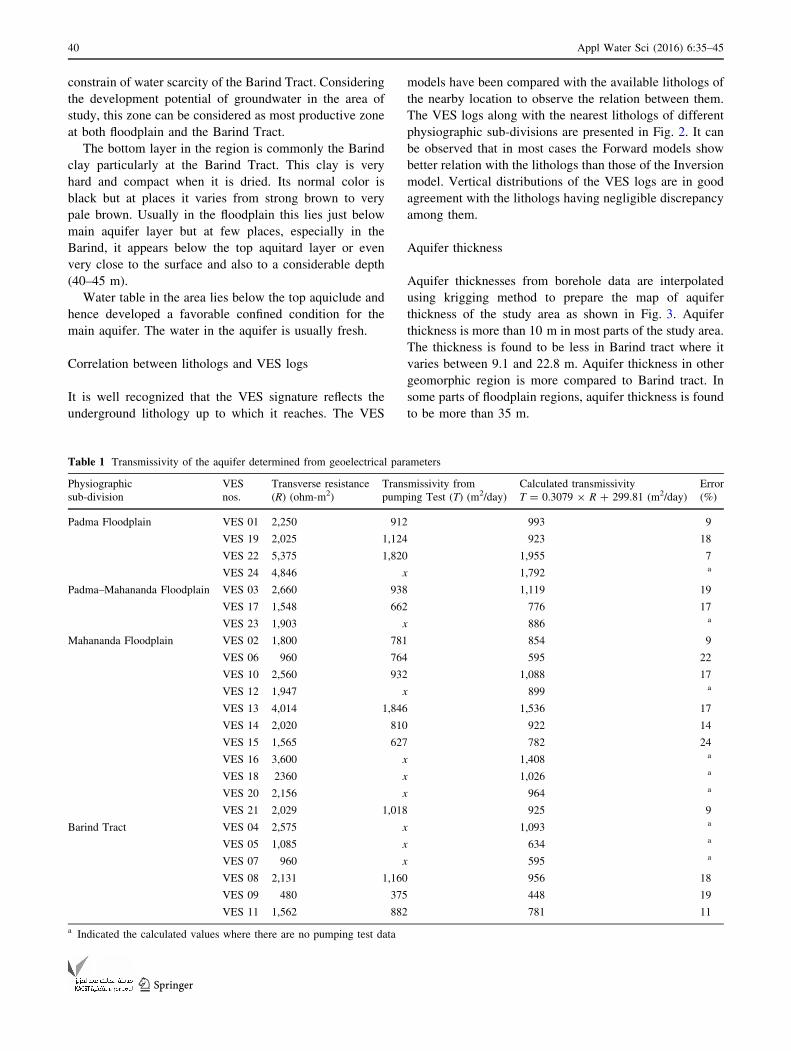
Table 1 Transmissivity of the aquifer determined from geoelectrical parameters
Physiographic
sub-division
VES
nos.
Transverse resistance
(R) (ohm-m2)
Transmissivity from
pumping Test (T) (m2/day)
Calculated transmissivity
T = 0.3079 9 R ? 299.81 (m2/day)
Error
(%)
Padma Floodplain VES 01 2,250 912 993 9
VES 19 2,025 1,124 923 18
VES 22 5,375 1,820 1,955 7
VES 24 4,846 x 1,792 a
Padma–Mahananda Floodplain VES 03 2,660 938 1,119 19
VES 17 1,548 662 776 17
VES 23 1,903 x 886 a
Mahananda Floodplain VES 02 1,800 781 854 9
VES 06 960 764 595 22
VES 10 2,560 932 1,088 17
VES 12 1,947 x 899 a
VES 13 4,014 1,846 1,536 17
VES 14 2,020 810 922 14
VES 15 1,565 627 782 24
VES 16 3,600 x 1,408 a
VES 18 2360 x 1,026 a
VES 20 2,156 x 964 a
VES 21 2,029 1,018 925 9
Barind Tract VES 04 2,575 x 1,093 a
VES 05 1,085 x 634 a
VES 07 960 x 595 a
VES 08 2,131 1,160 956 18
VES 09 480 375 448 19
VES 11 1,562 882 781 11
a Indicated the calculated values where there are no pumping test data
40 Appl Water Sci (2016) 6:35–45
123
Transverse resistance and total resistivity
Transverse resistance and total resistivity computed from
VES data are interpolated to prepare the corresponding
maps of the study area which are shown in Fig. 4a, b,
respectively. The transverse resistance in the study area is
found to vary between 480 and 5,375 ohm-1. Overall, it is
found to be less in Barind tract compared to other geo-
morphic regions. Total resistivity, on the other hand, is
found to vary between 66 and 300 ohm in the study area.
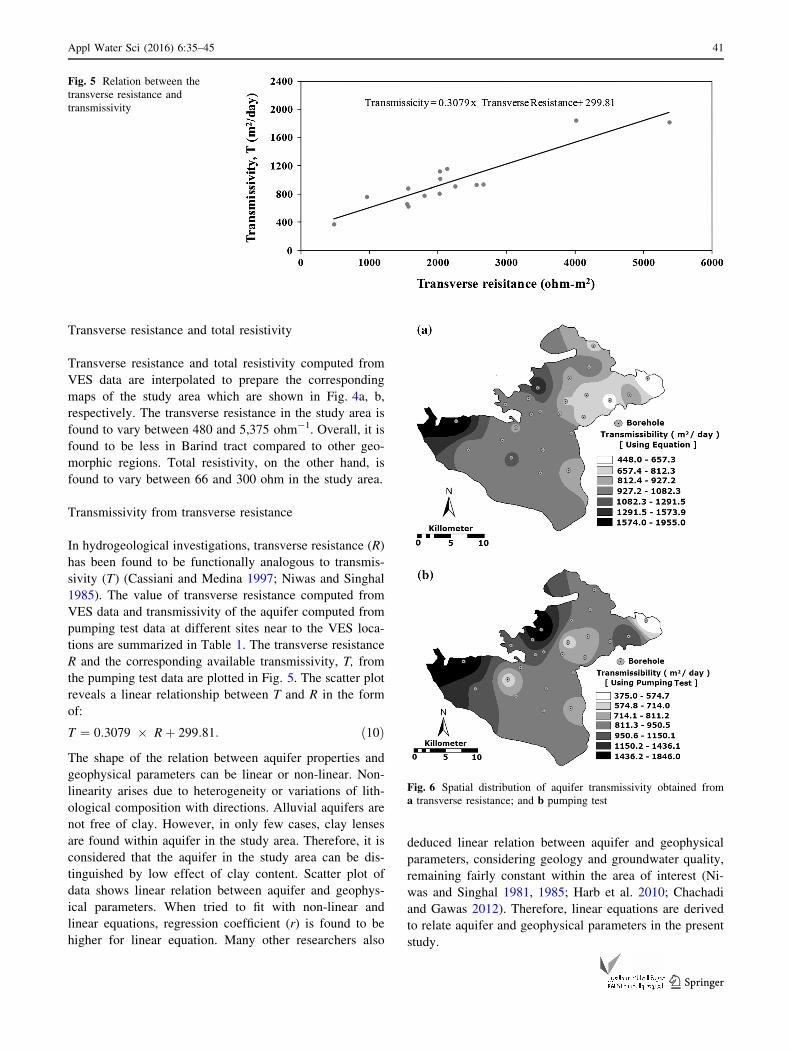
Transmissivity from transverse resistance
In hydrogeological investigations, transverse resistance (R)
has been found to be functionally analogous to transmis-
sivity (T) (Cassiani and Medina 1997; Niwas and Singhal
1985). The value of transverse resistance computed from
VES data and transmissivity of the aquifer computed from
pumping test data at different sites near to the VES loca-
tions are summarized in Table 1. The transverse resistance
R and the corresponding available transmissivity, T, from
the pumping test data are plotted in Fig. 5. The scatter plot
reveals a linear relationship between T and R in the form
of:
T ¼ 0:3079 � Rþ 299:81: ð10Þ
The shape of the relation between aquifer properties and
geophysical parameters can be linear or non-linear. Non-
linearity arises due to heterogeneity or variations of lith-
ological composition with directions. Alluvial aquifers are
not free of clay. However, in only few cases, clay lenses
are found within aquifer in the study area. Therefore, it is
considered that the aquifer in the study area can be dis-
tinguished by low effect of clay content. Scatter plot of
data shows linear relation between aquifer and geophys-
ical parameters. When tried to fit with non-linear and
linear equations, regression coefficient (r) is found to be
higher for linear equation. Many other researchers also
deduced linear relation between aquifer and geophysical
parameters, considering geology and groundwater quality,
remaining fairly constant within the area of interest (Ni-
was and Singhal 1981, 1985; Harb et al. 2010; Chachadi
and Gawas 2012). Therefore, linear equations are derived
to relate aquifer and geophysical parameters in the present
study.
Fig. 5 Relation between the
transverse resistance and
transmissivity
Fig. 6 Spatial distribution of aquifer transmissivity obtained from
a transverse resistance; and b pumping test
Appl Water Sci (2016) 6:35–45 41
123
The maps of aquifer transmissivity estimated from
transverse resistance using Eq. (10) and that obtained from
pumping test are shown in Fig. 6a, b, respectively. It can be
seen from the maps that spatial distribution of transmis-
sivity values calculated from transverse resistance matched
well with that obtained through pumping test. It has also
been found that the calculated T value in the VES loca-
tions, where pumping test data are not available (viz, VES
locations 04, 05, 07, 12, 18, 20, 21 and 23) also well
matched with the T of surrounding physiographic sub-
Table 2 Hydraulic conductivity of the aquifer determined from geoelectrical parameters
Physiographic
sub-division
VES
nos.
Total resistivity
of the aquifer
(A) (ohm-m)
Hydraulic conductivity
from pumping Test
(K) (m/day)
Predicted hydraulic conductivity
from the equation
K = 0.3712 9 A - 7.372 (m/day)
Error
(%)
Padma Floodplain VES 01 66 34.4 31 10
VES 19 255 69.6 75 8
VES 22 215 80.2 66 18
VES 24 300 x 85 a
Padma–Mahananda Floodplain VES 03 143 60 49 18
VES 17 114 33.5 42 26
VES 23 163 x 54 a
Mahananda Floodplain VES 02 132 45 46 3
VES 06 225 67 68 1
VES 10 145 43.4 49 14
VES 12 195 x 61 a
VES 13 212 85 65 24
VES 14 200 52.9 62 18
VES 15 229 57.8 69 19
VES 16 185 x 59 a
VES 18 205 x 63 a
VES 20 85 x 36 a
VES 21 154.5 43.6 52 18
Barind Tract VES 04 115 x 42 a
VES 05 272 x 79 a
VES 07 172 x 56 a
VES 08 155 50 52 4
VES 09 120 42 44 4
VES 11 110 46.9 41 12
a Indicated the calculated values where there are no pumping test data
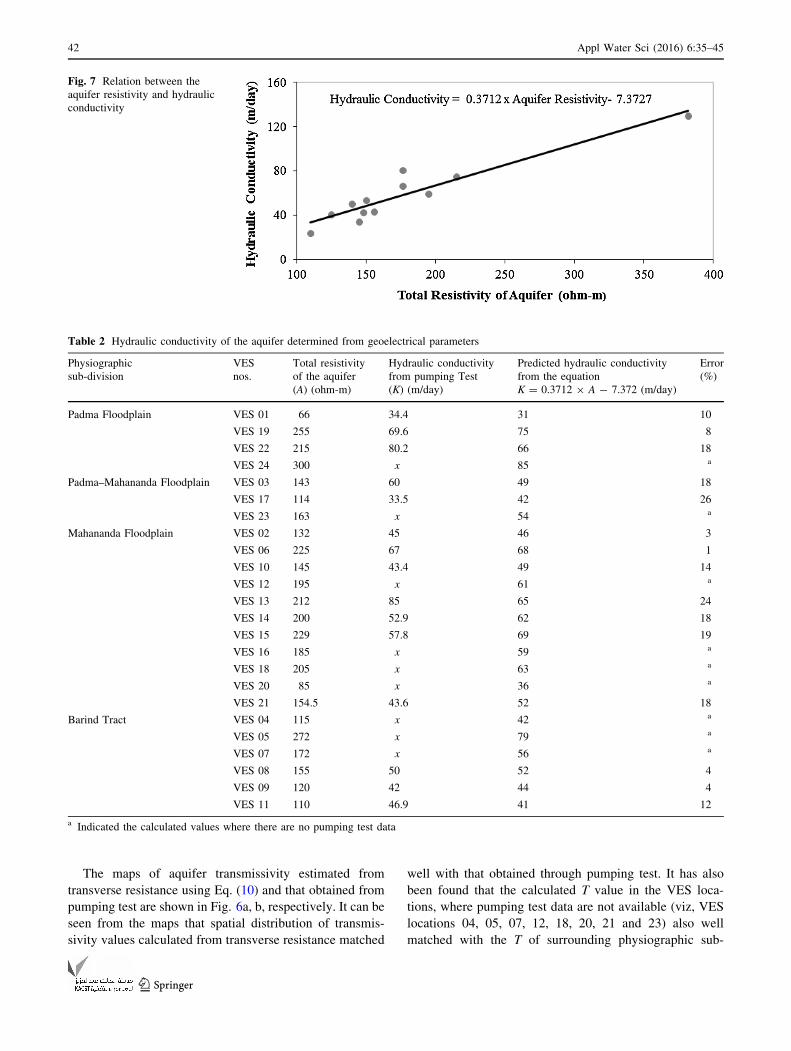
Fig. 7 Relation between the
aquifer resistivity and hydraulic
conductivity
42 Appl Water Sci (2016) 6:35–45
123
divisions (Table 1). Therefore, it can be remarked that
T (transmissivity) of the study area can be calculated from
the VES data using Eq. 10.
Hydraulic conductivity from aquifer total resistivity
Aquifer total resistivity (A) estimated from VESs is cor-
related with the hydraulic conductivity values computed
from the analysis of pumping test at 15 borehole locations
near to the VES points. The plot of aquifer resistivity along
abscissa and hydraulic conductivity along ordinate is pre-
sented in Fig. 7. This scatter plot also shows a linear
relationship between K and A which can be written in the
form:
K ¼ 0:3712� A� 7:3727 ð11Þ
Hydraulic conductivity (K) estimated by pumping test and
Eq. (11) are presented in Table 2. It is apparent from the
Table 2 that values calculated by aforementioned equation
give reasonable estimation of K for the respective regions
which belong to different physiographic sub-divisions. The
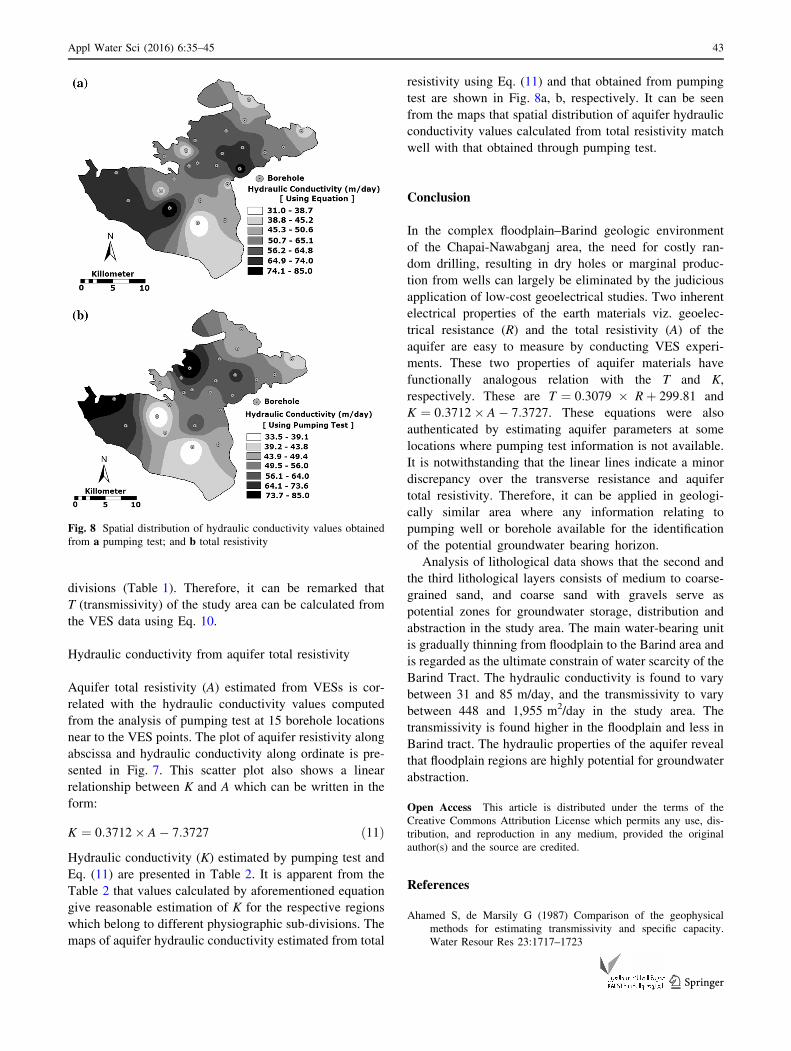
maps of aquifer hydraulic conductivity estimated from total
resistivity using Eq. (11) and that obtained from pumping
test are shown in Fig. 8a, b, respectively. It can be seen
from the maps that spatial distribution of aquifer hydraulic
conductivity values calculated from total resistivity match
well with that obtained through pumping test.
Conclusion
In the complex floodplain–Barind geologic environment
of the Chapai-Nawabganj area, the need for costly ran-
dom drilling, resulting in dry holes or marginal produc-
tion from wells can largely be eliminated by the judicious
application of low-cost geoelectrical studies. Two inherent
electrical properties of the earth materials viz. geoelec-
trical resistance (R) and the total resistivity (A) of the
aquifer are easy to measure by conducting VES experi-
ments. These two properties of aquifer materials have
functionally analogous relation with the T and K,
respectively. These are T ¼ 0:3079 � Rþ 299:81 and
K ¼ 0:3712� A� 7:3727. These equations were also
authenticated by estimating aquifer parameters at some
locations where pumping test information is not available.
It is notwithstanding that the linear lines indicate a minor
discrepancy over the transverse resistance and aquifer
total resistivity. Therefore, it can be applied in geologi-
cally similar area where any information relating to
pumping well or borehole available for the identification
of the potential groundwater bearing horizon.
Analysis of lithological data shows that the second and
the third lithological layers consists of medium to coarse-
grained sand, and coarse sand with gravels serve as
potential zones for groundwater storage, distribution and
abstraction in the study area. The main water-bearing unit
is gradually thinning from floodplain to the Barind area and
is regarded as the ultimate constrain of water scarcity of the
Barind Tract. The hydraulic conductivity is found to vary
between 31 and 85 m/day, and the transmissivity to vary
between 448 and 1,955 m2/day in the study area. The
transmissivity is found higher in the floodplain and less in
Barind tract. The hydraulic properties of the aquifer reveal
that floodplain regions are highly potential for groundwater
abstraction.
Open Access This article is distributed under the terms of the
Creative Commons Attribution License which permits any use, dis-
tribution, and reproduction in any medium, provided the original
author(s) and the source are credited.
References
Ahamed S, de Marsily G (1987) Comparison of the geophysical
methods for estimating transmissivity and specific capacity.
Water Resour Res 23:1717–1723
Fig. 8 Spatial distribution of hydraulic conductivity values obtained
from a pumping test; and b total resistivity
Appl Water Sci (2016) 6:35–45 43
123
Asaduzzaman M, Rushton KR (2006) Improved yield from aquifers
of limited saturated thickness using inverted wells. J Hydrol
326:311–324
Asfahani J (2012) Quaternary aquifer transmissivity derived from
vertical electrical sounding measurements in the Semi-Arid
Khanasser Valley region. Syria. Acta Geophysica
60(4):1143–1158
Ayers JF (1989) Conjunctive use of geophysical and geological data
in the study of an alluvial aquifer. Ground Water 27:625–632
Batte AG, Barifaijo E, Kiberu JM, Kawule W, Muwanga A, Owor M,
Kisekulo J (2010) Correlation of geoelectric data with aquifer
parameters to delineate the groundwater potential of hard rock
terrain in Central Uganda. Pure appl Geophys
167(12):1549–1559
Cassiani G, Medina MA Jr (1997) Incorporating auxiliary geophysical
data into groundwater flow parameter estimation. Groundwater
35:79–91
Chachadi AG, Gawas PD (2012) Correlation study between geoelec-
trical and aquifer parameters in West Coast Laterites. Int J Earth
Sci Eng 5(2):282–287
Cooper GRJ (2001) V E S 1.30, Forward modeling and inversion of
Schlumberger resistivity soundings for Microsoft Windows.
University of the Witwatersrand, Johannesburg, SA
Dasargues A (1997) Modeling base flow from an alluvial aquifer
using hydraulic-conductivity data obtained from a derived
relation with apparent electrical resistivity. J Hydrogeol
5:97–108
Eden RN, Hazel CP (1973) Computer and graphical analysis of
variable discharge pumping test of wells. Inst Eng Australia
Civil Eng Trans 15:5–10
Egbai JC (2011) Vertical electrical sounding for the determination of
aquifer transmissivity. Aust J Basic Appl Sci 5(6):1209–1214
Ezeh CC (2011) Geoelectrical studies for estimating aquifer hydraulic
properties in Enugu State, Nigeria. Int J Phys Sci
6(14):3319–3329
Frohlich RK, Fisher JJ, Summerly E (1996) Electric-hydraulic
conductivity correlation in fractured crystalline bedrock, Central
Landfill, Rhode Island, USA. J Appl Geophys 35:249–259
Harb N, Haddad K, Farkh S (2010) Calculation of transverse
resistance to correct aquifer resistivity of groundwater saturated
zones : implications for estimating its hydrogeological proper-
ties. Leban Sci J 11(1):105–115
Islami N (2011) Geoelectrical resistivity method for salt/brackish
water mapping. J Coast Dev 14(2):104–114
Jahan CS, Mazumder QH, Ghose SK, Asaduzzaman M (1994)
Specific yield evaluation: Barind Area, Bangladesh. J Geol Soc
India 44:283–290
Kalinski RJ, Kelly WE, Bogardi I, Pesti G (1993) Electrical resistivity
measurements to estimate travel times through unsaturated
ground water protective layers. J Appl Geophys 30:161–173
Kelly WE, Frohlich RK (1985) Relations between aquifer electrical
and hydraulic properties. Ground Water 23:182–189
Khan AA, Akhter SH, Ahmed KM, Hasan MA (2002) VES signature
in soft rock groundwater exploration vis-a-vis geoenvironmental
implications. In: Sherif et al. (eds) Groundwater hydrology, vol.
2, pp 179–193. Balkema Publishers, Leiden
Kruseman GP, de Ridder NA (1994) Analysis and evaluation of
pumping test data, 3rd edn., vol. 11. International Institute for
Land Reclamation and Development, Wageningen
Majumdar RK, Das D (2011) Hydrological characterization and
estimation of aquifer properties from electrical sounding data in
Sagar Island region, South 24 Parganas, West Bengal, India.
Asian J Earth Sci 4(2):60–74
Mbonu PDC, Ebeniro JO, Ofoegbu CO, Ekine AS (1991) Geoelectric
sounding for the determination of aquifer characteristics in parts
of the Umuahia area of Nigeria. Geophysics 56:284–291
Morgan P, McIntire WG (1959) Quaternary geology of Bengal basin.
Geol Soc Am Bull 70:319–342
Nath SK, Patra HP, Shahid S (2000) Geophysical prospecting for
ground water. Oxford and IBH Publishing, New Delhi
Niwas S, Celik M (2012) Equation estimation of porosity and
hydraulic conductivity of Ruhrtal aquifer in Germany using near
surface geophysics. J Appl Geophys 84:77–85
Niwas S, De Lima OAL (2006) Correlating electrical and hydraulic
conductivity of a general aquifer model: concept and application.
J Geol Soc India 67(6):730–736
Niwas S, Singhal DC (1981) Estimation of aquifer transmissivity
from Dar-Zarrouk Parameters in Porous Media. J Hydrol
50:393–399
Niwas S, Singhal DC (1985) Aquifer transmissivity of porous media
from resistivity data. J Hydrol 82:143–153
Nwosu LI, Nwankwo CN, Ekine AS (2013) Geoelectric investigation
of the hydraulic properties of the aquiferous zones for evaluation
of groundwater potentials in the complex geological area of imo
state, Nigeria. Asian J Earth Sci 6(1):1–15
Onuoha KM, Mbazi FCC (1988) Aquifer transmissivity from
electrical sounding data: The case of Ajali Sandstone aquifers,
South West of Enugu, Nigeria: Groundwater and mineral
resources of Nigeria. Vieweg-Verlag, Wiesbaden, pp 17–30
Patra HP, Nath SK (1999) Schlumberger geoelectric sounding in
ground water. Principles, interpretation and applications. Balk-
ema Publishers, Rotterdam, p 153
Ponzini G, Ostroman A, Mollinai M (1984) Empirical relation
between electrical transverse resistance and hydraulic transmis-
sivity. Geoexploration 22:1–15
Purvance DT, Andricevic R (2000a) On the electrical-hydraulic
conductivity correlation in aquifers. Water Resour Res
36:205–213
Purvance DT, Andricevic R (2000b) Geoelectrical characterization of
the hydraulic conductivity field and its spatial structure at
variable scales. Water Resour Res 36:215–224
Rashid H (1991) Geography of Bangladesh. Oxford University Press
Limited, Dhaka
Sattar GS (2005) Combined analysis of geoelectrical and hydrogeo-
logical data for the evaluation of groundwater potentiality in
Chapai-Nawabganj area of Bangladesh, Unpublished Ph.D.
thesis. University of Rajshahi
Shahid S (2010) Spatial assessment of groundwater demand in
Northwestern Bangladesh. Int J Water 5(3):267–283
Shahid S, Hazarika MK (2010) Groundwater droughts in the
northwestern districts of Bangladesh. Water Resour Manag
24(10):1989–2006
Shevnin V, Delgado-Rodrıguez O, Mousatov A, Ryjov A (2006)
Estimation of soil hydraulic conductivity on clay content,
determined from resistivity data. Paper presented at the 19th
symposium on the application of geophysics to engineering and
environmental problems, SAGEEP 2006: geophysical applica-
tions for environmental and engineering hazzards—advances
and constraints 2:1464–1473
Sikandar P, Christen EW (2012) Geoelectrical sounding for the
estimation of hydraulic conductivity of alluvial aquifers. Water
Resour Manag 26(5):1201–1215
Singhal DC, Niwas S, Shakeel M, Adam EM (1998) Estimation of
hydraulic characteristics of alluvial aquifers from electrical
resistivity data. J Geol Soc India 51:461–470
Ugada U, Ibe KK, Akaolisa CZ, Opara AI (2013) Hydrogeophysical
evaluation of aquifer hydraulic characteristics using surface
geophysical data: a case study of Umuahia and environs,
southeastern Nigeria. Arab J Geosci 1–12 (in press)
Yadav GS, Abolfazli A (1998) Geoelectrical soundings and their
relationship to hydraulic parameters in semi-arid regions of
Jalore, north-western India. J Appl Geophys 39:35–51
44 Appl Water Sci (2016) 6:35–45
123
Zohdy AAR (1974) Use of Dark Zarrouk curves in the interpretation
of vertical electrical sounding data. U.S. Geol Surv Bull
41:1313-D
Zohdy AAR (1975) Automatic interpretation of Schlumberger
sounding curves using modified Dark Zarrouk function. U.S.
Geol Surv Bull 39:1313-E
Zohdy AAR, Bisdorf RJ (1989) Programs for the automatic process-
ing and interpretation of Schlumberger sounding curves in Quick
BASIC 4.0. U.S. Geological Survey Open-File Report, 89–137
Appl Water Sci (2016) 6:35–45 45
123