Embed Size (px)
Citation preview

Deciphering common and rare genetic e�ectson reading ability

© 2016, Amaia Carrion Castillo
ISBN: 978-90-76203-78-2
Printed and bound by Ipskamp Drukkers

Deciphering common and rare genetic e�ectson reading ability
Proefschri�
ter verkrijging van de graad van doctor
aan de Radboud Universiteit Nijmegen
op gezag van de rector magni�cus prof. dr. J.H.J.M. van Krieken,
volgens besluit van het college van decanen
in het openbaar te verdedigen op maandag 7 november 2016
om 12.30 uur precies
door
Amaia Carrion Castillogeboren op 22 november 1988
te Donostia (Spanje)

PromotorProf. dr. Simon E. Fisher
CopromotorDr. Clyde Francks (MPI)
ManuscriptcommissieProf. dr. Anneke I. den Hollander
Prof. dr. Juha Kere (Karolinska Institutet, Zweden)
Prof. dr. Gerd Schulte-Korne (Ludwig-Maximilians-University Munich, Duitsland)

Deciphering common and rare genetic e�ectson reading ability
Doctoral �esis
to obtain the degree of doctor
from Radboud University Nijmegen
on the authority of the Rector Magni�cus prof. dr. J.H.J.M. van Krieken,
according to the decision of the Council of Deans
to be defended in public on Monday, November 7, 2016
at 12.30 hours
by
Amaia Carrion CastilloBorn on 22 November 1988
in Donostia (Spain)
SupervisorProf. dr. Simon E. Fisher
Co-supervisorDr. Clyde Francks (MPI)
Doctoral �esis CommitteeProf. dr. Anneke I. den Hollander
Prof. dr. Juha Kere (Karolinska Institutet, Sweden)
Prof. dr. Gerd Schulte-Korne (Ludwig-Maximilians-University Munich, Germany)

Etxekoei


C O N T E N T S
1 General introduction 11
1.1 �e learning-to-read brain . . . . . . . . . . . . . . . . . . . . . . . . 11
1.2 Variation in reading ability . . . . . . . . . . . . . . . . . . . . . . . . 13
1.3 Complex and multifactorial aetiology . . . . . . . . . . . . . . . . . . 14
1.4 Aim of this thesis . . . . . . . . . . . . . . . . . . . . . . . . . . . . . 17
references . . . . . . . . . . . . . . . . . . . . . . . . . . . . . . . . . . . 20
2 Molecular Genetics of Dyslexia: An Overview 25
2.1 Introduction . . . . . . . . . . . . . . . . . . . . . . . . . . . . . . . . 26
2.2 First clues: the DYX1 locus . . . . . . . . . . . . . . . . . . . . . . . . 29
2.3 Two genes for the price of one: the DYX2 locus . . . . . . . . . . . . 32
2.4 �e DYX3 locus: a connection with IQ? . . . . . . . . . . . . . . . . . 38
2.5 DYX5, the ROBO1 gene and axon guidance . . . . . . . . . . . . . . . 39
2.6 Additional dyslexia susceptibility loci . . . . . . . . . . . . . . . . . . 41
2.7 Shared genetic aetiology between dyslexia and language impairments? 43
2.8 Exploring new endophenotypes: mismatch negativity . . . . . . . . . 44
2.9 Genetics and the Dutch Dyslexia Program: past, present and future . 46
2.10 Discussion . . . . . . . . . . . . . . . . . . . . . . . . . . . . . . . . . 48
2.11 Glossary of molecular genetic terms . . . . . . . . . . . . . . . . . . . 49
references . . . . . . . . . . . . . . . . . . . . . . . . . . . . . . . . . . . 53
3 Association analysis of dyslexia candidate genes in a Dutch longi-tudinal sample 63
3.1 Introduction . . . . . . . . . . . . . . . . . . . . . . . . . . . . . . . . 64
3.2 Material and Methods . . . . . . . . . . . . . . . . . . . . . . . . . . . 68
3.3 Results . . . . . . . . . . . . . . . . . . . . . . . . . . . . . . . . . . . 75
3.4 Discussion . . . . . . . . . . . . . . . . . . . . . . . . . . . . . . . . . 82
references . . . . . . . . . . . . . . . . . . . . . . . . . . . . . . . . . . . 87
supplementary information . . . . . . . . . . . . . . . . . . . . . . 93
4 Evaluation of results from genome-wide studies of language andreading in a novel independent dataset 105
4.1 Introduction . . . . . . . . . . . . . . . . . . . . . . . . . . . . . . . . 107
9

10 CONTENTS
4.2 Methods . . . . . . . . . . . . . . . . . . . . . . . . . . . . . . . . . . 112
4.3 Results . . . . . . . . . . . . . . . . . . . . . . . . . . . . . . . . . . . 118
4.4 Discussion . . . . . . . . . . . . . . . . . . . . . . . . . . . . . . . . . 125
references . . . . . . . . . . . . . . . . . . . . . . . . . . . . . . . . . . . 129
supplementary information . . . . . . . . . . . . . . . . . . . . . . 133
5 Genome-wide sequencing in a large family with dyslexia 137
5.1 Introduction . . . . . . . . . . . . . . . . . . . . . . . . . . . . . . . . 138
5.2 Material and Methods . . . . . . . . . . . . . . . . . . . . . . . . . . . 140
5.3 Results . . . . . . . . . . . . . . . . . . . . . . . . . . . . . . . . . . . 148
5.4 Discussion . . . . . . . . . . . . . . . . . . . . . . . . . . . . . . . . . 153
references . . . . . . . . . . . . . . . . . . . . . . . . . . . . . . . . . . . 157
supplementary information . . . . . . . . . . . . . . . . . . . . . . 164
6 Noncoding mutations in SEMA3C co-segregate with developmen-tal dyslexia in a Dutch family 169
6.1 Introduction . . . . . . . . . . . . . . . . . . . . . . . . . . . . . . . . 170
6.2 Material and Methods . . . . . . . . . . . . . . . . . . . . . . . . . . . 171
6.3 Results . . . . . . . . . . . . . . . . . . . . . . . . . . . . . . . . . . . 180
6.4 Discussion . . . . . . . . . . . . . . . . . . . . . . . . . . . . . . . . . 188
references . . . . . . . . . . . . . . . . . . . . . . . . . . . . . . . . . . . 193
supplementary information . . . . . . . . . . . . . . . . . . . . . . 197
7 Discussion 203
7.1 Summary . . . . . . . . . . . . . . . . . . . . . . . . . . . . . . . . . . 203
7.2 Neuronal migration: a potentially unifying mechanism? . . . . . . . . 205
7.3 Revisiting candidate genes . . . . . . . . . . . . . . . . . . . . . . . . 207
7.4 Unraveling the genome: promises and challenges . . . . . . . . . . . 209
7.5 Genes, reading, and the brain . . . . . . . . . . . . . . . . . . . . . . . 211
7.6 Conclusion . . . . . . . . . . . . . . . . . . . . . . . . . . . . . . . . . 213
references . . . . . . . . . . . . . . . . . . . . . . . . . . . . . . . . . . . 214
nederlandse samenvatting 221
acknowledgements 225
curriculum vitae 227
mpi series in psycholinguistics 229

1
G E N E R A L I N T R O D U C T I O N
Reading is a paradigmatic case of a human cultural achievement. It is a fairly new de-
velopment: the earliest wri�en records date back a few thousand years (Rogers, 2004),
and draw a boundary between history and prehistory. Scripts are thought to have
evolved independently in di�erent cultures (Coulmas, 2003), such as the cuneiform
script in Mesopotamia, the Chinese script in Asia (Boltz, 1986), and the Olmec script
in Mesoamerica (Rodriguez Martinez et al., 2006). �e ability to encode language into
a wri�en form, and to decode the wri�en language by reading, has shaped recent hu-
man societies and history. Despite this central role, being able to read is neither a
necessary or de�ning skill for humans: not all cultures have it, and even in the ones
that developed a writing system, mastering this skill was typically restricted to a
minority of the population.
Notwithstanding that it is a learned cultural trait, the ability to read and write is
an instantiation of speci�c neurobiological and cognitive systems that are in place in
the human species. �e main aim of the present thesis is to study the genes that un-
derlie those systems, and to see how genetic variation in�uences variation in reading
ability.
1.1 the learning-to-read brain
Reading consists of deciphering information that is in wri�en form back to linguis-
tic form. So as to access the content of the linguistic information, reading requires
the reader to �nd a correspondence between the wri�en characters (graphemes) and
representations of speech sounds (phonemes) or other units of language that convey
meaning (e.g. morphemes). Hence, language is a prerequisite for learning this highly
specialized skill (Peterson and Pennington, 2015), although this relationship becomes
less hierarchical as reading co-occurs and feeds back into some aspects of language
11

12 chapter 1: general introduction
acquisition in school-age children. Consequently, several language-related cognitive
processes play an important role and co-occur during the reading process. Coming
to an explicit awareness of the sound structures of words (phoneme awareness) is re-
quired to enable the automatic matching of le�ers to sounds (van der Leij et al., 2013;
Peterson and Pennington, 2015). For example, to decode the word ‘cat’, you need to
identify and manipulate the corresponding speech sounds (the phonemes /k/, /æ/
and /t/). Phoneme awareness can be assessed using tasks such as phoneme deletion,
where participants are asked to identify how a word would be said if one sound were
omi�ed (e.g. how would cat sound without the /k/? /æt/). Fast processing speed is
also important for timing mechanisms involved in reading (de Jong and van der Leij,
2003; Pennington, 2006). Processing speed can be assessed using rapid naming tasks
where participants have to name a number of highly familiar symbols (which can be
digits, le�ers, colours or pictures) as fast as possible (de Jong and van der Leij, 2003).
Performance on such tasks correlate with reading ability, and have varying predic-
tive powers depending on age and reading experience (van der Leij et al., 2013), and
whether the way in which the words of a language are spelled (their orthographic
system) is more or less consistent (Landerl et al., 2013; Caravolas et al., 2013). �e
consistency of orthography varies across languages. For example, the sound /u/ is
systematically wri�en as ‘u’ in di�erent contexts in Basque (‘su’, ‘zugan’, ‘gu’, ‘lur’)
or Spanish (‘burro’, ‘bruja’, ‘bruno’) and as ‘oe’ Dutch (‘koe’, ‘moe’, ‘goed’, ‘boer’),
whereas the sound /u:/ 1is wri�en in multiple forms in English (‘too’, ‘true’, ‘shoe’,
‘�ew’, ’through’).
A highly organized cortical system that integrates information on several aspects
of words (i.e. the wri�en form, the speech sounds, and the meaning) has been de-
scribed in the adult literate brain (Price, 2012). It includes three main areas which
are usually co-located in the le� hemisphere: a posterior region in the dorsal infe-
rior parietal lobule (IPL), a posterior ventral occipitotemporal region (OT), and an
anterior area around the inferior frontal gyrus (IFG) (see Figure 1.1). �e same brain
networks are usually involved in skilled readers across di�erent languages and writ-
ing systems (Rueckl et al., 2015), and are likely constrained by networks underlying
processing of spoken language. Nevertheless, they are not hard-wired: learning to
read exempli�es brain plasticity as the relevant circuitry is re�ned upon acquisition
of literacy (Dehaene et al., 2015).
1 In English, the closest equivalent of the phoneme /u/ of the other three languages is speci�ed as being
long, hence the di�erent phonetic symbol used, i.e. /u:/.

1.2 variation in reading ability 13
Figure 1.1: Le� hemisphere reading network, taken from Richlan (2012).
1.2 variation in reading ability
Mastering reading is not equally challenging for everyone. Reading ability is a con-
tinuously distributed trait in the population, and it has been proposed that the un-
derlying causal mechanisms are similar across the distribution. Individuals that fall
at the low end of the distribution are categorized as dyslexic (Shaywitz et al., 1992).
�e dichotomization of any continuous trait relies on establishing a threshold
which, as in the case of dyslexia, can be arbitrary (Bishop, 2015; Peterson and Pen-
nington, 2015). For research purposes, a threshold reading performance of 1.5 stan-
dard deviations (SD) below the normative mean for a child’s age has been used (Shay-
witz et al., 1990; Peterson and Pennington, 2015), although this cut-o� varies across
studies (usually between -2SDs and -1SDs). An alternative diagnostic criterion is de-
�ned by the discrepancy between the observed performance and the predicted level
of pro�ciency given IQ (Peterson and Pennington, 2015), although the use of IQ for
dyslexia diagnosis is currently debated.
�e de�nition of dyslexia is based on the exclusion of other possible causes that
could explain the di�culty in mastering reading (e.g. intellectual disability, inade-
quate exposure to reading, or other obvious causes like comorbid neurological con-
ditions or a history of head injury) (Grigorenko, 2001). �e prevalence of dyslexia is
one of the highest for neurodevelopmental disorders, with estimates ranging from
5-10% (Shaywitz et al., 1990), although these �gures vary across countries and sex
14 chapter 1: general introduction
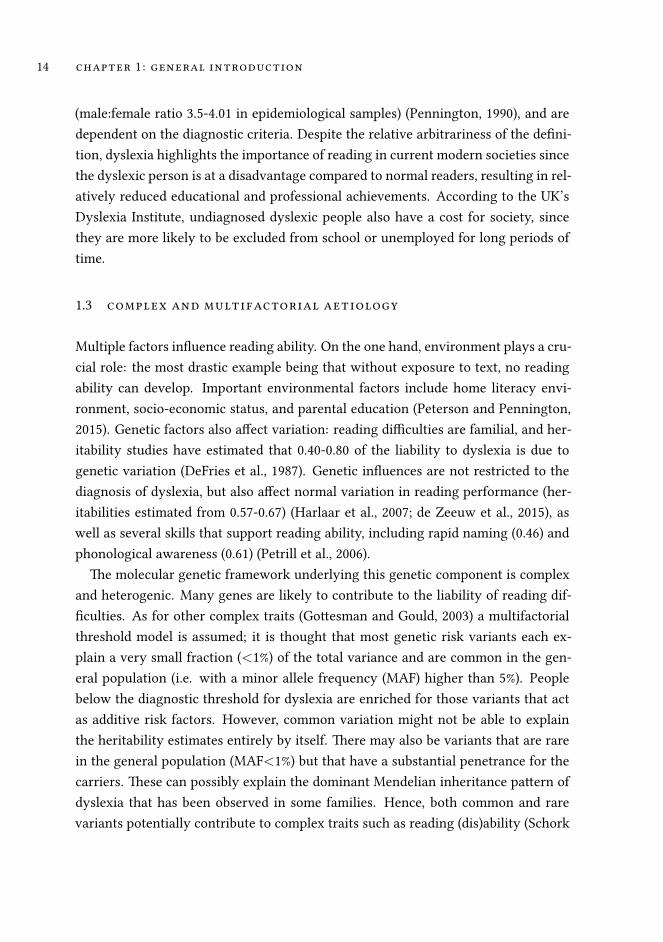
(male:female ratio 3.5-4.01 in epidemiological samples) (Pennington, 1990), and are
dependent on the diagnostic criteria. Despite the relative arbitrariness of the de�ni-
tion, dyslexia highlights the importance of reading in current modern societies since
the dyslexic person is at a disadvantage compared to normal readers, resulting in rel-
atively reduced educational and professional achievements. According to the UK’s
Dyslexia Institute, undiagnosed dyslexic people also have a cost for society, since
they are more likely to be excluded from school or unemployed for long periods of
time.
1.3 complex and multifactorial aetiology
Multiple factors in�uence reading ability. On the one hand, environment plays a cru-
cial role: the most drastic example being that without exposure to text, no reading
ability can develop. Important environmental factors include home literacy envi-
ronment, socio-economic status, and parental education (Peterson and Pennington,
2015). Genetic factors also a�ect variation: reading di�culties are familial, and her-
itability studies have estimated that 0.40-0.80 of the liability to dyslexia is due to
genetic variation (DeFries et al., 1987). Genetic in�uences are not restricted to the
diagnosis of dyslexia, but also a�ect normal variation in reading performance (her-
itabilities estimated from 0.57-0.67) (Harlaar et al., 2007; de Zeeuw et al., 2015), as
well as several skills that support reading ability, including rapid naming (0.46) and
phonological awareness (0.61) (Petrill et al., 2006).
�e molecular genetic framework underlying this genetic component is complex
and heterogenic. Many genes are likely to contribute to the liability of reading dif-
�culties. As for other complex traits (Go�esman and Gould, 2003) a multifactorial
threshold model is assumed; it is thought that most genetic risk variants each ex-
plain a very small fraction (<1%) of the total variance and are common in the gen-
eral population (i.e. with a minor allele frequency (MAF) higher than 5%). People
below the diagnostic threshold for dyslexia are enriched for those variants that act
as additive risk factors. However, common variation might not be able to explain
the heritability estimates entirely by itself. �ere may also be variants that are rare
in the general population (MAF<1%) but that have a substantial penetrance for the
carriers. �ese can possibly explain the dominant Mendelian inheritance pa�ern of
dyslexia that has been observed in some families. Hence, both common and rare
variants potentially contribute to complex traits such as reading (dis)ability (Schork

1.3 complex and multifactorial aetiology 15
et al., 2009), and the genetic risk factors for dyslexia liability are heterogeneous (Fig-
ure 1.2). Moreover, these risk factors might interact non-additively with each other
(epistasis) (Maschere�i et al., 2015) and with the environment (gene x environment
interaction) (Maschere�i et al., 2013).
chr1
chr2
chr3
chr4
chr5
chr6
chr7
chr8
chr9
chr10
chr11
chr12
chr13
chr14
chr15
chr16
chr17
chr18
chr19
chr20
chr21
chr22
chrX
chrY
0 Mb 50 Mb 100 Mb 150 Mb 200 Mb 250 MbChromosome position
DYX9
DYX2 DYX4
DYX7
DYX6
DYX1
DYX3
DYX5
DYX8
Figure 1.2: Ideogram of the genome, with dyslexia linked regions highlighted in red,
and the most prominent susceptibility loci labelled as DYX1-DYX9.
As discussed in more detail later in this thesis, multiple dyslexia susceptibility loci
in the genome (DYX1-DYX9) have been identi�ed through linkage analysis studies
and/or chromosomal rearrangements cosegregating with dyslexia in families (sum-
marized in Figure 1.2). Candidate genes within some of these loci have been pro-
posed, including DYX1C1 (Taipale et al., 2003) and CYP19A1 (Anthoni et al., 2012) in
DYX1 (chr15q); KIAA0319 (Francks et al., 2004; Cope et al., 2005) and DCDC2 (Meng
et al., 2005) in DYX2 (chr6p); MRPL19 and C2ORF3 (Anthoni et al., 2007) in DYX3
(chr2p); and ROBO1 in DYX5 (chr3) (Hannula-Jouppi et al., 2005). Variation within
these genes has been associated with dyslexia and reading-related quantitative traits
in independent studies, and functional investigations of the proteins they encode has
revealed common biological pathways in which several of these genes are implicated
including axon guidance, dendrite outgrowth and ciliary biology (Adler et al., 2013;

16 chapter 1: general introduction
Lamminmaki et al., 2012; Ivliev et al., 2012; Peschansky et al., 2010), further discussed
in later chapters of this thesis.
In the past few years, there have been several technological advances in molecular
methods. On the one hand, high throughput genotyping (SNP-chips) have become
cost-e�ective, which have enabled moving from the ‘candidate-gene’ association
studies to a whole-genome oriented approach to assess common genetic variation
in reading abilities and dyslexia through genome-wide association scans (GWAS).
Several GWAS studies have been performed with the aim to identify other common
genetic variants associated with variation in the reading phenotype. �ese studies
did not yet yield any associations that exceed standard thresholds for genome-wide
signi�cance, most likely as a consequence of low power due to limited sample size.
Nonetheless, they have opened a promising avenue, identifying new suggestive asso-
ciation signals on chromosomes 1p13.1, 3p24.3, 4q26, 5q35.1, 7q32.1, 13q34, 16q22.3,
19p13.3, 21q11.3 and 22q12.3 (Gialluisi et al., 2014; Eicher et al., 2013; Field et al., 2013;
Luciano et al., 2013).
On the other hand, the use of massively parallel sequencing technology, or next
generation sequencing (NGS), has permi�ed geneticists to obtain a complete overview
of the variation within the whole exome (i.e. protein coding regions) or the whole
genome. �is approach makes it possible to study both common and rare variation
in samples of interest. �e study of low frequency genetic variation, which cannot
be captured easily by chips used for GWAS, is particularly important because it is an
aspect of human genetic variation that had been underexplored until very recently.
�rough NGS studies we now have a be�er characterization of the whole spectrum
of genetic variation at the individual and population level, and of how these rare
variants a�ect human traits in health and disease (Walter et al., 2015). �is tech-
nology has enabled researchers to resolve the underlying genetic causes of multiple
previously unsolved Mendelian disorders as well as to increase understanding of a
number of complex diseases (as reviewed in Bamshad et al. (2011)). With respect to
dyslexia, a whole exome sequencing (WES) study resulted in the identi�cation of a
rare coding variant in CEP63 that co-segregates with dyslexia in a multiplex family
(Einarsdo�ir et al., 2015).
In sum, reading ability has an important and complex genetic component, for
which some key players have been identi�ed so far. However, in order to build a
comprehensive picture of the genetic factors underlying reading (dis)ability and to
understand the mechanistic causal relation from the genes to the behaviour, we will

1.4 aim of this thesis 17
need to (a) identify new genes and (b) to evaluate the relative relevance and biological
role of each of these key elements.
1.4 aim of this thesis
�e main aim of this thesis was to improve our understanding of the genetic under-
pinnings of reading (dis)ability. To this end, I investigated common and rare genetic
variants that might a�ect reading-related quantitative traits and dyslexia.
Figure 1.3: Schematic representation of possible di�erent types of genetic contribution
to the reading phenotype, and their relationship to this thesis.
First, in Chapter 2, I carried out a systematic review of the literature on the molec-
ular genetics of dyslexia. I focused mainly on some of the most prominently studied

18 chapter 1: general introduction
candidate genes for dyslexia susceptibility (e.g. DYX1C1, KIAA0319, DCDC2, ROBO1),
describing the history of these candidate genes from their initial genetic mapping,
through identi�cation of associated gene variants, to characterization of gene func-
tion in cellular and animal model systems. I also provided an overview of additional
genes and loci that have been suggested as potential risk factors. �e role of be-
havioural and brain related intermediate phenotypes was discussed. Finally, the
Dutch Dyslexia Program (DDP) was also introduced in this chapter, since several
datasets deriving from this program are used in the studies of later chapters.
In Chapter 3, I performed a longitudinal analysis of some of the most intensively
studied candidate single nucleotide polymorphisms (SNPs) for dyslexia susceptibility.
�is study used a Dutch dataset (from the DDP) characterized with several reading-
related quantitative measures over multiple developmental stages. I carried out longi-
tudinal association analyses, to evaluate these well-known candidate dyslexia SNPs
in a longitudinal context.
In Chapter 4, I reviewed the �rst genome-wide association scan (GWAS) stud-
ies of the �eld and selected the top association signals from these studies for fur-
ther investigation. I performed multivariate and univariate association analyses of
such SNPs in an entirely novel population-based dataset characterized with several
reading-related quantitative measures.
In Chapter 5, I re-analysed a family that had previously been linked to chromo-
some Xq27, taking advantage of the new possibilities o�ered by NGS technology.
Whole exome and/or whole genome sequencing was performed for key members
in this family, and the linkage analysis was re-visited with the additional data. �e
combination of linkage analysis and NGS enabled me to de�ne genomic regions of in-
terest, and to evaluate the possible contributions of coding, noncoding and structural
genetic variants.
In Chapter 6, I adopted a similar NGS-based approach to study another large
multigenerational family with recurrent cases of dyslexia. Linkage analysis was
performed for the �rst time on this family, and whole genome sequenced individ-
uals were used to identify putative rare variants with substantial penetrance. �e
�ndings suggested new candidates which connect with biological pathways that are
already suspected to be important for dyslexia.
Finally, in Chapter 7 I have summarized and reviewed the main �ndings of the
experimental chapters (i.e. Chapters 3 to 6), and discussed the state of the art and

1.4 aim of this thesis 19
future perspectives of the genetics of reading abilities, in relation to the complemen-
tary approaches that were considered within these studies.

20 chapter 1: general introduction
references
Adler WT, Pla� MP, Mehlhorn AJ, Haight JL, Currier TA, et al. (2013) Position of
neocortical neurons transfected at di�erent gestational ages with shRNA targeted
against candidate dyslexia susceptibility genes. PLoS ONE 8: e65179.
Anthoni H, Sucheston LE, Lewis BA, Tapia-Paez I, Fan X, et al. (2012) The aromatase
gene CYP19A1: several genetic and functional lines of evidence supporting a role
in reading, speech and language. Behav Genet 42: 509–527.
Anthoni H, Zucchelli M, Matsson H, Muller-Myhsok B, Fransson I, et al. (2007) A lo-
cus on 2p12 containing the co-regulated MRPL19 and C2ORF3 genes is associated
to dyslexia. Hum Mol Genet 16: 667–677.
Bamshad MJ, Ng SB, Bigham AW, Tabor HK, Emond MJ, et al. (2011) Exome sequenc-
ing as a tool for Mendelian disease gene discovery. Nat Rev Genet 12: 745–755.
Bishop DV (2015) The interface between genetics and psychology: lessons from de-
velopmental dyslexia. Proc Biol Sci 282.
Boltz WG (1986) Early Chinese writing. World Archaeology 17: 420–436.
Caravolas M, Lervag A, De�or S, Seidlova Malkova G, Hulme C (2013) Di�erent pat-
terns, but equivalent predictors, of growth in reading in consistent and inconsis-
tent orthographies. Psychol Sci 24: 1398–1407.
Cope N, Harold D, Hill G, Moskvina V, Stevenson J, et al. (2005) Strong evidence that
KIAA0319 on chromosome 6p is a susceptibility gene for developmental dyslexia.
Am J Hum Genet 76: 581–591.
Coulmas F (2003) Writing systems: An introduction to their linguistic analysis. Cam-
bridge University Press.
de Jong P, van der Leij A (2003) Developmental changes in the manifestation of a
phonological de�cit in dyslexic children learning to read a regular orthography.
Journal of Educational Psychology 95: 22–40.
de Zeeuw EL, de Geus EJ, Boomsma DI (2015) Meta-analysis of twin studies high-
lights the importance of genetic variation in primary school educational achieve-
ment. Trends in Neuroscience and Education pp. –, URL h�p://www.sciencedirect.
com/science/article/pii/S2211949315000198.
DeFries JC, Fulker DW, LaBuda MC (1987) Evidence for a genetic aetiology in reading
disability of twins. Nature 329: 537–539.
Dehaene S, Cohen L, Morais J, Kolinsky R (2015) Illiterate to literate: behavioural and
cerebral changes induced by reading acquisition. Nat Rev Neurosci 16: 234–244.

References 21
Eicher JD, Powers NR, Miller LL, Akshoomo� N, Amaral DG, et al. (2013) Genome-
wide association study of shared components of reading disability and language
impairment. Genes Brain Behav 12: 792–801.
Einarsdo�ir E, Svensson I, Darki F, Peyrard-Janvid M, Lindvall JM, et al. (2015) Mu-
tation in CEP63 co-segregating with developmental dyslexia in a Swedish family.
Hum Genet 134: 1239–1248.
Field LL, Shumansky K, Ryan J, Truong D, Swiergala E, et al. (2013) Dense-map
genome scan for dyslexia supports loci at 4q13, 16p12, 17q22; suggests novel locus
at 7q36. Genes Brain Behav 12: 56–69.
Francks C, Paracchini S, Smith SD, Richardson AJ, Scerri TS, et al. (2004) A 77-
kilobase region of chromosome 6p22.2 is associated with dyslexia in families from
the United Kingdom and from the United States. Am J Hum Genet 75: 1046–1058.
Gialluisi A, Newbury DF, Wilcu� EG, Olson RK, DeFries JC, et al. (2014) Genome-
wide screening for DNA variants associated with reading and language traits.
Genes Brain Behav 13: 686–701.
Go�esman II, Gould TD (2003) The endophenotype concept in psychiatry: etymol-
ogy and strategic intentions. Am J Psychiatry 160: 636–645.
Grigorenko EL (2001) Developmental dyslexia: an update on genes, brains, and en-
vironments. J Child Psychol Psychiatry 42: 91–125.
Hannula-Jouppi K, Kaminen-Ahola N, Taipale M, Eklund R, Nopola-Hemmi J, et al.
(2005) The axon guidance receptor gene ROBO1 is a candidate gene for develop-
mental dyslexia. PLoS Genet 1: e50.
Harlaar N, Dale PS, Plomin R (2007) From learning to read to reading to learn: sub-
stantial and stable genetic in�uence. Child Dev 78: 116–131.
Ivliev AE, ’t Hoen PA, van Roon-Mom WM, Peters DJ, Sergeeva MG (2012) Exploring
the transcriptome of ciliated cells using in silico dissection of human tissues. PLoS
ONE 7: e35618.
Lamminmaki S, Massinen S, Nopola-Hemmi J, Kere J, Hari R (2012) Human ROBO1
regulates interaural interaction in auditory pathways. J Neurosci 32: 966–971.
Landerl K, Ramus F, Moll K, Lyytinen H, Leppanen PH, et al. (2013) Predictors of de-
velopmental dyslexia in European orthographies with varying complexity. J Child
Psychol Psychiatry 54: 686–694.
Luciano M, Evans DM, Hansell NK, Medland SE, Montgomery GW, et al. (2013) A
genome-wide association study for reading and language abilities in two popula-
tion cohorts. Genes Brain Behav 12: 645–652.

22 chapter 1: general introduction
Maschere�i S, Bureau A, Ba�aglia M, Simone D, �adrelli E, et al. (2013) An as-
sessment of gene-by-environment interactions in developmental dyslexia-related
phenotypes. Genes Brain Behav 12: 47–55.
Maschere�i S, Facoe�i A, Giorda R, Beri S, Riva V, et al. (2015) GRIN2B mediates
susceptibility to intelligence quotient and cognitive impairments in developmental
dyslexia. Psychiatr Genet 25: 9–20.
Meng H, Smith SD, Hager K, Held M, Liu J, et al. (2005) DCDC2 is associated with
reading disability and modulates neuronal development in the brain. Proc Natl
Acad Sci USA 102: 17053–17058.
Pennington BF (1990) The genetics of dyslexia. J Child Psychol Psychiatry 31: 193–
201.
Pennington BF (2006) From single to multiple de�cit models of developmental disor-
ders. Cognition 101: 385–413.
Peschansky VJ, Burbridge TJ, Volz AJ, Fiondella C, Wissner-Gross Z, et al. (2010)
The e�ect of variation in expression of the candidate dyslexia susceptibility gene
homolog Kiaa0319 on neuronal migration and dendritic morphology in the rat.
Cereb Cortex 20: 884–897.
Peterson RL, Pennington BF (2015) Developmental dyslexia. Annu Rev Clin Psychol
11: 283–307.
Petrill SA, �ompson LA, Deater-Deckard K, Dethorne LS, Schatschneider C (2006)
Genetic and Environmental E�ects of Serial Naming and Phonological Awareness
on Early Reading Outcomes. J Educ Psychol 98: 112–121.
Price CJ (2012) A review and synthesis of the �rst 20 years of PET and fMRI studies
of heard speech, spoken language and reading. Neuroimage 62: 816–847.
Richlan F (2012) Developmental dyslexia: dysfunction of a le� hemisphere reading
network. Front Hum Neurosci 6: 120.
Rodriguez Martinez MdelC, Ortiz Ceballos P, Coe MD, Diehl RA, Houston SD, et al.
(2006) Oldest writing in the New World. Science 313: 1610–1614.
Rogers H (2004) Writing Systems: A Linguistic Approach (Blackwell Textbooks In
Linguistics). {Blackwell Publishers}.Rueckl JG, Paz-Alonso PM, Molfese PJ, Kuo WJ, Bick A, et al. (2015) Universal brain
signature of pro�cient reading: Evidence from four contrasting languages. Proc
Natl Acad Sci USA 112: 15510–15515.
Schork NJ, Murray SS, Frazer KA, Topol EJ (2009) Common vs. rare allele hypotheses
for complex diseases. Curr Opin Genet Dev 19: 212–219.

References 23
Shaywitz SE, Escobar MD, Shaywitz BA, Fletcher JM, Makuch R (1992) Evidence that
dyslexia may represent the lower tail of a normal distribution of reading ability. N
Engl J Med 326: 145–150.
Shaywitz SE, Shaywitz BA, Fletcher JM, Escobar MD (1990) Prevalence of reading
disability in boys and girls. Results of the Connecticut Longitudinal Study. JAMA
264: 998–1002.
Taipale M, Kaminen N, Nopola-Hemmi J, Haltia T, Myllyluoma B, et al. (2003) A
candidate gene for developmental dyslexia encodes a nuclear tetratricopeptide re-
peat domain protein dynamically regulated in brain. Proc Natl Acad Sci USA 100:
11553–11558.
van der Leij A, van Bergen E, van Zuijen T, de Jong P, Maurits N, et al. (2013) Precur-
sors of developmental dyslexia: an overview of the longitudinal Dutch Dyslexia
Programme study. Dyslexia 19: 191–213.
Walter K, Min JL, Huang J, Crooks L, Memari Y, et al. (2015) The UK10K project
identi�es rare variants in health and disease. Nature .


2
M O L E C U L A R G E N E T I C S O F D Y S L E X I A : A N O V E R V I E W
Dyslexia is a highly heritable learning disorder with a complex underlying ge-
netic architecture. Over the past decade, researchers have pinpointed a number of
candidate genes that may contribute to dyslexia susceptibility. Here, we provide
an overview of the state of the art, describing how studies have moved from map-
ping potential risk loci, through identi�cation of associated gene variants, to char-
acterization of gene function in cellular and animal model systems. Work thus far
has highlighted some intriguing mechanistic pathways, such as neuronal migration,
axon guidance, and ciliary biology, but it is clear that we still have much to learn
about the molecular networks that are involved. We end the review by highlight-
ing the past, present and future contributions of the Dutch Dyslexia Programme to
studies of genetic factors. In particular, we emphasize the importance of relating ge-
netic information to intermediate neurobiological measures, as well as the value of
incorporating longitudinal and developmental data into molecular designs.
Keywords: molecular genetics, dyslexia, review
�is chapter has been published as:
Carrion-Castillo, A., Franke, B., & Fisher, S. E. (2013). Molecular genetics of dyslexia: An overview.
Dyslexia, 19(4), 214-240. doi:10.1002/dys.1464
25

26 chapter 2: literature review
2.1 introduction
Over the past decade or so, advances in molecular technologies have enabled re-
searchers to begin pinpointing potential genetic risk factors implicated in human
neurodevelopmental disorders (Graham and Fisher, 2013). A signi�cant amount of
work has focused on developmental dyslexia (speci�c reading disability). �e search
for risk genes underlying dyslexia is well motivated; a wealth of prior information
from familial clustering and twin studies suggests a substantial inherited component.
For example, the proportion of variance in reading skills that is explained by genetic
endowment is high, with heritability estimates ranging from 0.4-0.8 (Schumacher
et al., 2007). At the same time, it is clear that the genetic architecture underlying
dyslexia must be complex and multifactorial, involving a combination of polygenic-
ity (two or more genes contribute to the phenotype) and heterogeneity (the same
disorder can be caused by multiple origins in di�erent individuals). Moreover, it is
likely that many of the genetic risk factors will have small e�ect sizes, or only be
implicated in rare cases.
Crucially, the success of tracking down the molecular basis of a disorder depends
not only on the available genomic methodologies, but also on the strategies used to
ascertain and characterize the phenotype of interest. Developmental dyslexia is typ-
ically de�ned as a severe di�culty in the mastery of reading and/or spelling skills
that cannot be explained by impaired intelligence, socioeconomic factors, or other
obvious causes like comorbid neurological conditions or a history of head injury
(Grigorenko, 2001). Such a de�nition is largely exclusive (i.e. it relies on exclusion of
other possible causes), based on an unexpected discordance between predicted levels
of pro�ciency (for example, calculated from chronological age and/or IQ) and the ob-
served performance. As a consequence, a categorical diagnosis of dyslexia (a�ected
versus una�ected) can be highly sensitive to the nature of the assessment procedures,
including which tests are administered and how the diagnostic thresholds are set.
Faced with the limitations of categorical de�nitions, many genetic investigations
of dyslexia make direct use of data from psychometric measures for assessing rela-
tionships between molecular factors and the disorder in cohorts under study (Fisher
and DeFries, 2002). Some of these quantitative traits, such as a person’s performance
on single word reading or spelling tests, directly index the de�ning di�culties. Oth-
ers tap into particular underlying cognitive processes that are hypothesized to con-
tribute to reading and spelling pro�ciency, including orthographic processing, pho-

2.1 introduction 27
neme awareness, rapid automatized naming, and phonological short-term memory
(Table 2.1). �e associated psychometric measures can be considered as examples
of endophenotypes: quantitative indices that are closer to the underlying biological
phenomena, and that are conceivably easier to link with the genetic factors (Go�es-
man and Gould, 2003). A good characterization of endophenotypes can aid in under-
standing the critical biological mechanisms, and in pinpointing the genes that are in-
volved, especially for genetically complex traits (Kendler and Neale, 2010). In the past
couple of years, some studies (Czamara et al., 2011; Darki et al., 2012; Peyrard-Janvid
et al., 2004; Pinel et al., 2012; Roeske et al., 2011; Wilcke et al., 2012) have moved be-
yond the behavioural measures described above, a�empting to de�ne brain imaging
or neurophysiological measures as endophenotypes for dyslexia genetics (e.g. event-
related potentials from electrophysiology, e�ects on cortical volumes). Although this
�eld is still emerging and most of the �ndings await replication, neuroimaging en-
dophenotypes are a promising step for building bridges between genetic information
and behavioural output.
Orthographic processing Re�ects orthographic knowledge. Can be mea-
sured using orthographic choice tasks of phonolog-
ically similar le�er strings.
Phoneme awareness �e ability to identify and manipulate the sounds
in spoken words, which re�ects phonological pro-
cessing. Can be measured using phonemic deletion
tasks.
Rapid automatized nam-
ing
Rapid naming of highly familiar visual symbols,
which re�ects speed of processing. Can be mea-
sured by several rapid naming tests of symbols
(digits/le�ers), colours, or pictures.
Phonological short-term
memory
Recall for a period of several seconds to a minute
without rehearsal. Hypothesized to tap phonolog-
ical processing. Can be measured using nonsense
word repetition tasks
Table 2.1: Key cognitive skills underlying reading, and associated psychometric tests.

28 chapter 2: literature review
As noted above, there are inherent problems with conceptualizing dyslexia as a di-
chotomous trait (a�ected or una�ected). Indeed, it has been proposed that dyslexia
may not constitute a qualitatively distinct disorder at all, but could simply re�ect the
lower end of normal variation in reading ability (Shaywitz et al., 1992). In this context,
recent genetic studies have not only investigated cohorts of people with dyslexia,
but also extended their analyses to reading-related phenotypes in unselected pop-
ulations from large epidemiological samples (birth cohorts, twin studies, biobank-
ing initiatives, and so on). �e substantial numbers of samples available from these
kinds of general population collections can improve statistical power for detecting
contributions of common genetic risk factors, which are expected to have individual
e�ect sizes that are rather small (Paracchini, 2011). Despite the challenges of genetic
complexity, there are at least 9 reported candidate regions of interest for dyslexia
in the human genome (DYX1-DYX9), and up to 14 individual candidate genes with
varying degrees of supporting evidence (Poelmans et al., 2009). �e suggested can-
didates include some that have been implicated in speci�c biological processes such
as migration of neurons during early brain development, or outgrowth of dendrites
and axons (e.g. ROBO1, KIAA0319, DCDC2, DYX1C1). Indeed, a molecular frame-
work that a�empts to synthesize these di�erent �ndings has been formulated by
researchers from the Dutch Dyslexia Programme (DDP) (Poelmans et al., 2011), at-
tributing a central role to a signaling network involved in neuronal migration and
neurite outgrowth. E�orts have also been made to merge the genetic �ndings with
a neuropsychological framework (Giraud and Ramus, 2012), proposing that abnor-
mal neuronal migration might lead to anomalous brain oscillations, disturbing the
sampling of the auditory signal, and thereby a�ecting phonological processing.
�us, important progress has been made, but the picture is still far from complete.
�e present paper will outline research that has been carried out at several levels in
order to understand the genetic basis of dyslexia, from multiple di�erent research
laboratories across the world, including the contributing �ndings from the DDP. We
give an overview of the main dyslexia susceptibility loci that are currently known,
in each case starting from the initial linkage mapping (see Glossary in Section 2.11
for de�nition of this and other technical terms), moving to the support provided by
association studies and then zooming into the candidate genes and their functional
roles. We end by considering future perspectives for the �eld, and providing exam-
ples of how further molecular work with the DDP can help to �ll in the gaps between
genotype and phenotype.

2.2 first clues: the dyx1 locus 29
2.2 first clues: the dyx1 locus
A connection between speci�c reading disability and genetic markers on chromo-
some 15 was perhaps the earliest �nding for the �eld (Smith et al., 1983). Subsequent
studies have repeatedly highlighted linkage to this chromosome, with peak signals
mostly located around genetic markers in 15q21, dubbed the DYX1 locus (Grigorenko
et al., 1997; Schulte-Korne et al., 1998; Chapman et al., 2004; Platko et al., 2008), al-
though a signal at another location, 15q15, has also been reported (Morris et al., 2000;
Schumacher et al., 2008). Genome-wide linkage analyses of reading and spelling
quantitative traits in an unselected twin sample (Bates et al., 2007) found replication-
level support for linkage of regular word spelling to DYX1.
2.2.1 Discovery of DYX1C1 gene
A candidate gene in DYX1, subsequently named DYX1C1, was �rst identi�ed through
studies of a Finnish family in which a chromosomal rearrangement, a translocation
involving chromosomes 2 and 15, co-segregated with reading and writing di�culties
(Nopola-Hemmi et al., 2000). �e chromosome 15 breakpoint of this translocation
was located within the DYX1 region that had previously been linked to dyslexia in
other studies. Precise mapping of the breakpoint demonstrated that it directly dis-
rupted the DYX1C1 gene, which encodes a 420 amino acid protein with three protein-
protein interaction domains (tetratricopeptide repeats, TPR) (Taipale et al., 2003).
�e gene was shown to be expressed in a subset of human glial and neuronal cells.
Furthermore, two DYX1C1 sequence changes (single-nucleotide polymorphisms or
SNPs) were found to be associated with dyslexia in additional Finnish families. Both
these changes were proposed as putative functional alleles: −3G > A creates a po-
tential new binding site for a transcription factor known as Elk-1, while 1249G > T
introduces a premature stop codon that shortens the encoded protein by four amino
acids.
In subsequent work, multiple groups have tested for association between dyslexia
(and related traits) and these two DYX1C1 variants, but the results remain inconclu-
sive. Marino et al. (2007) reported that the -3A allele was signi�cantly associated with
de�cits on a measure of short-term memory (Single Le�er Backward Span), as was a
haplotype combining -3A with 1249T. However, in some DYX1C1 investigations, op-
posite pa�erns of e�ects were observed; the major alleles of these variants (i.e. the

30 chapter 2: literature review
non-risk alleles from the original study) were associated with a diagnosis of dyslexia
(Brkanac et al., 2007; Wigg et al., 2004), or with de�cits on orthographic choice tasks
(Scerri et al., 2004). Several other studies, both in dyslexia cohorts and in the general
population, failed to replicate the original associations with these DYX1C1 putative
risk alleles or their haplotype (Bates et al., 2010; Bellini et al., 2005; Tran et al., 2013).
Other markers in DYX1C1 have been reported to show associations with categori-
cal dyslexia (Dahdouh et al., 2009; Wigg et al., 2004), with short-term memory perfor-
mance in females with dyslexia (Dahdouh et al., 2009), or with quantitative measures
of reading-related traits in the general population (Bates et al., 2010). A recent neu-
roimaging genetics study of 79 people (Darki et al., 2012) included DYX1C1 markers
from these prior studies. One of the markers, previously associated with irregular
and nonword reading performance by Bates et al. (2010), was found to correlate with
white ma�er volume locally, in the le� temporo-parietal region, and also on the
global brain level. However, the marker in question was not signi�cantly correlated
with reading performance in this same sample, which was not selected for dyslexia.
�e lack of consistency of the DYX1C1 associations has been recently assessed us-
ing meta-analyses. One of them (Zou et al., 2012) integrated case-control and family-
based association test studies to examine the -3G/A variant, concluding that there is
no statistical evidence of an association between this SNP and dyslexia risk. Another
meta-analysis assessed cumulative evidence from 10 independent studies of -3G/A
and 1249G/T, and found low credibility of evidence for both SNPs, due to high levels
of heterogeneity between studies (Tran et al., 2013).
2.2.2 Investigating DYX1C1 functions
To gain insights into the potential roles of DYX1C1 (and putative dyslexia risk alle-
les) in brain development, the gene and its encoded protein have been functionally
characterized. Variants in the promoter region of DYX1C1, including the -3G/A SNP,
have been suggested to mediate allele-speci�c binding of transcription factors (such
as TFII-I and Sp1) and/or to be associated with di�erent expression levels of the gene.
Investigations of the DNA fragment spanning the -3G/A SNP identi�ed that it was
bound by TFII-I, PARP (poly ADP-ribose polymerase 1) and a splicing factor known
as SFPQ (Tapia-Paez et al., 2008).
In a developmental study of the rodent orthologue, Dyx1c1, expression levels of
this gene were knocked down in embryonic neocortex of the rat (Wang et al., 2006;

2.2 first clues: the dyx1 locus 31
Currier et al., 2011; Adler et al., 2013). �is experimental manipulation led to an
aberrant migration pa�ern of the treated neurons, in which the cells accumulated
in the multipolar stage of migration. E�ects were non-autonomous; they were not
limited to the cells that had been knocked down for Dyx1c1, but also disturbed some
other neighbouring cells (Currier et al., 2011). Overexpression of Dyx1c1 rescued
migration, con�rming that the knockdown was causing the aberrant phenotype; and
it was found that the TPR domains were su�cient for this rescue (Wang et al., 2006).
However, the study did not support a functional role for the 1249G > T SNP that
creates a premature stop codon, because overexpression of the truncated variant also
rescued migration.
When neurons were subjected to embryonic knockdown of Dyx1c1 levels, they mi-
grated past their expected laminar targets (Adler et al., 2013). �ese overmigration
observations have been con�rmed in a subsequent investigation using live-cell imag-
ing of human neuroblastoma cells, where knockdown of DYX1C1 led to increased
migration rates compared to controls, and this was dependent not only on the TPR
domains, but also on another novel highly conserved motif, referred to as a DYX1 do-
main (Tammimies et al., 2013). Analysis of changes in global gene expression levels
a�er perturbation of DYX1C1, by overexpression or knockdown in these cell lines,
uncovered a group of genes that was enriched for known functions, including ”cellu-
lar component movement”, ”cell migration” and ”nervous system development”, as
well as a pathway involved in focal adhesion (Tammimies et al., 2013).
Further studies have shown that the rat orthologue of DYX1C1 interacts with es-
trogen receptors in primary rat neurons (Massinen et al., 2009). Based on these data,
it has been proposed that DYX1C1 negatively regulates estrogen receptor levels in
a dose-dependent manner, decreasing their transcriptional activity and stability. As
the estrogen pathway is known to be important for brain development, interaction
of DYX1C1 with sex hormones has been postulated as a potential contributor to the
o�en reported sex di�erence prevalence of dyslexia.
Tammimies and colleagues speci�cally assessed whether DYX1C1 can interact with
other proteins implicated in neuronal migration and/or associated with dyslexia sus-
ceptibility, including DCDC2 and KIAA0319 (see next section) (Tammimies et al.,
2013). It was found that DYX1C1 interacts with LIS1 (a protein implicated in liss-
encephaly, a rare brain disorder caused by severely disrupted neuronal migration)
and DCDC2, but not with KIAA0319. Several new interactions with DYX1C1 were
also reported, with a signi�cant overrepresentation of proteins that are components

32 chapter 2: literature review
of the cytoskeleton, three of which (TUBB2B, TUBA1 and Ataxin1) were further val-
idated.
Recent evidence suggests that DYX1C1 and other candidate dyslexia genes, such as
DCDC2 and KIAA0319, might be involved in the growth and function of cilia (Ivliev
et al., 2012). �ese tiny hairlike structures line the surfaces of many types of cells
and can move in rhythmic waves. �ere is a growing realization of the important
roles that cilia play in early brain pa�erning and homeostasis. �e zebra�sh ortho-
logue of DYX1C1 is expressed in many ciliated tissues and its knockdown leads to
multiple ciliopathy-related phenotypes (Chandrasekar et al., 2013). Dyx1c1- mutant
mice are reported to display ciliary motility defects (Tarkar et al., 2013). Finally, re-
cessive loss of function mutations of DYX1C1 have been identi�ed in human patients
with Primary Ciliary Diskinesia, a disorder characterized by chronic airway disease,
laterality defects and male infertility (Tarkar et al., 2013).
2.3 two genes for the price of one: the dyx2 locus
Cardon et al. (1994) described the �rst evidence for a chromosome-6 quantitative
trait locus involved in dyslexia susceptibility, spanning the Human Leukocyte Anti-
gen complex on 6p21.3. Linkage at 6p21 − 23 (the DYX2 locus) has since been re-
ported by multiple further studies, with several reading-related traits, using a variety
of approaches and sampling strategies (Grigorenko et al., 1997; Fisher et al., 2002;
Kaplan et al., 2002; Platko et al., 2008; Fisher et al., 1999). A linkage study of Spe-
ci�c Language Impairment (SLI) that targeted known candidate regions for dyslexia,
identi�ed support for involvement of the DYX2 region, suggesting impacts beyond
diagnostic boundaries (Rice et al., 2009), but earlier studies of other SLI cohorts have
not found evidence of linkage to this locus (Consortium, 2002; Bartle� et al., 2002).
DYX2 is one of the most replicated dyslexia susceptibility loci to date, but still
a number of reports have failed to �nd support for this region. For example, one
of the early studies that focused on spelling disability in German families did not
�nd evidence for DYX2 linkage (Schulte-Korne et al., 1998), and this locus did not
show any signal in a genome-wide linkage scan of reading abilities in the general
population (Bates et al., 2007). Moreover, the DDP analysed a set of 108 families with
at least two a�ected children, assessing categorical status and also key quantitative
traits, including word reading, phonological decoding, verbal competence, nonsense-

2.3 two genes for the price of one: the dyx2 locus 33
word repetition, and rapid automatized naming (de Kovel et al., 2008), but did not
detect any linkage to DYX2 in the cohort.
2.3.1 �e KIAA0319 gene
Building on prior �ndings of linkage to DYX2, several research teams used associa-
tion analysis to narrow the region of interest and to zoom in on a convincing can-
didate gene or genes. In one investigation of �ve phenotypes that measured ortho-
graphic and phonologic skills in dyslexia families from the U.S. (De�enbacher et al.,
2004), associations were reported with markers in �ve genes from the DYX2 region:
VMP, DCDC2, KIAA0319, TTRAP, and THEM2. In another quantitative trait associa-
tion study, involving sets of families from the U.K. and the U.S., Francks et al. (2004)
narrowed the focus to a small (70kb) region spanning THEM2, TTRAP and KIAA0319,
with the main risk haplotype being identi�ed by a SNP marker (rs2143340) upstream
of KIAA0319, in the TTRAP locus. Cope et al. (2005), investigating an independent
U.K. sample, similarly reported an enrichment of dyslexia-associated SNPs in this
interval, although they did not replicate the rs2143340 �nding.
Following these initial indications of KIAA0319 involvement, several other studies
have suggested that markers and haplotypes (rs4504469-rs2038137-rs2143340 [1-1-
2], rs4504469-rs6935076 [2-1]) in this gene are associated with categorical dyslexia
and/or with quantitative traits, not only in people with dyslexia, but also in general
population samples (Harold et al., 2006; Luciano et al., 2007; Paracchini et al., 2008;
Couto et al., 2010; Newbury et al., 2011; Venkatesh et al., 2013). However, as observed
for other dyslexia candidate genes, a number of studies did not �nd evidence for
biased transmission of KIAA0319 markers in their dyslexic samples (Brkanac et al.,
2007; Ludwig et al., 2008; Schumacher et al., 2006a). Despite these negative reports,
a recent meta-analysis that focused on the 931C > T polymorphism (rs4504469) of
KIAA0319 concluded that the minor T allele is signi�cantly associated with dyslexia
risk (Zou et al., 2012).
Investigations have also assessed whether KIAA0319 alleles might have broad im-
pacts across di�erent neurodevelopmental disorders. In a study that assessed as-
sociation of candidate genes in relation to dyslexia and other frequently comorbid
disorders such as A�ention De�cit Hyperactivity Disorder (ADHD) and SLI (Scerri
et al., 2011), KIAA0319 variants were associated with reading and spelling scores.
SNPs rs6935076 and rs9461045 appeared to have a speci�c e�ect on dyslexia, whereas

34 chapter 2: literature review
rs2143340 was associated with general reading ability - the e�ect did not dilute when
widening the analysis to the general population. Another study reported that several
variants in the region upstream of KIAA0319 (rs4504469-C, rs761100-G, rs6935076-
T) were associated with reading and language phenotypes in a SLI sample (Rice
et al., 2009). However, the replication levels of these studies are di�cult to evalu-
ate, because even when the SNP markers are the same, the risk alleles are o�en not
consistent, with di�erent directions of e�ect (increasing susceptibility in one study,
but showing a protective e�ect in another). For example, the speci�c risk alleles
of rs761100 and rs6935076 that were correlated with reduced expressive language
scores in one dyslexic cohort (Newbury et al., 2011), were those that had correlated
with increased reading and language performance in other studies (Harold et al.,
2006).
Variants within the THEM2-TTRAP-KIAA0319 region have been tested for associ-
ation with neuroimaging phenotypes in small samples from the general population,
again with di�ering e�ects in di�erent studies. Using functional MRI, Pinel and col-
leagues reported that a SNP in THEM2 (rs17243157) was associated with asymmetry
of activation at the temporal lobe during a reading task (Pinel et al., 2012). How-
ever, the other DYX2 SNPs tested in this study were not found to be associated with
any activation pa�ern in the brain regions of interest. Another study found that the
rs2143340 SNP in TTRAP was associated with activation in the right and le� ante-
rior inferior parietal lobe during phonologic processing tasks (Cope et al., 2012). In
their recent structural imaging study, Darki et al. (2012) reported that rs6935076 in
KIAA0319 had a signi�cant e�ect on the white ma�er volume of the le� temporo-
parietal region, but not with reading scores in that sample (Darki et al., 2012).
Cell-based approaches have been used to identify a potential functional basis of
genetic associations in the THEM2-TTRAP-KIAA0319 region. �e �rst such study fo-
cused on one established risk haplotype for dyslexia (rs4504469- rs2038137-rs2143340
[1-1-2]), and showed that it was associated with lower expression levels of KIAA0319,
indicating that regulatory sequence variants could be a�ecting transcriptional regu-
lation of this gene (Paracchini et al., 2006). In a follow-up investigation of this e�ect,
Dennis et al. (2009) tested various versions of the promoter of KIAA0319, carrying
di�erent dyslexia-associated SNP alleles, via reporter gene assays. �ey zoomed in
on a particular functional SNP, rs9461045, �nding that the minor allele yields reduced
expression of reported genes in neuronal and non-neuronal cell lines. �is variant
creates a binding site for a transcription factor, known as OCT-1, that could explain

2.3 two genes for the price of one: the dyx2 locus 35
reduced expression of KIAA0319 from the risk haplotype. Indeed, when OCT-1 was
knocked down, the expression levels of the risk allele were shown to recover.
�e KIAA0319 gene has several variants due to alternative splicing: A, B and C,
encoding di�erent versions of the protein (Velayos-Baeza et al., 2007). Version A of
the protein localizes in the plasma membrane of the cell; it has a single domain that
spans the membrane and it forms dimers - two molecules of the protein bind to each
other to form a functional unit. �is protein variant undergoes modi�cations (addi-
tion of carbohydrate groups, also known as glycosylation) that typically contribute
to protein folding, stability, cell adhesion, and cell-cell interaction. �erefore, it has
been proposed that it could be involved in the interaction of neurons and glial �bers
during neuronal migration (see below), most probably mediated by speci�c interac-
tion domains that are present in its central region (Velayos-Baeza et al., 2008). �e
other two protein variants (B and C) lack the transmembrane domain and are local-
ized in the endoplasmic reticulum of the cell. Only variant B has been detected in the
extracellular medium, and its size suggests that, like variant A, it is glycosylated. It
has thus been speculated that the KIAA0319 gene may have a wider functional spec-
trum that also includes signaling (Velayos-Baeza et al., 2008, 2010; Levecque et al.,
2009).
�e expression pa�ern of KIAA0319 in the developing neocortex is consistent with
its hypothesized role in neuronal migration (Paracchini et al., 2006). �e gene is also
expressed in the adult brain, being relatively abundant in the cerebellum, the cerebral
cortex, the putamen, the amygdala and the hippocampus (Peschansky et al., 2010;
Velayos-Baeza et al., 2007). Studies of cortical tissue reported highest expression in
the superior parietal cortex, primary visual cortex and occipital cortex (Meng et al.,
2005).
When the expression of Kiaa0319 (the rodent orthologue of KIAA0319) was ex-
perimentally knocked down in embryonic rat neocortex, this disturbed neuronal
migration, by reducing the migration distances from the ventricular zone towards
the cortical plate (Peschansky et al., 2010; Paracchini et al., 2006; Adler et al., 2013).
Periventricular heterotopias (clusters of disorganized neurons along the lateral ven-
tricles of the brain) were found in three quarters of the animals, containing large
numbers of neurons that did not migrate properly and formed clumps around the
ventricles. �e e�ects of knockdown appeared to be non-cell autonomous, disturb-
ing both radially and tangentially migrating neurons (Peschansky et al., 2010; Adler
et al., 2013). Kiaa0319 knockdown also led to enlargement of apical dendrites of

36 chapter 2: literature review
the treated neurons, which could be rescued by overexpression of the human gene
(Peschansky et al., 2010). �e longer term e�ects of embryonic Kiaa0319 knockdown
on speci�c brain structures of the brain have also been studied. A�er the gene had
been knocked down embryonically in a lateral ventricle, adult male rats displayed a
reduced midsagi�al area of the corpus callosum, but no di�erence in volume of the
cortex and hippocampus (Szalkowski et al., 2013). �e authors pointed out that the
area a�ected in their rodent studies has previously been associated with phonologi-
cal processing de�cits in humans with dyslexia.
2.3.2 �e DCDC2 gene
DCDC2, another gene in the DYX2 region, was �rst proposed as a dyslexia candidate
gene based on association of SNPs with one quantitative index of dyslexia severity
(discrepancy between expected and observed reading scores) in a set of U.S. families
(Meng et al., 2005), overlapping with the cohort analysed in some of the KIAA0319
studies described above. Meng et al. (2005) also characterized a small (2.4kb) deletion
within the DCDC2 locus that contained a short tandem repeat (STR), referred to as
BV677278. �e STR was highly variable with multiple alleles, and by combining the
deletion with the 10 minor alleles of the STR, the authors were able to show associa-
tion with another quantitative phenotype in the cohort, performance on a homonym
choice task. A number of subsequent reports have described association of this STR
marker with a categorical de�nition of dyslexia (Schumacher et al., 2006a), and with
quantitative measures of reading and memory (Marino et al., 2012). However, other
studies could �nd only weak and inconsistent evidence of association, for example
Harold et al. (2006).
Experimental studies suggest that the BV677278 STR is bound by a transcription
factor called ETV6 (Powers et al., 2013) expressed in human brain (Meng et al., 2011),
and that di�erent STR alleles might a�ect gene regulation. �e STR is in high linkage
disequilibrium with a haplotype block that is associated with phonological aware-
ness and a composite language measure (Powers et al., 2013). �is DCDC2 risk hap-
lotype seems to interact in a non-additive manner with a known KIAA0319 risk hap-
lotype (Francks et al., 2004; Scerri et al., 2011; Paracchini et al., 2008); individuals
carrying both dyslexia risk haplotypes had a signi�cantly worse performance than
expected (Powers et al., 2013).

2.3 two genes for the price of one: the dyx2 locus 37
Additional SNP markers in DCDC2 have also been associated with dyslexia (rs-
807724, rs793862, rs807701) (Schumacher et al., 2006a; Wilcke et al., 2009; Newbury
et al., 2011) and with quantitative measures such as reading �uency and nonsense
word repetition (Scerri et al., 2011). In contrast to the e�ects of certain KIAA0319
markers, whose putative e�ects extend to the general population, it has been pro-
posed that DCDC2 variants may contribute speci�cally to reading (dis)ability in peo-
ple with dyslexia, as associations do not hold when widening the sample to include
SLI, ADHD, or non-a�ected individuals (Scerri et al., 2011). Some studies fail to �nd
support for e�ects of DCDC2 markers even within dyslexic cohorts (Brkanac et al.,
2007; Zuo et al., 2012; Venkatesh et al., 2013).
A recent meta-analysis (Zhong et al., 2013), including 8 publications and a total
of 941 cases and 1183 controls, assessed association with dyslexia for the most con-
sistently reported DCDC2 markers (rs807701, rs793862, rs807724, rs1087266 and the
2.4kb deletion). Overall, allele C of rs807701 was signi�cantly associated with the
risk of dyslexia, while the other markers showed no evidence of association. How-
ever, sensitivity analysis suggested that the results were of low reliability and should
be treated with caution.
Association between the 2.4kb deletion within DCDC2 and gray ma�er distribu-
tion in the brain was tested in a small sample of healthy individuals (Meda et al., 2008).
It was proposed that the heterozygous subjects had higher grey ma�er volume in
the superior, medial and inferio temporal-gyri, the fusiform gyrus, the hippocampus,
the uncus, the parahippocampal, the occipito-parietal and the inferior and middle
frontal gyri. In their functional imaging study of DYX2 candidates, Cope and col-
leagues reported that the BV677278 STR of DCDC2 was associated with activation
of the superior anterior cingulate gyrus, posterior cingulate gyrus, le� paracentral
lobule and the le� inferior frontal gyrus during phonological processing tasks (Cope
et al., 2012). Additional imaging genetics projects have investigated other markers
in DCDC2 (Jamadar et al., 2011; Darki et al., 2012). For example, Darki et al. (2012)
reported that rs793842 was associated with variation in white ma�er volume of the
temporo-parietal region.
DCDC2 encodes a protein that contains two doublecortin domains. �ese domains
are named a�er a related protein (doublecortin or DCX ) that has been implicated in
lissencephaly, and they are thought to mediate interactions with the cytoskeleton
of the cell. Two isoforms are produced by alternative splicing, with the larger ver-
sion being expressed in adult and fetal brain (Schumacher et al., 2006a). Screening

38 chapter 2: literature review
of adult human brain tissues suggests that it is most highly expressed in the entorhi-
nal cortex, the inferior and medial temporal cortex, the hypothalamus, the amygdala
and the hippocampus (Meng et al., 2005). �e protein localizes in primary cilia, neu-
rites and cytoplasm of hippocampal neurons (Massinen et al., 2011), and associates
with a protein known as Kif3a at the primary cilium, in a manner that depends on
both the doublecortin domains. �ere is bioinformatic support for the implication
of DCDC2 in cilia (Ivliev et al., 2012) and overexpression of the gene increases the
average length of a cilium to approximately twice the normal length (Massinen et al.,
2011). Studies in nematode worm models (C. elegans) suggest that it is important for
neuronal morphology (Massinen et al., 2011).
Similar to �ndings for Dyx1c1 and Kiaa0319, knockdown of Dcdc2 expression in
utero in rats yielded disturbed migration of neuronal precursors from the ventricu-
lar surface towards the pial surface (Meng et al., 2005; Adler et al., 2013). By con-
trast, studies of knockout mice that lack Dcdc2 did not �nd any defects in brain
morphology, function, or behaviour; in particular, the structure, number and length
of neuronal cilia in neocortex and hippocampus did not di�er between knockout
animals and the wild-type mice (Wang et al., 2011). However, in utero knockdown
of the related gene, Dcx (doublecortin) caused more developmental disruption in
Dcdc2 knockouts than in wild-type mice: subcortical heterotopias and disruptions
of dendritic growth (Wang et al., 2011). �is suggests that there may be partial func-
tional redundancy of these two genes in regulating neuronal migration and dendritic
growth in the mice. A follow-up study of the Dcdc2 knockout mice reported reduced
performance in visual discrimination tasks (which had not been evident in the earlier
study) as well as impairments in long-term working memory, despite the absence of
any de�cits in neuronal migration (Gabel et al., 2011). �e Dcdc2 mutated mice also
learned less e�ciently, which is intriguing given that dyslexia is primarily a learning
disorder (Gabel et al., 2011).
2.4 the dyx3 locus: a connection with iq?
By studying a large multigenerational family from Norway in which dyslexia ap-
peared to be inherited in a simple dominant manner, Fagerheim et al. (1999) identi�ed
a candidate locus (DYX3) on chromosome 2 (2p12-16). Over a decade later, the iden-
tity of the putative causative mutation in this family remains unknown. Neverthe-
less, further investigations in other samples have supported linkage of the 2p12-16

2.5 dyx5, the robo1 gene and axon guidance 39
region with dyslexia (Kaminen et al., 2003) and with several reading-related quanti-
tative traits in dyslexic samples, including the sibling pairs of the DDP (Fisher et al.,
2002; Francks et al., 2002; Petryshen et al., 2002; de Kovel et al., 2008). A nearby re-
gion on 2q22.3 has also been linked to phonemic decoding e�ciency in families with
dyslexia (Raskind et al., 2005), and to reading of irregular words and regular spelling
in the general population (Bates et al., 2007).
�e �rst candidate genes proposed for DYX3 (SEMA4F, OTX1 and TACR1) did not
contain risk variants that could account for the evidence of linkage to this chro-
mosomal region (Francks et al., 2002; Peyrard-Janvid et al., 2004). Subsequently, a
two-stage study pinpointed a small interval of interest within 2p12, containing two
overlapping haplotypes that were associated with dyslexia in two populations (An-
thoni et al., 2007). �e region de�ned by the haplotypes lay between a hypothetical
gene, FLJ13391 and two other candidates, MRPL19 and C2ORF3. In studies of lym-
phocyte cells, heterozygous carriers of the putative risk haplotypes had signi�cantly
lower expression levels of MRPL19 and C2ORF3 than people who carried only non-
risk alleles. However, other studies in an SLI cohort (Newbury et al., 2011) and a
general population sample (Scerri et al., 2011) did not replicate the association be-
tween variants in MRPL19/C2ORF3 and language and reading traits.
Most recently, the relevant markers on 2p12 were found to be signi�cantly associ-
ated with verbal and performance IQ in an investigation that examined the impact
of multiple di�erent candidate dyslexia and SLI risk factors on general cognitive abil-
ities (Scerri et al., 2012). One of the highlighted SNPs in MRPL19 (rs917235) was also
associated with variation in white ma�er volume in the posterior corpus callosum
and the cingulum, brain regions that have been shown to be connecting sections
of the parietal, occipital and temporal cortices. �us, the authors proposed that the
MRPL19/C2ORF3 gene �ndings are more likely to be related to general cognition than
having a speci�c e�ect on reading or language skills.
2.5 dyx5, the robo1 gene and axon guidance
Nopola-Hemmi and colleagues described a four generation Finnish family in which
profound reading di�culties were inherited in a manner that was consistent with
involvement of a single dominant gene, which they mapped to the 3p12-q13 region,
named the DYX5 locus (Nopola-Hemmi et al., 2001). Support for this region was
found in a genome-wide scan of quantitative reading-related traits in dyslexia fami-

40 chapter 2: literature review
lies (Fisher et al., 2002), as well as with irregular word reading in the general popula-
tion Bates et al. (2007). A case-control study in the Afrikaner population also found
suggestive association between dyslexia and markers in 3q13 (Platko et al., 2008).
Although 5HT1F and DRD3 were �rst proposed as candidate genes in the DYX5
region (Nopola-Hemmi et al., 2001), ROBO1 in 3p12 was soon identi�ed to be dis-
rupted in a dyslexic case with a de novo chromosomal translocation a�ecting this
locus (Hannula-Jouppi et al., 2005). Intriguingly, ROBO1 encodes a protein that acts
as an axon guidance receptor. Moreover, on returning to the original four-generation
family that �rst showed linkage to DYX5, Hannula-Jouppi uncovered a putative risk
haplotype of ROBO1 that co-segregated with dyslexia in 19 of the 21 dyslexic family
members. No protein-coding change could be identi�ed, but the dyslexia-associated
alleles of the risk haplotype had a�enuated expression of ROBO1 in lymphocytes
from a�ected individuals, suggesting that altered regulation of this gene could be
a potential causal mechanism (Hannula-Jouppi et al., 2005). Other SNPs in ROBO1
have been reported to be associated with performance on measures of short-term
memory (nonsense word repetition and digit span) but not with tests of reading in
the general population (Bates et al., 2011).
ROBO1 is strongly expressed in developing and adult brain tissue (Lamminmaki
et al., 2012). Studies of animal orthologues have shown that the encoded protein
acts as a receptor for molecular guidance cues during cellular migration and axonal
navigation, playing an important role in crossing of axons across the midline be-
tween brain hemispheres. To investigate potential e�ects on axon crossing in hu-
mans, Lamminmaki et al. (2012) used magnetoencephalography to study dyslexic
individuals carrying the ROBO1 risk haplotype, taken from the original family stud-
ied by Nopola-Hemmi et al. (2001) and Hannula-Jouppi et al. (2005). On assessing
the strength of auditory pathways using a binaural suppression endophenotype, they
found that the control group had a signi�cantly smaller response to binaural than to
monaural stimulation, whilst the risk haplotype group did not (Lamminmaki et al.,
2012). �e strength of the ipsilateral suppression in both hemispheres also corre-
lated with ROBO1 expression levels in blood. However, the risk haplotype group did
not show any signi�cant di�erence from controls in total biallelic expression of this
gene (i.e. expressed from both chromosomal copies). Nevertheless, the authors pro-
posed that partially reduced levels of ROBO1 expression might be causing dyslexia
in this family, by a�ecting the auditory processing and brain development as shown
by their defective interaural interaction.

2.6 additional dyslexia susceptibility loci 41
2.6 additional dyslexia susceptibility loci
�e loci discussed above are the most well studied ones thus far. Even so, a number
of other regions in the genome have also been proposed to harbour susceptibility
genes, and have been designated as DYX loci, as brie�y covered below.
dyx4 A region of 6q11.2-q12 (named the DYX4 locus) was linked to phonological
coding in dyslexia and related quantitative traits (Petryshen et al., 2001). �is
linkage has not been replicated, although one study has reported a suggestive
linkage of 6q15 to spelling of irregular words in a general population sample
(Bates et al., 2007).
dyx6 In two parallel genome-wide linkage screens of quantitative traits in indepen-
dent sets of dyslexia families, the most signi�cant markers for performance on
single-word reading tests coincided, implicating a region on 18p11.2, DYX6
(Fisher et al., 2002). A study of German families did not detect linkage to
chromosome 18p11-q12 (Schumacher et al., 2006b). However, in other sam-
ples DYX6 has been linked to phonological and orthographic coding measures
(Bates et al., 2007) and to reading performance (Seshadri et al., 2007). Four po-
tential candidate genes (MC5R, DYM, NEDD4L and VAPA) have been proposed
in this region (Scerri et al., 2010).
dyx7 Evidence for DYX7 (11p15) comes from a suggestive linkage with phonolog-
ical awareness in the genome-wide linkage screens conducted by Fisher and
colleagues (Fisher et al., 2002), followed by targeted analyses of the region
spanning DRD4, the dopamine D4 receptor, an extensively studied ADHD can-
didate gene on 11p15.5 (Hsiung et al., 2004). Although this la�er study ob-
served linkage to the region, the authors could not detect any association be-
tween known allelic variants of DRD4 and dyslexia susceptibility.
dyx8 �e short arm of chromosome 1 was implicated in one of the earlier �ndings
of the �eld; a translocation a�ecting 1p22 was reported to co-segregate with
severe writing and reading di�culties in a small family (Rabin et al., 1993).
Subsequent studies have provided support for a dyslexia susceptibility locus
in a slightly di�erent location on this chromosome, 1p34-p36 (named DYX8)
via linkage analysis of qualitative phenotypes and quantitative measures (Grig-
orenko et al., 2001). Further evidence has come from the sibling pair studies

42 chapter 2: literature review
of the DDP, in which the strongest linkage peak for categorical dyslexia was
located at 1p36 (de Kovel et al., 2008) as well as from a later report of 1p36
linkage in families with SLI (Rice et al., 2009). KIAA0319L in 1p34 has been
proposed as a candidate gene in the DYX8 region, since it is a likely homologue
of KIAA0319, displaying 61% similarity at the protein level (Couto et al., 2008).
Embryonic knockdown of Kiaa0319l expression in rats caused a similar pheno-
type to that observed in the earlier experiments targeting Kiaa0319: aberrant
migration pa�erns with heterotopias and non-cell autonomous e�ects (Pla�
et al., 2013).
dyx9 In addition to recruiting families in which at least two �rst-degree relatives
had a history of reading problems, the DDP identi�ed a number of large three-
generation Dutch pedigrees with multiple a�ected individuals (de Kovel et al.,
2004). A genome-wide linkage scan of categorical dyslexia was carried out in
one particularly interesting family, in which 15 of 29 available members could
be classi�ed as a�ected, based on reading tests. �e study identi�ed a genome-
wide signi�cant peak of linkage on the X chromosome, in Xq27.3, around the
marker DXS8043, with a risk haplotype shared by 12 of the 15 a�ected family
members (de Kovel et al., 2004). All four males who carried this haplotype were
severely a�ected based on their reading scores - note that males only carry a
single X chromosome, while females carry two copies. �e eight female carri-
ers with a categorical diagnosis of dyslexia showed greater variability in pheno-
type, and there was also an additional female carrier who was una�ected. �is
is consistent with a putative causative mutation in this region having a dom-
inant mode of action, but with reduced penetrance and more variable e�ects
in females. Analysis of the coding sequence of four candidate genes within
this shared region (FMR1, Cxorf1 (TMEM257), DKFZp574M2010, and KIAA1854
(SLITRK2)) did not reveal any mutations, and the causative gene in this family
remains undiscovered.
Analyses of the separate DDP sibling pair sample did not �nd supporting evi-
dence for DYX9 (de Kovel et al., 2004), suggesting that the involvement of the
putative risk gene might be limited to rare mutations of large e�ect. Neverthe-
less, there are hints from other studies that there might indeed be common risk
variants located in this part of the X chromosome. Linkage between Xq26 and
reading-related measures was reported in the earlier genome-wide screens by
Fisher and colleagues (Fisher et al., 2002). Xq27.3 markers showed suggestive

2.7 shared genetic aetiology between dyslexia and language impairments? 43
association with dyslexia in the female sub-sample of a study in an Afrikaner
population (Platko et al., 2008), and suggestive linkage to a nonsense-word
spelling phenotype in a general population sample (Bates et al., 2007). Finally,
a recent study of French dyslexic families also supported the DYX9 locus, with
maximal linkage at Xq27.3 (Huc-Chabrolle et al., 2013). �e authors proposed
that variants a�ecting FMR1, a gene implicated in fragile X syndrome (the most
common genetic cause of intellectual disability), might be involved, although
sequencing of this gene and six other candidates (CXORF1, CXORF51, SLITRK2,
FMR2, ASFMR1, FMR1NB) failed to identify any mutation or polymorphisms
co-segregating with dyslexia.
In addition to those described above, several additional loci have been described
only once. Of particular interest are areas of the genome implicated through chro-
mosomal aberrations which segregate with disorder in multiple members of a family.
One of these is 21q22.3, which was found to segregate with dyslexia in a father and
his two a�ected sons (Poelmans et al., 2009).
2.7 shared genetic aetiology between dyslexia and language im-
pairments?
Given that many people with dyslexia show subtle underlying problems with as-
pects of linguistic processing, it is interesting to consider whether there might be
some shared genetic mechanisms that are common to reading disability and more
overt forms of language disorder. To test this at the molecular level, candidate genes
identi�ed from studies of language-impaired cohorts have been tested with respect
to dyslexia as well as reading-related traits in the general population.
SLI, one of the most common forms of language impairment, is highly comorbid
with dyslexia (43−55%) (Newbury et al., 2011). Based on association analyses of SLI
families, Newbury et al. (2009) proposed CMIP (16q23.2-q23.3) and ATP2C2 (16q24.1)
as candidate genes that modulate phonological short-term memory (measured by
nonsense word repetition tasks) speci�cally in children with language impairment. A
subsequent study con�rmed a lack of association of CMIP and ATP2C2 with nonsense
word repetition in the unselected general population, but at the same time observed
support for the contribution of CMIP variants to aspects of reading performance,
including single word reading and spelling skills, across the normal range of abilities
(Scerri et al., 2011).

44 chapter 2: literature review
Investigations of families with SLI have also identi�ed association of language
measures, particularly nonsense word repetition, with SNPs in CNTNAP2 (7q35-36)
(Vernes et al., 2008). �is gene encodes a neurexin protein with multiple important
functions in the central nervous system, and it is downregulated by FOXP2, a gene
involved in rare single-gene forms of speech and language disorder (Vernes et al.,
2008). Suggestive linkage to 7q35 has been found for speech and reading measures
in independent SLI cohorts (Rice et al., 2009), and the SLI-associated CNTNAP2 SNPs
are correlated with assessments of early language performance (at age 2 years) in a
general population sample (Whitehouse et al., 2011). In one study of dyslexia families
using SNPs from all three SLI candidate genes (CNTNAP2, ATP2C2, CMIP) associa-
tions were only weak and sporadic, leading the authors to argue against pleiotropic
e�ects of these loci (Newbury et al., 2011). However, association of CNTNAP2 SNPs
with nonsense word repetition has been described in a di�erent dyslexia sample (Pe-
ter et al., 2011), while a copy number variant a�ecting CNTNAP2 was recently re-
ported in an individual with severe problems in reading–spelling tests and naming
tasks (Veerappa et al., 2013).
As noted above, rare mutations of the FOXP2 transcription factor have been found
to cause a severe speech and language disorder, characterized by speech apraxia and
multiple de�cits in expressive and receptive language (Fisher and Schar�, 2009). To
investigate whether common polymorphisms of FOXP2 might a�ect the processing
of wri�en language in dyslexia, Wilcke et al. (2012) carried out a case-control asso-
ciation study of variants in this gene and detected nominal association for one SNP,
rs21533005. �ey further studied this SNP in a small fMRI genetics study of phono-
logical processing, proposing that non-carriers of the risk allele showed overactiva-
tion of temporo-parietal areas such as the angular and supramarginal gyri. �ey
also suggested an interaction between dyslexia and genetic risk for the rolandic op-
erculum, a brain region which is involved in motoric speech production. Another
functional imaging study reported that SNPs of FOXP2 were signi�cantly associated
with reading-related activation in two frontal regions of the le� hemisphere: the
inferior frontal gyrus and the dorsal part of the precentral gyrus (Pinel et al., 2012).
2.8 exploring new endophenotypes: mismatch negativity
As noted above, moving towards brain-based endophenotypes of dyslexia is likely to
be important for the future of the �eld, opening up new avenues for genetic inves-

2.8 exploring new endophenotypes: mismatch negativity 45
tigation. One potential endophenotype of interest is auditory mismatch negativity
(MMN), a well-established component of auditory event related potential (ERP) that
is elicited by any discriminable change in some repetitive aspect of the on-going au-
ditory stimulation. It is an automatic response, and thus does not require a�ention,
with a peak that is usually 100-250ms a�er stimulus onset (Naatanen, 2001). �is ERP
component provides an objective measure of discrimination accuracy, as it has been
correlated with behavioural performance. MMN elicitation depends on short term
memory, which has been shown to be reduced in dyslexics. �e DDP longitudinal
study has found that this phenotype is already disturbed very early in life in children
from dyslexia risk families (van Leeuwen et al., 2008; van Zuijen et al., 2012), (also
see paper on Precursors of developmental dyslexia, this issue). A later component
of the MMN (referred to as late MMN or lMMN), with latency between 300-700ms,
has also been proposed as a potential endophenotype, and it has been found to be
reduced in the dyslexic population when compared to a control group (Neuho� et al.,
2012).
Roeske et al. (2011) carried out a genome-wide screen for association with MMN
measures in children with dyslexia, and identi�ed markers on 4q32.1 that were con-
sistently associated with lMMN. �e associated variants lie in a ”gene desert” (a chro-
mosomal region containing very few protein-coding genes). However, the markers
were found to show signi�cant association with levels of messenger RNA expressed
from another gene located on another chromosome - SLC2A3 in chromosome band
12p13. SLC2A3 encodes the predominant facilitative transporter of glucose in neu-
rons. �e authors postulated that the identi�ed SNPs on 4q32.1 exert regulatory
e�ect on the SLC2A3 locus (known as transregulation, since it lies on a di�erent
chromosome). �ey proposed that altered levels of SLC2A3 protein could lead to glu-
cose de�cits in neurons of children with dyslexia, contributing to their smaller MMN
during passive listening tasks. Another report described association between lMMN
and three rare variants in high linkage disequilibrium in DYX2 on chromosome 6
(Czamara et al., 2011); one within DCDC2 and the other two in the intergenic region
between DCDC2 and KIAA0319. It has been hypothesized that e�ects on lMMN in
dyslexic readers re�ect “intact auditory discrimination ability but alterations at later
stages of auditory/ phonological processing” (Giraud and Ramus, 2012). Given the
promising �ndings above, the lMMN endophenotype should be further pursued for
genetic studies.

46 chapter 2: literature review
2.9 genetics and the dutch dyslexia program: past, present and
future
�e DDP has already stimulated, and will continue to contribute to, molecular ge-
netic research in at least three di�erent related areas, considered below.
First, the DDP assembled a cohort of Dutch nuclear families with dyslexia in which
219 sibling pairs were phenotyped using key quantitative measures including non-
sense word repetition, nonsense word reading, word reading, and rapid automatized
naming. As demonstrated by de de Kovel et al. (2008), a robustly characterized sam-
ple such as this can be used to independently evaluate contributions of candidate
dyslexia susceptibility loci identi�ed in other studies. Replication of linkage and as-
sociation �ndings is especially important for conditions like dyslexia, in which the
genetic underpinnings are complex and multifactorial. Interestingly, work with the
DDP cohort has replicated e�ects of DYX3 on chromosome 2 and DYX8 on chromo-
some 1, while at the same time �nding no evidence for linkage to what is perhaps the
most consistently replicated locus, DYX2 on chromosome 6. Evidence for linkage to
DYX1 on chromosome 15, another commonly reported locus, was only found for the
nonsense word repetition quantitative trait, which had low correlation with dyslexia
categorical status in the DDP sample. de Kovel et al. (2008) point out that while quan-
titative traits are o�en used in dyslexia genetics, in the hope of ge�ing closer to the
molecular causes, the evidence provided by such measurements is seldom as simple
to interpret as we wish. �ey note that “linkage peaks at the same locus are asso-
ciated with di�erent quantitative traits in di�erent studies”, which complicates the
reliability of distinct �ndings that are o�en considered “replications”.
It is clear that the dyslexia susceptibility loci that have been suggested by studies
thus far can only account for a small proportion of the total heritability of this trait.
�us, there are likely to be multiple additional genetic risk factors waiting to be
discovered. Based on experiences with other complex brain-related phenotypes, to
successfully identify common risk variants of small e�ect size it will be necessary
to carry out particularly large-scale screens of the genome. �is can perhaps best
be achieved by combining a number of independent well-phenotyped samples from
multiple di�erent research teams, in which case the existing DDP cohorts can make
a key contribution to future gene discovery e�orts.
Second, research by the DDP illustrates the potential of identifying rare multigen-
erational families in which many individuals are a�ected, in order to gain novel in-

2.9 genetics and the dutch dyslexia program: past, present and future 47
sights into the biological underpinnings of disorder. In particular, as described above,
the DDP reported identi�cation of a Dutch family of almost 30 members, in which
half were de�ned as dyslexic, and discovered a region of the X chromosome with
signi�cant linkage (de Kovel et al., 2004). �is study again highlights the genetic
heterogeneity of dyslexia. Although in most families/cases there will be complex
genetic architecture with many risk variants, each contributing to a small amount
of the total variance of reading ability, there are also unusual examples where the
inheritance pa�ern appears consistent with a rare mutation of just a single gene,
with a large e�ect size. Making use of recent technological advances in the �eld of
genetics, we are currently using next-generation DNA sequencing technologies to
zoom in on the putative causal mutation in this X-linked family. As has been shown
by prior investigations of the FOXP2 gene in speech and language disorders (Fisher
and Schar�, 2009) rare single-gene e�ects o�er exciting molecular windows into the
aetiological pathways underlying more common cases of disorder. Two additional
large pedigrees collected by DDP with similar segregation pa�erns to the reported
family also await analysis (unpublished data).
�ird, almost every molecular genetic study of dyslexia thus far has adopted a
�xed perspective on behavioural and cognitive skills, failing to acknowledge that
this is a developmental trait, a moving target in terms of phenotypic de�nition. A
crucial factor for the future is to consider developmental trajectories for reading- and
language-related skills of the children who are being studied, and relate them to the
underlying genetics. As detailed in accompanying papers (see paper on Precursors
of developmental dyslexia, this issue), the DDP assembled a very extensively pheno-
typed longitudinal sample of children from families who are at-risk of dyslexia, as
well as matched non-risk families. �ese children have been carefully evaluated at
multiple developmental timepoints from birth to 10 years of age, using a range of
electrophysiological, behavioural and cognitive measures, motivated by hypotheses
about the biological underpinnings of dyslexia. DNA has been collected from the
majority of children and parents from the longitudinal cohort, providing a unique
resource for association analyses with dyslexia endophenotypes; we are currently
carrying out such studies for the top candidate SNPs from prior literature, described
in our review above. As well as being able to assess the molecular contributions to
several quantitative traits, including electrophysiological endophenotypes, this new
upcoming research can also account for the temporal structure of the longitudinal
assessments, assessing how pro�les change with development and how this relates

48 chapter 2: literature review
to genotype. Such cohorts o�er unprecedented opportunities to tap into central ques-
tions about the mechanistic and dynamic links that connect genes to dyslexia.
2.10 discussion
In sum, the relationship between genetic information and reading skills (as with
other behavioural outputs) is not straightforward, especially when the genetic bases
are known to be highly complex and heterogenic. Hence, there is a large amount
of data that needs to be accumulated and integrated in order to reach a coherent
understanding that will enable us disentangle the environmental and genetic e�ects
on dyslexia. Endophenotypes such as behavioural traits and neuroimaging measure-
ments enable a quantitative assessment of the dyslexic phenotype and their relation
to genetic variants, which will be essential for us to gain be�er understanding of its
biology. �e evidence from existing candidates points towards molecular pathways
a�ecting neuronal migration and axon guidance, which in turn may compromise the
brain architecture a�ecting phonological processing (for example). It is likely that
multiple susceptibility genes remain to be discovered, and it will be interesting to
�nd out whether they implicate similar neuronal mechanisms to those candidates
suggested so far, or lead us into novel molecular pathways.
Most of the genetic variants that have been related to dyslexia in prior work have
been non-coding (not altering sequences of encoded proteins), and as such they have
been proposed to have regulatory e�ects on the genes, although in the majority of
cases direct functional evidence has not been demonstrated. On the other hand, the
loss of function of several of the candidate genes in animal models has shown im-
pacts on brain development. Nevertheless, the observed phenotypes in these model
systems can o�en be quite subtle.
Note that the dyslexic category is speci�c to a literate culture, and that most of
the a�ected people would not have a disability if they were not required to read.
Reading depends on years of explicit instruction and practice in order to develop
this highly specialized skill. Hence, the genetic e�ects that underlie reading abilities
and disabilities must be widespread in nature, given that they are a�ecting the �ne
tuning of an otherwise robust molecular and cognitive system.
�e ultimate goal of this area of research is not only to break down the genetic
components of dyslexia, but also to build bridges from the subcellular molecular
pathways to manifestations of reading problems. To do so, we will need to step into

2.11 glossary of molecular genetic terms 49
the brain, trying to understand the e�ects of dyslexia candidate genes on structures
and functions of key neural circuits, and on temporal processing of language, as well
as how these relate to the behavioural traits on which dyslexia is de�ned.
2.11 glossary of molecular genetic terms
alleles Alternative variants of the same gene or genomic position, originally aris-
ing due to mutation.
association analysis Testing for non-random correlations between a pheno-
typic trait (qualitative or quantitative) and speci�c allelic variants. Can be car-
ried out for just a single genetic marker, or used to screen multiple sites within
a gene, or even across the entire genome, assuming appropriate adjustments
are made for multiple testing when evaluating signi�cance of results.
chromosomal band Each human chromosome has a short arm (‘p’) and long
arm (‘q’), separated by a centromere. Each chromosome arm is divided into
regions, or cytogenetic bands, that can be seen using a microscope and special
stains. �ese bands are labeled p1, p2, p3, q1, q2, q3, etc., counting from the
centromere outwards. At higher resolutions, sub-bands can be seen within
the bands, also numbered from centromere outwards. For example, the cyto-
genetic map location of the DYX1C1 gene is 15q21.3, which indicates it is on
chromosome 15, q arm, band 2, sub-band 1, and sub-sub-band 3.
copy number variant A structural alteration of a chromosome in which there
are an abnormal number of copies of a particular section of DNA, as a conse-
quence of regions of the genome being deleted or duplicated.
cytoskeleton �e cellular sca�olding of a cell. It has an essential and dynamic
role in many cellular processes, such as cellular division, migration, and intra-
cellular transport.
deletion Loss of genetic material. �e size of the missing region may range from
just a single nucleotide of DNA, all the way to a large part of a chromosome.
dominant inheritance In studies of genetic disorders, when one abnormal
copy of a gene from a single parent gives rise to the disorder, even though
the copy inherited from the other parent is normal.

50 chapter 2: literature review
endophenotype A measurable intermediate trait that is assumed to provide a
closer link to the biological substrate of a disorder.
expression Process in which genetic information contained in DNA is used to
synthesize a functional gene product, such as a protein. For example, if a
protein-coding gene has high expression in a particular tissue, it means that
large amounts of the encoded protein are being produced in that tissue.
genotype �e genetic constitution of an individual. Can refer to the entire com-
plement of genetic material, a speci�c gene, or a set of genes.
haplotype A speci�c combination of several adjacent polymorphisms on a chro-
mosome that are inherited together.
heritability �e proportion of variability in a particular characteristic that can
be a�ributed to genetic in�uences. It is a statistical description that applies to
a speci�c population and so it can change if the environment is altered.
linkage mapping �e use of polymorphic genetic markers (such as short tandem
repeats) to identify the approximate genomic location of a gene responsible for
a given trait. �is technique relies on tracking the inheritance of the genetic
markers in families and testing whether they co-segregate with the trait of
interest, in a manner that is unlikely to have occurred by chance.
linkage diseqilibrium A property of physically close regions of the genome,
which tend to be inherited together, resulting in the non-random association
of speci�c allelic variants at the neighbouring loci.
orthologue Corresponding versions of the same gene found in di�erent species,
having arisen from a single gene present in the last common ancestor of those
species. Orthologues in di�erent species may be denoted with distinct symbols,
and human genes are typically referred to with uppercase le�ers. For example,
the �rst reported dyslexia candidate gene has the symbol DYX1C1 in humans,
but Dyx1c1 in rodents.
penetrance �e proportion of individuals with a particular gene variant who
also express an associated trait (phenotype). Complete penetrance means that
every individual with the same speci�c genotype manifests the phenotype.
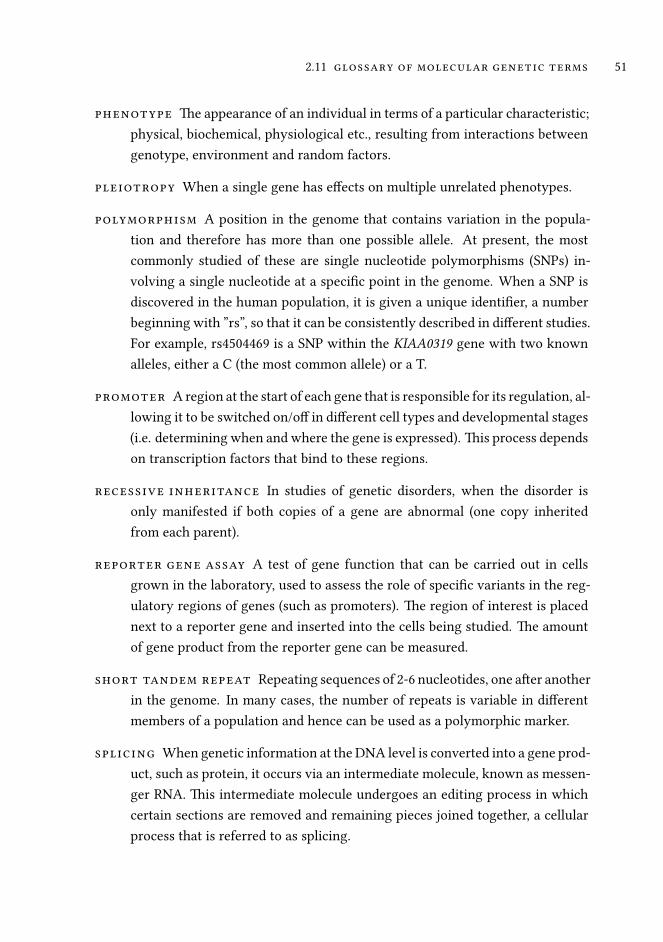
2.11 glossary of molecular genetic terms 51
phenotype �e appearance of an individual in terms of a particular characteristic;
physical, biochemical, physiological etc., resulting from interactions between
genotype, environment and random factors.
pleiotropy When a single gene has e�ects on multiple unrelated phenotypes.
polymorphism A position in the genome that contains variation in the popula-
tion and therefore has more than one possible allele. At present, the most
commonly studied of these are single nucleotide polymorphisms (SNPs) in-
volving a single nucleotide at a speci�c point in the genome. When a SNP is
discovered in the human population, it is given a unique identi�er, a number
beginning with ”rs”, so that it can be consistently described in di�erent studies.
For example, rs4504469 is a SNP within the KIAA0319 gene with two known
alleles, either a C (the most common allele) or a T.
promoter A region at the start of each gene that is responsible for its regulation, al-
lowing it to be switched on/o� in di�erent cell types and developmental stages
(i.e. determining when and where the gene is expressed). �is process depends
on transcription factors that bind to these regions.
recessive inheritance In studies of genetic disorders, when the disorder is
only manifested if both copies of a gene are abnormal (one copy inherited
from each parent).
reporter gene assay A test of gene function that can be carried out in cells
grown in the laboratory, used to assess the role of speci�c variants in the reg-
ulatory regions of genes (such as promoters). �e region of interest is placed
next to a reporter gene and inserted into the cells being studied. �e amount
of gene product from the reporter gene can be measured.
short tandem repeat Repeating sequences of 2-6 nucleotides, one a�er another
in the genome. In many cases, the number of repeats is variable in di�erent
members of a population and hence can be used as a polymorphic marker.
splicing When genetic information at the DNA level is converted into a gene prod-
uct, such as protein, it occurs via an intermediate molecule, known as messen-
ger RNA. �is intermediate molecule undergoes an editing process in which
certain sections are removed and remaining pieces joined together, a cellular
process that is referred to as splicing.

52 chapter 2: literature review
stop codon A small section within a gene that signals the endpoint (termination)
of the protein that it encodes. If a mutation results in an early stop codon,
midway within a gene, then the encoded protein is truncated and may not
function properly.
translocation Genetic rearrangement in which part of a chromosome breaks
and becomes a�ached to another part of the same chromosome, or to a di�er-
ent chromosome.
transcription factor A DNA-binding protein that regulates gene expression.

References 53
references
Adler WT, Pla� MP, Mehlhorn AJ, Haight JL, Currier TA, et al. (2013) Position of
neocortical neurons transfected at di�erent gestational ages with shRNA targeted
against candidate dyslexia susceptibility genes. PLoS ONE 8: e65179.
Anthoni H, Zucchelli M, Matsson H, Muller-Myhsok B, Fransson I, et al. (2007) A lo-
cus on 2p12 containing the co-regulated MRPL19 and C2ORF3 genes is associated
to dyslexia. Hum Mol Genet 16: 667–677.
Bartle� CW, Flax JF, Logue MW, Vieland VJ, Basse� AS, et al. (2002) A major sus-
ceptibility locus for speci�c language impairment is located on 13q21. Am J Hum
Genet 71: 45–55.
Bates TC, Lind PA, Luciano M, Montgomery GW, Martin NG, et al. (2010) Dyslexia
and DYX1C1: de�cits in reading and spelling associated with a missense mutation.
Mol Psychiatry 15: 1190–1196.
Bates TC, Luciano M, Castles A, Coltheart M, Wright MJ, et al. (2007) Replication
of reported linkages for dyslexia and spelling and suggestive evidence for novel
regions on chromosomes 4 and 17. Eur J Hum Genet 15: 194–203.
Bates TC, Luciano M, Medland SE, Montgomery GW, Wright MJ, et al. (2011) Ge-
netic variance in a component of the language acquisition device: ROBO1 poly-
morphisms associated with phonological bu�er de�cits. Behav Genet 41: 50–57.
Bellini G, Bravaccio C, Calamoneri F, Donatella Cocuzza M, Fiorillo P, et al. (2005)
No evidence for association between dyslexia and DYX1C1 functional variants in
a group of children and adolescents from Southern Italy. J Mol Neurosci 27: 311–
314.
Brkanac Z, Chapman NH, Matsushita MM, Chun L, Nielsen K, et al. (2007) Evaluation
of candidate genes for DYX1 and DYX2 in families with dyslexia. Am J Med Genet
B Neuropsychiatr Genet 144B: 556–560.
Cardon LR, Smith SD, Fulker DW, Kimberling WJ, Pennington BF, et al. (1994) �an-
titative trait locus for reading disability on chromosome 6. Science 266: 276–279.
Chandrasekar G, Vesterlund L, Hultenby K, Tapia-Paez I, Kere J (2013) The zebra�sh
orthologue of the dyslexia candidate gene DYX1C1 is essential for cilia growth
and function. PLoS ONE 8: e63123.
Chapman NH, Igo RP, �omson JB, Matsushita M, Brkanac Z, et al. (2004) Linkage
analyses of four regions previously implicated in dyslexia: con�rmation of a locus
on chromosome 15q. Am J Med Genet B Neuropsychiatr Genet 131B: 67–75.

54 chapter 2: literature review
Consortium S (2002) A genomewide scan identi�es two novel loci involved in speci�c
language impairment. Am J Hum Genet 70: 384–398.
Cope N, Eicher JD, Meng H, Gibson CJ, Hager K, et al. (2012) Variants in the DYX2
locus are associated with altered brain activation in reading-related brain regions
in subjects with reading disability. Neuroimage 63: 148–156.
Cope N, Harold D, Hill G, Moskvina V, Stevenson J, et al. (2005) Strong evidence that
KIAA0319 on chromosome 6p is a susceptibility gene for developmental dyslexia.
Am J Hum Genet 76: 581–591.
Couto JM, Gomez L, Wigg K, Cate-Carter T, Archibald J, et al. (2008) The KIAA0319-
like (KIAA0319L) gene on chromosome 1p34 as a candidate for reading disabilities.
J Neurogenet 22: 295–313.
Couto JM, Livne-Bar I, Huang K, Xu Z, Cate-Carter T, et al. (2010) Association of
reading disabilities with regions marked by acetylated H3 histones in KIAA0319.
Am J Med Genet B Neuropsychiatr Genet 153B: 447–462.
Currier TA, Etchegaray MA, Haight JL, Galaburda AM, Rosen GD (2011) The e�ects
of embryonic knockdown of the candidate dyslexia susceptibility gene homologue
Dyx1c1 on the distribution of GABAergic neurons in the cerebral cortex. Neuro-
science 172: 535–546.
Czamara D, Bruder J, Becker J, Bartling J, Ho�mann P, et al. (2011) Association of a
rare variant with mismatch negativity in a region between KIAA0319 and DCDC2
in dyslexia. Behav Genet 41: 110–119.
Dahdouh F, Anthoni H, Tapia-Paez I, Peyrard-Janvid M, Schulte-Korne G, et al. (2009)
Further evidence for DYX1C1 as a susceptibility factor for dyslexia. Psychiatr
Genet 19: 59–63.
Darki F, Peyrard-Janvid M, Matsson H, Kere J, Klingberg T (2012) Three Dyslexia
Susceptibility Genes, DYX1C1, DCDC2, and KIAA0319, A�ect Temporo-Parietal
White Ma�er Structure. Biol Psychiatry 72: 671–676.
de Kovel CG, Franke B, Hol FA, Lebrec JJ, Maassen B, et al. (2008) Con�rmation of
dyslexia susceptibility loci on chromosomes 1p and 2p, but not 6p in a Dutch sib-
pair collection. Am J Med Genet B Neuropsychiatr Genet 147: 294–300.
de Kovel CG, Hol FA, Heister JG, Willemen JJ, Sandkuijl LA, et al. (2004) Genome-
wide scan identi�es susceptibility locus for dyslexia on Xq27 in an extended Dutch
family. J Med Genet 41: 652–657.
De�enbacher KE, Kenyon JB, Hoover DM, Olson RK, Pennington BF, et al. (2004)
Re�nement of the 6p21.3 quantitative trait locus in�uencing dyslexia: linkage and

References 55
association analyses. Hum Genet 115: 128–138.
Dennis MY, Paracchini S, Scerri TS, Prokunina-Olsson L, Knight JC, et al. (2009) A
common variant associated with dyslexia reduces expression of the KIAA0319
gene. PLoS Genet 5: e1000436.
Fagerheim T, Raeymaekers P, T?nnessen FE, Pedersen M, Tranebjaerg L, et al. (1999)
A new gene (DYX3) for dyslexia is located on chromosome 2. J Med Genet 36:
664–669.
Fisher SE, DeFries JC (2002) Developmental dyslexia: genetic dissection of a complex
cognitive trait. Nat Rev Neurosci 3: 767–780.
Fisher SE, Francks C, Marlow AJ, MacPhie IL, Newbury DF, et al. (2002) Independent
genome-wide scans identify a chromosome 18 quantitative-trait locus in�uencing
dyslexia. Nat Genet 30: 86–91.
Fisher SE, Schar� C (2009) FOXP2 as a molecular window into speech and language.
Trends Genet 25: 166–177.
Fisher SE, Stein JF, Monaco AP (1999) A genome-wide search strategy for identifying
quantitative trait loci involved in reading and spelling disability (developmental
dyslexia). Eur Child Adolesc Psychiatry 8 Suppl 3: 47–51.
Francks C, Fisher SE, Olson RK, Pennington BF, Smith SD, et al. (2002) Fine mapping
of the chromosome 2p12-16 dyslexia susceptibility locus: quantitative association
analysis and positional candidate genes SEMA4F and OTX1. Psychiatr Genet 12:
35–41.
Francks C, Paracchini S, Smith SD, Richardson AJ, Scerri TS, et al. (2004) A 77-
kilobase region of chromosome 6p22.2 is associated with dyslexia in families from
the United Kingdom and from the United States. Am J Hum Genet 75: 1046–1058.
Gabel LA, Marin I, LoTurco JJ, Che A, Murphy C, et al. (2011) Mutation of the dyslexia-
associated gene Dcdc2 impairs LTM and visuo-spatial performance in mice. Genes
Brain Behav 10: 868–875.
Giraud AL, Ramus F (2012) Neurogenetics and auditory processing in developmental
dyslexia. Curr Opin Neurobiol 23: 1–6.
Go�esman II, Gould TD (2003) The endophenotype concept in psychiatry: etymol-
ogy and strategic intentions. Am J Psychiatry 160: 636–645.
Graham SA, Fisher SE (2013) Decoding the genetics of speech and language. Curr
Opin Neurobiol 23: 43–51.
Grigorenko EL (2001) Developmental dyslexia: an update on genes, brains, and en-
vironments. J Child Psychol Psychiatry 42: 91–125.

56 chapter 2: literature review
Grigorenko EL, Wood FB, Meyer MS, Hart LA, Speed WC, et al. (1997) Susceptibility
loci for distinct components of developmental dyslexia on chromosomes 6 and 15.
Am J Hum Genet 60: 27–39.
Grigorenko EL, Wood FB, Meyer MS, Pauls JE, Hart LA, et al. (2001) Linkage studies
suggest a possible locus for developmental dyslexia on chromosome 1p. Am J Med
Genet 105: 120–129.
Hannula-Jouppi K, Kaminen-Ahola N, Taipale M, Eklund R, Nopola-Hemmi J, et al.
(2005) The axon guidance receptor gene ROBO1 is a candidate gene for develop-
mental dyslexia. PLoS Genet 1: e50.
Harold D, Paracchini S, Scerri T, Dennis M, Cope N, et al. (2006) Further evidence that
the KIAA0319 gene confers susceptibility to developmental dyslexia. Mol Psychi-
atry 11: 1085–1091.
Hsiung GY, Kaplan BJ, Petryshen TL, Lu S, Field LL (2004) A dyslexia susceptibil-
ity locus (DYX7) linked to dopamine D4 receptor (DRD4) region on chromosome
11p15.5. Am J Med Genet B Neuropsychiatr Genet 125B: 112–119.
Huc-Chabrolle M, Charon C, Guilmatre A, Vourc’h P, Tripi G, et al. (2013) Xq27
FRAXA Locus is a Strong Candidate for Dyslexia: Evidence from a Genome-Wide
Scan in French Families. Behav Genet 43: 132–140.
Ivliev AE, ’t Hoen PA, van Roon-Mom WM, Peters DJ, Sergeeva MG (2012) Exploring
the transcriptome of ciliated cells using in silico dissection of human tissues. PLoS
ONE 7: e35618.
Jamadar S, Powers NR, Meda SA, Gelernter J, Gruen JR, et al. (2011) Genetic in�u-
ences of cortical gray ma�er in language-related regions in healthy controls and
schizophrenia. Schizophr Res 129: 141–148.
Kaminen N, Hannula-Jouppi K, Kestila M, Lahermo P, Muller K, et al. (2003) A
genome scan for developmental dyslexia con�rms linkage to chromosome 2p11
and suggests a new locus on 7q32. J Med Genet 40: 340–345.
Kaplan DE, Gayan J, Ahn J, Won TW, Pauls D, et al. (2002) Evidence for linkage and
association with reading disability on 6p21.3-22. Am J Hum Genet 70: 1287–1298.
Kendler KS, Neale MC (2010) Endophenotype: a conceptual analysis. Mol Psychiatry
15: 789–797.
Lamminmaki S, Massinen S, Nopola-Hemmi J, Kere J, Hari R (2012) Human ROBO1
regulates interaural interaction in auditory pathways. J Neurosci 32: 966–971.
Levecque C, Velayos-Baeza A, Holloway ZG, Monaco AP (2009) The dyslexia-
associated protein KIAA0319 interacts with adaptor protein 2 and follows the

References 57
classical clathrin-mediated endocytosis pathway. Am J Physiol, Cell Physiol 297:
C160–168.
Luciano M, Lind PA, Du�y DL, Castles A, Wright MJ, et al. (2007) A haplotype span-
ning KIAA0319 and TTRAP is associated with normal variation in reading and
spelling ability. Biol Psychiatry 62: 811–817.
Ludwig KU, Roeske D, Schumacher J, Schulte-Korne G, Konig IR, et al. (2008) Inves-
tigation of interaction between DCDC2 and KIAA0319 in a large German dyslexia
sample. J Neural Transm 115: 1587–1589.
Marino C, Ci�erio A, Giorda R, Facoe�i A, Menozzi G, et al. (2007) Association
of short-term memory with a variant within DYX1C1 in developmental dyslexia.
Genes Brain Behav 6: 640–646.
Marino C, Meng H, Maschere�i S, Rusconi M, Cope N, et al. (2012) DCDC2 genetic
variants and susceptibility to developmental dyslexia. Psychiatr Genet 22: 25–30.
Massinen S, Hokkanen ME, Matsson H, Tammimies K, Tapia-Paez I, et al. (2011) In-
creased expression of the dyslexia candidate gene DCDC2 a�ects length and sig-
naling of primary cilia in neurons. PLoS ONE 6: e20580.
Massinen S, Tammimies K, Tapia-Paez I, Matsson H, Hokkanen ME, et al. (2009) Func-
tional interaction of DYX1C1 with estrogen receptors suggests involvement of
hormonal pathways in dyslexia. Hum Mol Genet 18: 2802–2812.
Meda SA, Gelernter J, Gruen JR, Calhoun VD, Meng H, et al. (2008) Polymorphism
of DCDC2 Reveals Di�erences in Cortical Morphology of Healthy Individuals-A
Preliminary Voxel Based Morphometry Study. Brain Imaging Behav 2: 21–26.
Meng H, Powers NR, Tang L, Cope NA, Zhang PX, et al. (2011) A dyslexia-associated
variant in DCDC2 changes gene expression. Behav Genet 41: 58–66.
Meng H, Smith SD, Hager K, Held M, Liu J, et al. (2005) DCDC2 is associated with
reading disability and modulates neuronal development in the brain. Proc Natl
Acad Sci USA 102: 17053–17058.
Morris DW, Robinson L, Turic D, Duke M, Webb V, et al. (2000) Family-based associ-
ation mapping provides evidence for a gene for reading disability on chromosome
15q. Hum Mol Genet 9: 843–848.
Naatanen R (2001) The perception of speech sounds by the human brain as re�ected
by the mismatch negativity (MMN) and its magnetic equivalent (MMNm). Psy-
chophysiology 38: 1–21.
Neuho� N, Bruder J, Bartling J, Warnke A, Remschmidt H, et al. (2012) Evidence for
the late MMN as a neurophysiological endophenotype for dyslexia. PLoS ONE 7:

58 chapter 2: literature review
e34909.
Newbury DF, Paracchini S, Scerri TS, Winchester L, Addis L, et al. (2011) Investiga-
tion of dyslexia and SLI risk variants in reading- and language-impaired subjects.
Behav Genet 41: 90–104.
Newbury DF, Winchester L, Addis L, Paracchini S, Buckingham LL, et al. (2009) CMIP
and ATP2C2 modulate phonological short-term memory in language impairment.
Am J Hum Genet 85: 264–272.
Nopola-Hemmi J, Myllyluoma B, Haltia T, Taipale M, Ollikainen V, et al. (2001) A
dominant gene for developmental dyslexia on chromosome 3. J Med Genet 38:
658–664.
Nopola-Hemmi J, Taipale M, Haltia T, Lehesjoki AE, Voutilainen A, et al. (2000) Two
translocations of chromosome 15q associated with dyslexia. J Med Genet 37: 771–
775.
Paracchini S (2011) Dissection of genetic associations with language-related traits in
population-based cohorts. J Neurodev Disord 3: 365–373.
Paracchini S, Steer CD, Buckingham LL, Morris AP, Ring S, et al. (2008) Association
of the KIAA0319 dyslexia susceptibility gene with reading skills in the general
population. Am J Psychiatry 165: 1576–1584.
Paracchini S, �omas A, Castro S, Lai C, Paramasivam M, et al. (2006) The chro-
mosome 6p22 haplotype associated with dyslexia reduces the expression of
KIAA0319, a novel gene involved in neuronal migration. Hum Mol Genet 15: 1659–
1666.
Peschansky VJ, Burbridge TJ, Volz AJ, Fiondella C, Wissner-Gross Z, et al. (2010)
The e�ect of variation in expression of the candidate dyslexia susceptibility gene
homolog Kiaa0319 on neuronal migration and dendritic morphology in the rat.
Cereb Cortex 20: 884–897.
Peter B, Raskind WH, Matsushita M, Lisowski M, Vu T, et al. (2011) Replication of
CNTNAP2 association with nonword repetition and support for FOXP2 associa-
tion with timed reading and motor activities in a dyslexia family sample. J Neu-
rodev Disord 3: 39–49.
Petryshen TL, Kaplan BJ, Fu Liu M, de French NS, Tobias R, et al. (2001) Evidence for
a susceptibility locus on chromosome 6q in�uencing phonological coding dyslexia.
Am J Med Genet 105: 507–517.
Petryshen TL, Kaplan BJ, Hughes ML, Tzenova J, Field LL (2002) Supportive evidence
for the DYX3 dyslexia susceptibility gene in Canadian families. J Med Genet 39:

References 59
125–126.
Peyrard-Janvid M, Anthoni H, Onkamo P, Lahermo P, Zucchelli M, et al. (2004) Fine
mapping of the 2p11 dyslexia locus and exclusion of TACR1 as a candidate gene.
Hum Genet 114: 510–516.
Pinel P, Fauchereau F, Moreno A, Barbot A, Lathrop M, et al. (2012) Genetic variants
of FOXP2 and KIAA0319/TTRAP/THEM2 locus are associated with altered brain
activation in distinct language-related regions. J Neurosci 32: 817–825.
Platko JV, Wood FB, Pelser I, Meyer M, Gericke GS, et al. (2008) Association of reading
disability on chromosome 6p22 in the Afrikaner population. Am J Med Genet B
Neuropsychiatr Genet 147B: 1278–1287.
Pla� MP, Adler WT, Mehlhorn AJ, Johnson GC, Wright KA, et al. (2013) Embryonic
disruption of the candidate dyslexia susceptibility gene homolog Kiaa0319-like
results in neuronal migration disorders. Neuroscience 248C: 585–593.
Poelmans G, Buitelaar JK, Pauls DL, Franke B (2011) A theoretical molecular network
for dyslexia: integrating available genetic �ndings. Mol Psychiatry 16: 365–382.
Poelmans G, Engelen JJ, Van Lent-Albrechts J, Smeets HJ, Schoenmakers E, et al.
(2009) Identi�cation of novel dyslexia candidate genes through the analysis of a
chromosomal deletion. Am J Med Genet B Neuropsychiatr Genet 150B: 140–147.
Powers NR, Eicher JD, Bu�er F, Kong Y, Miller LL, et al. (2013) Alleles of a Polymor-
phic ETV6 Binding Site in DCDC2 Confer Risk of Reading and Language Impair-
ment. Am J Hum Genet 93: 19–28.
Rabin M, Wen XL, Hepburn M, Lubs HA, Feldman E, et al. (1993) Suggestive linkage
of developmental dyslexia to chromosome 1p34-p36. Lancet 342: 178.
Raskind WH, Igo RP, Chapman NH, Berninger VW, �omson JB, et al. (2005) A
genome scan in multigenerational families with dyslexia: Identi�cation of a novel
locus on chromosome 2q that contributes to phonological decoding e�ciency. Mol
Psychiatry 10: 699–711.
Rice ML, Smith SD, Gayan J (2009) Convergent genetic linkage and associations to
language, speech and reading measures in families of probands with Speci�c Lan-
guage Impairment. J Neurodev Disord 1: 264–282.
Roeske D, Ludwig KU, Neuho� N, Becker J, Bartling J, et al. (2011) First genome-
wide association scan on neurophysiological endophenotypes points to trans-
regulation e�ects on SLC2A3 in dyslexic children. Mol Psychiatry 16: 97–107.
Scerri TS, Darki F, Newbury DF, Whitehouse AJ, Peyrard-Janvid M, et al. (2012) The
dyslexia candidate locus on 2p12 is associated with general cognitive ability and

60 chapter 2: literature review
white ma�er structure. PLoS ONE 7: e50321.
Scerri TS, Fisher SE, Francks C, MacPhie IL, Paracchini S, et al. (2004) Putative func-
tional alleles of DYX1C1 are not associated with dyslexia susceptibility in a large
sample of sibling pairs from the UK. J Med Genet 41: 853–857.
Scerri TS, Morris AP, Buckingham LL, Newbury DF, Miller LL, et al. (2011) DCDC2,
KIAA0319 and CMIP are associated with reading-related traits. Biol Psychiatry 70:
237–245.
Scerri TS, Paracchini S, Morris A, MacPhie IL, Talco� J, et al. (2010) Identi�cation
of candidate genes for dyslexia susceptibility on chromosome 18. PLoS ONE 5:
e13712.
Schulte-Korne G, Grimm T, Nothen MM, Muller-Myhsok B, Cichon S, et al. (1998)
Evidence for linkage of spelling disability to chromosome 15. Am J Hum Genet 63:
279–282.
Schumacher J, Anthoni H, Dahdouh F, Konig IR, Hillmer AM, et al. (2006a) Strong
genetic evidence of DCDC2 as a susceptibility gene for dyslexia. Am J Hum Genet
78: 52–62.
Schumacher J, Ho�mann P, Schmal C, Schulte-Korne G, Nothen MM (2007) Genetics
of dyslexia: the evolving landscape. J Med Genet 44: 289–297.
Schumacher J, Konig IR, Plume E, Propping P, Warnke A, et al. (2006b) Linkage anal-
yses of chromosomal region 18p11-q12 in dyslexia. J Neural Transm 113: 417–423.
Schumacher J, Konig IR, Schroder T, Duell M, Plume E, et al. (2008) Further evidence
for a susceptibility locus contributing to reading disability on chromosome 15q15-
q21. Psychiatr Genet 18: 137–142.
Seshadri S, DeStefano AL, Au R, Massaro JM, Beiser AS, et al. (2007) Genetic corre-
lates of brain aging on MRI and cognitive test measures: a genome-wide associ-
ation and linkage analysis in the Framingham Study. BMC Med Genet 8 Suppl 1:
S15.
Shaywitz SE, Escobar MD, Shaywitz BA, Fletcher JM, Makuch R (1992) Evidence that
dyslexia may represent the lower tail of a normal distribution of reading ability. N
Engl J Med 326: 145–150.
Smith SD, Kimberling WJ, Pennington BF, Lubs HA (1983) Speci�c reading disability:
identi�cation of an inherited form through linkage analysis. Science 219: 1345–
1347.
Szalkowski CE, Fiondella CF, Truong DT, Rosen GD, LoTurco JJ, et al. (2013) The
e�ects of Kiaa0319 knockdown on cortical and subcortical anatomy in male rats.

References 61
Int J Dev Neurosci 31: 116–122.
Taipale M, Kaminen N, Nopola-Hemmi J, Haltia T, Myllyluoma B, et al. (2003) A
candidate gene for developmental dyslexia encodes a nuclear tetratricopeptide re-
peat domain protein dynamically regulated in brain. Proc Natl Acad Sci USA 100:
11553–11558.
Tammimies K, Vitezic M, Matsson H, Le Guyader S, Burglin TR, et al. (2013) Molec-
ular Networks of DYX1C1 Gene Show Connection to Neuronal Migration Genes
and Cytoskeletal Proteins. Biol Psychiatry 73: 583–590.
Tapia-Paez I, Tammimies K, Massinen S, Roy AL, Kere J (2008) The complex of TFII-
I, PARP1, and SFPQ proteins regulates the DYX1C1 gene implicated in neuronal
migration and dyslexia. FASEB J 22: 3001–3009.
Tarkar A, Loges NT, Slagle CE, Francis R, Dougherty GW, et al. (2013) DYX1C1 is
required for axonemal dynein assembly and ciliary motility. Nat Genet 45: 995–
1003.
Tran C, Gagnon F, Wigg KG, Feng Y, Gomez L, et al. (2013) A family-based association
analysis and meta-analysis of the reading disabilities candidate gene DYX1C1. Am
J Med Genet B Neuropsychiatr Genet 162: 146–156.
van Leeuwen T, Been P, van Herten M, Zwarts F, Maassen B, et al. (2008) Two-
month-old infants at risk for dyslexia do not discriminate /bAk/ from /dAk/: A
brain-mapping study. Journal of Neurolinguistics 21: 333 – 348, ¡ce:title¿Use of
Electrophysiological Measures in Reading Research¡/ce:title¿.
van Zuijen TL, Plakas A, Maassen BA, Been P, Maurits NM, et al. (2012) Temporal
auditory processing at 17 months of age is associated with preliterate language
comprehension and later word reading �uency: An ERP study. Neurosci Le� 528:
31–35.
Veerappa AM, Saldanha M, Padakannaya P, Ramachandra NB (2013) Family-based
genome-wide copy number scan identi�es �ve new genes of dyslexia involved in
dendritic spinal plasticity. J Hum Genet 58: 539–547.
Velayos-Baeza A, Levecque C, Kobayashi K, Holloway ZG, Monaco AP (2010)
The dyslexia-associated KIAA0319 protein undergoes proteolytic processing with
gamma-secretase-independent intramembrane cleavage. J Biol Chem 285: 40148–
40162.
Velayos-Baeza A, Toma C, da Roza S, Paracchini S, Monaco AP (2007) Alternative
splicing in the dyslexia-associated gene KIAA0319. Mamm Genome 18: 627–634.

62 chapter 2: literature review
Velayos-Baeza A, Toma C, Paracchini S, Monaco AP (2008) The dyslexia-associated
gene KIAA0319 encodes highly N- and O-glycosylated plasma membrane and se-
creted isoforms. Hum Mol Genet 17: 859–871.
Venkatesh SK, Siddaiah A, Padakannaya P, Ramachandra NB (2013) Analysis of ge-
netic variants of dyslexia candidate genes KIAA0319 and DCDC2 in Indian popu-
lation. J Hum Genet 58: 531–538.
Vernes SC, Newbury DF, Abrahams BS, Winchester L, Nicod J, et al. (2008) A func-
tional genetic link between distinct developmental language disorders. N Engl J
Med 359: 2337–2345.
Wang Y, Paramasivam M, �omas A, Bai J, Kaminen-Ahola N, et al. (2006) DYX1C1
functions in neuronal migration in developing neocortex. Neuroscience 143: 515–
522.
Wang Y, Yin X, Rosen G, Gabel L, Guadiana SM, et al. (2011) Dcdc2 knockout
mice display exacerbated developmental disruptions following knockdown of dou-
blecortin. Neuroscience 190: 398–408.
Whitehouse AJ, Bishop DV, Ang QW, Pennell CE, Fisher SE (2011) CNTNAP2 vari-
ants a�ect early language development in the general population. Genes Brain
Behav 10: 451–456.
Wigg KG, Couto JM, Feng Y, Anderson B, Cate-Carter TD, et al. (2004) Support for
EKN1 as the susceptibility locus for dyslexia on 15q21. Mol Psychiatry 9: 1111–
1121.
Wilcke A, Ligges C, Burkhardt J, Alexander M, Wolf C, et al. (2012) Imaging genetics
of FOXP2 in dyslexia. Eur J Hum Genet 20: 224–229.
Wilcke A, Weissfuss J, Kirsten H, Wolfram G, Boltze J, et al. (2009) The role of gene
DCDC2 in German dyslexics. Ann Dyslexia 59: 1–11.
Zhong R, Yang B, Tang H, Zou L, Song R, et al. (2013) Meta-analysis of the association
between DCDC2 polymorphisms and risk of dyslexia. Mol Neurobiol 47: 435–442.
Zou L, Chen W, Shao S, Sun Z, Zhong R, et al. (2012) Genetic variant in KIAA0319,
but not in DYX1C1, is associated with risk of dyslexia: an integrated meta-analysis.
Am J Med Genet B Neuropsychiatr Genet 159B: 970–976.
Zuo PX, Wu HR, Li ZC, Cao XD, Pang LJ, et al. (2012) Association of polymorphisms
in the DCDC2 gene with developmental dyslexia in the Han Chinese. Chin Med J
125: 622–625.

3
A S S O C I AT I O N A N A LY S I S O F D Y S L E X I A C A N D I D AT E G E N E S
I N A D U T C H L O N G I T U D I N A L S A M P L E
Dyslexia is a common speci�c learning disability with a substantive genetic com-
ponent. Several candidate genes have been proposed to be implicated in dyslexia sus-
ceptibility, such as DYX1C1, ROBO1, KIAA0319, and DCDC2. Associations with vari-
ants in these genes have also been reported with a variety of psychometric measures
tapping into the underlying processes that might be impaired in dyslexic people. In
this study, we �rst conducted a literature review to select single nucleotide poly-
morphisms (SNPs) in dyslexia candidate genes that had been repeatedly implicated
across studies. We then assessed the SNPs for association in the richly phenotyped
longitudinal dataset from the Dutch Dyslexia Program. We tested for association
with several quantitative traits, including word and nonword reading �uency, rapid
naming, phoneme deletion, and nonword repetition. In this, we took advantage of
the longitudinal nature of the sample to examine, if associations were stable across
four developmental time-points (from 7 to 12 years). Two SNPs in the KIAA0319
gene were found to be nominally associated with rapid naming, and these associa-
tions were stable across di�erent ages. Genetic association analysis with complex
cognitive traits can be enriched through the use of longitudinal information on trait
development.
Keywords: association study, dyslexia, candidate genes, longitudinal
�is chapter has been submi�ed as:
Carrion-Castillo, A., Maassen, B., Franke, B., Heister, A., Naber, M., van der Leij, A., Francks, C., &
Fisher, S. E. Association analysis of dyslexia candidate genes in a Dutch longitudinal sample (under
review).
63

64 chapter 3: longitudinal analysis of dyslexia candidate genes
3.1 introduction
Reading ability is a complex behavioural trait. It is known that several cognitive pro-
cesses are involved in the acquisition of this skill (Pennington, 2006). For example,
successful reading of a novel word depends on phonological awareness, the ability to
explicitly re�ect on the internal sound structure of words, as well as phonological de-
coding, the ability to match phonetic units to their wri�en equivalents (graphemes).
�e language in which reading is learned also plays an important role in the type of
strategies learners use (Pennington, 2006). In spite of the essential role reading plays
in many human societies nowadays, about 5-7% of the population have trouble in
acquiring reading skills and may be diagnosed with dyslexia (Shaywitz et al., 1990).
It is well known that a substantial amount of the variance in reading ability is ex-
plained by inherited factors: genetic variance explains about 30-70% of the total vari-
ation in reading skills (Olson et al., 2014). However, we still know very li�le about the
speci�c genetic underpinnings of this trait, since the genetic variants that have been
identi�ed so far can only explain a very small fraction of the heritability estimates.
Nevertheless, some dyslexia candidate loci have been identi�ed through linkage and
candidate gene association studies, leading to proposal of several potential suscep-
tibility genes, including the axon guidance receptor ROBO1 in chromosome 3p12.3
(Hannula-Jouppi et al., 2005), DYX1C1 in chromosome 15q21.3 (Nopola-Hemmi et al.,
2000), and the genes KIAA0319 and DCDC2 in chromosome 6p22.3 (Francks et al.,
2004; Cope et al., 2005).
�e candidate genes have been studied in relation to dyslexia a�ection status
and/or other reading-related traits in multiple studies. Some of the associations have
supporting evidence from independent samples, in line with the hypothesis that they
play a role in shaping the biology underlying the cognitive processes on which read-
ing relies. Several of the candidate genes have been implicated in neuronal migration
by in utero gene knockdown methods (Adler et al., 2013), which is intriguing given
a possible association between disrupted cortical architecture and dyslexia (Giraud
and Ramus, 2012).
Despite this, the evidence supporting the relevance of speci�c genetic variants that
have been proposed so far remains inconclusive: some studies have been unable to
replicate previous �ndings; in some other cases the associations were found with
an opposite direction of e�ect (i.e. the risk allele of the original study was found
to be protective in other studies). For example, the allele T of rs6935076, a SNP in

3.1 introduction 65
the KIAA0319 gene, was originally reported to be associated with dyslexia a�ection
status (Harold et al., 2006), and the same allele (T) was found to be associated with
poorer performance on a language-standardized test and reading comprehension in a
di�erent sample (Rice et al., 2009). Nonetheless, multiple successive studies reported
associations with the opposite direction of e�ect (i.e. risk allele= C) (Couto et al.,
2010; Newbury et al., 2011; Scerri et al., 2011), and others did not �nd any association
between this SNP and reading measures (Schumacher et al., 2006; Brkanac et al.,
2007).
It is o�en argued that this lack of consistency could be at least partially explained
by the heterogeneity across studies (Schumacher et al., 2006; Brkanac et al., 2007;
Newbury et al., 2011), which occurs at various levels: from the study design (e.g.
sample size, language), to trait characterization (e.g. ascertainment criteria, age at
assesment), or the genetic background of the population that is being studied. It
is also likely that some of the associations re�ect false positive �ndings due to in-
complete control of type-I error, a common challenge for genetic studies of complex
traits.
An additional source of heterogeneity might come from variation in the develop-
mental stage at which the diagnosis of dyslexia a�ection status or the quantitative
trait measurement took place. In fact, it has been shown that there are changes in
the relationship of reading-related traits (such as phonological awareness and rapid
automized naming) with reading throughout development (de Jong and van der Leij,
2003; Wagner et al., 1997). �ere is evidence from other �elds of human genetics
that an age-varying e�ect could be one of the issues underlying the non-replication
of some association studies (Lasky-Su et al., 2008; Franke et al., 2010). Despite the
use of normative scores to compare across grades and e�orts to account for the ef-
fects of age on reading ability, it is possible that the variability of ages within and
between datasets might have contributed to the inconsistency of results. Most of the
studies reported so far on the genetics of reading ability have been cross-sectional,
where association has been tested between the SNPs of interest and dyslexia status,
or quantitative traits measured only at one developmental time-point per subject.
Apart from potentially providing higher statistical power than cross-sectional stud-
ies of equivalent sample sizes, longitudinal studies also give the possibility to evalu-
ate associations that change over time (Sitlani et al., 2015). Age-dependent e�ects of
SNPs have been reported in studies related to expressive language and autism-like
traits (St Pourcain et al., 2014a,b).

66 chapter 3: longitudinal analysis of dyslexia candidate genes
Learning to read involves many cognitive processes, which makes it di�cult to
disentangle whether de�cits that are used to characterize people with dyslexia (e.g.
lower phonological awareness) are the reason for the di�culty or the consequence
of a reduced experience in reading (Goswami, 2015). �e direction of this causal-
ity can be be�er studied by looking at longitudinal samples, because they enable a
comparison of developmental trajectories (even starting prior to reading instruction)
between children that are eventually categorized as dyslexic from the trajectories of
those that are not. For instance, mismatch negativity (MMN), an electrophysiologi-
cal measure linked to speech processing, has been found to be reduced in children
(Neuho� et al., 2012) and adults (Schulte-Korne et al., 2001) diagnosed with dyslexia,
and a longitudinal study by van Zuijen et al. (2013) showed that MMN at 2-months
predicted later reading �uency scores. �is supports the view that reduced MMN
can be considered an early precursor of dyslexia, rather than a consequence of it.
In one of the few longitudinal studies of the genetics of reading skills, Zhang et al.
(2012) looked at the association of three SNPs in DYX1C1 and orthographic skills in
relation to children’s development over time. �ey found that rs11629841 in DYX1C1
is associated with children’s orthographic judgments at ages 7 and 8, but less-so at
age 6 years.
In the current study, we have tested association of some of the most consistent
dyslexia candidate genetic variants in a very extensively characterised longitudinal
sample that has not yet been studied for genetic e�ects. �e Dutch Dyslexia Pro-
gramme (DDP) cohort consists of children with and without familial risk for dyslexia
that have been evaluated at multiple developmental time-points, using psychomet-
ric measures related to the development of reading ability. In addition to studying
the genetic association with measures of reading ability, the richness of this dataset
allowed us to look into speci�c endophenotypes known to be linked to reading abil-
ity, such as speed of processing and phonological awareness (de Jong and van der
Leij, 2003; van der Leij et al., 2013; Landerl et al., 2013). Importantly, some of these
measures were taken across multiple developmental time-points, allowing us to ob-
serve the developmental trajectories of speci�c traits within this group of children.
With these data, two simultaneous questions could be asked about the association of
a given genetic variant (SNP) and quantitative trait: 1) Does the SNP have an e�ect
on the overall level of the trait? 2) Does the e�ect of the SNP change over time?

3.1
introduction
67
Dyslexia genetics literature
Consistent associations with reading phenotypes - At least twice same direction of effectOne SNP per LD block (r2>0.8)
Candidate independent SNPs Table 3.2
Association analyses
Longitudinal modeling - Lmer LRT - pr(X2)< 0.05 - SNP Table 3.3 - SNP x timepoint
Bonferroni threshold: 14 SNPs/ 0.05 = 3.6×10⁻³
Single time-point analyses - PLINK - Univariate Table 3.4 - Haplotype Table 3.S4
DDP longitudinal sample
N 64 control 121 at-risk dyslexia
Traits Word Reading Nonword Reading Phoneme Deletion Rapid Naming Nonword Repetition
Time-points: BG2, EG2, MG3, G6
Table 3.1Figure 3.2
Figure 3.1: DDP longitudinal association study design.
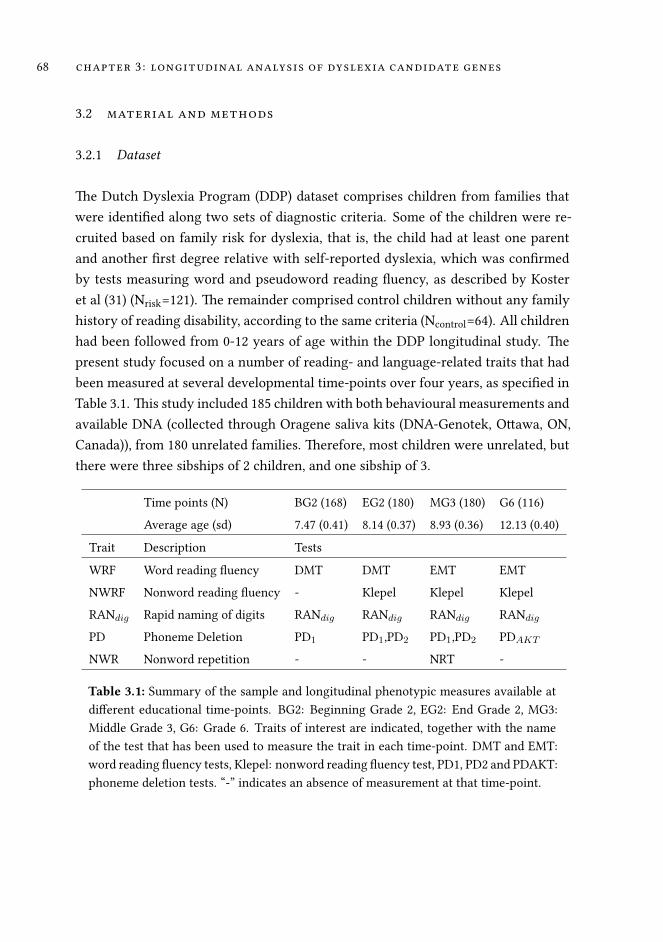
68 chapter 3: longitudinal analysis of dyslexia candidate genes
3.2 material and methods
3.2.1 Dataset
�e Dutch Dyslexia Program (DDP) dataset comprises children from families that
were identi�ed along two sets of diagnostic criteria. Some of the children were re-
cruited based on family risk for dyslexia, that is, the child had at least one parent
and another �rst degree relative with self-reported dyslexia, which was con�rmed
by tests measuring word and pseudoword reading �uency, as described by Koster
et al (31) (Nrisk=121). �e remainder comprised control children without any family
history of reading disability, according to the same criteria (Ncontrol=64). All children
had been followed from 0-12 years of age within the DDP longitudinal study. �e
present study focused on a number of reading- and language-related traits that had
been measured at several developmental time-points over four years, as speci�ed in
Table 3.1. �is study included 185 children with both behavioural measurements and
available DNA (collected through Oragene saliva kits (DNA-Genotek, O�awa, ON,
Canada)), from 180 unrelated families. �erefore, most children were unrelated, but
there were three sibships of 2 children, and one sibship of 3.
Time points (N) BG2 (168) EG2 (180) MG3 (180) G6 (116)
Average age (sd) 7.47 (0.41) 8.14 (0.37) 8.93 (0.36) 12.13 (0.40)
Trait Description Tests
WRF Word reading �uency DMT DMT EMT EMT
NWRF Nonword reading �uency - Klepel Klepel Klepel
RANdig Rapid naming of digits RANdig RANdig RANdig RANdig
PD Phoneme Deletion PD1 PD1,PD2 PD1,PD2 PDAKT
NWR Nonword repetition - - NRT -
Table 3.1: Summary of the sample and longitudinal phenotypic measures available at
di�erent educational time-points. BG2: Beginning Grade 2, EG2: End Grade 2, MG3:
Middle Grade 3, G6: Grade 6. Traits of interest are indicated, together with the name
of the test that has been used to measure the trait in each time-point. DMT and EMT:
word reading �uency tests, Klepel: nonword reading �uency test, PD1, PD2 and PDAKT:
phoneme deletion tests. “-” indicates an absence of measurement at that time-point.

3.2 material and methods 69
3.2.2 Phenotypes
A subset of measures available from the DDP project was selected to be tested in
relation to dyslexia candidate gene variants (Table 3.1): word reading �uency (WRF),
nonword reading �uency (NWRF), rapid naming (RAN), phoneme deletion (PD), and
nonword repetition (NWR). Test reliabilities ranged from 0.73-0.97 (van Bergen et al.,
2011). A detailed description of all traits measured in the DDP sample can be found
in van van Bergen et al. (2011, 2012). Datapoints were excluded as outliers, if they
deviated more than 3 standard deviations from the relevant trait mean within the
developmental time-point.
Word reading �uency
Word reading �uency (WRF) was measured using standard Dutch reading tests that
consist of reading aloud from a list as many words as possible within one minute.
Two di�erent tests were administered depending on the grade (see Table 3.1): the
‘Drie Minuten Test’ (DMT: three minute test: three lists, one minute each (Verhoeven,
1995)) and the ‘Een Minuut Test’ (EMT: one minute test, (EMT, (Brus and Voeten,
1972)). In both cases, the number of correctly read items per minute was taken as
the outcome. �ese tests assess the reading accuracy as well as �uency.
Nonword reading �uency
Nonword reading �uency (NWRF) was measured using the ‘Klepel’ nonword read-
ing test (van den Bos et al., 1994). Similarly to the word reading tests, a list of 50
nonwords must be read within a time limit, in this case two minutes. �e outcome
measure is the number of items read correctly.
Rapid naming
Serial rapid automatized naming (RANdig) (van den Bos, 2003) measures the speed
of naming over-learned information. Children were asked to name 5 di�erent digits,
each occurring 10 times, as quickly as possible. �e outcome measure is expressed
as the number of digits named per second (i.e. 50 item/time in seconds).
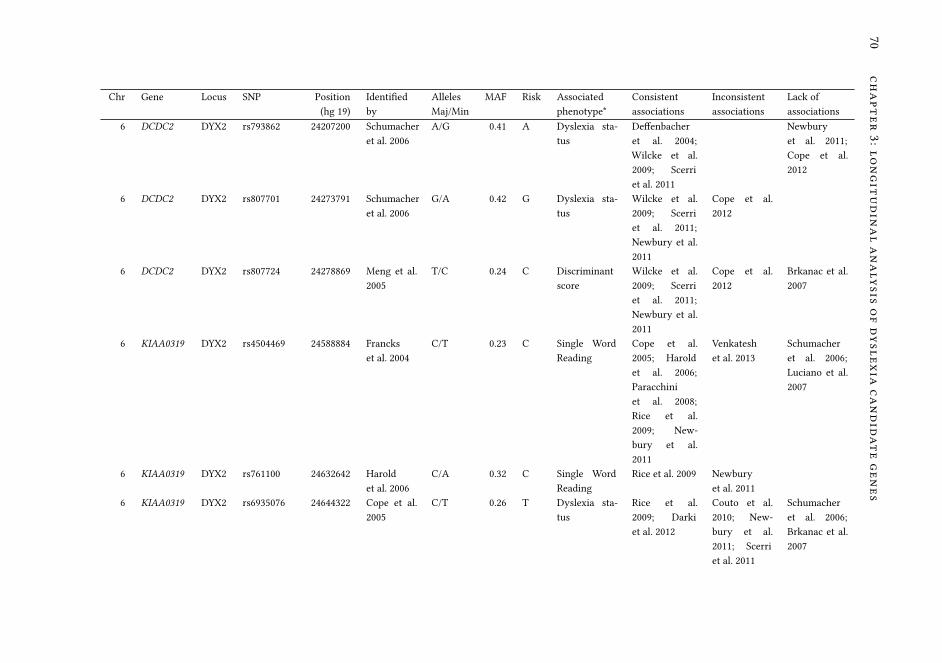
70
chapter3:longitudinalanalysisofdyslexiacandidategenes
Chr Gene Locus SNP Position Identi�ed Alleles MAF Risk Associated Consistent Inconsistent Lack of
(hg 19) by Maj/Min phenotype* associations associations associations
6 DCDC2 DYX2 rs793862 24207200 Schumacher
et al. 2006
A/G 0.41 A Dyslexia sta-
tus
De�enbacher
et al. 2004;
Wilcke et al.
2009; Scerri
et al. 2011
Newbury
et al. 2011;
Cope et al.
2012
6 DCDC2 DYX2 rs807701 24273791 Schumacher
et al. 2006
G/A 0.42 G Dyslexia sta-
tus
Wilcke et al.
2009; Scerri
et al. 2011;
Newbury et al.
2011
Cope et al.
2012
6 DCDC2 DYX2 rs807724 24278869 Meng et al.
2005
T/C 0.24 C Discriminant
score
Wilcke et al.
2009; Scerri
et al. 2011;
Newbury et al.
2011
Cope et al.
2012
Brkanac et al.
2007
6 KIAA0319 DYX2 rs4504469 24588884 Francks
et al. 2004
C/T 0.23 C Single Word
Reading
Cope et al.
2005; Harold
et al. 2006;
Paracchini
et al. 2008;
Rice et al.
2009; New-
bury et al.
2011
Venkatesh
et al. 2013
Schumacher
et al. 2006;
Luciano et al.
2007
6 KIAA0319 DYX2 rs761100 24632642 Harold
et al. 2006
C/A 0.32 C Single Word
Reading
Rice et al. 2009 Newbury
et al. 2011
6 KIAA0319 DYX2 rs6935076 24644322 Cope et al.
2005
C/T 0.26 T Dyslexia sta-
tus
Rice et al.
2009; Darki
et al. 2012
Couto et al.
2010; New-
bury et al.
2011; Scerri
et al. 2011
Schumacher
et al. 2006;
Brkanac et al.
2007

3.2
materialandmethods
71
6 KIAA0319 DYX2 rs2038137 24645943 Francks
et al. 2004
G/T 0.25 G Single Word
Reading
Cope et al.
2005; Harold
et al. 2006;
Paracchini
et al. 2008
6 KIAA0319 DYX2 rs9467247 24647219 Francks
et al. 2004
C/A 0.33 A Single Word
Reading
Dennis et al.
2009
6 TTRAP DYX2 rs2143340 24659071 Francks
et al. 2004
A/G 0.15 G Single Word
Reading
Paracchini
et al. 2008;
Newbury et al.
2011; Scerri
et al. 2011
Luciano et al.
2007; Cope
et al. 2012
7 CNTNAP2 - rs759178 147575112 Vernes et al.
2008
C/A 0.40 C Nonword rep-
etition
Whitehouse
et al. 2011
7 CNTNAP2 - rs17236239 147582305 Vernes et al.
2008
A/G 0.24 G Nonword rep-
etition
Whitehouse
et al. 2011
7 CNTNAP2 - rs2710117 147601772 Vernes et al.
2008
A/T 0.37 A Nonword rep-
etition
Whitehouse
et al. 2011
15 DYX1C1 DYX1 rs3743204 55790310 Dahdouh
et al. 2009
G/T 0.33 T Short Term
Memory
Bates et al.
2010
Darki et al.
2012
16 CMIP SLI1 rs16955705 81673350 Newbury
et al. 2009
A/C 0.36 C Nonword rep-
etition
Newbury
et al. 2009;
Scerri et al.
2011
Table 3.2: SNPs analysed in the current study. * Strongest signal (if several) on the �rst study reporting the association of the
SNP with reading-related abilities. Risk: allele associated with lower scores/ a�ection status in the �rst study that reported the
association. Consistent associations: signi�cant association of the marker SNP with a reading-related trait with the same direction
of e�ect. Inconsistent associations: signi�cant association of the SNP marker with a reading-related trait with the opposite direction
of e�ect. Lack of associations: tested the association of the SNP with a reading related trait but did not replicate the association.

72 chapter 3: longitudinal analysis of dyslexia candidate genes
Phoneme deletion
Phonological awareness was measured using a phoneme deletion task, in which a
phoneme (always a consonant) had to be deleted from a nonword, resulting in an-
other nonword (de Jong and van der Leij, 2003). �ere was no time limit for the
completion of this task. �e task was divided in two parts (PD1 and PD2), which
di�ered in the type of tested nonwords. In the �rst part, nine monosyllabic and nine
disyllabic nonwords were included. In the second part, the items were nine disyllabic
nonwords, in which the phoneme to be deleted occurred twice. �e outcome mea-
sure for each part was the proportion of correct items. We then calculated at each
developmental time-point a composite score across parts, the proportion of correct
items for all available parts (PDtot).
A di�erent phoneme deletion task was used in grade 6: PDAKT (Amsterdam Pho-
neme Deletion Test) (van Bergen et al., 2015), which consisted of 12 items. �e out-
come measure was the proportion of correct items.
Nonword repetition
Nonword repetition (NWR) consisted of a test, in which children had to repeat a
list of 27 nonwords that were presented to them auditorily. �ere was no time limit
for the completion of this task. �e outcome measure was the number of correctly
repeated items.
3.2.3 Genetic variants
Fourteen candidate SNPs were tested for association in the DDP longitudinal sam-
ple. �e choice of SNPs was based on a literature review at the time of designing
the study (see Table 2). We �rst identi�ed 18 SNPs that had been associated with
reading-related traits (i.e. dyslexia a�ection status, reading �uency, nonword repe-
tition, orthographic choice, spelling, phonological awareness, or discriminant score)
at least twice in a consistent manner, i.e. with the same directions of allelic e�ect
across studies. We then pruned the SNP list to reduce redundancy, based on link-
age disequilibrium (LD), by selecting only one SNP per LD block (r2 > 0.8) using
SNAP (CEU population) (Johnson et al., 2008). As a result, four SNPs were excluded
(rs2179515, rs2235676, rs3212236, rs9461045). �e list of the 14 selected SNPs a�er
the pruning is summarized in Table 3.2.

3.2 material and methods 73
�e DDP children and their parents (N=555) were directly genotyped in-house us-
ing KASP assays (LGC Ltd., Teddington, UK). We excluded 9 individuals with more
than 3/14 missing genotypes (i.e. a missing genotype rate exceeding 20%) from anal-
yses. Mendelian inconsistencies were �agged using PLINK v1.07 (Purcell et al., 2007)
and, as a result, the genotypes for one SNP were excluded in one family. �e total
genotyping rate in the remaining individuals was 98.8%, with a missing rate<5% for
all the SNPs. All SNPs were in Hardy-Weinberg equilibrium in the unrelated parents
(p>0.05). Subsequent analysis was carried out using only child trait measurements
and genotypes.
3.2.4 Statistical analyses
In this study, we conducted a number of tests to assess the association between 15
candidate SNPs and �ve quantitative traits related to reading ability, two of which
were measured using two di�erent instruments (see Table 3.1). Since these tests
are not independent to each other (due to the correlation between phenotypes, see
Figure 3.2) we do not correct our P-values for multiple testing for the traits. For
the 15 SNPs tested, the application of a Bonferroni correction sets the threshold for
signi�cance at p = 3.3∗10−3, which we have applied despite the partial dependence
of some of the SNPs as a result of linkage disequilibrium. We describe the trends
of association across SNPs, traits and methods. �e signals that are captured by
multiple methodological approaches are highlighted as the most reliable results from
the present study.
Phenotypic correlations
Pearson’s correlations between traits, within developmental time-points, were com-
puted using R statistical so�ware (R, 2014). We also computed correlations for each
trait across developmental time-points (Figure 3.S1).
Longitudinal modeling of SNP e�ects
To examine the longitudinal dimension of the genetic e�ects, a linear mixed model
was ��ed to each trait in R using the ‘lme4’ package (Bates et al., 2015). First, we
��ed a null model for each trait, which consisted of a �xed-e�ect part and a random-
e�ect part. All models contained the same �xed e�ect terms: age, developmental

74 chapter 3: longitudinal analysis of dyslexia candidate genes
time-point, sex, cohort (i.e. recruitment site), and group (risk and non-risk) (Table
3.S1). �ey also all contained a random e�ect for family intercept to account for
the relatedness of some of the samples. �e other random-e�ects varied per trait
(see Table 3.S2), since the models were ��ed depending on the number of repeated
observations per subject that were available (i.e. same trait across time-points as
indicated in Table 3.1).
For Klepel, RANdig, and PDtot, three or more developmental time-points were avail-
able. �us, we included a random e�ect for subject intercept and a slope for age per
subject, to allow children to di�er in their rates of development. For each of DMT and
EMT (reading �uency measures), only two developmental time-points were available.
Hence, it was not possible to include a random e�ect for slope, and we only included
a random intercept per subject. When a trait had only been measured at one develop-
mental time-point (i.e. NWR and PDAKT), the time-point term was dropped, and the
random e�ect part only contained the intercept for the family. �e e�ect of a SNP
on the overall level of a trait was then assessed by comparing the null model with
a full model, in which SNP allele dosage was included as a �xed e�ect. �e e�ect
of a SNP on the trajectory was assessed by comparing the model including the SNP
with a model that included the SNP and SNP x time-point interaction terms. A like-
lihood ratio test (LRT) between the nested models (see Equations in Supplementary
information), was used to assess the signi�cance of the term of interest (i.e. ‘SNP’ or
‘time-point x SNP’). �e signi�cances of the estimates were calculated using Sa�erth-
waite approximations to determine denominator degrees of freedom, in the package
‘lmerTest’ (Kuznetsova et al., 2015).
For the 14 SNPs tested, the application of Bonferroni correction would set a con-
servative threshold for signi�cance at p=3.6*10-3
(conservative because of the partial
dependence of some of the SNPs as a result of linkage disequilibrium). Since the
�ve traits were not independent of each other (due to substantial correlations be-
tween traits, see Figure 3.2), we did not consider a further correction of P-values for
multiple testing across the �ve traits.
Single time-point analyses
SNPs that showed signi�cant association in the longitudinal analysis (for SNP or
time-point x SNP) were further explored by testing additive linear association at
each separate developmental time-point using PLINK v1.07 (Purcell et al., 2007) (–
qfam and permutations to correct for the sibship structure of a small minority of

3.3 results 75
families). For these analyses, we �rst adjusted the traits for covariate e�ects with
a predictive linear model (separately for each developmental time-point). We con-
sidered age (centered by substracting the mean age) as a variable, and sex, cohort
(i.e. recruitment site), and group (risk and non-risk) as factors for each trait at each
time-point (see Table 3.S1). Although not all of these covariates were signi�cant pre-
dictors of all traits, we kept them in order to be consistent in the way we analysed
the di�erent traits. Blom’s transformation was used to rank-normalize residuals and
a�ain normality within each time-point.
In order to assess whether trait-associations of several neighbouring SNPs were
independent, we performed conditional association analysis using the –condition
option in PLINK v1.07.
We also evaluated haplotypes for two SNPs in KIAA0319 in relation to rapid nam-
ing using PLINK v1.07 (–hap-assoc).
3.3 results
�e �ve traits were substantially inter-correlated within each developmental time-
point (Figure 3.2). Overall, the two reading �uency measures (word and nonword
reading) were most highly correlated with each other (r=0.85), while the correlations
of the other phenotypes were more moderate (r=0.11-0.62). �e lowest correlations
were seen between rapid naming and phoneme deletion (PDtot and PDAKT, r=0.22-
0.32), and between rapid naming and nonword repetition (r=0.11). �e correlation
structure was largely stable across time points, although there was some variation,
for example the correlation between reading �uency and rapid naming increased
over developmental time.
�e longitudinal assessments of the SNP e�ects and timepoint x SNP interactions
are summarized in Table 3.3, showing associations for which Pr in likelihood ra-
tio tests (see Table 3.S3 for full LRT tables). For the SNPs that showed signi�cant
e�ects (either main SNP e�ect or timepoint x SNP interaction e�ect), follow-up uni-
variate association analyses per time-point are shown in Table 3.4. Five out of the
14 SNPs tested showed evidence of association with either rapid naming (rs761100,
rs2038137), word reading �uency (rs6935076), or nonword repetition (rs17236239).
Speci�cally, rapid naming of digits was nominally associated with two neighbour-
ing SNPs in KIAA0319 (rs761100 χ2(1) = 6.927, p = 0.009; rs2038137 χ2
(1) =6.496, p =
0.011), the minor alleles being associated with lower scores, corresponding to slower
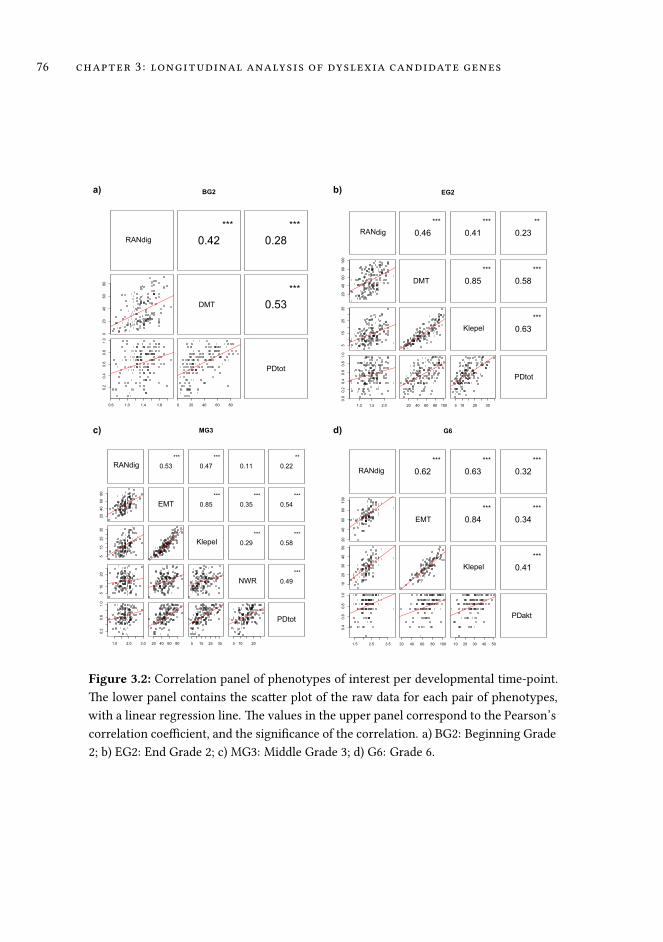
76 chapter 3: longitudinal analysis of dyslexia candidate genes
RANdig 0.53
***
0.47
***
0.11 0.22
**
20406080
EMT 0.85
***
0.35
***
0.54
***
515
25
35
Klepel 0.29
***
0.58
***
510
20
NWR 0.49
***
1.0 2.0 3.0
0.2
0.6
1.0
20 40 60 80 5 15 25 35 5 10 20
PDtot
MG3
RANdig 0.42
***
0.28
***
020
40
60
80
DMT 0.53
***
0.6 1.0 1.4 1.8
0.2
0.4
0.6
0.8
1.0
0 20 40 60 80
PDtot
BG2
RANdig 0.62
***
0.63
***
0.32
***
20
40
60
80
100
EMT 0.84
***
0.34
***
10
20
30
40
50
Klepel 0.41
***
1.5 2.5 3.5
0.4
0.6
0.8
1.0
20 40 60 80 100 10 20 30 40 50
PDakt
G6
0.46
***
0.41
***
0.23
**
20
40
60
80100
DMT 0.85
***
0.58
***
515
25
35
Klepel 0.63
***
1.0 1.5 2.0
0.0
0.2
0.4
0.6
0.8
1.0
20 40 60 80 100 5 10 20 30
PDtot
EG2a) b)
c) d)
RANdig
Figure 3.2: Correlation panel of phenotypes of interest per developmental time-point.
�e lower panel contains the sca�er plot of the raw data for each pair of phenotypes,
with a linear regression line. �e values in the upper panel correspond to the Pearson’s
correlation coe�cient, and the signi�cance of the correlation. a) BG2: Beginning Grade
2; b) EG2: End Grade 2; c) MG3: Middle Grade 3; d) G6: Grade 6.

3.3 results 77
naming. �ese results were independent of developmental time-point, since the in-
teractions between the SNPs and time-point were not signi�cant. �e single time-
point analysis re�ected the same signal, showing signi�cant associations of these
two SNPs at multiple developmental time-points (Table 4); the most signi�cant was
at beginning of grade 2 for rs761100 (pEG2 = 0.001) and at the middle of grade 3 for
rs2038137 (pEG2 = 0.005). �e directions of e�ect for both SNPs were the same across
all developmental time-points, with the minor alleles yielding lower scores (Figure
3.3).
Rs761100 and rs2038137 are located 13 kb apart in the 5’ untranslated region (UTR)
of the KIAA0319 gene, and they are in LD with each other (, for the 1000G CEU popu-
lation) (Johnson et al., 2008). When both SNPs were modeled together as �xed e�ects
for association with rapid naming, the second SNP was not a signi�cant predictor.
Similarly, the association was no longer signi�cant when conditioning the test of one
of the SNPs on the other (Table 3.S5). Haplotype analyses per developmental time-
point indicated that the two minor alleles rs761100-A and rs2038137-T form the risk
haplotype (p≤0.01 for all time-points except G6, Table 3.S5).
Rs6935076, another SNP in KIAA0319, was associated with word reading �uency
(DMT: χ2(1) = 3.568, p = 0.059; EMT: χ2
(1) = 4.861, p = 0.027). �is association was
con�rmed in two of the developmental stages by the single time-point analysis (DMT:
pEG2= 0.042; EMT: pMG3= 0.047). Although this SNP is located in between rs761100
and rs2038137, the two SNPs that were associated with rapid naming, it is in low LD
with these (r2= 0.21-0.28) and did not itself show any association with rapid naming
(RANdig: χ2(1) = 1.042, p = 0.307).
�e longitudinal analysis showed a developmental time-point-dependent associa-
tion between the CNTNAP2 variant rs759178 and nonword reading �uency (χ2(2) =
7.131, p = 0.028) (Figure 3.4). Of note, there were no signi�cant di�erences in non-
word reading scores between the genotypes at the individual time-points themselves
(Table 3.4).
We found that rs17236239, a second SNP in CNTNAP2, was associated with non-
word repetition, both via linear regression in R (χ2(1)= 6.380, p= 0.012) and PLINK
(p=0.025).
We did not �nd signi�cant associations between phoneme deletion measures (PDtot
and PDAKT) and any of the SNPs tested.

78
chapter3:longitudinalanalysisofdyslexiacandidategenes
Time points
Trait Model Term BG2 EG2 MG3 G6 Nind Nfam Alleles Risk Estimate SE df T Pr(>T)
Maj/Min
NWR NWR rs17236239 x 159 155 A/G A 0.294 0.118 151.36 2.491 0.014
WRF EMT rs6935076 x x 161 154 C/T C 0.217 0.100 150.54 2.177 0.031
RAN RANdig rs2038137 x x x x 167 163 G/T T -0.187 0.074 163.67 -2.526 0.012
RAN RANdig rs761100 x x x x 165 161 C/A A -0.187 0.072 162.01 -2.610 0.010
NWRF Klepel x x x 164 160 C/A
rs759178 0.054 0.084 174.20 0.601 0.548
MG3:rs759178 -0.083 0.037 180.30 -2.231 0.027
G6:rs759178 0.024 0.072 129.50 0.325 0.745
Table 3.3: Nominally signi�cant associations for the SNP �xed e�ect terms and timepoint*SNP interaction terms from the linear
mixed models. �e estimates for the SNP are for the centered dependent variables speci�ed in the model. For the time-point*SNP
interaction term, estimates for the centered dependent variables speci�ed on the model are given for the marker per each level of the
time-point (except for the baseline, i.e. EG2). �e degrees of freedom (df) are estimated with Sa�erthwaite’s approximation. Risk:
allele associated with lower scores.

3.3
results
79
�
�
�
�
�
�
�
�
�
�
�
�
−1
0
1
BG2 EG2 MG3 G6
Time−point
Z−score
RANdig
Genotypers2038137�
�
�
G/G
G/T
T/T
�
�
�
�
�
�
�
�
�
�
�
�
−1
0
1
BG2 EG2 MG3 G6
Time−point
Z−score
RANdig
Genotypers761100�
�
�
C/C
C/A
A/A
a) b)
Figure 3.3: Z-standardized performance on rapid naming of digits (RANdig) per developmental time-point and genotypic groups of
a) rs761100 and b) rs2038137. �e lines represent the ��ed residuals to the mixed linear model including the allelic state of the SNP
as a variable, and the points and error bars are the mean and standard deviation of the mean per time-point.

80 chapter 3: longitudinal analysis of dyslexia candidate genes
rs759178 * timepoint
Genotype rs759178
Z−sc
ore
Klep
el
−0.5
0.0
0.5
1.0
C/C C/A A/A
: timepoint EG2
C/C C/A A/A
: timepoint MG3
C/C C/A A/A
: timepoint G6
�
�
�
�
�
�
�
�
�
0
1
EG2 MG3 G6
Time−point
Z−sc
ore
Kle
pel Genotype
rs759178
�
�
�
C/C
C/A
A/A
a)
b)
Figure 3.4: Z-standardised performance on nonword reading �uency per developmen-
tal time-point and genotypic groups of rs759178. a) Interaction plot of time-point x
rs759178. b) Fi�ed residuals to the mixed linear model including the rs759178 and time-
point x rs759178 as variables; the points and error bars are the mean and standard devi-
ation of the mean per time-point.

3.3
results
81
Time-points BG2 EG2 MG3 G6
Test N β EMP1 N β EMP1 N β EMP1 N β EMP1
Nonword Reading Fluency
rs759178 Klepel 160 -0.162 0.167 160 0.011 0.929 110 -0.076 0.584
Word Reading Fluency
rs6935076 DMT2/EMT 156 0.243 0.058 157 0.243 0.042 157 0.245 0.047 110 0.280 0.053
Rapid Naming
rs761100 RANdig 158 -0.339 0.001 161 -0.294 0.009 162 -0.286 0.009 111 -0.256 0.062
rs2038137 RANdig 160 -0.302 0.006 163 -0.290 0.014 164 -0.307 0.005 112 -0.248 0.063
Nonword Repetition
rs17236239 NRT 159 0.283 0.025
Table 3.4: PLINK univariate association analyses per developmental time-point. N: number of individuals in the analysis. β: regres-
sion coe�cient for the major allele. EMP1: Empirical P-values (10,000 permutations).

82 chapter 3: longitudinal analysis of dyslexia candidate genes
3.4 discussion
In this study, we performed candidate gene association analyses in a Dutch sample
with longitudinal measures for several reading-related measures. �is dataset con-
sisted of a very richly phenotyped sample, in which genetic associations could be
detected via intermediate measures related to the cognitive processes involved in
reading (such as phoneme deletion and rapid naming) collected at multiple devel-
opmental time-points. Based on a literature search, we selected and genotyped 14
SNPs that had been associated with dyslexia and/or relevant quantitative traits, con-
sistently in at least two separate studies, and found in the prominent candidate genes
DYX1C1, DCDC2, KIAA0319, CMIP, and CNTNAP2. We modeled the data longitudi-
nally to assess overall and developmental time-dependent e�ects of these SNPs on
word and nonword reading �uency, nonword repetition, rapid naming, and phoneme
deletion. A number of nominally signi�cant associations were observed, and detailed
single time-point analyses of these associations con�rmed that most of them were
consistent across developmental time-points. Below, we discuss the results across
the di�erent analyses, considering them in relation to the pool of existing data cur-
rently available in the �eld of dyslexia genetics.
�e most signi�cant association that we found in the DDP sample was between
rapid naming and two SNPs, rs761100 and rs2038137, in the 5’ UTR of the KIAA0319
gene. �e ability to rapidly name a limited set of well-known items is considered
a measure of processing speed; it tackles the timing mechanisms necessary for the
automaticity required in advanced stages of reading development (Pennington, 2006;
van der Leij et al., 2013) and is one of the strongest predictors of reading ability in
pre-literate children (van der Leij et al., 2013). Moreover, superior parental rapid
naming pro�ciency has been shown to be a protective factor for children at famil-
ial risk for dyslexia in the DDP sample (van der Leij et al., 2013; van Bergen et al.,
2012), suggesting that it is an important intergenerational precursor of reading (van
Bergen et al., 2014). However, the e�ect of these SNPs on word reading �uency in
our samples is at best only marginally signi�cant (DMT, rs761100, χ2(1) = 2.697, p =
0.100). �is could re�ect some heterogeneity in reading strategies, since the overall
variance in reading is explained by other factors in addition to rapid naming, and
those other factors might not be a�ected by these SNPs. On the other hand, we also
found that rs6935076, another SNP in the same region of KIAA0319, was associated

3.4 discussion 83
with word reading �uency in the DDP sample, although to a lesser extent and not at
all developmental time-points, but was not associated with rapid naming.
Rapid naming has not o�en been investigated in previous genetic studies of read-
ing ability; it has been included in only three linkage studies (Konig et al., 2011;
Rubenstein et al., 2014; de Kovel et al., 2008) and a small number of recent associa-
tion studies (Lim et al., 2014). One of these studies found evidence of linkage for the
composite score of RAN colours/objects, on 6p21 (Konig et al., 2011). �e region is
close to the DYX2 locus spanning KIAA0319, although the authors of the study ar-
gued that their results support the existence of an additional dyslexia susceptibility
gene on 6p. �e linkage was not found in two other studies that also included sev-
eral rapid naming measures (Rubenstein et al., 2014; de Kovel et al., 2008). �e lack
of consistency across studies is a long-standing problem for the �eld, in part due to
the heterogeneity across studies at various levels, such as study design, sample size,
ascertainment scheme, and population (Fisher and DeFries, 2002).
A recent study that tested for association between rapid naming of digits and
dyslexia candidate SNPs in a Chinese population, found that this trait was nominally
associated with several SNPs in KIAA0319 (Lim et al., 2014), including rs2038137 (p=
0.02454), one of the associated SNPs in the present study. �is same SNP was also
associated with scores on Chinese dictation and phonological awareness in the Chi-
nese sample. However, the direction of e�ect of this SNP in the present study was
not congruent with previous reports. We found the minor allele T to be associated
with lower scores, but it was originally reported that the major allele G was associ-
ated with reduced performance on word reading, orthographic choice, and spelling
(Francks et al., 2004), and this association has been observed in additional studies
with this same direction of e�ect (i.e. risk allele=G) (Cope et al., 2005; Harold et al.,
2006).
�e other SNP that we found to be associated with rapid naming was rs761100,
also in the KIAA0319 gene. �is SNP was �rst found associated with several quan-
titative traits including reading and spelling, and the risk allele was reported to be
the major allele C (Harold et al., 2006), opposite to our direction of e�ect (risk al-
lele=minor T). However, another study found that the minor allele was associated
with reduced expressive language in a sample of children with speci�c language
impairment (Newbury et al., 2011). �is SNP was also included in a recent cross-
linguistic meta-analysis across several European samples, and its minor allele T was
nominally associated with lower spelling scores in the meta-analysis, although not

84 chapter 3: longitudinal analysis of dyslexia candidate genes
in any of the subsamples separately (Becker et al., 2014). �is SNP was not included
in the Chinese study that looked at rapid naming (Lim et al., 2014).
We observed association between nonword repetition and rs17236239, a CNTNAP2
SNP that was selected based on its previous association with this trait. However,
the DDP sample showed the opposite direction of e�ect to that previously reported
(Vernes et al., 2008; Whitehouse et al., 2011).
We did not �nd association between any of the SNPs and phoneme deletion, which
is a measure of phonological awareness that has been repeatedly associated with
candidate SNPs in prior literature (Francks et al., 2004; Lim et al., 2014).
Another question that we asked concerned the stability of the associations across
di�erent developmental time-points. Overall, most of the associations that we found
were time-independent. When looking at the single time-point analysis, we did ob-
serve that some of the association signals di�ered at distinct points of development,
mainly becoming less signi�cant at the latest time-point (G6, mean age=12.1 years).
�is drop in signi�cance may well relate to the drop of sample size in the latest stages
of the project, rather than indicating a decrease of the genetic e�ect on these traits as
the age increases. Moreover, our time-span ranged only from age 7 to 12 years, and
for some of the traits of interest the measurement instrument was not constant across
developmental time-points (e.g. reading �uency with DMT and EMT), which broke
the longitudinal analysis into two steps. �ese factors, together with our moderate
sample size, might have reduced our chances of detecting developmentally sensitive
genetic e�ects. Nevertheless, we did observe one suggestive �nding in our longi-
tudinal analysis: an interaction of rs759178, nonword reading �uency, and develop-
mental time-point. �is interaction involved a smaller di�erence across genotypes
in the middle time-point (MG3, mean age=8.9 years) compared to the other earlier
and later ages (Figure 3.4). Although the single time-point analysis did not show any
signi�cant di�erence between genotypes at any of the individual time-points, there
was a trend (risk allele=C) at the end of grade 2 (EG2, mean age=8.14 years). �is
result is di�cult to interpret biologically, but indicates how cross-sectional studies
could miss associations that are present only at certain developmental stages. Lon-
gitudinal analysis of genetic e�ects in reading ability and related quantitative traits
is a potentially powerful method that has been underexploited so far, and should be
considered whenever this type of data is available, as in the DDP cohort.
Another strength of the DDP cohort is the richness of the assessment, involving
several quantitative traits. Even when the e�ects that we observed were stable in
3.4 discussion 85
time, the availability of multiple reading- and language-related traits permi�ed a
detailed understanding of the type of process that the genetic variation could be
a�ecting.
�e literature on candidate genetic variants for reading is di�cult to interpret, as
re�ected by the summary in Table 3.2. Recent e�orts have tried to integrate evidence
across studies, to get insights into the relevance of these candidate SNPs for dyslexia.
�e NeuroDys consortium meta-analyzed association results for 19 SNPs (including
8 that we analyzed in the present study) across several European samples, but did
not �nd any signi�cant association a�er correcting for multiple comparisons (Becker
et al., 2014). Some others have focused on just a handful of variants per study, and
they have notably meta-analyzed results from case-control studies, concluding that
many of the variants were not associated with an increase of dyslexia (Zou et al., 2012;
Zhong et al., 2013; Tran et al., 2013), although a few were (e.g. rs4504469-T (Zou et al.,
2012), rs807701- C (Zhong et al., 2013). �ese e�orts have been highly constrained
by heterogeneity across studies, as well as the limited availability of any given trait
measurement across studies. One source of study heterogeneity is the orthography
of the language (e.g. more transparent orthography in Dutch versus a more complex
orthography in English). It is thought that the relationship between reading-related
cognitive abilities and reading skills varies depending on the orthographic system.
For example, it has been proposed that rapid naming might be an important predic-
tor for reading in consistent, but not in complex, orthographies (Kirby et al., 2010).
However, another study found that ”the impact of phoneme deletion and RAN-digits
was stronger in complex than in less complex orthographies” for predicting devel-
opmental dyslexia (Landerl et al., 2013). Despite the fact that the directionality of
the relationship is not clear, it seems that the strategies children develop in order to
master reading do di�er across orthography types. �us, it might be important to
reconsider the available data on the genetic studies of reading, taking into account
factors such as orthographic complexity.
Other recent investigations have tested the association of dyslexia status and/or
reading-related measures with polymorphisms across the entire genome (Field et al.,
2013; Luciano et al., 2013; Gialluisi et al., 2014). �ese genome-wide association
screens have yielded some interesting new candidate genes, but no clearly signi�-
cant results, probably because these studies have so far been performed using sam-
ple sizes that were not large enough to reliably detect e�ects explaining less than 1%
of trait variance (which have to be expected based on experiences from other brain

86 chapter 3: longitudinal analysis of dyslexia candidate genes
disorders (Psychiatric Genomics Consortium, 2014)). Indeed, the main limitation of
the present study is its moderate sample, which is not well powered to detect small
e�ect sizes. However, the DDP dataset consists of a very well-characterized sample
at the phenotypic level, and we have evaluated some of the most intensively studied
candidate SNPs for dyslexia in a longitudinal dataset for the �rst time, while the pre-
viously reported e�ect sizes for many of these SNPs were large enough to be detected
in comparatively sized datasets.
Future genetic studies of reading-related traits will probably depend on increas-
ing power by meta-analysing many of the available samples, an approach that has
proven successful for other complex traits. �e present longitudinal study reminds
us that there are also non-genetic dimensions that should be accounted for, including
developmental time-point.

References 87
references
Adler WT, Pla� MP, Mehlhorn AJ, Haight JL, Currier TA, et al. (2013) Position of
neocortical neurons transfected at di�erent gestational ages with shRNA targeted
against candidate dyslexia susceptibility genes. PLoS ONE 8: e65179.
Bates D, Maechler M, Bolker B, Walker S (2015) lme4: Linear mixed-e�ects models
using Eigen and S4. URL h�p://CRAN.R-project.org/package=lme4, r package ver-
sion 1.1-8.
Bates TC, Lind PA, Luciano M, Montgomery GW, Martin NG, et al. (2010) Dyslexia
and DYX1C1: de�cits in reading and spelling associated with a missense mutation.
Mol Psychiatry 15: 1190–1196.
Becker J, Czamara D, Scerri TS, Ramus F, Csepe V, et al. (2014) Genetic analysis of
dyslexia candidate genes in the European cross-linguistic NeuroDys cohort. Eur J
Hum Genet 22: 675–680.
Brkanac Z, Chapman NH, Matsushita MM, Chun L, Nielsen K, et al. (2007) Evaluation
of candidate genes for DYX1 and DYX2 in families with dyslexia. Am J Med Genet
B Neuropsychiatr Genet 144B: 556–560.
Brus BT, Voeten MJM (1972) Een-minuut-test [one-minute-test]. Swets & Zeitlinger
.
Cope N, Eicher JD, Meng H, Gibson CJ, Hager K, et al. (2012) Variants in the DYX2
locus are associated with altered brain activation in reading-related brain regions
in subjects with reading disability. Neuroimage 63: 148–156.
Cope N, Harold D, Hill G, Moskvina V, Stevenson J, et al. (2005) Strong evidence that
KIAA0319 on chromosome 6p is a susceptibility gene for developmental dyslexia.
Am J Hum Genet 76: 581–591.
Couto JM, Livne-Bar I, Huang K, Xu Z, Cate-Carter T, et al. (2010) Association of
reading disabilities with regions marked by acetylated H3 histones in KIAA0319.
Am J Med Genet B Neuropsychiatr Genet 153B: 447–462.
Dahdouh F, Anthoni H, Tapia-Paez I, Peyrard-Janvid M, Schulte-Korne G, et al. (2009)
Further evidence for DYX1C1 as a susceptibility factor for dyslexia. Psychiatr
Genet 19: 59–63.
Darki F, Peyrard-Janvid M, Matsson H, Kere J, Klingberg T (2012) Three Dyslexia
Susceptibility Genes, DYX1C1, DCDC2, and KIAA0319, A�ect Temporo-Parietal
White Ma�er Structure. Biol Psychiatry 72: 671–676.

88 chapter 3: longitudinal analysis of dyslexia candidate genes
de Jong P, van der Leij A (2003) Developmental changes in the manifestation of a
phonological de�cit in dyslexic children learning to read a regular orthography.
Journal of Educational Psychology 95: 22–40.
de Kovel CG, Franke B, Hol FA, Lebrec JJ, Maassen B, et al. (2008) Con�rmation of
dyslexia susceptibility loci on chromosomes 1p and 2p, but not 6p in a Dutch sib-
pair collection. Am J Med Genet B Neuropsychiatr Genet 147: 294–300.
De�enbacher KE, Kenyon JB, Hoover DM, Olson RK, Pennington BF, et al. (2004)
Re�nement of the 6p21.3 quantitative trait locus in�uencing dyslexia: linkage and
association analyses. Hum Genet 115: 128–138.
Dennis MY, Paracchini S, Scerri TS, Prokunina-Olsson L, Knight JC, et al. (2009) A
common variant associated with dyslexia reduces expression of the KIAA0319
gene. PLoS Genet 5: e1000436.
Field LL, Shumansky K, Ryan J, Truong D, Swiergala E, et al. (2013) Dense-map
genome scan for dyslexia supports loci at 4q13, 16p12, 17q22; suggests novel locus
at 7q36. Genes Brain Behav 12: 56–69.
Fisher SE, DeFries JC (2002) Developmental dyslexia: genetic dissection of a complex
cognitive trait. Nat Rev Neurosci 3: 767–780.
Francks C, Paracchini S, Smith SD, Richardson AJ, Scerri TS, et al. (2004) A 77-
kilobase region of chromosome 6p22.2 is associated with dyslexia in families from
the United Kingdom and from the United States. Am J Hum Genet 75: 1046–1058.
Franke B, Vasquez AA, Johansson S, Hoogman M, Romanos J, et al. (2010) Multicen-
ter analysis of the SLC6A3/DAT1 VNTR haplotype in persistent ADHD suggests
di�erential involvement of the gene in childhood and persistent ADHD. Neuropsy-
chopharmacology 35: 656–664.
Gialluisi A, Newbury DF, Wilcu� EG, Olson RK, DeFries JC, et al. (2014) Genome-
wide screening for DNA variants associated with reading and language traits.
Genes Brain Behav 13: 686–701.
Giraud AL, Ramus F (2012) Neurogenetics and auditory processing in developmental
dyslexia. Curr Opin Neurobiol 23: 1–6.
Goswami U (2015) Sensory theories of developmental dyslexia: three challenges for
research. Nat Rev Neurosci 16: 43–54.
Hannula-Jouppi K, Kaminen-Ahola N, Taipale M, Eklund R, Nopola-Hemmi J, et al.
(2005) The axon guidance receptor gene ROBO1 is a candidate gene for develop-
mental dyslexia. PLoS Genet 1: e50.

References 89
Harold D, Paracchini S, Scerri T, Dennis M, Cope N, et al. (2006) Further evidence that
the KIAA0319 gene confers susceptibility to developmental dyslexia. Mol Psychi-
atry 11: 1085–1091.
Johnson AD, Handsaker RE, Pulit SL, Nizzari MM, O’Donnell CJ, et al. (2008) SNAP:
a web-based tool for identi�cation and annotation of proxy SNPs using HapMap.
Bioinformatics 24: 2938–2939.
Kirby J, Georgiou G, Martinussen R, Parrila R (2010) Naming speed and reading:
From prediction to instruction. Reading Research �arterly 45: 341–362.
Konig IR, Schumacher J, Ho�mann P, Kleensang A, Ludwig KU, et al. (2011) Mapping
for dyslexia and related cognitive trait loci provides strong evidence for further
risk genes on chromosome 6p21. Am J Med Genet B Neuropsychiatr Genet 156B:
36–43.
Kuznetsova A, Bruun Brockho� P, Haubo Bojesen Christensen R (2015) lmerTest:
Tests in Linear Mixed E�ects Models. URL h�p://CRAN.R-project.org/package=
lmerTest, r package version 2.0-25.
Landerl K, Ramus F, Moll K, Lyytinen H, Leppanen PH, et al. (2013) Predictors of de-
velopmental dyslexia in European orthographies with varying complexity. J Child
Psychol Psychiatry 54: 686–694.
Lasky-Su J, Lyon HN, Emilsson V, Heid IM, Molony C, et al. (2008) On the replication
of genetic associations: timing can be everything! Am J Hum Genet 82: 849–858.
Lim CK, Wong AM, Ho CS, Waye MM (2014) A common haplotype of KIAA0319
contributes to the phonological awareness skill in Chinese children. Behav Brain
Funct 10: 23.
Luciano M, Evans DM, Hansell NK, Medland SE, Montgomery GW, et al. (2013) A
genome-wide association study for reading and language abilities in two popula-
tion cohorts. Genes Brain Behav 12: 645–652.
Luciano M, Lind PA, Du�y DL, Castles A, Wright MJ, et al. (2007) A haplotype span-
ning KIAA0319 and TTRAP is associated with normal variation in reading and
spelling ability. Biol Psychiatry 62: 811–817.
Meng H, Smith SD, Hager K, Held M, Liu J, et al. (2005) DCDC2 is associated with
reading disability and modulates neuronal development in the brain. Proc Natl
Acad Sci USA 102: 17053–17058.
Neuho� N, Bruder J, Bartling J, Warnke A, Remschmidt H, et al. (2012) Evidence for
the late MMN as a neurophysiological endophenotype for dyslexia. PLoS ONE 7:
e34909.

90 chapter 3: longitudinal analysis of dyslexia candidate genes
Newbury DF, Paracchini S, Scerri TS, Winchester L, Addis L, et al. (2011) Investiga-
tion of dyslexia and SLI risk variants in reading- and language-impaired subjects.
Behav Genet 41: 90–104.
Newbury DF, Winchester L, Addis L, Paracchini S, Buckingham LL, et al. (2009) CMIP
and ATP2C2 modulate phonological short-term memory in language impairment.
Am J Hum Genet 85: 264–272.
Nopola-Hemmi J, Taipale M, Haltia T, Lehesjoki AE, Voutilainen A, et al. (2000) Two
translocations of chromosome 15q associated with dyslexia. J Med Genet 37: 771–
775.
Olson RK, Keenan JM, Byrne B, Samuelsson S (2014) Why do Children Di�er in Their
Development of Reading and Related Skills? Sci Stud Read 18: 38–54.
Paracchini S, Steer CD, Buckingham LL, Morris AP, Ring S, et al. (2008) Association
of the KIAA0319 dyslexia susceptibility gene with reading skills in the general
population. Am J Psychiatry 165: 1576–1584.
Pennington BF (2006) From single to multiple de�cit models of developmental disor-
ders. Cognition 101: 385–413.
Psychiatric Genomics Consortium SWGot (2014) Biological insights from 108
schizophrenia-associated genetic loci. Nature 511: 421–427.
Purcell S, Neale B, Todd-Brown K, �omas L, Ferreira MA, et al. (2007) PLINK: a tool
set for whole-genome association and population-based linkage analyses. Am J
Hum Genet 81: 559–575.
R CT (2014) R: A Language and Environment for Statistical Computing. R Foundation
for Statistical Computing, Vienna, Austria, URL h�p://www.R-project.org/.
Rice ML, Smith SD, Gayan J (2009) Convergent genetic linkage and associations to
language, speech and reading measures in families of probands with Speci�c Lan-
guage Impairment. J Neurodev Disord 1: 264–282.
Rubenstein KB, Raskind WH, Berninger VW, Matsushita MM, Wijsman EM (2014)
Genome scan for cognitive trait loci of dyslexia: Rapid naming and rapid switching
of le�ers, numbers, and colors. Am J Med Genet B Neuropsychiatr Genet 165B:
345–356.
Scerri TS, Morris AP, Buckingham LL, Newbury DF, Miller LL, et al. (2011) DCDC2,
KIAA0319 and CMIP are associated with reading-related traits. Biol Psychiatry 70:
237–245.
Schulte-Korne G, Deimel W, Bartling J, Remschmidt H (2001) Speech perception
de�cit in dyslexic adults as measured by mismatch negativity (MMN). Int J Psy-

References 91
chophysiol 40: 77–87.
Schumacher J, Anthoni H, Dahdouh F, Konig IR, Hillmer AM, et al. (2006) Strong
genetic evidence of DCDC2 as a susceptibility gene for dyslexia. Am J Hum Genet
78: 52–62.
Shaywitz SE, Shaywitz BA, Fletcher JM, Escobar MD (1990) Prevalence of reading
disability in boys and girls. Results of the Connecticut Longitudinal Study. JAMA
264: 998–1002.
Sitlani CM, Rice KM, Lumley T, McKnight B, Cupples LA, et al. (2015) Generalized
estimating equations for genome-wide association studies using longitudinal phe-
notype data. Stat Med 34: 118–130.
St Pourcain B, Cents RA, Whitehouse AJ, Haworth CM, Davis OS, et al. (2014a) Com-
mon variation near ROBO2 is associated with expressive vocabulary in infancy.
Nat Commun 5: 4831.
St Pourcain B, Skuse DH, Mandy WP, Wang K, Hakonarson H, et al. (2014b) Variabil-
ity in the common genetic architecture of social-communication spectrum pheno-
types during childhood and adolescence. Mol Autism 5: 18.
Tran C, Gagnon F, Wigg KG, Feng Y, Gomez L, et al. (2013) A family-based association
analysis and meta-analysis of the reading disabilities candidate gene DYX1C1. Am
J Med Genet B Neuropsychiatr Genet 162: 146–156.
Tran C, Wigg KG, Zhang K, Cate-Carter TD, Kerr E, et al. (2014) Association of the
ROBO1 gene with reading disabilities in a family-based analysis. Genes, Brain and
Behavior 13: 430–438, URL h�p://dx.doi.org/10.1111/gbb.12126.
van Bergen E, Bishop D, van Zuijen T, de Jong PF (2015) How Does Parental Reading
In�uence Children’s Reading? A Study of Cognitive Mediation. Scienti�c Studies
of Reading 0: 1–15.
van Bergen E, de Jong PF, Plakas A, Maassen B, van der Leij A (2012) Child and
parental literacy levels within families with a history of dyslexia. J Child Psychol
Psychiatry 53: 28–36.
van Bergen E, de Jong PF, Regtvoort A, Oort F, van O�erloo S, et al. (2011) Dutch
children at family risk of dyslexia: precursors, reading development, and parental
e�ects. Dyslexia 17: 2–18.
van Bergen E, van der Leij A, de Jong PF (2014) The intergenerational multiple de�cit
model and the case of dyslexia. Front Hum Neurosci 8: 346.
van den Bos KP (2003) Serieel benoemen en woorden lezen [serial naming and word
reading]. Rijksunversiteit Groningen .

92 chapter 3: longitudinal analysis of dyslexia candidate genes
van den Bos KP, Lutje Spelberg HC, Scheepstra AJM, de Vries JR (1994) De klepel:
Een test voor de leesvaardigheid van pseudowoorden [the klepel: A test for the
reading skills of pseudowords]. Swets & Zeitlinger .
van der Leij A, van Bergen E, van Zuijen T, de Jong P, Maurits N, et al. (2013) Precur-
sors of developmental dyslexia: an overview of the longitudinal Dutch Dyslexia
Programme study. Dyslexia 19: 191–213.
van Zuijen TL, Plakas A, Maassen BA, Maurits NM, van der Leij A (2013) Infant
ERPs separate children at risk of dyslexia who become good readers from those
who become poor readers. Dev Sci 16: 554–563.
Venkatesh SK, Siddaiah A, Padakannaya P, Ramachandra NB (2013) Analysis of ge-
netic variants of dyslexia candidate genes KIAA0319 and DCDC2 in Indian popu-
lation. J Hum Genet 58: 531–538.
Verhoeven L (1995) Drie-Minuten-Toets (DMT). Cito.
Vernes SC, Newbury DF, Abrahams BS, Winchester L, Nicod J, et al. (2008) A func-
tional genetic link between distinct developmental language disorders. N Engl J
Med 359: 2337–2345.
Wagner RK, Torgesen JK, Rasho�e CA, Hecht SA, Barker TA, et al. (1997) Chang-
ing relations between phonological processing abilities and word-level reading as
children develop from beginning to skilled readers: A 5-year longitudinal study.
Developmental Psychology 33: 468–479.
Whitehouse AJ, Bishop DV, Ang QW, Pennell CE, Fisher SE (2011) CNTNAP2 vari-
ants a�ect early language development in the general population. Genes Brain
Behav 10: 451–456.
Wilcke A, Weissfuss J, Kirsten H, Wolfram G, Boltze J, et al. (2009) The role of gene
DCDC2 in German dyslexics. Ann Dyslexia 59: 1–11.
Zhang Y, Li J, Tardif T, Burmeister M, Villafuerte SM, et al. (2012) Association of the
DYX1C1 dyslexia susceptibility gene with orthography in the Chinese population.
PLoS ONE 7: e42969.
Zhong R, Yang B, Tang H, Zou L, Song R, et al. (2013) Meta-analysis of the association
between DCDC2 polymorphisms and risk of dyslexia. Mol Neurobiol 47: 435–442.
Zou L, Chen W, Shao S, Sun Z, Zhong R, et al. (2012) Genetic variant in KIAA0319,
but not in DYX1C1, is associated with risk of dyslexia: an integrated meta-analysis.
Am J Med Genet B Neuropsychiatr Genet 159B: 970–976.

Supplementary information 93
supplementary information
(a)
DMT.BG2 0.87
***
0.87
***
0.72
***
2040
6080
100
DMT.EG2 0.93
***
0.85
***
2040
6080
EMT.MG3 0.85
***
0 20 40 60 80
2040
6080
100
20 40 60 80 100 20 40 60 80
EMT.G6
DMT/EMT
(b)
EG2 0.92
***
0.85
***
510
1520
2530
35
MG3 0.87
***
5 10 15 20 25 30 35
1020
3040
50
5 10 15 20 25 30 35
G6
Klepel
(c)
BG2 0.72
***
0.68
***
0.63
***
1.0
1.5
2.0
EG2 0.77
***
0.70
***
1.01.52.02.53.0
MG3 0.74
***
0.6 1.0 1.4 1.8
1.5
2.5
3.5
1.0 1.5 2.0 1.0 1.5 2.0 2.5 3.0
G6
RAN_Dig_ss
(d)
PDtot.BG2 0.67
***
0.62
***
0.56
***
0.0
0.2
0.4
0.6
0.8
1.0
PDtot.EG2 0.75
***
0.62
***
0.2
0.4
0.6
0.8
1.0
PDtot.MG3 0.57
***
0.2 0.4 0.6 0.8 1.0
0.4
0.6
0.8
1.0
0.0 0.2 0.4 0.6 0.8 1.0 0.2 0.4 0.6 0.8 1.0
PDAKT.G6
PD
Figure 3.S1: Correlation panel of phenotypes of interest per phenotype. a Word reading
�uency: DMT test in time-point BG2 and EG2, EMT test in time-point MG3 and G6; b
Nonword reading �uency; c Rapid Naming Digits; d Phoneme deletion tests: PDtot and
and PDakt.
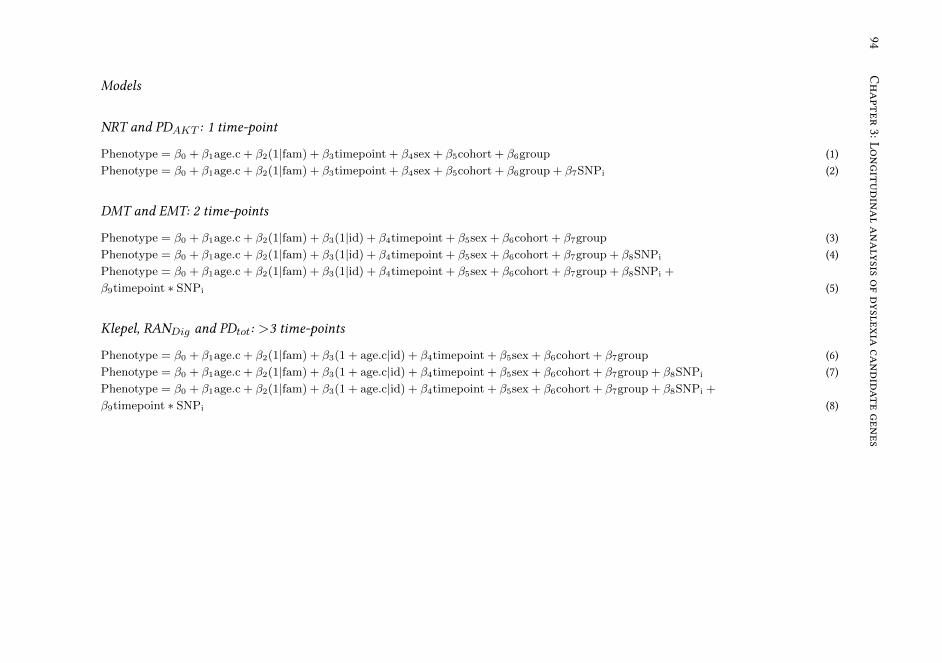
94
Chapter3:Longitudinalanalysisofdyslexiacandidategenes
Models
NRT and PDAKT : 1 time-point
Phenotype = β0 + β1age.c + β2(1|fam) + β3timepoint + β4sex + β5cohort + β6group (1)
Phenotype = β0 + β1age.c + β2(1|fam) + β3timepoint + β4sex + β5cohort + β6group + β7SNPi (2)
DMT and EMT: 2 time-points
Phenotype = β0 + β1age.c + β2(1|fam) + β3(1|id) + β4timepoint + β5sex + β6cohort + β7group (3)
Phenotype = β0 + β1age.c + β2(1|fam) + β3(1|id) + β4timepoint + β5sex + β6cohort + β7group + β8SNPi (4)
Phenotype = β0 + β1age.c + β2(1|fam) + β3(1|id) + β4timepoint + β5sex + β6cohort + β7group + β8SNPi +
β9timepoint ∗ SNPi (5)
Klepel, RANDig and PDtot: >3 time-points
Phenotype = β0 + β1age.c + β2(1|fam) + β3(1 + age.c|id) + β4timepoint + β5sex + β6cohort + β7group (6)
Phenotype = β0 + β1age.c + β2(1|fam) + β3(1 + age.c|id) + β4timepoint + β5sex + β6cohort + β7group + β8SNPi (7)
Phenotype = β0 + β1age.c + β2(1|fam) + β3(1 + age.c|id) + β4timepoint + β5sex + β6cohort + β7group + β8SNPi +
β9timepoint ∗ SNPi (8)

Supplementary information 95
Covariates
Covariate Levels
Age Continuous
Sex Male, female
Cohort Groningen, Nijmegen, Amsterdam
Group Familial Risk, Non-familial risk
Table 3.S1: List of covariates that have been regressed out from the raw scores per
time-point, and that have been included into the linear regression models.
Mixed e�ect models, null models
Time- Fixed Random Phenotype Measure
points terms terms
1 age.c sex cohort group family Nonword Repetition NWR
Phoneme Deletion PDAKT
2 age.c sex cohort group family subject Word Reading Fluency DMT
Word Reading Fluency EMT
>3 age.c sex cohort group family age.c|subject Nonword Reading Fluency Klepel
Rapid Naming of Digits RANdig
Phoneme Deletion PDtot
Table 3.S2: Null models for each measurement, specifying the �xed e�ect and random
terms for each trait, depending on the number of available measures per subject.

96
Chapter3:Longitudinalanalysisofdyslexiacandidategenes
Likelihood ratio tests
Formula Df AIC BIC logLik deviance χ2 χ2df Pr(χ2
)
H0 Z EMT ˜ age.c + (1|fam) + (1|id) + timep + sex + cohort + group 10 537.15 573.02 -258.57 517.15
H1 Z EMT ˜ age.c + (1|fam) + (1|id) + timep + sex + cohort + group + rs6935076 11 534.29 573.75 -256.14 512.29 4.86 1 0.028
H0 Z Klepel ˜ age.c + (1|fam) + (1 + age.c|id) + timep + sex + cohort + group + rs759178 14 576.43 633.29 -274.21 548.43
H1 Z Klepel ˜ age.c + (1|fam) + (1 + age.c|id) + timep + sex + cohort + group + rs759178 + timep*rs759178 16 573.30 638.28 -270.65 541.30 7.13 2 0.028
H0 Z RANdig ˜ age.c + (1|fam) + (1 + age.c|id) + timep + sex + cohort + group 14 1009.63 1071.14 -490.81 981.63
H1 Z RANdig ˜ age.c + (1|fam) + (1 + age.c|id) + timep + sex + cohort + group + rs2038137 15 1005.13 1071.04 -487.57 975.13 6.50 1 0.011
H0 Z RANdig ˜ age.c + (1|fam) + (1 + age.c|id) + timep + sex + cohort + group 14 997.56 1058.91 -484.78 969.56
H1 Z RANdig ˜ age.c + (1|fam) + (1 + age.c|id) + timep + sex + cohort + group + rs761100 15 992.63 1058.36 -481.32 962.63 6.93 1 0.009
H0 Z NWR ˜ age.c +(1|fam) + sex + cohort + group 8 443.44 467.99 -213.72 427.44
H1 Z NWR ˜ age.c +(1|fam) + sex + cohort + group + rs17236239 9 439.06 466.68 -210.53 421.06 6.38 1 0.01
Table 3.S3: Likelihood ratio test between nested mixed models for the SNPs and timepoint*SNP terms that are nominally signi�cant.

Supplementaryinformation
97
Haplotype analyses
Time-points BG2 EG2 MG3 G6
Haplotype N β R2
P N β R2
P N β R2
P N β R2
P
rs2038137|rs761100 11 146 0.387 0.075 8.47e-04 149 0.312 0.046 0.008 150 0.304 0.045 9.47e-03 108 0.255 0.031 0.068
rs2038137|rs761100 12 146 -0.234 0.008 0.300 149 -0.005 3.38e-06 0.982 150 1.76e-03 4.16e-07 0.994 108 0.042 2.35e-04 0.875
rs2038137|rs761100 22 146 -0.337 0.054 0.005 149 -0.325 0.048 0.007 150 -0.316 0.047 8.05e-04 108 -0.265 0.034 0.057
Table 3.S4: Haplotype analyses of rs2038137-rs761100 for Rapid Naming Digits per time-point.
Conditional analyses
BG2 EG2 MG3 G6
SNPtest SNPcov N β P N β P N β P N β P
rs2038137 rs761100 158 -0.135 0.530 161 -0.228 0.288 162 -0.275 0.203 111 -0.186 0.489
rs761100 rs2038137 158 -0.230 0.264 161 -0.111 0.588 162 -0.063 0.762 111 -0.095 0.723
Table 3.S5: Conditional association of RAN digits with rs761100 and rs2038137 from PLINK.
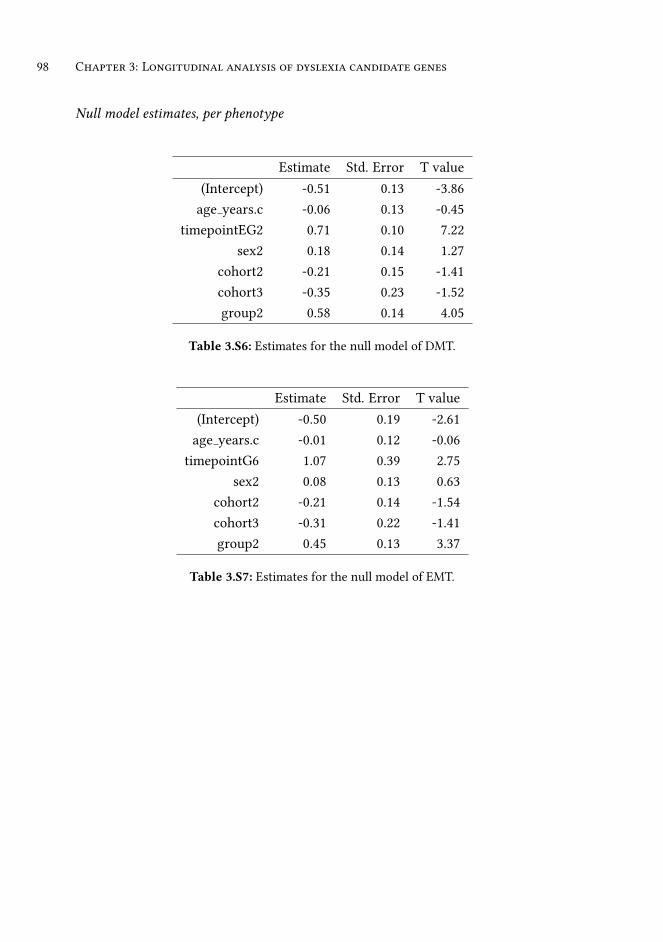
98 Chapter 3: Longitudinal analysis of dyslexia candidate genes
Null model estimates, per phenotype
Estimate Std. Error T value
(Intercept) -0.51 0.13 -3.86
age years.c -0.06 0.13 -0.45
timepointEG2 0.71 0.10 7.22
sex2 0.18 0.14 1.27
cohort2 -0.21 0.15 -1.41
cohort3 -0.35 0.23 -1.52
group2 0.58 0.14 4.05
Table 3.S6: Estimates for the null model of DMT.
Estimate Std. Error T value
(Intercept) -0.50 0.19 -2.61
age years.c -0.01 0.12 -0.06
timepointG6 1.07 0.39 2.75
sex2 0.08 0.13 0.63
cohort2 -0.21 0.14 -1.54
cohort3 -0.31 0.22 -1.41
group2 0.45 0.13 3.37
Table 3.S7: Estimates for the null model of EMT.

Supplementary information 99
Estimate Std. Error T value
(Intercept) -0.43 0.10 -4.19
age years.c -0.01 0.09 -0.14
timepointMG3 0.27 0.07 3.72
timepointG6 1.47 0.35 4.17
sex2 0.00 0.11 0.02
cohort2 -0.32 0.11 -2.84
cohort3 -0.36 0.18 -2.04
group2 0.41 0.11 3.71
Table 3.S8: Estimates for the null model of Klepel.
Estimate Std. Error T value
(Intercept) -0.16 0.30 -0.53
age years.c -0.07 0.22 -0.33
sex2 0.18 0.15 1.22
cohort2 -0.06 0.16 -0.40
cohort3 -0.05 0.23 -0.22
group2 0.58 0.16 3.63
Table 3.S9: Estimates for the null model of NWR.
Estimate Std. Error T value
(Intercept) -0.24 0.13 -1.88
age years.c -0.16 0.14 -1.08
timepointEG2 -0.15 0.12 -1.29
timepointMG3 0.34 0.22 1.55
sex2 0.28 0.13 2.07
cohort2 -0.17 0.14 -1.22
cohort3 -0.36 0.22 -1.62
group2 0.68 0.14 4.98
Table 3.S10: Estimates for the null model of PDtot.

100 Chapter 3: Longitudinal analysis of dyslexia candidate genes
Estimate Std. Error T value
(Intercept) -0.63 0.10 -6.41
age years.c 0.07 0.09 0.74
timepointEG2 0.21 0.08 2.75
timepointMG3 0.71 0.14 4.98
timepointG6 1.49 0.44 3.43
sex2 -0.05 0.10 -0.47
cohort2 -0.10 0.11 -0.96
cohort3 0.06 0.17 0.36
group2 0.12 0.10 1.12
Table 3.S11: Estimates for the null model of RANdig

Supplementary information 101
Full model estimates
Estimate Std. Error T value
(Intercept) -0.90 0.27 -3.37
age years.c 0.02 0.12 0.13
timepointG6 0.99 0.39 2.53
sex2 0.07 0.13 0.50
cohort2 -0.22 0.14 -1.59
cohort3 -0.28 0.22 -1.24
group2 0.46 0.14 3.40
rs6935076 0.22 0.10 2.18
Table 3.S12: Estimates for the full model of EMT rs6935076.
Estimate Std. Error T value
(Intercept) -0.55 0.22 -2.45
age years.c 0.00 0.09 0.01
timepointMG3 0.44 0.11 4.20
timepointG6 1.37 0.38 3.59
sex2 0.00 0.11 0.02
cohort2 -0.32 0.11 -2.78
cohort3 -0.37 0.18 -2.00
group2 0.41 0.11 3.67
rs759178 0.05 0.08 0.60
timepointMG3:rs759178 -0.08 0.04 -2.23
timepointG6:rs759178 0.02 0.07 0.33
Table 3.S13: Estimates for the full model of Klepel timepoint*rs759178 interaction.

102 Chapter 3: Longitudinal analysis of dyslexia candidate genes
Estimate Std. Error T value
(Intercept) -0.52 0.34 -1.52
age years.c -0.13 0.22 -0.59
sex2 0.19 0.15 1.27
cohort2 -0.10 0.16 -0.61
cohort3 -0.19 0.23 -0.82
group2 0.53 0.16 3.25
rs17236239 0.29 0.12 2.49
Table 3.S14: Estimates for the full model of NWR rs17236239.
Estimate Std. Error T value
(Intercept) -0.28 0.17 -1.68
age years.c 0.10 0.09 1.05
timepointEG2 0.19 0.08 2.48
timepointMG3 0.67 0.14 4.69
timepointG6 1.36 0.43 3.13
sex2 -0.03 0.10 -0.30
cohort2 -0.14 0.11 -1.27
cohort3 0.05 0.17 0.27
group2 0.13 0.10 1.24
rs2038137 -0.19 0.07 -2.53
Table 3.S15: Estimates for the full model of RANdig rs2038137.

Supplementary information 103
Estimate Std. Error T value
(Intercept) -0.23 0.18 -1.29
age years.c 0.08 0.09 0.89
timepointEG2 0.20 0.08 2.58
timepointMG3 0.69 0.14 4.75
timepointG6 1.42 0.44 3.24
sex2 -0.05 0.10 -0.45
cohort2 -0.14 0.11 -1.30
cohort3 0.03 0.17 0.16
group2 0.12 0.10 1.14
rs761100 -0.19 0.07 -2.61
Table 3.S16: Estimates for the full model of RANdig rs761100.


4
E VA L UAT I O N O F R E S U L T S F R O M G E N O M E -W I D E S T U D I E S O F
L A N G UA G E A N D R E A D I N G I N A N O V E L I N D E P E N D E N T
D ATA S E T
Recent genome wide association scans (GWAS) for reading and language abilities
have pin-pointed promising new candidate loci. However, the potential contribu-
tions of these loci remain to be validated. In the present study, we tested 17 of the
most signi�cantly associated single nucleotide polymorphisms (SNPs) from these
GWAS studies (p < 10-6
in the original studies) in a new independent population
dataset from the Netherlands: known as FIOLA (Familial In�uences On Literacy
Abilities). �is dataset comprised 483 children from 307 nuclear families, plus 505
adults (including parents of participating children), and provided adequate statistical
power to detect the e�ects that were previously reported. �e following measures
of reading and language performance were collected: word reading �uency, non-
word reading �uency, phonological awareness, and rapid automatized naming. Two
SNPs (rs12636438, rs7187223) were associated with performance in multivariate and
univariate testing, but these did not remain signi�cant a�er correction for multiple
testing. Another SNP (rs482700) was only nominally associated in the multivariate
test. For the rest of the SNPs we did not �nd supportive evidence of association. �e
�ndings may re�ect di�erences between our study and the previous investigations
in respects such as the language of testing, the exact tests used, and the recruitment
criteria. Alternatively, most of the prior reported associations may have been false
positives. A larger scale GWAS meta-analysis than those previously performed will
�is chapter has been published as:
Carrion-Castillo, A., van Bergen, E., Vino, A., van Zuijen, T., de Jong, P. F., Francks, C., & Fisher, S. E.
(2016). Evaluation of results from genome-wide studies of language and reading in a novel independent
dataset. Genes Brain Behav., 15(6), 531-541. doi:10.1111/gbb.12299
105

106 chapter 4: evaluation of new language and reading candidate snps
likely be required to obtain robust insights into the genomic architecture underlying
reading and language.
Keywords: reading, language, association study, candidate SNPs

4.1 introduction 107
4.1 introduction
It is well known that reading abilities have a genetic component, with reported her-
itability estimates ranging from 30% for a discriminant score of reading ability (De-
Fries et al., 1987) to 73% for word reading and 49% for reading comprehension in a
recent meta-analysis (de Zeeuw et al., 2015). Until the last 2-3 years most research on
the genetics of reading ability and disability (developmental dyslexia) was focused on
candidate genes (e.g. ROBO1, KIAA0319, DCDC2 and DYX1C1) that were o�en identi-
�ed through linkage analysis followed by �ne-mapping association studies. Several
candidate associations were reported, and some of these have shown further support-
ive evidence in independent samples (reviewed in e.g. (Carrion-Castillo et al., 2013)).
However, there is also a considerable lack of consistency across studies (Zhong et al.,
2013; Zou et al., 2012; Tran et al., 2013; Becker et al., 2014), which has hindered e�orts
to precisely de�ne the role of any speci�c variant in a�ecting the neurobiological ba-
sis of reading (Carrion-Castillo et al., 2013).
More recently, several genome-wide association scan (GWAS) studies have tried
to identify common genetic variants that in�uence language and reading abilities,
without prior hypotheses with regard to speci�c candidate genes or regions of the
genome (Luciano et al., 2013; Harlaar et al., 2014; Gialluisi et al., 2014; Eicher et al.,
2013; Field et al., 2013; Nudel et al., 2014). �is new wave of research for the �eld
queries the whole genome for association in a relatively unbiased manner, which is
appropriate for phenotypes when the vast majority of the underlying genetic archi-
tecture is unknown. An important consideration for this approach is that, ideally,
dataset sizes must be in the order of thousands of participants or more, in order to
detect the small e�ect sizes that are expected for individual polymorphisms, and in
the context of a high degree of statistical correction for multiple testing over millions
of genetic variants (Visscher et al., 2012).
GWAS studies of reading and language performed so far have been based on a
range of di�erent designs and approaches. �ey have included cohorts ascertained
through disorder (e.g. dyslexia or Speci�c Language Impairment (SLI)) or sampled
from the general population. Such cohorts have been tested for association of SNPs
with either a categorically-de�ned a�ection status or else with quantitative measures
of performance for an array of reading/language-related skills. Here, we brie�y sum-
marize �ndings of the relevant GWAS reports published prior to October 2014, upon
which we based the present study (see also Table 4.1).

108 chapter 4: evaluation of new language and reading candidate snps
Field et al. (2013) tested for association with a trait de�ned as ’phonological coding
dyslexia’ in a family-based sample (n=718, with 400 cases from 101 families), using
the Transmission Disequilibrium Test (TDT) to screen ∼ 133,000 markers from the
genome. A SNP within 5q35.1 (77kb downstream of FGF18) was associated with
dyslexia status at a borderline-level of signi�cance when considered against genome-
wide multiple testing thresholds.
Eicher et al. (2013) performed case-control genome-wide association analyses with
three di�erent a�ection statuses for reading and language disorders de�ned from a
general population sample of 4,291 children, the ALSPAC (Avon Longitudinal Study
of Parents and their Children) cohort. Available quantitative traits were �rst used
to de�ne cases of reading disability (n=353), language impairment (n=163), as well
as comorbid cases showing both reading and language de�cits (n=174). Case-control
analyses were then performed to evaluate associations of variants across the genome.
Suggestive associations were found at several loci (3p24.4, 4q26, and within the
COL4A2 gene on 13q34), some of which could be tentatively linked to variation in
brain white ma�er tracts in follow-up analysis of Di�usion Tensor Imaging (DTI)
data in a separate sample of 332 healthy participants.
In another case-control GWAS study, Nudel et al. (2014) investigated a family-
based sample recruited on the basis of probands with an SLI diagnosis; the SLI Con-
sortium (SLIC) cohort, including 297 cases from 278 nuclear families. As well as
using standard association analyses, the study tested for parent-of-origin e�ects and
found two paternal e�ects; a signi�cant association for a locus on 7p14.1, and a sug-
gestive association within the NOP9 gene on 14q11.2. For maternal parent-of-origin
analyses they identi�ed a suggestive association in the 5p13.1 region.
Moving away from case-control designs, Gialluisi et al. (2014) tested for pleiotropic
e�ects of common genetic variants by carrying out GWAS meta-analysis of quantita-
tive data from three di�erent cohorts enriched for participants with reading/language
disorders: the SLIC families, a UK-reading disability (UK-RD) dataset, and the Col-
orado Learning Disability Research Center (CLDRC) dataset (total n=1,862). �e
available quantitative traits variously included spelling, word reading, nonword read-
ing, nonword repetition, phonological awareness, expressive and receptive language
scores, and these were used to derive �rst principal components in each dataset. �e
GWAS meta-analysis identi�ed two loci showing suggestive associations with the
principal component, one within 7q32.1 (˜10kb upstream of FLNC) and the other on
22q12.3 within the RBFOX2 gene.

4.1 introduction 109
Several GWAS studies have focused on normal variation in reading and language
in epidemiological cohorts. Luciano et al. (2013) meta-analysed GWAS results based
on various quantitative traits in two general population cohorts, ALSPAC (maxi-
mum n=5,472) and the Brisbane Adolescent Twin Sample (BATS; n=1,177 from 538
families). �ey reported suggestive associations with a compound score of reading
and spelling (19p13.3 within DAZAP1), word reading (1p13.1, 16q22.2 and 19p13.3)
and nonword repetition (16q23.2, and 21q11.2 within ABCC13). A subsequent study
tested for association with a composite score of receptive language measures at 12-
years old in the UK Twins Early Development Study (TEDS) (Harlaar et al., 2014).
Suggestive associations were identi�ed within 2q31.2 in a primary discovery sample
(n=2,329), but did not show any evidence of association in replication samples (total
n= 2,639).
Finally, St Pourcain et al. (2014) focused on expressive vocabulary at an early age
(15-18 months, n= 8,889) and later age (24-30 months, n=10,819) in four general pop-
ulation datasets: ALSPAC, TEDS, the Dutch Generation R cohort, and Western Aus-
tralian Pregnancy Cohort (Raine) Study. One SNP within 3p12.3 (˜19kb downstream
of the ROBO2 gene) was signi�cantly associated with early expressive vocabulary
in GWAS meta-analysis. �is SNP is roughly 1 megabase from the dyslexia suscep-
tibility locus DYX5 (where the dyslexia candidate gene ROBO1 lies; which is also a
paralogue of ROBO2). Other SNPs were reported as suggestively associated in chro-
mosomal bands 11p15.2, 12q15 and 19p13.3.
�e sample sizes used for most of these studies of reading and language abilities
are below what is optimal for GWAS of highly polygenic human traits, with the pos-
sible exception of two of the reports (Luciano et al., 2013; St Pourcain et al., 2014).
Most of the reported top �ndings are statistically ‘suggestive’, and all remain to be
validated in other independent samples, although they provide promising new can-
didate genes that could potentially play roles in the neurobiology of language and
reading.
For the present study we have tested the most signi�cantly associated SNPs from
the above GWAS studies, targeting those that have shown association p < 10-6
in
the original reports. �rough direct genotyping of the key SNPs, we a�empted to
�nd supportive evidence in a new Dutch general population sample in which there
are several reading-related quantitative traits available, known as the FIOLA (Fa-
milial In�uences On Literacy Abilities) dataset. While not all of the GWAS stud-
ies used datasets that are independent of one another, all of the top associations

110 chapter 4: evaluation of new language and reading candidate snps
were study-speci�c. �e GWAS studies encompassed a broad range of phenotypic
traits, including some measures, like expressive vocabulary (St Pourcain et al., 2014)
and receptive language ability (Harlaar et al., 2014), which are not available in FI-
OLA. However, there is abundant evidence that reading and language performance
measures have partly overlapping genetic contributions (Newbury et al., 2011; Lu-
ciano et al., 2013; Gialluisi et al., 2014). Several studies show evidence supporting the
hypothesis that vocabulary size at di�erent ages predicts later reading ability (van
Bergen et al., 2014; Du� et al., 2015). A study of Dutch children with and without
risk for dyslexia found that expressive vocabulary at 4.5 years is correlated (r=0.26)
with reading scores at age 8 (van Bergen et al., 2014). Similarly, Du� et al. (2015)
et al found that a latent variable comprising expressive and receptive vocabulary
at 16-24 months predicts school-age (age range: 4-9 years) phonological awareness,
reading accuracy and reading comprehension in a British sample (accounting for 4%
of the variance in phonological awareness, 11% in reading accuracy and 18% in read-
ing comprehension). Furthermore, these phenotypic relationships are supported by
correlations at the genetic level as well, since twin studies have shown that genetic
factors account for part of the correlation between language pro�ciency and later
reading ability (Harlaar et al., 2008; Hayiou-�omas et al., 2010).
�erefore, it was reasonable to use FIOLA to test all top associations from the
GWAS studies, whether or not a given SNP had been originally reported to asso-
ciate with a trait for which there was a matching measure available in the FIOLA
dataset. Note that our goal was not strict replication, for which identical measures
and recruitment strategies should be used across datasets. Rather, we aimed to test
for supportive evidence that might help to validate any of the GWAS �ndings, and
extend our understanding of them with respect to pleiotropy across measures of
reading and language performance.

4.1
introduction
111
Reference Design Samples Trait Age (years) Study Type Totalmax Casesmax
Field et al. (2013) GWAS Dys-Canada Phonological coding
dyslexia
8-18 Case-Control 718 400
Eicher et al. (2013) GWAS ALSPAC Dyslexia 7-9 Case-Control 4291 353
Eicher et al. (2013) GWAS ALSPAC SLI 7-9 Case-Control 4291 163
Eicher et al. (2013) GWAS ALSPAC Dyslexia/SLI 7-9 Case-Control 4291 174
Nudel et al. (2014) GWAS: ba-
sic, maternal,
paternal
SLIC SLI 8-19 Case-Control - 297
Gialluisi et al. (2014) GWASMA SLIC + UK-RD +
CLDRC
Principal Component of
Reading and Language
5-19; 5-31;8-19 �antitative 1862 -
Luciano et al. (2013) GWASMA ALSPAC + BATS Word Reading 8-9;12-25 �antitative 6189 -
Luciano et al. (2013) GWASMA ALSPAC + BATS Nonword Reading 8-9;12-25 �antitative 6182 -
Luciano et al. (2013) GWASMA ALSPAC + BATS Reading and spelling mea-
sure
8-9;12-25 �antitative 6182 -
Luciano et al. (2013) GWASMA ALSPAC + BATS Nonword Repetition 8-9;12-25 �antitative 6583 -
Harlaar et al. (2014) GWAS TEDS Receptive Language Com-
posite Score
12 �antitative 2329 -
St Pourcain et al. (2014) GWASMA ALSPAC + GenR Expressive vocabulary CDI 1.25-1.5 �antitative 8889 -
St Pourcain et al. (2014) GWASMA ALSPAC + GenR +
Raine + TEDS
Expressive vocabulary CDI 2-2.5 �antitative 10819 -
Table 4.1: Summary of genome wide association studies of language and reading traits published until October 2014, which provided
the basis for selection of SNPs in the current study. Age range is speci�ed per sample if it di�ers between the datasets included in
each study.

112 chapter 4: evaluation of new language and reading candidate snps
4.2 methods
4.2.1 Sample
�e Familial In�uences On Literacy Abilities (FIOLA) project consists of a general
population, family-based, Dutch sample that has been assessed with reading-related
tests (van Bergen et al., 2015). Families that visited the Amsterdam Science Museum
NEMO were invited to take part. �is research is part of Science Live, the innovative
research programme of Science Museum NEMO that enables scientists to carry out
real, publishable, peer-reviewed research using NEMO visitors as volunteers. �e
museum o�ered quiet rooms for one-to-one testing. Ethical approval for this study
was provided by the University of Amsterdam ethics commi�ee, �le number 2011-
OWI-1882, and wri�en informed consent of the participants (or their parents) was
obtained. Two indicators of sample representativeness for the general population
were evaluated: �e level of education of the parents was 0.49 SD above the national
average, and children’s reading scores were 0.40 SD above the national average (van
Bergen et al., 2015).
For the current study only individuals of European descent were included, in order
to reduce the possible impact of genetic strati�cation (ancestry was assessed using
an ethnicity questionnaire which queried as far back as the four grandparents and 60
individuals were excluded as a result). Other inclusion criteria were that participants
had Dutch as their �rst language (no exclusion based on second language learning),
and had a�ended Dutch primary education.
Our primary analysis was conducted on children, i.e. participants aged less than
200 months (16.6 years), because the previous GWAS studies have been carried out
on children and teenagers (see Table 4.1), and genetic e�ects on reading and lan-
guage performance may be partially age-dependent, targeting speci�c developmen-
tal stages (St Pourcain et al., 2014). In total, there were 483 children from 307 indepen-
dent families, which comprised 149 singletons, 140 sibships for which two siblings
were available, and 18 sibships for which 3 children were available. �e minimum
age was 6 years, Mean age=10.06 years, SD=1.97 years.
As a secondary step, we separately analysed all of the unrelated adults available
(n=505, aged 33 to 68 years, Mean=43.27 years, SD=4.58 years), which included par-
ents of the children (when available) plus 50 other unrelated individuals that had
been tested at their homes using the same measures, including parallel form tests to

4.2 methods 113
compute parallel form reliability. �e inclusion of parents meant that this analysis
was not entirely statistically independent from the analysis of children, but provided
a useful complementary analysis available in this dataset. While programs do exist
to analyze the child and parent information all together, we were unaware of an op-
tion that would do this in a multivariate context, to support simultaneous association
analysis with multiple phenotypic measures (see below). Possible age-dependence
of genetic e�ects on language-related traits also supports an approach of analyzing
adults separately from children.
4.2.2 Traits of interest
�e traits of interest for this study were reading �uency of words and nonwords,
phonological awareness (PA), and serial rapid automatized naming (RAN). �ese are
well-established indices of reading ability and related cognitive performance (Lan-
derl et al., 2013; van der Leij et al., 2013). Phonological awareness and rapid naming
are correlated with reading ability, and may each be linked to independent fractions
of the variance in reading performance . Both have o�en been included in previous
studies of the genetics of dyslexia and reading (e.g. (Rubenstein et al., 2014; Francks
et al., 2004)).
Word reading �uency was assessed using the One-Minute-Test (in Dutch, Een-
Minuut-Test or EMT), (Brus and Voeten, 1972), and nonword reading �uency was
assessed using the Klepel test (van den Bos et al., 1994). Participants were asked to
correctly read as many (non)words as possible within one minute (word reading) or
two minutes (nonword reading). To avoid a ceiling e�ect in adults, the original lists
were extended, resulting in lists of 145 words or non-words (van Bergen et al., 2015).
PA was measured with a phoneme deletion task (van Bergen et al., 2015). For
each test item a phoneme (always a consonant) had to be deleted from a nonword,
resulting in another nonword. Accuracy and speed were combined into a �uency
measure.
RAN was measured by naming a matrix of 50 digits as quickly as possible (van den
Bos, 2003). �e time to completion was transformed to the number of digits per
second, to normalize the score distribution.

114
chapter4:evaluationofnew
languageandreadingcandidatesnps
FIOLA dataset
1020 European descent individuals351 independent families
Children: 483 , 307 families
Adults: 505, unrelated
Word Reading FluencyNonword Reading FluencyPhoneme AwarenessRapid Naming
Traits
Data
GWASes on reading and language Table 4.1
Original study P≤1×10⁻⁶
One SNP per LD block (r2>0.8)
Candidate independent SNPs Table 4.2
Literature
Association analysis
Primary analysis
Follow up analyses
Bonferroni threshold: 0.05/ 17 SNP = 2.9×10 –3
Multivariate association Children Table 4.3
Univariate association Children
PMV<0.05 & LoadingMV>|0.2| Table 4.4
Phenotype matched to original study Table 4.5
Multivariate association Adults Table 4.3
Figure 4.1: FIOLA genetics study design.

4.2 methods 115
�e reliability of all tasks was high. Reliability measures were available from man-
uals for children: parallel form reliabilities for word reading (0.76-0.96) and non-
word reading (0.89-0.95) and split-form and test-retest reliabilities for RAN (0.78-
0.92). Test-retest reliabilities were also estimated in a sample of 66 independent chil-
dren for RAN (0.80) and PA (0.75-0.81) (van Bergen et al., 2015). A subset of 50 adults
from the present sample were tested with parallel forms to estimate reliabilities for
adults, which were 0.96 for word reading, 0.94 for nonword reading and 0.94 for RAN.
Internal consistency for PA in this adult sample had a Cronbach’s α of 0.71-0.89 (for
accuracy and reaction time) (for details and full task descriptions see van Bergen et al.
(2015)). In order to account for the linear and quadratic e�ects of age (in months), age
and age2
were regressed out from the scores of children (age <200 months), and the
standardised residuals were used as trait scores. Scores for adults (age>200 months)
were z-standardised to bring them on the same scale. Extreme values for each trait
were identi�ed as outliers when they were below/above 1.5 times the interquartile
range from the 1st
/ 3rd
quartiles. As a result 15 datapoints from the children’s dataset
were removed (word reading=3, nonword reading=1, PA=6, RAN=5) and 31 from the
adults’ (word reading =7, nonword reading=7, PA=8, RAN=9).
All of the phenotypic traits were normally distributed and signi�cantly correlated
with each other both for children and adults (see Supplementary information and van
Bergen et al. (2015)). �e correlations ranged from moderate (rPA-RAN for children
0.34 and for adults 0.39) to high (rEMT-KL for children 0.84 and for adults 0.68).
All of the phenotypic traits were normally distributed and signi�cantly correlated
with each other both for children and adults (see Supplementary information and van
Bergen et al. (2015)). �e correlations ranged from moderate (rPA−RAN for children
0.34 and for adults 0.39) to high ((rEMT−KL for children 0.84 and for adults 0.68).
4.2.3 Power analysis
Power estimates were performed using the Genetic Power Calculator (Purcell et al.,
2003) , corresponding to univariate association analysis. Power was calculated for
a range of type I error rates (alpha values) and QTL e�ect sizes, given two di�erent
experimental designs that were roughly comparable to analysis of either the children
or the adults from the FIOLA dataset: 1) 240 nuclear families with sibship size of 2,
with both parents genotyped, but with only o�spring phenotyped, 2) 500 unrelated
individuals.

116 chapter 4: evaluation of new language and reading candidate snps
4.2.4 SNP selection and genotyping
From the GWAS studies summarized in Table 4.1, and described in the Introduction,
we selected all SNPs reported to be associated with reading or language traits with
p < 10-6
. We then pruned the candidate variant list to reduce redundancy by select-
ing only one SNP per linkage disequilibrium (LD) block (r2 >0.8, CEU population)
using SNAP (Johnson et al., 2008), which resulted in 20 SNPs as listed in Table 4.2.
SNPs were directly genotyped using the KASP genotyping assay (LGC Ltd., Tedding-
ton, UK). �ree of the SNPs failed at either the assay design or validation phase
(rs59197085, rs5995177 and rs11176749), and were therefore excluded from the study.
As a result, 17 SNPs were included in the present study (Table 4.2).
Mendelian inheritance errors were detected using pedstats (Wigginton and Abeca-
sis, 2005). PLINK v1.07 (Purcell et al., 2007) was used to calculate missing genotype
rates and to test for Hardy-Weinberg disequilibrium. 3 individuals (2 children, 1
adult) with more than 2/17 missing genotypes (missing genotype rate> 12%) were ex-
cluded. �e total genotyping rate in the remaining individuals (nchildren= 481, nadults=
505) was 99.8%, with a missing genotype rate <5% for all the SNPs. All SNPs were
in Hardy-Weinberg equilibrium (p>0.05).
Association analysis
We used multivariate association analysis as our primary means of testing for asso-
ciation of the reading and language traits with each SNP, using the ‘mqfam’ option
of PLINK-multivariate (Ferreira and Purcell, 2009). �is approach was appropriate
given the correlation structure of our traits of interest in both subsets of the dataset
(children and adults, see Supplementary information), and it had the advantage that
only one statistical test was performed per SNP in primary testing, thus reducing
multiple testing (Bonferroni-adjusted signi�cance threshold of p=3*10-3
for 17 SNPs,
α=0.05). �e method �nds the linear combination of a set of correlated measures
which is most strongly associated with the given SNP genotypes. We performed
the multivariate association analysis separately for children and parents. For chil-
dren, 10,000 permutations were used in PLINK-multivariate to account for the family-
based structure of the dataset (including children and parental genotypes when avail-
able), in order to obtain an empirical P value per SNP.

4.2
methods
117
Reference Phenotype SNP Risk Pvalue E�ect Chr Position (bp) MAF Minor Gene Closest Gene
Luciano et al. (2013) WordReading rs4839516 C 3.62e-07 0.08(0.02)b
1 116197828 0.29 A - MAB21L3
Harlaar et al. (2014) Receptive Lang rs12474600 G 4.57e-07 -0.24(0.05)b
2 179020159 0.10 A CCDC141 SESTD1
Eicher et al. (2013) Case control rs12636438 G 5.45e-07 1.81a
3 22021785 0.17 G - ZNF385D-AS2
St Pourcain et al. (2014) Expressive early rs7642482 G 1.3e-08 0.11(0.02)b
3 77668605 0.15 G - ROBO2
Eicher et al. (2013) Case control rs482700 G 1.4e-07 1.83a
4 115146334 0.28 G - NDST4
Nudel et al. (2014) Maternal - SLI rs10447141 G 1.16e-07 2.77a
5 39817065 0.29 T - LINC00603
Field et al. (2013) Case control rs9313548 T 6.2e-07 3.08a
5 171534296 0.45 C - FGF18
Nudel et al. (2014) Paternal - SLI rs7801303 3.51e-07 - 7 40878471 0.42 A - LINC01450
Gialluisi et al. (2014) Principal Component rs59197085 A 3.86e-07 0.001-0.033a
7 128820702 0.09 A CCDC136 FLNC
Harlaar et al. (2014) Receptive Lang rs1326167 T 9.59e-07 0.17(0.04)b
10 90341269 0.25 C - LOC101926942
St Pourcain et al. (2014) Expressive early rs10734234 T 1.9e-07 -0.14(0.03)b
11 15444314 0.10 C - LOC102724957
St Pourcain et al. (2014) Expressive early rs11176749 T 7.2e-07 0.12(0.03)b
12 67459004 0.14 T - LOC100507175
Eicher et al. (2013) Case control rs9521789 C 7.59e-07 1.71a
13 110467273 0.41 C COL4A2 COL4A2-AS1
Nudel et al. (2014) Paternal - SLI rs4280164 G 3.74e-08 3.87a
14 24302079 0.20 A C14orf21 NOP9
Luciano et al. (2013) WordReading rs764255 T 1.8e-07 0.25(0.05)b
16 73679784 0.37 C - LOC100506172
Luciano et al. (2013) NonWordRepetition rs7187223 G 9.9e-08 -0.08(0.02)b
16 82424128 0.04 G - CDH13
St Pourcain et al. (2014) Expressive early rs1654584 G 3.4e-07 0.08(0.02)b
19 3970685 0.22 G DAPK3 EEF2
Luciano et al. (2013) NonWordRepetition rs2192161 G 7.34e-08 0.20(0.04)b
21 14309673 0.07 A - ABCC13
Gialluisi et al. (2014) Principal Component rs5995177 A 5.01e-07 0.006-0.025c
22 35913505 0.07 A RBFOX2 RBFOX2
Gialluisi et al. (2014) Principal Component rs12158565 G 7.57e-07 0.004-0.036c
22 35920795 0.10 G RBFOX2 RBFOX2
Table 4.2: Candidate SNPs from the top hits of the recent GWAS literature on reading and language abilities, ordered by genomic
coordinates. SNPs that failed genotyping assay design are marked in italics. SNP position is given for the human reference hg19.
E�ect sizes are given as:athe odds ratio (OR) for case-control studies and
bβ coe�cient (SE) orc
r2
for the quantitative trait studies.

118 chapter 4: evaluation of new language and reading candidate snps
�e multivariate analysis was followed by testing ‘total’ univariate association
with PLINK 1.07, for 3 SNPs (see below) which showed multivariate p < 0.05 in the
children, in order to explore the evidence for pleiotropy across measures. �e ‘total’
test of association may potentially be a�ected by population strati�cation. �erefore
a population strati�cation test was also performed using the -ap model in QTDT,
which assesses the equivalence of the ‘within-family’ and ‘between-family’ mean
allelic e�ects (Abecasis et al., 2000). Additionally, for two of the SNPs, the FIOLA
dataset contained a particularly closely matched phenotypic measure to that which
showed association in the original GWAS study (see Table 4.2), and therefore uni-
variate association testing was performed for these SNPs using the closest matching
measure, as a relatively direct a�empt at replication.
�e results from the univariate tests for selected SNPs (in Tables 4.4 and 4.5) were
meta-analysed together with together to results from the original studies. �is was
implemented in the programme METAL (h�p://www.sph.umich.edu/csg/abecasis/
Metal/index.html; (Willer et al., 2010)). We chose an approach that does not assume
equivalence of allelic e�ect sizes between datasets, which was appropriate given
the heterogeneity of study recruitment, assessment and trait de�nitions. Put brie�y,
the meta-analysis tested each SNP for a genetic e�ect, across the two contributing
datasets, computing an overall z-score for that SNP determined by the P value, the
direction of the allelic e�ect, and the sample size of each study involved in the meta-
analysis. For the SNPs that had �rst been reported by studies with unequal numbers
of cases and controls, we computed the e�ective sample size as recommended by
Willer et al. (2010). (Ne� =4/(1/cases+1/Nctrls)).
Finally, for three SNPs that had been associated with parent-of-origin SLI transmis-
sion to children in one GWAS study, we modelled the e�ects of maternally and pater-
nally derived alleles separately in a parent-of-origin analysis using QTDT (Abecasis
et al., 2000) with the -ao –of options.
4.3 results
4.3.1 Power analysis
Our study provided power of less than 60% to detect nominally signi�cant results
(α=0.05) for e�ects of 1%, for both the children and parent analysis. However, the
e�ect sizes that were reported in the GWAS papers, for the SNPs we investigated here,

4.3 results 119
ranged from 0.5% to 12% (e.g. rs2192161 explained 3.9% of the variance in the original
study (Luciano et al., 2013)). We had high power to detect e�ects that explain roughly
5% of the phenotypic variance (β>0.80 with α=0.003, i.e. Bonferroni correction for
17 SNPs) and moderate power to detect smaller e�ects (e.g. β ≈ 0.60 for e�ects that
explain 3% of the phenotypic variance, see Figure 4.2). Nevertheless, it is likely that
the e�ect sizes in the GWAS studies where the associations were �rst reported are
overestimates of any real e�ects, due to the winner’s curse (Ioannidis, 2008), and
hence our power to detect these e�ects may be only roughly 60%.
4.3.2 Association analysis
We performed multivariate association analysis �rst in the sample of children and
then in adults, followed by univariate analysis for the SNPs that were nominally
signi�cant in the multivariate analysis for each sample.
Multivariate analysis in the children resulted in three nominally signi�cant asso-
ciations (rs12636438, pemp=0.045; rs482700, pemp =0.047 and rs7187223, pemp =0.020)
(see Table 4.3). �e loadings were >|0.2| for all four phenotypic measures in the
multivariate models for all three SNPs, although for rs482700 word reading �uency
had the opposite direction of e�ect to the rest of the measures. One of these mark-
ers, rs7187223, was the only SNP to show nominally signi�cant association in the
adults, with the highest loading for phoneme awareness (loadingPA>|0.9|, p=0.049,
see Table 4.3). �ese associations did not survive statistical correction for multiple
testing.

120
chapter4:evaluationofnew
languageandreadingcandidatesnps
0.00
0.25
0.50
0.75
1.00
0.01 0.02 0.03 0.04 0.05Additive QTL variance
PW
R
N=240, sibship=2, sibcor=0.4
0.00
0.25
0.50
0.75
1.00
0.01 0.02 0.03 0.04 0.05Additive QTL variance
PW
R
N=500, sibship=1
alpha
1e-04
0.001
0.003
0.01
0.05
Figure 4.2: Power estimation. �e x-axis is the additive proportion a�ributable to the �antitative Trait Locus (range 0-5%). a)
Children, family-based design, b) Adults, unrelated sample design.

4.3 results 121
Univariate analyses were performed for these three SNPs in the children, con�rm-
ing that the putative e�ects of rs12636438 and rs7187223 encompassed several traits.
However, there was no nominally signi�cant univariate association with rs482700.
�e most signi�cant associations with rs12636438 were with nonword reading �u-
ency and rapid naming (pNWRF= 0.01411 and pRAN= 0.02376, see Figure S3). �ere
was also a consistent but non-signi�cant trend of association with word reading �u-
ency. However, the direction of these e�ects in the FIOLA dataset was opposite to
that previously reported: the allele associated with poorer performance was major
allele (A) in our study, but the minor allele (G) was overrepresented in comorbid
cases with LI and dyslexia in the original GWAS study of Eicher et al. (2013). �is
inconsistency in the direction of e�ect was re�ected by the meta-analysed P values
which were all higher than the originally reported one (Table 4.4). In the children,
rs7187223 was nominally associated with rapid naming and there was a trend with
the same direction of e�ect with phoneme awareness (pRAN= 0.03897, pPA= 0.03584).
�e minor allele G was associated with lower performance, which was consistent
with the e�ect reported by Luciano et al. (2013), and re�ected by meta-analysed P
values< 1.4e-08 for RAN and PA (Table 4.4). Because this SNP was nominally signif-
icant in the multivariate analysis of the adults, we tested association with univariate
traits within this sample too, and found that it was also associated with phoneme
awareness (pPA= 0.0026). However, the result on the adults had the opposite direc-
tion of e�ect to that within the children, and also opposite to that previously re-
ported for nonword repetition (Luciano et al., 2013) (see Figure S3). �e tests for
population strati�cation did not show signi�cant di�erences of the between-family
and within-family components of association for any SNP (all p>0.05), suggesting
that population strati�cation was unlikely to be a substantial confounding factor in
the analysis.
Word reading �uency in FIOLA is closely matched to the ‘Word Reading’ pheno-
type from Luciano et al. (2013), and hence we tested association of this trait within
the children with the two SNPs (rs4839516 and rs764255) that were reported in Lu-
ciano et al. (2013). However, we did not �nd supportive evidence for associations
of any of these SNPs with word reading �uency (see Table 4.5). Finally, because
rs7801303, rs4280164 and rs10447141 had been reported to be associated with parent-
of-origin-speci�c transmission to children with SLI (Nudel et al., 2014), we tested for
such e�ects using QTDT for these SNPs and our traits of interest, but there were no
signi�cant parent-of-origin e�ects (p>0.1).

122
chapter4:evaluationofnew
languageandreadingcandidatesnps
Children Adults
SNP Nfam Nind F Loadings: WRF, NWRF, PA, RAN Pemp MAF Nfam Nind F Loadings: WRF, NWRF, PA, RAN P
rs4839516 307 945 1.82 0.104 0.27 481 481 1.31 0.265
rs12474600 307 943 0.13 0.967 0.09 479 479 2.02 0.090
rs12636438 307 945 2.37 0.6044,0.847,0.2881,0.745 0.045 0.20 479 479 0.24 0.916
rs7642482 307 941 0.32 0.856 0.21 479 479 0.92 0.451
rs482700 307 946 2.31 -0.2751,0.21,0.3467,0.3788 0.047 0.26 481 481 0.75 0.560
rs10447141 307 945 1.61 0.144 0.33 481 481 1.28 0.278
rs9313548 307 942 0.42 0.759 0.48 480 480 0.74 0.564
rs7801303 307 945 2.18 0.052 0.44 480 480 0.41 0.800
rs1326167 307 940 0.75 0.507 0.24 481 481 1.94 0.102
rs10734234 307 944 2.01 0.097 0.11 481 481 0.84 0.501
rs9521789 307 944 1.19 0.291 0.40 481 481 0.21 0.935
rs4280164 307 943 0.36 0.822 0.21 481 481 0.27 0.896
rs764255 306 940 0.09 0.982 0.36 480 480 1.36 0.249
rs7187223 307 943 2.40 0.2892,0.2347,0.7195,0.6826 0.020 0.03 481 481 2.41 -0.4112,-0.5619,-0.9859,-0.2483 0.049
rs1654584 307 945 2.13 0.074 0.25 481 481 2.03 0.089
rs2192161 307 940 0.64 0.592 0.06 478 478 1.12 0.348
rs12158565 307 945 0.26 0.891 0.13 481 481 0.51 0.727
Table 4.3: PLINK multivariate association results (total test) from children and adults. Pemp: empirical P values (10,000 permutations).
WRF: word reading �uency, NWRF: nonword reading �uency, PA: phonological awareness, RAN: rapid automatized naming. Load-
ings re�ect the contribution of that trait to the multivariate test, and are only shown when P<0.05. Multiple testing correction for
17 SNPs sets the threshold to 2.9*10-3
.
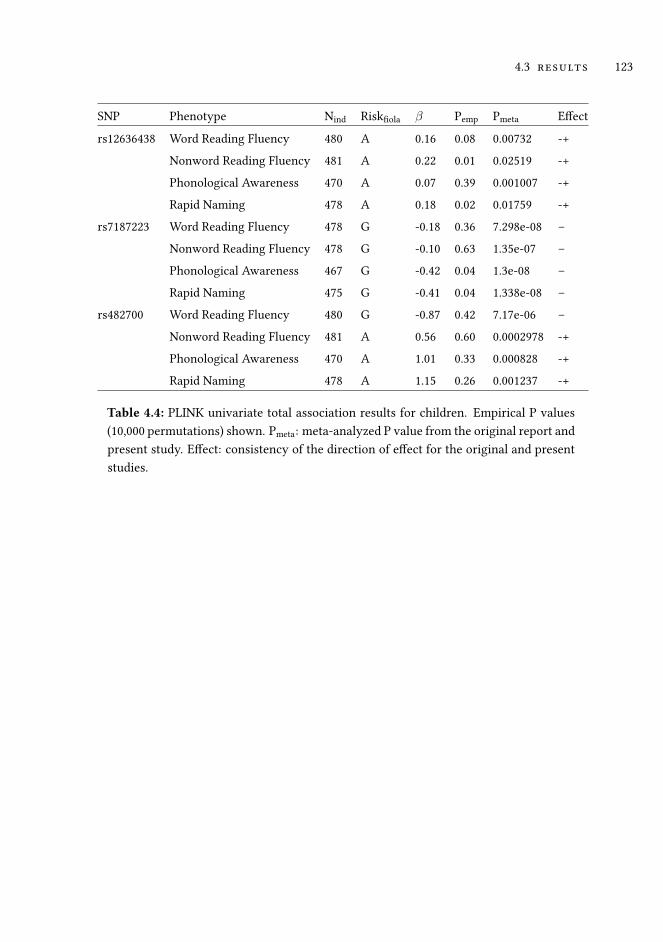
4.3 results 123
SNP Phenotype Nind Risk�ola β Pemp Pmeta E�ect
rs12636438 Word Reading Fluency 480 A 0.16 0.08 0.00732 -+
Nonword Reading Fluency 481 A 0.22 0.01 0.02519 -+
Phonological Awareness 470 A 0.07 0.39 0.001007 -+
Rapid Naming 478 A 0.18 0.02 0.01759 -+
rs7187223 Word Reading Fluency 478 G -0.18 0.36 7.298e-08 –
Nonword Reading Fluency 478 G -0.10 0.63 1.35e-07 –
Phonological Awareness 467 G -0.42 0.04 1.3e-08 –
Rapid Naming 475 G -0.41 0.04 1.338e-08 –
rs482700 Word Reading Fluency 480 G -0.87 0.42 7.17e-06 –
Nonword Reading Fluency 481 A 0.56 0.60 0.0002978 -+
Phonological Awareness 470 A 1.01 0.33 0.000828 -+
Rapid Naming 478 A 1.15 0.26 0.001237 -+
Table 4.4: PLINK univariate total association results for children. Empirical P values
(10,000 permutations) shown. Pmeta: meta-analyzed P value from the original report and
present study. E�ect: consistency of the direction of e�ect for the original and present
studies.

124
chapter4:evaluationofnew
languageandreadingcandidatesnps
SNP Reference Phenotyperef Riskref Phenotype�ola Nind β Pemp Pmeta E�ect
rs4839516 Luciano et al. (2013) Word Reading C Word Reading Fluency 480 -0.104 0.188 4.812e-06 +-
rs764255 Luciano et al. (2013) Word Reading T Word Reading Fluency 477 0.033 0.650 8.507e-07 -+
Table 4.5: PLINK univariate total association results for children, where SNPs and phenotypes matched those of the original report.
Pmeta: meta-analyzed P value from the original report and present study. E�ect: consistency of the direction of e�ect for the original
and present studies.

4.4 discussion 125
4.4 discussion
�e aim of this study was to evaluate the most signi�cant associations from a recent
wave of the �rst GWAS studies of language and reading performance, by testing
for their reported e�ects on reading-related quantitative traits in FIOLA, a new and
independent Dutch dataset from the general population. We adopted an inclusive
criterion for the selection of candidate SNPs, with the primary hypothesis that ge-
netic e�ects might be pleiotropic and shared among several language and reading
traits (Luciano et al., 2013; Gialluisi et al., 2014; Newbury et al., 2011). Seventeen can-
didate SNPs were selected, for which the FIOLA dataset provided su�cient statistical
power to detect most of the previously reported e�ects, although it was underpow-
ered to detect e�ects smaller than 1%. �ree nominally signi�cant associations were
observed in the multivariate analysis of the children, and two of these (rs12636438,
rs7187223) showed consistent signals in univariate analysis.
�e association of rs12636438 loaded on all four traits, but more strongly on non-
word reading �uency and rapid naming, with the major allele A being associated with
lower performance in both cases. �is SNP lies within the ZNF385D gene, which
codes for a zinc �nger protein that may act as a transcriptional regulator (Eicher
et al., 2013). However, Eicher et al. (2013) found that the minor allele (G) of this
SNP was overrepresented in comorbid cases of SLI and dyslexia, as well as associ-
ated with lower scores on a measure of receptive vocabulary (Picture Vocabulary
Test) in a follow up sample. �us, our �ndings show an opposite direction of e�ect
to the original study. �e incongruence of the allelic direction might be due to the
di�erent genetic backgrounds of the populations analysed. �e haplotype structure
in a region can di�er between populations, changing the LD pa�ern between the
tag SNP (where the association is detected) and the causal SNP that is driving the
association, which is as yet unknown. Such factors could in principle lead to con-
trasting directions of e�ect of the same tag SNP in di�erent studies when substantial
population strati�cation is present (Lin et al., 2007), a phenomenon that has been
suggested to potentially explain previous inconsistencies in the literature of the ge-
netics of reading (Luciano et al., 2013; Gialluisi et al., 2014). It is di�cult to evaluate
this hypothesis without genome-wide information to assess the genetic homogene-
ity of all the samples (only directly genotyped SNP information is currently available
for FIOLA). Despite the fact that only individuals of European descent were included
in the analysis, di�erent LD pa�erns between our sample and the ALSPAC sample

126 chapter 4: evaluation of new language and reading candidate snps
may account for the contrasting result for rs12636438. Alternatively, it might re�ect
type I error, representing a false positive. Eicher et al. (2013) also looked at the re-
lationship of rs12636438 and white ma�er volumes and reported association with
volumes of several DTI �ber tracts that are important for reading and language (the
inferior longitudinal fasiculus, the inferior fronto-occipto fasiculus and the temporal
superior longitudinal fasiculus). Of note, FIOLA did not involve any neuroimaging
of participants, so we are unable to evaluate the reliability of those �ndings in the
current study.
We found that rs7187223 was nominally associated with rapid naming and phono-
logical awareness in the univariate analysis of children. �e minor allele (G) was
associated with lower performance in both cases, supporting the original associa-
tion by Luciano et al. (2013) that reported that this allele was associated with lower
nonword repetition scores. Rs7187223 was also the only SNP that was nominally
signi�cant for the multivariate analysis in the sample of unrelated adults. �is e�ect
loaded most strongly on phoneme awareness, which was also re�ected by the uni-
variate association with this trait. Surprisingly, the association in the adults had the
opposite direction of e�ect to that on children, with the major allele (A) being asso-
ciated with lower performance. Haplotype structure di�erences as discussed above
cannot be responsible for this contrasting e�ect, since we are comparing two subsets
of the same population. �e main di�erence between the children and adult subsam-
ples was obviously their age. �ere is some evidence suggesting that age-varying
e�ects may also contribute to di�erences in allelic e�ects (Lasky-Su et al., 2008), and
a longitudinal study found that a SNP in the DYX1C1 dyslexia candidate gene is asso-
ciated with children’s orthographic judgments at ages 7 and 8, but not at age 6 (Zhang
et al., 2012). Moreover, in the GWAS study of St Pourcain et al. (2014), an association
of expressive vocabulary with rs7642482, near to ROBO2 was also age-dependent
(St Pourcain et al., 2014): it was genome-wide signi�cant for an early developmental
stage (15-18 months) but showed no evidence of association for a similar measure a
few months later (24-30 months). Nevertheless, because language and reading acqui-
sition are developmental processes, most of the studies that look at genetic e�ects on
these traits tend to focus on datasets consisting of children (see Table 4.1), and there
is very li�le known about the stability of genetic e�ects over time into adulthood.
Alternatively, it is also possible that the opposite allelic e�ect between children and
adults could be due to di�erences underlying the measured trait. Despite the fact
that the same phoneme deletion task was used to measure PA in both samples, the

4.4 discussion 127
across-age invariance of this measurement has not been tested. Taken together, our
results for rs7187223 do not provide compelling evidence to support the previously
reported association.
Since one of the reading measures available for the FIOLA dataset (i.e. word read-
ing �uency) was conceptually similar to some reported by Luciano et al. (2013), we
speci�cally a�empted to replicate their top hits with word reading (rs4839516 and
rs764255), using univariate association tests. However, we did not replicate these as-
sociations. Similarly, we did not �nd any parental e�ect on the SNPs that had been
reported to be associated with parent-of-origin transmission in relation to SLI (Nudel
et al., 2014).
To our knowledge, this has been the �rst a�empt to independently and system-
atically assess the results of recent GWAS reports for language and reading traits.
We were only able to �nd limited support for three of the SNPs that had been pre-
viously associated with reading and language related traits in these GWAS studies.
�e associations with the other SNPs were not supported in our study. However,
this does not translate into a complete rejection of these SNPs as potentially rel-
evant, given the range of the studies that we have considered when selecting the
SNPs, and the between-study heterogeneity of the measures even in the cases where
similar phenotypes were available (e.g. word reading accuracy versus word reading
�uency). �e FIOLA dataset was ascertained in an unconventional manner through
a public venue. �is is an advantageous set-up to test large numbers of individu-
als and has the potential to contribute to the ascertainment of large cohorts in the
future. However, the FIOLA dataset is not entirely representative of the Dutch pop-
ulation: it is biased towards a higher-than-average educational level for adults (0.49
SD above the average), and towards higher-than-average word reading scores for
children (0.4 SD above national norms) (van Bergen et al., 2015). Moreover, there is
a small but signi�cant correlation of the spousal reading ability (0.16, p=0.019, (van
Bergen et al., 2015)), which may indicate assortative mating. Environmental factors
such as parental education and socio-economic status have been suggested to moder-
ate genetic in�uences on reading disabilities, in terms of both heritability estimates
and single SNP e�ects (Friend et al., 2008; Maschere�i et al., 2013). Hence, non-
random sampling from the population, as is apparently the case for FIOLA, adds yet
another potential source of heterogeneity across di�erent datasets and studies. IQ,
which correlates phenotypically and genetically with educational a�ainment, should
also be considered (Davies et al., 2016). Several of the GWAS studies have adjusted

128 chapter 4: evaluation of new language and reading candidate snps
their reading-related measures for IQ prior to genetic association testing (Gialluisi
et al., 2014; Luciano et al., 2013), and one showed that some association signals are
sensitive to this manipulation (Gialluisi et al., 2014). In other words, some genetic ef-
fects may be more pleiotropic for reading-related cognition and IQ than others. �e
previously reported GWAS results remain to be further studied in other samples, and
ideally meta-analysed across all available samples together, while accounting for the
issues addressed in the present study.

References 129
references
Abecasis GR, Cardon LR, Cookson WO (2000) A general test of association for quan-
titative traits in nuclear families. Am J Hum Genet 66: 279–292.
Becker J, Czamara D, Scerri TS, Ramus F, Csepe V, et al. (2014) Genetic analysis of
dyslexia candidate genes in the European cross-linguistic NeuroDys cohort. Eur J
Hum Genet 22: 675–680.
Brus BT, Voeten MJM (1972) Een-minuut-test [one-minute-test]. Swets & Zeitlinger.
Carrion-Castillo A, Franke B, Fisher SE (2013) Molecular genetics of dyslexia: an
overview. Dyslexia 19: 214–240.
Davies G, Marioni RE, Liewald DC, Hill WD, Hagenaars SP, et al. (2016) Genome-
wide association study of cognitive functions and educational a�ainment in UK
Biobank (N=112 151). Mol Psychiatry .
de Zeeuw EL, de Geus EJ, Boomsma DI (2015) Meta-analysis of twin studies high-
lights the importance of genetic variation in primary school educational achieve-
ment. Trends in Neuroscience and Education pp. –, URL h�p://www.sciencedirect.
com/science/article/pii/S2211949315000198.
DeFries JC, Fulker DW, LaBuda MC (1987) Evidence for a genetic aetiology in reading
disability of twins. Nature 329: 537–539.
Du� FJ, Reen G, Plunke� K, Nation K (2015) Do infant vocabulary skills predict
school-age language and literacy outcomes? J Child Psychol Psychiatry 56: 848–
856.
Eicher JD, Powers NR, Miller LL, Akshoomo� N, Amaral DG, et al. (2013) Genome-
wide association study of shared components of reading disability and language
impairment. Genes Brain Behav 12: 792–801.
Ferreira MA, Purcell SM (2009) A multivariate test of association. Bioinformatics 25:
132–133.
Field LL, Shumansky K, Ryan J, Truong D, Swiergala E, et al. (2013) Dense-map
genome scan for dyslexia supports loci at 4q13, 16p12, 17q22; suggests novel locus
at 7q36. Genes Brain Behav 12: 56–69.
Francks C, Paracchini S, Smith SD, Richardson AJ, Scerri TS, et al. (2004) A 77-
kilobase region of chromosome 6p22.2 is associated with dyslexia in families from
the United Kingdom and from the United States. Am J Hum Genet 75: 1046–1058.
Friend A, DeFries JC, Olson RK (2008) Parental education moderates genetic in�u-
ences on reading disability. Psychol Sci 19: 1124–1130.

130 chapter 4: evaluation of new language and reading candidate snps
Gialluisi A, Newbury DF, Wilcu� EG, Olson RK, DeFries JC, et al. (2014) Genome-
wide screening for DNA variants associated with reading and language traits.
Genes Brain Behav 13: 686–701.
Harlaar N, Hayiou-�omas ME, Dale PS, Plomin R (2008) Why do preschool language
abilities correlate with later reading? A twin study. J Speech Lang Hear Res 51:
688–705.
Harlaar N, Meaburn EL, Hayiou-�omas ME, Davis OS, Docherty S, et al. (2014)
Genome-wide association study of receptive language ability of 12-year-olds. J
Speech Lang Hear Res 57: 96–105.
Hayiou-�omas ME, Harlaar N, Dale PS, Plomin R (2010) Preschool speech, language
skills, and reading at 7, 9, and 10 years: etiology of the relationship. J Speech Lang
Hear Res 53: 311–332.
Ioannidis JP (2008) Why most discovered true associations are in�ated. Epidemiology
19: 640–648.
Johnson AD, Handsaker RE, Pulit SL, Nizzari MM, O’Donnell CJ, et al. (2008) SNAP:
a web-based tool for identi�cation and annotation of proxy SNPs using HapMap.
Bioinformatics 24: 2938–2939.
Landerl K, Ramus F, Moll K, Lyytinen H, Leppanen PH, et al. (2013) Predictors of de-
velopmental dyslexia in European orthographies with varying complexity. J Child
Psychol Psychiatry 54: 686–694.
Lasky-Su J, Lyon HN, Emilsson V, Heid IM, Molony C, et al. (2008) On the replication
of genetic associations: timing can be everything! Am J Hum Genet 82: 849–858.
Lin PI, Vance JM, Pericak-Vance MA, Martin ER (2007) No gene is an island: the
�ip-�op phenomenon. Am J Hum Genet 80: 531–538.
Luciano M, Evans DM, Hansell NK, Medland SE, Montgomery GW, et al. (2013) A
genome-wide association study for reading and language abilities in two popula-
tion cohorts. Genes Brain Behav 12: 645–652.
Maschere�i S, Bureau A, Ba�aglia M, Simone D, �adrelli E, et al. (2013) An as-
sessment of gene-by-environment interactions in developmental dyslexia-related
phenotypes. Genes Brain Behav 12: 47–55.
Newbury DF, Paracchini S, Scerri TS, Winchester L, Addis L, et al. (2011) Investiga-
tion of dyslexia and SLI risk variants in reading- and language-impaired subjects.
Behav Genet 41: 90–104.
Nudel R, Simpson NH, Baird G, O’Hare A, Conti-Ramsden G, et al. (2014) Genome-
wide association analyses of child genotype e�ects and parent-of-origin e�ects in

References 131
speci�c language impairment. Genes Brain Behav 13: 418–429.
Purcell S, Cherny SS, Sham PC (2003) Genetic Power Calculator: design of linkage
and association genetic mapping studies of complex traits. Bioinformatics 19: 149–
150.
Purcell S, Neale B, Todd-Brown K, �omas L, Ferreira MA, et al. (2007) PLINK: a tool
set for whole-genome association and population-based linkage analyses. Am J
Hum Genet 81: 559–575.
Rubenstein KB, Raskind WH, Berninger VW, Matsushita MM, Wijsman EM (2014)
Genome scan for cognitive trait loci of dyslexia: Rapid naming and rapid switching
of le�ers, numbers, and colors. Am J Med Genet B Neuropsychiatr Genet 165B:
345–356.
St Pourcain B, Cents RA, Whitehouse AJ, Haworth CM, Davis OS, et al. (2014) Com-
mon variation near ROBO2 is associated with expressive vocabulary in infancy.
Nat Commun 5: 4831.
Tran C, Gagnon F, Wigg KG, Feng Y, Gomez L, et al. (2013) A family-based association
analysis and meta-analysis of the reading disabilities candidate gene DYX1C1. Am
J Med Genet B Neuropsychiatr Genet 162: 146–156.
van Bergen E, Bishop D, van Zuijen T, de Jong PF (2015) How Does Parental Reading
In�uence Children’s Reading? A Study of Cognitive Mediation. Scienti�c Studies
of Reading 0: 1–15.
van Bergen E, van der Leij A, de Jong PF (2014) The intergenerational multiple de�cit
model and the case of dyslexia. Front Hum Neurosci 8: 346.
van den Bos KP (2003) Serieel benoemen en woorden lezen [serial naming and word
reading]. Rijksunversiteit Groningen .
van den Bos KP, Lutje Spelberg HC, Scheepstra AJM, de Vries JR (1994) De klepel:
Een test voor de leesvaardigheid van pseudowoorden [the klepel: A test for the
reading skills of pseudowords]. Swets & Zeitlinger .
van der Leij A, van Bergen E, van Zuijen T, de Jong P, Maurits N, et al. (2013) Precur-
sors of developmental dyslexia: an overview of the longitudinal Dutch Dyslexia
Programme study. Dyslexia 19: 191–213.
Visscher PM, Brown MA, McCarthy MI, Yang J (2012) Five years of GWAS discovery.
Am J Hum Genet 90: 7–24.
Wigginton JE, Abecasis GR (2005) PEDSTATS: descriptive statistics, graphics and
quality assessment for gene mapping data. Bioinformatics 21: 3445–3447.

132 chapter 4: evaluation of new language and reading candidate snps
Willer CJ, Li Y, Abecasis GR (2010) METAL: fast and e�cient meta-analysis of ge-
nomewide association scans. Bioinformatics 26: 2190–2191.
Zhang Y, Li J, Tardif T, Burmeister M, Villafuerte SM, et al. (2012) Association of the
DYX1C1 dyslexia susceptibility gene with orthography in the Chinese population.
PLoS ONE 7: e42969.
Zhong R, Yang B, Tang H, Zou L, Song R, et al. (2013) Meta-analysis of the association
between DCDC2 polymorphisms and risk of dyslexia. Mol Neurobiol 47: 435–442.
Zou L, Chen W, Shao S, Sun Z, Zhong R, et al. (2012) Genetic variant in KIAA0319,
but not in DYX1C1, is associated with risk of dyslexia: an integrated meta-analysis.
Am J Med Genet B Neuropsychiatr Genet 159B: 970–976.

Supplementary information 133
supplementary information
zEMT
-2 -1 0 1 2
0.84 0.50
-2 -1 0 1 2
-2-1
01
2
0.57
-2-1
01
2 zKL
0.51 0.65
zRAN
-2-1
01
2
0.34
-2 -1 0 1 2
-2-1
01
2
-2 -1 0 1 2
zPA
Sample 1- Children
Figure 4.S1: Correlation panel of z-scores for the four phenotypes analysed in samples
of children. �e lower panel contains the sca�er plot of the raw data for each pair of
phenotypes. �e values in the upper panel correspond to the Pearson’s correlation coef-
�cient, and the signi�cance of the correlation. �e diagonal shows the histogram of each
of the scores. EMT= word reading �uency; Kl= nonword reading �uency; RAN=rapid
automatized naming; PA=phonological awareness.

134 Chapter 4: Evaluation of new language and reading candidate SNPs
zEMT
-2 -1 0 1 2
0.68 0.65
-2 -1 0 1 2
-2-1
01
2
0.46
-2-1
01
2 zKL
0.60 0.64
zRAN
-2-1
01
2
0.39
-2 -1 0 1 2
-2-1
01
2
-2 -1 0 1 2
zPA
Sample 2- Adults
Figure 4.S2: Correlation panel of z-scores for the four phenotypes analysed in samples
adults. �e lower panel contains the sca�er plot of the raw data for each pair of pheno-
types. �e values in the upper panel correspond to the Pearson’s correlation coe�cient,
and the signi�cance of the correlation. �e diagonal shows the histogram of each of the
scores. EMT= word reading �uency; Kl= nonword reading �uency; RAN=rapid autom-
atized naming; PA=phonological awareness.

Supplementary information 135
Children
Figure 4.S3: Rapid naming (zRAN) and nonword reading �uency (zKL) scores in rela-
tion to rs12636438 genotypes for the children. �e mean with the standard error per
group shown in red.

136 Chapter 4: Evaluation of new language and reading candidate SNPs
Children
Adults
Figure 4.S4: Rapid naming (zRAN) and phoneme awareness (zPA) scores in relation
to rs7187223 genotypes for children and adults. �e mean with the standard error per
group shown in red.

5
G E N O M E -W I D E S E Q U E N C I N G I N A L A R G E FA M I LY W I T H
D Y S L E X I A
Dyslexia is one of the most common human neurodevelopmental disorders (5-10%
prevalence), and it has a complex aetiology which is likely to involve contributions
from both common and rare genetic variation. We analyzed a 30-member multigen-
erational family with dyslexia, with the goal of identifying a rare genetic variant that
might have an individually substantial e�ect on this complex trait. We performed
whole genome linkage analysis and sequenced the whole exomes or genomes of 15
members of the family (13 a�ected and 2 una�ected). No candidate variants were
identi�ed that might be causative for dyslexia in this family as perfectly penetrant
Mendelian mutations. However, several rare variants were identi�ed that may con-
tribute to the trait in this family, including a nonsynonymous SNP within the gene
CACNA2D3, a noncoding variant upstream of RBMX, and an intronic deletion within
AFF2.
Keywords: mapping complex traits, family linkage analysis, whole exome sequenc-
ing, whole genome sequencing, dyslexia
137

138 chapter 5: genome-wide seqencing in a family with dyslexia
5.1 introduction
Dyslexia is one of the most common human neurodevelopmental disorders (5-10%
prevalence), and it has a complex aetiology involving genetic and environmental fac-
tors. It is o�en considered to re�ect the lower tail of the population distribution in
reading ability (Shaywitz et al., 1992). �us, much e�ort in dyslexia genetics research
has been directed to �nd common genetic variants, with small and additive e�ects
that contribute to susceptibility (Bishop, 2015). �is ”common disease-common vari-
ant” hypothesis has led to the identi�cation of candidate genes, including KIAA0319
and DCDC2, in which genetic variation is linked to reading performance in cohorts
ascertained through poor reading performance (Francks et al., 2004; Cope et al., 2005;
Meng et al., 2005), as well as in unselected populations (Paracchini et al., 2008; Scerri
et al., 2011).
However, there are some unusual, extended families in which dyslexia is inherited
in what resembles a Mendelian fashion, and with a much higher prevalence within
the family than in the general population (Fagerheim et al., 1999; Nopola-Hemmi
et al., 2001). In such families, one or a few genetic variants might have substantial
penetrances, i.e. people carrying those variants would have relatively high proba-
bilities of developing the trait. Such variants are expected to be rare in the general
population, and because of this, not usually amenable to a standard genetic associ-
ation study design, based on cohorts of unrelated people. Nevertheless, detecting
highly penetrant, rare variants in family studies can pinpoint genes which have crit-
ically important biological roles for the trait of interest. Genes that are identi�ed via
highly penetrant and rare mutations can also be investigated further using common
genetic variants in follow-up candidate gene association studies.
Family studies have already proven to be valuable for the identi�cation of sev-
eral dyslexia candidate genes. For example, DYX1C1 (Taipale et al., 2003) was iden-
ti�ed as a potential candidate because of a chromosomal rearrangement that co-
segregated with dyslexia in multiple members of one family. A rare haplotype of
ROBO1 (Hannula-Jouppi et al., 2005) was found to co-segregate with dyslexia status
in the majority of a�ected relatives of another large family, and the same gene was
disrupted by a translocation in an unrelated case. Subsequently, common variants
within these genes have been tested for association with reading-related quantita-
tive traits (Dahdouh et al., 2009; Bates et al., 2010, 2011), as well as brain imaging en-
dophenotypes (e.g. Darki et al. (2012)) in independent samples. �e biological roles

5.1 introduction 139
of such genes have been further characterized in cellular (Lamminmaki et al., 2012;
Tammimies et al., 2013) and animal models (Currier et al., 2011; Andrews et al., 2006),
illustrating how identifying rare variants can shed light on molecular pathways in-
volved in dyslexia. Linkage studies in multigenerational families have also identi�ed
other dyslexia candidate genomic regions, including DYX3 on chromosome 2p15-16
(Fagerheim et al., 1999) and DYX9 on Xq27.3 (de Kovel et al., 2004). However, speci�c
genes or variants contributing to dyslexia within those genomic regions have not
been identi�ed. Indeed it remains unclear whether these speci�c genomic regions
are responsible for the inheritance of dyslexia in these families.
�e current study focuses on the family that led to the identi�cation of DYX9 on
Xq27.3, referred to herea�er as family 259 (de Kovel et al., 2004). �e previous link-
age study was based primarily on microsatellite markers, but also involved targeted
sequencing of some individual candidate genes within Xq27.3 (FMR1, TMEM257, DK-
FZp574M2010 and SLITRK2), which did not identify any protein-coding mutations
that co-segregated with dyslexia (de Kovel et al., 2004). Another study that analysed
twelve French families with dyslexia also found evidence for linkage within this ge-
nomic region, but again did not identify a mutation co-segregating with dyslexia by
targeted sequencing of seven candidate genes (FMR1, CXORF1, CXORF51, SLITRK2,
FMR2, ASFMR1, and FMR1NB) (Huc-Chabrolle et al., 2013).
Next generation sequencing (NGS) now o�ers the possibility to screen systemat-
ically and rapidly over the whole genome or whole exome (i.e. the protein-coding
regions of the genome) for rare mutations a�ecting Mendelian traits. �is approach
has revolutionized genetic analysis of human Mendelian traits (Bamshad et al., 2011),
identifying several disease-causing genes that could not be previously detected, such
as SETBP1 for Schinzel-Giedion syndrome (Hoischen et al., 2010), and TGM6 for
spinocerebellar ataxia (Wang et al., 2010). With respect to dyslexia, a two-base muta-
tion within the CEP63 gene, causing an amino acid substitution, was recently shown
through this approach to co-segregate with the trait in an extended Swedish family
(Einarsdo�ir et al., 2015). We have therefore re-visited family 259 (de Kovel et al.,
2004) with NGS, and adopted an approach that combines linkage analysis with mu-
tation analysis (Smith et al., 2011; Wijsman, 2012), with respect to three types of
genetic variation: coding, noncoding, and structural.

140 chapter 5: genome-wide seqencing in a family with dyslexia
5.2 material and methods
5.2.1 Subjects and diagnostic criteria
We studied a three generation family of thirty members (family 259, Figure 5.1), with
a potentially rare Mendelian form of dyslexia. �is pedigree was recruited as part
of a multidisciplinary research e�ort into di�erent aspects of dyslexia (the Dutch
Dyslexia Programme: DDP (van der Leij and Maassen, 2013)), in which families were
ascertained when at least two �rst degree relatives had a school history of reading
problems, as described in de Kovel et al. (2004). Informed consent was obtained from
all participants and the study was approved by the local ethics commi�ee (CWOM) of
the University Medical Centre Nijmegen under CWOM-nr 9811-025 (de Kovel et al.,
2004).
Dyslexia was de�ned following the criteria of the Dutch Dyslexia Programme
(van der Leij and Maassen, 2013), which are based on several quantitative measures
described in detail by de Kovel et al. (2004). In short, people were de�ned as a�ected
if they 1) performed below the 10th percentile on a word reading test, or 2) scored
below the 10th percentile on a nonword reading test, or 3) scored below the 25th
normative percentile on both word and nonword reading tests, or 4) had a word or
nonword reading score that was>60 percentage points below their normalized score
on a verbal competence test (discrepancy criterion). Following these criteria, 15 of
the 30 subjects were identi�ed as dyslexic.
5.2.2 Genotyping with microsatellite markers
�is genotyping was performed previously and described by de Kovel et al. (2004).
DNA samples were extracted from blood. 374 CA repeat markers (LMS-MD10 v2.5;
Applied Biosystems, Foster City, CA, USA) were genotyped for 29 family members.

5.2
materialandmethods
141
Family 259
WESWGS
WES WES
WGS
WESWES WES WESWES WES
WGS
WESWGS
WGS
I. 1 I. 2
II. 1 II. 2 II. 3 II. 4 II. 5 II. 6 II. 7 II. 8 II. 9 II. 10 II. 11 II. 12
III. 7 III. 8III. 5 III. 6III. 3 III. 4III. 1 III. 2 III. 12 III. 13 III. 14III. 9 III. 10 III. 11 III. 15 III. 16
Figure 5.1: Pedigree of family 259. WES: individuals for which whole exome sequencing was performed. WGS: individuals for
which whole genome sequencing was performed. Black symbols represent dyslexic individuals, white symbols represent una�ected
individuals, and grey symbols represent individuals for which the phenotype was not known.

142 chapter 5: genome-wide seqencing in a family with dyslexia
5.2.3 Next generation sequencing
A total of 13 members of the family were selected for either whole exome sequenc-
ing (WES) or whole genome sequencing (WGS). �e sample selection and choices of
sequencing method were motivated primarily by the individuals’ quantitative trait
scores (i.e. taking those most severely a�ected or obviously una�ected). It was con-
strained by cost and performed in phases (one phase of WES, one phase of WGS) due
to practical considerations. WES was used for ten members and WGS for �ve mem-
bers: two members had both WES and WGS, as indicated in Figure 5.1. �is selection
enabled us to sequence as many people as possible (within budget constraints) for the
exonic regions, and to also thoroughly investigate non-exonic variation for a minor-
ity of samples. Furthermore, the two samples that were sequenced by both methods
permi�ed a comparison between the two approaches, and helped to identify exonic
variants that might have been missed by the targeted exome sequencing approach
(Gilissen et al., 2014; Belkadi et al., 2015) (see Appendix 5.4 for a comparison of the
exome coverage from WGS and WES data).
Whole exome sequencing
Genomic DNA samples collected from 10 a�ected family members (see Figure 5.1)
were used for whole exome sequencing by the genomics research organization and
service company ‘BGI’ (Hong Kong/Shenzhen) using Illumina’s HiSeq 2000 technol-
ogy (Illumina, 2016a). Exome capture was done with the Agilent SureSelect All Hu-
man Exon V4 (51 megabase) array (SureSelect, 2016) which targets over 80% of the
coding exons. Sequencing was at 100 times average coverage depth with library in-
sert size 150-200 base pairs (paired-end). Depending on the amount of available DNA,
one or two libraries were constructed for each sample.
Whole genome sequencing
Genomic DNA samples collected from 5 family members (3 a�ected and 2 una�ected;
see Figure 5.1) were used for whole genome sequencing by the genomics research
organization and service company ‘Novogene’ (Hong Kong) using Illumina’s HiSeq
Xten technology (Illumina, 2016b). Sequencing was at 30 times average coverage
depth with library insert size 2x 150 base pairs (paired-end).

5.2 material and methods 143
5.2.4 NGS data processing
�e WES and WGS data were processed following an identical pipeline if not speci-
�ed otherwise below.
Alignment and pre-processing
Raw reads were cleaned by excluding adapter sequences, reads with low-quality
bases for more than 50% of their lengths, and reads with unknown bases for more
than 10% of their lengths. Clean reads, which comprised 94% of total reads for WES
and 97% of toal reads for WGS, were mapped onto the human reference genome
(hg19) using the so�ware Burrows-Wheeler Aligner (BWA) (Li and Durbin, 2009).
Bam �les were sorted using SAMtools (Li et al., 2009) and PCR duplicate reads were
marked using Picard (Picard, 2016).
For WES data, the mean sequence read length was 88 base pairs, and approxi-
mately 99.3% of the target exome was covered by at least a 10 times sequence read
depth. For WGS data, the mean sequence read length was 150 base pairs, and ap-
proximately 97.5% of the genome was covered by at least a 10 times sequence read
depth.
Re-alignment around indels (insertion/deletions) and base quality control recali-
bration was performed using the Genome Analysis Toolkit so�ware (GATK v2.7.2
for WES, and v3.4 for WGS) (McKenna et al., 2010; DePristo et al., 2011).
Variant calling and annotation
Since more accurate variant calls can be achieved by including data from larger num-
bers of subjects simultaneously, we ran this process by pooling our data from family
259 together with additional subjects from di�erent projects that had been sequenced
with the identical protocols and in the same batches (i.e. 12 additional WES samples,
and 56 additional WGS samples).
For the WES analysis, a target interval �le was generated to de�ne the exonic re-
gions by using the UCSC Genome Browser (exons for Refseq genes± 10bp, reference
genome: hg19). Genetic variants were called using the HaplotypeCaller (HC) tool of
GATK (McKenna et al., 2010; DePristo et al., 2011). For the WES, multisample calling
was done using HC (GATK v2.7.2) to call variants jointly on all the available samples,
using the default parameters with the exception of con�dence thresholds that were

144 chapter 5: genome-wide seqencing in a family with dyslexia
set to: stand call conf = 50.0, stand emit conf = 10.0. For the WGS, HC was run sepa-
rately per sample using the ‘-ERC GVCF’ mode, and then merged together using the
GenotypeGVCFs tool, as recommended by the GATK best practices (GATK v3.4).
We performed Variant �ality Score Recalibration (VQSR) on the WGS data to
exclude low quality variants (phred-scaled Qscore < 30) and to �ag the rest into the
sensitivity tier into which they fell (90, 99, 99.9 and 100). Variant quality �ltering
for the WES samples was based on hard �lter cuto�s, i.e. QD < 2.0 || FS > 60.0 ||MQ< 40.0 ||HaplotypeScore> 13.0 ||Mapping�alityRankSum< -12.5 || ReadPos-
RankSum < -8.0).
WES and WGS variant calls were combined per subject using the ‘CombineVari-
ants’ tool from GATK (v.3.4.) with the options ‘-genotypeMergeOptions UNIQUIFY’.
�is resulted in a total of 7,751,540 variant calls. Since a genetic variant can be repre-
sented in several di�erent ways in a variant call format (vcf) �le (e.g. the reference
coordinate position can be 0 or 1), the representation of the variants in the combined
vcf was uni�ed using the variant tool set VT (Tan et al., 2015). By doing so, multi-
allelic variants (583,792) were decomposed into a biallelic representation (907,403
additional biallelic variants), and then normalized (425,861 variants normalized) us-
ing the VT decompose and normalize so�ware tools (Tan et al., 2015). �e variant
calling of SNPs and indels predicted on average 46,366 (range: 43,065-55,188 ) vari-
ants per WES sample, and 4,755,537 (range: 4,701,300-4,807,194) per WGS sample.
Variants were then annotated using Annovar (Wang et al., 2010) and Variant E�ect
Predictor (VEP v37) (McLaren et al., 2010).
Structural variant calling
WGS data was used to call structural variants (SVs), including deletions, duplications
and inversions. SVs can be indicated from several di�erent signals in WGS data, in-
cluding read-pairs, split-reads, and read-depth. Di�erent SV detection methods have
di�erent accuracies and resolutions for the various types of SV (Mohiyuddin et al.,
2015). Hence, we called SVs using three complementary variant calling programs:
CNVnator (Abyzov et al., 2011), BreakDancer (Chen et al., 2009) and Lumpy (Layer
et al., 2014).
Overlapping calls from the three SV detectors were then combined within samples
using MetaSV (Mohiyuddin et al., 2015), considering as high-con�dence those SVs
detected by at least two of the tools. �e �ve WGS samples had on average 310,491

5.2 material and methods 145
SV calls (range: 309,800-311,000), of which on average 1,875 (range: 1,850-1,907) had
been called by at least two di�erent callers.
SV calls across all samples were combined using the R package intanSV (Yao, 2016)
by merging the calls that had been made in at least two samples with a reciprocal
coordinate overlap larger than 10 %. �ere were a total of 23,383 overlapped calls:
20,315 deletions, 2,335 duplications, and 733 inversions.
�e SV calls were compared against the Database of Genomic Variants (DGV;
downloaded from UCSC genome browser hg19, February 2016) to annotate them
as rare and common. �ose that overlapped by > 50% of their lengths with �ve or
fewer variants in the DGV were considered rare. �ose that did not overlap with any
variant in the DGV were classed as novel.
We excluded SVs as being potentially causative for the phenotype when they were
present in the una�ected individual II.11 (married into family 259; see Figure 5.1), or
when they were common variants in the DGV database.
5.2.5 Linkage analysis
Exonic biallelic variants from WES which had rs identity numbers in the dbSNP
database (Sherry et al., 2001), and minor allele frequency (MAF) >5%, were cleaned
to remove Mendelian errors and unlikely recombination events using Merlin (Abeca-
sis et al., 2002) and Pedcheck (O’Connell and Weeks, 1998). �is yielded a total of
34,066 variants that were subject to linkage disequelibrium (LD) pruning (Variant
In�action Factor=1) using PLINK (Purcell et al., 2007). LD was de�ned according to
a set of 1303 Dutch subjects from Nijmegen’s Brain Imaging Genetics (BIG) dataset
(Franke et al., 2010; Guadalupe et al., 2014), and only variants genotyped or imputed
in BIG could be selected for the pruning. �is resulted in 12,129 independent (uncor-
related) variants. A genetic distance map was then created for the resulting variants
using the cM map interpolator (based on the Human610 �and cM/bP genetic map)
tool within the SNP/Max system of BC Platforms (Platforms, 2015). Further �lter-
ing involved removing variants with low polymorphism information content (PIC)
within the family (‘minimum distance between markers’ = 0.2 centiMorgans (cM),
‘most informative marker selected within’ = 0.1 cM) which resulted in 4,705 variants.
Note that this set of high frequency polymorphisms merely provided a sca�old map
that was suitable for multipoint linkage analysis, and it was not intended to contain
the causative variant. �e 4,705 variants were then combined with the 374 STR geno-
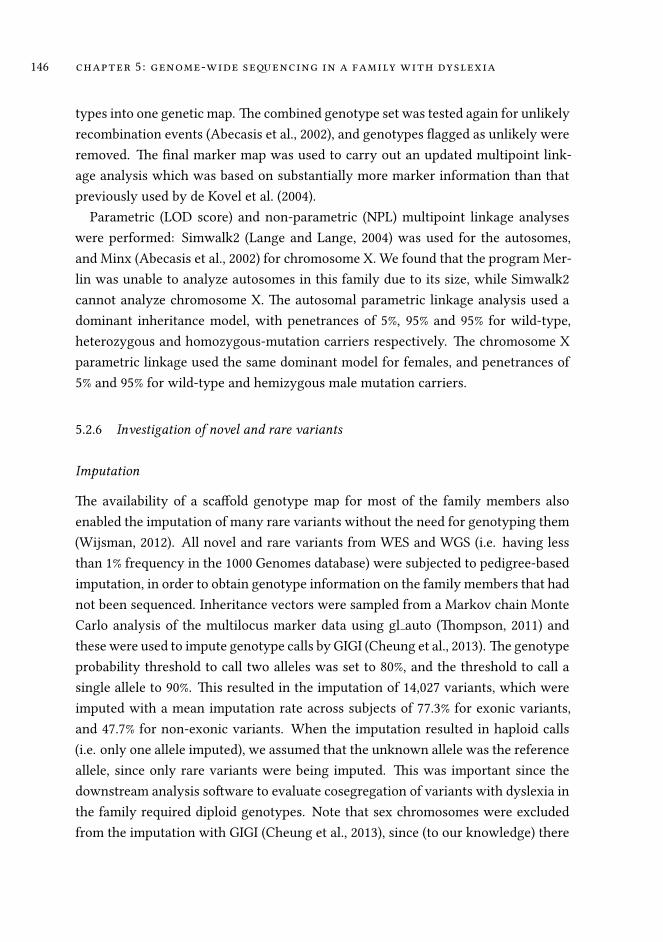
146 chapter 5: genome-wide seqencing in a family with dyslexia
types into one genetic map. �e combined genotype set was tested again for unlikely
recombination events (Abecasis et al., 2002), and genotypes �agged as unlikely were
removed. �e �nal marker map was used to carry out an updated multipoint link-
age analysis which was based on substantially more marker information than that
previously used by de Kovel et al. (2004).
Parametric (LOD score) and non-parametric (NPL) multipoint linkage analyses
were performed: Simwalk2 (Lange and Lange, 2004) was used for the autosomes,
and Minx (Abecasis et al., 2002) for chromosome X. We found that the program Mer-
lin was unable to analyze autosomes in this family due to its size, while Simwalk2
cannot analyze chromosome X. �e autosomal parametric linkage analysis used a
dominant inheritance model, with penetrances of 5%, 95% and 95% for wild-type,
heterozygous and homozygous-mutation carriers respectively. �e chromosome X
parametric linkage used the same dominant model for females, and penetrances of
5% and 95% for wild-type and hemizygous male mutation carriers.
5.2.6 Investigation of novel and rare variants
Imputation
�e availability of a sca�old genotype map for most of the family members also
enabled the imputation of many rare variants without the need for genotyping them
(Wijsman, 2012). All novel and rare variants from WES and WGS (i.e. having less
than 1% frequency in the 1000 Genomes database) were subjected to pedigree-based
imputation, in order to obtain genotype information on the family members that had
not been sequenced. Inheritance vectors were sampled from a Markov chain Monte
Carlo analysis of the multilocus marker data using gl auto (�ompson, 2011) and
these were used to impute genotype calls by GIGI (Cheung et al., 2013). �e genotype
probability threshold to call two alleles was set to 80%, and the threshold to call a
single allele to 90%. �is resulted in the imputation of 14,027 variants, which were
imputed with a mean imputation rate across subjects of 77.3% for exonic variants,
and 47.7% for non-exonic variants. When the imputation resulted in haploid calls
(i.e. only one allele imputed), we assumed that the unknown allele was the reference
allele, since only rare variants were being imputed. �is was important since the
downstream analysis so�ware to evaluate cosegregation of variants with dyslexia in
the family required diploid genotypes. Note that sex chromosomes were excluded
from the imputation with GIGI (Cheung et al., 2013), since (to our knowledge) there

5.2 material and methods 147
is currently no available so�ware to impute genotypes on chromosome X, based on
pedigree structure.
Single point linkage analysis
Single-point linkage analysis was conducted for all rare variants (i.e. novel in family
259 or MAF<0.01 in the 1000Genomes database) located within genomic regions
with multipoint LOD> 1 or NPL >1, by using Pseudomarker2.0 (Hiekkalinna et al.,
2011), whether or not these variants had been included in the map used for multipoint
linkage analysis. Pseudomarker2.0 only performs parametric linkage analysis, and
we speci�ed a dominant model with the same parameters as used for multipoint
analysis (noted above). We also performed a family-based test of allelic association
(MQLS) within this family, using the MQLS-XM package (�ornton and McPeek, 2007;
�ornton et al., 2012), which does not assume a model. Imputed genotypes were used
for these two analyses. When that was not possible (i.e. for variants on chromosome
X, or when the imputation rate was zero), we used the available genotypes from the
sequence data.
Filtering of variants as potentially causative for the phenotype
Variants were excluded if they were not present in any a�ected members, or if they
were present in both una�ected members who had WGS data. �en, variants were
excluded which fell outside genomic regions of interest as speci�ed by the linkage
analysis (i.e. LOD or NPL > 1), and restricted to rare variation by �ltering out com-
mon variants (MAF > 1 % in 1000G and ExAC’s European populations). We also
�ltered out variants that were present in < 60% of the dyslexic individuals, given
the imputed genotypes. For the variants that had not been imputed, we �ltered out
variants that were present in < 60% of the a�ected individuals with sequence data
(i.e. at least 7/13 a�ected for coding variants, at least 2/3 for noncoding variants).
�e �ltered set of variants was then queried under two di�erent hypotheses: First,
we identi�ed exonic variants, excluding those annotated as synonymous variants
by both Annovar and VEP. �en, we identi�ed non-coding variants that were pre-
dicted to be likely pathogenic , given either of the following annotation summary
scores: GWAVAunmatched > 0.5 (Ritchie et al., 2014), CADDphred > 15 (Kircher et al.,
2014). �ese two scores consider information on potential regulation of expression
and evolutionary conservation, and each uses di�erent algorithms (and assumptions)
to evaluate the pathogenicity or functional importance of variants. Note that pre-

148 chapter 5: genome-wide seqencing in a family with dyslexia
computed scores are only available for SNVs, so that indels could not be evaluated
by these scores. We further assessed the putative functional role of these variants
by checking available databases on regulatory regions of the genome (RegulomeDB
(Boyle et al., 2012) and HaploReg (Ward and Kellis, 2012)).
Sanger sequencing
Four variants were validated by Sanger sequencing in all the family members (indi-
cated in Table 5.1). �e validation rate was 100%, and all genotypes were concordant
with the imputed genotype calls (albeit that one of these variants was not imputed,
and for the other three variants 83.3% of the alleles had been imputed).
5.3 results
5.3.1 Multipoint linkage
Our multipoint analysis con�rmed and re�ned the previously reported linkage on
chromosome Xq27.3 (de Kovel et al., 2004): in our current analysis, the maximum
LOD score was 3.19, and NPL score was 1.87 (Figure 5.S3), while the extent of the
linked interval (LOD>3) was narrower (chrX:142795438-146312362, hg19) than that
reported previously (STRs DXS1227-DXS8091,chrX:140892381-147603133, hg19). We
also identi�ed a region of linkage with NPL> 2 on chromosome 20q11.23 (peak
NPL=2.51, LOD= 0.91), which had not been previously reported.
Additional linkages with LOD > 1 or NPL > 1 were present on all chromosomes
except 16 (see Tables 5.S2 and 5.S1 for the exact de�nitions of all intervals with mul-
tipoint NPL > 1 or LOD >1 ).

5.3
results
149
1 2 3 4 5 6 7 8 9 10 11 12 13 14 15 16 17 18 19 20 21 22 X
0.0
0.5
1.0
1.5
2.0
2.5
Genomic Position (cM)
NP
L Z−
scor
e
1 2 3 4 5 6 7 8 9 10 11 12 13 14 15 16 17 18 19 20 21 22 X
−4
−2
0
2
Genomic Position (cM)
LO
D
Figure 5.2: Nonparametric and parametric multipoint linkage analysis across the genome.

150 chapter 5: genome-wide seqencing in a family with dyslexia
5.3.2 Rare or novel variant
A�er �ltering (see above), there were 8 coding, non-synonymous variants that were
present in at least 60% of the a�ected individuals with available genotype data, as
summarized in Table 5.1. �ese variants fell within the following genes: COL6A3,
EOMES (also known as TBR2), CACNA2D3, LACE1, PTPRCAP, LAMA1, KIAA1468
and DLL3. However, the single point linkage scores for these variants were all below
1, and only the CACNA2D3 variant had an MQLS pvalue <0.05.
A�er �ltering, there were 105 non-coding variants within putatively linked ge-
nomic regions that were likely to be pathogenic or functional based on CADD or
GWAVA calls. Among the non-coding variants within the regions of interest on
chromosomes 20q and Xq (Table 5.2), there were six variants present in all three
dyslexic individuals with WGS data, and in neither of the two controls. One was in
the region upstream (49 bp from the 5’UTR) of the RBMX gene on Xq26.3. �ere is
evidence that this variant alters transcription factor binding motifs (10 altered mo-
tifs), and is located within a region showing a DNase peak signal (53 tissues), as
well as promoter histone marks (24 tissues) and evidence of having 31 bound pro-
teins in ChIP-Seq (chromatin-immunoprecipitation-sequencing) experiments (Boyle
et al., 2012; Ward and Kellis, 2012). �ese sources of information suggest that vari-
ation at this genomic location could have a regulatory e�ect on the expression of
RBMX. �is gene encodes an RNA-binding motif X-linked protein, that plays a role
in tissue-speci�c regulation of pre- and post-transcriptional processes and is required
for normal embryonic development (Tsend-Ayush et al., 2005). �e other �ve vari-
ants were intergenic, with only limited evidence of e�ects on regulatory activity,
although three of them (rs11697073, rs150856499 and rs192873740) are within evolu-
tionarily constrained regions.

5.3
results
151
Chr Position Ref Alt cytoBand dbSNP138 Gene Transcript AA.change MAF1000G MAFExAC MQLS LODsp ImpRate A�ected Una�ected Sanger
2 238245107 G A 2q37.3 rs150907698 COL6A3 NM 057166 p.T2272M 8.0e-04 7.6e-04 0.11 0.00 0.83 0.62 0.33 N
3 27763575 C T 3p24.1 . EOMES NM 001278182 p.A71T - 6.3e-05 0.09 0.31 0.88 0.71 0.14 N
3 54661890 A G 3p14.3 rs35593475 CACNA2D3 NM 018398 p.N347S 2.0e-04 1.2e-04 0.03 0.22 0.78 0.77 0.25 Y
6 108843547 T G 6q21 rs143107973 LACE1 NM 145315 p.F455L 6.0e-04 1.6e-03 0.39 0.28 0.75 0.79 0.33 Y
11 67203326 C T 11q13.2 . PTPRCAP NM 005608 p.A167T - - 0.05 0.37 0.83 0.69 0.20 N
18 7007187 C A 18p11.31 rs147345095 LAMA1 NM 005559 p.S1404I - 4.0e-04 0.35 0.00 0.82 0.79 0.60 Y
18 59878477 T G 18q21.33 rs75449685 KIAA1468 - - - 5.0e-03 - - 0.00 0.54 0.00 N
19 39989989 C A 19q13.2 . DLL3 NM 016941 p.P76Q - 8.7e-06 0.05 - 0.00 0.69 0.00 Y
Table 5.1: Rare, exonic, nonsynonymous variants present at least in 60% of the a�ected individuals. Ref: reference allele in hg19. Alt:
alternative observed allele. AA.change: aminoacid change. LODsp: single point LOD score. ImpRate: Imputation rate of the variant.
A�ected, una�ected: frequency of variant carriers of each type in the family. If the ImpRate is not 0, the proportions of carriers are
given for the imputed genotypes; otherwise, for the people with available data.

152
chapter5:genome-wideseq
encinginafamilywithdyslexia
Chr Position Ref Alt cytoBand dbSNP138 Gene Func MAF1000G CADD GWAVA ImpRate A�ected Una�ected
20 37729593 C T 20q12 . DHX35,LOC339568 intergenic 8.0e-04 16.48 - 0.32 0.67 0.50
20 37967464 C G 20q12 rs11697073 LOC339568,LINC01370 intergenic - 25.70 - 0.33 1.00 0.00
20 38583233 A G 20q12 . LOC339568,LINC01370 intergenic - 15.67 - 0.37 1.00 0.00
20 40783158 G T 20q12 . PTPRT intronic - 20.40 - 0.32 0.67 0.50
20 42167234 C T 20q13.12 rs190929877 L3MBTL1 intronic 6.0e-04 5.50 0.67 0.30 0.67 0.50
20 43495488 C G 20q13.12 rs2903761 RIMS4,YWHAB intergenic - 15.62 - 0.63 1.00 0.67
20 43847789 T C 20q13.12 rs139383729 SEMG1,SEMG2 intergenic 2.0e-04 2.31 0.55 0.52 0.67 0.00
20 44098189 C T 20q13.12 rs118003431 WFDC2 upstream 4.8e-03 1.54 0.97 0.33 0.67 0.50
X 135962973 A G Xq26.3 rs187789123 RBMX upstream - 13.70 0.93 0.00 1.00 0.00
X 139025273 C T Xq27.1 rs150856499 MIR505,CXorf66 intergenic 7.9e-04 19.13 0.48 0.00 1.00 0.00
X 148102395 T A Xq28 rs192873740 AFF2,IDS intergenic 7.9e-04 18.31 - 0.00 1.00 0.00
X 153604201 G A Xq28 rs186249683 FLNA,EMD intergenic 2.4e-03 1.07 0.51 0.00 1.00 0.00
Table 5.2: Rare, noncoding variants that were predicted to be pathogenic within linked regions on chromosomes 20 and X. A�ected,
una�ected: frequency of variant carriers of each type in the family. If the ImpRate is not 0, the proportions of carriers are given for
the imputed genotypes; otherwise, for the people with available WES data.

5.4 discussion 153
5.3.3 Structural variant calls
�ere were 70 SVs that fell within the genomic regions de�ned by the multipoint
linkage analysis (NPL>1 or LOD>1). Of these, only four deletions cosegregated
with dyslexia within the WGS samples (i.e. the three a�ected members had them,
while the two una�ected did not). �ese four deletions were each only called by
one out of the three callers, either by CNVnator or BreakDancer, and were therefore
considered as uncertain calls. �e potential deletion on chr20:40349033-40349733
falls within an intergenic region, ∼ 10Mb upstream of the closest gene (CHD6). �e
potential deletion on chrX:147785400-147786267 falls within the second intron of
AFF2. �e potential deletion on chr13:101663267-101664033 is 766bp long, within
the non-coding RNA NALCN-AS1. �e fourth deletion (chr14:21263100-21265900) is
2.8kb long and intergenic.
5.4 discussion
A combination of linkage analysis and NGS in families has proven to be a power-
ful approach to �nd causative variants for several monogenic diseases, as well as
complex traits (Rosenthal et al., 2013; Norton et al., 2013). In the present study we
adopted this strategy with the goal of identifying novel or rare variants a�ecting
dyslexia in a multigenerational Dutch family (de Kovel et al., 2004).
By combining STR genotype data with common SNPs from WES, we were able to
further characterize the haplotype that underlies a previously reported linkage on
chromosome Xq27, as well as identifying other putatively linked genomic regions
(including one with peak NPL=2.51 on 20q12). �e linkage data provided a valuable
�lter to rank novel and rare variants as potentially causative for dyslexia in this
family (Smith et al., 2011).
We used both parametric and nonparametric multipoint linkage analysis to de�ne
genomic regions of interest. �e former approach models a particular inheritance
pa�ern in the family (in this case dominant inheritance for the autosomes), while
the la�er measures an increase in identity-by-descent sharing in a�ected members
without specifying a particular set of model parameters. It is likely that family 259
does not segregate a purely Mendelian form of dyslexia, as indicated by the fact that
there is male-to-male transmission that cannot be explained by the X chromosome
linkage (from individual II.9 to II.13, Figure 5.1), and that a relative marrying into the

154 chapter 5: genome-wide seqencing in a family with dyslexia
family (individual II.4) was also diagnosed with dyslexia, which could be a source of
genetic heterogeneity. Whenever the underlying inheritance model is misspeci�ed,
parametric linkage analysis can have less power than non-parametric analysis, and
is therefore prone to false negative results for genomic intervals which may nonethe-
less harbour truly causative variants (Lange and Lange, 2004). Indeed, recent WES
studies in families (Einarsdo�ir et al., 2015; Villanueva et al., 2015) have proposed
possible causal variants that did not fall within obviously linked genomic regions
(Svensson et al., 2011; Villanueva et al., 2011). However, when the model is speci�ed
correctly, then parametric analysis has the greatest power.
Within genomic regions showing a linkage score higher than one (NPL or LOD),
there were eight rare coding variants a�er �ltering. However, none of these had sig-
ni�cant single-point linkage scores, and only one of them (within the CACNA2D3
gene) was nominally signi�cant in the MQLS association analysis. �us, such vari-
ants are not likely to be strongly penetrant for dyslexia in family 259. �is is not
surprising given that our multipoint linkage threshold was quite mild in order to
be inclusive (i.e. NPL or LOD>1), and that the two most strongly linked loci (on
chromosomes 20q and Xq) did not contain any of these particular coding variants.
In spite of the imperfect segregation with dyslexia, it is possible that the coding
variants identi�ed could be contributing to the genetic background of the family
by increasing the risk in an oligogenic manner. For instance, one of these variants
was within the gene LAMA1, which lies in the dyslexia susceptibility locus DYX6
on chromosome 18 (Fisher et al., 2002; Scerri et al., 2010; Mueller et al., 2014) and
was found to be linked to several reading-related quantitative traits in prior studies
(e.g. word reading, phonological decoding and orthographic coding). Indeed, a SNP
within LAMA1 (rs17439829) was signi�cantly associated with orthographic coding
and reading ability in a sample of UK families, although this association was not
replicated in an independent sample (Scerri et al., 2010). Another of the variants we
identi�ed is within the CACNA2D3 gene, which is a strong candidate gene for autism
spectrum disorder (Iossifov et al., 2012). �is gene encodes a member of the alpha-
2/delta subunit family (α2δ3), a protein in the voltage-dependent calcium channel
complex. �e α2δ3 subunit modulates the expression and function of voltage-gated
calcium channels, and it has been found to be essential for the normal structure and
function of speci�c classes of synapses in the mammalian auditory pathway, and
suggested to be a candidate gene for auditory processing disorders (Pirone et al.,
2014). A third nonsynonymous variant was within the gene EOMES (also known as

5.4 discussion 155
TBR2), which codes for a transcription factor that a�ects cortical development and
has been linked to intellectual disability (Elsen et al., 2013).
Protein-altering DNA variation is the easiest to interpret, because we can o�en
predict with relatively high con�dence whether a given mutation will a�ect protein
function. However, several of the genetic variants so far associated with dyslexia
have been of a regulatory nature, a�ecting the expression of proximal genes (Dennis
et al., 2009; Hannula-Jouppi et al., 2005). Hence, we also considered noncoding vari-
ants based on scores that integrate several types of annotation and provide a measure
of potential functionality (CADD, GWAVA) (Kircher et al., 2014; Ritchie et al., 2014).
One variant upstream of RBMX is in a potential regulatory region that is active in
several tissues, including the brain. A 23 bp frameshi� deletion within RBMX has
been found recently in a family with intellectual disability, suggesting this gene as
a novel candidate gene for X-linked intellectual disability syndrome (Shashi et al.,
2015).
Another class of genetic variation is structural variation, such as the translocations
that disrupted the genes ROBO1 and DYX1C1 (see Section 5.1) (Taipale et al., 2003;
Hannula-Jouppi et al., 2005). We were able to identify several possible structural
variants from the WGS data. Only four deletions co-segregated with dyslexia in the
subset of samples with this type of data. One of them was a ∼800bp deletion that
fell within an intron of AFF2, which was one of the candidate genes in Xq27 that had
been scrutinized for coding mutations in the previous studies (de Kovel et al., 2004;
Huc-Chabrolle et al., 2013). However, these variants were only called by one of the
three SV callers that were used, and hence should be independently con�rmed. In
addition, the possible functional relevance of this type of small CNV in noncoding
regions is di�cult to predict.
It is possible, although somewhat unlikely, that our sequencing e�orts may have
missed a highly penetrant exomic variant, because the WES protocol that we used is
known to result in less-than-100% coverage for detecting protein-coding DNA varia-
tion (Gnirke et al., 2009; SureSelect, 2016). However, our use of WGS on an additional
�ve samples will have greatly reduced the chance that we missed a variant within
the linked regions of the genome.
In summary, we used a combination of linkage analysis and NGS to screen for rare
genetic variation that might underlie the inheritance of dyslexia in a large multi-
generational family. No single variant stood out as a top candidate in this regard,
which suggests that the pa�ern of inheritance in this family is more complex than

156 chapter 5: genome-wide seqencing in a family with dyslexia
Mendelian, but we found several variants that could potentially be contributing to
the phenotype. In order to establish a causal relationship between any of the variants
found in this study and dyslexia, it would be important to evaluate the functional as-
pects of the variants in biological models, and/or to �nd convergent evidence for
the relevance of any of these genes to reading ability in independent datasets. It
remains possible that other large, extended families with elevated rates of dyslexia
may be a�ected by rare, or unique, but relatively penetrant mutations. �erefore
combined linkage and NGS analysis continues to hold the potential to identify key
genes involved in the molecular underpinnings of dyslexia.

References 157
references
Abecasis GR, Cherny SS, Cookson WO, Cardon LR (2002) Merlin–rapid analysis of
dense genetic maps using sparse gene �ow trees. Nature Genetics 30: 97–101.
Abyzov A, Urban AE, Snyder M, Gerstein M (2011) CNVnator: an approach to dis-
cover, genotype, and characterize typical and atypical CNVs from family and pop-
ulation genome sequencing. Genome Res 21: 974–984.
Andrews W, Liapi A, Plachez C, Camurri L, Zhang J, et al. (2006) Robo1 regulates
the development of major axon tracts and interneuron migration in the forebrain.
Development 133: 2243–2252.
Bamshad MJ, Ng SB, Bigham AW, Tabor HK, Emond MJ, et al. (2011) Exome sequenc-
ing as a tool for Mendelian disease gene discovery. Nat Rev Genet 12: 745–755.
Bates TC, Lind PA, Luciano M, Montgomery GW, Martin NG, et al. (2010) Dyslexia
and DYX1C1: de�cits in reading and spelling associated with a missense mutation.
Mol Psychiatry 15: 1190–1196.
Bates TC, Luciano M, Medland SE, Montgomery GW, Wright MJ, et al. (2011) Ge-
netic variance in a component of the language acquisition device: ROBO1 poly-
morphisms associated with phonological bu�er de�cits. Behav Genet 41: 50–57.
Belkadi A, Bolze A, Itan Y, Cobat A, Vincent QB, et al. (2015) Whole-genome sequenc-
ing is more powerful than whole-exome sequencing for detecting exome variants.
Proc Natl Acad Sci USA 112: 5473–5478.
Bishop DV (2015) The interface between genetics and psychology: lessons from de-
velopmental dyslexia. Proc Biol Sci 282.
Boyle AP, Hong EL, Hariharan M, Cheng Y, Schaub MA, et al. (2012) Annotation
of functional variation in personal genomes using RegulomeDB. Genome Res 22:
1790–1797.
Chen K, Wallis JW, McLellan MD, Larson DE, Kalicki JM, et al. (2009) BreakDancer:
an algorithm for high-resolution mapping of genomic structural variation. Nat
Methods 6: 677–681.
Cheung CY, �ompson EA, Wijsman EM (2013) GIGI: an approach to e�ective impu-
tation of dense genotypes on large pedigrees. Am J Hum Genet 92: 504–516.
Cope N, Harold D, Hill G, Moskvina V, Stevenson J, et al. (2005) Strong evidence that
KIAA0319 on chromosome 6p is a susceptibility gene for developmental dyslexia.
Am J Hum Genet 76: 581–591.

158 chapter 5: genome-wide seqencing in a family with dyslexia
Currier TA, Etchegaray MA, Haight JL, Galaburda AM, Rosen GD (2011) The e�ects
of embryonic knockdown of the candidate dyslexia susceptibility gene homologue
Dyx1c1 on the distribution of GABAergic neurons in the cerebral cortex. Neuro-
science 172: 535–546.
Dahdouh F, Anthoni H, Tapia-Paez I, Peyrard-Janvid M, Schulte-Korne G, et al. (2009)
Further evidence for DYX1C1 as a susceptibility factor for dyslexia. Psychiatr
Genet 19: 59–63.
Darki F, Peyrard-Janvid M, Matsson H, Kere J, Klingberg T (2012) Three Dyslexia
Susceptibility Genes, DYX1C1, DCDC2, and KIAA0319, A�ect Temporo-Parietal
White Ma�er Structure. Biol Psychiatry 72: 671–676.
de Kovel CG, Hol FA, Heister JG, Willemen JJ, Sandkuijl LA, et al. (2004) Genome-
wide scan identi�es susceptibility locus for dyslexia on Xq27 in an extended Dutch
family. J Med Genet 41: 652–657.
Dennis MY, Paracchini S, Scerri TS, Prokunina-Olsson L, Knight JC, et al. (2009) A
common variant associated with dyslexia reduces expression of the KIAA0319
gene. PLoS Genet 5: e1000436.
DePristo MA, Banks E, Poplin R, Garimella KV, Maguire JR, et al. (2011) A framework
for variation discovery and genotyping using next-generation DNA sequencing
data. Nat Genet 43: 491–498.
Einarsdo�ir E, Svensson I, Darki F, Peyrard-Janvid M, Lindvall JM, et al. (2015) Mu-
tation in CEP63 co-segregating with developmental dyslexia in a Swedish family.
Hum Genet 134: 1239–1248.
Elsen GE, Hodge RD, Bedogni F, Daza RA, Nelson BR, et al. (2013) The protomap is
propagated to cortical plate neurons through an Eomes-dependent intermediate
map. Proc Natl Acad Sci USA 110: 4081–4086.
Fagerheim T, Raeymaekers P, T?nnessen FE, Pedersen M, Tranebjaerg L, et al. (1999)
A new gene (DYX3) for dyslexia is located on chromosome 2. J Med Genet 36:
664–669.
Fisher SE, Francks C, Marlow AJ, MacPhie IL, Newbury DF, et al. (2002) Independent
genome-wide scans identify a chromosome 18 quantitative-trait locus in�uencing
dyslexia. Nat Genet 30: 86–91.
Francks C, Paracchini S, Smith SD, Richardson AJ, Scerri TS, et al. (2004) A 77-
kilobase region of chromosome 6p22.2 is associated with dyslexia in families from
the United Kingdom and from the United States. Am J Hum Genet 75: 1046–1058.

References 159
Franke B, Vasquez AA, Veltman JA, Brunner HG, Rijpkema M, et al. (2010) Genetic
variation in CACNA1C, a gene associated with bipolar disorder, in�uences brain-
stem rather than gray ma�er volume in healthy individuals. Biol Psychiatry 68:
586–588.
Gilissen C, Hehir-Kwa JY, �ung DT, van de Vorst M, van Bon BW, et al. (2014)
Genome sequencing identi�es major causes of severe intellectual disability. Na-
ture 511: 344–347.
Gnirke A, Melnikov A, Maguire J, Rogov P, LeProust EM, et al. (2009) Solution hybrid
selection with ultra-long oligonucleotides for massively parallel targeted sequenc-
ing. Nat Biotechnol 27: 182–189.
Guadalupe T, Zwiers MP, Teumer A, Wi�feld K, Vasquez AA, et al. (2014) Measure-
ment and genetics of human subcortical and hippocampal asymmetries in large
datasets. Hum Brain Mapp 35: 3277–3289.
Hannula-Jouppi K, Kaminen-Ahola N, Taipale M, Eklund R, Nopola-Hemmi J, et al.
(2005) The axon guidance receptor gene ROBO1 is a candidate gene for develop-
mental dyslexia. PLoS Genet 1: e50.
Hiekkalinna T, Scha�er AA, Lambert B, Norrgrann P, Goring HH, et al. (2011) PSEU-
DOMARKER: a powerful program for joint linkage and/or linkage disequilibrium
analysis on mixtures of singletons and related individuals. Hum Hered 71: 256–
266.
Hoischen A, van Bon BW, Gilissen C, Arts P, van Lier B, et al. (2010) De novo muta-
tions of SETBP1 cause Schinzel-Giedion syndrome. Nat Genet 42: 483–485.
Huc-Chabrolle M, Charon C, Guilmatre A, Vourc’h P, Tripi G, et al. (2013) Xq27
FRAXA Locus is a Strong Candidate for Dyslexia: Evidence from a Genome-Wide
Scan in French Families. Behav Genet 43: 132–140.
Illumina (2016a) HiSeq2000. URL h�p://support.illumina.com/sequencing/
sequencing instruments/hiseq 2000.html.
Illumina (2016b) Illumina X-ten. URL h�p://www.illumina.com/systems/
hiseq-x-sequencing-system.html.
Iossifov I, Ronemus M, Levy D, Wang Z, Hakker I, et al. (2012) De novo gene disrup-
tions in children on the autistic spectrum. Neuron 74: 285–299.
Kircher M, Wi�en DM, Jain P, O’Roak BJ, Cooper GM, et al. (2014) A general frame-
work for estimating the relative pathogenicity of human genetic variants. Nat
Genet 46: 310–315.

160 chapter 5: genome-wide seqencing in a family with dyslexia
Lamminmaki S, Massinen S, Nopola-Hemmi J, Kere J, Hari R (2012) Human ROBO1
regulates interaural interaction in auditory pathways. J Neurosci 32: 966–971.
Lange EM, Lange K (2004) Powerful allele sharing statistics for nonparametric link-
age analysis. Hum Hered 57: 49–58.
Layer RM, Chiang C, �inlan AR, Hall IM (2014) LUMPY: a probabilistic framework
for structural variant discovery. Genome Biol 15: R84.
Li H, Durbin R (2009) Fast and accurate short read alignment with Burrows-Wheeler
transform. Bioinformatics 25: 1754–1760.
Li H, Handsaker B, Wysoker A, Fennell T, Ruan J, et al. (2009) The Sequence Align-
ment/Map format and SAMtools. Bioinformatics 25: 2078–2079.
McKenna A, Hanna M, Banks E, Sivachenko A, Cibulskis K, et al. (2010) The Genome
Analysis Toolkit: a MapReduce framework for analyzing next-generation DNA
sequencing data. Genome Res 20: 1297–1303.
McLaren W, Pritchard B, Rios D, Chen Y, Flicek P, et al. (2010) Deriving the con-
sequences of genomic variants with the Ensembl API and SNP E�ect Predictor.
Bioinformatics 26: 2069–2070.
Meng H, Smith SD, Hager K, Held M, Liu J, et al. (2005) DCDC2 is associated with
reading disability and modulates neuronal development in the brain. Proc Natl
Acad Sci USA 102: 17053–17058.
Mohiyuddin M, Mu JC, Li J, Bani Asadi N, Gerstein MB, et al. (2015) MetaSV: an
accurate and integrative structural-variant caller for next generation sequencing.
Bioinformatics 31: 2741–2744.
Mueller B, Ahnert P, Burkhardt J, Brauer J, Czepezauer I, et al. (2014) Genetic risk
variants for dyslexia on chromosome 18 in a German cohort. Genes Brain Behav
13: 350–356.
Nopola-Hemmi J, Myllyluoma B, Haltia T, Taipale M, Ollikainen V, et al. (2001) A
dominant gene for developmental dyslexia on chromosome 3. J Med Genet 38:
658–664.
Norton N, Li D, Rampersaud E, Morales A, Martin ER, et al. (2013) Exome sequencing
and genome-wide linkage analysis in 17 families illustrate the complex contribu-
tion of TTN truncating variants to dilated cardiomyopathy. Circ Cardiovasc Genet
6: 144–153.
O’Connell JR, Weeks DE (1998) PedCheck: a program for identi�cation of genotype
incompatibilities in linkage analysis. Am J Hum Genet 63: 259–266.

References 161
Paracchini S, Steer CD, Buckingham LL, Morris AP, Ring S, et al. (2008) Association
of the KIAA0319 dyslexia susceptibility gene with reading skills in the general
population. Am J Psychiatry 165: 1576–1584.
Picard (2016) Picard. URL h�ps://broadinstitute.github.io/picard/.
Pirone A, Kurt S, Zucco�i A, Ru�iger L, Pilz P, et al. (2014) α2δ3 is essential for
normal structure and function of auditory nerve synapses and is a novel candidate
for auditory processing disorders is essential for normal structure and function of
auditory nerve synapses and is a novel candidate for auditory processing disorders.
J Neurosci 34: 434–445.
Platforms B (2015) BC Platforms. URL h�p://bcplatforms.com/.
Purcell S, Neale B, Todd-Brown K, �omas L, Ferreira MA, et al. (2007) PLINK: a tool
set for whole-genome association and population-based linkage analyses. Am J
Hum Genet 81: 559–575.
Ritchie GR, Dunham I, Zeggini E, Flicek P (2014) Functional annotation of noncoding
sequence variants. Nat Methods 11: 294–296.
Rosenthal EA, Ranchalis J, Crosslin DR, Burt A, Brunzell JD, et al. (2013) Joint link-
age and association analysis with exome sequence data implicates SLC25A40 in
hypertriglyceridemia. Am J Hum Genet 93: 1035–1045.
Scerri TS, Morris AP, Buckingham LL, Newbury DF, Miller LL, et al. (2011) DCDC2,
KIAA0319 and CMIP are associated with reading-related traits. Biol Psychiatry 70:
237–245.
Scerri TS, Paracchini S, Morris A, MacPhie IL, Talco� J, et al. (2010) Identi�cation
of candidate genes for dyslexia susceptibility on chromosome 18. PLoS ONE 5:
e13712.
Shashi V, Xie P, Schoch K, Goldstein DB, Howard TD, et al. (2015) The RBMX gene
as a candidate for the Shashi X-linked intellectual disability syndrome. Clin Genet
88: 386–390.
Shaywitz SE, Escobar MD, Shaywitz BA, Fletcher JM, Makuch R (1992) Evidence that
dyslexia may represent the lower tail of a normal distribution of reading ability. N
Engl J Med 326: 145–150.
Sherry ST, Ward MH, Kholodov M, Baker J, Phan L, et al. (2001) dbSNP: the NCBI
database of genetic variation. Nucleic Acids Res 29: 308–311.
Smith KR, Bromhead CJ, Hildebrand MS, Shearer AE, Lockhart PJ, et al. (2011) Reduc-
ing the exome search space for mendelian diseases using genetic linkage analysis
of exome genotypes. Genome Biol 12: R85.
162 chapter 5: genome-wide seqencing in a family with dyslexia
SureSelect (2016) SureSelect Performance. URL h�p://www.genomics.agilent.com/
article.jsp?pageId=3051.
Svensson I, Nilsson S, Wahlstrom J, Jernas M, Carlsson LM, et al. (2011) Familial
dyslexia in a large Swedish family: a whole genome linkage scan. Behav Genet 41:
43–49.
Taipale M, Kaminen N, Nopola-Hemmi J, Haltia T, Myllyluoma B, et al. (2003) A
candidate gene for developmental dyslexia encodes a nuclear tetratricopeptide re-
peat domain protein dynamically regulated in brain. Proc Natl Acad Sci USA 100:
11553–11558.
Tammimies K, Vitezic M, Matsson H, Le Guyader S, Burglin TR, et al. (2013) Molec-
ular Networks of DYX1C1 Gene Show Connection to Neuronal Migration Genes
and Cytoskeletal Proteins. Biol Psychiatry 73: 583–590.
Tan A, Abecasis GR, Kang HM (2015) Uni�ed representation of genetic variants.
Bioinformatics 31: 2202–2204.
�iele H, Nurnberg P (2005) HaploPainter: a tool for drawing pedigrees with complex
haplotypes. Bioinformatics 21: 1730–1732.
�ompson E (2011) The structure of genetic linkage data: from LIPED to 1M SNPs.
Hum Hered 71: 86–96.
�ornton T, McPeek MS (2007) Case-control association testing with related individ-
uals: a more powerful quasi-likelihood score test. Am J Hum Genet 81: 321–337.
�ornton T, Zhang Q, Cai X, Ober C, McPeek MS (2012) XM: association testing on
the X-chromosome in case-control samples with related individuals. Genet Epi-
demiol 36: 438–450.
Tsend-Ayush E, O’Sullivan LA, Grutzner FS, Onnebo SM, Lewis RS, et al. (2005)
RBMX gene is essential for brain development in zebra�sh. Dev Dyn 234: 682–
688.
van der Leij A, Maassen B (2013) Dutch Dyslexia Programme. Dyslexia 19: 189–190.
Villanueva P, Newbury DF, Jara L, De Barbieri Z, Mirza G, et al. (2011) Genome-wide
analysis of genetic susceptibility to language impairment in an isolated Chilean
population. Eur J Hum Genet 19: 687–695.
Villanueva P, Nudel R, Hoischen A, Fernandez MA, Simpson NH, et al. (2015) Exome
Sequencing in an Admixed Isolated Population Indicates ¡italic¿NFXL1¡/italic¿
Variants Confer a Risk for Speci�c Language Impairment. PLoS Genet 11:
e1004925, URL h�p://dx.doi.org/10.1371%2Fjournal.pgen.1004925.

References 163
Wang K, Li M, Hakonarson H (2010) ANNOVAR: functional annotation of genetic
variants from high-throughput sequencing data. Nucleic Acids Res 38: e164.
Ward LD, Kellis M (2012) HaploReg: a resource for exploring chromatin states, con-
servation, and regulatory motif alterations within sets of genetically linked vari-
ants. Nucleic Acids Res 40: D930–934.
Wijsman EM (2012) The role of large pedigrees in an era of high-throughput sequenc-
ing. Hum Genet 131: 1555–1563.
Yao W (2016) intansv: Integrative analysis of structural variations. R package version
1.6.2.

164 Chapter 5: Genome-wide seqencing in a family with dyslexia
supplementary information
Exome coverage: WES vs WGS
Two of the a�ected samples in family 259 were sequenced twice, once by WES and
once by WGS. We compared the two sequencing strategies by comparing the average
and cumulative read depth for the exome, as de�ned in two di�erent ways: 1) by the
exome capture that was used for the WES (Agilent 51M), and 2) by the de�nition of
the exonic regions from the UCSC genome browser (hg19).
Agilent 51M exonic region
UCSC exons +-10bp
0
30
60
90
14577 14587 14577 14587Sample
Mea
n D
epth
seq
wes
wgs
Mean Read Depth WES vs. WGS
Figure 5.S1: Mean read depth comparison for the two samples that were used for WGS
and WES. Two de�nitions of exonic regions were considered: 1) exonic regions targeted
by the WES capture protocol (Agilent 51M) and 2) exons de�ned according to UCSC
gene de�nitions.

Supplementary information 165
Agilent 51M exonic region
UCSC exons +-10bp
0
25
50
75
100
0 20 40 60 80 0 20 40 60 80Read depth
Minimum MAPQ = 0, minimum BQ = 0, all exonic bases
Per
cen
tag
e o
f b
ases
at
this
dep
th o
r b
ette
r
seq
wes
wgs
Cumulative distribution of coverageWES vs. WGS
Figure 5.S2: Cumulative distribution of coverage for the two samples that were used
for WGS and WES. Two de�nitions of exonic regions were considered: 1) exonic regions
targeted by the WES capture protocol (Agilent 51M) and 2) exons de�ned according to
UCSC gene de�nitions. MAPQ: mapping quality. BQ: base quality.
Multipoint linkage analysis, genomic regions of interest
Interval Chr Start End LODmax So�ware
1 7 37298800 40899967 1.42 Simwalk2
2 13 98829217 106119446 1.58 Simwalk2
3 20 34502107 36758778 1.09 Simwalk2
4 20 54941124 55072472 1.07 Simwalk2
5 X 138633280 152823728 3.19 Merlin
Table 5.S1: Regions of interest as de�ned by LOD> 1 using parametric linkage analysis.
Coordinates are given for the genome reference hg19. LODmax indicates the maximum
LOD score within each interval.

166 Chapter 5: Genome-wide seqencing in a family with dyslexia
Interval Chr Start End NPLmax So�ware
1 1 44401384 47078637 1.28 Simwalk2
2 2 75113657 79254261 1.13 Simwalk2
3 2 111907691 116447277 1.54 Simwalk2
4 2 163128824 171070912 1.53 Simwalk2
5 2 237374309 240066417 1.38 Simwalk2
6 3 16640075 28381887 1.06 Simwalk2
7 3 52188361 53213657 1.09 Simwalk2
8 3 53700550 56627048 1.18 Simwalk2
9 3 126137558 128755814 1.14 Simwalk2
10 4 5838513 7435194 1.35 Simwalk2
11 4 7655855 9785134 1.17 Simwalk2
12 5 33998883 35644621 1.00 Simwalk2
13 5 38884071 44809162 1.17 Simwalk2
14 6 2955802 16145325 1.59 Simwalk2
15 6 36922684 43112267 1.61 Simwalk2
16 6 102503317 111283592 1.63 Simwalk2
17 7 2257612 5257573 1.67 Simwalk2
18 8 104153137 125498547 1.49 Simwalk2
19 9 138377853 139397707 1.15 Simwalk2
20 10 25701341 29581440 1.09 Simwalk2
21 11 25100229 27362359 1.05 Simwalk2
22 11 66626234 68030015 1.00 Simwalk2
23 12 58162739 60169265 1.09 Simwalk2
24 12 92539344 93258665 1.02 Simwalk2
25 14 21215728 21623648 1.24 Simwalk2
26 14 22687415 23549319 1.11 Simwalk2
27 14 51716188 57948380 1.46 Simwalk2
28 15 35273620 38794566 1.27 Simwalk2
29 17 27835138 28511978 1.07 Simwalk2
30 18 6046717 11492931 1.61 Simwalk2
31 18 52258548 55143766 1.08 Simwalk2
32 18 56940307 63489378 1.07 Simwalk2
33 19 37677748 43519362 1.67 Simwalk2
34 19 52825235 53270460 1.21 Simwalk2
35 20 37383640 44238741 2.51 Simwalk2
36 21 31692377 32201822 1.00 Simwalk2
37 22 34022284 35660875 1.02 Simwalk2
38 X 134713855 151869765 1.87 Merlin
Table 5.S2: Regions of interest as de�ned by NPL > 1. Coordinates are given for the
genome reference hg19. NPLmax indicates the maximum NPL score within each inter-
val.

Supplementary information 167
Haplotype analysis of chromosome Xq
Haplotypes were generated for chromosome X. Haplotypes were created in the hap-
lotype analysis tool Minx (Abecasis et al., 2002) and visualized using Haplopainter
(�iele and Nurnberg, 2005).
5112112311111
1111121111112
0000000000000
1111112221112
0000000000000
4122212221112
0000000000000
1111121111111
3212111421212
4122212221112
0000000000000
3000012221112
1111112222111
1122221111111
1111112222111
1111111111111
0000000000000
2000020400003
1111121111111
2000010100002
0000000000000
2000020400003
1111121111111
2111110500004
0000000000000
2111132311121
0000000000000
3000032311121
0000000000000
4122212221112
0000000000000
1111121111111
1111121111111
3000010200005
0000000000000
4122212221112
0000000000000
5112112311111
4122212221112
1111121111111
4122212221112
3000021111111
0000000000000
3212111421212
0000000000000
1111112222111
4122212221112
1111121111111
0000000000000
1111121111111
2000020400003
2000010100002
0000000000000
1111121111111
2111110500004
3000032311121
0000000000000
3000010100003
4122212221112
1111121111111
DXS1047X:135104864X:135496398X:138633280X:139038443DXS1227X:142795438DXS8043X:144904882X:145076302X:146312362X:147010320DXS8091
DXS1047X:135104864X:135496398X:138633280X:139038443DXS1227X:142795438DXS8043X:144904882X:145076302X:146312362X:147010320DXS8091
DXS1047X:135104864X:135496398X:138633280X:139038443DXS1227X:142795438DXS8043X:144904882X:145076302X:146312362X:147010320DXS8091
138.83139.15139.51143.02143.93150.37156.63161.17163.13163.53165.68166.51167.30
138.83139.15139.51143.02143.93150.37156.63161.17163.13163.53165.68166.51167.30
138.83139.15139.51143.02143.93150.37156.63161.17163.13163.53165.68166.51167.30
Family 259
III. 3III.1WES
III. 6 III. 7 III. 13WES
III. 16
WGS
III. 8 III. 15III. 12 III. 14III. 5WES
III. 2
WGS
III. 10 III. 11III. 4WES
III. 9
I. 2I. 1
II. 6WES
II. 7WES
II. 1 II. 8II. 2 II. 11II. 3 II. 9WESWGS
II. 4 II. 10II. 5 II. 12
Figure 5.S3: Haplotype visualization of the linkage peak on chomosome Xq (DXS1047
to DXS8091). �e risk haplotype is coloured in dark green.


6
N O N C O D I N G M U TAT I O N S I N S E M A 3 C C O - S E G R E G AT E W I T H
D E V E L O P M E N TA L D Y S L E X I A I N A D U T C H FA M I LY
Dyslexia is a common developmental disorder. It has high heritability estimates,
and its genetic underpinnings are thought to be complex, involving common and
rare genetic variation. Multigenerational families segregating apparent monogenic
forms of language-related disorders can provide useful entrypoints into biological
pathways. In the present study, we performed a genome-wide linkage scan in a
previously unpublished extended family in which dyslexia seems to be transmi�ed
with an autosomal dominant pa�ern of inheritance. We identi�ed a locus on chro-
mosome 7q21.11 showing evidence of linkage to the disorder (LOD=2.82). Whole
genome sequencing of key individuals enabled the assessment of coding, noncoding
and structural variation in the family. Two rare intronic SNPs within the SEMA3C
gene, which were predicted to have functional e�ects, cosegregated with dyslexia
and the risk haplotype on 7q21.11. SEMA3C encodes a secreted protein that acts as a
guidance cue in several processes, including cortical neuronal migration and cellular
polarization.
Keywords: mapping complex traits, family linkage analysis, whole genome sequenc-
ing, dyslexia
169

170 chapter 6: noncoding mutations in sema3c cosegregate with dyslexia
6.1 introduction
Dyslexia is a prevalent human neurodevelopmental disability, characterized by a dif-
�culty learning to read despite conventional instruction, adequate educational oppor-
tunities and IQ, and a lack of sensory impairments (Shaywitz et al., 1992). It shows
familial clustering and is moderately heritable, with heritability estimates that range
from 0.3 to 0.8 (Peterson and Pennington, 2015). Studies thus far indicate a complex
multifactorial aetiology involving genetic and environmental factors (Bishop, 2015).
Multiple genetic variants are likely to act as risk factors contributing to the liabil-
ity to dyslexia. Until recent years, much of the research on the molecular basis of
dyslexia focused on a handful of candidate genes (e.g. ROBO1, KIAA0319, DCDC2,
and DYX1C1) that were identi�ed through linkage analysis in families, and then fol-
lowed up via �ne-mapping of association with common variants within those genes
(see Carrion-Castillo et al. (2013) for a review). In the last 2-3 years, genome wide as-
sociation scan (GWAS) studies have tried to identify other common genetic variants
a�ecting reading ability by querying the whole genome for association in a rela-
tively unbiased manner (Luciano et al., 2013; Field et al., 2013; Gialluisi et al., 2014;
Eicher et al., 2013). �ese GWAS e�orts have yielded some promising new candidate
genes, but so far no association reached genome-wide statistical signi�cance. �e
”common-disease common variant” hypothesis assumes that multiple, relatively fre-
quent variants in the population, each with a small e�ect, account for most of the
genetic susceptibility to common disorders (Schork et al., 2009), and this has been
the main focus of the �eld. Nevertheless, there are some unusual extended families
in which dyslexia is more prevalent than in the general population, and in which it
may follow a roughly Mendelian inheritance pa�ern (Fagerheim et al., 1999; Nopola-
Hemmi et al., 2001; de Kovel et al., 2004). It is possible that one, or a few, genetic
variants with substantial penetrances could explain dyslexia within these families, as
was the case for a translocation that disrupted the gene DYX1C1 and co-segregated
with dyslexia in one family (Taipale et al., 2003).
Next generation sequencing (NGS) has recently revolutionized the genetic anal-
ysis of human disorders by enabling the systematic and rapid screen of common
and rare mutations in the whole genome or whole exome (i.e. the protein-coding
regions of the genome). �is has led to the discovery of several disease-causing
genes underlying previously unsolved Mendelian disorders (Bamshad et al., 2011),
such as SETBP1 for Schinzel-Giedion syndrome (Hoischen et al., 2010), and TGM6

6.2 material and methods 171
for spinocerebellar ataxia (Wang et al., 2010). Moreover, this technology has also
been used to explore the extent to which rare alleles can explain the heritability of
complex diseases and health-related traits. For instance, through family-based ap-
proaches for detecting de novo mutations, NGS has identi�ed new genes involved in
the genetic architecture of complex and heterogenic diseases such as autism (Iossifov
et al., 2014) and intellectual disability (Gilissen et al., 2014).
�e use of NGS technology enables the inspection of almost the entire genome
or exome, while unusual families with recurrent dyslexia provide the possibility to
rank variants as putatively causal for the trait, according to how well they cosegre-
gate with the phenotype and their likely functional consequences at the molecular
level. For example, a recent study that performed whole exome sequencing (WES)
in an extended Swedish family found that a two-base mutation (chr3:123264558-9,
hg19), which resulted in an amino acid change (p.R229L) within the CEP63 gene,
co-segregated with dyslexia: six out of eight of the dyslexic people available for
genotyping were carriers of the risk variant (Einarsdo�ir et al., 2015).
In the current study, we have adopted a similar strategy to that in Chapter 5, i.e.
combining linkage analysis and whole genome sequencing (WGS). Evidence from
linkage analysis was used to reduce the number of putatively causal variants arising
from WGS, with the aim of identifying rare variants with high penetrance in this fam-
ily. We focused on three types of genetic variation that could potentially contribute
to explain the phenotype in this family: coding, noncoding, and structural. Identi�-
cation of such genetic variants promises to yield new clues on genes and pathways
that are important for the development of normal reading abilities, while common
variants in the same genes may also be relevant for more typical forms of dyslexia.
6.2 material and methods
6.2.1 Sample
We studied a three generation family of thirty members (referred to herea�er as
family 352, Figure 6.1), with a potentially rare Mendelian form of dyslexia. �e in-
heritance pa�ern was consistent with autosomal dominant transmission, with all
three generations presenting dyslexic people, roughly half of the family members af-
fected (n=14), similar numbers of a�ected males (n=8) and females (n=6), and three
instances of male-to-male transmission. �is family, which has not been previously

172 chapter 6: noncoding mutations in sema3c cosegregate with dyslexia
described in the literature, was recruited as part of a multidisciplinary research ef-
fort into di�erent aspects of dyslexia (the Dutch Dyslexia Programme) (van der Leij
and Maassen, 2013), in which families were ascertained when at least two �rst de-
gree relatives had a school history of reading problems (de Kovel et al., 2004; van der
Leij and Maassen, 2013). Informed consent was obtained from all participants and
the study was approved by the ethics commi�ee (CWOM) of the University Medical
Centre Nijmegen under CWOM-nr 9811-025.
6.2.2 Phenotypic measures and diagnostic criteria
�e subjects were administered a ba�ery of tests in single sessions, as brie�y de-
scribed below.
Word and nonword reading �uency
Word reading �uency was assessed using the One-Minute-Test (in Dutch, Een-Minuut-
Test or EMT), (Brus and Voeten, 1972), while nonword reading �uency was assessed
using the Klepel test (van den Bos et al., 1994). Participants were asked to correctly
read as many items as possible within one minute (word reading) or two minutes
(nonword reading).
Verbal competence
Verbal competence was assessed as part of the Dutch version of the Wechsler Adult
Intelligence Test (Uterwijk, 2000), which tests the ability of the subject to express
him/herself verbally. �e subject is o�ered two words and is asked to describe as
concisely as possible the similarities between them. Examples (in English) are car-
aeroplane or courage-cowardice.
Diagnostic criteria
Dyslexia was de�ned following the criteria of the Dutch Dyslexia Programme, which
is based on several reading-related quantitative measures (van der Leij and Maassen,
2013). People were de�ned as a�ected if they 1) performed below the 10th percentile
on a word reading test, or 2) scored below the 10th percentile on a nonword reading
test, or 3) scored below the 25th normative percentile on both word and nonword
reading tests, or 4) had a word or nonword reading score that was >60 percentage

6.2 material and methods 173
points below their normalized score on a verbal competence test (discrepancy crite-
rion). Following these criteria, 14 out of 29 tested family members were identi�ed as
dyslexic.
6.2.3 Genotyping
Twenty-six samples for which DNA was available, including 13 dyslexics, 11 non-
dyslexics and two people with unknown phenotype from family 352 (i.e. all except
I.2, II.7, III.9 and III.11 in Figure 6.1) were genotyped using the Illumina In�nium
OmniExpressExome-8 BeadChip (Illumina, 2016a) by the genomics service company
‘Euro�ns’ (Germany).
6.2.4 Genomewide linkage analysis
A total number of 7,338 SNPs, with a minimum distance between SNPs of 0.25 centi-
morgans (cM) and an average heterozygosity of 49.7%, were selected for multipoint
linkage analysis using LinkDataGen (Bahlo and Bromhead, 2009), which also �ltered
out Mendelian inheritance errors and removed non-polymorphic SNPs within the
family. Given the presence of three male-to-male transmissions in the family, which
are not compatible with a X-linked inheritance pa�ern, chromosome X was not an-
alyzed.
Multipoint parametric linkage analysis was performed using a dominant inheri-
tance model, assuming a disorder allele frequency of 1% and penetrances of 5%, 99%
and 99% for wild-type, heterozygous and homozygous-mutation carriers respectively.
We also performed an exploratory follow-up analaysis under a less penetrant domi-
nant model (with penetrances of 5%, 90% and 90%).
Given the uncertainty in de�ning a parametric model for this trait a priori, we also
conducted nonparametric (NPL) multipoint linkage analysis, which does not rely on
assumptions regarding monogenic inheritance, estimates of penetrance levels and
phenocopy rates (Fisher and DeFries, 2002). �e NPL tests only for an increase in
Identity-by-Descent (IBD) allele sharing in a�ected individuals, without specifying
a parametric model.
Both multipoint linkage analyses were performed using the Morgan (v3.2) pro-
grams lm bayes (parametric) and lm ibdtests (nonparametric) (�ompson, 2011), with
30000 Monte Carlo iterations for the autosomes.

174
chapter6:noncodingmutationsinsema3ccosegregatewithdyslexia
Family 352
WGS
WGS
WGSWGS
WGSI. 1 I. 2
II. 1 II. 2 II. 3 II. 4WGS
II. 5 II. 6 II. 7 II. 8 II. 9 II. 10 II. 11 II. 12 II. 13 II. 14
III. 1 III. 2 III. 3 III. 4WGSIII. 5 III. 6 III. 7 III. 8 III. 9 III. 10 III. 11 III. 12 III. 13 III. 14
Figure 6.1: Pedigree of family 352. Black symbols represent individuals diagnosed with dyslexia, white symbols represent non-
dyslexic individuals, and grey symbols are individuals for which the phenotype was not known. WGS: whole genome sequenced as
part of this study.

6.2 material and methods 175
Estimation of Genome-Wide Signi�cant Values
Genome-wide signi�cant linkage scores were calculated by simulations, using the
SNPs that were included in the real linkage analysis. Permutations were performed
using gene-dropping simulations, as implemented in Morgan. 1000 replicates were
simulated and each replicate was analyzed with the same parametric model as the
real data using lm bayes. �e signi�cance for each LOD score was assessed by: 1)
counting the number of replicates (n) in which the maximum LOD score exceeded
the highest observed LOD score and 2) calculating the p value as (n+1)/1001. �e
threshold for genome-wide signi�cant linkage was taken to be the highest LOD score
of the 1000 replicates.
Haplotype analysis
Haplotypes were generated for the genomic regions that showed multipoint LOD >
1. Haplotypes were created in the haplotype analysis tool simwalk2snp (Lange and
Lange, 2004) and visualized using Haplopainter (�iele and Nurnberg, 2005).
6.2.5 Whole Genome Sequencing
Genomic DNA samples collected from 7 members (5 a�ected and 2 una�ected, see
Figure 6.1) of family 352 were used for whole genome sequencing by the genomics re-
search organization and service company ’Novogene’ (Hong Kong) using Illumina’s
HiSeq Xten technology (Illumina, 2016b). �e sample selection was motivated by
the individual’s quantitative trait scores (i.e. taking those most severely a�ected or
obviously una�ected), and it was constrained by cost. Sequencing was at 30 times
average coverage depth with library insert size 2x 150 base pairs (paired-end).
6.2.6 WGS data processing
�e sequencing and data preparation was done in the same batch and following the
same pipeline as the samples in family 259 (Chaper 5). �e pipeline proceeded as
follows.
176 chapter 6: noncoding mutations in sema3c cosegregate with dyslexia
Alignment and pre-processing
Raw reads were cleaned by excluding adapter sequences, reads with low-quality
bases for more than 50% of their lengths, and reads with unknown bases for more
than 10% of their lengths. Clean reads comprised 97% of total reads, and were mapped
onto the human reference genome (hg19) using the so�ware Burrows-Wheeler Alig-
ner (BWA) (Li and Durbin, 2009). Bam �les were sorted using SAMtools (Li et al.,
2009) and PCR duplicate reads were marked using Picard (Picard, 2016). �e mean
sequence read length was 150 base pairs, and approximately 97.5% of the genome
was covered by at least a 10 times sequence read depth.
Re-alignment around indels (insertion/deletions) and base quality control recali-
bration was performed using the Genome analysis toolkit so�ware (GATK v3.4) (Mc-
Kenna et al., 2010; DePristo et al., 2011).
Variant calling and annotation
Since more accurate variant calls can be achieved by including data from larger num-
bers of subjects simultaneously, we ran this process by pooling our data from family
352 together with 54 additional samples from di�erent projects that had been se-
quenced with the identical protocols and in the same batches.
Genetic variants were called using the HaplotypeCaller (HC) tool of GATK (Mc-
Kenna et al., 2010; DePristo et al., 2011).. HC was run separately per sample using
the ‘-ERC GVCF’ mode, and then merged together using the GenotypeGVCFs tool,
as recommended by the GATK best practices (GATK v3.4). We performed Variant
�ality Score Recalibration (VQSR) to exclude the low quality variants (phred-scaled
Qscore < 30) and to �ag the rest into the sensitivity tier they fell into (90, 99, 99.9
and 100). �e variant calling of SNPs and indels identi�ed on average 4,523,372 per
sample (range: 4,455,342-4,581,631), for a total of 14,980,001 di�erent variants. �ese
variants were then annotated using Annovar (Wang et al., 2010) and Variant E�ect
Predictor (VEP v37) (McLaren et al., 2010).
6.2.7 Investigation of novel and rare variants
Imputation
In order to obtain genotype information on the family members that had not been
sequenced, all novel and rare variants from WGS (i.e. having less than 1% frequency

6.2 material and methods 177
in the 1000 Genomes database) were subjected to pedigree-based imputation. Inher-
itance vectors were sampled from a Markov chain Monte Carlo analysis of the mul-
tilocus marker data using gl auto (�ompson, 2011) and these were used to impute
genotype calls by GIGI (Cheung et al., 2013). �e genotype probability threshold to
call two alleles was set to 80%, and the threshold to call a single allele to 90%. �is
resulted in the imputation of 306,597 variants, with a mean imputation rate of 51.58%.
When the imputation resulted in haploid calls (i.e. only one allele imputed), we as-
sumed that the unknown allele was the reference allele, since only rare variants were
being imputed (the downstream analysis so�ware to evaluate cosegregation of vari-
ants with dyslexia in the family required diploid genotypes). Sex chromosomes were
excluded from the imputation with GIGI (Cheung et al., 2013), since (to our knowl-
edge) there is currently no available so�ware to impute genotypes on chromosome
X, based on pedigree structure.
Single-point linkage analysis
Single-point linkage analysis was conducted for all rare variants (i.e. novel in fam-
ily 352 or MAF<0.01 in the 1000Genomes database) located within genomic regions
with multipoint LOD> 1 or NPL >1, by using Pseudomarker2.0 (Hiekkalinna et al.,
2011), regardless of whether they had been included in the marker map used for
multipoint linkage analysis. We speci�ed the same dominant model as used for the
multipoint analysis (above). We also performed a family-based test of allelic associ-
ation (M) within this family, using the MQLS-XM package (�ornton and McPeek,
2007; �ornton et al., 2012) which does not assume a model. Imputed genotypes were
used for these two analyses. When that was not possible (i.e. when the imputation
rate was zero), we used the available genotypes from the sequence data.
Filtering of variants as potentially causative for the phenotype
Variants were excluded if they were not present in any a�ected members, or if they
were present in both una�ected members who had WGS data. �en, variants were
excluded which fell outside genomic regions of interest as speci�ed by the linkage
analysis (i.e. LOD or NPL > 1). �ese relatively low thresholds were chosen in or-
der not to exclude potentially causative variants which might have shown imperfect
co-segregation with dyslexia in the family. We then excluded common variants by
�ltering out any with reported MAF > 1 % in 1000G and ExAC’s European popula-
tions. Subsequently, we retained only those variants that were present in more than

178 chapter 6: noncoding mutations in sema3c cosegregate with dyslexia
60% of the dyslexic individuals. When available, imputed genotypes were used for
this �ltering step. For the variants that had not been imputed, we included variants
that were present in more than 60% of the a�ected individuals with sequence data
(i.e. at least 3/5 a�ected). �e �ltered set of variants was then queried under two
di�erent hypotheses:
First, we identi�ed exonic variants, excluding those annotated as synonymous
variants by both Annovar and VEP. �en, we identi�ed non-coding variants that
were predicted to be likely pathogenic, given either of the following annotation sum-
mary scores: GWAVA > 0.5 (Ritchie et al., 2014), CADD > 15 (Kircher et al., 2014).
�ese two scores consider information on potential regulation of expression and evo-
lutionary conservation, and each use di�erent algorithms (and assumptions) to eval-
uate the pathogenicity or functional importance of variants. Note that precomputed
scores are only available for single nucleotide variants (SNVs) and some indels, but
not all indels could not be evaluated by these scores. Unscored variants (786/3182)
for which neither CADD nor GWAVA metrics were available were �ltered out. We
further assessed the putative functional role of these variants by checking available
databases on regulatory regions of the genome (RegulomeDB (Boyle et al., 2012) and
HaploReg (Ward and Kellis, 2012)).
6.2.8 Structural variant (SV) calling
Several signals in WGS data (e.g. read-pairs, split-reads, and read-depth) can indicate
the presence of SVs (Mohiyuddin et al., 2015). Genotyping intensity data from SNP
arays can also be used to call copy number variants (CNVs). Hence, di�erent types
of SVs were called using the available data.
WGS
WGS data were used to call SVs, including deletions, duplications and inversions. SVs
were called using three variant calling programs: CNVnator (Abyzov et al., 2011),
BreakDancer (Chen et al., 2009) and Lumpy (Layer et al., 2014). Overlapping calls
from the three SV detectors were then combined within samples using MetaSV (Mo-
hiyuddin et al., 2015), considering as high-con�dence those SVs detected by at least
two of the tools. �e seven WGS samples had on average 311,500 SV calls (range:
310,900-311,900), of which on average 1,915 (range: 1,855-1,949) had been called by
at least two di�erent callers.

6.2 material and methods 179
SV calls across all samples were combined using the R package intanSV (Yao, 2016)
by merging the calls that had been made in at least two samples with a reciprocal
coordinate overlap larger than 10 %. �ere were a total of 26,799 overlapped calls,
22,954 deletions, 3,105 duplications, and 740 inversions.
�e SV calls were compared against the Database of Genomic Variants (DGV, re-
lease July 2015; downloaded from UCSC genome browser hg19, February 2016) to
annotate them as rare and common. �ose that overlapped by> 50% of their lengths
with �ve or fewer CNV events in the DGV were considered rare, while if they over-
lapped by > 50% of their lengths with more than �ve CNV events in the DGV they
were considered common. �ose that did not overlap with any CNV in the DGV
were classed as novel.
We excluded SVs as being potentially causative for the phenotype when they were
present in the una�ected individual II.14 (married into family 352), or when they
were common variants (as de�ned above) in the DGV database.
SVs from SNP microarrays
PennCNV (Wang et al., 2007) was used to detect Copy Number Variants (CNVs) from
the signal intensity data. �is program uses the normalized intensity data (Log R
Ratio, and B Allele Frequencies) for SNP and CNV probes to call putative CNVs using
a Hidden Markov Model (HMM). For this analysis, we used default HMM parameters,
as well as the PFB (Population Frequency of B allele) and GC (CG content model) �les
provided with the program (hhall.hg18.p�, hhall.hg18.gcmodel), since our sample
was too small to directly estimate these parameters from it. We used the joint calling
option in order to take advantage of the family structure. Since only a trio-structure
can be speci�ed, a separate trio was de�ned for each non-founder sample. As a result,
there were 1,947 CNV calls, and each sample had on average 92.7 calls (range: 31-
211). We �ltered out common CNVs (as de�ned for the DGV, see above) and CNVs
that fell outside of the linked genomic regions (multipoint LOD > 1 or multipoint
NPL > 1).

180 chapter 6: noncoding mutations in sema3c cosegregate with dyslexia
6.3 results
6.3.1 Multipoint linkage
Multipoint analysis identi�ed two regions of linkage with LOD > 1 (Figure 6.2) on
chromosomes 7 and 14 under the dominant parametric model. �e maximum LOD
score was 2.82 on 7q21.11 (chr7:80197286-83403157, hg19), in a region that encom-
passes several genes (CD36, SEMA3C, LOC100128317, HGF, CACNA2D1, LOC101927356,
PCLO, SEMA3E). �e linked region on 14q12 (chr14:29132877-29995029, hg19) had a
maximum LOD score of 1.45. �e empirical threshold for genome-wide signi�cant
linkage (occurring in 5% of genome-scans by chance in the permutation analyses)
was estimated to be 3.44, and the empirical P value for the maximum observed LOD
was P(LODmax=2.82)=0.109. Haplotypes of 7q21.11 showed that the linked region
was shared among all a�ected family members except for two, and no una�ected
members (Figure 6.4). �e multipoint parametric model with lower penetrances it
did not result in any genome-wide signi�cant linkages and it yielded a similar peak
at 7q21.11 (LODmax=2.42).
Additional linkages with NPL > 1 were present on chromosomes 1, 2, 3, 4, 5, 6, 7,
8, 9 and 13, with a maximum NPL score of 1.27 (see Figure 6.S1 and Table 6.S1 for
the exact de�nitions of all intervals with multipoint NPL > 1).

6.3
results
181
Figure 6.2: Parametric multipoint linkage analysis across the genome. Chromosomes are represented along the X axis (see top) in
numerical ascending order from le� to right, and from their p to q arms. �e Y axis shows the multipoint linkage LOD score.

182
chapter6:noncodingmutationsinsema3ccosegregatewithdyslexia
Scale
chr7:
1 Mb hg19
80,500,000 81,000,000 81,500,000 82,000,000 82,500,000 83,000,000
User Supplied Track 1
UCSC Genes (RefSeq, GenBank, CCDS, Rfam, tRNAs & Comparative Genomics)CD36
CD36
CD36
CD36
CD36
CD36
CD36
CD36
CD36
SEMA3C
SEMA3C
SEMA3C
AY927633
HGF
HGF
HGF
HGF
HGF
HGF
AK092048
CACNA2D1
CACNA2D1
AK055932 Mir_548 PCLO
PCLO
PCLO
PCLO
PCLO
SEMA3E
SEMA3E
0
1
2
3
LOD
chr7 (q21.11) 21.3 14.3 14.1 q21.11 21.322.1 q31.1 q33 q34q35
❛�
Scale
chr14:
200 kb hg19
29,200,000 29,300,000 29,400,000 29,500,000 29,600,000 29,700,000 29,800,000 29,900,000
User Supplied Track 1
UCSC Genes (RefSeq, GenBank, CCDS, Rfam, tRNAs & Comparative Genomics)FOXG1
C14orf23
C14orf23
BC034423
MIR548AI
0
1
2
3
LOD
chr14 (q12) p13 p12 14p11.2 q11.2 14q12 q21.1 21.221.3 23.1 24.2 q24.3 q31.1 q31.3 q32.2
❜�
Figure 6.3: Genomic regions of interest as de�ned by LOD > 1 (parametric linkage analysis). Multipoint linkage score (upper track)
shown over the UCSC genes (lower track) in a) chromosome 7q21.1 and b) chromosome 14q12.

6.3
results
183
-/- -/- -/--/-+/- ?-/- +/- -/- -/- +/-+/-+/--/-
?+/-
-/-+/- +/-?+/- -/- -/- -/- +/-?-/- -/- -/-+/-
93.36 93.67 94.26 94.63 95.40 95.89 96.19 96.60 97.37 97.65 98.22 98.62 99.49 99.74100.14100.85101.07101.57102.36102.90103.35103.70104.17104.85
93.36 93.67 94.26 94.63 95.40 95.89 96.19 96.60 97.37 97.65 98.22 98.62 99.49 99.74100.14100.85101.07101.57102.36102.90103.35103.70104.17104.85
93.36 93.67 94.26 94.63 95.40 95.89 96.19 96.60 97.37 97.65 98.22 98.62 99.49 99.74100.14100.85101.07101.57102.36102.90103.35103.70104.17104.85
II. 8 II. 10WGS
II. 14WGS
II. 9II. 1WGS
II. 7II. 3 II. 4WGS
II. 6 II. 12 II. 13II. 11II. 5II. 2
I. 2I. 1WGS
III. 10III. 5WGS
III. 14WGS
III. 11III. 1 III. 3 III. 4 III. 6 III. 13III.9III. 7 III. 8 III. 12III. 2
Figure 6.4: Haplotype visualization of the linked genomic region on chromosome 7q21.11. Carrier statuses for the rare variants
rs144517871 (Sanger sequenced) and rs143835534 (imputed) are indicated above each individual as: wild type: -/-, heterozygote
carrier: +/-, unknown: ?. �e putative ’risk haplotype’ is shown in red.

184 chapter 6: noncoding mutations in sema3c cosegregate with dyslexia
6.3.2 Rare or novel SNPs and indels
Coding variants
A�er �ltering (see above), there were two coding, rare or novel, non synonymous
variants that were present in at least 60% of the a�ected individuals with available
genotype data, as summarized in Table 6.1. �ese variants fell within the genes
RP1L1 (chromsome 8p23.1) and COL4A2 (chromosome 13.q34). Neither gene is lo-
cated within either of the two most strongly linked regions that arose from mul-
tipoint parametric analysis. RP1L1 codes for the retinitis pigmentosa like-1 gene,
which has been associated with occult macular dystrophy (OMIM 608581). COL4A2
encodes a subunit of type IV collagen, which is a major structural component of
basement membranes. Although the RP1L1 and COL4A2 SNVs from family 352 are
rare or new in the general population, they were relatively frequent in una�ected in-
dividuals within the family, as re�ected by low single-point linkage scores and high
MQLS pvalues (Table 6.1).
Non-coding or synonymous variants
A�er �ltering there were 65 non-coding or synonymous variants within putatively
linked genomic regions that were likely to be pathogenic or functional based on
CADD or GWAVA calls, 9 of which were present in more than 60% of the a�ected
people (Table 6.2). Most of them were also relatively frequent in the una�ected peo-
ple within the family. However, there were two SNVs (rs144517871 and rs143835534)
within the most strongly linked region on chromosome 7q21.11, located within the
�rst intron of the SEMA3C gene. �e imputed genotypes predicted that both would
cosegregate with dyslexia within the family, except for two putative phenocopies:
II.8 and III.4. �is was con�rmed by Sanger sequencing for rs144517871 (see Figure
6.4 for cosegregation). �e two SNVs are 184bp apart, and in perfect linkage disequi-
librium (LD) (r2=1). Each SNP yielded a single-point linkage LOD score of 1.82, and
a MQLS association pvalue of 0.02. �e frequencies of the observed variants were
0.0031 in the 1000G overall population and slightly higher (0.0099) in the European
subsample, as well as in a representative Dutch population (rs144517871=0.010 and
rs143835534=0.009) (Genome of the Netherlands, h�p://www.nlgenome.nl/search/)
(Francioli et al., 2014). We plo�ed the relationships of rs144517871 with word and
nonword reading �uency (Figure 6.6): this showed that risk-allele carriers for rs144517871
performed overall worse than non-carriers on both measures.

6.3 results 185
Scalechr7:
--->
GM12878 ChromHMMH1-hESC ChromHMM
K562 ChromHMMHepG2 ChromHMM
HUVEC ChromHMMHMEC ChromHMMHSMM ChromHMMNHEK ChromHMMNHLF ChromHMM
Master DNaseI HS
GapsHumanChimpGorilla
OrangutanGibbonRhesusMouse
DogElephantArmadilloLamprey
10 bases hg1980,547,380 80,547,385 80,547,390 80,547,395 80,547,400
G G T A A T T T T C A A A A G A A A C A G T T T C T T C C TUser Supplied Track 1
Simple Nucleotide Polymorphisms (dbSNP 146)
UCSC Genes (RefSeq, GenBank, CCDS, Rfam, tRNAs & Comparative Genomics)
Chromatin State Segmentation by HMM from ENCODE/Broad
DNaseI Hypersensitive Site Master List (125 cell types) from ENCODE/Analysis
100 vertebrates Basewise Conservation by PhyloP
Multiz Alignments of 100 Vertebrates
100 vertebrates conservation by PhastCons
100 vertebrates Conserved Elements
rs144517871
SEMA3CSEMA3CSEMA3C
G G T A A T T T T C A A A A G A A A C A G T T T C T T C C TG G T A A T T T T C A A A A G A A A C A G T T T C T T C C TG G T A A T T T T C A A A A G A A A C A G T T T C T T C C TG G T A A T T T T C A A A A G A A A C A G T T T C T T C C TG G T A A T T T T C A A A A G A A A C A C T T T C T T C C TG G T A A T T T T C A A A A G A A A C A G T T T C T T C C TG G T A A T T T T C A A A A G A A A C A G T T T C T T C C TG G T A A T T T T C A A A C G A A A C A G T T T C T T C C TG G T A A T T T T C A A A A G A A A C A G T T C C T T C C TG G T A A T T T T C A A A A G A A A C A A T T T C T T C C T
lod=80lod=132
0123
LOD1
100 Vert. Cons4.88 _
-4.5 _
100 Vert. Cons1 _
0 _
Figure 6.5: Detailed annotation of the genomic region around rs144517871 using the
UCSC Genome Browser (hg19). Tracks are included for ENCODE digital DNaseI HS
hypersensitivity clusters, ENCODE/Broad chromatin state segmentation by HMM in
several cell lines, as well as 100 Vertebrate consevation scores (PhyloP, PhansCons, Con-
served elements) and sequence alignment (Multiz Alignments of 100 Vertebrates).
�e variant rs144517871 is predicted to be within a regulatory region according to
the EnsemblRegulatory Build (Zerbino et al., 2015), and had high scores for functional
prediction, CADD=26.3 and GWAVA=0.82. �e variant has promoter and enhancer
histone marks in several tissues (17 and 4 tissues respectively, Figure 6.5). It is pre-
dicted to alter several regulatory motifs (Haploreg: Pou2f2, Pou5f1,ZEB1 (Ward and
Kellis, 2012); Regulome: Pou5f1 (Boyle et al., 2012)). It is also well conserved across
mammals, with a GERP conservation score of 4.73. �e other variant within the
SEMA3C intron, rs143835534, had lower functional prediction scores, CADD=6.57
and GWAVA=0.74. It shares some of the histone marks with rs144517871, and also
is predicted to alter some regulatory motifs, but it is not evolutionarily conserved
(GERP=-1.28) (Figure 6.S2).

186
chapter6:noncodingmutationsinsema3ccosegregatewithdyslexia
Chr Position Ref Alt cytoBand dbSNP138 Gene Transcript AA.change MAF1000G MAFExAC MQLS LODsp ImpRate A�ected Una�ected
8 10465152 A C 8p23.1 rs192863038 RP1L1 NM 178857 p.D2152E - - 0.33 0.01 0 0.6 0.5
13 111082914 A T 13q34 rs201716258 COL4A2 NM 001846 p.H203L 2e-04 1.5e-04 0.11 0.00 0.48 0.80 0.33
Table 6.1: Rare, exonic, nonsynonymous variants present at least in 60% of the a�ected individuals in family 352 a�er �ltering (see
text). Ref: reference allele in hg19. Alt: alternative observed allele. AA.change: aminoacid change. LODsp: single point LOD score.
ImpRate: Imputation rate of the variant. A�ected, una�ected: frequency of variant carriers of each type in the family. If the ImpRate
is not 0, the proportions of carriers are given for the imputed genotypes; otherwise, for the people with available data.

6.3
results
187
Chr Position Ref Alt cytoBand dbSNP138 Gene Func MAF1000G CADD GWAVA MQLS LOSDsp ImpRate A�ected Una�ected
1 68296119 T C 1p31.3 rs111907541 GNG12 intronic 1.8e-03 6.32 0.64 0.07 0.11 0.30 0.67 0.00
1 68300052 G A 1p31.3 rs111472994 GNG12-AS1 ncRNA intronic 2.0e-03 27.60 0.84 0.07 0.11 0.30 0.67 0.00
1 70507620 G A 1p31.1 rs189591558 LRRC7 intronic 2.0e-04 8.55 0.51 0.23 0.06 0.30 0.83 0.50
2 5865630 G A 2p25.2 rs145390307 SOX11,LINC01105 intergenic 1.6e-03 0.39 0.65 0.23 0.18 0.48 0.70 0.00
2 6776265 T C 2p25.2 rs142428415 LINC01246,MIR7515HG intergenic 2.8e-03 4.39 0.63 0.23 0.18 0.48 0.70 0.00
3 9419889 T C 3p25.3 . THUMPD3 intronic - 19.05 - 0.23 0.00 0.48 0.70 0.33
7 80547391 A C 7q21.11 rs144517871 SEMA3C intronic 3.2e-03 26.30 0.82 0.02 1.84 0.52 0.90 0.00
7 80547575 T C 7q21.11 rs143835534 SEMA3C intronic 3.2e-03 6.57 0.74 0.02 1.84 0.52 0.90 0.00
7 93715698 G - 7q21.3 - - - - 15.19 - 0.32 0.31 0.52 0.70 0.25
Table 6.2: Rare, noncoding variants that are were predicted to be pathogenic within linked genomic regions. A�ected, una�ected:
frequency of variant carriers of each type in the family. If the ImpRate is not 0, the proportions of carriers are given for the imputed
genotypes; otherwise, for the people with available WGS data.

188 chapter 6: noncoding mutations in sema3c cosegregate with dyslexia
6.3.3 Structural and copy number variants
�ere were 121 SV calls from the WGS data that fell within the linked regions with
multipoint linkage scores of NPL>1 or LOD>1. Of these, 46 were present in >
60 % of the a�ected members (i.e. in at least 3/5 a�ected members) and only �ve
cosegregated with dyslexia within the WGS samples (i.e. �ve a�ected members had
them, and the two una�ected did not). �ese were four deletions and one duplica-
tion that were each called by only one out of the three callers (either CNVnator or
BreakDancer) and were therefore considered as uncertain calls (see Table 6.S2). One
of these (chr7:82725900-82727020) was a 1,120 bp deletion that fell within the most
strongly linked region on 7q21.11, located in the third intron of the gene PCLO.
�ere were 12 CNV calls from the SNP array data that fell within regions with
multipoint linkage scores of NPL>1 or LOD>1. Of these, most were only present
in 1-3 a�ected members, and one was present in 8/14 of the a�ected members and
only in 2/11 una�ected members. �is CNV was a 5.58kb duplication on 7q21.11
(chr7:81070971-81076550), although some of the samples (3 a�ected and 1 una�ected)
had a smaller call of 2kb encompassing only a subset of the region (chr7:81074519-
81076550, see Table 6.S2). �is duplication was located between the noncoding RNA
AY927633 (telomeric 12.89Kb) and the gene SEMA3C (51.91Kb centromeric).
6.4 discussion
In the present study we adopted a strategy of combining linkage analysis with WGS
to identify genetic variants that contribute to dyslexia in an extended family.
�e most strongly dyslexia-linked region, on chromosome 7q21.11, was identi�ed
by dominant parametric multipoint linkage analysis (LOD=2.82). Except for two af-
fected members that were putative phenocopies, the risk haplotype cosegregated
perfectly with dyslexia status in the family: it was found in heterozygote state in 12
members with dyslexia and absent from all those without dyslexia. �e linked re-
gion encompassed several genes (CD36, SEMA3C, LOC100128317, HGF, CACNA2D1,
LOC101927356, PCLO, SEMA3E). Within this region, there were two rare (MAF<0.01),
noncoding single nucleotide variants (rs144517871 and rs143835534) predicted to
have functional e�ects, located in the �rst intron of the gene SEMA3C, and in high LD
with each other. �ese variants co-segregated perfectly with the risk haplotype. In
silico characterization showed that rs144517871 a�ects an evolutionarily contrained

6.4 discussion 189
0
25
50
75
Wordreading fluency
Nonwordreading fluency
Test
PercentileScore
rs144517871
-/-
+/-
Figure 6.6: Mean percentile scores on word and non-word reading tests for carriers
(black bars, n=11) and non-carriers (grey bars, n=15) of the rs144517871 risk allele (7q21
haplotype). Error bars show one standard deviation within this family.
III.2
III.3
II.10
II.1
I.1
II.5
Figure 6.7: Sanger sequencing chromatograms for representative wile-type (A/A) and
rs144517871 risk allele carrier (M=A/C) family members. Heterozygous genotypes: in-
dividuals III.2, II.5, II.1, I.1; homozygous individuals: III.3, II.10.

190 chapter 6: noncoding mutations in sema3c cosegregate with dyslexia
regulatory region in the �rst intron of SEMA3C (which is located between exons
that are part of the 5’UTR). It is therefore possible that this variant has a cis regula-
tory e�ect on the expression of SEMA3C. Since dyslexia is a relatively subtle pheno-
type, genetic contributions to it need not have severe consequences at the molecu-
lar/cellular level. A regulatory mechanism that a�ects the amount of mRNA/protein,
rather than a protein’s function itself, is biologically plausible. In order to further
explore this hypothesis, it will be necessary to perform functional molecular assays
(e.g. luciferase assays), as was done in previous studies in which SNPs associated
with dyslexia were shown to a�ect the expression of proximal genes (Dennis et al.,
2009; Hannula-Jouppi et al., 2005).
SEMA3C encodes a class III semaphorin, which are secreted proteins that bind to
plexin and play an important role in the regulation of developmental processes, in-
cluding by providing guidance cues to migrating cortical neurons (Chen et al., 2008).
In fact, SEMA3C has been shown to control cortical projection, neuron polarization
and migration (Wiegre�e et al., 2015). Given its roles in brain development, SEMA3C
represents a convincing candidate gene for dyslexia, a cognitive trait which has
been associated with changes in cerebral cortical architecture (Giraud and Ramus,
2012). Of potential relevance, a previous linkage study of families with dyslexia and
Rolandic epilepsy (Strug et al., 2012) reported a dyslexia-linked locus spanning the
same location on 7q21.11 (multipoint LOD=3.08, microsatellite marker at linkage
peak = D7S660). Since SEMA3C was the closest gene to the peak of linkage with
dyslexia in the study by Strug et al. (2012), those authors screened the protein-coding
and promoter regions of the SEMA3C gene for mutations in one of the families that
contributed most to their linkage LOD score. However, they were unable to identify
mutations that co-segregated with dyslexia, and suggested that either intronic re-
gions or other genes could be responsible for the signal. In light of our data from the
present study, it would be worth further investigating the families studied by (Strug
et al., 2012) with a focus on potential regulatory variation a�ecting SEMA3C.
Given the scope for incomplete penetrance and phenocopy for dyslexia, we also
considered other genomic regions that were linked to a lesser degree than 7q21.11
in family 359 (i.e. any regions with LOD or NPL scores>1): a locus on chromosome
14q12 from the parametric analysis, and several other loci on chromosomes 1-9 and
13 that were found linked in the nonparametric analysis. A�er �ltering, there were
two rare, coding, nonsynonymous variants within genomic regions showing multi-
point linkage scores higher than 1 (NPL or LOD). However, neither of the two vari-

6.4 discussion 191
ants yielded signi�cant single-point linkage scores or MQLS scores. �is suggests
that they are not likely to be strongly penetrant for dyslexia in this family. Neverthe-
less, it is interesting that one of them falls within the gene COL4A2 on chromosome
13q34, since a common SNP in this gene was recently associated with comorbid read-
ing disability and language impairment in a genome-wide association study (Eicher
et al., 2013). However, this association was not replicated with reading-related quan-
titative traits in two other samples (Eicher et al. (2013) and see Chapter 4).
Non-synonymous variants in protein-coding regions can be used to infer changes
in gene function in a relatively direct manner. Functional annotation of variants
outside of protein-coding regions is more complex. In this study, we used summary
scores (CADD and GWAVA) (Kircher et al., 2014; Ritchie et al., 2014) that integrate
information from di�erent sources at the DNA and protein levels (e.g. ENCODE
annotation for DNaseI hypersensitivity, transcription factor binding sites and mo-
tifs, chemical similarity of amino acid substition) and genomic properties (including
evolutionary conservation, GC content) to rank variants according to expected dele-
teriousness (CADD) or pathogenicity (GWAVA). �e CADD metric measures dele-
teriousness by contrasting variants that survived natural selection (i.e. �xed in the
human lineage) with simulated mutations (Kircher et al., 2014), in such a way that
variants with higher scores are likely to have been selected against (given their anno-
tation pa�ern). �e GWAVA score uses similar sources of annotation, to discriminate
between disease-causing (i.e. pathogenic) and control variants, and apply this infor-
mation to weight variants across the genome (Ritchie et al., 2014). As dyslexia is
not a pathogenic trait, we could not assume that causal variants in this family have
necessarily been selected against. However, we took advantage of pathogenicity and
deleteriousness metrics to rank the variants, as a proxy for a�ecting gene function.
We are not aware of a method to predict biological e�ects of variants in a way that
is entirely neutral with respect to selection, since comparative information on what
changes are ‘tolerated’ are inherent to published approaches for both coding and non-
coding variants (comparative information across proteins, across variants, or across
species). Furthermore, a variant may cause a non-pathogenic trait in dominant form,
but a disease in recessive form. Variants may also have pleiotropic e�ects, causing
increased risk in relation to one pathogenic trait, and non-pathogenic modi�cation
of another trait. �us, even for a non-pathogenic trait, the CADD and GWAVA met-
rics were useful tools to rank noncoding variants for possible functional relevance.
Both tools predicted that rs144517871 (within SEMA3C) has functional e�ects.
192 chapter 6: noncoding mutations in sema3c cosegregate with dyslexia
Our SV analysis detected a putative intronic deletion of 1.12kb within the PCLO
gene (also on 7q21.11), which was predicted to cosegregate with dyslexia (except
for two putative phenocopies). However, the putatively deleted region did not con-
tain any regulatory elements as annotated in ENCODE. Furthermore, this deletion
fell within a highly repetitive region (containing a Short Interspersed Nuclear Ele-
ment (SINE) and a simple TATAA repeat, as de�ned by Repeatmasker (Smit et al.,
2013-2015) and was only called by one of the several algorithms used for identifying
structural variants.
In summary, a combination of linkage analysis and WGS was used to identify novel
or rare variants a�ecting dyslexia in an extended Dutch family. �is strategy has
proven to be a powerful approach to �nd causative variants for several monogenic
and more complex traits (Rosenthal et al., 2013; Norton et al., 2013). We identi�ed
a region on chromosome 7q21.11 linked to dyslexia, which was concordant with a
linkage reported in a previous study (Strug et al., 2012). �ere were no rare or novel
exonic variants within this region, but two rare (MAF < 0.01) non-coding variants
within the �rst intron of the gene SEMA3C, which were predicted to be functional,
were found in all but two family members with dyslexia, while being absent from
una�ected members). �us, we propose SEMA3C as a candidate gene for dyslexia,
and hypothesize that these intronic variants could have a cis regulatory e�ect on the
expression levels of the gene. Further work will be required to assess the functional
aspects of the variants in biological models, and to establish a causal relationship
between these genetic variants and dyslexia.

References 193
references
Abyzov A, Urban AE, Snyder M, Gerstein M (2011) CNVnator: an approach to dis-
cover, genotype, and characterize typical and atypical CNVs from family and pop-
ulation genome sequencing. Genome Res 21: 974–984.
Bahlo M, Bromhead CJ (2009) Generating linkage mapping �les from A�ymetrix SNP
chip data. Bioinformatics 25: 1961–1962.
Bamshad MJ, Ng SB, Bigham AW, Tabor HK, Emond MJ, et al. (2011) Exome sequenc-
ing as a tool for Mendelian disease gene discovery. Nat Rev Genet 12: 745–755.
Bishop DV (2015) The interface between genetics and psychology: lessons from de-
velopmental dyslexia. Proc Biol Sci 282.
Boyle AP, Hong EL, Hariharan M, Cheng Y, Schaub MA, et al. (2012) Annotation
of functional variation in personal genomes using RegulomeDB. Genome Res 22:
1790–1797.
Brus BT, Voeten MJM (1972) Een-minuut-test [one-minute-test]. Swets & Zeitlinger.
Carrion-Castillo A, Franke B, Fisher SE (2013) Molecular genetics of dyslexia: an
overview. Dyslexia 19: 214–240.
Chen G, Sima J, Jin M, Wang KY, Xue XJ, et al. (2008) Semaphorin-3A guides radial
migration of cortical neurons during development. Nat Neurosci 11: 36–44.
Chen WM, Manichaikul A, Rich SS (2009) A generalized family-based association
test for dichotomous traits. Am J Hum Genet 85: 364–376.
Cheung CY, �ompson EA, Wijsman EM (2013) GIGI: an approach to e�ective impu-
tation of dense genotypes on large pedigrees. Am J Hum Genet 92: 504–516.
de Kovel CG, Hol FA, Heister JG, Willemen JJ, Sandkuijl LA, et al. (2004) Genome-
wide scan identi�es susceptibility locus for dyslexia on Xq27 in an extended Dutch
family. J Med Genet 41: 652–657.
Dennis MY, Paracchini S, Scerri TS, Prokunina-Olsson L, Knight JC, et al. (2009) A
common variant associated with dyslexia reduces expression of the KIAA0319
gene. PLoS Genet 5: e1000436.
DePristo MA, Banks E, Poplin R, Garimella KV, Maguire JR, et al. (2011) A framework
for variation discovery and genotyping using next-generation DNA sequencing
data. Nat Genet 43: 491–498.
Eicher JD, Powers NR, Miller LL, Akshoomo� N, Amaral DG, et al. (2013) Genome-
wide association study of shared components of reading disability and language
impairment. Genes Brain Behav 12: 792–801.

194 chapter 6: noncoding mutations in sema3c cosegregate with dyslexia
Einarsdo�ir E, Svensson I, Darki F, Peyrard-Janvid M, Lindvall JM, et al. (2015) Mu-
tation in CEP63 co-segregating with developmental dyslexia in a Swedish family.
Hum Genet 134: 1239–1248.
Fagerheim T, Raeymaekers P, T?nnessen FE, Pedersen M, Tranebjaerg L, et al. (1999)
A new gene (DYX3) for dyslexia is located on chromosome 2. J Med Genet 36:
664–669.
Field LL, Shumansky K, Ryan J, Truong D, Swiergala E, et al. (2013) Dense-map
genome scan for dyslexia supports loci at 4q13, 16p12, 17q22; suggests novel locus
at 7q36. Genes Brain Behav 12: 56–69.
Fisher SE, DeFries JC (2002) Developmental dyslexia: genetic dissection of a complex
cognitive trait. Nat Rev Neurosci 3: 767–780.
Francioli LC, Menelaou A, Pulit SL, van Dijk F, Palamara PF, et al. (2014) Whole-
genome sequence variation, population structure and demographic history of the
Dutch population. Nat Genet 46: 818–825.
Gialluisi A, Newbury DF, Wilcu� EG, Olson RK, DeFries JC, et al. (2014) Genome-
wide screening for DNA variants associated with reading and language traits.
Genes Brain Behav 13: 686–701.
Gilissen C, Hehir-Kwa JY, �ung DT, van de Vorst M, van Bon BW, et al. (2014)
Genome sequencing identi�es major causes of severe intellectual disability. Na-
ture 511: 344–347.
Giraud AL, Ramus F (2012) Neurogenetics and auditory processing in developmental
dyslexia. Curr Opin Neurobiol 23: 1–6.
Hannula-Jouppi K, Kaminen-Ahola N, Taipale M, Eklund R, Nopola-Hemmi J, et al.
(2005) The axon guidance receptor gene ROBO1 is a candidate gene for develop-
mental dyslexia. PLoS Genet 1: e50.
Hiekkalinna T, Scha�er AA, Lambert B, Norrgrann P, Goring HH, et al. (2011) PSEU-
DOMARKER: a powerful program for joint linkage and/or linkage disequilibrium
analysis on mixtures of singletons and related individuals. Hum Hered 71: 256–
266.
Hoischen A, van Bon BW, Gilissen C, Arts P, van Lier B, et al. (2010) De novo muta-
tions of SETBP1 cause Schinzel-Giedion syndrome. Nat Genet 42: 483–485.
Illumina (2016a) Illumina Human OmniExpress-Exome. URL h�p://www.illumina.
com/products/in�nium humanomniexpressexome beadchip kits.html.
Illumina (2016b) Illumina X-ten. URL h�p://www.illumina.com/systems/
hiseq-x-sequencing-system.html.

References 195
Iossifov I, O’Roak BJ, Sanders SJ, Ronemus M, Krumm N, et al. (2014) The contribu-
tion of de novo coding mutations to autism spectrum disorder. Nature 515: 216–
221.
Kircher M, Wi�en DM, Jain P, O’Roak BJ, Cooper GM, et al. (2014) A general frame-
work for estimating the relative pathogenicity of human genetic variants. Nat
Genet 46: 310–315.
Lange EM, Lange K (2004) Powerful allele sharing statistics for nonparametric link-
age analysis. Hum Hered 57: 49–58.
Layer RM, Chiang C, �inlan AR, Hall IM (2014) LUMPY: a probabilistic framework
for structural variant discovery. Genome Biol 15: R84.
Li H, Durbin R (2009) Fast and accurate short read alignment with Burrows-Wheeler
transform. Bioinformatics 25: 1754–1760.
Li H, Handsaker B, Wysoker A, Fennell T, Ruan J, et al. (2009) The Sequence Align-
ment/Map format and SAMtools. Bioinformatics 25: 2078–2079.
Luciano M, Evans DM, Hansell NK, Medland SE, Montgomery GW, et al. (2013) A
genome-wide association study for reading and language abilities in two popula-
tion cohorts. Genes Brain Behav 12: 645–652.
McKenna A, Hanna M, Banks E, Sivachenko A, Cibulskis K, et al. (2010) The Genome
Analysis Toolkit: a MapReduce framework for analyzing next-generation DNA
sequencing data. Genome Res 20: 1297–1303.
McLaren W, Pritchard B, Rios D, Chen Y, Flicek P, et al. (2010) Deriving the con-
sequences of genomic variants with the Ensembl API and SNP E�ect Predictor.
Bioinformatics 26: 2069–2070.
Mohiyuddin M, Mu JC, Li J, Bani Asadi N, Gerstein MB, et al. (2015) MetaSV: an
accurate and integrative structural-variant caller for next generation sequencing.
Bioinformatics 31: 2741–2744.
Nopola-Hemmi J, Myllyluoma B, Haltia T, Taipale M, Ollikainen V, et al. (2001) A
dominant gene for developmental dyslexia on chromosome 3. J Med Genet 38:
658–664.
Norton N, Li D, Rampersaud E, Morales A, Martin ER, et al. (2013) Exome sequencing
and genome-wide linkage analysis in 17 families illustrate the complex contribu-
tion of TTN truncating variants to dilated cardiomyopathy. Circ Cardiovasc Genet
6: 144–153.
Peterson RL, Pennington BF (2015) Developmental dyslexia. Annu Rev Clin Psychol
11: 283–307.

196 chapter 6: noncoding mutations in sema3c cosegregate with dyslexia
Picard (2016) Picard. URL h�ps://broadinstitute.github.io/picard/.
Ritchie GR, Dunham I, Zeggini E, Flicek P (2014) Functional annotation of noncoding
sequence variants. Nat Methods 11: 294–296.
Rosenthal EA, Ranchalis J, Crosslin DR, Burt A, Brunzell JD, et al. (2013) Joint link-
age and association analysis with exome sequence data implicates SLC25A40 in
hypertriglyceridemia. Am J Hum Genet 93: 1035–1045.
Schork NJ, Murray SS, Frazer KA, Topol EJ (2009) Common vs. rare allele hypotheses
for complex diseases. Curr Opin Genet Dev 19: 212–219.
Shaywitz SE, Escobar MD, Shaywitz BA, Fletcher JM, Makuch R (1992) Evidence that
dyslexia may represent the lower tail of a normal distribution of reading ability. N
Engl J Med 326: 145–150.
Smit A, Hubley R, Green P (2013-2015) RepeatMasker Open-4.0. URL h�p://www.
repeatmasker.org.
Strug LJ, Addis L, Chiang T, Baskurt Z, Li W, et al. (2012) The genetics of reading
disability in an o�en excluded sample: novel loci suggested for reading disability
in Rolandic epilepsy. PLoS ONE 7: e40696.
Taipale M, Kaminen N, Nopola-Hemmi J, Haltia T, Myllyluoma B, et al. (2003) A
candidate gene for developmental dyslexia encodes a nuclear tetratricopeptide re-
peat domain protein dynamically regulated in brain. Proc Natl Acad Sci USA 100:
11553–11558.
�iele H, Nurnberg P (2005) HaploPainter: a tool for drawing pedigrees with complex
haplotypes. Bioinformatics 21: 1730–1732.
�ompson E (2011) The structure of genetic linkage data: from LIPED to 1M SNPs.
Hum Hered 71: 86–96.
�ornton T, McPeek MS (2007) Case-control association testing with related individ-
uals: a more powerful quasi-likelihood score test. Am J Hum Genet 81: 321–337.
�ornton T, Zhang Q, Cai X, Ober C, McPeek MS (2012) XM: association testing on
the X-chromosome in case-control samples with related individuals. Genet Epi-
demiol 36: 438–450.
Uterwijk J (2000) WAIS-III Nederlandstalige Bewering. Technische Handleiding.
Lisse: Swets and Zeitlinger.
van den Bos KP, Lutje Spelberg HC, Scheepstra AJM, de Vries JR (1994) De klepel:
Een test voor de leesvaardigheid van pseudowoorden [the klepel: A test for the
reading skills of pseudowords]. Swets & Zeitlinger .
van der Leij A, Maassen B (2013) Dutch Dyslexia Programme. Dyslexia 19: 189–190.

Supplementary information 197
Wang K, Li M, Hadley D, Liu R, Glessner J, et al. (2007) PennCNV: an integrated hid-
den Markov model designed for high-resolution copy number variation detection
in whole-genome SNP genotyping data. Genome Res 17: 1665–1674.
Wang K, Li M, Hakonarson H (2010) ANNOVAR: functional annotation of genetic
variants from high-throughput sequencing data. Nucleic Acids Res 38: e164.
Ward LD, Kellis M (2012) HaploReg: a resource for exploring chromatin states, con-
servation, and regulatory motif alterations within sets of genetically linked vari-
ants. Nucleic Acids Res 40: D930–934.
Wiegre�e C, Simon R, Peschkes K, Kling C, Strehle M, et al. (2015) Bcl11a (Ctip1)
Controls Migration of Cortical Projection Neurons through Regulation of Sema3c.
Neuron 87: 311–325.
Yao W (2016) intansv: Integrative analysis of structural variations. R package version
1.6.2.
Zerbino DR, Wilder SP, Johnson N, Jue�emann T, Flicek PR (2015) The ensembl reg-
ulatory build. Genome Biol 16: 56.
supplementary information
Nonparametric linkage analysis

198 Chapter 6: Noncoding mutations in SEMA3C cosegregate with dyslexia
Chr Start End NPLmax
1 67231916 71001920 1.27
2 5241229 8102347 1.04
3 397958 1317869 1.27
3 9066156 9831970 1.04
4 97475233 98597993 1.27
5 172469848 172758076 1.27
6 10897488 11730612 1.27
7 52443808 53706347 1.27
7 62241041 66786374 1.27
7 93557588 94948841 1.27
8 3984856 21474049 1.27
9 290670 571192 1.27
13 110353253 111111777 1.27
Table 6.S1: Genomic regions of interest as de�ned by NPL> 1 (non-parametric linkage
analysis). Coordinates are given for the genome reference hg19. NPLmax indicates the
maximum NPL score within each interval.

Supplementaryinformation
199
Figure 6.S1: Nonparametric multipoint linkage analysis across the genome. Chromosomes are represented along the X axis (see top)
in numerical ascending order from le� to right, and from their p to q arms. �e Y axis shows the multipoint linkage LOD score.

200
Chapter6:NoncodingmutationsinSEMA3Ccosegregatewithdyslexia
Annotation of SEMA3C intron 1
Scale
chr7:
Ensembl Reg Build
TFBS Conserved
GM12878 ChromHMM
H1-hESC ChromHMM
K562 ChromHMM
HepG2 ChromHMM
HUVEC ChromHMM
HMEC ChromHMM
HSMM ChromHMM
NHEK ChromHMM
NHLF ChromHMM
Master DNaseI HS
Multiz Align
100 Vert. El
1 kb hg19
80,546,500 80,547,000 80,547,500 80,548,000 80,548,500
User Supplied Track 1
UCSC Genes (RefSeq, GenBank, CCDS, Rfam, tRNAs & Comparative Genomics)
Overview of Ensembl Regulatory Build
HMR Conserved Transcription Factor Binding Sites
Chromatin State Segmentation by HMM from ENCODE/Broad
DNaseI Hypersensitive Site Master List (125 cell types) from ENCODE/Analysis
Vertebrate Multiz Alignment & Conservation (100 Species)
SEMA3C
SEMA3C
SEMA3C
0
1
2
3
LOD
TFBS Summary
100 Vert. Cons
100 Vert. Cons
rs144517871 rs143835534
Figure 6.S2: Detailed annotation of the genomic region �rst intron of SEMA3C using the UCSC Genome Browser (hg19). �e variants
rs144517871 and rs143835534 are marked in blue. Tracks for ENCODE digital DNaseI HS hypersensitivity clusters, transcription factor
binding sites, ENCODE/Broad chromatin state segmentation by HMM in several cell lines, as well as 100 Vertebrate consevation scores
(PhyloP, PhansCons, Conserved elements) and sequence alignment (Multiz Alignments of 100 Vertebrates) are included.

Supplementaryinformation
201
Structural variation
Data Chr Start End Size Type A�ected Una�ected CytoBand Genes Region
WGS 7 64968140 64970840 2700 dup 5 0 7q11.21 - -
WGS 7 65679120 65680880 1760 del 5 0 7q11.21 TPST1 intron
PennCNV 7 81070971 81076550 5579 dup 3 1 7q21.11 - -
PennCNV 7 81074519 81076550 2031 dup 5 1 7q21.11 - -
WGS 7 82725900 82727020 1120 del 5 0 7q21.11 PCLO intron
WGS 7 93831480 93832280 800 del 5 0 7q21.3 - -
WGS 8 12274140 12276320 2180 del 5 0 8q23.1 FAM66A, FAM90A25P, LOC100506990
Table 6.S2: Structural variants within linked genomic regions. A�ected, una�ected: count of variant carriers of each type, among
the family members with available data (WGS: 5 a�ected, 2 una�ected; SNP array: 14 a�ected, 11 una�ected). Type of SV call:
del=deletion, dup=duplication.


7
D I S C U S S I O N
Reading is a complex behavioural phenotype, and di�erent types of genetic variants
are expected to a�ect its variability. �is thesis was aimed at clarifying the genetic
underpinnings of individual di�erences in reading ability.
7.1 summary
A literature review in Chapter 2 provided a thorough overview of the known molec-
ular basis of dyslexia. In particular, I evaluated statistical and biological evidence
for the contributions to dyslexia and related traits of the most prominent candidate
genes in the literature, including DYX1C1, DCDC2, KIAA0319 and ROBO1. �ese
genes have been implicated in dyslexia by several complementary lines of evidence:
linkage studies have mapped possible dyslexia-susceptibility genomic regions; sin-
gle nucleotide polymorphisms (SNPs) located within or neighbouring the genes have
been associated with reading and related phenotypes; molecular studies have re-
vealed gene-regulatory features of some of the associated SNPs, suggesting possi-
ble functional involvements; and animal models with altered gene functions have
been found to have relevant phenotypes (e.g. heterotopias, abnormal migration of
cortical neurons, ciliary motility defects). Moreover, some of the candidate genes
and variants have recently been subjected to electrophysiological and functional or
structural brain imaging studies, leading researchers to conclude that they are asso-
ciated with brain regions and processes implicated in reading. In sum, these studies
have provided support for the involvement of these genes in the neurobiology un-
derlying reading ability. Yet, at the same time, the �eld contains contrasting results,
with multiple non-replications and opposite directionality of allelic e�ects that hin-
der progress on the basis of the available data.
203

204 chapter 7: discussion
In Chapter 3, I targeted fourteen of the most consistently associated SNPs in the
literature, which fell within the candidate genes DYX1C1, KIAA0319, DCDC2, CNT-
NAP2 and CMIP and assessed them in relation to reading �uency, rapid naming, pho-
neme awareness and nonword repetition in the longitudinal dataset of the Dutch
Dyslexia Programme (DDP). Evidence of association was found for 5 SNPs, but for
most of these the directions of e�ect were not consistent with previous studies. Two
SNPs within the 5’UTR of KIAA0319 (rs2038137 and rs761100) were consistently as-
sociated with rapid naming across four developmental time-points (7-12 years). �is
study shows how developmental information can be incorporated into the study of
genetic e�ects in reading.
In Chapter 4, I evaluated the most signi�cant associations from the �rst genome-
wide association scan (GWAS) studies of language and reading performance, by test-
ing for their e�ects on reading-related quantitative traits in FIOLA, a new and in-
dependent dataset including children and adults from the general Dutch population.
I selected seventeen SNPs to study (with association P values <10-6
in the origi-
nal GWAS), for which the FIOLA dataset provided su�cient statistical power to de-
tect the previously reported e�ects. �e primary association testing was performed
within the subset of children in FIOLA. As a secondary analysis, I tested the same
SNPs for association within the adults of this dataset. �ree nominally signi�cant as-
sociations were observed in the multivariate analysis of the children, and two of these
(rs12636438, rs7187223) showed consistent signals in the univariate analysis as well.
�e association of rs12636438 had the opposite direction of e�ect to that previously
reported by Eicher et al. (2013). �e minor allele of rs7187223 was associated with
lower performance on rapid naming and phoneme awareness in our sample of chil-
dren, in a consistent manner to the association that Luciano et al. (2013) reported for
nonword repetition. �is SNP was the only nominally signi�cant association within
our adult sample, but there we found that the major allele was associated with lower
phoneme awareness scores. In general, this study provided li�le support for vari-
ants previously implicated by GWAS, which suggests that such studies will need to
be performed in future using much larger meta-datasets than those investigated so
far.
In Chapter 5, I performed whole genome linkage analysis and sequenced the whole
exomes or genomes of 15 members (13 a�ected) of a large extended family with
dyslexia (de Kovel et al., 2004). No candidate variants were identi�ed that might
be causative for dyslexia as perfectly penetrant Mendelian mutations. Nonetheless,

7.2 neuronal migration: a potentially unifying mechanism? 205
several rare variants were identi�ed that may contribute to dyslexia liability in this
family, including a nonsynonymous SNP within the gene CACNA2D3, a noncoding
variant upstream of RBMX, and an intronic deletion within AFF2. It is likely that an
oligogenic or more complex genetic background underlies the inheritance pa�ern in
this family.
In Chapter 6, I combined linkage analysis with whole genome sequencing (WGS)
on another extended family with dyslexia. I identi�ed a locus dominantly linked
to dyslexia on chromosome 7q21.11. Two rare intronic single nucleotide variants
in SEMA3C were found to co-segregate with the risk haplotype and almost perfectly
with dyslexia within the family (i.e. 12 of the 14 dyslexic relatives were heterozygous
for the risk variants, while none of the una�ected relatives were carriers). Both
variants lie in a predicted regulatory region around the gene’s promoter, and in silico
characterization suggested that one of them (rs144517871) is a good candidate for cis
regulation of SEMA3C.
In sum, these studies focused on speci�c aspects of the genetic basis underlying
reading ability. Next, I will examine some broader implications for future research
that have arisen from these and other studies. I will focus on a number of issues:
the potential role of neuronal migration as a possible neurodevelopmental process
a�ecting reading (dis)ability; the challenges faced to reconcile candidate gene asso-
ciation studies; the use of next generation sequencing technologies; and the utility
of characterizing the phenotype at the brain level.
7.2 neuronal migration: a potentially unifying mechanism?
�e functional impact of at least one of the variants identi�ed in family 352 is likely
to involve subtle gene regulation a�ecting the expression levels of SEMA3C. �is
gene encodes a class III semaphorin, a family of signalling molecules that play im-
portant roles in cerebral cortical layering by providing guidance cues to migrating
neurons (Chen et al., 2008), in addition to other functions, such as tumor di�eren-
tiation (Malik et al., 2016) or promoting endothelial-to-mesenchymal transition of
cells in the developing heart (Plein et al., 2015). In the mouse brain, Sema3c is re-
pressed by Bcl11a (Wiegre�e et al., 2015), which is an important transcription factor
for cortical development. Of note, a de novo microdeletion on the dyslexia suscep-
tibility locus 3 (DYX3) on chromosome 2p containing only the BCL11A gene was
reported in a proband with severe speech sound disorder (Peter et al., 2014). Wiegr-

206 chapter 7: discussion
e�e et al. (2015) found that homozygous mutant Bcl11a mice presented defects in
neuronal morphology and neuronal migration, and that the mutant phenotype was
rescued when knocking down Sema3c. Molecular assays, such as luciferase reporter
gene assays, could be used to evaluate whether the putative functional variant(s) af-
fect the expression of SEMA3C in cellular models. Another possibility to validate
SEMA3C as a candidate gene for dyslexia is to test whether or not common vari-
ants within this gene are associated with reading-related phenotypes in independent
datasets. It is possible that both rare and common variants in the same gene can be
implicated in reading-related disorders, as in the case of ROBO1, where a rare haplo-
type co-segregated with dyslexia in an extended family (Hannula-Jouppi et al., 2005),
and common SNPs were associated to nonword repetition in the general population
(Bates et al., 2011). Convergent evidence for a role of SEMA3C in�uencing dyslexia
would provide a new building block to understand the molecular landscape for read-
ing ability. Indeed, several candidate genes for dyslexia have already been implicated
in neuronal migration. Embryonic knockdown rat models of the homologue genes
of DYX1C1, DCDC2 and KIAA0319 by in utero electroporation of plasmids encoding
small hairpin RNA (shRNA) resulted in neuronal migration de�cits (Adler et al., 2013;
Peschansky et al., 2010; Szalkowski et al., 2013; Currier et al., 2011). However, o�-
target e�ects for shRNA technology have been reported (Baek et al., 2014) suggest-
ing that caution is needed for the interpretation of the �ndings from the knockdown
studies. Indeed, no such e�ect in neuronal migration was observed in Dcdc2 knock-
out mice (Wang et al., 2011). ROBO1 encodes an axonal guidance receptor that has
roles in migration of interneurons, neuronal di�erentiation and synapse formation
(Andrews et al., 2006, 2008). �ese animal models represent the severe end of the
spectrum in the phenotypic variability that could be caused by genetic variations in
these genes.
�e fact that writing systems are a recent cultural development, together with
the relatively high prevalence of dyslexia in current populations, suggests that sub-
tle changes (at genetic, cognitive and brain levels) leading to di�erences in reading
ability were unlikely to have involved overtly negative selection pressures in human
history. Subtle changes could arise from (1) drastic genetic alterations of molecular
components which are nonetheless compensated by partial redundancy, as in the
case of Dcx and Dcdc2, where it was observed that in utero knockdowns of Dcx pre-
sented more developmental disruptions in Dcdc2 mice than in control mice (Wang
et al., 2011); or (2) subtle genetic alterations, as for candidate dyslexia SNPs that have

7.3 revisiting candidate genes 207
been reported to have regulatory e�ects on the expression levels of KIAA0319 (Den-
nis et al., 2009) and DCDC2 (Meng et al., 2005, 2011; Powers et al., 2013). Recent evi-
dence suggests that DYX1C1, DCDC2 and KIAA0319 are also involved in the growth
and function of cilia (Ivliev et al., 2012; Chandrasekar et al., 2013; Massinen et al.,
2011; Tarkar et al., 2013) and it has been proposed that e�ects on cilia-dependent
neuronal migration could result in subtle changes in neuronal positioning or con-
nectivity (Kere, 2014).
Taken together, the evidence so far suggests that �ne-tuning e�ects on cortical
development (and the genetic factors that in�uence them) could lead to establishing
suboptimal connections or lateralization pa�erns in the brain, which could in turn
translate into reading di�culties.
7.3 revisiting candidate genes
My evaluation of prior candidate SNPs for reading-related traits did not yield clear
support for their involvement (Chapter 3 and Chapter 4). In both studies, there were
some SNPs showing evidence of association in the datasets that I used, but most
of these signals were not in line with previously reported e�ects. �is is a well-
known issue in the �eld, and it is o�en argued that heterogeneity across studies
at di�erent levels might underlie this issue: study design parameters, population
structure, ascertainment of probands, assessment of the traits, or diagnostic criteria
(Paracchini et al., 2007). I also discussed the possibility that other factors, such as
developmental stage, and language or orthography type, could be contributing to
the heterogeneity. All of these factors are likely to be important, but an overarching
problem for this literature is statistical power in the face of relatively limited sample
sizes, and small e�ects that are inaccurately measured, leading both to false negative
and false positive signals.
�e genetic component of reading ability is complex and heterogeneous, and likely
will require studies with large samples sizes to have adequate power to detect its
smaller individual genetic contributions (Visscher et al., 2012). Recently, GWAS stud-
ies have taken a �rst step towards increasing sample sizes, moving from studies
with a few hundreds to thousands of individuals (Luciano et al., 2013; Field et al.,
2013; Eicher et al., 2013; Gialluisi et al., 2014). Each of these studies have reported
new suggestively associated loci (as reviewed in Chapter 4), but the results did not
yield any signi�cant associations in the context of genome-wide multiple testing

208 chapter 7: discussion
and statistical correction. So far there has not been convergence of signals across
these studies, despite some having used partially overlapping samples such as the
ALSPAC dataset (Luciano et al., 2013; Eicher et al., 2013). �is suggests that (1) the
analysis is very sensitive to the characterization of the phenotypic traits, and (2)
future studies will require even larger sample sizes, for which it will be necessary
to meta-analyse results over multiple datasets, which has shown to be a powerful
approach for other complex neuropsychiatric disorders, such as schizophrenia (Psy-
chiatric Genomics Consortium, 2014). On the other hand, the phenotype itself is a
moving target: the strategy that is used to decipher a word is in�uenced by several
factors, including the transparency of the orthography (Landerl et al., 1997) and indi-
vidual preferences for decoding strategies (McGeown et al., 2013). Hence, measures
of reading ability can have di�erent contributions to their variance across studies.
Meta-analyses studies that tried to integrate the evidence for speci�c candidate SNPs
from case-control or transmission disequilibrium test (TDT) studies (Zou et al., 2012;
Zhong et al., 2013; Tran et al., 2013) reported evidence of association for just two of
the considered SNPs (e.g. rs807701 in DCDC2 (Zhong et al., 2013) and rs4504469 in
KIAA0319 (Zou et al., 2012)). �e use of quantitative scores instead of categorical
a�ection status may help in the face of heterogeneity of genetic e�ects. However,
the quantitative measures used are not always assessed in a similar manner in di�er-
ent studies. For example, single word reading ability in English is normally assessed
as the proportion of correctly read words (reading accuracy), which does not have
a timing component, while other languages with shallow orthographies (a more di-
rect spelling-sound correspondence) such as Dutch or German assess single word
reading as the number of correctly read words per minute (reading �uency) (Becker
et al., 2014). �e di�erent measurement instruments across languages are usually
suited to di�erences in writing systems, and may be justi�ed to avoid ceiling and
�oor e�ects, but are a source of heterogeneity which challenges a transparent com-
parison across studies. A recent study that adopted the same inclusion criteria for
samples from eight European countries, and looked at word-reading and spelling
performance as quantitative variables, was unable to �nd any signi�cant association
in meta-analysis of candidate dyslexia-genes (Becker et al., 2014).
By measuring skills such as phoneme awareness, rapid naming, and phonologi-
cal short term memory, that may be endophenotypes with underlying roles in read-
ing, more homogeneous results might be expected in genetic studies, because even
if these processes impact di�erently on reading in di�erent groups or populations

7.4 unraveling the genome: promises and challenges 209
(Landerl et al., 2013; Caravolas et al., 2013), their genetic architectures may be less
heterogeneous than reading ability itself. However, studies that have looked for ge-
netic associations with these supposedly intermediate phenotypes have generally
targeted di�erent traits (depending on the available data) and focused on only a few
candidate SNPs each (see Chapter 2 and Chapter 3). Comparing or meta-analysing
genetic association results across di�erent measures in di�erent datasets is justi�ed
when pleiotropic/multivariate genetic e�ects are expected of the variants (also in
Chapter 4). However, even if a variant can a�ect more than one trait, it is likely that
the strength of the association will di�er between these traits. Genome-wide meta-
analyses of genetic association for reading-related endophenotypes have only just
started to be performed (Luciano et al., 2013; Gialluisi et al., 2014).
Reading experience also in�uences these quantitative traits: for example it has
been shown that phonological awareness is a�ected by literacy (Morais et al., 1979).
Furthermore, a comparison between literate and illiterate people’s brain activity re-
sponses during speech and visual processing tasks suggests that learning to read
reorganizes the brain to an extent by enhancing responses at the visual cortices (e.g.
in the visual word form area), by activating the le�-lateralized language network
upon the presentation of wri�en sentences, and by enhancing activation of the re-
gions involved in phonological coding (planum temporale) during speech perpec-
tion (Dehaene et al., 2010, 2015). �us, literacy acquisition a�ects endophenotypes
at the behavioural and brain level. �e coming e�orts for large sample GWAS meta-
analysis studies should be careful to ensure an adequate handling of the phenotypic
information, especially when samples contain children at di�erent stages of learn-
ing to read. �ese studies will also yield evidence to re-evaluate the role of current
dyslexia candidate genes in the literature.
7.4 unraveling the genome: promises and challenges
High throughput sequencing technologies have revolutionized genomic research, as
virtually the whole genome or exome are now accessible for mutation screening.
�is provides the opportunity, from a single dataset, to simultaneously consider dif-
ferent classes of genetic variants: in terms of frequency (i.e. new or rare mutations in
addition to common variants), as well as type (e.g. SNVs, indels and even structural
variants). �e family-based design that I adopted in Chapters 5 and 6 is a powerful
approach to examine rare genetic variants contributing to dyslexia using NGS tech-

210 chapter 7: discussion
nology. �e main assumption underlying this approach is that there are one or a few
genetic variants that account for dyslexia within these families (the mono/oligogenic
hypothesis), which is motivated by the apparent inheritance pa�ern and high recur-
rence of dyslexia in these unusual families.
In Chapter 5 I did not �nd any variant that could fully explain the dyslexic phe-
notype in family 259, in spite of the linked regions on chromosome Xq27.3 and on
chromosome 20q11.23. It is possible that a complex genetic aetiology underlies the
inheritance pa�ern in this family. Several rare and new mutations were identi�ed
within genes involved in potentially relevant biological pathways such as calcium
regulation within neurons (CACNA2D3), cortical development (EOMES, also known
as TBR2), or related to other disorders such as intellectual disability (AFF2). How-
ever, whether any of these mutations is causally related to dyslexia remains to be
con�rmed. Alternatively, a mutation with a large e�ect may have been missed. It is
unlikely yet possible that such a ‘causal’ mutation was not detected by the sequenc-
ing. In order to reduce this possibility, WES and WGS were performed in several sam-
ples from the family. Another explanation could be that we were unable to interpret
the biological relevance of a co-segregating variant that was present in the data. �is
would be more likely in the case of noncoding variants, since large-scale interpreta-
tion of this variation currently depends on automated annotations based on several
sources of information, and experimental algorithms. Recent e�orts have achieved
the simpli�cation of multiple sources of information (e.g. evolutionary conserva-
tion, e�ects on expression levels) into one or a few scores that can easily be used for
variant ranking and �ltering (Kircher et al., 2014; Ritchie et al., 2014). Nevertheless,
these are dependent on currently available and imperfect knowledge. Each of these
algorithms also makes di�erent assumptions regarding how to de�ne pathogenicity
or functionality, and even when they aim to target the same aspect of variant func-
tionality, they are not always congruent with each other (see Chapter 5 and Chapter
6). Furthermore, the evaluation of variants that are not present in other datasets (i.e.
newly discovered mutations in a given study) is still a challenge for many noncoding
variants.
Functional characterization of genetic variants in molecular assays remains the
‘gold standard’ way to evaluate both coding and noncoding variants. For instance,
through a ba�ery of molecular assays for FOXP1 de novo coding mutations that were
thought to be causing intellectual disability, Sollis et al. (2016) were able to discern
likely aetiological mutations from others of unknown signi�cance. However, these

7.5 genes, reading, and the brain 211
assays are time-consuming and it is not yet feasible to use them systematically to
�lter out or rank variants from sequencing studies. Furthermore, the exact type of
molecular assays should be appropriate to assess the speci�c, potential biological
function that each type of variant might have. Nevertheless, the NGS-based data
presented here will need to be backed up by functional work, in order to translate
the genomic �ndings into biological mechanisms.
7.5 genes, reading, and the brain
Recently, brain-related endophenotypes have been studied in relation to the genetics
of reading ability (Roeske et al., 2011; Pinel et al., 2012; Darki et al., 2012; Skeide et al.,
2015). �ese measures (e.g. volumes of brain regions, white ma�er track integrity,
brain activity as measured by BOLD signal, event related potentials) are thought to
capture either the physical substrate for the realization of the cognitive processes
that underlie reading, or the electrophysiological readouts of those processes. Ac-
cordingly, they should be in�uenced by genetic variants that a�ect reading ability. It
is possible that some of these measures are stable across populations, as there seems
to be a convergent network of brain areas that are activated in reading across sev-
eral orthographic and writing systems (as measured by fMRI) (Rueckl et al., 2015),
and a recent meta-analysis of functional neuroimaging studies comparing dyslexic
and control readers in deep and shallow orthographies also found support for a con-
sistent neurobiological pa�ern for dyslexia (Martin et al., 2016). However, the same
studies also revealed small activation di�erences across languages for the brain areas
implicated in reading (Rueckl et al., 2015), or showing di�erences between dyslexics
and controls (Martin et al., 2016). Hence, the identi�cation of brain endophenotypes
that are even more stable would be helpful for future studies. Some fairly robust
measures include: the auditory mismatch negativity, the size of the planum tempo-
rale, or the white ma�er integrity or morphology of the arcuate fasciculus nerve
�bre tract. �e auditory mismatch negativity (MMN) is an automatic brain response
(event-related potential) to auditory discriminable stimuli (Naatanen, 2001) which
di�ers between dyslexic and control adults (Schulte-Korne et al., 2001) and children
(Neuho� et al., 2012), and is also reduced in pre-literate, children who are at-risk
for dyslexia (assessed on the basis of familial dyslexia), suggesting that this measure
indexes susceptibility to reading di�culties rather than a consequence of them (van
Zuijen et al., 2012). �e planum temporale (PT) is a highly asymmetric region in the

212 chapter 7: discussion
temporal lobe, involved in auditory processing, that seems to have reversed asym-
metry in dyslexic males (Galaburda et al., 1985; Altarelli et al., 2014). �e asymmetry
of the PT (i.e. le� PT > right PT) has been described early in development (e.g. even
in fetuses, (Chi et al., 1977))), suggesting that di�erences in this early asymmetric
landmark could constrain reorganization of brain circuitry that occurs when learn-
ing to read (Altarelli et al., 2014; Dehaene et al., 2015). �e arcuate fasciculus (AF)
is a white ma�er tract connecting the frontal and temporal lobe regions involved in
reading and language. Dyslexics presented reduced integrity (measured as fractional
anisotropy) of the le� AF when compared to controls (Vandermosten et al., 2012).
Several imaging genetic studies for reading ability have been performed so far, as-
sessing a varied spectrum of endophenotypes including the AF (Skeide et al., 2015),
MMN (Roeske et al., 2011), white and grey ma�er volumes (Darki et al., 2012) and
task-related activation of regions of interest (Pinel et al., 2012). However, these stud-
ies generally used small sample sizes (from tens to a few hundreds), and in most
cases were restricted to small numbers of SNPs within candidate genes.
A brain-oriented approach could help to elucidate the causal mechanisms from
genes to behaviour. �ere are several possible causal directions. �e most direct
would go from genes to brain to behaviour, but more complex ones are also possible,
as for example from genes to behaviour to brain. For instance, if a person is more
highly motivated to indulge in reading behaviours for some genetically mediated
reason, the reading behaviour could result in changes of reading-related structures
in the brain. As a result, a genetic association could be observed between a SNP
and brain structures, which would have been mediated by the behaviour. �e es-
tablishment of the causality could be best accomplished through a research strategy
that integrates data from brain imaging endophenotypes together with reading abil-
ity and related quantitative traits, ideally all in the same datasets. For this strategy,
substantial sample sizes will be required, as the genetic e�ects on brain phenotypes
are expected to be as small as the e�ects on behavioural traits (Hibar et al., 2015).
Potentially, this approach should not only enable us to learn more about the genetic
underpinnings of reading ability and its neurobiological substrates, but it may also
help to inform us about cause-e�ect relationships between di�erent psychometric
and brain measures, for example through the use of mediation analysis.

7.6 conclusion 213
7.6 conclusion
Reading is a relatively recent human cultural trait (just a few thousand years old).
Understanding how we are able to learn this highly specialized skill requires descrip-
tions at multiple levels. On the one hand, well characterized reading and interme-
diate phenotypes are required (including both behavioural and brain measures). On
the other hand, we need to identify genes that relate to the behavioural di�erences,
and understand how they a�ect the development and function of the brain by look-
ing at the cellular function of the proteins they encode and the biological pathways
in which they are involved. In order to build a comprehensive account of the reading
phenotype, it will be necessary to integrate the results from the di�erent strategies
and levels of description.
In this thesis, I approached the genetic basis of reading ability using complemen-
tary state-of-the-art strategies: by evaluating the role of common SNPs in known
candidate genes, and by searching for rare, highly-penetrant genetic variants that
could cause strongly familial forms of dyslexia. I related these investigations to
knowledge about cognitive performance measures and molecular mechanisms. �e
�ndings from my thesis provide important new entry-points for future work bridg-
ing the gap between our genetic make-up and reading abilities.

214 chapter 7: discussion
references
Adler WT, Pla� MP, Mehlhorn AJ, Haight JL, Currier TA, et al. (2013) Position of
neocortical neurons transfected at di�erent gestational ages with shRNA targeted
against candidate dyslexia susceptibility genes. PLoS ONE 8: e65179.
Altarelli I, Leroy F, Monzalvo K, Fluss J, Billard C, et al. (2014) Planum temporale
asymmetry in developmental dyslexia: Revisiting an old question. Hum Brain
Mapp 35: 5717–5735.
Andrews W, Barber M, Hernadez-Miranda LR, Xian J, Rakic S, et al. (2008) The role of
Slit-Robo signaling in the generation, migration and morphological di�erentiation
of cortical interneurons. Dev Biol 313: 648–658.
Andrews W, Liapi A, Plachez C, Camurri L, Zhang J, et al. (2006) Robo1 regulates
the development of major axon tracts and interneuron migration in the forebrain.
Development 133: 2243–2252.
Baek ST, Kerjan G, Bielas SL, Lee JE, Fenstermaker AG, et al. (2014) O�-target e�ect
of doublecortin family shRNA on neuronal migration associated with endogenous
microRNA dysregulation. Neuron 82: 1255–1262.
Bates TC, Luciano M, Medland SE, Montgomery GW, Wright MJ, et al. (2011) Ge-
netic variance in a component of the language acquisition device: ROBO1 poly-
morphisms associated with phonological bu�er de�cits. Behav Genet 41: 50–57.
Becker J, Czamara D, Scerri TS, Ramus F, Csepe V, et al. (2014) Genetic analysis of
dyslexia candidate genes in the European cross-linguistic NeuroDys cohort. Eur J
Hum Genet 22: 675–680.
Caravolas M, Lervag A, De�or S, Seidlova Malkova G, Hulme C (2013) Di�erent pat-
terns, but equivalent predictors, of growth in reading in consistent and inconsis-
tent orthographies. Psychol Sci 24: 1398–1407.
Chandrasekar G, Vesterlund L, Hultenby K, Tapia-Paez I, Kere J (2013) The zebra�sh
orthologue of the dyslexia candidate gene DYX1C1 is essential for cilia growth
and function. PLoS ONE 8: e63123.
Chen G, Sima J, Jin M, Wang KY, Xue XJ, et al. (2008) Semaphorin-3A guides radial
migration of cortical neurons during development. Nat Neurosci 11: 36–44.
Chi JG, Dooling EC, Gilles FH (1977) Le�-right asymmetries of the temporal speech
areas of the human fetus. Arch Neurol 34: 346–348.
Currier TA, Etchegaray MA, Haight JL, Galaburda AM, Rosen GD (2011) The e�ects
of embryonic knockdown of the candidate dyslexia susceptibility gene homologue

References 215
Dyx1c1 on the distribution of GABAergic neurons in the cerebral cortex. Neuro-
science 172: 535–546.
Darki F, Peyrard-Janvid M, Matsson H, Kere J, Klingberg T (2012) Three Dyslexia
Susceptibility Genes, DYX1C1, DCDC2, and KIAA0319, A�ect Temporo-Parietal
White Ma�er Structure. Biol Psychiatry 72: 671–676.
de Kovel CG, Hol FA, Heister JG, Willemen JJ, Sandkuijl LA, et al. (2004) Genome-
wide scan identi�es susceptibility locus for dyslexia on Xq27 in an extended Dutch
family. J Med Genet 41: 652–657.
Dehaene S, Cohen L, Morais J, Kolinsky R (2015) Illiterate to literate: behavioural and
cerebral changes induced by reading acquisition. Nat Rev Neurosci 16: 234–244.
Dehaene S, Pegado F, Braga LW, Ventura P, Nunes Filho G, et al. (2010) How learning
to read changes the cortical networks for vision and language. Science 330: 1359–
1364.
Dennis MY, Paracchini S, Scerri TS, Prokunina-Olsson L, Knight JC, et al. (2009) A
common variant associated with dyslexia reduces expression of the KIAA0319
gene. PLoS Genet 5: e1000436.
Eicher JD, Powers NR, Miller LL, Akshoomo� N, Amaral DG, et al. (2013) Genome-
wide association study of shared components of reading disability and language
impairment. Genes Brain Behav 12: 792–801.
Field LL, Shumansky K, Ryan J, Truong D, Swiergala E, et al. (2013) Dense-map
genome scan for dyslexia supports loci at 4q13, 16p12, 17q22; suggests novel locus
at 7q36. Genes Brain Behav 12: 56–69.
Galaburda AM, Sherman GF, Rosen GD, Aboitiz F, Geschwind N (1985) Developmen-
tal dyslexia: four consecutive patients with cortical anomalies. Ann Neurol 18:
222–233.
Gialluisi A, Newbury DF, Wilcu� EG, Olson RK, DeFries JC, et al. (2014) Genome-
wide screening for DNA variants associated with reading and language traits.
Genes Brain Behav 13: 686–701.
Hannula-Jouppi K, Kaminen-Ahola N, Taipale M, Eklund R, Nopola-Hemmi J, et al.
(2005) The axon guidance receptor gene ROBO1 is a candidate gene for develop-
mental dyslexia. PLoS Genet 1: e50.
Hibar DP, Stein JL, Renteria ME, Arias-Vasquez A, Desrivieres S, et al. (2015) Com-
mon genetic variants in�uence human subcortical brain structures. Nature 520:
224–229.

216 chapter 7: discussion
Ivliev AE, ’t Hoen PA, van Roon-Mom WM, Peters DJ, Sergeeva MG (2012) Exploring
the transcriptome of ciliated cells using in silico dissection of human tissues. PLoS
ONE 7: e35618.
Kere J (2014) The molecular genetics and neurobiology of developmental dyslexia as
model of a complex phenotype. Biochem Biophys Res Commun 452: 236–243.
Kircher M, Wi�en DM, Jain P, O’Roak BJ, Cooper GM, et al. (2014) A general frame-
work for estimating the relative pathogenicity of human genetic variants. Nat
Genet 46: 310–315.
Landerl K, Ramus F, Moll K, Lyytinen H, Leppanen PH, et al. (2013) Predictors of de-
velopmental dyslexia in European orthographies with varying complexity. J Child
Psychol Psychiatry 54: 686–694.
Landerl K, Wimmer H, Frith U (1997) The impact of orthographic consistency on
dyslexia: a German-English comparison. Cognition 63: 315–334.
Luciano M, Evans DM, Hansell NK, Medland SE, Montgomery GW, et al. (2013) A
genome-wide association study for reading and language abilities in two popula-
tion cohorts. Genes Brain Behav 12: 645–652.
Malik MF, Satherley LK, Davies EL, Ye L, Jiang WG (2016) Expression of Semaphorin
3C in Breast Cancer and its Impact on Adhesion and Invasion of Breast Cancer
Cells. Anticancer Res 36: 1281–1286.
Martin A, Kronbichler M, Richlan F (2016) Dyslexic brain activation abnormalities in
deep and shallow orthographies: A meta-analysis of 28 functional neuroimaging
studies. Hum Brain Mapp .
Massinen S, Hokkanen ME, Matsson H, Tammimies K, Tapia-Paez I, et al. (2011) In-
creased expression of the dyslexia candidate gene DCDC2 a�ects length and sig-
naling of primary cilia in neurons. PLoS ONE 6: e20580.
McGeown SP, Medford E, Moxon G (2013) Individual di�erences in children’s read-
ing and spelling strategies and the skills supporting strategy use. Learning and
Individual Di�erences 28: 75 – 81.
Meng H, Powers NR, Tang L, Cope NA, Zhang PX, et al. (2011) A dyslexia-associated
variant in DCDC2 changes gene expression. Behav Genet 41: 58–66.
Meng H, Smith SD, Hager K, Held M, Liu J, et al. (2005) DCDC2 is associated with
reading disability and modulates neuronal development in the brain. Proc Natl
Acad Sci USA 102: 17053–17058.
Morais J, Cary L, Alegria J, Bertelson P (1979) Does awareness of speech as a sequence
of phones arise spontaneously? Cognition 7: 323–331.

References 217
Naatanen R (2001) The perception of speech sounds by the human brain as re�ected
by the mismatch negativity (MMN) and its magnetic equivalent (MMNm). Psy-
chophysiology 38: 1–21.
Neuho� N, Bruder J, Bartling J, Warnke A, Remschmidt H, et al. (2012) Evidence for
the late MMN as a neurophysiological endophenotype for dyslexia. PLoS ONE 7:
e34909.
Paracchini S, Scerri T, Monaco AP (2007) The genetic lexicon of dyslexia. Annu Rev
Genomics Hum Genet 8: 57–79.
Peschansky VJ, Burbridge TJ, Volz AJ, Fiondella C, Wissner-Gross Z, et al. (2010)
The e�ect of variation in expression of the candidate dyslexia susceptibility gene
homolog Kiaa0319 on neuronal migration and dendritic morphology in the rat.
Cereb Cortex 20: 884–897.
Peter B, Matsushita M, Oda K, Raskind W (2014) De novo microdeletion of BCL11A
is associated with severe speech sound disorder. Am J Med Genet A 164A: 2091–
2096.
Pinel P, Fauchereau F, Moreno A, Barbot A, Lathrop M, et al. (2012) Genetic variants
of FOXP2 and KIAA0319/TTRAP/THEM2 locus are associated with altered brain
activation in distinct language-related regions. J Neurosci 32: 817–825.
Plein A, Calmont A, Fantin A, Denti L, Anderson NA, et al. (2015) Neural crest-
derived SEMA3C activates endothelial NRP1 for cardiac out�ow tract septation.
J Clin Invest 125: 2661–2676.
Powers NR, Eicher JD, Bu�er F, Kong Y, Miller LL, et al. (2013) Alleles of a Polymor-
phic ETV6 Binding Site in DCDC2 Confer Risk of Reading and Language Impair-
ment. Am J Hum Genet 93: 19–28.
Psychiatric Genomics Consortium SWGot (2014) Biological insights from 108
schizophrenia-associated genetic loci. Nature 511: 421–427.
Ritchie GR, Dunham I, Zeggini E, Flicek P (2014) Functional annotation of noncoding
sequence variants. Nat Methods 11: 294–296.
Roeske D, Ludwig KU, Neuho� N, Becker J, Bartling J, et al. (2011) First genome-
wide association scan on neurophysiological endophenotypes points to trans-
regulation e�ects on SLC2A3 in dyslexic children. Mol Psychiatry 16: 97–107.
Rueckl JG, Paz-Alonso PM, Molfese PJ, Kuo WJ, Bick A, et al. (2015) Universal brain
signature of pro�cient reading: Evidence from four contrasting languages. Proc
Natl Acad Sci USA 112: 15510–15515.

218 chapter 7: discussion
Schulte-Korne G, Deimel W, Bartling J, Remschmidt H (2001) Speech perception
de�cit in dyslexic adults as measured by mismatch negativity (MMN). Int J Psy-
chophysiol 40: 77–87.
Skeide MA, Kirsten H, Kra� I, Schaadt G, Muller B, et al. (2015) Genetic dyslexia risk
variant is related to neural connectivity pa�erns underlying phonological aware-
ness in children. Neuroimage 118: 414–421.
Sollis E, Graham SA, Vino A, Froehlich H, Vreeburg M, et al. (2016) Identi�cation and
functional characterization of de novo FOXP1 variants provides novel insights into
the etiology of neurodevelopmental disorder. Hum Mol Genet .
Szalkowski CE, Fiondella CF, Truong DT, Rosen GD, LoTurco JJ, et al. (2013) The
e�ects of Kiaa0319 knockdown on cortical and subcortical anatomy in male rats.
Int J Dev Neurosci 31: 116–122.
Tarkar A, Loges NT, Slagle CE, Francis R, Dougherty GW, et al. (2013) DYX1C1 is
required for axonemal dynein assembly and ciliary motility. Nat Genet 45: 995–
1003.
Tran C, Gagnon F, Wigg KG, Feng Y, Gomez L, et al. (2013) A family-based association
analysis and meta-analysis of the reading disabilities candidate gene DYX1C1. Am
J Med Genet B Neuropsychiatr Genet 162: 146–156.
van Zuijen TL, Plakas A, Maassen BA, Been P, Maurits NM, et al. (2012) Temporal
auditory processing at 17 months of age is associated with preliterate language
comprehension and later word reading �uency: An ERP study. Neurosci Le� 528:
31–35.
Vandermosten M, Boets B, Wouters J, Ghesquiere P (2012) A qualitative and quanti-
tative review of di�usion tensor imaging studies in reading and dyslexia. Neurosci
Biobehav Rev 36: 1532–1552.
Visscher PM, Brown MA, McCarthy MI, Yang J (2012) Five years of GWAS discovery.
Am J Hum Genet 90: 7–24.
Wang Y, Yin X, Rosen G, Gabel L, Guadiana SM, et al. (2011) Dcdc2 knockout
mice display exacerbated developmental disruptions following knockdown of dou-
blecortin. Neuroscience 190: 398–408.
Wiegre�e C, Simon R, Peschkes K, Kling C, Strehle M, et al. (2015) Bcl11a (Ctip1)
Controls Migration of Cortical Projection Neurons through Regulation of Sema3c.
Neuron 87: 311–325.
Zhong R, Yang B, Tang H, Zou L, Song R, et al. (2013) Meta-analysis of the association
between DCDC2 polymorphisms and risk of dyslexia. Mol Neurobiol 47: 435–442.

References 219
Zou L, Chen W, Shao S, Sun Z, Zhong R, et al. (2012) Genetic variant in KIAA0319,
but not in DYX1C1, is associated with risk of dyslexia: an integrated meta-analysis.
Am J Med Genet B Neuropsychiatr Genet 159B: 970–976.


N E D E R L A N D S E S A M E N VAT T I N G
Ik lees elke dag wel iets: een roman, de krant, emails en, als ik geluk heb, zelfs
een handgeschreven brief. Ik lees ook op straat: de namen van treinstations, een
paar zinnen van een advertentie, de namen van verschillende gebakjes bij de bak-
ker. Lezen is een integraal onderdeel van mijn leven. Toch is lezen niet vanzelf-
sprekend: we moeten leren lezen en dit is niet voor iedereen even makkelijk. Net
zoals sommige mensen langer zijn dan andere, lezen sommige mensen beter dan
andere. Leesvaardigheid kan worden voorgesteld als een eigenschap met een con-
tinue distributie binnen de bevolking, net als bijvoorbeeld lichaamslengte. Mensen
die onder een bepaalde drempelwaarde van leesvaardheidscores vallen, worden als
dyslectisch beschouwd. Omdat lezen een complexe taak is, zijn er verschillende fac-
toren (zowel genetische factoren als omgevingsfactoren) die de leesvaardigheid van
mensen beınvloeden. Het doel van dit proefschri� was om de genetische basis van
individuele verschillen in leesvaardigheid te verhelderen.
Het literatuuroverzicht in Hoofdstuk 2 bood een gedegen overzicht van de be-
kende moleculaire basis van dyslexie. In het bijzonder heb ik statistisch en biologisch
bewijs beoordeeld voor de bijdrage van de meest prominente kandidaatsgenen in de
literatuur, namelijk DYX1C1, DCDC2, KIAA0319 en ROBO1 aan dyslexie en andere
leesgerelateerde eigenschappen. Aan deze genen wordt betrokkenheid bij dyslexie
toegeschreven in verschillende, aanvullende, bewijsvoeringen: ze vallen binnen re-
gio’s van het genoom die geassocieerd zijn met aanleg voor dyslexie; posities in het
genoom die variatie in de bevolking beva�en (dat wil zeggen genetische varianten)
binnen of aangrenzend aan deze genen zijn gerelateerd aan lezen en gerelateerde
eigenschappen; moleculaire studies hebben onthuld dat sommige van deze geneti-
sche varianten betrokken zouden kunnen zijn bij genregulatie; en diermodellen met
aangepaste genfunctionaliteit laten verschillen in relevante breineigenschappen zien
(zoals abnormale migratie van corticale neuronen). Bovendien zijn sommige van
deze varianten recent onderzocht met neuroimaging, die onderzoekers ertoe hebben
geleid te concluderen dat zij geassocieerd zijn met hersengebieden die betrokken zijn
bij het lezen. Alles bij elkaar hebben deze studies de betrokkenheid van deze genen in
de neurobiologie die leesvaardigheid ondersteunt gestaafd. Maar tegelijkertijd bevat
221

222 Nederlandse samenvatting
het onderzoeksgebied contrasterende resultaten, met verscheidene non-replicaties
en tegenovergestelde richting van e�ecten, die voortgang op basis van de bekende
data belemmeren.
In de Hoofdstukken 3 en 4 heb ik de veelvoorkomende genetische variatie (dat wil
zeggen vaak voorkomend in de bevolking) geevalueerd waarvan wordt voorgesteld
dat zij leesvaardigheid en dyslexie beınvloeden. Van deze veelvoorkomende varian-
ten verwacht men dat ze op een additieve manier als risicofactoren fungeren, waarbij
ze elk een zeer kleine fractie van de variatie in leesvaardigheid verklaren.
In Hoofdstuk 3, heb ik me gericht op veertien van de meest consistent geassocieerde
veelvoorkomende enkel-nucleotide polymor�een (single nucleitide variants of SNPs;
genetische varianten die een enkele positie in het genoom beınvloeden) uit de litera-
tuur, die binnen de kandidaatgenen DYX1C1, KIAA0319, DCDC2, CNTNAP2 vielen. Ik
heb deze SNPs beoordeeld in relatie tot verschillende leesgerelateerde eigenschappen
(vloeiend lezen, snel woorden opzeggen, foneembewustzijn en niet-woord herhaling)
in de longitudinale dataset van het Dutch Dyslexia Programme (DDP). Elk van deze
eigenschappen meet verschillende processen die betrokken zijn bij het lezen. Er is
bewijs gevonden voor de associatie van 5 SNPs met verschillende eigenschappen,
maar voor de meeste van deze e�ecten was de directionaliteit niet overeenomstig
met eerdere studies. Desalnie�emin, waren twee SNPs binnen het KIAA0319 gen
consistent geassocieerd met het snel opzeggen van worden over 4 ontwikkelingstijd-
punten (7-12 jaar). Dit onderzoek laat zien hoe ontwikkelingsinformatie kan worden
gebruikt bij het onderzoek naar genetische e�ecten op lezen.
In de afgelopen paar jaar hee� een golf van genoombrede associatie studies (genome-
wide association studies of GWAS) geprobeerd om veelvoorkomende genetische va-
rianten te vinden die taal- en leesvaardigheid beınvloeden, zonder voorafgaande hy-
potheses met betrekking tot speci�eke kandidaatsgenen of regio’s van het genoom.
Deze nieuwe onderzoeksgolf in het veld bestudeerd het gehele genoom voor associ-
atie op een relatief onbevooroordeelde manier, wat geschikt is voor complexe eigen-
schappen waarvoor de overgrote meerderheid van de onderliggende genetische ar-
chitectuur onbekend is. In Hoofdstuk 4 heb ik de meest signi�cante associaties van
de GWAS studies van taal en leesprestatie geevalueerd door hen te testen op lees-
gerelateerde kwantitatieve eigenschappen in FIOLA, een nieuwe en ona�ankelijke
dataset van kinderen en volwassenen uit de Nederlandse bevolking. Ik heb zeventien
SNPs geselecteerd om te bestuderen en heb hun e�ecten apart getest voor volwasse-
nen en kinderen. In het algemeen bood dit onderzoek weinig onderbouwing voor de
223
varianten die eerder in GWAS zijn gevonden, wat suggereert dat zulke studies in de
toekomst zullen moeten worden uitgevoerd met gebruikmaking van meta-datasets
die veel groter zijn dan die die tot nu toe zijn gebruikt.
Zeldzame genetische variatie zou ook kunnen bijdragen tot leesvaardigheid. In
Hoofdstuk 5 en 6 heb ik een gangbare benadering genomen om te zoeken naar zeld-
zame (niet veelvoorkomend in de bevolking) varianten die het erfelijkheidspatroon
van dyslexie in twee multigenerationele families zouden kunnen verklaren. Deze fa-
milies worden gekenmerkt door de relatief hoge prevalentie van dyslexie (∼ 50% in
vergelijking met∼5-10% dat wordt bericht voor de bevolking). Hiervoor heb ik eerst
de regio’s van het genoom gede�nieerd die hetzelfde erfelijkheidspatroon hebben
als dat van dyslexie in ieder van de families, en heb ik deze informatie gecombineerd
met de sequentie van een paar sleutelindividuen. Deze strategie biedt de mogelijk-
heid om het aantal kandidaatsvarianten dat dyslexie zou kunnen beınvloeden terug
te brengen.
In Hoofdstuk 5 werden geen kandidaatsvarianten geıdenti�ceerd die oorzakelijk
zouden kunnen zijn voor dyslexie op de manier van dominante mutaties die een een-
op-een overeenkomst hebben met dyslexie. Desalnie�emin werd een aantal zeld-
zame varianten geıdenti�ceerd dat zou kunnen bijdragen aan dyslexiegevoeligheid
in deze familie, waaronder varianten in de genen CACNA2D3, RBMX en AFF2. Het
is dus waarschijnlijk dat er geen enkele mutatie op zichzelf verantwoordelijk is voor
het voorkomen van dyslexie in deze familie, en dat een meer complexe genetische
achtergrond aanwezig is.
In Hoofdstuk 6 heb ik een regio gevonden op chromosoom 7q21.11 dat gelinkt
is aan dyslexie. Twee zeldzame enkel-nucleotide polymor�een binnen het SEMA3C
gen erfden over met deze regio van het genoom en erfden bovendien bijna perfect
over met de dyslexie binnen de familie (12 van de 14 dyslectische familieleden wa-
ren dragers van de risicovariant, tegen geen enkele van de niet-dyslectische fami-
lieleden). Deze twee varianten zijn intronisch: ze bevinden zich binnen het gen
maar beınvloeden het eiwit niet. Beide varianten liggen binnen een mogelijke re-
gulatorische regio en in silico karakterisatie van de regio suggereerde dat een van
de varianten (rs144517871) een goede kandidaat is voor regulatie van SEMA3C . Dus
stellen wij SEMA3C voor als een kandidaatsgen voor dyslexie en veronderstellen we
dat deze intronische varianten een regulatorisch e�ect zouden kunnen hebben op de
expressieniveaus van het gen.

224 Acknowledgements
Samenva�end heb ik in dit proefschri� de genetische basis van het lezen benaderd
door gebruik te maken van complementaire state-of-the-art strategieen: door de rol
van veelvoorkomende SNPs in bekende kandidaatsgenen te evalueren, en door te zoe-
ken naar zeldzame, hoogpenetrante genetische varianten die sterk erfelijke varianten
van dyslexie zouden kunnen veroorzaken. Ik heb deze onderzoeken gerelateerd aan
kennis over cognitieve prestatieindicatoren en moleculaire mechanismen.

A C K N O W L E D G E M E N T S
Caminante, son tus huellas
el camino y nada mas;
Caminante, no hay camino,
se hace camino al andar.
(Antonio Machado, Cantares)
Wanderer, your footsteps are
the path, and nothing else;
wanderer, there is no path,
the path is made by walking.
(Trans. Be�y Jean Craige)
�is particular path has been a path of search, and as such a pleasure. I would like
to express my gratitude to the many people that have accompanied me during these
years.
I have navigated di�erent seas, and despite sometimes feeling seasick, I ended up
eager to explore new oceans. For this journey, I have to thank my supervisors Simon
E. Fisher and Clyde Francks. For the opportunity, the resources and their guidance.
For le�ing me explore, while providing a clear reference and framework. For point-
ing out incoherences, and forcing me to spell out and understand each choice, as
well as its assumptions. For directing me (and the writing of the present thesis),
even when I chose to be in the antipodes.
Next, I would like to thank my collaborators, who collected most of the data in
these chapters, and provided useful insight and feedback to understand and analyze
it be�er. To everyone from the Dutch Dyslexia Programme, and in particular Ben
Maassen, Elsje van Bergen and Barbara Franke.
�ank you also to my reading commi�ee - Anneke van Hollander, Juha Kere and
Gerd Schulte-Korne - and all the corona members, for taking their time to evaluate
this work.
I would also like to thank to everyone at the Radboud ‘NGS multifactorial disease’
sessions for providing a regular meeting point to discuss pipelines and work�ows.
I am also deeply grateful to Martina Bernhard for her assistance before, during
and a�er the duration of my PhD. �anks also to everyone from the IMPRS o�ce -
Dirkje van der Aa, Els den Os and Kevin Lam - for the continuous support. Tobias van
Valkenhoef, Herbert Baumann and Reiner Dirksmeyer, and everyone else in the TG -
225

226 Curriculum vitae
thank you for your assistance and for ensuring that everything is running smoothly.
I am also indebted to Floris de Vries for the Dutch summary, as well as for many
insightful conversations.
So many times at the MPI, we have heard about the importance of language (for
the ‘human being/species’). As an individual too, having good conversations has
been u�erly important to me:
For multiple years, I had the chance to discuss about anything with Kate: how to
get our science correct, how to correct the world, and last but not least, how to get the
correct bread. With Amanda, the conversation continues. �ank you both for being
great o�cemates. Sylvia showed me tiny bits of hugely useful code, and patiently lis-
tened while I elaborated on my confusion regarding analysis or results. I frequently
knocked other doors in the corridor to share frustration or in�nitesimal satisfaction.
�ank you to everyone behind those doors: Alessandro, Tulya, Nicolas, Else, Car-
olien, Beate, Rick. Dan gets a special mention for always choosing the impossible
but most interesting question. To the functional people: thank you for tolerating my
intrusions into the wetlab, for sharing co�ee and advice. Special thanks to Arianna,
for rounds of genotyping, primer advice and general generous help. Other colleagues
and friends at the MPI have helped me to widen the perspective, to zoom out from
the speci�cs to the more general: Francisco, Harald, Sara I, Franziska, Carmen, Ely,
Julija, Marisa, Sean, Julia, Markus, Floris and many others.
Sara, companera de estreses y de estar tranquilas. Gracias por el trabajo y el no
trabajo. Espero que nuestros caminos vuelvan a juntarse, i que contiuarem amb la
xerrameca. Gaby, gracias por tantos capuchinos matutinos y tardıos, pero sobre todo,
por los cotilleos. Tulio, gracias por ser mi mentor. Por escuchar mis razonamientos
sin razon, y ayudarme a entender mejor a la ciencia y su embalaje. Ewelina, gracias
por tu perseverancia, con tanto headstand me trasmites fuerza. Gracies a Joan pel
catala, els frisbies i els cocines! For the walks in the woods, the co�ees, and every-
thing else, thanks also to Bri� (and Silas and Juniper).
Last but not least, thank you to so many others who have crossed and meaning-
fully shaped this road, be it in Nijmegen, Amsterdam, Paris, Barcelona, Donosti, or
elsewhere.
Aita, ama, eta Irati, eskerrik asko kilometroak gora, kilometroak behera, eguneroko-
tasun bat eta etxekotasun bat eskeintzeagatik. Mila esker Varuni, bidailagun izatea-
gatik.

C U R R I C U L U M V I TA E
Amaia Carrion Castillo studied Biology at the University of Barcelona and received
her degree in 2011. During her studies, she gained experience with molecular ge-
netic research through several internships at the Genetics Departments of the Uni-
versity of Barcelona and Leicester University, as well as at the Institute of Molecular
Pathology in Vienna. In 2011, she was introduced into the cognitive sciences during
another internship at the Laboratoire de Sciences Cognitives et Psycholinguistiques
(Paris). On that same year, she was awarded a ‘la Caixa‘ scholarship for postgradu-
ate studies to pursue her research master in Cognitive sciences at the Ecole Normale
Superieure in Paris, completed in 2012. In her master thesis, she investigated the
cerebral correlates of morphological and syntactic complexity in Basque. From 2012
to 2016 she carried out her PhD project at the Language and Genetics Department at
the Max Planck Institute for Psycholinguistics (Nijmegen). Her research focused on
the genetic underpinnings of reading ability by studying common and rare genetic
variants that could a�ect its variability.
227


M P I S E R I E S I N P S YC H O L I N G U I S T I C S
1. �e electrophysiology of speaking: Investigations on the time course of se-
mantic, syntactic, and phonological processing. Miranda van Turennout
2. �e role of the syllable in speech production: Evidence from lexical statistics,
metalinguistics, masked priming, and electromagnetic midsagi�al articulogra-
phy. Niels O. Schiller
3. Lexical access in the production of ellipsis and pronouns. Bernade�e M. Schmi�
4. �e open-/closed-class distinction in spoken-word recognition. Ale�e Have-
man
5. �e acquisition of phonetic categories in young infants: A self-organising ar-
ti�cial neural network approach. Kay Behnke
6. Gesture and speech production. Jan-Peter de Ruiter
7. Comparative intonational phonology: English and German. Esther Grabe
8. Finiteness in adult and child German. Ingeborg Lasser
9. Language input for word discovery. Joost van de Weijer
10. Inherent complement verbs revisited: Towards an understanding of argument
structure in Ewe. James Essegbey
11. Producing past and plural in�ections. Dirk Janssen
12. Valence and transitivity in Saliba: An Oceanic language of Papua New Guinea.
Anna Marge�s
13. From speech to words. Arie van der Lugt
14. Simple and complex verbs in Jaminjung: A study of event categorisation in an
Australian language. Eva Schultze-Berndt
229

230 MPI Series in Psycholinguistics
15. Interpreting inde�nites: An experimental study of children’s language com-
prehension. Irene Kramer
16. Language-speci�c listening: �e case of phonetic sequences. Andrea Weber
17. Moving eyes and naming objects. Femke van der Meulen
18. Analogy in morphology: �e selection of linking elements in Dutch compounds.
Andrea Kro�
19. Morphology in speech comprehension. Kerstin Mauth
20. Morphological families in the mental lexicon. Nivja H. de Jong
21. Fixed expressions and the production of idioms. Simone A. Sprenger
22. �e grammatical coding of postural semantics in Goemai (a West Chadic lan-
guage of Nigeria). Birgit Hellwig
23. Paradigmatic structures in morphological processing: Computational and cross-
linguistic experimental studies. Fermın Moscoso del Prado Martın
24. Contextual in�uences on spoken-word processing: An electrophysiological ap-
proach. Danielle van den Brink
25. Perceptual relevance of prevoicing in Dutch. Petra M. van Alphen
26. Syllables in speech production: E�ects of syllable preparation and syllable fre-
quency. Joana Cholin
27. Producing complex spoken numerals for time and space. Marjolein Meeuwissen
28. Morphology in auditory lexical processing: Sensitivity to �ne phonetic detail
and insensitivity to su�x reduction. Rachel J. J. K. Kemps
29. At the same time…: �e expression of simultaneity in learner varieties. Bar-
bara Schmiedtova
30. A grammar of Jalonke argument structure. Friederike Lupke
31. Agrammatic comprehension: An electrophysiological approach. Marlies Wasse-
naar

231
32. �e structure and use of shape-based noun classes in Mirana (North West Ama-
zon). Frank Seifart
33. Prosodically-conditioned detail in the recognition of spoken words. Anne Pier
Salverda
34. Phonetic and lexical processing in a second language. Mirjam Broersma
35. Retrieving semantic and syntactic word properties. Oliver Muller
36. Lexically-guided perceptual learning in speech processing. Frank Eisner
37. Sensitivity to detailed acoustic information in word recognition. Keren B. Shatz-
man
38. �e relationship between spoken word production and comprehension. Re-
becca Ozdemir
39. Dis�uency: Interrupting speech and gesture. Mandana Seyfeddinipur
40. �e acquisition of phonological structure: Distinguishing contrastive from
non-contrastive variation. Christiane Dietrich
41. Cognitive cladistics and the relativity of spatial cognition. Daniel B.M. Haun
42. �e acquisition of auditory categories. Martijn Goudbeek
43. A�x reduction in spoken Dutch. Mark Pluymaekers
44. Continuous-speech segmentation at the beginning of language acquisition:
Electrophysiological evidence. Valesca Kooijman
45. Space and iconicity in German Sign Language (DGS).Pamela Perniss
46. On the production of morphologically complex words with special a�ention
to e�ects of frequency. Heidrun Bien
47. Crosslinguistic in�uence in �rst and second languages: Convergence in speech
and gesture. Amanda Brown
48. �e acquisition of verb compounding in Mandarin Chinese. Jidong Chen
49. Phoneme inventories and pa�erns of speech sound perception. Anita Wagner
232 MPI Series in Psycholinguistics
50. Lexical processing of morphologically complex words: An information-theore-
tical perspective. Victor Kuperman
51. A grammar of Savosavo, a Papuan language of the Solomon Islands. Claudia
Wegener
52. Prosodic structure in speech production and perception. Claudia Kuzla
53. �e acquisition of �niteness by Turkish learners of German and Turkish learn-
ers of French: Investigating knowledge of forms and functions in production
and comprehension. Sarah Schimke
54. Studies on intonation and information structure in child and adult German.
Laura de Ruiter
55. Processing the �ne temporal structure of spoken words. Eva Reinisch
56. Semantics and (ir)regular in�ection in morphological processing. Wieke Tabak
57. Processing strongly reduced forms in casual speech. Susanne Brouwer
58. Ambiguous pronoun resolution in L1 and L2 German and Dutch. Miriam Ellert
59. Lexical interactions in non-native speech comprehension: Evidence from elec-
tro-encephalography, eye-tracking, and functional magnetic resonance imag-
ing. Ian FitzPatrick
60. Processing casual speech in native and non-native language. Annelie Tuinman
61. Split intransitivity in Rotokas, a Papuan language of Bougainville. Stuart Robin-
son
62. Evidentiality and intersubjectivity in Yurakare: An interactional account. Sonja
Gipper
63. �e in�uence of information structure on language comprehension: A neu-
rocognitive perspective. Lin Wang
64. �e meaning and use of ideophones in Siwu. Mark Dingemanse
65. �e role of acoustic detail and context in the comprehension of reduced pro-
nunciation variants. Marco van de Ven

233
66. Speech reduction in spontaneous French and Spanish. Francisco Torreira
67. �e relevance of early word recognition: Insights from the infant brain. Caro-
line Junge
68. Adjusting to di�erent speakers: Extrinsic normalization in vowel perception.
Ma�hias J. Sjerps
69. Structuring language. Contributions to the neurocognition of syntax. Katrien
R. Segaert
70. Infants’ appreciation of others’ mental states in prelinguistic communication:
A second person approach to mindreading. Birgit Knudsen
71. Gaze behavior in face-to-face interaction. Federico Rossano
72. Sign-spatiality in Kata Kolok: how a village sign language of Bali inscribes its
signing space. Conny de Vos
73. Who is talking? Behavioural and neural evidence for norm-based coding in
voice identity learning. A�ila Andics
74. Lexical processing of foreign-accented speech: Rapid and �exible adaptation.
Marijt Wi�eman
75. �e use of deictic versus representational gestures in infancy. Daniel Puccini
76. Territories of knowledge in Japanese conversation. Kaoru Hayano
77. Family and neighbourhood relations in the mental lexicon: A cross-language
perspective. Kimberley Mulder
78. Contributions of executive control to individual di�erences in word produc-
tion. Zeshu Shao
79. Hearing speech and seeing speech: Perceptual adjustments in auditory-visual
processing. Patrick van der Zande
80. High pitches and thick voices: �e role of language in space-pitch associations.
Sarah Dolscheid
81. Seeing what’s next: Processing and anticipating language referring to objects.
Joost Rommers

234 MPI Series in Psycholinguistics
82. Mental representation and processing of reduced words in casual speech. Iris
Hanique
83. �e many ways listeners adapt to reductions in casual speech. Katja Poellmann
84. Contrasting opposite polarity in Germanic and Romance languages: Verum
Focus and a�rmative particles in native speakers and advanced L2 learners.
Giuseppina Turco
85. Morphological processing in younger and older people: Evidence for �exible
dual-route access. Jana Reifegerste
86. Semantic and syntactic constraints on the production of subject-verb agree-
ment. Alma Veenstra
87. �e acquisition of morphophonological alternations across languages. Helen
Buckler
88. �e evolutionary dynamics of motion event encoding. Annemarie Verkerk
89. Rediscovering a forgo�en language. Jiyoun Choi
90. �e road to native listening: Language-general perception, language-speci�c
input. Sho Tsuji
91. Infants’understanding of communication as participants and observers. Gud-
mundur Bjarki �orgrımsson
92. Information structure in Avatime. Saskia van Pu�en
93. Switch reference in Whitesands. Jeremy Hammond
94. Machine learning for gesture recognition from videos. Binyam Gebrekidan
Gebre
95. Acquisition of spatial language by signing and speaking children: a compari-
son of Turkish sign language (TID) and Turkish. Beyza Sumer
96. An ear for pitch: on the e�ects of experience and aptitude in processing pitch
in language and music. Salomi Savvatia Asaridou
97. lncrementality and Flexibility in Sentence Production. Maartje van de Velde

235
98. Social learning dynamics in chimpanzees: Re�ections on (nonhuman) animal
culture. Edwin van Leeuwen
99. �e request system in Italian interaction. Giovanni Rossi
100. Timing turns in conversation: A temporal preparation account. Lilla Magyari
101. Assessing birth language memory in young adoptees. Wencui Zhou
102. A social and neurobiological approach to pointing in speech and gesture. David
Peeters
103. Investigating the genetic basis of reading and language skills. Alessandro Gi-
alluisi
104. Conversation Electri�ed: �e Electrophysiology of Spoken Speech Act Recog-
nition. Rosa Signy Gislado�ir
105. Modelling Multimodal Language Processing. Alastair Smith
106. Predicting language in di�erent contexts: �e nature and limits of mechanisms
in anticipatory language processing. Florian Hintz
107. Situational variation in non-native communication. Huib Kouwenhoven
108. Sustained a�ention in language production. Suzanne Jongman
109. Acoustic reduction in spoken-word processing: Distributional, syntactic, mor-
phosyntatic, and orthographic e�ects. Malte Viebahn
110. Nativeness, dominance, and the �exibility of listening to spoken language.
Laurence Bruggeman
111. Semantic speci�city of perception verbs in Maniq. Ewelina Wnuk
112. On the identi�cation of FOXP2 gene enhancers and their role in brain devel-
opment. Martin Becker
113. Events in language and thought: �e case of serial verb constructions in Ava-
time. Rebecca De�na
114. Deciphering common and rare genetic e�ects on reading ability. Amaia Carrion
Castillo