Embed Size (px)
Citation preview
-· •
BUREAU OF AGRICULTURAL ECONOMICS
UNITED STATES DEPARTMENT OF AGRICULTURE
__ Fo_s_-_7_0 ______________ __.«~ B DECEMBER 19~2
In this issue: FRENCH WEST AND NORTH AFRICA AS
A SOURCE OF FATS AND OILS
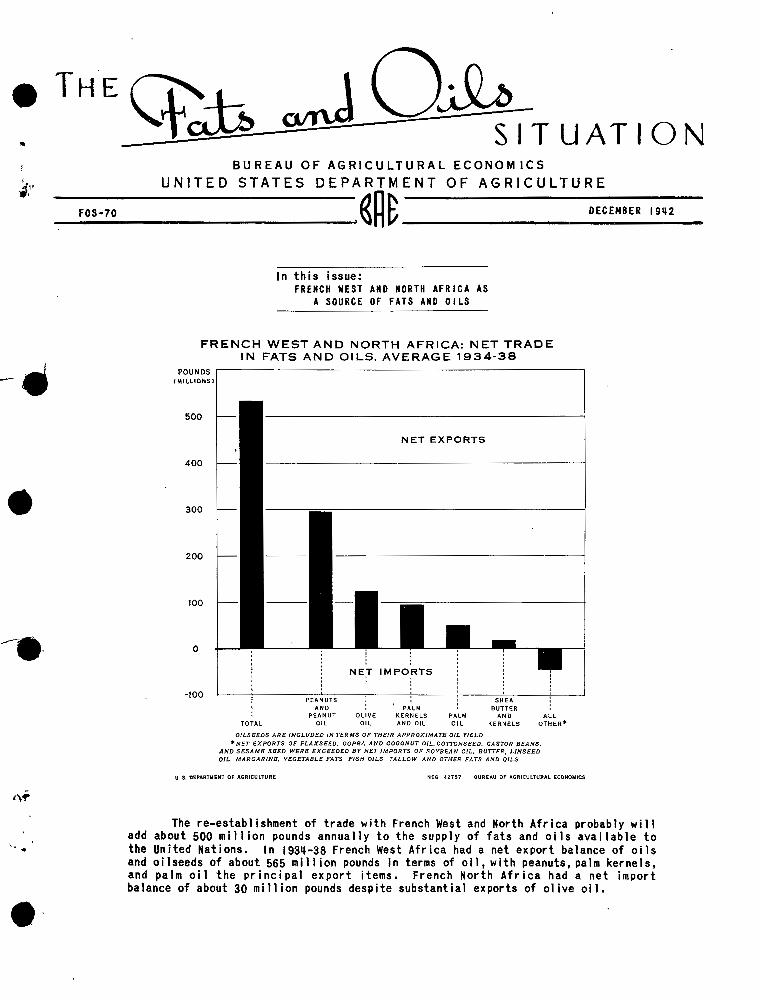
FRENCH WEST AND NORTH AFRICA: NET TRADE IN FATS AND OILS. AVERAGE 1934-38
POUNDS r--------------------------------------------------------, ( MILLIONS)
500
400
300
200
100
0
-100
TOTAL OLIVE
OIL
NET EXPORTS
KERNELS AND OIL
PALM OIL
0/LSEEDS ARE INCLUDED IN TERMS OF THEIR APPROXIMATE OIL YIELD
ALL OHlER*
*NET EXPORTS OF FLAXSEED. COPRA AND COCONUT OIL, COTTONSEED. CASTOR BEANS. AND SESAME SEED WERE EXCEEDED BY NET IMPORTS OF SOYBEAN OIL. BUTTER, LINSEED OIL, MARGARINE. VEGETABLE FATS FISH OILS TALLOW AND OTHER FATS AND OILS
U S. DEPARTMENT OF AGRICULTURE NEG 4.2757 BUREAU OF AGRICULTURAL ECONOMICS
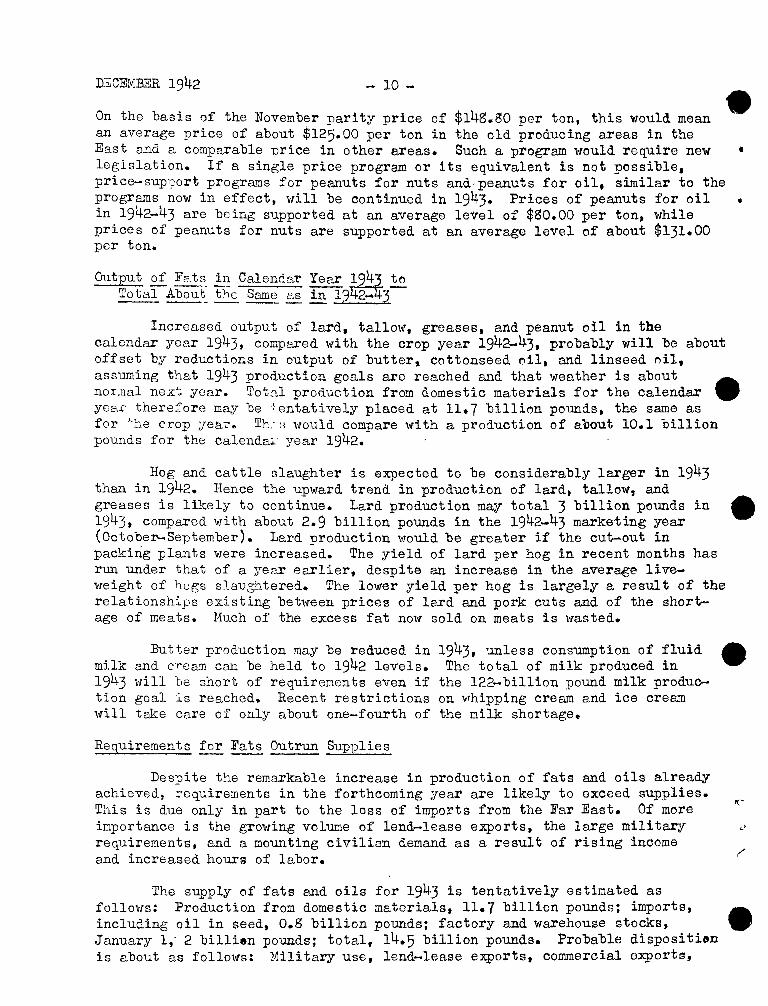
The re-establishment of trade with French West and North Africa probably will add about 500 million pounds annually to the supply of fats and oils available to the United Nations. In 193~-38 French West Africa had a net export balance of oils and oilseeds of about 565 mill ion pounds in terms of oil, with peanuts, palm kernels, and palm oil the principal export items. French North Africa had a net import balance of about 30 million pounds despite substantial exports of olive oil.

Table 1.- Wholesale price per pound of fats and oils a~ specified markets, and index numbers of prices, November 1940 and 1941, September-November 1942
PRICES Item
Butter, 92-score, Chicago .............. , ........... , • , , • , ......... : Butter, 92-score, New York ........................................ : Oleomargarine, dom. veg., Chicago ................................. : Compounds (animal and veg, cooking fats), Chicago ••••••••••••••••• : Lard, loose, Chicago ...........•.•....••.. , ..•••••...•••.•••.•...• : Lard, prime steam, tierces, Chicago ..••..•...••.•.......••...••.•. : Lard, refined, cartons, Chicago ......••••••.....•..•••...•......•. : Oleo oil, extra, tierces, Chicago ......................... , ....... : Oleostearine, bbl., N. Y, , .................... , ........... , .. , .. , .. : Tallow, edible, Chicago ••. , .• , ....... , ..... , • , ••• , .... , •• , , • , . , ... :
Corn oil, crude, tanks, f.o.b, mills .............................. : gorn oil, refined, bbl., N.Y ...................................... : ottonseed oil, crude, tanks, f.o,b, s. :;::, mills .................. :
Cottonseed oil, p.s.y., tank cars, N.Y ............................ : Peanut oil, crude, tanks, f.o,b, mills ............................ : Peanut oil, dom., refined, bbl., N.Y .............................. : Soybean oil, crude, tank cars, midwestern mills •••••••.••••••••••• : Soybean oil, dam. , crude, drums, N.y. . •••••••.••.•..••.••••••••••. : Soybean oil, refined, drums, N.Y .................................. :
Babassu oil, tanks, f.o.b. mills, Pacific Coast ................... ; Coconut oil, l.!anila, crude, tanks, f.o.b. Pacific Coast !J ........ : Coconut oil, :Janila, crude, bulk, c.i.f. N.Y. !J .................. : Coconut oil, Manila, refined, edible, tank cars, f. o. b. N.y. !J ... : Olive oil, edible, drums, N.Y ..................................... : Olive oil, inedible, arums, N.Y ................................... : Olive-oil foots, prime, drwns, N.Y. •••••••••••••••••···~·······•••= Palm oil, Niger, crude, drums, N. y, !/ ............................ : Rape oil, refined, denatured, drums, N.Y .......................... : Rape oil, blol'lll, drums, N.Y ....................................... : Sunflower oil, tank cars, f.o,b. N.Y .............................. : Teaseed oil, crude, drums, N.Y .................................... :
Tallow, No. 1, inedible, Chicago .................. , ............... : Grease, A \',fJli te, Chicago ........................................... : l.!enhaden oil, crude, tanks, f.o.b, Baltimore ...................... : Sardine oil, crude, tanks, Pacific Coast ............ , ............. : Vihale oil, refined, bleached winter, drums, N.Y ................... :
Linseed oil, raw, tank cars, !linneapolis .......................... : Linseed oil, raY., drums, carlots, N.Y . .....•...........••..•.•...• : Perilla oil, crude, drums, N.Y. •••••••••••·•••••••••·•••••••••••••= Oiticica oil, drums, N.Y. ••••••••••·••••••••••••••••••••••••••••••= Tung oil, drums, N.Y .............................................. :
Castor oil, No. 3, bbl., ti.Y ...................................... : Castor oil, No. l, tanks, N.Y ..................................... : Castor oil, dehydrated, drums, carlots, N.Y ....................... : Cod-liver oil, med. U .s.p. bbl., N. y, ............................. : Cod oil, Newfoundland, drums, N.Y ................................. :
November 1940 1941 Cents Cents 32.4 '3'5.'8 33.1 36.2 14.5 17.5
8.2 15.8 4.9 9.9 4.7 9.8 6.4 11.6 7.0 11.6 6.2 10,3 4.8 8.9
5.3 11.2 7.8 15.0 4.6 11.4 5.7 12.4 4.8 11.9 7.5 15.8 4.3 9.8 5.9 11.8 7.3 13.0
9.6 B.5 9.8
31 5.9 3110,6
41.3 72.3 29.9 54.4 10.3 17.2
6.6 12.0 13.6 14.8 17.5 17.2
16.9 28,0
4.3 8.4 4.3 8.6 3.8 7.7 5.1 7.9 9.5 11.1
7.7 9.4 8.7 10.2
18.0 22,8 19.0 22.0 26.9 35.8
9.8 12.4 9.5 11.8
lJ.l 16.9 31.5 38.0 8.0 10.5
INDEX: NUMBERS (1924-29 • 100)
Eight domestic fats and o~ls (l9l0-l4 • lOO) ...................... : Eight domestic fats and oils ...................................... :
88 62
119 84
1~ September: October
Cents Cents 43.2 45.8 43.9 46.5 19.0 19.0 17.0 17.0 11.9 12.5 12.9 13.5 14.5 15.3
10.5 10.5
12.8 12.8 15.5 15.5 12.8 12.8 13.6 13.7 13.0 13.0 17.0 17.0 11.7 11.8 13.0 13.0 14.2 14.2
11.0 n.o 11.4 11.4
'J/ 12.8 y 12.8 56.7 58.4 51.7 50.0 19.0 19.0 12.1 12.1 16.0 16.0 18.2 18,2
y 14.3 14.3 JQ.O 29.8
8.8 8.8 P.8 8,8 8.9 8.9
11.1 11,1
12.2 12.4 13.5 13.5 24.5 .24.5 25.0 25.0 39.0 39.0
13.8 13.8 13.0 13.0 18.6 18.6 :;6.4 36.4 12.0 12.0
143 149 101 106
November Cents 45.8 46.5 19.0 17.0 12.8 13.8 15.6
10.5
12.8 15.5 12.8 14.0 13.0 17.0 11.8 13.0 14.2
11.0 11.4
y 12.8 58.4 51.2 19.0 12.1 16.0 18.2 14.3 29.0
8.8 8.8 8.9
ll.l
12.1 13.3 24.5 25.0 39.0
13.8 13.0 18.6 36.4 12.0
150 107
All fats and oils (27 items) ...................................... : 68 93 107 111 112 Groul'ed £l origin: : An~mal fats ...................................................... : 66 82 99 104 104 Marine animal oils .............................................. : 86 118 127 127 127 Vegetable oils, domestic ........................................ : 59 lll 126 126 128 Vegetable oils, foreign ......................................... : 91 143 145 145 145
Grouped £l ~: : Butter .......................................................... : 74 81 98 104 104 Butter, seasonally adjusted ..................................... : 68 75 97 101 96 Lard ...................................... • ....... • ............. : J6 75 98 103 105 Other food fats ................................................. : 65 lJO 132 133 134
All food fats ................................................. : 67 89 104 109 110 Soap fats ....................................................... : 62 117 119 119 119 Drying oils ..................................... • .... •• • ........ : 88 107 134 134 132 J,!i.scellaneous oils .............................................. : 84 105 117 117 117
All industrial fats and oils .................................. : 73 112 125 125 125 Prices compiled from Oil, Paint and Drug Reporter, The National Provisi?ner, The Journal of Commerce (New York), and reports of the Agricultural Marketing Administration and Bureau of Labor Statistics, Prices quoted include excise taxes and duties where applicable. Index numbers for earlier years beginning 1910 are given in ~echnical llulletin
No. 737 (1940) and The Fats and Oils Situation beginning December 1940,
!/ Three-cent processing tax added to price as originally quoted. 3l Tanks, N.Y. 'J/ Quoted in drums.
,.
II(\-
•
.. '
•
FOS-70 .I.. 3 -
. - . ----------------------------------------------------THE FATS AND OILS S I T U.A T I 0 N
StlillL1al"y
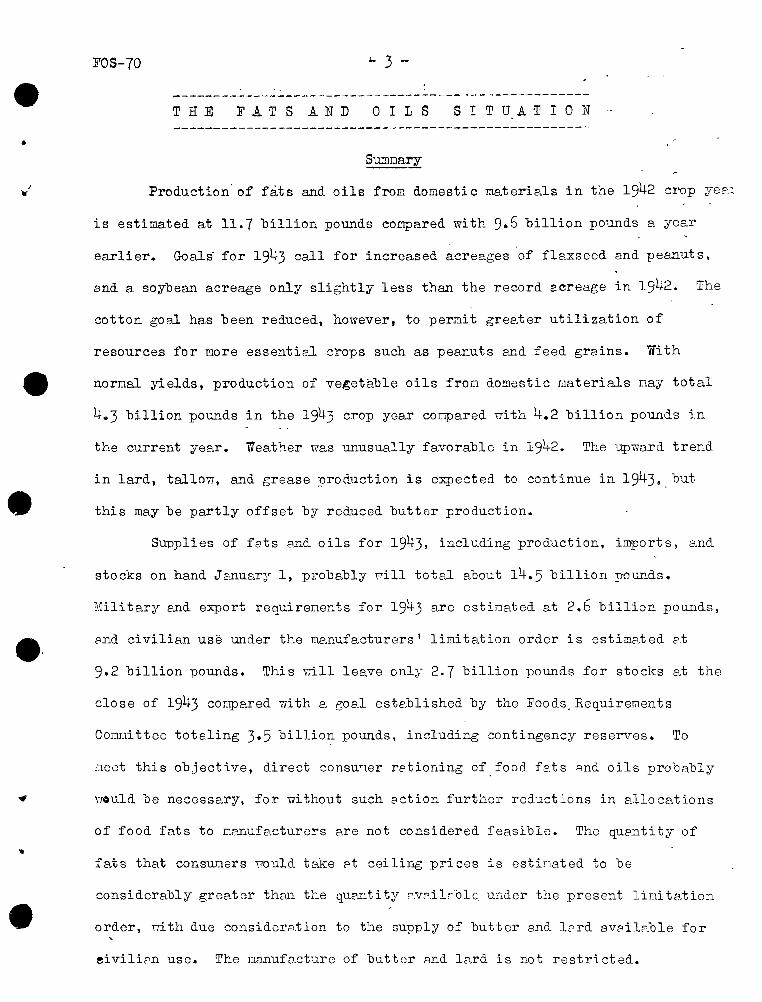
Production· of fats and oils from domestic materials in the 1942 crop yee.:.
is estimated at 11.7 billion pounds conpared with 9.6 billion pounds a year
earlier. Goals for 1943 call for increased acreages ·of fle~seed and peanuts,
end a soybean acreage only slightly less than the record acreage in 1942. The
cotton goal has been reduced, however, to permit greater utilization of
resources for more essential crops such as peanuts and feed grains. With
normal yields, production of ve~etable oils fran domestic materials nay total
4.3 billion pounds in the 1943 crop year conpared uith 4.2 billion pounds in
the current year. Weat~er was unusually favorable in 1942. The upward trend
in lard, tallow, a~d grease production is expected to continue in 1943 •. but
this may be partly offset by reduced butter production.
Supplies of fats and oils for 1943, including production, imports, and
stocks on hand JP.c11uary 1, probably vrill total about 14.5 billion pounds.
Military and export requirenents for 1943 are estinated at 2.6 billion pounds,
flnd civilian use under the manufacturers 1 limitation order is estimHted e.t
9.2 billion pounds. This will lea.ve only 2. 7 billion pounds for stocks at the
close of 1943 conpared with a goal established by the Foods.Requirements
CoruJittee totaling 3·5 billio~ pounds, including contingency reserves. To
Heat this objective, direct consu.,er retioning of. food fats <1nd oils probably
nould be necessary, for without such action further reductions in allocations
of food fo.ts to mmufe.cturers are not considered feasible. The quenti ty of
fats that consuners '.'IOUld take Pt ceiling prices is estinated to be
considerably greater than the quantity f'.vrdlrblo. under the present limi te,tion
order, ni th due considor0.tion to tl1.e supply of butter and lprd aveilable for
eivilipn use. The nanufncture of butter And lard is not restricted.
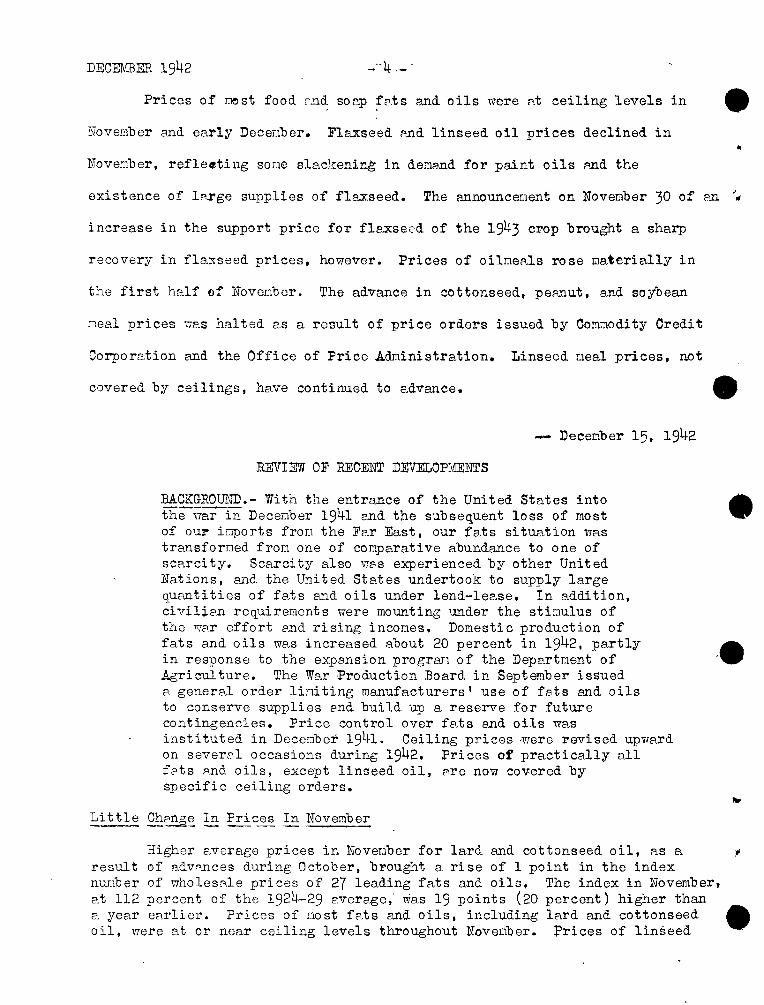
DECEMBER 1942 -··4 --.
Prices of r.JOst food !'nd socy fe.ts and oils were Rt ceiling levels in
November and early Decenber. Flaxseed ?~d linseed oil prices declined in •
Nove::-~ber, refleeting sone slackening in dena.nd for paint oils ~md the
existence of l~xge supplies of flaxseed. The announcenent on November 30 of an ~
increase in the support price for flaxseed of the 1943 crop brought a sharp
recovery in fla~seed prices, however. Prices of oilneals rose Qaterially in
the first half ~f Novonbor. The advance in cottonseed, peanut, and soybean
ne.<>.l prices 17.<>.s halted e,s a result of price orders issued by Com::~odity Credit
Corporation and the Office of Price Administration, Linseed neal prices, not
covered by ceilings, have continued to advance. ~
-- Decenber 15, 1942
REVIEW OF RECENT DEVELOPMENTS
BACKGROUND.- With the entrance of the United States into the ,,7ar in Decenber 1941 and the subsequent loss of most of ou!" ir:~ports fron the Far East, our fats situation was trensforned from one of conparative abundance to one of scarcity. Scarcity also ues experienced by other United Nations, and the United States undertook to supply large quantities of fats and oils under lend-lease. In addition, civili2.n requireElents were mounting under the stir.mlus of the 11'/'Cl.r effort .<>nd rising incones. Dol!lestic production of fats and oils was increased about 20 percent in 1942, partly in response to the expansion prograi1 of the Depe.rtnent of .Agriculture. The War Production Board in September issued a gener8l order liniting manufacturers' use of fats and oils to conserve supplies and build up a reserve for future contingencies. Price control over fa.ts and oils was instituted in Decenber 1941. Ceiling prices -vrere revised upvmrd on sever~l occasions during 1942. Prices of practically all f.?ts ~nd oils, except linseed oil, ~re now covered by specific ceiling orders.
Little Ch~ng~ In Pri~~~ In November
--
Higher average prices in Nover.1bor for lard and cottonseed oil, as a -, result of adv~nces during October, brought a rise of 1 point in the index nunber of wholesP1e prices of 27 leading fats and oils. The index in November, l?.t 112 percent of the 1924-29 e.verage,' was 19 points (20 percent) higher than a year earlier. Prices of nost fats and oils, including lard and cottonseed e oil, were at or noar ceiling levels throughout Novenber. rrices of linseed ·
•
FOS-70 - 5 -
oil and flaxseed_ declined during Noveu"ber, however, apparently reflecting the existence of large supplies of flaxseed avcdle"ble 2.Ild sor.e slackening in the den£'.nd for pcdnt oils. 'J:lhe announceoent on Nove::1"ber 30 of E- higher support price for 1943-crop flaxseed resulted in a sharp recovery in flaxseed prices e1nd hal ted the decline in lins·eed oil prices.
Prices of .oilneCI~S 2.dvanced naterially in early Novenber, continuing 2.
rise the.t bege1n in Octo"bor. With the exception of peanut nef1l, oilneals -n:r ~Toven"ber 10 had rE:Jached apnroxinately the price lE:Jvols of last MPrch. Price orders issued by Con:1odity Credit Corpor2.tion c::md the Office of Price A~Jinistratian halted the rise in prices of cottonseed, pecnut, 2nd soybePn meals. Linseed r.we,l prices, nhich are not subject to ceilin~s, hp_ve continued to advance.
Me2~ quotations, "bagged, per ton,- on D.sceo"ber 8 2nct highest H2_rch 1942 quotations are as foll0'7S: Cottonseed. ;·1eal, 41 percent protein, Me!!phis, $38.75 and S37. 50·; pe~mut i1eal, 45 percent protein, Southee.stern T1ills, S38.~00 2.nd $45. 75; linseed :·1eal, 34 percE:Jnt protein, Minneapolis, $43.00 a...l'ld $42.50. Soybean f.1e8.l is not quoted currently, -but· the naxinur.1 price for 41-percent ·:wc-.1 8_t Chic8go is around.$40.00, conpe1red "ith the highest Harch quotation of $46.20.
Restrictions Placed On Prices C~nd ~:Ioven1enf-Of ofir1e8i ---- --
Effective Novo::1bor ll, r:mxinuTl prices to be che.rgecl for oil.:wal by nills under cottonseed, peanut, or·soybean processor contrects for the Cotton States nere established by Cor.modi ty Credit Corpore1tion Cit $2.00 per ton over the oininun trade price specified in these contracts for Februc:ry 1943. The naxinL-.1 prices thus estc.blished, f .o.-b. ·nill, bulk delivery, are $35.00 per ton for 45-47 percent pe2nut 1.1oal end for 41 percent cottonseed oeal, 1'illd $33.00 to $34.50 per ton for old-p~ocess soybeRU neal, depending on location.
·-Distributors 1 nargins nere lir.ited by the Office of. Price Adninistratio:1,
effective Novenber 12, to· a n['~in~~ of 50 cents per ton for jobbers, $2 por ton for Tiholesalers, ?nd $3 per ton for ret2ilers. pee~ers perfor~ing bore than one function nay take the_ approprL<=tte :1argin for each fu..•1ction they perforn. An additional regulation, effective Novenber 30, lini ts processors 1 extrr-.. charge for less-than-carload lot sales to $1 per ton uhen tho sBle is to a · distributor and to $3 per ton when the sale is to a cons~~er or feeder. It cas expected that these regulations would reduce the- cost of cottonseed, peanut, and soybean neals purchased for feedii).g by $3 to $4 per ton. _
Shipnent of soybean neal into speCified Northeastern Bnd Southern areas was prohibited by Connodi ty Credit CoJ.1loratim Oilseed OrC..ers 4 Bnd 5, effecti vo Decenber 3. The purpose of these orders is to conserve supplies of protein feeds in the Midwest and Pacific Nor.thwest, Md to niniuizo crosshauling. Connodity Credit Corporation is arranging for the shipnent of large ouantities of soybeans fron the Corn Belt fo.r crushing wherever processing capa;ity is available in Eastern, Southern, And Pacific Co8st nills that nornally crush flaxseed, cottonseed, or coprC~ .•

DECEl\IBER 1942 - 6-
Under A.;Jendnents 17 and 18 to the fats and oils price schedule, effectb:e No•TK1ber 19, sF>les of refined soybean, peenut, ·or cottonseed oil for nonecUble uses nay be nade 0.t e level 1/2 cent per pound above the naxinun prices set forth in A~enfuJents 7 end 8. Unlike sellers of these oils for edible use, sellers for nonfood purposes are not entitled to buy the crude oils fro~ Co~mdity Credit Corporation at 1/2 cent per pound under ceiling prices for crude. Hence the ne'\'T a.ction by the Office of Price A.r'\ninistr~,tion equa~izes refining na..rgins as between oil going into food uses and that going into nonfood uses. Industria~ uses nornelly account for a s~all part of the totcl diseppearance of these oils. In 1941 only 22 percent of the soybean oil, 7 percent of the peenut oil, and 5 percent of the cottonseed oil n~s used for purposes other thrn food.
•
Anendnent 62 to Supple~entary negulation 14 of the General 1~mun Price Regulation, effective Novenber 23, provides a 2-cent per pound nargin for indep8ndent collectors of grease that is salvaged in households. In some ~ localities, renderers do not collect directly from butchers, but rely on .., independent collectorse Maximum prices for household-salvaged grease are as follows: Housewife to butcher, 4 cents per pound; butcher to renderer or independent collector, 5 cents per pound; collector to renderer, 7 cents per pound. ·
Effective Date of Limitation Order -A.dvanceCit'O OCtober 1
The general limitation order for fats and oils, General ~reference Order M-71, was reissued in amended form on November 24. The order now specifies the last quarter of 1942 as the first period for which quotas must. be observed, instead of the last 4 months-of 1942 specified in the original order. This modification is designed to give relief to manufacturers who had made large sales in Sept ember before the quotas were announced and who consequently were unable to do their proportionate share of business i~ the remain-ing 3 months of the original quota period. e
The limitation otl the manuiacture of "other edible finished productslt was officially interpreted on November 18 as not applying to products in which fats and oils are not the largest single ingredients by weight. Shortening, . mayonnai.se., and salad dressing, however, are subject to the o:rder 1 regardless of their composition.
Butter Stocks Frozen
Conservation Order M-267, issued November 20, required about half of the butter in cold-storage warehouses i.n 35 cities, or roughly 40 percent of total cold-storage stocks, to be set aside for the requirements of Government agencies. Until March 6, butter set aside in accordance with this order may not be delivered without specif~c permission of the DirectorGeneral for Industry O~erations, except for military or lend-lease purposes, or to a Governm0n:; agc:~r:;y-(. !:!.'he order was desi e:;ned to create a readily · ·available su:pply to m&et r·eq_uirements for such jnrposes in the immediate future.

•
'I
FOS-70 - 7 -
Producers of cream were prohibited by Conservation Order M-259,effective November 25, from delivering cream containing more than 19 percent butterfat except to other producers. Exceptions were made for small-volume deliveries by farmers and for deliveries in States having high minimum standards for cream. Although this order will result chiefly in increasing supplies of milk for fluid consumption, it will tend to encourage butter production. Mo~e direct aid to butter production may result from Conservation Order M-271, restricting commercial production of ice cream in December and January to 60 percent of October output. Since ice cream production declines seasonally from October ta December, the restriction is actually in the neighborhood of 20 percent. It is estimated that the butterfat saved in December by the order will be equivalent to about 70 million pounds of milk or 3·3 million ~ounds of butter.
General Imports Order M-63 was reissued in a.mended form on November 20. As before, commodities named in the order may not be imported into the United States without written authorization from the War Production Board, except by authorized agencies of the Federal Government. The commodities are grouped into three lists. List III includes commodities that are not needed so urgently in the war effort as those on the other two lists. Items on list I are distinguished from those on list II by stricter control over their movement and utilization after importation. The revised listing of fats and oils is as follows:
Lists I and II~ Castor beans; cod oil; cottonseed oil; flaxseed; linseed oil; murumuru oil; neatsfoot oil and stock; oleo oil; ~eanut oil; rubber seed and oil; sunflower oil; edible and inedible tallow, including oleo stock; tucum oil; wool grease; babassu nuts, i<:er:::J.els, and oil; cashe"'T nut shell oil; castor oil; coconut oil; cohune nuts, kernels and oil; copra; edible corn oil; oiticica oil; ouricury nuts, ker:::J.els and oil; palm kernels ~nd palm-kernel oil; palm oil; rapeseed oil; sperm oil; and tung oil. List l!I: Butter; hempseed and oil; hydrogenated or hardened fats and oils;·murumuru nuts and kernels; oleostearine; rapeseed; sesfu~e seed and oil;- sunflower seed; tucum nuts and kernels; and vegetable oil soapstock ~~d otcer foots. List Ill also ~Acludes fatty acids, and oilmeal except fro~ coconuts or copra, soybeans, or flaxseed.
Glycerin Recovery.Order ~sue~
Domestic production of glycerin may be increased 6 million to 7 million pounds per year under Conservation Order M-193, effective December 1, which sets up certain standards of production efficiency in glycerin recovery for the soap, fats splitting, and glycerin refining industries. The new standards are more severe than those in effect on coconut oil and palm oil under General Preference Orders M-59 and }~-60.
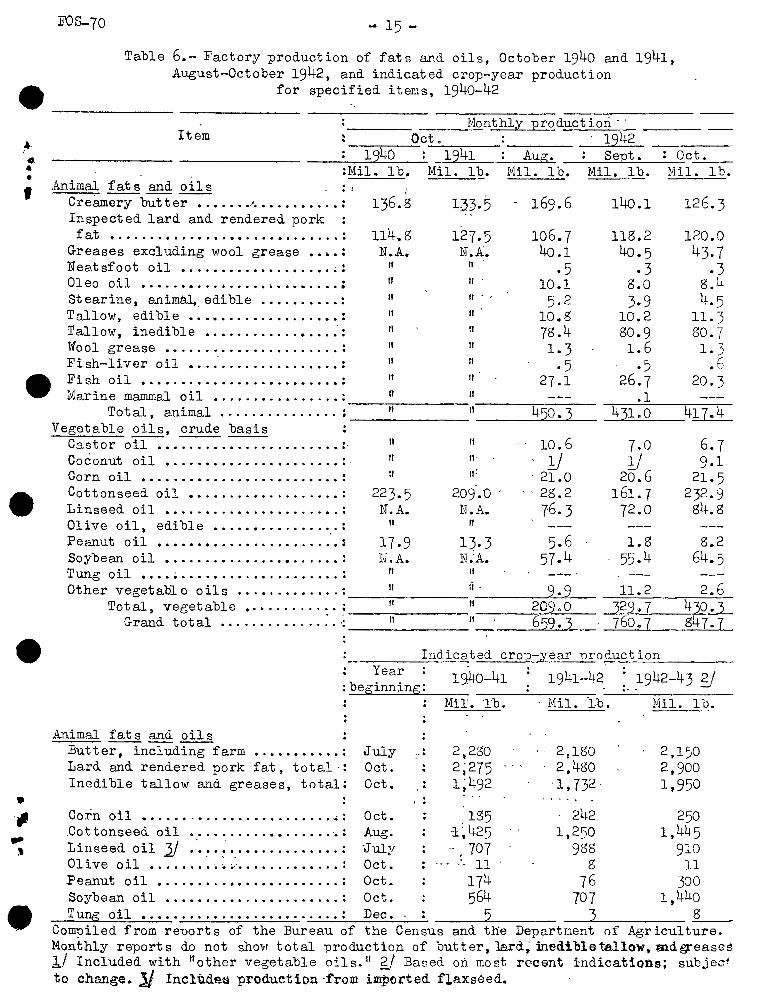
Production of Fats and Oil~ Seasona!_ly Highe~- in --octo"bei; oct<.iber I!: ~~~6ks su~ht~~ High~
Factory production of fats and oils totaled 848 million pounds in October, an increase of 87 million polli~ds over Se~tember. Reflecting seasonally heavier marketings of cottonseed, the opening of the new crop year for soybeans,

DECE1ffitlli 1942 - B-
and increased crushings of flaxseed, total production of vegetable oils was 100 million pom1ds larger than a month earlier. Production of animal fats and oils declined about 14 million pounds, largely because of a decline. in creamery butter output.
Factory and warehouse stocks of fats and oils increased about 14 million pounds during Octooer to 1,836 million pounds (crude basis) at the end of the month. The largest increases were 42 million pounds in cottonseed oil and 30 million pounds in linseed oil, while decreases of 37 nillion pounds and 25 million pounds occurred in stocks of butter and inediole tallow, respectively. Stocks noiT:Jally w.ou.ld have increased more than they did during October as a result of the seasonal increase in production. Consumption of fats and oils was unusually large in Octooer this year, however.
AHA. Purchases of Shortening Increased
•
The Agricultural Marketing Administration purchased about 19 million pou...n<ls of shortening other than lard in Novel:lber, compared with a total of aoou~ 9 nilJion pcunds i~ the first 10 months of 1942. Purchases of lard, ~ however, at appro:xinately 35 i~~illion pounds, were rather small in relation to those in other months this year. Total purchases of fats and oils in Noveuber auounted to about 56 million pounds, compared with 63 million pounds in October a.nd a nonthly average of 80 nillion pounds in the first 10 months of 1942. With near-record or record nur.11lers of hogs now being narketed, Governnent purcha.ses of lard prooably will increase su"ostantially in December and followi~ nonths. 4lt
OUTLOOK
Production of fats and oils fro~ domestic naterials in the 1942 crop year is no'V esti:.1ated at ll. 7 billion pounds, conpared with 9.6 billion pounds in 1941-42. Approxinately 7.5 billion pounds of the 1942 crop-year total will~ be aninal fats and oils (including marine), and 4.2 billion pounds will be ~ vegeta-ble oils. The four najor vegetable oils crops -- cottonseed, flaxseed, peanuts, and soybeans -- are expected to yield about 3·9 billion pounds of crude oil, assuming that 160 to 165 million bushels of soybeans can be crushed i:!:l the current narketing year. Details for najor iteEJ.s are shown in table 6.
Pr~C!:_~ction Goals for ~ Announced
Agricultural production goals for 1943, announced Novenber 30, call for further increases next year in hog and dairy production, in livestock slaughter, ~ and in flaxseed &!d peanut acreage. The soybean goal for 1943 is 1.5 million e"cres larger than for 19L~2, but is slightly under the acreage indicated for harvest this year. The ~otton acreage goal has been reduced to permit greater utilization of land anc! :._c'l:'vr in the South for .nore essential crops, such as pce.nuts and liv82f,cck : P ,,· ~Tops.
I
e
FOS-70 - 9-
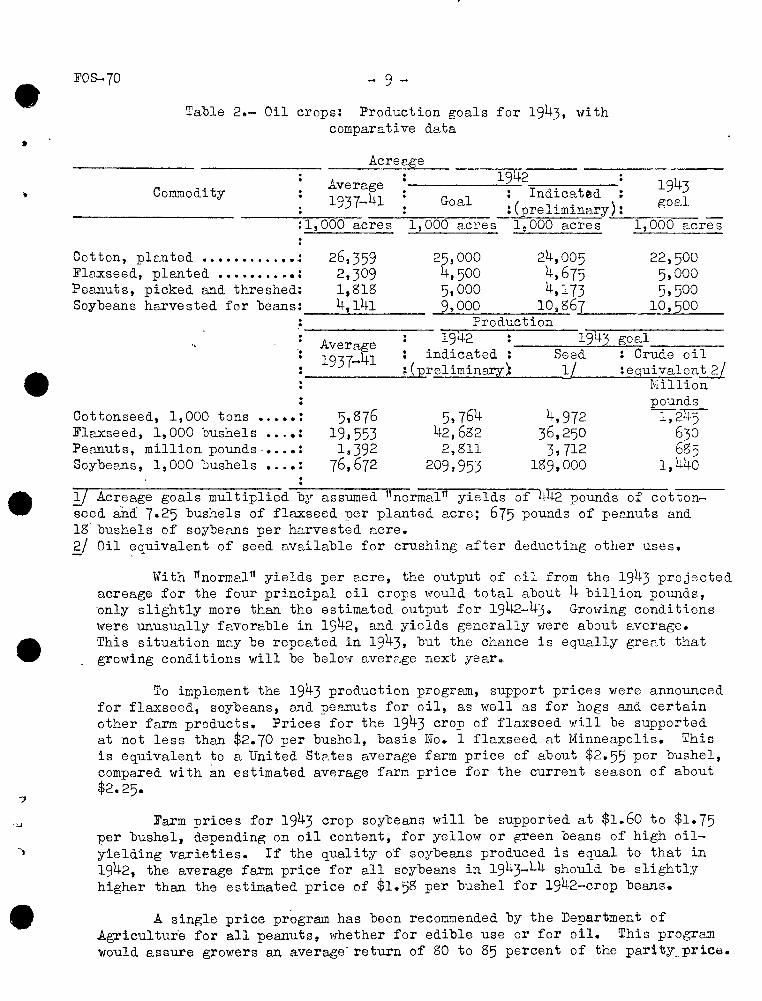
Table 2.- Oil crops: Production goals for 1943, with comparative data
Commodity . . Acreage
---------~1~9~42. --------Average = 1943 : Indicated : 1937-41 Goal :(preliminary): goal -------------------- ------~~~~- ~--~~~-- --:1,000 acres 1,000 acres 1,000 acres 1,000 acres
Cotton, plnnted . 26,359 2a,ooo 24,005 22,500 . . . . . . . . . . . . .. Flaxseed, planted •••••••••• : 2,309 .500 4,675 5,000 Peanuts, picked and threshed: 1,818 5,000 4,173 5.500 Soybeans harvested for beans: 4,141 9,000 10~867 10,200 . Production .
Aver11:ge 1942 1943 goal .. indicated : Seed : Crude oil • 1937-41 ; ( reliminary ~ !;_/ :equivalen"W_ ~-;illion . pounds .
Cottonseed, 1,000 tons . 5.876 5.764 4,972 1,245 . . . . . . Flaxseed, 1,000 bushels ••.• : 19,553 42,682 36,250 630 Peanuts, million pounds- ••.• : 1,392 2,811 3,712 685 Soybeans, 1,000 bushels •..• : 76,672 209,953 189,000 1,440
1/ Acreage goals multiplied b;y assumed 11 normal11 yields of 442 1J01L1l.ds of cottonseed and 7.25 bushels of flaxseed per planted acre; 675 pounds·' of :rennuts and 18. bushels of soybee~s per harvested acre. g/ Oil ?quivalent of seed available for crushing after deducting other uses.
\Ji th lfnorme-111 yields per e.cre, the output of oil from the 1943 projected acreage for the four principal oil crops would total about 4 billion pounds, ~nly slightly more than the estimated output for 1942-43o Growing conditions were unusually fe.vorable in 1942, and yields generally were about average. This situation may be repeated in 1943, but the chance is equally great that growing conditions will be beloT:f averP.ge next year~
To implement the 1943 production program, support prices were announced for flaxseed, soybeans, a...'1d peanuts for oil, as i\l'ell as for hogs and certain other farm products. Prices for the 1943 crop of flaxseed will be supported at not less than $2.70 per bushel, basis No. 1 flaxseed at Minneapolis. This is equivalent to a United Ste,tes average farm price of about $2.55 per bushel, compared with an estimated average faro price for the current season of about $2.25·
Farm prices for 1943 crop soybeans will be supported at $1.60 to $1.75 per bushel, depending on oil content, for yello;\1' or green beans of high oilyielding varieties. If the quality of soybeans produced is equal to that in 1942, the average farm price for all soybeans in 1943-44 should be slightly higher than the estimated price of $1.58 per bushel for 1942-crop beans.
A single price program has been recommended by the Department of Agriculture for all peanuts, ~r-rhether for edible use or for oil. This program would assure growers an average·return of SO to S5 percent of the parity_prica.
DECEMBER 1942 - 10-
On the basis of the November parity price of $148.80 per ton, this would mean an average price of about $125.00 per ton in the old producing areas in the East and a comparable ~rice in other areas. Such a program would require new legislation. If a single price program or its equivalent is not possible1
price-sup~ort programs for peanuts for nuts and·peanuts for oil, similar to the programs now in effect, will be continued in 1943. Prices of peanuts for oil in 1942-43 are being supported at an average le~el of $80.00 per ton, while prices of peanuts for nuts are supported at an average level of about $131.00 per ton.
Increased output of lard, tallow, greases, and peanut oil in the
•
calendar year 1943, compared with the crop year 1942-43, probably will be about offset by reductions in output of butter, cottonseed oil, and linseed nil, assuming that 1943 production goals arc reached and that weather is about ~ nor.nal ne.x:-';; year. Tot~l production from domestic materials for the calendar • yea.£ therefore may be -:-entatively placed at 11.7 billion pounds, the same as for '·"he crop ;:re~:r. Tb: cl would compare with a production of about 10.1 billion pounds for the calenda~: year 1942.
Hog and cattle slaughter is expected to be considerably larger in 1943 than in 1942. Hence the upward trend in production of lard, tallow, and greases is likely to continue. Lard production may total 3 billion pounds in e 1943, compared with about 2.9 billion pounds in the 1942-43 marketing year (October-September). Lard production \..rould be greater if the cut-out in packing plants were increased. The yield of lard per hog in recent months has run under that of a J'ear earlier, despite an increase in the average live-weight of hugs slaughtered. The lower yield per hog is largely a result of the relationships existing between prices of lard and pork cuts and of the short-age of meats. Much of the excess fat now sold on meats is wasted.
Butter production may be reduced in milk and c·rea:n can be held to 1942 levels. 1943 will 't.e short of requirements even if tion goal is reached. Recent restrictions will take care of only about one-fourth of
Requirements for Fats Outrun Sup1)lies
1943, unless consumption of fluid The total of milk produced in
the 122-billion pound milk producon v.rhipping cream and ice cream the milk shortage.
Des~ite the remarkable increase in production of fats and oils already achieved, requirements in the forthcoming year are likely to exceed supplies. This is due only in part to the loss of imports from the Far East. Of more importance is the growing volune of lend-lease exports, the large military reQuirements, and a molh~ting civilian demand as a result of rising income and increased hours of labor.
The supply of fats and oils for 1943 is tentatively estimated as follows: Production from domestic materials, 11.7 billion pounds; imports, including oil in seed, 0.8 billion pounds; factory and warehouse stocks, January l; 2 billien pounds; total, 14.5 billion pounds. !?robable disposi thn is about as follows: ~Uli tary use, lend-lease exports, commercial exports~
)
•
FOS-70 --11-
and shipnents tb United .. Str:.tes -.t!erri tories, 2.6 billion pouncls; civilian nonfood ~se und.er gener.hl, lini tn_tion· order, 3.2 billion pounds; civili211 food use under general limi tat'ion order., toget11er w:l,th. available butter and lard, 6 billion .pounds; factorY working stocks, end of yeRr; 2 billion pounds; Gove~nment _contingency reserve, end.of yo~r,.0.7 billion pounds; total, 14.5 billion po"unds. In addition, 18 to 20 million_ bushels of soybeans in excess of crushing needs, equivalent to 150 to 200 nillion pounds of oil, may be held as a r~serve for foreign or donestic contingency needs.
' Actually, requirements for fats will be greater than use in 1943, par~ ticularly the requirements foF civilians and for the Gover~~ent contingency reserve. The objective for .tb,is re~erve· \'las originally placed by the Foods Requirenents Conoittee at -1.5-billion pounds to' be ·a.ccumuJ,ated by Decer.1ber 31, 1943. To ttchieve thi~ goal it probably"wou,ld be necessary to institute direct consumer rationing of food fats and oils at a .. ley~l-below ~.that considered feasible under the pre'sent manufacturers', lim_i tati~m order.
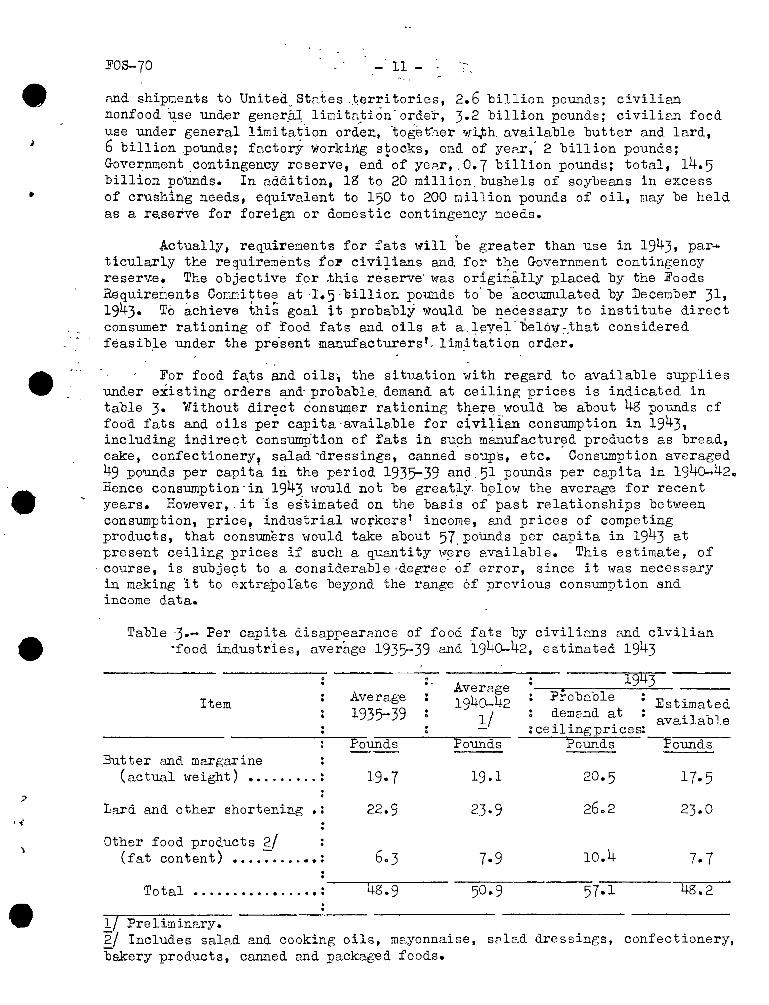
For food fa,ts and oils; the situation i-.ri th regard to available supplies under existing orders an~ probable. demand at ceiling prices is indicated in table 3· Without direct cons~er rationing the~e would be about 48 pounds of food fats and oils pe; capita -available for ci vi~ian consumption in 1943, including indireqt consump-tion of fats in su~h manufactur~d products as bread, cake, confectionery, salad'dressings, canned soups, -etc. Consumption averaged 49 pounds per capita iri the period 1935-39 and.51 pounds per capita in 1940-42~ Hence consumption-in 1943 would not be great~y. b~iow the average for recent years. However,.it 'is estimated on the basis of past relationships between consumption, price, industrial workers 1 income, &~d prices of competing products, that consumers would take about 57 poUnds per Capita in 1943 at present ceiling prices if such a quantity y..r~r.e available. This estimate, of
. course, is subject to a considerable ·degree of error, since it was necessary in m~ing lt to extrapolate beypnd the range of previous consumption and income data.
Table J.- Per capita disappearance of food fats by civilic.ns and civilian •food industr-ies, average 1935-39 .and .1940-42, estimated 1943
Item
:Butter and margarine (actual weight) ••....... :
Lard and other shortening .:
Other food products 2/ (fat content) ••.. ~ •...•• :
Total ..........•....• :
1/ Pre lim inary.
Average 1935-39
Pounds
:. 1943 AverRge 1940--42
ll Proba.ole :Estimated . dema:1d at ~ available
:ceilingprices: Pounds Pounds Pou.11ds
20.5 17-5
23-9 26o2 23.0
7-9 10.4 7-7
57-1 48.2
2/ Includes salRd and cooking oils, mRyonnaise, s?lad dressings, confectionery, bakery products, canned and packaged foods.

DECEMBER 1942 12 -
FRENCH liES~· AND NORTH AF.RIOA AS A SOURCE OF FATS AND OILS
Pre-war trade statistics for French West Africa p~d French North Africa indicate that these two regions, considered together, have a net export capacity of roughly half a billion pounds of fats, oils, and oil-bearing materials in terms of oil. Total exports of these items averaged 690 million pounds annually in 1934-38, while total imports averaged 155 million pounds, leaving a net export balance of about 535 million pounds. West Africa had a net export balance of about 565 million pounds, but North Africa, with its sizable urban population, had a net import balance of about 30 million pounds.
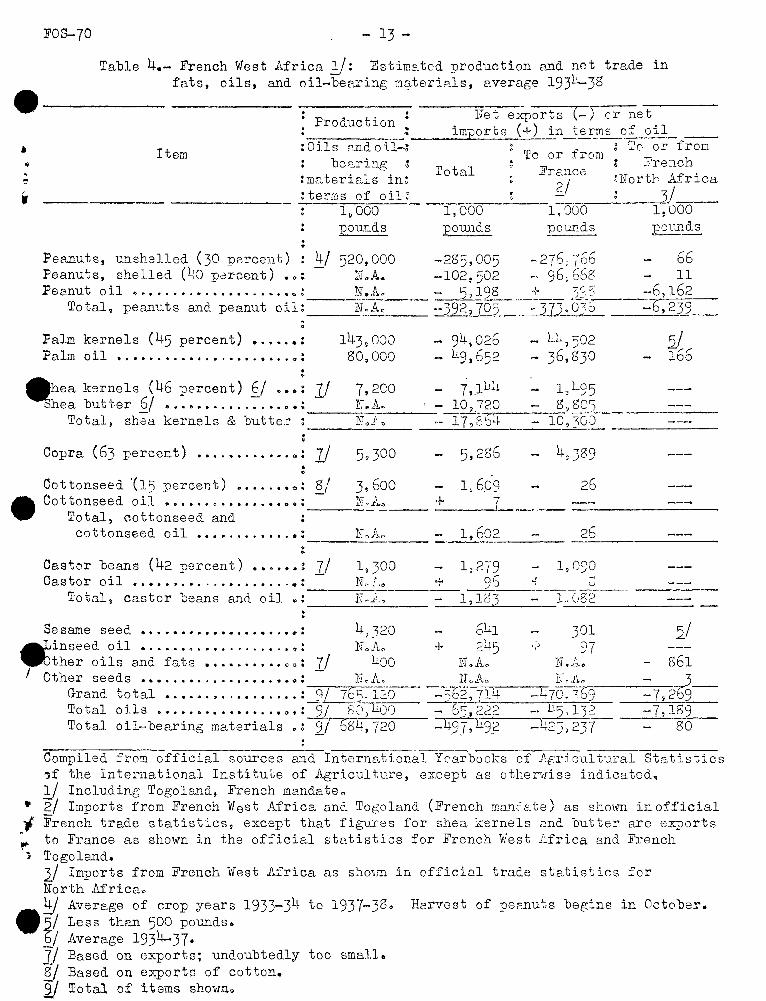
French West Africa is a leading source of the peanuts entering international trade, standing second only to India. Together with relatively small but increasing quantities of peanut oil, peanuts accounted for 70 percent of West Africa1 e total exports of fats, oil~, and ~ilsee~s in 1934-38• ~ Substantial quanti ties of palm kernels, palm eil, and shea kernels and shea • butter were also exported, and smaller quantiti~s of copra, cottonseed, castor beans, and sesame seed. (See table 4.) . ,
Olive oil is the only fat oT oil exported in ~rge quantities from French North Africa. Some flaxseed is e~orted, especially from French Morocco, and there are also small exports of castor beans, cottonseed, mustard seed, and apricot seed, as well as ef certain fish oils and animal fats. Peanut oil is by far the largest item among the imported fats and oils, but substantial quantities of soybean oil, butter, and ·linseed oil ~ere also imported in 1934-38• (See table 5.) ·
Total consumption of fats and oils in French North Africa appears to have been well over 200 million pounds in 1934-38, with net imports furnishing about 30 million pounds of this total, No accurate estimate ef consumption can be made, however, as production figures are lacking for many items.
(
The net tra~e position of French West Africa and North Africa in 1934-3~ docs not necessarily indicate the situation as it exists today. Changes in foreign trade relation.s resulting from the war may have caused production to decline. Over the long run, however, the.figures given in this report sh•uld provide a fairly reliable guide to the status of West Africa and North Africa with respect to fats and oils supplies.
(
FOS-70 - 13-
Table 4.- French West Africa 1/: Estim~ted production end net trade in fats, oils, and oil-beexing n0terials, ~verage 1934-38
• • li:"e t e:rnorts (-) cr net : Proc1uc t ion : -<:-' • • imp?rts (+) in_!~~s of oi~- __ __ :Oils nncioU--~----'- : S:o or from
Item be!lring
:materials in~ :te:c-ms of oil!
1.ooo . . pounds
Peanuts, unshelled (30 pe~cent) : }±/ 520,000 Peanuts, shelled (~0 parcent) • ~: IJ~A. PeEnut oil ~ ...................... '- c:. ~ N •. A.l"' -::-:::-'-:-..;__ __
Total, peam.;.ts anct peanut oil~ N .Ac ' .
Palm kernels (45 percent) •..•.• : Palm oil ............. a •••••••• 0":
143,000 so.ooo
'£o or f:rom Total
:?re:1ch Freol1CG
~Nortl1 Africa ?) I
~~------ ~-------_j;~---l,COO 1,~00 1,000 pounds pounds -po1.mds
-265,005 -276: {66 66 -102,502 - 96,668 11
~.19s + ~ss -6,162 _-_ )c-.._9=-"2"-',--70 5 . ~3 73 ~ Q3-s----b~23§--
94,026 l.~9, 652
)iil -=:112 .,- ') ...~-
36,830 s/ 166 . •
Ahea kernels (46 percent) §j ••• : 11 7,200 7,JL!.Lt. ~hea butter 6/ ................. : N.A.. _ _29.2..,?20
l?L95 s 99_Q..':"!._ __
- lO,jGJ Total, shea kernels & butter :---lL.l' :·--- 17,t~':::J"""~-----::-:::-. • Copra ( 63 :percent) ••..•..•.••. ": If
Cottonseed. '(15 percent) •••..•• ,: ~/ Cottonseed oil ••..•.•.••.•.•••• :
3,600
Total, cottonseed and . . -----cottons0ed oil ••••....•...• : NoA~ ----·
Castor beans (42 percent) ••.••• : 1/ 1,300 Castor oil ••••........•...•...• : N, t.o ---Total, castor beans and oil ~: lZ-J.,
Sesame seed •••••••••••••••••.• :/:1: 4.)20 '.
4,)39
1, 6_09 26 +
1,602 26 ----1: 27'9 1,0)0
+ 96 -{ 4
u
l,l;J,J LG82 ----
6lq 301 5./ ~inseed oil ••.•.•...•.........• : ~ther oils and fats ••····•·••uo: 1/ I
N oJL, + too
245 ..;) 97 N.A" :N •. b.., 1561
l~ .A, 3_ -'-t70.}o9 -7~ 2b9 - ll5,l32 -7,1139 -'-+2], 237 so
Other seeds •••...•.......•..••• : N.A. ll.An Gr nd ... t 1 • q 1 76<T·"·o--- ---=-r?71""'4.,---.......,r:-. aJ. vo a •.•• ,. . , . . . . . • . . . . • ~ 1 , _,- ...::'~ -JO_--'-, _,_. -.,.-,----,:-Total oils ••.•.•.•.•••...• o.:97s:J;EorJ - 465,222 Total oil-bearing materials • ~ :2._1 684, {20 - 9Y ,'1.-:-c+'9:::-?-::------, . ..,...-::-'"-=-=-=
Compiled :rom official sources e~d International Year~ooks of Agricultural Statistics "f the International Instituce of Agriculture, except as othervrise indicated .. 1/ Including Togol~nd, French mandate~
• 2/ Imports from Frencb. \fest A.frica and Togoland (French maJ1c'Ete) as shown inofficial :1 French trade statistics, except that figures for shea kernels ;:;nd butter e.re exports f!· to France as shown in the officie,l statistics for French itiest i..frica and French
l Togoland. 3/ Imports from French West Africa as s~1o1rm in official trad.e statistics for North ~'l.frica,, 4/ Averege of crop years 1933-34 to 1937-36• Hervest of peanuts begins in October.
-~6// Less than 500 pounds. Average 1934-37•
7/ Eased on exports; undoubtedly too small. 8/ Eased on exports of cotton. ~ Total of items shownQ

-, Table 5.- French North Africa: Estimated pro.iuction, disaproaranc~, and
net trade in fats, oils, and oil-bearing material~, ~
average 1934-3R •
Het e;:-ports (-) or t
___ __:.::.nf2 t _t :2£.9 yt ~ ("'.·) • Item
.Ap11arent :Pro~uction= domestic
dis-:To or from "
~o or • Total lfrench
: appearance: \\'est from France
_________ --------~~~A~f~ri~ 1,000 lb. 1,ooo n. ~..L.OClQ lb. 1,000 lb.
Vet;et al::l e Q_il s .S!!<! Q.!l-:be~riT1~: m{"' t er H> l s ( J.n ten.:s o~ t;rnde : -;;-il)-:-~ -- ----- -- ---
01 i ve oil ................•. : 1/161+, 260 ll.l, 520 s'-122. 740 3,/-·53. 8~"t Peanuts, uns~1elled ( )0 pet.): S p 728 + S .. 728 + 1, 744 Peanuts, shelled (4'J pet.) .: 1,216 + 1,.216 + 397 Peanut oil ................. : ~40 + SL1_l~Q_ + 71,616
+ 20 66
+ 11 + 6,162
Total, ~epnuts nnd peanut oil •.......... =-------.....- ..,_9..L7L, 3.t..::S::_4:___;+.!.__g~7u,..--t.384 + 73.75i--~2_6~
Soybean oil ................ : 12,199 + 12,199 + l7t"J ---li'J c..xseed (33 "'let.) •....•... : 5,877 169 ~~·70S - 5~115 3} Linseed oil •............... : _7,Lt6) + 7 .. )_L6j __ ~Q}2 _)}__
Total, fl.!nseed. a11d linseed oil .......... : 5,877 7,632 + 1,·r55 -1,082 j}
Coconut oil • , .......••..... : l,b)·J 4/+ 1,690 '-:g+ 1,573 ---All other oil,sec1s ......... : '1/ 596 ~.~~2 t'+ -2)616 o/- 11~3 6/+ 3 ~ All other vegetable oils •.. : 1J,l43 :J./+ 15,143 ])+ 6,597 ]../+1,029 -.,
Animal a:n-1 f l sh !-'_?-~ s and oils: : Butter ..................... : I}) 2~) 10,189 + 10,16!.1 ,.L 5,Us4 + 18 Tallow ..................... : 1,535 + 1~5?-5 + 1,309 Other animal fats and. oils • : f?/ :=-oCJ 951~ 2_/+ GLL:; .~1/+ 596 2}-Fish oils .................. : -8/ )51 2,391 + 2.040 102
1
Sod. oil •.... , ..........•..• : ___, t:3 + ~~3 + 42 Margarine and. v~:zetable fats: : 7,1)3 + 7,193 + 5,564 + 1 --~r:IDYtou-Dl ..... :--.---:-:- .. :J-9.11:1.1..2 Lli !QL 2o1,085 + 2J 1 6~7- + 39. 5<?5
Total -V eget ab: e oils, :!.ncl ud.- :
+7,2~
ing rnarga!'ine ......... :J.Q./l6Lt,26J 10/172.6L\8 + 8,30:3 +35,673 +7,172 Al1imal anl :ish fats
ar.J. oils •.•........... :,10/ ~5...1:Q.L l5..J:.:.1g_ _ _::-__].'-~.l±_2_t_.:_7_,___Q.S9. __ + _ ___ll All fats a:.d oils •..... :~~_1_)L~f)_l..Qj_l37.760 + 2:2,~l5_i:42,]02 •7~
To~al, oil-bearing : .,.-----'mc.tt er i~::_ <: •••••••••••••• :10/ 6 1 412.10~/ 1._~5 + ____ h_:_~52 __ _.= _ _J.J 117 + __ill?_ Prod.uctio:1 E:nti. trade cor.~piled fr0m offi.cial sources an<l lnt'?lMl.t ional Yer.rbook:> of Ar:;ricultural Statistics of the International Institut;a of A,~ricu.ltm·e. Dome(;:tic ·• di sa;p~Jen.r ance computed froo dat"' on produ::t ion and t rG.cl e. \' 1:_/ Cro-p yeo.rs 1933-34 to 1937-38. Crop year be5ins in lTove.::nber. ?:} Includes olive· ,,. oil foots. J} Less thart 500 pound.s. ':!:J :Jaba for Ttinisia ir1cludes palm-kernel oil. r' 2/ Includes estin~tc of 69,000 pounds of cottonseed, based on production of cotton as estimated by Office of Foreign .A.,sri(':ulturaJ. Relatioas, remainder based on e"--pol"t~
and is probably too small. ~/ Includes cottonseed, hempseed, sesame seed, mustard seed, co-pra, castor beans, apricot seed, and other seeds not specified. ]} Include-s e palm oil, :_JaLJ.-kernel oil, castor oil, cottonseed oil, sesame oil, ra-peseed oil, sunflo1-.rcr oU, corn oil, and other oils not specified. '§./ Based on exports; probabl too small. 2} Includes lard, 'l.•rool grease, lanolin, and other animal fats and oils not s~ecified. 10/ Total of items as shown.
•
'
• -I ..,. ,
FOS-70 ... 15-
Table 6.- Factory production of fats and oils, October 1940 and 1941, August-October 1942, and indicated crop-year production
for specified items, 1940-42
________ M-=-onthly~ductiori · · Octo 1942 ---------;-:--- ---..,.-- ---- __ .....,_;____
1940 1941 Item
Aug. Seut. Oct. :Mil. lb. Mil. lb.
---~-----
Mil. lb. Mil. lb • Mil. lb. Animal fats and oils : ,
Creamery butter •....• •. • . .•.•.•...• : Inspected lard and rendered pork fat ............................. .
Greases excluding wool grease •••• : Neatsfoot oil •........•.•..•.•. 1;!
Oleo oil ........................ .. :
Corn oil ......................... : Cotton seed oil •................... Linseed oil •...................•. : Olive oil, edible ••...•....•..... : Peanut oil ••..•.••.•............. l Soybean oil •••............•......•
136.8
114.3 N.A.
II
223.5 N.A.
11
17.9 N.A.
II
133-5
121'. 5 N.A.
II
209.0 N.A.
II
13.3 N."A.
140.1 126.3
120.0 43.7
-3 3.lJ. 4. 5
ll. 3 80.7 1.3
r .o
_____ I_n_d_i_c=ated cro?-year pro~du=c~t~l~·o~n~---Yea.r
:beginning:
Animal fats and oils Butter, including farm July . . . . . . . . . . . . . ... Lard and rendered pork fat, total ·: Oct. Inedible tallm,.r and greases, total: Oct.
: Corn oil ......................... ...: : Oct. .Cottonseed oil . . . . . . . . . . . . . . . . . . . . . . Aug . Linseed oil J.l . 'Jul~r ..................... Olive oil . . . ~ . Oct. . . . . . . . . . . .. ... . . . . . . . . . . . . ' Peanut oil . Oct. . . . . . . . . . . . . . . . . . . . . . . . . Soybean oil . Oct. . . . . . . . . . . . . . . . . . . . . . . .
1940-41 1>-lil'. Tb.
2,230 2;275 1;492
. 135 -1 ~ 425 ... 707
11 174 564
1941-42 ~ 1942-43 ~ · Mil. ·l-b.
' . 2,130 2,480
·1, 732. . ....
242 1,250
933 3
76 707
... Mil. lb.
2,150 2,900 1,950
250 1,445
910 11
300 1,440
Tung oil •..•.....•..•............ : Dec. L_ Compiled from reuorts of the Bureau of the Census and the Department of Agriculture. Monthly reports do not show total -production of butter, lard.; :inedible tallow. mdgreases l/ Included with "other vesetable oils. 11 ?) Eased on most recent indications; subjeci to change. Jl Include~ produeticm ·fl'om imported flaxseed.

DECEMBER 1942 16-
Table 7·- Factory and warehouse stocks of s~ecified fats and oils, crude basis, October 31, 1940-42, August 31 and September 30, 1942
Item 0 : 0 . _____ ----=1:...<9_:.4""2 -----ct • 31, ct • 31, ·
1940 ~ 1941 ~ Aug.31 Sept- 30'~ ' Oct. 31
Million Million Million ! uounds
Animal fats and oils Butter •..... , ...•.•........ : Lard and rendered pork fat • : Greases, excludin~ wool grease
Neat sfoot oil •.....•.•..... :
106 223
N.A. rr
pounds
187 177'
N.A. If
pounds
152 85
10.3 3
Oleo oil ................... : » II 5 Stearine. animal, edible ••. : n 11 .3 Tallow, edible o ............ : 11 II 13 Tallow, inedible , ....•.•••• : 11 11 258. Wool grease •.....•......... : 11 11 . 5 Cod and cod-li VPr oil •.•.•• : 11 " 13 Other fish-liver oil •.•.... : 11 11 3 Fish oil ................... : 11 11 118 Marine mammal oil •...•..... : 11 11 45
T . ---:,;;-, -~--~~----<Y~'----otal, an1mal •....•.•• :_____________ o05 v:eget able 'oils. crude basis y : ---___;;-<---
Babassu oil •............••. : N.A. N.A. Castor oil ••....•••..••..•. : II II
Coconut oil •......•••.....• : II II
Corn oil •...•........•....• : n n Cottonseed oil •....•.....•• : Linseed oil •••.•.....•..••• : Oiticica oil ....•.••...•••• : Olive oil, edible •..•....•. ·: Olive oil, inedible and ~
531 N.A.
II
If
360 N.A.
Fi ff
1_3 37
136 44
27_~ 230
9 7
Million Million pounds pounds
124 87 62 56
99 91 3 3 4 4 2 3
11 13 237 212
5 5 11 12
2 2 124 '. 131
4o· < 62 724 682
12 12 30 24
130 134 42 36
304 346 243 273
9 g
7 7
foots •.................... : 11 11 12 12 11 Palm-kernel oil •.••..•...•• : 11 11 2 2 ?) 1 Palm oil •...••.•..•.•...... : 11 li 98 95 90 Peanut oil •........•.....•. : 11 11 24 16 17
ri II 3 3 Perilla oil •.............•. : 3 Rape oil ................... : It 11 17 18 16 Sesame oil •••.............. : 11 11 3/ }./ J}_ Soybean oil •.•.•••...•....• : II II 14i 111 106
• .. .. •
'
Tung oil •...•..•.•..•...•.. : 11 11 33 32 31 ,. Other vegetable oils •••.... : 11 " 33 __ 3.{..5'--------'39__ '\
Total, vegetable •....• : 11 11 1,116 1,098 1,154--n _ ____ ,;;..;Gr:;.:an~·=d;;_total •...•.... : 11 11 1.921 1,822 1,836 (' Compiled from reports of the BUreau of the_Census, except butter and lard, Agricultural lv1arKeting Administration. Totals :computed from -llnrounded number~. y Crude plus refined converted to crude ·basis "'by dividing 'l:iy the follo"ring factors: Babassu, corn, cottonseed, palm-1cernel and palii,I oils 0.93i coconut, peanut, and soybean oils, 0.94. · · · ·_: · · · · · · ·
. ~/ Refined.only. ~ata-for crude not availaple. , ]./ Less than 50o;ooo polinds.
- 17--- -
Table s.- Prices ~-f Fpecified oil-bearing m~terials' November 1940 and 1941, September-Novembel' 1942
Nov. Item Unit 1940 : 1941
' :Dollars Dollars . •. ~ .. "'
Castor beans, Brazilian, ~ ,:_. f .o. b. Brazilian ports ........ :Long ton :.!_/51.00 !,/'60.12
Cottonseed, United States farm price ............•....•.......• :Short ton:
Flaxseed, No.1, Minneapolis .•.... Bushel Flaxseed, United States farm price: 11
Peanuts (for nuts and oil), :. United States farm price •...... :100 pound:
Peanuts for oil, delivered ~ designated agencies •........... : W'Soybeans, No. 2 Yellow, Chicago •• : Bushel
Soybeans, U~:fted States farm price:
II
11
23.12 1.59 1.39
-95 .84
45.23 1.84 1.60
4. 61
3.84 1.6o 1.43
Sept.
Dollars
75.00
45-33 2.43 2.24
1. 71 1. 57
: :
1942 Oct.
Dol ;)Jars
75.00
46.46 2.46 2.25
5-77
4.o4
.- Nov.
Dollars
75.00
5-94
4.04
Compil~d.from Oil, Paint and Drug-Reporter, Daily Trade Bulletin (Chicago), Chicago Journal of Commerce, Daily Market Record- (Minneapolis), and reports of the Bureau of Agricultural Economics. l/ C. and f., New York.
Table 9.- Price per ton of specified. oilseed meals, November 1940 ~~d 1941~ September-November 1942
--=N=ov-=-. ,_. ____ _ Item !,/ : 1940 : 1941 Sept.
1942
Oct. Nov.
:Dollars Dollars Dollars Dollars Dollars
-Copra meal, L~s Angeles-..•..•.••...... ; .. -.·.·.~- 2l-.55- 36.45 Cotton seed meal, 41 percent protein, lviemur.i s.: 29 .• JJ . 36 • .75 · Cottonseed meal, 41 percent protein, Chicago: 35 •. 60.. _1+.2. 60 Linseed m.e.~l_, 34 percent protein, ·:
- Minnea-poJ;J, . .s· .. t •••••••••.•••••••••• -••••• · •.•.•.••• : 28.25 Linseed meal, . 32 pe;r:cent_ protein, Ne\or Y:ork .•. : .. 27 .50 Peanut maal, 45 percent protein, :
35-90 31.25
,52.4o 35.60 41.35
36.00 35.20
f.-o.b., Southeastern mills •.... -.............. : .. 24 •. 91-h _ .. 36~97 _ 36.94 Soybean meal, 41 percent protein, .Chicago .... : .30.50 .. 39.1Q, _ .43:5,o
• Jt Compiled from records ~· 1/ Bagged, carlots. ~ -
of the Agricultur-al .M~keting Administ~qtion.
•
52-~0 52.'68 36. 5 38.60 4-l. 90 45.40
36.45 39-75 33-75 33· 75
3.7. 75 39-12 42.70 46.60
- 18-
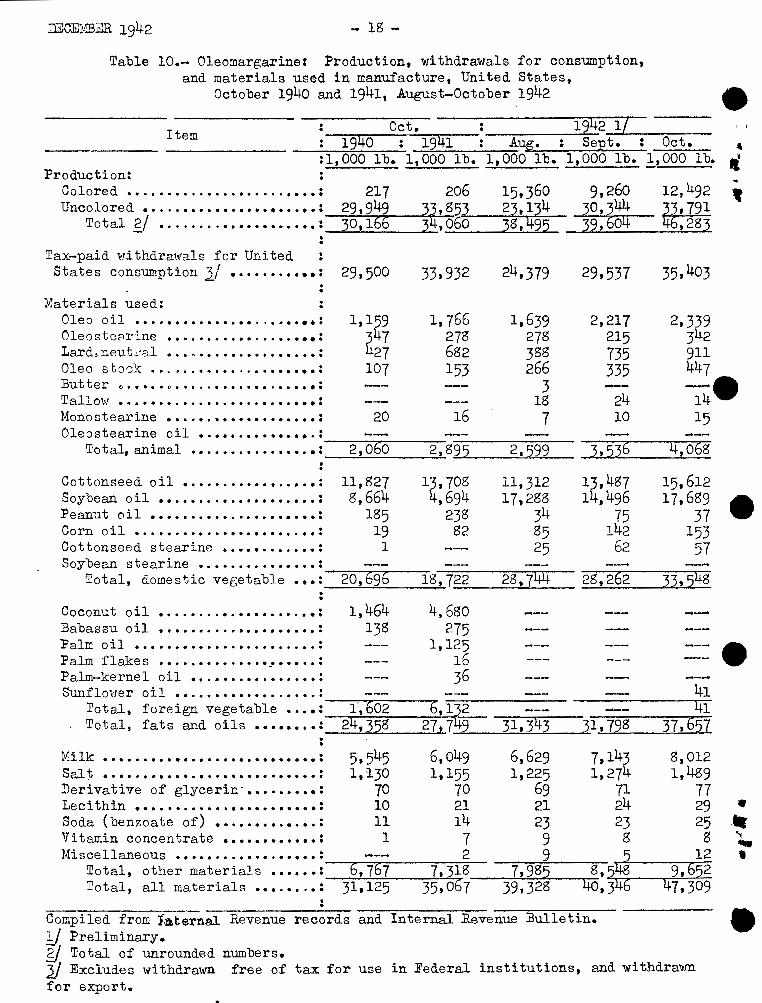
Table 10.- Oleomargarine: Production, withdrawals for consumption, and materials used in manufacture, United States,
October 1940 and 1941, August-October 1942
Item Oct. : 1942 1/ ' ' 1940 : 1941 Aug. : Sept. : Oct. ~
Production: :1,000 lb. 1,000 lb. 1,000 lb. 1,000 lb. 1,000 lb. ~
Colored ••..••....••..•.....•••• : 217 206 15,360 9,260 12,492 Uncolored ••.. ·•••••••••••••··••: 29,949 33,85~3 _ _,2,...,3:.:.'"""13..:--4.,...-- _3""'0~,73=44r.--- 33_,]_3_1_
Total g/ .................... :~3~0~,_16~6---~3~4,060 38,495 39,604 ~
Tax-paid \•d thdrawa1s for United : States consumption}/ •..•.•.•••• : 29,500
Materials used: . . 33,932
Oleo oil ••••••••••••.••..•••••• : 1,159 1,766 1,639 2,217 2,339 Oleosto8rine •••...•..••...•.••• : 347 278 278 215 342 Lard, neutc.:al ................... : 427 682 388 735 911
•
Oleo sto~k ••••..•••••..•••••••• : 107 153 266 335 447 Butter e·•···"···~·············•= 3 --14-Tallot~ ........................... : 18 24 Monostearine •••.•.••••••••••••• : 20 16 7 10 15 Cleostearine oil •.••••••••••••. =---:-.....,....,--=----- ...,...----.....,.--- ---..,...------....-...,...-.
Total, animal ................ : 2, 060 2, 8.::...9"-5 __ ..:::2~, 5,£.,9~9~- -"-3.!..., 5~3~6:__ __ 4.;..!,:...:0-=6~8
Cottonseed oil •...•..•••••..••• : Soybean oil ••............•..•.. : Peanut oil •................•.•• : Corn oil •.•••.•.•.•••••••••..•• ! Cottonseed stearine •.••••...••• :
11,827 8,664
185 19
1
13,708 11,312 13,487 15,612 4,694 17,288 14,496 17,689
238 34 75 37 82 85 142 153
25 62 57 Soybean stearine •.•.•.••••••••• :___,=-:::--;r:::-,.---::- .-.,.----..,..,.."""""'"~- ~-::-7.....,----:---T:""'::':"
Total, domestic vegetable ••• : 20,696 18,722 28,744 ~2_8~1 2_6~2-~3~3w'~5~4_8
Coconut oil ..................... : :Sa bas su oil •.........•.•.•.•... :
1,464 138
4,680 275
Palm oil •.•.•.•................ : 1,125 Palm flakes ••...••.•.•••• _ •••••. : 16 Palm-kernel oil ••.•••.••.•••.•• : 36 Sunfloirrer oil ••................ : 41
Total, foreign vegetable ····===:1;·,~6:0~2;~~~~6~,~1~3~2--Total, fats and oils •••••••• : 24,358 27,7_4~9--~3_1~,3~4~3~-~31,798 37,657
Milk •.••..•.•••.•.••.•.•••••••• : 5.545 6,049 6,629 7,143 8,012 Sal~ .....•.•..•.•..• • . • • • · • · · · • : 1,130 1,155 1,225 1,274 1,489 Derivative of glycerin· ••••••••• : 70 70 69 71 77 Lecithin •...........•..•.•....• : 10 21 21 24 29 Soda (benzoate of) ••.•••••.•.•. : 11 14 23 23 25 Vitamin concentrate •••••••••••• : 1 7 9 8 g Miscellaneous •••••••.••••.••••• : 2 9 5 12
Total, other materials •••••• :---6~~~7=6~7----~7~,-3-1~8~ 7,985 8,5~4~8----~9-,~6=5~2 Total, all materials •••.•..• : 31,125 35,067--~3~9~,~3~28~--~4~0,346 47,309
Compiled from f~ternal Revenue records and Internal Revenue Bulletin. ~ 1/ Preliminary. gj Total of unrounded numbers. Jl Excludes withdrawn free of tax for use in Federal institutions, and withdrawn for export.