Embed Size (px)
Citation preview

TNIBX
TTABX
TNBMX
International Bond Fund (USD Hedged)
International Bond Fund (USD Hedged)–Advisor Class
International Bond Fund (USD Hedged)–I Class
ANNUALREPORT
December 31, 2017
T. Rowe PRICe
The fund primarily invests in investment-grade nondollar-denominated bonds, which are normally hedged to the U.S. dollar, for current income and capital appreciation.
REPORTS ON THE WEB
Sign up for our Email Program, and you can begin to receive updated fund reports and prospectuses online rather than through the mail. Log in to your account at troweprice.com for more information.
HIGHLIGHTS
• DevelopedmarketsinternationalbondsgeneratedsolidreturnsonthebackofaweakerU.S.dollarandstablegovernmentbondmarketsduringthe12-monthreportingperiod,whiledollar-hedgedreturnsweremuchmoremodest.
• TheInternationalBondFund(USDHedged)returned1.24%fortheperiodfromfundinceptiononSeptember12,2017,throughDecember31,2017,outperformingtheBloombergBarclaysGlobalAggregateexUSDBondUSDHedgedIndexanditsLipperpeergroupaverage.
• Thestrategyhedgesmostofitsnondollar-denominatedholdingsbacktoU.S.dollars,givinginvestorsaccesstothediversificationbenefitsofinternationalbondswithoutincurringthehighervolatilityofcurrencyexposure.
• Effectivesecurityselectioniscriticallyimportantastheinternationalbondmarketgrowsinsize,complexity,andmaturity,highlightingtheimportanceofT.RowePrice’sglobalsovereign,credit,andequityresearchplatforms.
T. Rowe Price International Bond Fund (USD Hedged)
TheviewsandopinionsinthisreportwerecurrentasofDecember31,2017.They are not guarantees of performance or investment results andshouldnotbe takenas investmentadvice. Investmentdecisionsreflectavarietyof factors,and themanagers reserve the right tochange theirviews about individual stocks, sectors, and the markets at any time.As a result, the views expressed should not be relied upon as a fore-castof the fund’s future investment intent.Thereport iscertifiedunderthe Sarbanes-Oxley Act, which requiresmutual funds and other publiccompanies to affirm that, to the best of their knowledge, the informa-tionintheirfinancialreportsisfairlyandaccuratelystatedinallmaterialrespects.

T. Rowe Price International Bond Fund (USD Hedged)Manager’s Letter
1
Fellow Shareholders
Although the fund’s inception was in mid-September, we will discuss the market
environment for the entire 12-month reporting period. Developed markets
international bonds generated solid returns on the back of a weaker U.S. dollar and
stable government bond markets, while dollar-hedged returns were much more
modest. Bond markets with credit risk continued to trend upward with very little
volatility. The U.S. dollar lost ground against most other currencies in 2017, ending
the greenback’s multiyear run of strength.
The International Bond Fund (USD Hedged) returned 1.24% for the time period from its inception on September 12, 2017, through December 31, 2017. (Results for Advisor and I Class shares vary,
reflecting their different fee structures.) The fund outperformed the benchmark Bloomberg Barclays Global Aggregate ex USD Bond USD Hedged Index and the Lipper International Income Funds Average for the short since-inception time frame.
The International Bond Fund (USD Hedged) hedges most of its nondollar-denominated holdings back to U.S. dollars, giving investors
access to the diversification benefits of international bonds without incurring the higher volatility of currency exposure. As a result, it will not significantly benefit in periods of U.S. dollar weakness and
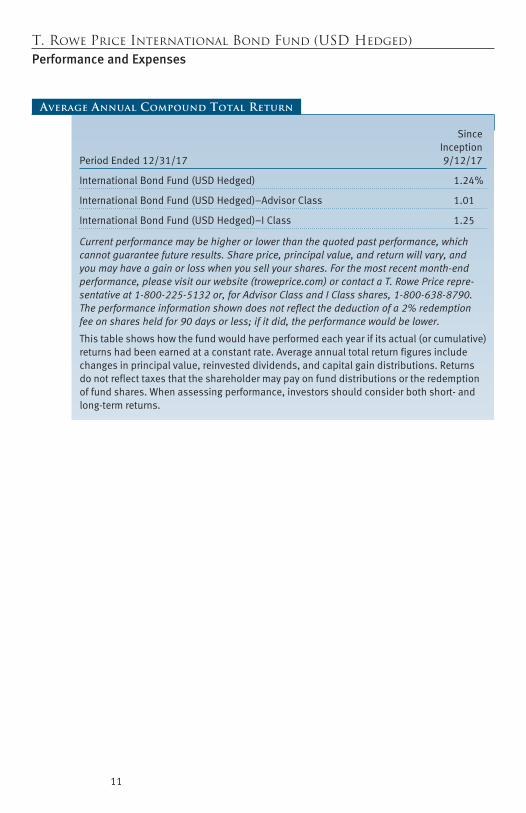
TotalReturn Since InceptionPeriodEnded12/31/17 9/12/17
InternationalBondFund(USDHedged) 1.24%
InternationalBondFund(USDHedged)–AdvisorClass 1.01
InternationalBondFund(USDHedged)–IClass 1.25
BloombergBarclaysGlobalAggregateexUSDBondUSDHedgedIndex 0.82
LipperInternationalIncomeFundsAverage -0.12
Performance Comparison
2
will not significantly suffer during periods of U.S. dollar strength. Aside from the lack of foreign exchange exposure, the fund has the same objective, portfolio management team, investment process, and strategy as the T. Rowe Price International Bond Fund.
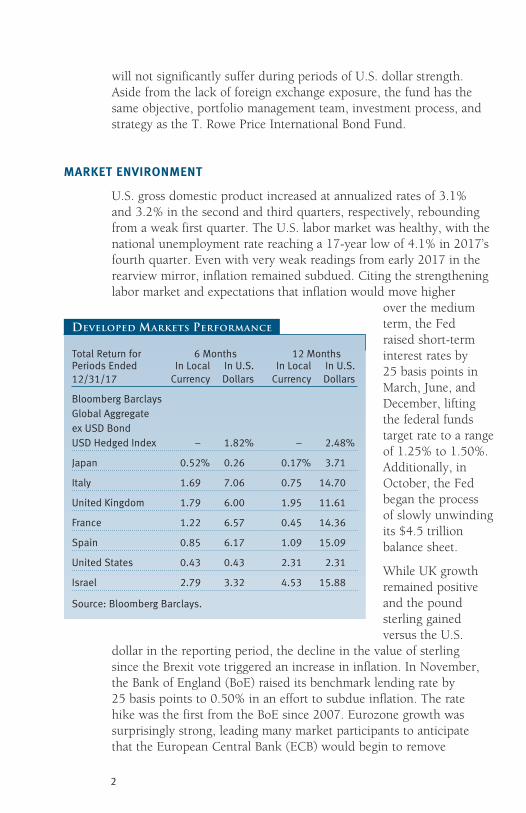
MARKET ENVIRONMENT
U.S. gross domestic product increased at annualized rates of 3.1% and 3.2% in the second and third quarters, respectively, rebounding from a weak first quarter. The U.S. labor market was healthy, with the national unemployment rate reaching a 17-year low of 4.1% in 2017’s fourth quarter. Even with very weak readings from early 2017 in the rearview mirror, inflation remained subdued. Citing the strengthening labor market and expectations that inflation would move higher
over the medium term, the Fed raised short-term interest rates by 25 basis points in March, June, and December, lifting the federal funds target rate to a range of 1.25% to 1.50%. Additionally, in October, the Fed began the process of slowly unwinding its $4.5 trillion balance sheet.
While UK growth remained positive and the pound sterling gained versus the U.S.
dollar in the reporting period, the decline in the value of sterling since the Brexit vote triggered an increase in inflation. In November, the Bank of England (BoE) raised its benchmark lending rate by 25 basis points to 0.50% in an effort to subdue inflation. The rate hike was the first from the BoE since 2007. Eurozone growth was surprisingly strong, leading many market participants to anticipate that the European Central Bank (ECB) would begin to remove
TotalReturnfor 6Months 12MonthsPeriodsEnded InLocal InU.S. InLocal InU.S.12/31/17 Currency Dollars Currency Dollars
BloombergBarclaysGlobalAggregateexUSDBondUSDHedgedIndex – 1.82% – 2.48%
Japan 0.52% 0.26 0.17% 3.71
Italy 1.69 7.06 0.75 14.70
UnitedKingdom 1.79 6.00 1.95 11.61
France 1.22 6.57 0.45 14.36
Spain 0.85 6.17 1.09 15.09
UnitedStates 0.43 0.43 2.31 2.31
Israel 2.79 3.32 4.53 15.88
Source:BloombergBarclays.
Developed Markets Performance

3
its accommodative monetary policy. In October, ECB President Mario Draghi announced that the central bank would continue to buy bonds at least through September 2018 while cutting the size of its monthly purchases in half beginning in January 2018. Japanese growth remained sluggish and inflation persistently low, leading the Bank of Japan to maintain its government bond purchase policy that targets a 0% yield on the 10-year Japanese government bond. Growth in emerging markets as a whole continued to outpace expansion in developed markets, although there was more dispersion in the economic health of individual emerging countries as a result of idiosyncratic themes.
The U.S. dollar lost ground against most other currencies in 2017, ending the greenback’s multiyear run of strength. The U.S. Treasury yield curve flattened as anticipation of the Fed’s slow interest rate normalization pushed short-term yields higher while limited inflation pressure benefited longer-maturity Treasuries, whose yields decreased. U.S. Treasuries offered a meaningful yield premium over high-quality government bonds from other developed markets, supporting demand. The 10-year U.S. Treasury note’s yield finished the year at 2.40%, down modestly from 2.45% at the beginning of 2017. Volatility in
Treasuries was unusually low. The yield on the 10-year U.S. Treasury note generally stayed between 2.10% and 2.55% during the year, a tight 45 basis point range. In 2016, the yield varied from about 1.40% to 2.60%, a much larger 120 basis point range. Volatility was similarly low in core eurozone government debt, although the 10-year German bund yield increased near the
end of the year to around 0.45% amid stronger-than-expected growth in Europe. The yield on the 10-year UK sovereign note finished the year little changed at about 1.20%, after anticipation of the BoE’s rate increase helped push yields up from their midyear lows. There was modestly higher volatility in emerging markets government debt, given the differing monetary policies and political situations across individual countries.
TotalReturnPeriodsEnded12/31/17 6Months 12Months
J.P.MorganEmergingMarketsBondIndexGlobal 2.94% 9.32%
India 1.44 4.93
Chile 3.39 9.65
Mexico 3.65 11.95
Malaysia 2.44 8.81
Indonesia 3.89 11.60
Source:J.P.Morgan.InU.S.dollars.
Emerging Markets performance
4
U.S. high yield bonds rallied through most of the year, supported by rising prices of oil and other commodities in the second half of the year. The price of a barrel of Brent crude oil, the global benchmark, finished 2017 at nearly $67 after starting the year at about $55 and falling below $45 in June. Noninvestment-grade bonds from issuers in industries related to commodities account for a significant proportion of the U.S. high yield market. Credit spreads on U.S. high yield reached their narrowest levels in 10 years late in 2017. In Europe, high yield bond credit spreads compressed so much that the yield of the sector, as measured by the J.P. Morgan European Currency High Yield Index, reached 3.00% in October, compared with an average yield since 1999 of 8.78%, before widening somewhat at the end of the year. Although they lagged high yield bonds, investment-grade corporate bonds from U.S. issuers posted solid gains, benefiting from anticipation of tax reform from the Trump administration. European investment-grade corporates underperformed their U.S. cousins. Sovereign and corporate bonds from emerging markets were among the best-performing fixed income segments in 2017, benefiting from the ongoing search for higher-yielding assets in an environment of low interest rates.
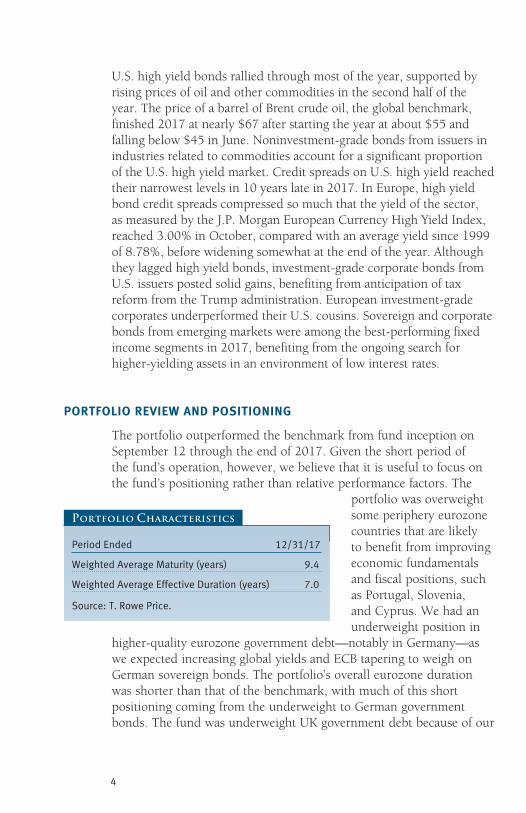
PORTFOLIO REVIEW AND POSITIONING
The portfolio outperformed the benchmark from fund inception on September 12 through the end of 2017. Given the short period of the fund’s operation, however, we believe that it is useful to focus on the fund’s positioning rather than relative performance factors. The
portfolio was overweight some periphery eurozone countries that are likely to benefit from improving economic fundamentals and fiscal positions, such as Portugal, Slovenia, and Cyprus. We had an underweight position in
higher-quality eurozone government debt—notably in Germany—as we expected increasing global yields and ECB tapering to weigh on German sovereign bonds. The portfolio’s overall eurozone duration was shorter than that of the benchmark, with much of this short positioning coming from the underweight to German government bonds. The fund was underweight UK government debt because of our
PeriodEnded 12/31/17
WeightedAverageMaturity(years) 9.4
WeightedAverageEffectiveDuration(years) 7.0
Source:T.RowePrice.
Portfolio Characteristics
5
expectation that Brexit-related uncertainty and economic headwinds would push UK yields up.
Within emerging markets, we generally favor allocations to countries that are easing monetary policy or that have steep yield curves, including Brazil, Indonesia, and Serbia. Our exposure to locally denominated Brazilian government bonds was particularly beneficial to relative performance as the Central Bank of Brazil continued to cut interest rates, boosting prices
of the debt. Many of the fund’s emerging markets positions are in countries that we believe are more insulated from increases in global interest rates, including Malaysia and India. We were underweight
emerging markets such as the Czech Republic, where prices did not appear to accurately reflect our expectations for higher inflation.
In terms of sector allocation, we maintained an allocation to European high yield bonds, which continued to indirectly benefit from the ECB’s bond buying as well as Europe’s low inflation and generally credit-friendly environment. We also had exposure to
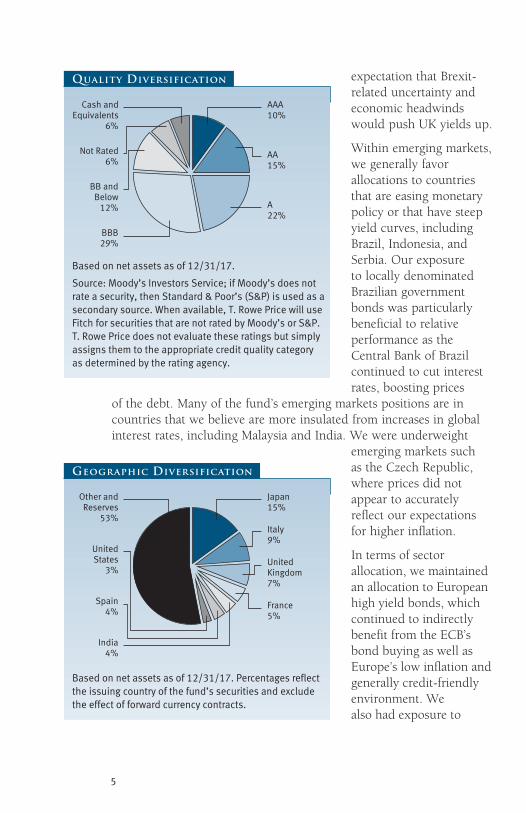
BBB29%
A22%
Not Rated6%
Cash andEquivalents
6%
AA15%
BB andBelow
12%
AAA10%
Based on net assets as of 12/31/17.
Source: Moody’s Investors Service; if Moody’s does notrate a security, then Standard & Poor’s (S&P) is used as asecondary source. When available, T. Rowe Price will useFitch for securities that are not rated by Moody’s or S&P.T. Rowe Price does not evaluate these ratings but simplyassigns them to the appropriate credit quality categoryas determined by the rating agency.
Quality Diversification
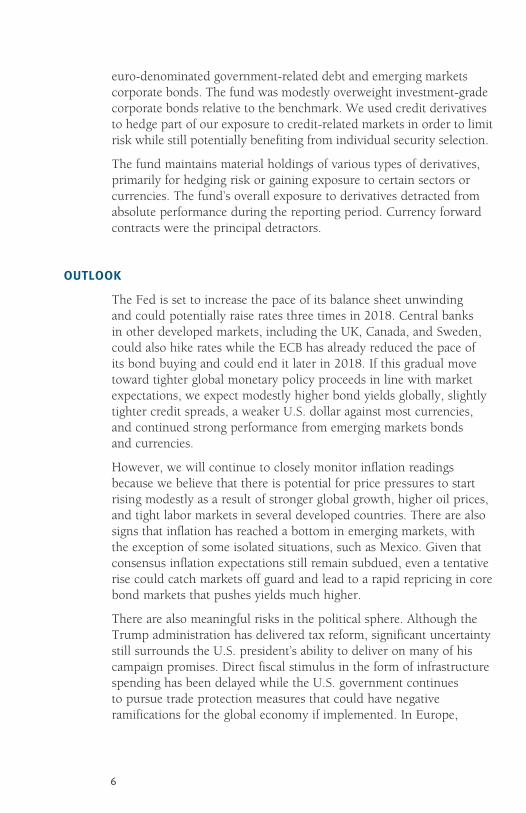
Spain4%
India4%
UnitedKingdom7%
France5%
Other andReserves
53%Italy9%
UnitedStates
3%
Japan15%
Based on net assets as of 12/31/17. Percentages reflectthe issuing country of the fund’s securities and exclude the effect of forward currency contracts.
Geographic Diversification
6
euro-denominated government-related debt and emerging markets corporate bonds. The fund was modestly overweight investment-grade corporate bonds relative to the benchmark. We used credit derivatives to hedge part of our exposure to credit-related markets in order to limit risk while still potentially benefiting from individual security selection.
The fund maintains material holdings of various types of derivatives, primarily for hedging risk or gaining exposure to certain sectors or currencies. The fund’s overall exposure to derivatives detracted from absolute performance during the reporting period. Currency forward contracts were the principal detractors.
OUTLOOK
The Fed is set to increase the pace of its balance sheet unwinding and could potentially raise rates three times in 2018. Central banks in other developed markets, including the UK, Canada, and Sweden, could also hike rates while the ECB has already reduced the pace of its bond buying and could end it later in 2018. If this gradual move toward tighter global monetary policy proceeds in line with market expectations, we expect modestly higher bond yields globally, slightly tighter credit spreads, a weaker U.S. dollar against most currencies, and continued strong performance from emerging markets bonds and currencies.
However, we will continue to closely monitor inflation readings because we believe that there is potential for price pressures to start rising modestly as a result of stronger global growth, higher oil prices, and tight labor markets in several developed countries. There are also signs that inflation has reached a bottom in emerging markets, with the exception of some isolated situations, such as Mexico. Given that consensus inflation expectations still remain subdued, even a tentative rise could catch markets off guard and lead to a rapid repricing in core bond markets that pushes yields much higher.
There are also meaningful risks in the political sphere. Although the Trump administration has delivered tax reform, significant uncertainty still surrounds the U.S. president’s ability to deliver on many of his campaign promises. Direct fiscal stimulus in the form of infrastructure spending has been delayed while the U.S. government continues to pursue trade protection measures that could have negative ramifications for the global economy if implemented. In Europe,

7
fears of populism have receded, but Italy’s March elections have the potential to reignite political risk. Also, noise and ambiguity about the UK’s exit from the European Union is likely to continue through 2018.
The uncertainty dominating the market environment should provide a tailwind for our strategy as we try to find sectors and individual securities that become mispriced as a result of temporary market dislocations. In this environment, we believe that the extended reach of T. Rowe Price’s global sovereign, credit, and equity research platforms, combined with our emphasis on collaboration across those platforms, gives us a critical edge in analyzing risks and opportunities in both developed and emerging fixed income markets.
Respectfully submitted,
Arif HusainPresident of the International Fixed Income Division and co-portfolio manager and cochairman of the fund’s Investment Advisory Committee
Kenneth OrchardCo-portfolio manager and cochairman of the fund’s Investment Advisory Committee
January 26, 2018
The committee chairmen have day-to-day responsibility for the portfolio and work with committee members in developing and executing the fund’s investment program.
8
T. Rowe Price International Bond Fund (USD Hedged)
Risk of International Bond Investing
FundsthatinvestoverseasgenerallycarrymoreriskthanfundsthatinveststrictlyinU.S.assets,includingunpredictablechangesincurrencyvalues.Investmentsinemergingmarketsaresubjecttoabruptandseverepricedeclinesandshouldberegardedasspeculative.Theeconomicandpoliticalstructuresofdevelopingnations,inmostcases,donotcomparefavorablywiththeU.S.orotherdevelopedcountriesintermsofwealthandstability,andtheirfinancialmarketsoftenlackliquidity.Somecountriesalsohavelegaciesofhyperinflation,currencydevaluations,andgovernmentalinterferenceinmarkets.
International investments are subject to currency risk,adeclineinthevalueofaforeigncurrencyversustheU.S.dollar,whichreducesthedollarvalueofsecuritiesdenominatedinthatcurrency.Theoverallimpactonafund’sholdingscanbesignificantandlong-lastingdependingonthecurrenciesrepresentedintheportfolio,howeachoneappreciatesordepreciatesinrelationtotheU.S.dollar,andwhethercurrencypositionsarehedged.Further,exchangeratemovementsareunpredictable,anditisnotpossibletoeffectivelyhedgethecurrencyrisksofmanydevelopingcountries.
Bonds are also subject to interest rate risk,thedeclineinbondpricesthatusuallyaccompaniesariseininterestrates,andcredit risk,thechancethatanyfundholdingcouldhaveitscreditratingdowngradedorthatabondissuerwilldefault(failtomaketimelypaymentsofinterestorprincipal),potentiallyreducingthefund’sincomelevelandshareprice.
Glossary
Bloomberg Barclays Global Aggregate ex USD Bond USD Hedged Index: Anunmanagedindexthattracksaninternationalbasketofbondsthatcontainsgovernment,corporate,agency,andmortgage-relatedbonds,hedgedtoU.S.dollars.
Credit spread: Measurestheadditionalyieldthatinvestorsdemandascompensationforholdingabondwithcreditriskversusasimilar-maturityTreasurysecurityorothertypeoflow-riskbond.
Duration: Ameasureofabond’sorbondfund’ssensitivitytochangesininterestrates.Forexample,afundwithadurationofsixyearswouldfallabout6%inresponsetoaone-percentage-pointriseinrates,andviceversa.
Gross domestic product: Thetotalmarketvalueofallgoodsandservicesproducedinacountryinagivenyear.
J.P. Morgan Emerging Markets Bond Index Global: TracksU.S.dollargovernmentbondsof31foreigncountries.

9
T. Rowe Price International Bond Fund (USD Hedged)
Glossary (continued)
Quasi-sovereign debt: Debtissuedbyacorporationandbackedbytherespectivegovernment,typicallyofferingthehigheryieldsofcorporatedebtwiththeaddedbenefitofgovernmentsupport.
Weighted average maturity: Ameasureofafund’ssensitivitytointerestrates.Ingeneral,thelongertheaveragematurity,thegreaterthefund’ssensitivitytointerestratechanges.Theweightedaveragematuritymaytakeintoaccounttheinterestratereadjustmentdatesforcertainsecurities.
Yield curve: Agraphicdepictionoftherelationshipbetweenyieldsandmaturitydatesforasetofsimilarsecurities.Asecuritywithalongermaturityusuallyhasahigheryield.Ifashort-termsecurityoffersahigheryield,thenthecurveissaidtobe“inverted.”Ifshort-andlong-termbondsareofferingequivalentyields,thenthecurveissaidtobe“flat.”
Note:BloombergIndexServicesLtd.Copyright2018,BloombergIndexServicesLtd.Usedwithpermission.
10
T. Rowe Price International Bond Fund (USD Hedged)
PRICE AND YIELD
12/31/17
International Bond Fund (USD Hedged)
PricePerShare $10.06
DividendsPerShare SinceInception9/15/17 0.03
SECYieldWithWaivera(30-Day) 1.51%
SECYieldWithoutWaiver(30-Day) 1.39%
International Bond Fund (USD Hedged)–Advisor Class
PricePerShare $10.05
DividendsPerShare SinceInception9/15/17 0.02
SECYieldWithWaiverb(30-Day) 1.14%
SECYieldWithoutWaiver(30-Day) 0.82%
International Bond Fund (USD Hedged)–I Class
PricePerShare $10.06
DividendsPerShare SinceInception9/15/17 0.03
SECYieldWithWaiverc(30-Day) 1.60%
SECYieldWithoutWaiver(30-Day) 1.48%
12-monthdividendsmaynotequalthecombined6-monthfiguresduetorounding.Yieldswillvaryandarenotguaranteed.
aThroughApril30,2020,T.RowePriceAssociates(TRPA),hasagreedtowaiveitsmanagementfeesorbearanyexpenses(excludinginterest;expensesrelatedtoborrowings,taxes,andbrokerage;nonrecurring,extraordinaryexpenses;andacquiredfundfeesandexpenses)thatwouldcausetheclass’sratioofexpensestoaveragedailynetassetstoexceed0.74%.Detailsareavailableinthefund’sprospectus.
bThroughApril30,2020,TRPAhasagreedtowaiveitsmanagementfeesorbearanyexpenses(excludinginterest;expensesrelatedtoborrowings,taxes,andbrokerage;nonrecurring,extraordinaryexpenses;andacquiredfundfeesandexpenses)thatwouldcausetheclass’sratioofexpensestoaveragedailynetassetstoexceed0.99%.Detailsareavailableinthefund’sprospectus.
cThroughApril30,2020,TRPAhasagreedtopaytheoperatingexpensesofthefund’sIClass,excludingmanagementfees;interest;expensesrelatedtoborrowings,taxes,andbrokerage;nonrecurring,extraordinaryexpenses;andacquiredfundfeesandexpenses(IClassoperatingexpenses)totheextenttheIClassoperatingexpensesexceedacertainportionoftheclass’saveragedailynetassets.Detailsareavailableinthefund’sprospectus.
Portfolio Highlights
11
T. Rowe Price International Bond Fund (USD Hedged)Performance and Expenses
Since InceptionPeriodEnded12/31/17 9/12/17
InternationalBondFund(USDHedged) 1.24%
InternationalBondFund(USDHedged)–AdvisorClass 1.01
InternationalBondFund(USDHedged)–IClass 1.25
Current performance may be higher or lower than the quoted past performance, which cannot guarantee future results. Share price, principal value, and return will vary, and you may have a gain or loss when you sell your shares. For the most recent month-end performance, please visit our website (troweprice.com) or contact a T. Rowe Price repre-sentative at 1-800-225-5132 or, for Advisor Class and I Class shares, 1-800-638-8790. The performance information shown does not reflect the deduction of a 2% redemption fee on shares held for 90 days or less; if it did, the performance would be lower.
Thistableshowshowthefundwouldhaveperformedeachyearifitsactual(orcumulative)returnshadbeenearnedataconstantrate.Averageannualtotalreturnfiguresincludechangesinprincipalvalue,reinvesteddividends,andcapitalgaindistributions.Returnsdonotreflecttaxesthattheshareholdermaypayonfunddistributionsortheredemptionoffundshares.Whenassessingperformance,investorsshouldconsiderbothshort-andlong-termreturns.
Average Annual Compound Total Return
12
T. Rowe Price International Bond Fund (USD Hedged)
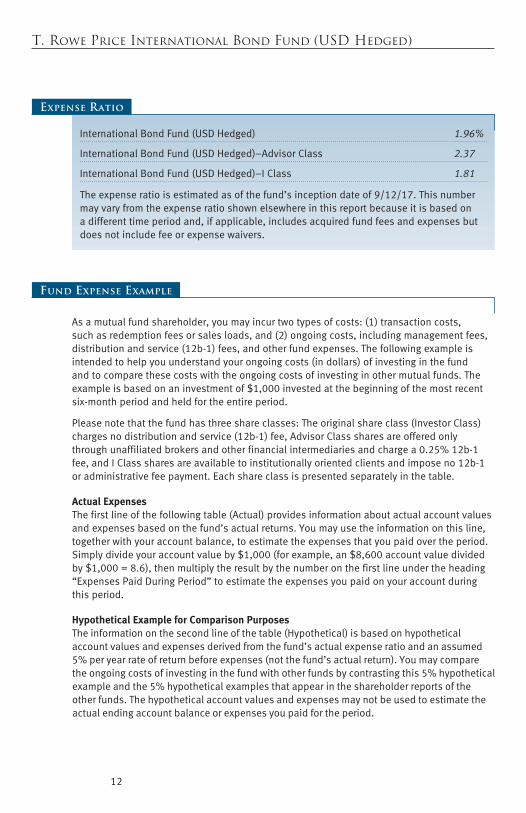
InternationalBondFund(USDHedged) 1.96%
InternationalBondFund(USDHedged)–AdvisorClass 2.37
InternationalBondFund(USDHedged)–IClass 1.81
Theexpenseratioisestimatedasofthefund’sinceptiondateof9/12/17.Thisnumbermayvaryfromtheexpenseratioshownelsewhereinthisreportbecauseitisbasedonadifferenttimeperiodand,ifapplicable,includesacquiredfundfeesandexpensesbutdoesnotincludefeeorexpensewaivers.
Expense Ratio
Fund Expense Example
Asamutualfundshareholder,youmayincurtwotypesofcosts:(1)transactioncosts,suchasredemptionfeesorsalesloads,and(2)ongoingcosts,includingmanagementfees,distributionandservice(12b-1)fees,andotherfundexpenses.Thefollowingexampleisintendedtohelpyouunderstandyourongoingcosts(indollars)ofinvestinginthefundandtocomparethesecostswiththeongoingcostsofinvestinginothermutualfunds.Theexampleisbasedonaninvestmentof$1,000investedatthebeginningofthemostrecentsix-monthperiodandheldfortheentireperiod.
Pleasenotethatthefundhasthreeshareclasses:Theoriginalshareclass(InvestorClass)chargesnodistributionandservice(12b-1)fee,AdvisorClasssharesareofferedonlythroughunaffiliatedbrokersandotherfinancialintermediariesandchargea0.25%12b-1fee,andIClasssharesareavailabletoinstitutionallyorientedclientsandimposeno12b-1oradministrativefeepayment.Eachshareclassispresentedseparatelyinthetable.
Actual ExpensesThefirstlineofthefollowingtable(Actual)providesinformationaboutactualaccountvaluesandexpensesbasedonthefund’sactualreturns.Youmayusetheinformationonthisline,togetherwithyouraccountbalance,toestimatetheexpensesthatyoupaidovertheperiod.Simplydivideyouraccountvalueby$1,000(forexample,an$8,600accountvaluedividedby$1,000=8.6),thenmultiplytheresultbythenumberonthefirstlineundertheheading“ExpensesPaidDuringPeriod”toestimatetheexpensesyoupaidonyouraccountduringthisperiod.
Hypothetical Example for Comparison PurposesTheinformationonthesecondlineofthetable(Hypothetical)isbasedonhypotheticalaccountvaluesandexpensesderivedfromthefund’sactualexpenseratioandanassumed5%peryearrateofreturnbeforeexpenses(notthefund’sactualreturn).Youmaycomparetheongoingcostsofinvestinginthefundwithotherfundsbycontrastingthis5%hypotheticalexampleandthe5%hypotheticalexamplesthatappearintheshareholderreportsoftheotherfunds.Thehypotheticalaccountvaluesandexpensesmaynotbeusedtoestimatetheactualendingaccountbalanceorexpensesyoupaidfortheperiod.

13
T. Rowe Price International Bond Fund (USD Hedged)
Fund Expense Example (continued)
Note:T.RowePricechargesanannualaccountservicefeeof$20,generallyforaccountswithlessthan$10,000.ThefeeiswaivedforanyinvestorwhoseT.RowePricemutualfundaccountstotal$50,000ormore;accountselectingtoreceiveelectronicdeliveryofaccountstatements,transactionconfirmations,prospectuses,andshareholderreports;oraccountsofaninvestorwhoisaT.RowePricePersonalServicesorEnhancedPersonalServicesclient(enrollmentintheseprogramsgenerallyrequiresT.RowePriceassetsofatleast$250,000).Thisfeeisnotincludedintheaccompanyingtable.Ifyouaresubjecttothefee,keepitinmindwhenyouareestimatingtheongoingexpensesofinvestinginthefundandwhencomparingtheexpensesofthisfundwithotherfunds.
Youshouldalsobeawarethattheexpensesshowninthetablehighlightonlyyourongoingcostsanddonotreflectanytransactioncosts,suchasredemptionfeesorsalesloads.Therefore,thesecondlineofthetableisusefulincomparingongoingcostsonlyandwillnothelpyoudeterminetherelativetotalcostsofowningdifferentfunds.Totheextentafundchargestransactioncosts,however,thetotalcostofowningthatfundishigher.
Beginning Ending ExpensesPaid AccountValue AccountValue DuringPeriod* 9/13/171 12/31/17 9/13/17to12/31/171,2
Investor ClassActual $1,000.00 $1,012.40 $1.76
7/1/171 12/31/17 7/1/17to12/31/171,3
Hypothetical(assumes5%returnbeforeexpenses) 1,000.00 1,022.28 2.96
Advisor Class 9/13/171 12/31/17 9/13/17to12/31/171,2
Actual $1,000.00 $1,010.10 $3.00
7/1/171 12/31/17 7/1/17to12/31/171,3
Hypothetical(assumes5%returnbeforeexpenses) 1,000.00 1,020.21 5.04
International Bond Fund (USD Hedged)

14
T. Rowe Price International Bond Fund (USD Hedged)
Fund Expense Example (continued)
Beginning Ending ExpensesPaid AccountValue AccountValue DuringPeriod 9/13/171 12/31/17 9/13/17to12/31/171,2
I ClassActual $1,000.00 $1,012.50 $1.61
7/1/171 12/31/17 7/1/17to12/31/171,3
Hypothetical(assumes5%returnbeforeexpenses) 1,000.00 1,022.53 2.70
1Theactualexpenseexampleisbasedontheperiodsincetheclass’sstartofoperationson9/13/17,onedayafterinception;thehypotheticalexpenseexampleisbasedonthehalf-yearperiodbeginning7/1/17,asrequiredbytheSEC.
2Expensesareequaltotheclass’sannualizedexpenseratiofortheperiodsinceinception,multipliedbytheaverageaccountvalueovertheperiod,multipliedbythenumberofdaysintheperiod(110),anddividedbythedaysintheyear(365)toreflecttheperiodsincetheclass’sstartofoperations.TheannualizedexpenseratiooftheInvestorClasswas0.58%,theAdvisorClasswas0.99%,andtheIClasswas0.53%.
3Expensesareequaltotheclass’sannualizedexpenseratiofortheperiodsinceinception,multipliedbytheaverageaccountvalueovertheperiod,multipliedbythenumberofdaysinthemostrecentfiscalhalfyear(184),anddividedbythedaysintheyear(365)toreflectthehalf-yearperiod.TheannualizedexpenseratiooftheInvestorClasswas0.58%,theAdvisorClasswas0.99%,andtheIClasswas0.53%.
International Bond Fund (USD Hedged)

15
T. Rowe Price International Bond Fund (USD Hedged)
Financial Highlights For a share outstanding throughout each period
The accompanying notes are an integral part of these financial statements.
Investor Class
9/12/17(1)
Through
12/31/17
NET ASSET VALUE
Beginning of period
$ 10.00
Investment activities
Net investment income(2)
0.04(3)
Net realized and unrealized gain / loss
0.08
Total from investment activities
0.12
Distributions
Net investment income
(0.03)
Net realized gain
(0.03)
Total distributions
(0.06)
NET ASSET VALUE
End of period $ 10.06
Ratios/Supplemental Data Total return(4) 1.24%(3)
Ratio of total expenses to average net assets 0.58%
(3)(5)
Ratio of net investment income to average net assets 1.48%
(3)(5)
Portfolio turnover rate
13.5%
Net assets, end of period (in millions)
$ 1,115
(1) Inception date (2) Per share amounts calculated using average shares outstanding method. (3) See Note 6. Excludes expenses in excess of a 0.74% contractual expense limitation in effect
through 4/30/20. (4) Total return reflects the rate that an investor would have earned on an investment in the fund
during each period, assuming reinvestment of all distributions and payment of no redemption or account fees. Total return is not annualized for periods less than one year.
(5) Annualized
16
T. Rowe Price International Bond Fund (USD Hedged)
Financial Highlights For a share outstanding throughout each period
The accompanying notes are an integral part of these financial statements.
Advisor Class
9/12/17(1)
Through
12/31/17 NET ASSET VALUE
Beginning of period
$ 10.00
Investment activities
Net investment income(2)
0.03(3)
Net realized and unrealized gain / loss
0.07
Total from investment activities
0.10
Distributions
Net investment income
(0.02)
Net realized gain
(0.03)
Total distributions
(0.05)
NET ASSET VALUE
End of period $ 10.05
Ratios/Supplemental Data Total return(4) 1.01%(3)
Ratio of total expenses to average net assets 0.99%
(3)(5)
Ratio of net investment income to average net assets 0.85%
(3)(5)
Portfolio turnover rate
13.5%
Net assets, end of period (in thousands)
$ 251
(1) Inception date (2) Per share amounts calculated using average shares outstanding method. (3) See Note 6. Excludes expenses in excess of a 0.99% contractual expense limitation in effect
through 4/30/20. (4) Total return reflects the rate that an investor would have earned on an investment in the fund
during each period, assuming reinvestment of all distributions and payment of no redemption or account fees. Total return is not annualized for periods less than one year.
(5) Annualized

17
T. Rowe Price International Bond Fund (USD Hedged)
Financial Highlights For a share outstanding throughout each period
The accompanying notes are an integral part of these financial statements.
I Class
9/12/17(1)
Through
12/31/17 NET ASSET VALUE
Beginning of period
$ 10.00
Investment activities
Net investment income(2)
0.04(3)
Net realized and unrealized gain / loss
0.08
Total from investment activities
0.12
Distributions
Net investment income
(0.03)
Net realized gain
(0.03)
Total distributions
(0.06)
NET ASSET VALUE
End of period $ 10.06
Ratios/Supplemental Data Total return(4) 1.25%(3)
Ratio of total expenses to average net assets 0.53%
(3)(5)
Ratio of net investment income to average net assets 1.56%
(3)(5)
Portfolio turnover rate
13.5%
Net assets, end of period (in millions)
$ 121
(1) Inception date (2) Per share amounts calculated using average shares outstanding method. (3) Excludes expenses in excess of a 0.05% contractual operating expense limitation in effect
through 4/30/20. (4) Total return reflects the rate that an investor would have earned on an investment in the fund
during each period, assuming reinvestment of all distributions and payment of no redemption or account fees. Total return is not annualized for periods less than one year.
(5) Annualized

T. Rowe Price International Bond Fund (USD Hedged) December 31, 2017
Portfolio of Investments ‡ Par/Shares $ Value
(Cost and value in $000s)
18
ALBANIA 0.2%
Government Bonds 0.2%
Government of Albania, 5.75%, 11/12/20 (EUR) 1,955,000 2,638
Total Albania (Cost $2,583) 2,638
ARGENTINA 0.8%
Corporate Bonds 0.2%
Codere Finance 2 Luxembourg, 6.75%, 11/1/21 (EUR) 1,782,000 2,268
2,268
Government Bonds 0.6%
Republic of Argentina, 3.375%, 1/15/23 (EUR) 3,059,000 3,751
Republic of Argentina, FRN, BDLRPP + 3.25%, 22.75%, 3/1/20 21,672,082 1,190
Republic of Argentina, FRN, 7D ARPP, 28.75%, 6/21/20 21,305,622 1,216
YPF Sociedad Anonima, 8.75%, 4/4/24 (USD) 1,580,000 1,819
7,976
Total Argentina (Cost $10,182) 10,244
AUSTRALIA 2.3%
Corporate Bonds 0.3%
Transurban Finance, 1.875%, 9/16/24 (EUR) 3,340,000 4,235
4,235
Government Bonds 2.0%
Commonwealth of Australia, 3.00%, 3/21/47 7,250,000 5,282
New South Wales Treasury, 4.00%, 4/20/23 13,742,900 11,503
New South Wales Treasury, 4.00%, 5/20/26 9,257,800 7,845
24,630
Total Australia (Cost $28,328) 28,865
T. Rowe Price International Bond Fund (USD Hedged)
Par/Shares $ Value
(Cost and value in $000s)
19
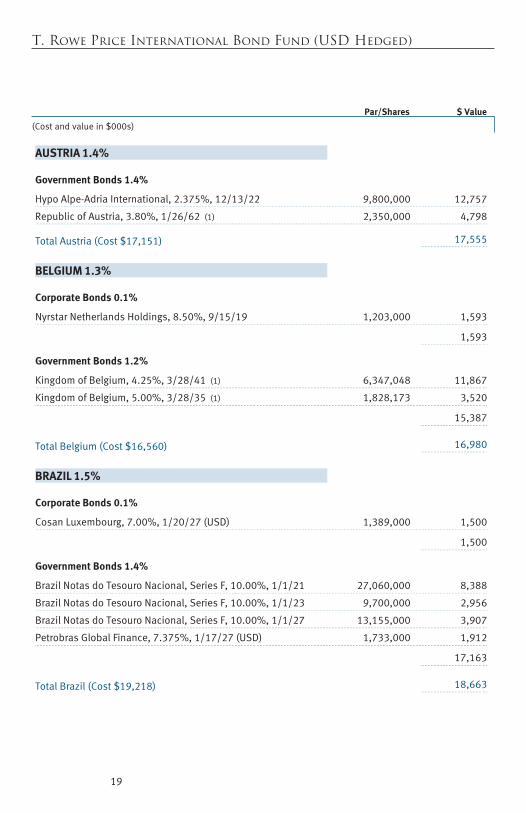
AUSTRIA 1.4%
Government Bonds 1.4%
Hypo Alpe-Adria International, 2.375%, 12/13/22 9,800,000 12,757
Republic of Austria, 3.80%, 1/26/62 (1) 2,350,000 4,798
Total Austria (Cost $17,151) 17,555
BELGIUM 1.3%
Corporate Bonds 0.1%
Nyrstar Netherlands Holdings, 8.50%, 9/15/19 1,203,000 1,593
1,593
Government Bonds 1.2%
Kingdom of Belgium, 4.25%, 3/28/41 (1) 6,347,048 11,867
Kingdom of Belgium, 5.00%, 3/28/35 (1) 1,828,173 3,520
15,387
Total Belgium (Cost $16,560) 16,980
BRAZIL 1.5%
Corporate Bonds 0.1%
Cosan Luxembourg, 7.00%, 1/20/27 (USD) 1,389,000 1,500
1,500
Government Bonds 1.4%
Brazil Notas do Tesouro Nacional, Series F, 10.00%, 1/1/21 27,060,000 8,388
Brazil Notas do Tesouro Nacional, Series F, 10.00%, 1/1/23 9,700,000 2,956
Brazil Notas do Tesouro Nacional, Series F, 10.00%, 1/1/27 13,155,000 3,907
Petrobras Global Finance, 7.375%, 1/17/27 (USD) 1,733,000 1,912
17,163
Total Brazil (Cost $19,218) 18,663
T. Rowe Price International Bond Fund (USD Hedged)
Par/Shares $ Value
(Cost and value in $000s)
20
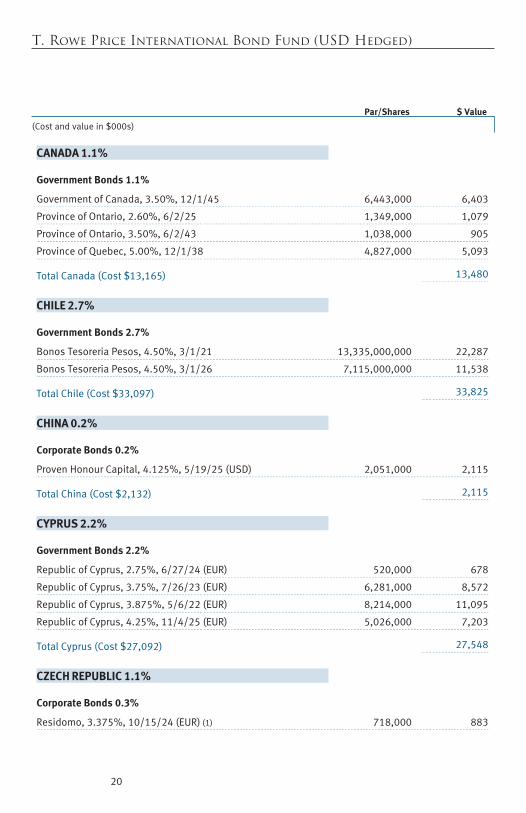
CANADA 1.1%
Government Bonds 1.1%
Government of Canada, 3.50%, 12/1/45 6,443,000 6,403
Province of Ontario, 2.60%, 6/2/25 1,349,000 1,079
Province of Ontario, 3.50%, 6/2/43 1,038,000 905
Province of Quebec, 5.00%, 12/1/38 4,827,000 5,093
Total Canada (Cost $13,165) 13,480
CHILE 2.7%
Government Bonds 2.7%
Bonos Tesoreria Pesos, 4.50%, 3/1/21 13,335,000,000 22,287
Bonos Tesoreria Pesos, 4.50%, 3/1/26 7,115,000,000 11,538
Total Chile (Cost $33,097) 33,825
CHINA 0.2%
Corporate Bonds 0.2%
Proven Honour Capital, 4.125%, 5/19/25 (USD) 2,051,000 2,115
Total China (Cost $2,132) 2,115
CYPRUS 2.2%
Government Bonds 2.2%
Republic of Cyprus, 2.75%, 6/27/24 (EUR) 520,000 678
Republic of Cyprus, 3.75%, 7/26/23 (EUR) 6,281,000 8,572
Republic of Cyprus, 3.875%, 5/6/22 (EUR) 8,214,000 11,095
Republic of Cyprus, 4.25%, 11/4/25 (EUR) 5,026,000 7,203
Total Cyprus (Cost $27,092) 27,548
CZECH REPUBLIC 1.1%
Corporate Bonds 0.3%
Residomo, 3.375%, 10/15/24 (EUR) (1) 718,000 883

T. Rowe Price International Bond Fund (USD Hedged)
Par/Shares $ Value
(Cost and value in $000s)
21
UniCredit Bank, 0.625%, 4/30/20 (EUR) 2,200,000 2,664
3,547
Government Bonds 0.8%
Czech Republic, 3.625%, 4/14/21 (EUR) 6,028,000 8,157
Czech Republic, 3.875%, 5/24/22 (EUR) 1,298,000 1,826
9,983
Total Czech Republic (Cost $13,295) 13,530
DENMARK 1.2%
Corporate Bonds 0.7%
Danske Bank, FRN, 2.75%, 5/19/26 (EUR) (2) 926,000 1,187
Danske Bank, FRN, 3.875%, 10/4/23 (EUR) (2) 1,273,000 1,569
Realkredit Danmark, 1.00%, 4/1/22 1,622,674 272
Realkredit Danmark, 2.00%, 4/1/23 7,038,854 1,234
Realkredit Danmark, 2.00%, 4/1/24 23,886,607 4,205
8,467
Government Bonds 0.5%
Kingdom of Denmark, 1.75%, 11/15/25 24,070,815 4,344
Kingdom of Denmark, 3.00%, 11/15/21 8,398,693 1,527
Kingdom of Denmark, 4.50%, 11/15/39 1,982,381 539
6,410
Total Denmark (Cost $14,633) 14,877
EGYPT 0.3%
Government Bonds 0.3%
Government of Egypt, 0.00%, 3/6/18 28,000,000 1,531
Government of Egypt, 0.00%, 3/27/18 28,500,000 1,540
Government of Egypt, 0.00%, 4/10/18 1,200,000 64
Total Egypt (Cost $3,153) 3,135
T. Rowe Price International Bond Fund (USD Hedged)
Par/Shares $ Value
(Cost and value in $000s)
22
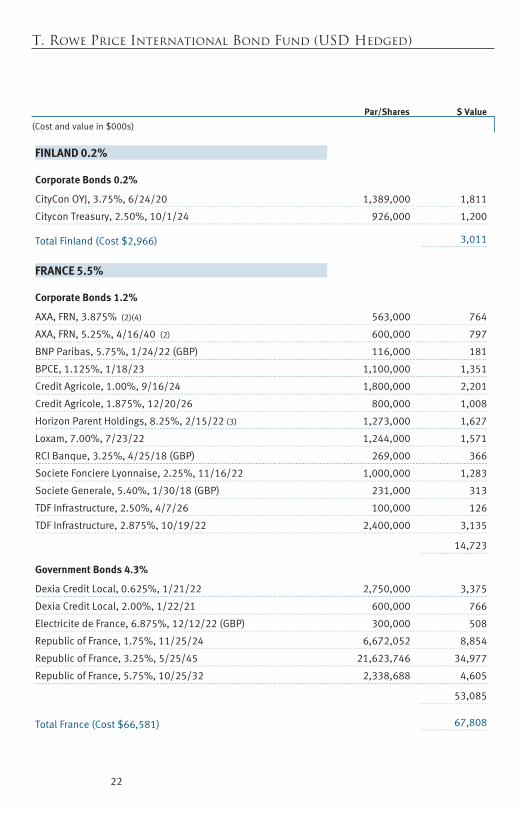
FINLAND 0.2%
Corporate Bonds 0.2%
CityCon OYJ, 3.75%, 6/24/20 1,389,000 1,811
Citycon Treasury, 2.50%, 10/1/24 926,000 1,200
Total Finland (Cost $2,966) 3,011
FRANCE 5.5%
Corporate Bonds 1.2%
AXA, FRN, 3.875% (2)(4) 563,000 764
AXA, FRN, 5.25%, 4/16/40 (2) 600,000 797
BNP Paribas, 5.75%, 1/24/22 (GBP) 116,000 181
BPCE, 1.125%, 1/18/23 1,100,000 1,351
Credit Agricole, 1.00%, 9/16/24 1,800,000 2,201
Credit Agricole, 1.875%, 12/20/26 800,000 1,008
Horizon Parent Holdings, 8.25%, 2/15/22 (3) 1,273,000 1,627
Loxam, 7.00%, 7/23/22 1,244,000 1,571
RCI Banque, 3.25%, 4/25/18 (GBP) 269,000 366
Societe Fonciere Lyonnaise, 2.25%, 11/16/22 1,000,000 1,283
Societe Generale, 5.40%, 1/30/18 (GBP) 231,000 313
TDF Infrastructure, 2.50%, 4/7/26 100,000 126
TDF Infrastructure, 2.875%, 10/19/22 2,400,000 3,135
14,723
Government Bonds 4.3%
Dexia Credit Local, 0.625%, 1/21/22 2,750,000 3,375
Dexia Credit Local, 2.00%, 1/22/21 600,000 766
Electricite de France, 6.875%, 12/12/22 (GBP) 300,000 508
Republic of France, 1.75%, 11/25/24 6,672,052 8,854
Republic of France, 3.25%, 5/25/45 21,623,746 34,977
Republic of France, 5.75%, 10/25/32 2,338,688 4,605
53,085
Total France (Cost $66,581) 67,808
T. Rowe Price International Bond Fund (USD Hedged)
Par/Shares $ Value
(Cost and value in $000s)
23
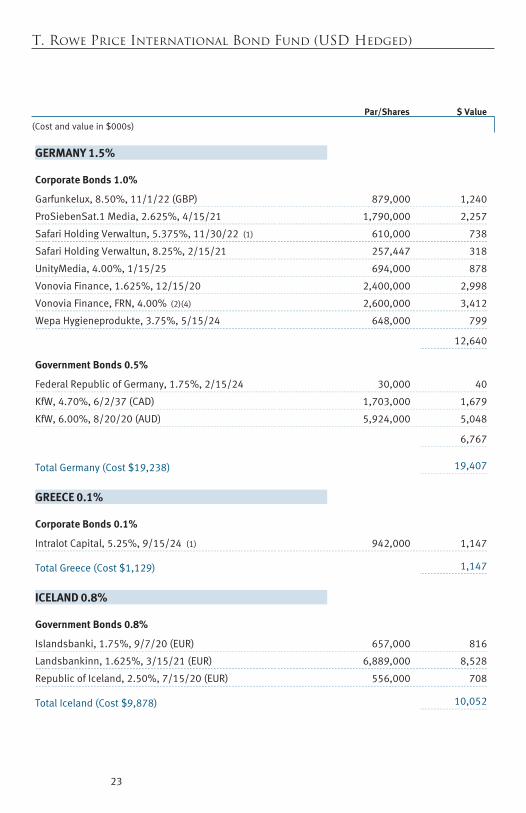
GERMANY 1.5%
Corporate Bonds 1.0%
Garfunkelux, 8.50%, 11/1/22 (GBP) 879,000 1,240
ProSiebenSat.1 Media, 2.625%, 4/15/21 1,790,000 2,257
Safari Holding Verwaltun, 5.375%, 11/30/22 (1) 610,000 738
Safari Holding Verwaltun, 8.25%, 2/15/21 257,447 318
UnityMedia, 4.00%, 1/15/25 694,000 878
Vonovia Finance, 1.625%, 12/15/20 2,400,000 2,998
Vonovia Finance, FRN, 4.00% (2)(4) 2,600,000 3,412
Wepa Hygieneprodukte, 3.75%, 5/15/24 648,000 799
12,640
Government Bonds 0.5%
Federal Republic of Germany, 1.75%, 2/15/24 30,000 40
KfW, 4.70%, 6/2/37 (CAD) 1,703,000 1,679
KfW, 6.00%, 8/20/20 (AUD) 5,924,000 5,048
6,767
Total Germany (Cost $19,238) 19,407
GREECE 0.1%
Corporate Bonds 0.1%
Intralot Capital, 5.25%, 9/15/24 (1) 942,000 1,147
Total Greece (Cost $1,129) 1,147
ICELAND 0.8%
Government Bonds 0.8%
Islandsbanki, 1.75%, 9/7/20 (EUR) 657,000 816
Landsbankinn, 1.625%, 3/15/21 (EUR) 6,889,000 8,528
Republic of Iceland, 2.50%, 7/15/20 (EUR) 556,000 708
Total Iceland (Cost $9,878) 10,052
T. Rowe Price International Bond Fund (USD Hedged)
Par/Shares $ Value
(Cost and value in $000s)
24
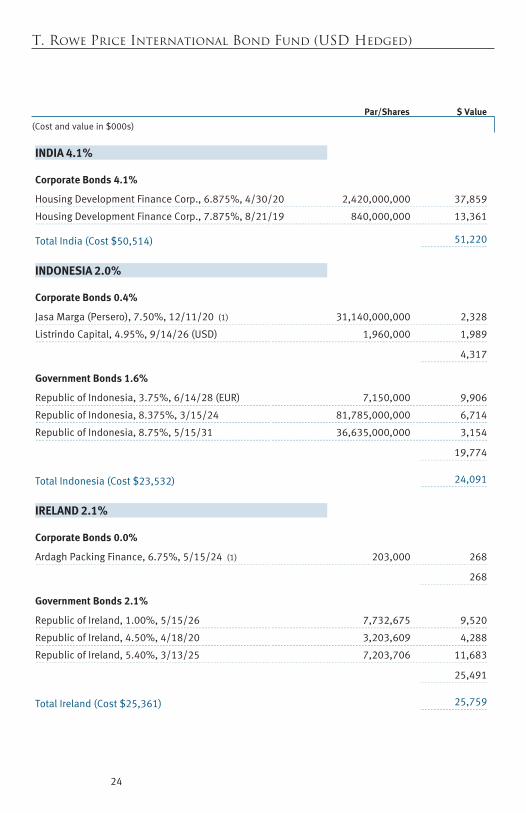
INDIA 4.1%
Corporate Bonds 4.1%
Housing Development Finance Corp., 6.875%, 4/30/20 2,420,000,000 37,859
Housing Development Finance Corp., 7.875%, 8/21/19 840,000,000 13,361
Total India (Cost $50,514) 51,220
INDONESIA 2.0%
Corporate Bonds 0.4%
Jasa Marga (Persero), 7.50%, 12/11/20 (1) 31,140,000,000 2,328
Listrindo Capital, 4.95%, 9/14/26 (USD) 1,960,000 1,989
4,317
Government Bonds 1.6%
Republic of Indonesia, 3.75%, 6/14/28 (EUR) 7,150,000 9,906
Republic of Indonesia, 8.375%, 3/15/24 81,785,000,000 6,714
Republic of Indonesia, 8.75%, 5/15/31 36,635,000,000 3,154
19,774
Total Indonesia (Cost $23,532) 24,091
IRELAND 2.1%
Corporate Bonds 0.0%
Ardagh Packing Finance, 6.75%, 5/15/24 (1) 203,000 268
268
Government Bonds 2.1%
Republic of Ireland, 1.00%, 5/15/26 7,732,675 9,520
Republic of Ireland, 4.50%, 4/18/20 3,203,609 4,288
Republic of Ireland, 5.40%, 3/13/25 7,203,706 11,683
25,491
Total Ireland (Cost $25,361) 25,759

T. Rowe Price International Bond Fund (USD Hedged)
Par/Shares $ Value
(Cost and value in $000s)
25
ISRAEL 2.5%
Government Bonds 2.5%
Israel Fixed Bond, 1.75%, 8/31/25 72,329,462 21,340
State of Israel, 1.50%, 1/18/27 (EUR) 3,447,000 4,261
State of Israel, 4.625%, 3/18/20 (EUR) 4,275,000 5,655
Total Israel (Cost $30,777) 31,256
ITALY 9.3%
Corporate Bonds 1.3%
Autostrade per L'talia, 6.25%, 6/9/22 (GBP) 532,000 862
Enel Finance International, 5.625%, 8/14/24 (GBP) 868,000 1,426
FCA Capital Ireland, 4.00%, 10/17/18 1,038,000 1,286
Inter Media Communication, 4.875%, 12/31/22 (1) 655,000 803
Intesa Sanpaolo, 1.375%, 1/18/24 1,389,000 1,706
Intesa Sanpaolo, 3.928%, 9/15/26 1,489,000 1,956
Telecom Italia, 2.375%, 10/12/27 3,000,000 3,599
Telecom Italia, 5.875%, 5/19/23 (GBP) 400,000 630
UniCredit, 2.00%, 3/4/23 1,851,000 2,355
UniCredit, 3.625%, 1/24/19 810,000 1,009
15,632
Government Bonds 8.0%
Italy Buoni Poliennali del Tesoro, 0.90%, 8/1/22 13,018,000 15,736
Italy Buoni Poliennali del Tesoro, 2.00%, 12/1/25 10,519,000 12,929
Italy Buoni Poliennali del Tesoro, 2.20%, 6/1/27 80,000 98
Italy Buoni Poliennali del Tesoro, 4.50%, 3/1/24 7,652,000 10,951
Italy Buoni Poliennali del Tesoro, 4.75%, 9/1/21 14,473,000 20,120
Italy Buoni Poliennali del Tesoro, 5.00%, 3/1/22 6,082,000 8,628
Italy Buoni Poliennali del Tesoro, 5.00%, 9/1/40 1,185,000 1,858
Italy Buoni Poliennali del Tesoro, 5.50%, 9/1/22 19,678,000 28,793
99,113
Total Italy (Cost $113,011) 114,745
T. Rowe Price International Bond Fund (USD Hedged)
Par/Shares $ Value
(Cost and value in $000s)
26
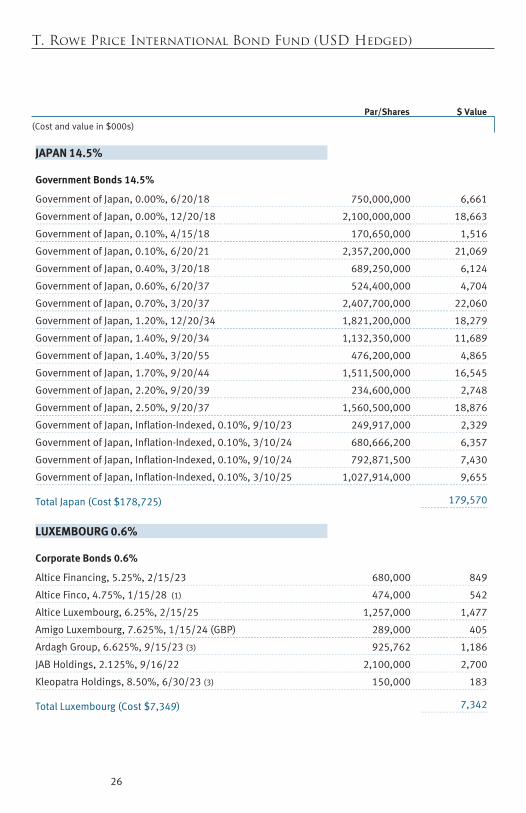
JAPAN 14.5%
Government Bonds 14.5%
Government of Japan, 0.00%, 6/20/18 750,000,000 6,661
Government of Japan, 0.00%, 12/20/18 2,100,000,000 18,663
Government of Japan, 0.10%, 4/15/18 170,650,000 1,516
Government of Japan, 0.10%, 6/20/21 2,357,200,000 21,069
Government of Japan, 0.40%, 3/20/18 689,250,000 6,124
Government of Japan, 0.60%, 6/20/37 524,400,000 4,704
Government of Japan, 0.70%, 3/20/37 2,407,700,000 22,060
Government of Japan, 1.20%, 12/20/34 1,821,200,000 18,279
Government of Japan, 1.40%, 9/20/34 1,132,350,000 11,689
Government of Japan, 1.40%, 3/20/55 476,200,000 4,865
Government of Japan, 1.70%, 9/20/44 1,511,500,000 16,545
Government of Japan, 2.20%, 9/20/39 234,600,000 2,748
Government of Japan, 2.50%, 9/20/37 1,560,500,000 18,876
Government of Japan, Inflation-Indexed, 0.10%, 9/10/23 249,917,000 2,329
Government of Japan, Inflation-Indexed, 0.10%, 3/10/24 680,666,200 6,357
Government of Japan, Inflation-Indexed, 0.10%, 9/10/24 792,871,500 7,430
Government of Japan, Inflation-Indexed, 0.10%, 3/10/25 1,027,914,000 9,655
Total Japan (Cost $178,725) 179,570
LUXEMBOURG 0.6%
Corporate Bonds 0.6%
Altice Financing, 5.25%, 2/15/23 680,000 849
Altice Finco, 4.75%, 1/15/28 (1) 474,000 542
Altice Luxembourg, 6.25%, 2/15/25 1,257,000 1,477
Amigo Luxembourg, 7.625%, 1/15/24 (GBP) 289,000 405
Ardagh Group, 6.625%, 9/15/23 (3) 925,762 1,186
JAB Holdings, 2.125%, 9/16/22 2,100,000 2,700
Kleopatra Holdings, 8.50%, 6/30/23 (3) 150,000 183
Total Luxembourg (Cost $7,349) 7,342

T. Rowe Price International Bond Fund (USD Hedged)
Par/Shares $ Value
(Cost and value in $000s)
27
MALAYSIA 2.0%
Government Bonds 2.0%
1MDB Global Investments, 4.40%, 3/9/23 (USD) 6,600,000 6,428
Government of Malaysia, 4.736%, 3/15/46 76,200,000 18,499
Total Malaysia (Cost $23,936) 24,927
MEXICO 2.2%
Government Bonds 2.2%
Petroleos Mexicanos, 2.75%, 4/21/27 (EUR) 2,614,000 3,017
Petroleos Mexicanos, 3.125%, 11/27/20 (EUR) 463,000 597
Petroleos Mexicanos, 3.75%, 3/15/19 (EUR) 2,407,000 3,013
Petroleos Mexicanos, 4.875%, 2/21/28 (EUR) 4,428,000 5,911
Petroleos Mexicanos, 5.125%, 3/15/23 (EUR) 6,268,000 8,770
United Mexican States, 7.50%, 6/3/27 27,772,800 1,397
United Mexican States, 7.75%, 11/13/42 57,778,800 2,924
United Mexican States, 10.00%, 12/5/24 18,400,800 1,056
Total Mexico (Cost $26,343) 26,685
MONGOLIA 0.2%
Government Bonds 0.2%
Government of Mongolia, 5.125%, 12/5/22 (USD) 2,600,000 2,581
Government of Mongolia, 10.875%, 4/6/21 (USD) 200,000 235
Total Mongolia (Cost $2,807) 2,816
MOROCCO 0.6%
Government Bonds 0.6%
Kingdom of Morocco, 4.50%, 10/5/20 (EUR) 5,084,000 6,788
Total Morocco (Cost $6,641) 6,788

T. Rowe Price International Bond Fund (USD Hedged)
Par/Shares $ Value
(Cost and value in $000s)
28
NETHERLANDS 0.8%
Corporate Bonds 0.8%
ABN Amro Bank, 6.375%, 4/27/21 463,000 661
Constellium, 4.25%, 2/15/26 (1) 330,000 397
Cooperatieve Rabobank, FRN, 2.50%, 5/26/26 (2) 1,851,000 2,350
ING Bank, FRN, 3.625%, 2/25/26 (2) 1,909,000 2,502
Lincoln Finance, 6.875%, 4/15/21 679,000 852
Maxeda Diy Holding, 6.125%, 7/15/22 (1) 355,000 428
Rabobank Nederland, 4.625%, 5/23/29 (GBP) 100,000 160
Rabobank Nederland, 4.875%, 1/10/23 (GBP) 926,000 1,452
Ziggo Secured Finance, 3.75%, 1/15/25 (1) 457,000 565
9,367
Government Bonds 0.0%
Kingdom of the Netherlands, 5.50%, 1/15/28 70,000 125
125
Total Netherlands (Cost $9,343) 9,492
NORWAY 0.4%
Corporate Bonds 0.2%
DNB NOR Boligkreditt, 1.875%, 11/21/22 (EUR) 2,234,000 2,902
2,902
Government Bonds 0.2%
Kingdom of Norway, 3.00%, 3/14/24 (1) 14,966,000 2,007
Kingdom of Norway, 3.75%, 5/25/21 (1) 1,851,000 247
2,254
Total Norway (Cost $5,143) 5,156

T. Rowe Price International Bond Fund (USD Hedged)
Par/Shares $ Value
(Cost and value in $000s)
29
PHILIPPINES 0.2%
Corporate Bonds 0.2%
ICTSI Treasury, 5.875%, 9/17/25 (USD) 1,690,000 1,868
Total Philippines (Cost $1,865) 1,868
PORTUGAL 1.7%
Government Bonds 1.7%
Republic of Portugal, 3.875%, 2/15/30 (1) 2,148,607 2,988
Republic of Portugal, 4.10%, 2/15/45 (1) 3,752,436 5,258
Republic of Portugal, 4.95%, 10/25/23 (1) 8,241,572 12,176
Total Portugal (Cost $19,507) 20,422
ROMANIA 1.7%
Government Bonds 1.7%
Republic of Romania, 4.625%, 9/18/20 (EUR) 4,215,000 5,699
Republic of Romania, 4.75%, 2/24/25 15,675,000 4,186
Republic of Romania, 4.875%, 11/7/19 (EUR) 2,798,000 3,672
Republic of Romania, 5.85%, 4/26/23 28,280,000 7,922
Total Romania (Cost $21,249) 21,479
RUSSIA 0.6%
Corporate Bonds 0.1%
Sberbank of Russia, 3.08%, 3/7/19 (EUR) 990,000 1,221
1,221
Government Bonds 0.5%
Russian Federation, 8.15%, 2/3/27 358,960,000 6,562
6,562
Total Russia (Cost $7,637) 7,783

T. Rowe Price International Bond Fund (USD Hedged)
Par/Shares $ Value
(Cost and value in $000s)
30
SERBIA 0.1%
Government Bonds 0.1%
Republic of Serbia, 5.75%, 7/21/23 54,150,000 575
Republic of Serbia, 7.25%, 9/28/21 (USD) 900,000 1,031
Total Serbia (Cost $1,585) 1,606
SINGAPORE 0.4%
Government Bonds 0.4%
Government of Singapore, 3.125%, 9/1/22 6,939,000 5,515
Total Singapore (Cost $5,426) 5,515
SLOVENIA 2.3%
Government Bonds 2.3%
Republic of Slovenia, 1.25%, 3/22/27 (EUR) 6,412,000 7,979
Republic of Slovenia, 1.50%, 3/25/35 (EUR) 2,107,000 2,505
Republic of Slovenia, 2.125%, 7/28/25 (EUR) 5,384,000 7,251
Republic of Slovenia, 4.625%, 9/9/24 (EUR) 1,943,000 3,035
Republic of Slovenia, 5.125%, 3/30/26 (EUR) 1,775,000 2,920
Republic of Slovenia, 5.25%, 2/18/24 (USD) 4,057,000 4,654
Total Slovenia (Cost $27,875) 28,344
SOUTH AFRICA 1.9%
Government Bonds 1.9%
Republic of South Africa, 10.50%, 12/21/26 265,550,000 23,993
Total South Africa (Cost $20,625) 23,993
SPAIN 3.8%
Corporate Bonds 2.3%
Banco Santander, 1.375%, 2/9/22 1,000,000 1,237
BBVA Sub Capital Unipers, FRN, 3.50%, 4/11/24 (2) 2,100,000 2,622
CaixaBank, FRN, 2.75%, 7/14/28 (2) 9,100,000 11,103

T. Rowe Price International Bond Fund (USD Hedged)
Par/Shares $ Value
(Cost and value in $000s)
31
Inmobiliaria Colonial, 2.728%, 6/5/23 2,900,000 3,792
Prosegur Cia de Seguridad, 2.75%, 4/2/18 400,000 483
Santander Consumer Finance, 0.90%, 2/18/20 1,800,000 2,196
Santander Issuances, 3.125%, 1/19/27 1,800,000 2,354
Telefonica Emisiones, 2.242%, 5/27/22 700,000 906
Telefonica Emisiones, 4.71%, 1/20/20 800,000 1,051
Telefonica Emisiones, 5.597%, 3/12/20 (GBP) 400,000 591
Telefonica Europe, FRN, 4.20% (2)(4) 1,400,000 1,773
Telefonica Europe, FRN, 5.875% (2)(4) 600,000 835
28,943
Government Bonds 1.5%
Kingdom of Spain, 1.50%, 4/30/27 (1) 11,500,000 13,859
Kingdom of Spain, 3.45%, 7/30/66 (1) 1,305,000 1,664
Kingdom of Spain, 5.15%, 10/31/44 (1) 1,410,000 2,449
17,972
Total Spain (Cost $46,463) 46,915
SRI LANKA 0.6%
Government Bonds 0.6%
Republic of Sri Lanka, 0.00%, 9/21/18 550,000,000 3,374
Republic of Sri Lanka, 6.20%, 5/11/27 (USD) (1) 736,000 779
Republic of Sri Lanka, 6.25%, 10/4/20 (USD) 100,000 106
Republic of Sri Lanka, 0.00%, 9/14/18 450,000,000 2,765
Total Sri Lanka (Cost $6,991) 7,024
SUPRANATIONAL 0.9%
Government Bonds 0.9%
European Investment Bank, 1.25%, 5/12/25 (SEK) 65,740,000 8,178
Inter-American Development Bank, 4.40%, 1/26/26 (CAD) 2,734,000 2,446
Total Supranational (Cost $10,560) 10,624

T. Rowe Price International Bond Fund (USD Hedged)
Par/Shares $ Value
(Cost and value in $000s)
32
SWEDEN 2.0%
Corporate Bonds 1.9%
Akelius Residential, 1.75%, 2/7/25 (EUR) 2,137,000 2,596
Nordea Hypotek, 1.00%, 4/8/22 140,100,000 17,377
Nordea Hypotek, 1.25%, 5/19/21 12,700,000 1,597
Skandinaviska Enskilda Banken, 1.50%, 6/17/20 13,500,000 1,706
23,276
Government Bonds 0.1%
Kingdom of Sweden, 1.00%, 11/12/26 9,940,000 1,259
1,259
Total Sweden (Cost $24,296) 24,535
SWITZERLAND 0.8%
Corporate Bonds 0.8%
Adecco International Financial Services 2.75%, 11/15/19 (EUR) 347,000 434
Cloverie, FRN, 7.50%, 7/24/39 (EUR) (2) 800,000 1,067
Credit Suisse Group Funding Limited, 1.25%, 4/14/22 (EUR) 2,083,000 2,577
Onex Wizard Acquisition Company II, 7.75%, 2/15/23 (EUR) 763,000 956
UBS AG London, 1.375%, 4/16/21 (EUR) 2,638,000 3,310
Zurich Insurance, FRN, 4.25%, 10/2/43 (EUR) (2) 694,000 970
Total Switzerland (Cost $9,171) 9,314
THAILAND 0.5%
Government Bonds 0.5%
Kingdom of Thailand, 4.875%, 6/22/29 150,695,000 5,683
Total Thailand (Cost $5,630) 5,683
T. Rowe Price International Bond Fund (USD Hedged)
Par/Shares $ Value
(Cost and value in $000s)
33
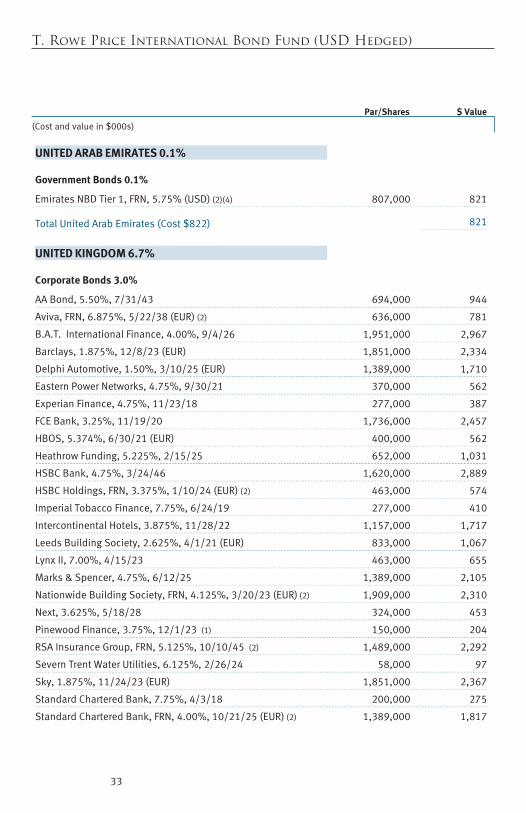
UNITED ARAB EMIRATES 0.1%
Government Bonds 0.1%
Emirates NBD Tier 1, FRN, 5.75% (USD) (2)(4) 807,000 821
Total United Arab Emirates (Cost $822) 821
UNITED KINGDOM 6.7%
Corporate Bonds 3.0%
AA Bond, 5.50%, 7/31/43 694,000 944
Aviva, FRN, 6.875%, 5/22/38 (EUR) (2) 636,000 781
B.A.T. International Finance, 4.00%, 9/4/26 1,951,000 2,967
Barclays, 1.875%, 12/8/23 (EUR) 1,851,000 2,334
Delphi Automotive, 1.50%, 3/10/25 (EUR) 1,389,000 1,710
Eastern Power Networks, 4.75%, 9/30/21 370,000 562
Experian Finance, 4.75%, 11/23/18 277,000 387
FCE Bank, 3.25%, 11/19/20 1,736,000 2,457
HBOS, 5.374%, 6/30/21 (EUR) 400,000 562
Heathrow Funding, 5.225%, 2/15/25 652,000 1,031
HSBC Bank, 4.75%, 3/24/46 1,620,000 2,889
HSBC Holdings, FRN, 3.375%, 1/10/24 (EUR) (2) 463,000 574
Imperial Tobacco Finance, 7.75%, 6/24/19 277,000 410
Intercontinental Hotels, 3.875%, 11/28/22 1,157,000 1,717
Leeds Building Society, 2.625%, 4/1/21 (EUR) 833,000 1,067
Lynx II, 7.00%, 4/15/23 463,000 655
Marks & Spencer, 4.75%, 6/12/25 1,389,000 2,105
Nationwide Building Society, FRN, 4.125%, 3/20/23 (EUR) (2) 1,909,000 2,310
Next, 3.625%, 5/18/28 324,000 453
Pinewood Finance, 3.75%, 12/1/23 (1) 150,000 204
RSA Insurance Group, FRN, 5.125%, 10/10/45 (2) 1,489,000 2,292
Severn Trent Water Utilities, 6.125%, 2/26/24 58,000 97
Sky, 1.875%, 11/24/23 (EUR) 1,851,000 2,367
Standard Chartered Bank, 7.75%, 4/3/18 200,000 275
Standard Chartered Bank, FRN, 4.00%, 10/21/25 (EUR) (2) 1,389,000 1,817

T. Rowe Price International Bond Fund (USD Hedged)
Par/Shares $ Value
(Cost and value in $000s)
34
Tesco, 6.125%, 2/24/22 509,000 792
Virgin Media Finance, 6.375%, 10/15/24 463,000 668
WM Morrison Supermarkets, 2.25%, 6/19/20 (EUR) 1,736,000 2,189
36,616
Government Bonds 3.7%
Government of the United Kingdom, 3.50%, 1/22/45 10,471,696 19,296
Government of the United Kingdom, 3.75%, 9/7/20 180,000 264
Government of the United Kingdom, 4.25%, 12/7/27 85,000 148
Government of the United Kingdom, 4.25%, 6/7/32 1,180,582 2,159
Government of the United Kingdom, 4.25%, 12/7/46 8,491,228 17,851
Government of the United Kingdom, 4.75%, 12/7/30 3,022,853 5,687
45,405
Total United Kingdom (Cost $79,105) 82,021
UNITED STATES 3.0%
Corporate Bonds 3.0%
Alliance Data Systems, 5.25%, 11/15/23 (EUR) 1,157,000 1,462
American International Group, 1.875%, 6/21/27 (EUR) 2,315,000 2,835
American International Group, 5.00%, 4/26/23 (GBP) 200,000 312
Apple, 3.05%, 7/31/29 (GBP) 926,000 1,381
Bank of America, VR, 1.379%, 2/7/25 (EUR) (2) 1,951,000 2,406
Carnival, 1.125%, 11/6/19 (EUR) 1,210,000 1,480
Citigroup, 6.25%, 9/2/19 (GBP) 437,000 640
ContourGlobal Power Holdings, 5.125%, 6/15/21 (EUR) 1,100,000 1,376
Discovery Communications, 2.50%, 9/20/24 (GBP) 1,720,000 2,296
Eastman Chemical, 1.50%, 5/26/23 (EUR) 512,000 639
Expedia, 2.50%, 6/3/22 (EUR) 1,504,000 1,907
General Motors Financial, 1.875%, 10/15/19 (EUR) 2,777,000 3,438
Goldman Sachs Group, 1.625%, 7/27/26 (EUR) 1,720,000 2,097
Goldman Sachs Group, 5.50%, 10/12/21 (GBP) 116,000 178
Manpower, 4.50%, 6/22/18 (EUR) 810,000 994
Met Life Global Funding I, 3.50%, 9/30/26 (GBP) 1,574,000 2,404
MetLife, 5.25%, 6/29/20 (GBP) 277,000 412

T. Rowe Price International Bond Fund (USD Hedged)
Par/Shares $ Value
(Cost and value in $000s)
35
Morgan Stanley, 1.375%, 10/27/26 (EUR) 1,851,000 2,223
Morgan Stanley, 5.00%, 5/2/19 (EUR) 350,000 448
Morgan Stanley, 5.375%, 8/10/20 (EUR) 350,000 477
Priceline Group, 2.15%, 11/25/22 (EUR) 875,000 1,126
Priceline Group, 2.375%, 9/23/24 (EUR) 2,762,000 3,580
Prologis, 2.25%, 6/30/29 (GBP) 1,620,000 2,141
Vantiv, 3.875%, 11/15/25 (GBP) (1) 525,000 719
Veritas, 7.50%, 2/1/23 (EUR) 424,000 539
Total United States (Cost $36,700) 37,510
SHORT-TERM INVESTMENTS 6.9%
Money Market Funds 5.1%
T. Rowe Price Government Reserve Fund, 1.24%, (5)(6) 63,296,908 63,297
63,297
U.S. Treasury Obligations 1.8%
U.S. Treasury Bills, 1.265%, 3/1/18 (7) 22,135,000 22,089
22,089
Total Short-Term Investments (Cost $85,386) 85,386

T. Rowe Price International Bond Fund (USD Hedged)
36
(Amountsin000s,exceptforcontracts)
OPTIONS PURCHASED 0.0%
OTC Options Purchased 0.0%
Counterparty Description Contracts Notional Amount Value
Citigroup EUR Put/ USD Call, 2/1/18 @ 1.174 (USD) (8) 1 6,150 6
Morgan Stanley
EUR Put/ USD Call, 2/1/18 @ 1.183 (USD) (8) 1 6,150 14
Citigroup EUR Put/ USD Call, 2/1/18 @ 1.164 (USD) (8) 1 6,150 3
Citigroup EUR Put/USD Call, 1/9/18 @ 1.173 (USD) (8) 1 18,500 1
Total Options Purchased (Cost $179) 24
Total Investments in Securities
99.9% of Net Assets (Cost $1,214,935) $ 1,235,594
‡
Country classifications are generally based on MSCI categories or another unaffiliated third party data provider; Par/Shares and Notional Amount are denominated in the currency of the country presented unless otherwise noted.
(1)
Security was purchased pursuant to Rule 144A under the Securities Act of 1933 and may be resold in transactions exempt from registration only to qualified institutional buyers -- total value of such securities at period-end amounts to $70,634 and represents 5.7% of net assets.
(2)
Security is a fix-to-float security, which carries a fixed coupon until a certain date, upon which it switches to a floating rate. Reference rate and spread is provided if the rate is currently floating.
(3)
Security has the ability to pay in kind or pay in cash. When applicable, separate rates of such payments are disclosed.
(4) Perpetual security with no stated maturity date. (5) Seven-day yield (6) Affiliated Company (7)
At December 31, 2017, all or a portion of this security is pledged as collateral and/or margin deposit to cover future funding obligations.
(8) Non-income producing 3M CZK PRIBOR Three month CZK PRIBOR (Prague Interbank Offered Rate) 3M EUR
LIBOR Three month EUR EURIBOR (EURO interbank offered rate) 3M HKD
HIBOR Three month HKD HIBOR (Hong Kong Interbank Offered Rate)

T. Rowe Price International Bond Fund (USD Hedged)
37
3M JPY LIBOR Three month JPY LIBOR (London interbank offered rate)
3M PLN WIBOR Three month PLN WIBOR (Warsaw interbank offered rate)
7D ARPP Argentina Central Bank seven day repo reference rate AUD Australian Dollar BRL Brazilian Real
BDLRPP Argentina deposit rates (Badlar) at private banks CAD Canadian Dollar CHF Swiss Franc CLP Chilean Peso CNY China Renminbi CZK Czech Koruna DKK Danish Krone EUR Euro FRN Floating-Rate Note GBP British Pound HKD Hong Kong Dollar IDR Indonesian Rupiah ILS Israeli Shekel INR Indian Rupee JPY Japanese Yen
KRW South Korean Won MXN Mexican Peso MYR Malaysian Ringgit NOK Norwegian Krone OTC Over the counter PLN Polish Zloty RON New Romanian Leu RSD Serbian Dinar RUB Russian Ruble SEK Swedish Krona SGD Singapore Dollar THB Thai Baht TRY Turkish Lira
TWD Taiwan Dollar USD U.S. Dollar
VR
Variable Rate; rate shown is effective rate at period-end. The rates for certain variable rate securities are not based on a published reference rate and spread but are determined by the issuer or agent and based on current market conditions.
ZAR South African Rand
38
T. Rowe Price International Bond Fund (USD Hedged)
(Amountsin000s)
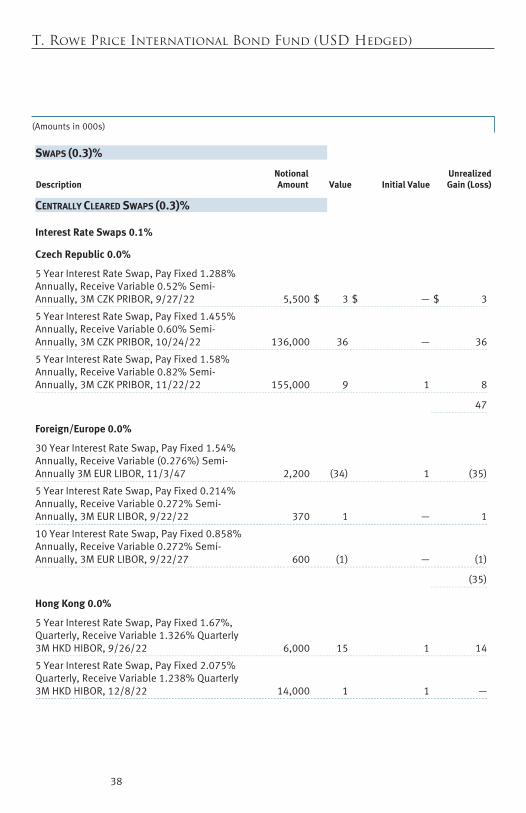
SWAPS (0.3)%
Description NotionalAmount Value Initial Value
UnrealizedGain (Loss)
CENTRALLY CLEARED SWAPS (0.3)%
Interest Rate Swaps 0.1%
Czech Republic 0.0%
5 Year Interest Rate Swap, Pay Fixed 1.288% Annually, Receive Variable 0.52% Semi-Annually, 3M CZK PRIBOR, 9/27/22 5,500 $ 3 $ — $ 3
5 Year Interest Rate Swap, Pay Fixed 1.455% Annually, Receive Variable 0.60% Semi-Annually, 3M CZK PRIBOR, 10/24/22 136,000 36 — 36
5 Year Interest Rate Swap, Pay Fixed 1.58% Annually, Receive Variable 0.82% Semi-Annually, 3M CZK PRIBOR, 11/22/22 155,000 9 1 8
47
Foreign/Europe 0.0%
30 Year Interest Rate Swap, Pay Fixed 1.54% Annually, Receive Variable (0.276%) Semi-Annually 3M EUR LIBOR, 11/3/47 2,200 (34) 1 (35)
5 Year Interest Rate Swap, Pay Fixed 0.214% Annually, Receive Variable 0.272% Semi-Annually, 3M EUR LIBOR, 9/22/22 370 1 — 1
10 Year Interest Rate Swap, Pay Fixed 0.858% Annually, Receive Variable 0.272% Semi-Annually, 3M EUR LIBOR, 9/22/27 600 (1) — (1)
(35)
Hong Kong 0.0%
5 Year Interest Rate Swap, Pay Fixed 1.67%, Quarterly, Receive Variable 1.326% Quarterly 3M HKD HIBOR, 9/26/22 6,000 15 1 14
5 Year Interest Rate Swap, Pay Fixed 2.075% Quarterly, Receive Variable 1.238% Quarterly 3M HKD HIBOR, 12/8/22 14,000 1 1 —

39
T. Rowe Price International Bond Fund (USD Hedged)
(Amountsin000s)
Description NotionalAmount Value Initial Value
UnrealizedGain (Loss)
5 Year Interest Rate Swap, Pay Fixed 1.955% Quarterly, Receive Variable 0.855% Quarterly 3M HKD HIBOR, 10/20/22 145,000 $ 68 $ — $ 68
5 Year Interest Rate Swap, Pay Fixed 1.90% Quarterly, Receive Variable 0.961% Quarterly 3M HKD HIBOR, 11/20/22 155,000 149 — 149
231
Japan 0.1%
20 Year Interest Rate Swap, Receive Fixed 0.732% Semi-Annually, Pay Variable (0.002%) Semi-Annually, 3M JPY LIBOR, 11/7/37 3,000,000 449 1 448
448
Poland 0.0%
5 Year Interest Rate Swap, Pay Fixed 2.555% Annually, Receive Variable 1.81% Semi-Annually, 3M PLN WIBOR, 11/6/22 10,700 (14) 1 (15)
5 Year Interest Rate Swap, Pay Fixed 2.58% Annually, Receive Variable 1.81% Semi-Annually, 3M PLN WIBOR, 11/6/22 10,700 (17) 1 (18)
5 Year Interest Rate Swap, Pay Fixed 2.50% Annually, Receive Variable 1.81% Semi-Annually 3M PLN WIBOR, 10/24/22 22,000 (14) — (14)
5 Year Interest Rate Swap, Pay Fixed 2.535% Annually, Receive Variable 1.81% Semi-Annually, 3M PLN WIBOR, 11/21/22 43,000 (37) — (37)
5 Year Interest Rate Swap, Pay Fixed 2.427% Annually, Receive Variable 1.81% Semi-Annually, 3M PLN WIBOR, 10/19/22 960 — — —
(84)
Total Centrally Cleared Interest Rate Swaps 607
Credit Default Swaps, Protection Bought (0.4)%
Foreign/Europe (0.4)%
Protection Bought (Relevant Credit: Markit iTraxx Europe CDSI-S28, 5 Year Index), Pay 1.00% Quarterly, Receive upon credit default, 12/20/22 (EUR) 42,000 (1,383) (1,168) (215)
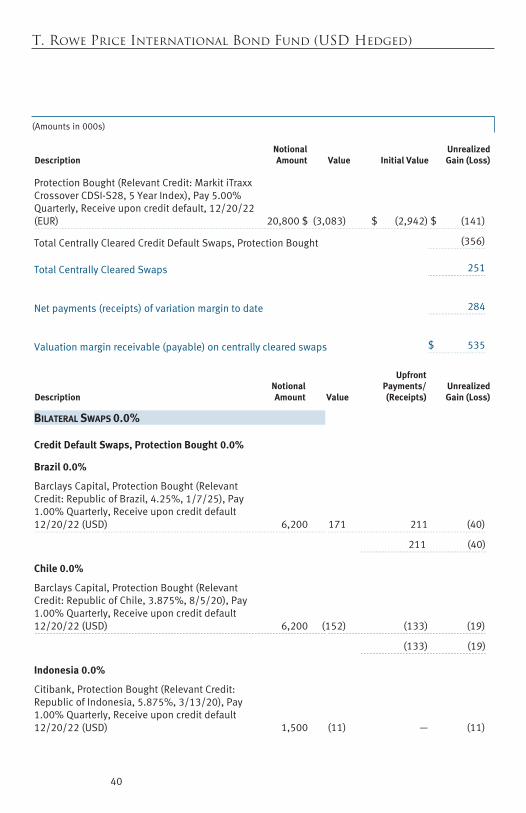
40
T. Rowe Price International Bond Fund (USD Hedged)
(Amountsin000s)
Description NotionalAmount Value Initial Value
UnrealizedGain (Loss)
Protection Bought (Relevant Credit: Markit iTraxx Crossover CDSI-S28, 5 Year Index), Pay 5.00% Quarterly, Receive upon credit default, 12/20/22 (EUR) 20,800 $ (3,083) $ (2,942) $ (141)
Total Centrally Cleared Credit Default Swaps, Protection Bought (356)
Total Centrally Cleared Swaps 251
Net payments (receipts) of variation margin to date 284
Valuation margin receivable (payable) on centrally cleared swaps $ 535
Description NotionalAmount Value
UpfrontPayments/(Receipts)
UnrealizedGain (Loss)
BILATERAL SWAPS 0.0%
Credit Default Swaps, Protection Bought 0.0%
Brazil 0.0%
Barclays Capital, Protection Bought (Relevant Credit: Republic of Brazil, 4.25%, 1/7/25), Pay 1.00% Quarterly, Receive upon credit default 12/20/22 (USD) 6,200 171 211 (40)
211 (40)
Chile 0.0%
Barclays Capital, Protection Bought (Relevant Credit: Republic of Chile, 3.875%, 8/5/20), Pay 1.00% Quarterly, Receive upon credit default 12/20/22 (USD) 6,200 (152) (133) (19)
(133) (19)
Indonesia 0.0%
Citibank, Protection Bought (Relevant Credit: Republic of Indonesia, 5.875%, 3/13/20), Pay 1.00% Quarterly, Receive upon credit default 12/20/22 (USD) 1,500 (11) — (11)

41
T. Rowe Price International Bond Fund (USD Hedged)
(Amountsin000s)
Description NotionalAmount Value
UpfrontPayments/(Receipts)
UnrealizedGain (Loss)
Barclays Capital, Protection Bought (Relevant Credit: Republic of Indonesia, 5.875%, 3/13/20), Pay 1.00% Quarterly, Receive upon credit default, 12/20/22 (USD) 1,550 $ (11) $ (3) $ (8)
(3) (19)
Malaysia 0.0%
Barclays Capital, Protection Bought (Relevant Credit: Penergangan Malaysia Berhad, 1.00% 12/20/22), Pay 1.00% Quarterly, Receive upon credit default, 12/20/22 (USD) 3,100 (61) (46) (15)
Barclays Capital, Protection Bought (Relevant Credit: Penergangan Malaysia Berhad, 1.00% 12/20/22), Pay 1.00% Quarterly, Receive upon credit default, 12/20/22 (USD) 3,100 (60) (53) (7)
(99) (22)
Mexico 0.0%
Barclays Capital, Protection Bought (Relevant Credit: United Mexican States, 4.15%, 3/28/27) Pay 1.00% Quarterly, Receive upon credit default, 12/20/22 (USD) 6,200 15 30 (15)
30 (15)
Peru 0.0%
Barclays Capital, Protection Bought (Relevant Credit: Republic of Peru, 8.75%, 11/21/33), Pay 1.00% Quarterly, Receive upon credit default 12/20/22 (USD) 6,200 (83) (72) (11)
(72) (11)
South Africa 0.0%
Citibank, Protection Bought (Relevant Credit: Republic of South Africa, 5.50%, 3/9/20), Pay 1.00% Quarterly, Receive upon credit default 12/20/22 (USD) 6,200 159 233 (74)
233 (74)
42
T. Rowe Price International Bond Fund (USD Hedged)
(Amountsin000s)
Description NotionalAmount Value
UpfrontPayments/(Receipts)
UnrealizedGain (Loss)
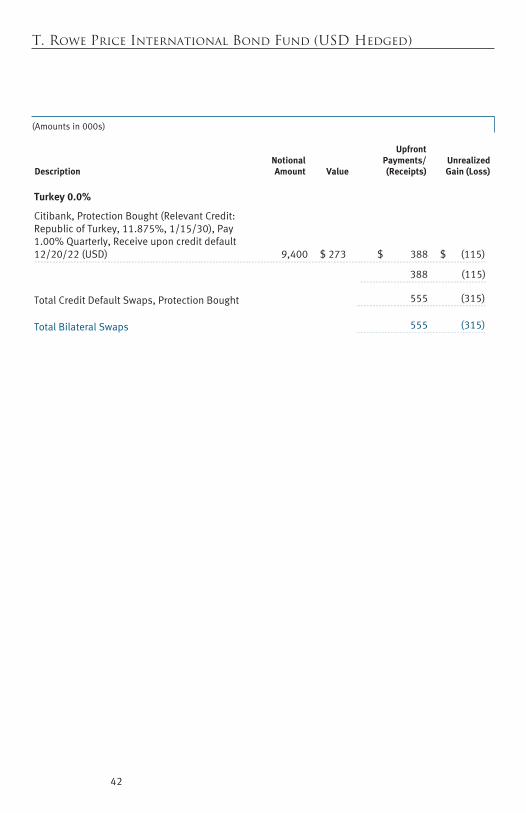
Turkey 0.0%
Citibank, Protection Bought (Relevant Credit: Republic of Turkey, 11.875%, 1/15/30), Pay 1.00% Quarterly, Receive upon credit default 12/20/22 (USD) 9,400 $ 273 $ 388 $ (115)
388 (115)
Total Credit Default Swaps, Protection Bought 555 (315)
Total Bilateral Swaps 555 (315)

T. Rowe Price International Bond Fund (USD Hedged)
Forward Currency Exchange Contracts
43
(Amounts in 000s)
Counterparty Settlement Receive Deliver Unrealized Gain (Loss)
Bank of America Merrill Lynch 1/12/18 RON 40,983 USD 10,465 $ 76
Bank of America Merrill Lynch 1/12/18 RUB 385,007 USD 6,567 112
Bank of America Merrill Lynch 1/12/18 USD 6,085 PLN 21,869 (197)
Bank of America Merrill Lynch 1/12/18 USD 5,007 RON 19,723 (65)
Bank of America Merrill Lynch 1/12/18 USD 3,169 RUB 189,000 (110)
Bank of America Merrill Lynch 1/19/18 RSD 12,750 USD 127 2
Bank of America Merrill Lynch 1/19/18 USD 5,410 ILS 18,975 (46)
Bank of America Merrill Lynch 1/19/18 USD 9,102 MXN 173,830 287
Bank of America Merrill Lynch 1/19/18 USD 78 RSD 7,971 (3)
Bank of America Merrill Lynch 1/19/18 USD 14,272 SEK 119,769 (342)
Bank of America Merrill Lynch 1/23/18 USD 12,232 CZK 264,756 (215)
Bank of America Merrill Lynch 1/25/18 USD 11,863 AUD 15,693 (381)
Bank of America Merrill Lynch 1/26/18 EUR 11,499 USD 13,626 189
Bank of America Merrill Lynch 1/26/18 GBP 121 USD 158 5
Bank of America Merrill Lynch 1/26/18 USD 362 CAD 441 11
Bank of America Merrill Lynch 1/26/18 USD 8,764 CAD 11,179 (133)
Bank of America Merrill Lynch 1/26/18 USD 6,164 DKK 38,695 (81)
Bank of America Merrill Lynch 1/26/18 USD 47,469 EUR 40,078 (682)
Bank of America Merrill Lynch 1/26/18 USD 13,893 GBP 10,490 (280)
Bank of America Merrill Lynch 1/26/18 USD 21,676 JPY 2,421,651 162
Bank of America Merrill Lynch 2/9/18 USD 21,241 ZAR 296,941 (2,625)

T. Rowe Price International Bond Fund (USD Hedged)
Forward Currency Exchange Contracts
44
(Amounts in 000s)
Forward Currency Exchange Contracts (continued)
Counterparty Settlement Receive Deliver Unrealized Gain (Loss)
Bank of America Merrill Lynch 2/15/18 USD 122,355 EUR 103,123 (1,683)
Bank of America Merrill Lynch 2/15/18 USD 15,361 GBP 11,591 (310)
Bank of America Merrill Lynch 2/15/18 USD 85,141 JPY 9,502,465 637
Bank of America Merrill Lynch 2/16/18 USD 11,662 AUD 15,429 (376)
Bank of America Merrill Lynch 2/16/18 USD 5,784 ILS 20,260 (48)
Bank of America Merrill Lynch 2/23/18 USD 1,155 NOK 9,483 (2)
Bank of America Merrill Lynch 3/15/18 USD 118,540 EUR 99,833 (1,750)
Bank of America Merrill Lynch 3/15/18 USD 13,875 GBP 10,455 (274)
Bank of America Merrill Lynch 12/18/18 CZK 395,630 USD 18,658 292
Bank of America Merrill Lynch 12/18/18 USD 18,543 EUR 15,327 (287)
Barclays Bank 1/9/18 MYR 1,050 USD 250 9 Barclays Bank 1/9/18 USD 6,316 MYR 26,455 (219) Barclays Bank 1/12/18 RON 4,514 USD 1,140 21 Barclays Bank 1/12/18 USD 326 PLN 1,192 (16) Barclays Bank 1/19/18 SEK 52,255 USD 6,269 107 Barclays Bank 1/26/18 EUR 472 USD 562 5 Barclays Bank 1/26/18 GBP 1,142 USD 1,506 36 Barclays Bank 1/26/18 USD 23,755 EUR 20,031 (311) Barclays Bank 2/2/18 USD 2,336 IDR 31,808,729 (2) Barclays Bank 2/2/18 USD 3,139 TWD 94,188 (32) Barclays Bank 2/9/18 ZAR 87,601 USD 6,218 822 Barclays Bank 2/15/18 USD 6,514 EUR 5,471 (67) Barclays Bank 2/15/18 USD 14,591 JPY 1,633,345 66 Barclays Bank 3/2/18 USD 15,976 BRL 52,652 204 Barclays Bank 4/6/18 USD 750 CLP 485,074 (38) Barclays Bank 5/11/18 USD 750 CLP 485,074 (37) BNP Paribas 1/9/18 MYR 37,044 USD 8,886 265 BNP Paribas 1/12/18 CLP 6,008,339 USD 9,170 593 BNP Paribas 1/23/18 EUR 5,890 USD 6,971 104 BNP Paribas 1/26/18 EUR 257 USD 300 9 BNP Paribas 1/26/18 GBP 272 USD 369 (1) BNP Paribas 1/26/18 USD 184 GBP 138 (3) BNP Paribas 1/26/18 USD 209 JPY 23,657 (1) BNP Paribas 2/2/18 USD 3,774 IDR 51,755,375 (30)

T. Rowe Price International Bond Fund (USD Hedged)
Forward Currency Exchange Contracts
45
(Amounts in 000s)
Forward Currency Exchange Contracts (continued)
Counterparty Settlement Receive Deliver Unrealized Gain (Loss)
BNP Paribas 2/9/18 ZAR 78,776 USD 5,688 644 BNP Paribas 2/15/18 EUR 1,590 USD 1,905 7 BNP Paribas 2/15/18 USD 796 EUR 679 (21) BNP Paribas 2/23/18 USD 371 CHF 365 (5) BNP Paribas 4/6/18 USD 3,056 CLP 2,002,740 (196) BNP Paribas 5/11/18 USD 6,105 CLP 4,005,599 (395) CIBC World Markets 1/19/18 MXN 120,210 USD 6,361 (265) CIBC World Markets 1/25/18 AUD 7,933 USD 6,060 130 CIBC World Markets 1/25/18 USD 3,140 AUD 4,179 (120) CIBC World Markets 1/26/18 EUR 11,093 USD 12,935 393 CIBC World Markets 1/26/18 USD 37 EUR 31 — CIBC World Markets 2/15/18 USD 18,903 JPY 2,113,353 110 Citibank 1/12/18 CLP 2,002,763 USD 3,053 201 Citibank 1/12/18 USD 401 CLP 251,822 (8) Citibank 1/12/18 USD 3,241 RUB 189,147 (40) Citibank 1/19/18 RSD 310,550 USD 3,079 72 Citibank 1/19/18 USD 6,237 SGD 8,478 (104) Citibank 1/26/18 CAD 15,425 USD 12,172 104 Citibank 1/26/18 EUR 3,996 USD 4,762 39 Citibank 1/26/18 GBP 391 USD 522 6 Citibank 1/26/18 GBP 12 USD 16 — Citibank 1/26/18 USD 118 EUR 100 (2) Citibank 1/26/18 USD 134 GBP 99 — Citibank 2/15/18 USD 362 GBP 276 (11) Citibank 2/15/18 USD 6,153 JPY 685,141 60 Citibank 3/9/18 USD 841 TRY 3,419 (43) Citibank 3/15/18 JPY 890,023 USD 7,900 26 Citibank 5/11/18 USD 3,050 CLP 2,002,763 (200) Deutsche Bank 1/12/18 USD 646 CLP 403,728 (10) Deutsche Bank 1/12/18 USD 276 RON 1,057 4 Deutsche Bank 1/12/18 USD 6,323 RON 24,718 (34) Deutsche Bank 1/19/18 SEK 103,116 USD 12,352 231 Deutsche Bank 1/23/18 CZK 5,386 USD 250 3 Deutsche Bank 1/26/18 EUR 54 USD 65 — Deutsche Bank 1/26/18 GBP 8 USD 11 — Deutsche Bank 1/26/18 USD 70 GBP 52 1 Deutsche Bank 1/26/18 USD 1,825 GBP 1,369 (24) Deutsche Bank 2/2/18 INR 768,670 USD 11,864 139 Deutsche Bank 3/2/18 BRL 19,617 USD 6,051 (174) Deutsche Bank 3/9/18 TRY 3,419 USD 846 39 Deutsche Bank 3/15/18 USD 11,948 EUR 10,066 (181) Goldman Sachs 1/26/18 EUR 68,690 USD 81,537 990 Goldman Sachs 1/26/18 GBP 2,009 USD 2,682 32

T. Rowe Price International Bond Fund (USD Hedged)
Forward Currency Exchange Contracts
46
(Amounts in 000s)
Forward Currency Exchange Contracts (continued)
Counterparty Settlement Receive Deliver Unrealized Gain (Loss)
Goldman Sachs 1/26/18 USD 9,616 EUR 8,059 (66) Goldman Sachs 2/9/18 USD 6,319 KRW 7,046,429 (267) Goldman Sachs 2/15/18 USD 6,051 JPY 681,441 (9) HSBC Bank 1/9/18 MYR 13,582 USD 3,223 132 HSBC Bank 1/9/18 USD 8,662 MYR 35,992 (230) HSBC Bank 1/12/18 CLP 2,002,760 USD 3,066 189 HSBC Bank 1/12/18 PLN 280 USD 78 3 HSBC Bank 1/12/18 USD 6,909 CLP 4,382,644 (213) HSBC Bank 1/19/18 MXN 116,702 USD 6,222 (304) HSBC Bank 1/19/18 USD 5,379 ILS 18,815 (31) HSBC Bank 1/19/18 USD 3,152 MXN 61,043 56 HSBC Bank 1/19/18 USD 5,899 SGD 7,994 (80) HSBC Bank 1/23/18 CNY 20,064 USD 3,010 68 HSBC Bank 1/26/18 EUR 950 USD 1,140 1 HSBC Bank 1/26/18 GBP 2,237 USD 2,987 35 HSBC Bank 1/26/18 USD 19,291 EUR 16,460 (485) HSBC Bank 1/26/18 USD 1,339 JPY 151,726 (9) HSBC Bank 2/2/18 USD 24,569 INR 1,611,334 (594) HSBC Bank 2/2/18 USD 2,809 THB 92,136 (21) HSBC Bank 2/9/18 USD 17,771 SGD 24,097 (256) HSBC Bank 2/15/18 GBP 385 USD 510 11 HSBC Bank 2/15/18 JPY 311,485 USD 2,781 (11) HSBC Bank 2/15/18 USD 8,939 EUR 7,631 (240) HSBC Bank 2/15/18 USD 876 GBP 649 (1) HSBC Bank 2/16/18 USD 1,791 ILS 6,269 (14) HSBC Bank 2/23/18 CNY 811 USD 121 3 HSBC Bank 2/23/18 USD 1,159 NOK 9,425 9 HSBC Bank 3/15/18 USD 3,206 EUR 2,702 (50) HSBC Bank 4/6/18 USD 3,063 CLP 2,002,760 (189) JPMorgan Chase 1/23/18 CZK 130,019 USD 6,031 82 Morgan Stanley 1/9/18 MYR 25,405 USD 6,016 260 Morgan Stanley 1/19/18 USD 840 SEK 7,012 (15) Morgan Stanley 2/15/18 USD 19,779 EUR 16,692 (299) Morgan Stanley 3/15/18 USD 19,811 EUR 16,692 (301) Royal Bank of Canada 1/26/18 USD 6,136 CAD 7,899 (151) Royal Bank of Canada 2/16/18 USD 3,061 AUD 4,078 (121) Royal Bank of Canada 3/15/18 USD 691 GBP 520 (13) Standard Chartered 1/9/18 USD 3,505 MYR 14,634 (110) Standard Chartered 1/12/18 USD 23,689 CLP 14,989,409 (668) Standard Chartered 1/12/18 USD 116 RUB 6,860 (3) Standard Chartered 1/19/18 SEK 47 USD 6 — Standard Chartered 1/19/18 USD 124 MXN 2,251 10 Standard Chartered 1/19/18 USD 572 SEK 4,523 20
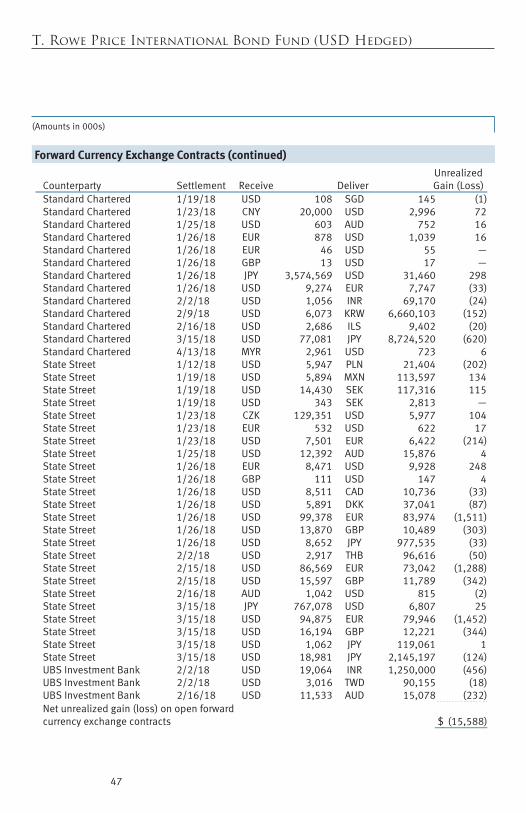
T. Rowe Price International Bond Fund (USD Hedged)
Forward Currency Exchange Contracts
47
(Amounts in 000s)
Forward Currency Exchange Contracts (continued)
Counterparty Settlement Receive Deliver Unrealized Gain (Loss)
Standard Chartered 1/19/18 USD 108 SGD 145 (1) Standard Chartered 1/23/18 CNY 20,000 USD 2,996 72 Standard Chartered 1/25/18 USD 603 AUD 752 16 Standard Chartered 1/26/18 EUR 878 USD 1,039 16 Standard Chartered 1/26/18 EUR 46 USD 55 — Standard Chartered 1/26/18 GBP 13 USD 17 — Standard Chartered 1/26/18 JPY 3,574,569 USD 31,460 298 Standard Chartered 1/26/18 USD 9,274 EUR 7,747 (33) Standard Chartered 2/2/18 USD 1,056 INR 69,170 (24) Standard Chartered 2/9/18 USD 6,073 KRW 6,660,103 (152) Standard Chartered 2/16/18 USD 2,686 ILS 9,402 (20) Standard Chartered 3/15/18 USD 77,081 JPY 8,724,520 (620) Standard Chartered 4/13/18 MYR 2,961 USD 723 6 State Street 1/12/18 USD 5,947 PLN 21,404 (202) State Street 1/19/18 USD 5,894 MXN 113,597 134 State Street 1/19/18 USD 14,430 SEK 117,316 115 State Street 1/19/18 USD 343 SEK 2,813 — State Street 1/23/18 CZK 129,351 USD 5,977 104 State Street 1/23/18 EUR 532 USD 622 17 State Street 1/23/18 USD 7,501 EUR 6,422 (214) State Street 1/25/18 USD 12,392 AUD 15,876 4 State Street 1/26/18 EUR 8,471 USD 9,928 248 State Street 1/26/18 GBP 111 USD 147 4 State Street 1/26/18 USD 8,511 CAD 10,736 (33) State Street 1/26/18 USD 5,891 DKK 37,041 (87) State Street 1/26/18 USD 99,378 EUR 83,974 (1,511) State Street 1/26/18 USD 13,870 GBP 10,489 (303) State Street 1/26/18 USD 8,652 JPY 977,535 (33) State Street 2/2/18 USD 2,917 THB 96,616 (50) State Street 2/15/18 USD 86,569 EUR 73,042 (1,288) State Street 2/15/18 USD 15,597 GBP 11,789 (342) State Street 2/16/18 AUD 1,042 USD 815 (2) State Street 3/15/18 JPY 767,078 USD 6,807 25 State Street 3/15/18 USD 94,875 EUR 79,946 (1,452) State Street 3/15/18 USD 16,194 GBP 12,221 (344) State Street 3/15/18 USD 1,062 JPY 119,061 1 State Street 3/15/18 USD 18,981 JPY 2,145,197 (124) UBS Investment Bank 2/2/18 USD 19,064 INR 1,250,000 (456) UBS Investment Bank 2/2/18 USD 3,016 TWD 90,155 (18) UBS Investment Bank 2/16/18 USD 11,533 AUD 15,078 (232)
Net unrealized gain (loss) on open forward currency exchange contracts $ (15,588)
T. Rowe Price International Bond Fund (USD Hedged)
48
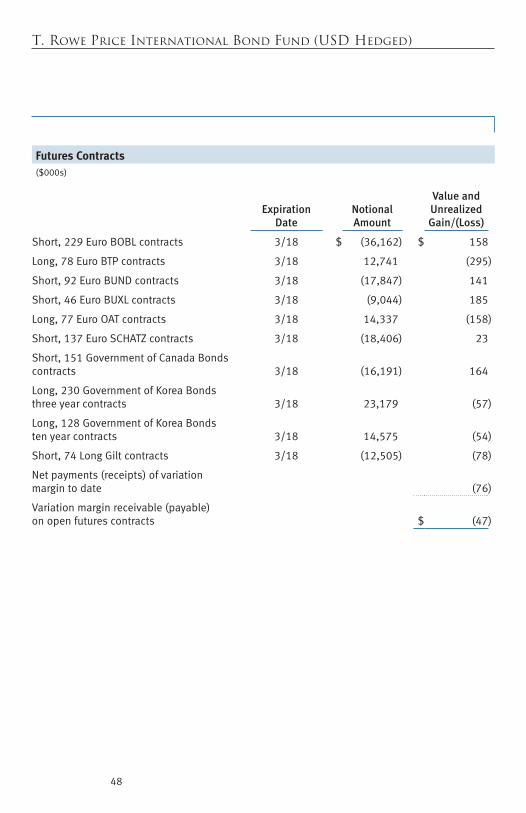
Futures Contracts($000s)
Expiration Date
Notional Amount
Value and Unrealized Gain/(Loss)
Short,229EuroBOBLcontracts 3/18 $ (36,162) $ 158
Long,78EuroBTPcontracts 3/18 12,741 (295)
Short,92EuroBUNDcontracts 3/18 (17,847) 141
Short,46EuroBUXLcontracts 3/18 (9,044) 185
Long,77EuroOATcontracts 3/18 14,337 (158)
Short,137EuroSCHATZcontracts 3/18 (18,406) 23
Short,151GovernmentofCanadaBondscontracts 3/18 (16,191) 164
Long,230GovernmentofKoreaBondsthreeyearcontracts 3/18 23,179 (57)
Long,128GovernmentofKoreaBondstenyearcontracts 3/18 14,575 (54)
Short,74LongGiltcontracts 3/18 (12,505) (78)
Netpayments(receipts)ofvariationmargintodate (76)
Variationmarginreceivable(payable)onopenfuturescontracts $ (47)

T. Rowe Price International Bond Fund (USD Hedged)
49
The accompanying notes are an integral part of these financial statements.
Affiliated Companies
($000s)
The fund may invest in certain securities that are considered affiliated companies. As defined by the 1940 Act, an affiliated company is one in which the fund owns 5% or more of the outstanding voting securities, or a company that is under common ownership or control. The following securities were considered affiliated companies for all or some portion of the period ended December 31, 2017. Net realized gain (loss), investment income, change in net unrealized gain/loss, and purchase and sales cost reflect all activity for the period then ended.
Affiliate
Net Realized Gain(Loss)
Change in NetUnrealizedGain/Loss
InvestmentIncome
T. Rowe Price Government Reserve Fund $ — $ — $ 212 Totals $ —# $ — $ 212+ Supplementary Investment Schedule Affiliate
Value9/12/17
PurchaseCost
SalesCost
Value12/31/17
T. Rowe Price Government Reserve Fund $ — ¤ ¤ $ 63,297 $ 63,297^
# Capital gain/loss distributions from mutual funds represented $0 of the net realized gain (loss).
+ Investment income comprised $212 of dividend income and $0 of interest income. ¤ Purchase and sale information not shown for cash management funds. ^ The cost basis of investments in affiliated companies was $63,297.

50
T. Rowe Price International Bond Fund (USD Hedged) December 31, 2017
($000s, except shares and per share amounts)
Statement of Assets and Liabilities
Assets
Investments in securities, at value (cost $1,214,935) $ 1,235,594
Interest receivable 13,741
Unrealized gain on forward currency exchange contracts 9,184
Foreign currency (cost $2,503) 2,543
Bilateral swap premiums paid 862
Receivable for investment securities sold 667
Variation margin receivable on centrally cleared swaps 535
Due from affiliates 121
Receivable for shares sold 64
Other assets 1,233
Total assets 1,264,544
Liabilities
Unrealized loss on forward currency exchange contracts 24,772
Payable for investment securities purchased 864
Investment management fees payable 511
Unrealized loss on bilateral swaps 315
Bilateral swap premiums received 307
Variation margin payable on futures contracts 47
Due to affiliates 30
Payable for shares redeemed 5
Other liabilities 1,288
Total liabilities 28,139
NET ASSETS $ 1,236,405 Net Assets Consist of:
Undistributed net investment income $ 390
Accumulated undistributed net realized loss (3,030)
Net unrealized gain 5,248
Paid-in capital applicable to 122,956,181 shares of $0.01 par value capital stock outstanding; 18,000,000 shares of the Corporation authorized 1,233,797
NET ASSETS $ 1,236,405
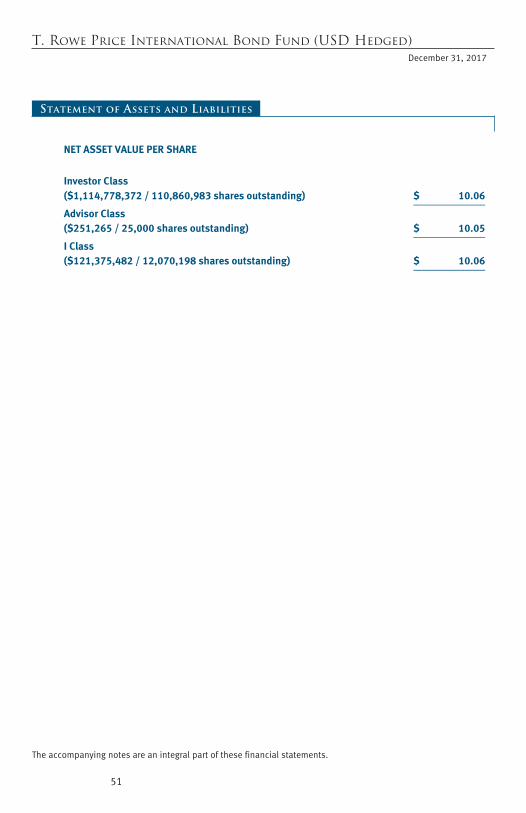
51
T. Rowe Price International Bond Fund (USD Hedged) December 31, 2017
The accompanying notes are an integral part of these financial statements.
Statement of Assets and Liabilities
NET ASSET VALUE PER SHARE
Investor Class ($1,114,778,372 / 110,860,983 shares outstanding) $ 10.06
Advisor Class ($251,265 / 25,000 shares outstanding) $ 10.05
I Class ($121,375,482 / 12,070,198 shares outstanding) $ 10.06
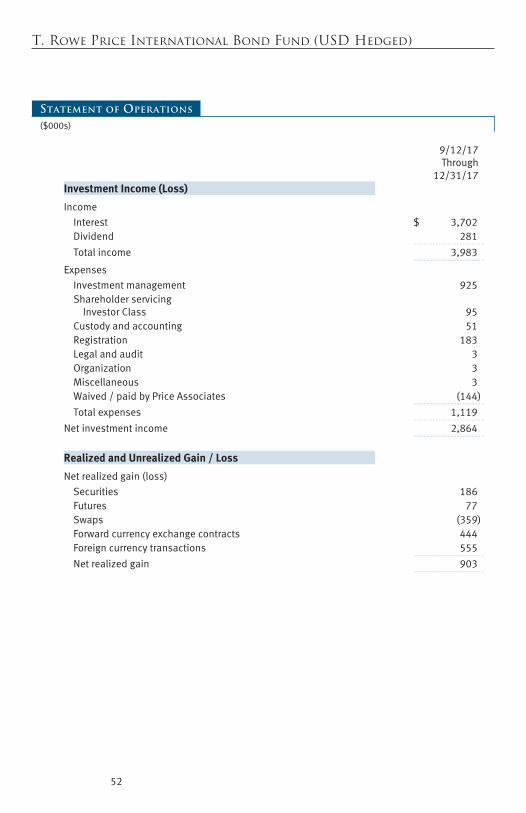
T. Rowe Price International Bond Fund (USD Hedged)
($000s)
Statement of Operations
52
9/12/17Through
12/31/17Investment Income (Loss)
Income Interest $ 3,702 Dividend 281
Total income 3,983
Expenses Investment management 925 Shareholder servicing
Investor Class 95 Custody and accounting 51 Registration 183 Legal and audit 3 Organization 3 Miscellaneous 3 Waived / paid by Price Associates (144)
Total expenses 1,119
Net investment income 2,864
Realized and Unrealized Gain / Loss
Net realized gain (loss) Securities 186 Futures 77 Swaps (359) Forward currency exchange contracts 444 Foreign currency transactions 555
Net realized gain 903

T. Rowe Price International Bond Fund (USD Hedged)
($000s)
Statement of Operations
53
The accompanying notes are an integral part of these financial statements.
9/12/17 Through
12/31/17Change in net unrealized gain / loss
Securities 20,659 Futures 29 Swaps (64) Forward currency exchange contracts (15,588) Other assets and liabilities denominated in foreign currencies 212
Change in net unrealized gain / loss 5,248
Net realized and unrealized gain / loss 6,151
INCREASE IN NET ASSETS FROM OPERATIONS $ 9,015
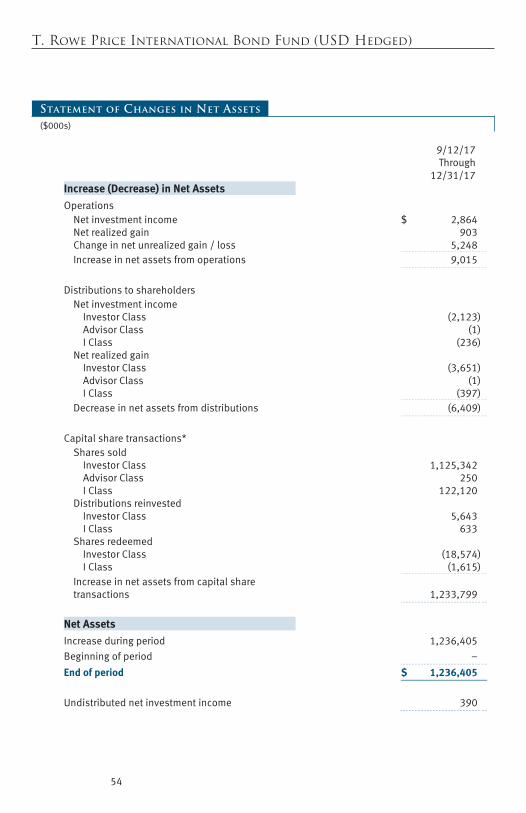
T. Rowe Price International Bond Fund (USD Hedged)
($000s)
54
Statement of Changes in Net Assets
9/12/17 Through
12/31/17Increase (Decrease) in Net Assets
Operations Net investment income $ 2,864 Net realized gain 903 Change in net unrealized gain / loss 5,248 Increase in net assets from operations 9,015
Distributions to shareholders
Net investment income Investor Class (2,123) Advisor Class (1) I Class (236)
Net realized gain Investor Class (3,651) Advisor Class (1) I Class (397)
Decrease in net assets from distributions (6,409)
Capital share transactions*
Shares sold Investor Class 1,125,342 Advisor Class 250 I Class 122,120
Distributions reinvested Investor Class 5,643 I Class 633
Shares redeemed Investor Class (18,574) I Class (1,615)
Increase in net assets from capital share transactions 1,233,799
Net Assets
Increase during period 1,236,405 Beginning of period –
End of period $ 1,236,405
Undistributed net investment income 390
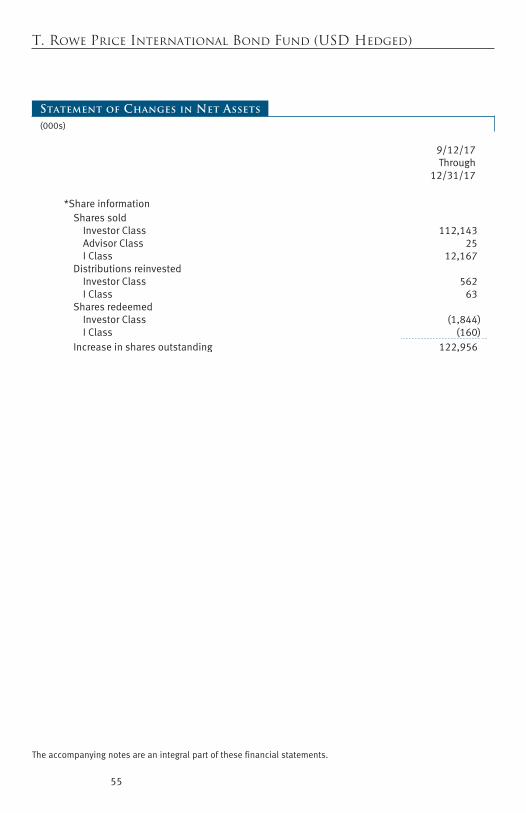
T. Rowe Price International Bond Fund (USD Hedged)
55
The accompanying notes are an integral part of these financial statements.
Statement of Changes in Net Assets
(000s)
9/12/17 Through
12/31/17 *Share information
Shares sold Investor Class 112,143 Advisor Class 25 I Class 12,167
Distributions reinvested Investor Class 562 I Class 63
Shares redeemed Investor Class (1,844) I Class (160)
Increase in shares outstanding 122,956
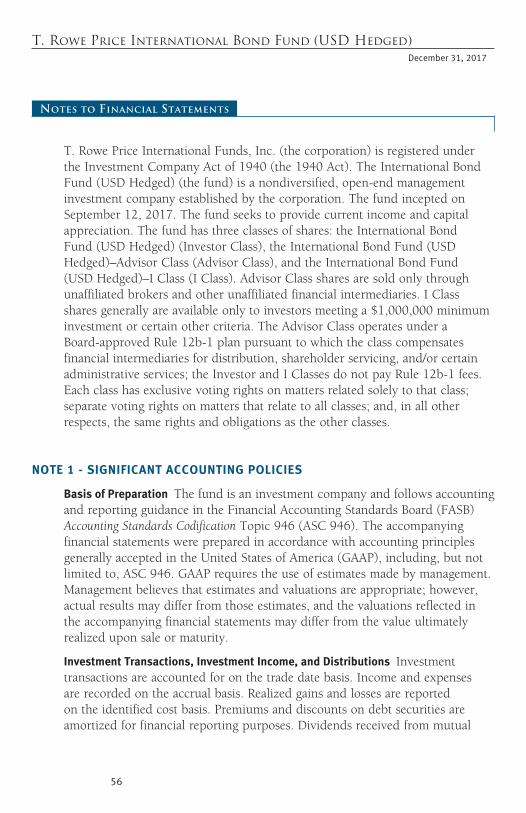
56
T. Rowe Price International Bond Fund (USD Hedged) December 31, 2017
Notes to Financial Statements
T. Rowe Price International Funds, Inc. (the corporation) is registered under the Investment Company Act of 1940 (the 1940 Act). The International Bond Fund (USD Hedged) (the fund) is a nondiversified, open-end management investment company established by the corporation. The fund incepted on September 12, 2017. The fund seeks to provide current income and capital appreciation. The fund has three classes of shares: the International Bond Fund (USD Hedged) (Investor Class), the International Bond Fund (USD Hedged)–Advisor Class (Advisor Class), and the International Bond Fund (USD Hedged)–I Class (I Class). Advisor Class shares are sold only through unaffiliated brokers and other unaffiliated financial intermediaries. I Class shares generally are available only to investors meeting a $1,000,000 minimum investment or certain other criteria. The Advisor Class operates under a Board-approved Rule 12b-1 plan pursuant to which the class compensates financial intermediaries for distribution, shareholder servicing, and/or certain administrative services; the Investor and I Classes do not pay Rule 12b-1 fees. Each class has exclusive voting rights on matters related solely to that class; separate voting rights on matters that relate to all classes; and, in all other respects, the same rights and obligations as the other classes.
NOTE 1 - SIGNIFICANT ACCOUNTING POLICIES
Basis of Preparation The fund is an investment company and follows accounting and reporting guidance in the Financial Accounting Standards Board (FASB) Accounting Standards Codification Topic 946 (ASC 946). The accompanying financial statements were prepared in accordance with accounting principles generally accepted in the United States of America (GAAP), including, but not limited to, ASC 946. GAAP requires the use of estimates made by management. Management believes that estimates and valuations are appropriate; however, actual results may differ from those estimates, and the valuations reflected in the accompanying financial statements may differ from the value ultimately realized upon sale or maturity.
Investment Transactions, Investment Income, and Distributions Investment transactions are accounted for on the trade date basis. Income and expenses are recorded on the accrual basis. Realized gains and losses are reported on the identified cost basis. Premiums and discounts on debt securities are amortized for financial reporting purposes. Dividends received from mutual

57
T. Rowe Price International Bond Fund (USD Hedged)
fund investments are reflected as dividend income; capital gain distributions are reflected as realized gain/loss. Dividend income and capital gain distributions are recorded on the ex-dividend date. Income tax-related interest and penalties, if incurred, are recorded as income tax expense. Income distributions are declared by each class daily and paid monthly. Distributions to shareholders are recorded on the ex-dividend date. A capital gain distribution may also be declared and paid by the fund annually.
Currency Translation Assets, including investments, and liabilities denominated in foreign currencies are translated into U.S. dollar values each day at the prevailing exchange rate, using the mean of the bid and asked prices of such currencies against U.S. dollars as quoted by a major bank. Purchases and sales of securities, income, and expenses are translated into U.S. dollars at the prevailing exchange rate on the respective date of such transaction. The portion of the results of operations attributable to changes in foreign exchange rates on investments is not bifurcated from the portion attributable to changes in market prices. The effect of changes in foreign currency exchange rates on realized and unrealized security gains and losses is reflected as a component of security gains and losses.
Class Accounting Shareholder servicing, prospectus, and shareholder report expenses incurred by each class are charged directly to the class to which they relate. Expenses common to all classes and investment income are allocated to the classes based upon the relative daily net assets of each class’s settled shares; realized and unrealized gains and losses are allocated based upon the relative daily net assets of each class’s outstanding shares. To the extent any expenses are waived or reimbursed in accordance with an expense limitation (see Note 6), the waiver or reimbursement is charged to the applicable class or allocated across the classes in the same manner as the related expense. The Advisor Class pays Rule 12b-1 fees, in an amount not exceeding 0.25% of the class’s average daily net assets; during the period ended December 31, 2017, the Advisor Class incurred less than $1,000 in these fees.
Redemption Fees A 2% fee is assessed on redemptions of fund shares held for 90 days or less to deter short-term trading and to protect the interests of long-term shareholders. Redemption fees are withheld from proceeds that shareholders receive from the sale or exchange of fund shares. The fees are paid to the fund and are recorded as an increase to paid-in capital. The fees may cause the redemption price per share to differ from the net asset value per share.
58
T. Rowe Price International Bond Fund (USD Hedged)
In-Kind Subscriptions Under certain circumstances, and when considered to be in the best interest of all shareholders, the fund may accept portfolio securities rather than cash as payment for the purchase of fund shares (in-kind subscription). For financial reporting and tax purposes, the cost basis of contributed securities is equal to the market value of the securities on the date of contribution. In-kind subscriptions result in no gain or loss and no tax consequences for the fund. During the period ended December 31, 2017, the fund accepted $874,948,000 of in-kind subscriptions, all of which were from other T. Rowe Price funds.
New Accounting Guidance In March 2017, the FASB issued amended guidance to shorten the amortization period for certain callable debt securities, held at a premium. The guidance is effective for fiscal years and interim periods beginning after December 15, 2018. Adoption will have no effect on the fund’s net assets or results of operations.
On August 1, 2017, the fund implemented amendments to Regulation S-X, issued by the Securities and Exchange Commission, which require standardized, enhanced disclosures, particularly related to derivatives, in investment company financial statements. Adoption had no effect on the fund’s net assets or results of operations.
Indemnification In the normal course of business, the fund may provide indemnification in connection with its officers and directors, service providers, and/or private company investments. The fund’s maximum exposure under these arrangements is unknown; however, the risk of material loss is currently considered to be remote.
NOTE 2 - VALUATION
The fund’s financial instruments are valued and each class’s net asset value (NAV) per share is computed at the close of the New York Stock Exchange (NYSE), normally 4 p.m. ET, each day the NYSE is open for business. However, the NAV per share may be calculated at a time other than the normal close of the NYSE if trading on the NYSE is restricted, if the NYSE closes earlier, or as may be permitted by the SEC.
59
T. Rowe Price International Bond Fund (USD Hedged)
Fair Value The fund’s financial instruments are reported at fair value, which GAAP defines as the price that would be received to sell an asset or paid to transfer a liability in an orderly transaction between market participants at the measurement date. The T. Rowe Price Valuation Committee (the Valuation Committee) is an internal committee that has been delegated certain responsibilities by the fund’s Board of Directors (the Board) to ensure that financial instruments are appropriately priced at fair value in accordance with GAAP and the 1940 Act. Subject to oversight by the Board, the Valuation Committee develops and oversees pricing-related policies and procedures and approves all fair value determinations. Specifically, the Valuation Committee establishes procedures to value securities; determines pricing techniques, sources, and persons eligible to effect fair value pricing actions; oversees the selection, services, and performance of pricing vendors; oversees valuation-related business continuity practices; and provides guidance on internal controls and valuation-related matters. The Valuation Committee reports to the Board and has representation from legal, portfolio management and trading, operations, risk management, and the fund’s treasurer.
Various valuation techniques and inputs are used to determine the fair value of financial instruments. GAAP establishes the following fair value hierarchy that categorizes the inputs used to measure fair value:
Level 1 – quoted prices (unadjusted) in active markets for identical financial instruments that the fund can access at the reporting date
Level 2 – inputs other than Level 1 quoted prices that are observable, either directly or indirectly (including, but not limited to, quoted prices for similar financial instruments in active markets, quoted prices for identical or similar financial instruments in inactive markets, interest rates and yield curves, implied volatilities, and credit spreads)
Level 3 – unobservable inputs
Observable inputs are developed using market data, such as publicly available information about actual events or transactions, and reflect the assumptions that market participants would use to price the financial instrument. Unobservable inputs are those for which market data are not available and are developed using the best information available about the assumptions that market participants
60
T. Rowe Price International Bond Fund (USD Hedged)
would use to price the financial instrument. GAAP requires valuation techniques to maximize the use of relevant observable inputs and minimize the use of unobservable inputs. When multiple inputs are used to derive fair value, the financial instrument is assigned to the level within the fair value hierarchy based on the lowest-level input that is significant to the fair value of the financial instrument. Input levels are not necessarily an indication of the risk or liquidity associated with financial instruments at that level but rather the degree of judgment used in determining those values.
Valuation Techniques Debt securities generally are traded in the over-the-counter (OTC) market. Securities with remaining maturities of one year or more at the time of acquisition are valued at prices furnished by dealers who make markets in such securities or by an independent pricing service, which considers the yield or price of bonds of comparable quality, coupon, maturity, and type, as well as prices quoted by dealers who make markets in such securities. Securities with remaining maturities of less than one year at the time of acquisition generally use amortized cost in local currency to approximate fair value. However, if amortized cost is deemed not to reflect fair value or the fund holds a significant amount of such securities with remaining maturities of more than 60 days, the securities are valued at prices furnished by dealers who make markets in such securities or by an independent pricing service. Generally, debt securities are categorized in Level 2 of the fair value hierarchy; however, to the extent the valuations include significant unobservable inputs, the securities would be categorized in Level 3.
Investments in mutual funds are valued at the mutual fund’s closing NAV per share on the day of valuation and are categorized in Level 1 of the fair value hierarchy. Listed options, and OTC options with a listed equivalent, are valued at the mean of the closing bid and asked prices and generally are categorized in Level 2 of the fair value hierarchy. Financial futures contracts are valued at closing settlement prices and are categorized in Level 1 of the fair value hierarchy. Forward currency exchange contracts are valued using the prevailing forward exchange rate and are categorized in Level 2 of the fair value hierarchy. Swaps are valued at prices furnished by an independent pricing service or independent swap dealers and generally are categorized in Level 2 of the fair value hierarchy; however, if unobservable inputs are significant to the valuation, the swap would be categorized in Level 3. Assets and liabilities other than financial instruments, including short-term receivables and payables, are carried at cost, or estimated realizable value, if less, which approximates fair value.

61
T. Rowe Price International Bond Fund (USD Hedged)
Thinly traded financial instruments and those for which the above valuation procedures are inappropriate or are deemed not to reflect fair value are stated at fair value as determined in good faith by the Valuation Committee. The objective of any fair value pricing determination is to arrive at a price that could reasonably be expected from a current sale. Financial instruments fair valued by the Valuation Committee are primarily private placements, restricted securities, warrants, rights, and other securities that are not publicly traded.
Subject to oversight by the Board, the Valuation Committee regularly makes good faith judgments to establish and adjust the fair valuations of certain securities as events occur and circumstances warrant. For instance, in determining the fair value of troubled or thinly traded debt instruments, the Valuation Committee considers a variety of factors, which may include, but are not limited to, the issuer’s business prospects, its financial standing and performance, recent investment transactions in the issuer, strategic events affecting the company, market liquidity for the issuer, and general economic conditions and events. In consultation with the investment and pricing teams, the Valuation Committee will determine an appropriate valuation technique based on available information, which may include both observable and unobservable inputs. The Valuation Committee typically will afford greatest weight to actual prices in arm’s length transactions, to the extent they represent orderly transactions between market participants, transaction information can be reliably obtained, and prices are deemed representative of fair value. However, the Valuation Committee may also consider other valuation methods such as a discount or premium from market value of a similar, freely traded security of the same issuer; discounted cash flows; yield to maturity; or some combination. Fair value determinations are reviewed on a regular basis and updated as information becomes available, including actual purchase and sale transactions of the issue. Because any fair value determination involves a significant amount of judgment, there is a degree of subjectivity inherent in such pricing decisions, and fair value prices determined by the Valuation Committee could differ from those of other market participants. Depending on the relative significance of unobservable inputs, including the valuation technique(s) used, fair valued securities may be categorized in Level 2 or 3 of the fair value hierarchy.

62
T. Rowe Price International Bond Fund (USD Hedged)
Valuation Inputs The following table summarizes the fund’s financial instruments, based on the inputs used to determine their fair values on December 31, 2017:
($000s) Level 1 Level 2 Level 3 Total Value
Quoted Prices
Significant Observable
Inputs
Significant Unobservable
Inputs
Assets
InvestmentsinSecurities,except: $ — $ 1,172,297 $ — $ 1,172,297
Short-TermInvestments 63,297 63,297
TotalSecurities 63,297 1,172,297 — 1,235,594
Swaps — 1,153 — 1,153
ForwardCurrencyExchangeContracts — 9,184 — 9,184
Total $ 63,297 $ 1,182,634 $ — $ 1,245,931
Liabilities
Swaps $ — $ 378 $ — $ 378
ForwardCurrencyExchangeContracts — 24,772 — 24,772
FuturesContracts 47 — — 47
Total $ 47 $ 25,150 $ — $ 25,197
There were no material transfers between Levels 1 and 2 during the period ended December 31, 2017.

63
T. Rowe Price International Bond Fund (USD Hedged)
NOTE 3 - DERIVATIVE INSTRUMENTS
During the period ended December 31, 2017, the fund invested in derivative instruments. As defined by GAAP, a derivative is a financial instrument whose value is derived from an underlying security price, foreign exchange rate, interest rate, index of prices or rates, or other variable; it requires little or no initial invest-ment and permits or requires net settlement. The fund invests in derivatives only if the expected risks and rewards are consistent with its investment objectives, policies, and overall risk profile, as described in its prospectus and Statement of Additional Information. The fund may use derivatives for a variety of purposes, such as seeking to hedge against declines in principal value, increase yield, invest in an asset with greater efficiency and at a lower cost than is possible through direct investment, or to adjust portfolio duration and credit exposure. The risks associated with the use of derivatives are different from, and potentially much greater than, the risks associated with investing directly in the instruments on which the derivatives are based. The fund at all times maintains sufficient cash reserves, liquid assets, or other SEC-permitted asset types to cover its settlement obligations under open derivative contracts.
The fund values its derivatives at fair value and recognizes changes in fair value currently in its results of operations. Accordingly, the fund does not follow hedge accounting, even for derivatives employed as economic hedges. Generally, the fund accounts for its derivatives on a gross basis. It does not offset the fair value of derivative liabilities against the fair value of derivative assets on its financial statements, nor does it offset the fair value of derivative instruments against the right to reclaim or obligation to return collateral.

64
T. Rowe Price International Bond Fund (USD Hedged)
The following table summarizes the fair value of the fund’s derivative instruments held as of December 31, 2017, and the related location on the accompanying Statement of Assets and Liabilities, presented by primary underlying risk exposure:
($000s) Location on Statement of Assets and Liabilities Fair Value
Assets
Interestratederivatives Futures*,CentrallyClearedSwaps* $ 1,398
Foreignexchangederivatives Securities^,Forwards 9,208
Creditderivatives BilateralSwaps,andPremiums 618
Total $ 11,224
Liabilities
Interestratederivatives Futures*,CentrallyClearedSwaps* $ 762
Foreignexchangederivatives Forwards 24,772
Creditderivatives BilateralSwaps,andPremiums,CentrallyClearedSwaps* 734
Total $ 26,268
*Thefairvaluepresentedincludescumulativegain(loss)onopenfuturescontractsandcentrallyclearedswaps;however,thevaluereflectedontheaccompanyingStatementofAssetsandLiabilitiesisonlytheunsettledvariationmarginreceivable(payable)atthatdate.
^PurchasedoptionsarereportedassecuritiesandarereflectedintheaccompanyingPortfolioofinvestments.

65
T. Rowe Price International Bond Fund (USD Hedged)
Additionally, the amount of gains and losses on derivative instruments recognized in fund earnings during the period ended December 31, 2017, and the related location on the accompanying Statement of Operations is summarized in the following table by primary underlying risk exposure:
($000s) Location of Gain (Loss) on Statement of Operations
Securities^ Futures
Forward Currency
Exchange Contracts Swaps Total
Realized Gain (Loss)
Interestratederivatives $ — $ 77 $ — $ (1) $ 76
Foreignexchangederivatives (29) — 444 — 415
Creditderivatives — — — (358) (358)
Total $ (29) $ 77 $ 444 $ (359) $ 133
Change in Unrealized Gain / Loss
Interestratederivatives $ — $ 29 $ — $ 607 $ 636
Foreignexchangederivatives (156) — (15,588) — (15,744)
Creditderivatives — — — (671) (671)
Total $ (156) $ 29 $ (15,588) $ (64) $ (15,779)
^Purchasedoptionsarereportedassecurities.
Counterparty Risk and Collateral The fund invests in derivatives in various markets, which expose it to differing levels of counterparty risk. Counterparty risk on exchange-traded and centrally cleared derivative contracts, such as futures, exchange-traded options, and centrally cleared swaps, is minimal

66
T. Rowe Price International Bond Fund (USD Hedged)
because the clearinghouse provides protection against counterparty defaults. For futures and centrally cleared swaps, the fund is required to deposit collateral in an amount specified by the clearinghouse and the clearing firm (margin requirement), and the margin requirement must be maintained over the life of the contract. Each clearinghouse and clearing firm, in its sole discretion, may adjust the margin requirements applicable to the fund.
Derivatives, such as bilateral swaps, forward currency exchange contracts, and OTC options, that are transacted and settle directly with a counterparty (bilateral derivatives) expose the fund to greater counterparty risk. To mitigate this risk, the fund has entered into master netting arrangements (MNAs) with certain counterparties that permit net settlement under specified conditions and, for certain counterparties, also require the exchange of collateral to cover mark-to-market exposure. MNAs may be in the form of International Swaps and Derivatives Association master agreements (ISDAs) or foreign exchange letter agreements (FX letters).
MNAs provide the ability to offset amounts the fund owes a counterparty against amounts the counterparty owes the fund (net settlement). Both ISDAs and FX letters generally allow termination of transactions and net settlement upon the occurrence of contractually specified events, such as failure to pay or bankruptcy. In addition, ISDAs specify other events, the occurrence of which would allow one of the parties to terminate. For example, a downgrade in credit rating of a counterparty would allow the fund to terminate, while a decline in the fund’s net assets of more than a specified percentage would allow the counterparty to terminate. Upon termination, all transactions with that counterparty would be liquidated and a net termination amount settled. ISDAs include collateral agreements whereas FX letters do not. Collateral requirements are determined daily based on the net aggregate unrealized gain or loss on all bilateral derivatives with a counterparty, subject to minimum transfer amounts that typically range from $100,000 to $250,000. Any additional collateral required due to changes in security values is typically transferred the same business day.
The following table summarizes the fund’s derivatives at the reporting date by loss exposure to each counterparty or clearinghouse after consideration of collateral, if any. Exchange-traded and centrally cleared derivatives that settle variation margin daily are presented at the variation margin receivable or payable on the reporting date, and exchange-traded options are presented at value.

67
T. Rowe Price International Bond Fund (USD Hedged)
($000s)
Counterparty
Form of
MNA
Gross Value on Statement of Assets
and LiabilitiesNet Amount
Due (to)/from Counterparty or Exchange
Collateral Pledged
(Received) by Fund
Loss Exposure, After Collateral* (not
less than $0)Asset Liability
BankofAmericaMerrillLynch ISDA $ 1,773 $ (9,890) $ (8,117) $ 6,163 $ —
BarclaysBank ISDA 1,456 (1,089) 367 (680) —
BNPParibas ISDA 1,622 (652) 970 — 971
CIBCWorldMarkets FXLetter 633 (385) 248 — 248
Citibank ISDA 950 (419) 531 (540) —
DeutscheBank ISDA 417 (423) (6) — —
GoldmanSachs ISDA 1,022 (342) 680 — 681
HSBCBank ISDA 507 (2,728) (2,221) 2,013 —
JPMorganChase ISDA 82 — 82 2,640 2,722
MorganStanley ISDA 274 (615) (341) — —
RoyalBankofCanada ISDA — (285) (285) — —
StandardChartered FXLetter 438 (1,631) (1,193) 835 —
StateStreet ISDA 652 (5,985) (5,333) 3,524 —
UBSInvestmentBank ISDA — (706) (706) 587 —
CentrallyClearedSwaps n/a 535 — 535 — 535
ExchangeTradedFutures n/a — (47) (47) 1,853 1,806
Total $ 10,361 $ (25,197)
*Insituationssuchascounterpartydefaultorbankruptcy,thefundmayhavefurtherrightsofoffsetagainstamountsduetoorfromthecounterpartyunderotheragreements.
Collateral may be in the form of cash or debt securities issued by the U.S. government or related agencies. Cash and currencies posted by the fund are reflected as cash deposits in the accompanying financial statements and generally are restricted from withdrawal by the fund; securities posted by the fund are so noted in the accompanying Portfolio of Investments; both remain in the fund’s assets. Collateral pledged by counterparties is not included in

68
T. Rowe Price International Bond Fund (USD Hedged)
the fund’s assets because the fund does not obtain effective control over those assets. For bilateral derivatives, collateral posted by the fund is held in a segregated account by the fund’s custodian.
While typically not sold in the same manner as to equity or fixed income securities, exchange-traded or centrally cleared derivatives may be closed out only on the exchange or clearinghouse where the contracts were traded, and OTC and bilateral derivatives may be unwound with counterparties or transactions assigned to other counterparties to allow the fund to exit the transaction. This ability is subject to the liquidity of underlying positions.
Forward Currency Exchange Contracts The fund is subject to foreign currency exchange rate risk in the normal course of pursuing its investment objectives. It uses forward currency exchange contracts (forwards) primarily to protect its non-U.S. dollar-denominated securities from adverse currency movements and to increase exposure to a particular foreign currency or to shift the fund’s foreign currency exposure from one country to another, or to enhance the fund’s return. A forward involves an obligation to purchase or sell a fixed amount of a specific currency on a future date at a price set at the time of the contract. Although certain forwards may be settled by exchanging only the net gain or loss on the contract, most forwards are settled with the exchange of the underlying currencies in accordance with the specified terms. Forwards are valued at the unrealized gain or loss on the contract, which reflects the net amount the fund either is entitled to receive or obligated to deliver, as measured by the difference between the forward exchange rates at the date of entry into the contract and the forward rates at the reporting date. Appreciated forwards are reflected as assets and depreciated forwards are reflected as liabilities on the accompanying Statement of Assets and Liabilities. Risks related to the use of forwards include the possible failure of counterparties to meet the terms of the agreements; that anticipated currency movements will not occur, thereby reducing the fund’s total return; and the potential for losses in excess of the fund’s initial investment. During the period ended December 31, 2017, the volume of the fund’s activity in forwards, based on underlying notional amounts, was generally between 0% and 102% of net assets.
Futures Contracts The fund is subject to interest rate risk in the normal course of pursuing its investment objectives and uses futures contracts to help manage such risk. The fund may enter into futures contracts to manage exposure to interest rate and yield curve movements, security prices, foreign currencies, credit quality, and mortgage prepayments; as an efficient means of adjusting exposure to all or part of a target market; to enhance income; as

69
T. Rowe Price International Bond Fund (USD Hedged)
a cash management tool; or to adjust portfolio duration and credit exposure. A futures contract provides for the future sale by one party and purchase by another of a specified amount of a specific underlying financial instrument at an agreed-upon price, date, time, and place. The fund currently invests only in exchange-traded futures, which generally are standardized as to maturity date, underlying financial instrument, and other contract terms. Payments are made or received by the fund each day to settle daily fluctuations in the value of the contract (variation margin), which reflect changes in the value of the underlying financial instrument. Variation margin is recorded as unrealized gain or loss until the contract is closed. The value of a futures contract included in net assets is the amount of unsettled variation margin; net variation margin receivable is reflected as an asset and net variation margin payable is reflected as a liability on the accompanying Statement of Assets and Liabilities. Risks related to the use of futures contracts include possible illiquidity of the futures markets, contract prices that can be highly volatile and imperfectly correlated to movements in hedged security values and interest rates, and potential losses in excess of the fund’s initial investment. During the period ended December 31, 2017, the volume of the fund’s activity in futures, based on underlying notional amounts, was generally between 0% and 16% of net assets.
Options The fund is subject to foreign currency exchange rate risk in the normal course of pursuing its investment objectives and uses options to help manage such risk. The fund may use options to manage exposure to security prices, interest rates, foreign currencies, and credit quality; as an efficient means of adjusting exposure to all or a part of a target market; to enhance income; as a cash management tool; or to adjust credit exposure. Options are included in net assets at fair value, purchased options are included in Investments in Securities, and written options are separately reflected as a liability on the accompanying Statement of Assets and Liabilities. Premiums on unexercised, expired options are recorded as realized gains or losses; premiums on exercised options are recorded as an adjustment to the proceeds from the sale or cost of the purchase. The difference between the premium and the amount received or paid in a closing transaction is also treated as realized gain or loss. In return for a premium paid, call and put options give the holder the right, but not the obligation, to purchase or sell, respectively, a security at a specified exercise price.
Risks related to the use of options include possible illiquidity of the options markets; trading restrictions imposed by an exchange or counterparty; movements in the underlying asset values currency values; and, for written

70
T. Rowe Price International Bond Fund (USD Hedged)
options, potential losses in excess of the fund’s initial investment. During the period ended December 31, 2017, the volume of the fund’s activity in options, based on underlying notional amounts, was generally between 0% and 3% of net assets.
Swaps The fund is subject to interest rate risk and credit risk in the normal course of pursuing its investment objectives and uses swap contracts to help manage such risks. The fund may use swaps in an effort to manage exposure to changes in interest rates, inflation rates, and credit quality; to adjust overall exposure to certain markets; to enhance total return or protect the value of portfolio securities; to serve as a cash management tool; or to adjust portfolio duration and credit exposure. Swap agreements can be settled either directly with the counterparty (bilateral swap) or through a central clearinghouse (centrally cleared swap). Fluctuations in the fair value of a contract are reflected in unrealized gain or loss and are reclassified to realized gain or loss upon contract termination or cash settlement. Net periodic receipts or payments required by a contract increase or decrease, respectively, the value of the contract until the contractual payment date, at which time such amounts are reclassified from unrealized to realized gain or loss. For bilateral swaps, cash payments are made or received by the fund on a periodic basis in accordance with contract terms; unrealized gain on contracts and premiums paid are reflected as assets and unrealized loss on contracts and premiums received are reflected as liabilities on the accompanying Statement of Assets and Liabilities. For bilateral swaps, premiums paid or received are amortized over the life of the swap and are recognized as realized gain or loss in the Statement of Operations. For centrally cleared swaps, payments are made or received by the fund each day to settle the daily fluctuation in the value of the contract (variation margin). Accordingly, the value of a centrally cleared swap included in net assets is the unsettled variation margin; net variation margin receivable is reflected as an asset and net variation margin payable is reflected as a liability on the accompanying Statement of Assets and Liabilities.
Interest rate swaps are agreements to exchange cash flows based on the difference between specified interest rates applied to a notional principal amount for a specified period of time. Risks related to the use of interest rate swaps include the potential for unanticipated movements in interest or currency rates, the possible failure of a counterparty to perform in accordance with the terms of the swap agreements, potential government regulation that could adversely affect the fund’s swap investments, and potential losses in excess of the fund’s initial investment.

71
T. Rowe Price International Bond Fund (USD Hedged)
Credit default swaps are agreements where one party (the protection buyer) agrees to make periodic payments to another party (the protection seller) in exchange for protection against specified credit events, such as certain defaults and bankruptcies related to an underlying credit instrument, or issuer or index of such instruments. Upon occurrence of a specified credit event, the protection seller is required to pay the buyer the difference between the notional amount of the swap and the value of the underlying credit, either in the form of a net cash settlement or by paying the gross notional amount and accepting delivery of the relevant underlying credit. For credit default swaps where the underlying credit is an index, a specified credit event may affect all or individual underlying securities included in the index and will be settled based upon the relative weighting of the affected underlying security(ies) within the index. Risks related to the use of credit default swaps include the possible inability of the fund to accurately assess the current and future creditworthiness of underlying issuers, the possible failure of a counterparty to perform in accordance with the terms of the swap agreements, potential government regulation that could adversely affect the fund’s swap investments, and potential losses in excess of the fund’s initial investment.
During the period ended December 31, 2017, the volume of the fund’s activity in swaps, based on underlying notional amounts, was generally between 0% and 20% of net assets.
NOTE 4 - OTHER INVESTMENT TRANSACTIONS
Consistent with its investment objective, the fund engages in the following practices to manage exposure to certain risks and/or to enhance perfor-mance. The investment objective, policies, program, and risk factors of the fund are described more fully in the fund’s prospectus and Statement of Additional Information.
Emerging and Frontier Markets The fund may invest, either directly or through investments in T. Rowe Price institutional funds, in securities of companies located in, issued by governments of, or denominated in or linked to the currencies of emerging and frontier market countries; at period-end, approximately 27% of the fund’s net assets were invested in emerging markets and 6% in frontier markets. Emerging markets, and to a greater extent frontier markets, generally have economic structures that are less diverse and mature, and political systems that are less stable, than developed countries.
72
T. Rowe Price International Bond Fund (USD Hedged)
These markets may be subject to greater political, economic, and social uncertainty and differing regulatory environments that may potentially impact the fund’s ability to buy or sell certain securities or repatriate proceeds to U.S. dollars. Such securities are often subject to greater price volatility, less liquidity, and higher rates of inflation than U.S. securities. Investing in frontier markets is significantly riskier than investing in other countries, including emerging markets.
Noninvestment-Grade Debt At December 31, 2017, approximately 14% of the fund’s net assets were invested, either directly or through its investment in T. Rowe Price institutional funds, in noninvestment-grade debt, including “high yield” or “junk” bonds or leveraged loans. The noninvestment-grade debt market may experience sudden and sharp price swings due to a variety of factors, including changes in economic forecasts, stock market activity, large sustained sales by major investors, a high-profile default, or a change in market sentiment. These events may decrease the ability of issuers to make principal and interest payments and adversely affect the liquidity or value, or both, of such securities. Investments in noninvestment-grade holdings may be considered speculative.
Restricted Securities The fund may invest in securities that are subject to legal or contractual restrictions on resale. Prompt sale of such securities at an acceptable price may be difficult and may involve substantial delays and additional costs.
Other Purchases and sales of portfolio securities other than short-term and U.S. government securities aggregated $1,185,023,000 and $84,621,000, respectively, for the period ended December 31, 2017.
NOTE 5 - FEDERAL INCOME TAxES
No provision for federal income taxes is required since the fund intends to qualify as a regulated investment company under Subchapter M of the Internal Revenue Code and distribute to shareholders all of its taxable income and gains. Distributions determined in accordance with federal income tax regulations may differ in amount or character from net investment income and realized gains for financial reporting purposes. Financial reporting records are adjusted for permanent book/tax differences to reflect tax character but are not adjusted for temporary differences.

73
T. Rowe Price International Bond Fund (USD Hedged)
The fund files U.S. federal, state, and local tax returns as required. The fund’s tax returns are subject to examination by the relevant tax authorities until expiration of the applicable statute of limitations, which is generally three years after the filing of the tax return but which can be extended to six years in certain circumstances.
Reclassifications to paid-in capital relate primarily to nondeductible organizational expenses. Reclassifications between income and gain relate primarily to per-share rounding of distributions. For the period ended December 31, 2017, the following reclassifications were recorded to reflect tax character (there was no impact on results of operations or net assets):
Undistributednetinvestmentincome $ (114)
Undistributednetrealizedgain 116
Paid-incapital (2)
($000s)
Distributions during the period ended December 31, 2017 totaled $6,409,000 and were characterized as ordinary income for tax purposes. At December 31, 2017, the tax-basis cost of investments, including derivatives, and components of net assets were as follows:
Costofinvestments $ 1,207,797
Unrealizedappreciation $ 33,400
Unrealizeddepreciation (24,562)
Netunrealizedappreciation(depreciation) 8,838
Undistributedordinaryincome 391
Undistributedlong-termcapitalgain 306
Late-yearordinarylossdeferrals (6,927)
Paid-incapital 1,233,797
Netassets $ 1,236,405
($000s)

74
T. Rowe Price International Bond Fund (USD Hedged)
The difference between book-basis and tax-basis net unrealized appreciation (depreciation) is attributable to the deferral of losses from certain derivative contracts, and the realization of gains/losses on certain open derivative contracts for tax purposes. In accordance with federal tax laws applicable to investment companies, net specified losses realized between November 1 and December 31 are not recognized for tax purposes until the subsequent year (late-year loss deferrals), however, such losses are recognized for financial reporting purposes in the year realized.
NOTE 6 - RELATED PARTY TRANSACTIONS
The fund is managed by T. Rowe Price Associates, Inc. (Price Associates), a wholly owned subsidiary of T. Rowe Price Group, Inc. (Price Group). Price Associates has entered into a sub-advisory agreement(s) with one or more of its wholly owned subsidiaries, to provide investment advisory services to the fund. The investment management agreement between the fund and Price Associates provides for an annual investment management fee, which is computed daily and paid monthly. The fee consists of an individual fund fee, equal to 0.20% of the fund’s average daily net assets, and a group fee. The group fee rate is calculated based on the combined net assets of certain mutual funds sponsored by Price Associates (the group) applied to a graduated fee schedule, with rates ranging from 0.48% for the first $1 billion of assets to 0.265% for assets in excess of $650 billion. The fund’s group fee is determined by applying the group fee rate to the fund’s average daily net assets. At December 31, 2017, the effective annual group fee rate was 0.29%.
The Investor Class and Advisor Class are each subject to a contractual expense limitation through the limitation dates indicated in the table below. During the limitation period, Price Associates is required to waive its management fee or pay any expenses (excluding interest, expenses related to borrowings, taxes, brokerage, and other non-recurring expenses permitted by the investment management agreement) that would otherwise cause the class’s ratio of annualized total expenses to average net assets (expense ratio) to exceed its expense limitation. Each class is required to repay Price Associates for expenses previously waived/paid to the extent the class’s net assets grow or expenses decline sufficiently to allow repayment without causing the class’s expense ratio (after the repayment is taken into account) to exceed both: (1) the expense
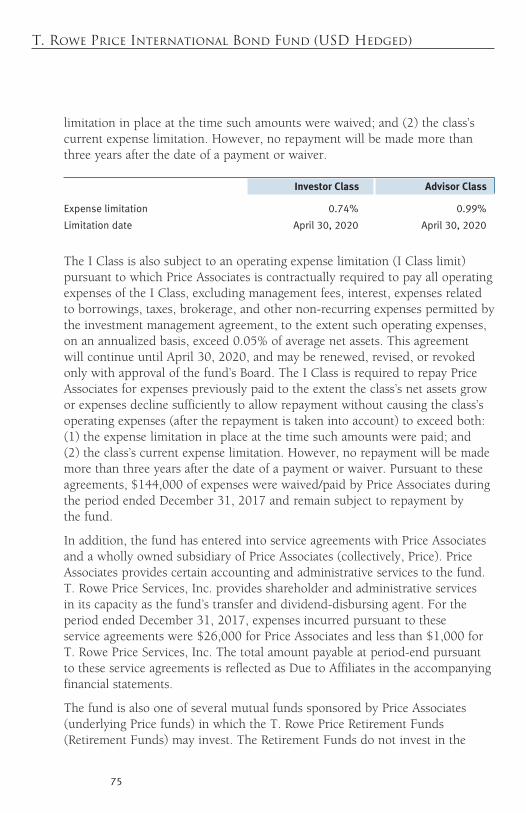
75
T. Rowe Price International Bond Fund (USD Hedged)
limitation in place at the time such amounts were waived; and (2) the class’s current expense limitation. However, no repayment will be made more than three years after the date of a payment or waiver.
Advisor Class
Expenselimitation 0.74% 0.99%
Limitationdate April30,2020 April30,2020
Investor Class
The I Class is also subject to an operating expense limitation (I Class limit) pursuant to which Price Associates is contractually required to pay all operating expenses of the I Class, excluding management fees, interest, expenses related to borrowings, taxes, brokerage, and other non-recurring expenses permitted by the investment management agreement, to the extent such operating expenses, on an annualized basis, exceed 0.05% of average net assets. This agreement will continue until April 30, 2020, and may be renewed, revised, or revoked only with approval of the fund’s Board. The I Class is required to repay Price Associates for expenses previously paid to the extent the class’s net assets grow or expenses decline sufficiently to allow repayment without causing the class’s operating expenses (after the repayment is taken into account) to exceed both: (1) the expense limitation in place at the time such amounts were paid; and (2) the class’s current expense limitation. However, no repayment will be made more than three years after the date of a payment or waiver. Pursuant to these agreements, $144,000 of expenses were waived/paid by Price Associates during the period ended December 31, 2017 and remain subject to repayment by the fund.
In addition, the fund has entered into service agreements with Price Associates and a wholly owned subsidiary of Price Associates (collectively, Price). Price Associates provides certain accounting and administrative services to the fund. T. Rowe Price Services, Inc. provides shareholder and administrative services in its capacity as the fund’s transfer and dividend-disbursing agent. For the period ended December 31, 2017, expenses incurred pursuant to these service agreements were $26,000 for Price Associates and less than $1,000 for T. Rowe Price Services, Inc. The total amount payable at period-end pursuant to these service agreements is reflected as Due to Affiliates in the accompanying financial statements.
The fund is also one of several mutual funds sponsored by Price Associates (underlying Price funds) in which the T. Rowe Price Retirement Funds (Retirement Funds) may invest. The Retirement Funds do not invest in the

76
T. Rowe Price International Bond Fund (USD Hedged)
underlying Price funds for the purpose of exercising management or control. Pursuant to a special servicing agreement, expenses associated with the operation of the Retirement Funds are borne by each underlying Price fund to the extent of estimated savings to it and in proportion to the average daily value of its shares owned by the Retirement Funds.
Expenses allocated under this special servicing agreement are reflected as shareholder servicing expense in the accompanying financial statements. For the period ended December 31, 2017, the fund was allocated $95,000 of Retirement Funds’ expenses. Of these amounts, $35,000 related to services provided by Price. At period-end, the amount payable to Price pursuant to this special servicing agreement is reflected as Due to Affiliates in the accompanying financial statements. At December 31, 2017, approximately 98% of the outstanding shares of the Investor Class were held by the Retirement Funds.
In addition, other mutual funds, trusts, and other accounts managed by Price Associates or its affiliates (collectively, Price funds and accounts) may invest in the fund and are not subject to the special servicing agreement disclosed above. No Price fund or account may invest for the purpose of exercising management or control over the fund. At December 31, 2017, approximately 99% of the I Class’s outstanding shares were held by Price funds and accounts.
The fund may invest its cash reserves in certain open-end management investment companies managed by Price Associates and considered affiliates of the fund: the T. Rowe Price Government Reserve Fund or the T. Rowe Price Treasury Reserve Fund, organized as money market funds, or the T. Rowe Price Short-Term Fund, a short-term bond fund (collectively, the Price Reserve Funds). The Price Reserve Funds are offered as short-term investment options to mutual funds, trusts, and other accounts managed by Price Associates or its affiliates and are not available for direct purchase by members of the public. Cash collateral from securities lending is invested in the T. Rowe Price Short-Term Fund. The Price Reserve Funds pay no investment management fees.

77
T. Rowe Price International Bond Fund (USD Hedged)
As of December 31, 2017, T. Rowe Price Group, Inc., or its wholly owned subsidiaries owned 2,450,000 shares of the Investor Class, representing 2% of the Investor Class’s net assets, 25,000 shares of the Advisor Class, representing 100% of the Advisor Class’s net assets, and 25,000 shares of the I Class, representing less than 1% of the I Class’s net assets.
The fund may participate in securities purchase and sale transactions with other funds or accounts advised by Price Associates (cross trades), in accordance with procedures adopted by the fund’s Board and Securities and Exchange Commission rules, which require, among other things, that such purchase and sale cross trades be effected at the independent current market price of the security. During the period ended December 31, 2017, the fund had no purchases or sales cross trades with other funds or accounts advised by Price Associates.

78
T. Rowe Price International Bond Fund (USD Hedged)
Report of Independent Registered Public Accounting Firm
To the Board of Directors of T. Rowe Price International Funds, Inc. and Shareholders of T. Rowe Price International Bond Fund (USD Hedged)
Opinion on the Financial Statements
We have audited the accompanying statement of assets and liabilities, including the portfolio of investments, of T. Rowe Price International Bond Fund (USD Hedged) (one of the funds constituting T. Rowe Price International Funds, Inc., hereafter referred to as the “Fund”) as of December 31, 2017, the related statements of operations and changes in net assets, including the related notes, and the financial highlights for the period September 12, 2017 (date of Fund’s Inception) through December 31, 2017 (collectively referred to as the “financial statements”). In our opinion, the financial statements present fairly, in all material respects, the financial position of the Fund as of December 31, 2017, and the results of its operations, changes in its net assets and the financial highlights for the period September 12, 2017 (date of Fund’s Inception) through December 31, 2017 in conformity with accounting principles generally accepted in the United States of America.
Basis for Opinion
These financial statements are the responsibility of the Fund’s management. Our responsibility is to express an opinion on the Fund’s financial statements based on our audit. We are a public accounting firm registered with the Public Company Accounting Oversight Board (United States) (“PCAOB”) and are required to be independent with respect to the Fund in accordance with the U.S. federal securities laws and the applicable rules and regulations of the Securities and Exchange Commission and the PCAOB.
We conducted our audit of these financial statements in accordance with the standards of the PCAOB. Those standards require that we plan and perform the audit to obtain reasonable assurance about whether the financial statements are free of material misstatement, whether due to error or fraud.
79
T. Rowe Price International Bond Fund (USD Hedged)
Our audit included performing procedures to assess the risks of material misstatement of the financial statements, whether due to error or fraud, and performing procedures that respond to those risks. Such procedures included examining, on a test basis, evidence regarding the amounts and disclosures in the financial statements. Our audit also included evaluating the accounting principles used and significant estimates made by management, as well as evaluating the overall presentation of the financial statements. Our procedures included confirmation of securities owned as of December 31, 2017 by correspondence with the custodians, transfer agent and brokers; when replies were not received from brokers, we performed other auditing procedures. We believe that our audit provides a reasonable basis for our opinion.
PricewaterhouseCoopers LLPBaltimore, MarylandFebruary 15, 2018
We have served as the auditor of one or more investment companies in T. Rowe Price group of investment companies since 1973.
Report of Independent Registered Public Accounting Firm (continued)
80
Tax Information (Unaudited) for the Tax Year Ended 12/31/17
WeareprovidingthisinformationasrequiredbytheInternalRevenueCode.Theamountsshownmaydifferfromthoseelsewhereinthisreportbecauseofdifferencesbetweentaxandfinancialreportingrequirements.
Thefund’sdistributionstoshareholdersincluded$3,933,000fromshort-termcapitalgains.
AdescriptionofthepoliciesandproceduresusedbyT.RowePricefundsandportfoliostodeterminehowtovoteproxiesrelatingtoportfoliosecuritiesisavailableineachfund’sStatementofAdditionalInformation.Youmayrequestthisdocumentbycalling1-800-225-5132orbyaccessingtheSEC’swebsite,sec.gov.
Thedescriptionofourproxyvotingpoliciesandproceduresisalsoavailableonourcorporatewebsite.Toaccessit,pleasevisitthefollowingWebpage:
https://www3.troweprice.com/usis/corporate/en/utility/policies.html
Scrolldowntothesectionnearthebottomofthepagethatsays,“ProxyVotingPolicies.”ClickontheProxyVotingPolicieslinkintheshadedbox.
Eachfund’smostrecentannualproxyvotingrecordisavailableonourwebsiteandthroughtheSEC’swebsite.ToaccessitthroughT.RowePrice,visitthewebsitelocationshownabove,andscrolldowntothesectionnearthebottomofthepagethatsays,“ProxyVotingRecords.”ClickontheProxyVotingRecordslinkintheshadedbox.
Information on Proxy Voting Policies, Procedures, and Records
ThefundfilesacompletescheduleofportfolioholdingswiththeSecuritiesandExchangeCommissionforthefirstandthirdquartersofeachfiscalyearonFormN-Q.Thefund’sFormN-QisavailableelectronicallyontheSEC’swebsite(sec.gov);hardcopiesmaybereviewedandcopiedattheSEC’sPublicReferenceRoom,100FSt.N.E.,Washington,DC20549.FormoreinformationonthePublicReferenceRoom,call1-800-SEC-0330.
How to Obtain Quarterly Portfolio Holdings
T. Rowe Price International Bond Fund (USD Hedged)

81
T. Rowe Price International Bond Fund (USD Hedged)
About the Fund’s Directors and Officers
YourfundisoverseenbyaBoardofDirectors(Board)thatmeetsregularlytoreviewawidevarietyofmattersaffectingorpotentiallyaffectingthefund,includingperformance,investmentprograms,compliancematters,advisoryfeesandexpenses,serviceproviders,andbusinessandregulatoryaffairs.TheBoardelectsthefund’sofficers,whoarelistedinthefinaltable.Atleast75%oftheBoard’smembersareindependentofT.RowePriceAssociates,Inc.(T.RowePrice),anditsaffiliates;“inside”or“interested”directorsareemployeesorofficersofT.RowePrice.Thebusinessaddressofeachdirectorandofficeris100EastPrattStreet,Baltimore,Maryland21202.TheStatementofAdditionalInformationincludesadditionalinformationaboutthefunddirectorsandisavailablewithoutchargebycallingaT.RowePricerepresentativeat1-800-638-5660.
Independent Directors
Name(Year of Birth)Year Elected*[Number of T. Rowe PricePortfolios Overseen]
Principal Occupation(s) and Directorships of Public Companies and Other Investment Companies During the Past Five Years
BruceW.Duncan(1951)2013[191]
ChiefExecutiveOfficerandDirector(2009toDecember2016),ChairmanoftheBoard(January2016topresent),andPresident(2009toSeptember2016),FirstIndustrialRealtyTrust,anownerandoperatorofindustrialproperties;ChairmanoftheBoard(2005toSeptember2016)andDirector(1999toSeptember2016),StarwoodHotels&Resorts,ahotelandleisurecompany;Director,BostonProperties(May2016topresent);Director,MarriottInternational,Inc.(September2016topresent)
RobertJ.Gerrard,Jr.(1952)2012[191]
AdvisoryBoardMember,PipelineCrisis/WinningStrategies,acollaborativeworkingtoimproveopportunitiesforyoungAfricanAmericans(1997topresent)
PaulF.McBride(1956)2013[191]
AdvisoryBoardMember,VizziaTechnologies(2015topresent)
*Eachindependentdirectorservesuntilretirement,resignation,orelectionofasuccessor.
82
T. Rowe Price International Bond Fund (USD Hedged)
Independent Directors (continued)
Name(Year of Birth)Year Elected*[Number of T. Rowe PricePortfolios Overseen]
Principal Occupation(s) and Directorships of Public Companies and Other Investment Companies During the Past Five Years
CeciliaE.Rouse,Ph.D.(1963)2012[191]
Dean,WoodrowWilsonSchool(2012topresent);ProfessorandResearcher,PrincetonUniversity(1992topresent);MemberofNationalAcademyofEducation(2010topresent);Director,MDRC,anonprofiteducationandsocialpolicyresearchorganization(2011topresent);ResearchAssociateofLaborStudiesProgram(2011to2015)andBoardMember(2015topresent),NationalBureauofEconomicResearch(2011topresent);ChairofCommitteeontheStatusofMinorityGroupsintheEconomicProfession(2012topresent);VicePresident(2015topresent),AmericanEconomicAssociation
JohnG.Schreiber(1946)2001[191]
Owner/President,CentaurCapitalPartners,Inc.,arealestateinvestmentcompany(1991topresent);Cofounder,Partner,andCochairmanoftheInvestmentCommittee,BlackstoneRealEstateAdvisors,L.P.(1992to2015);Director,GeneralGrowthProperties,Inc.(2010to2013);Director,BlackstoneMortgageTrust,arealestatefinancecompany(2012to2016);DirectorandChairmanoftheBoard,BrixmorPropertyGroup,Inc.(2013topresent);Director,HiltonWorldwide(2013topresent);Director,HudsonPacificProperties(2014to2016)
MarkR.Tercek(1957)2009[191]
PresidentandChiefExecutiveOfficer,TheNatureConservancy(2008topresent)
*Eachindependentdirectorservesuntilretirement,resignation,orelectionofasuccessor.
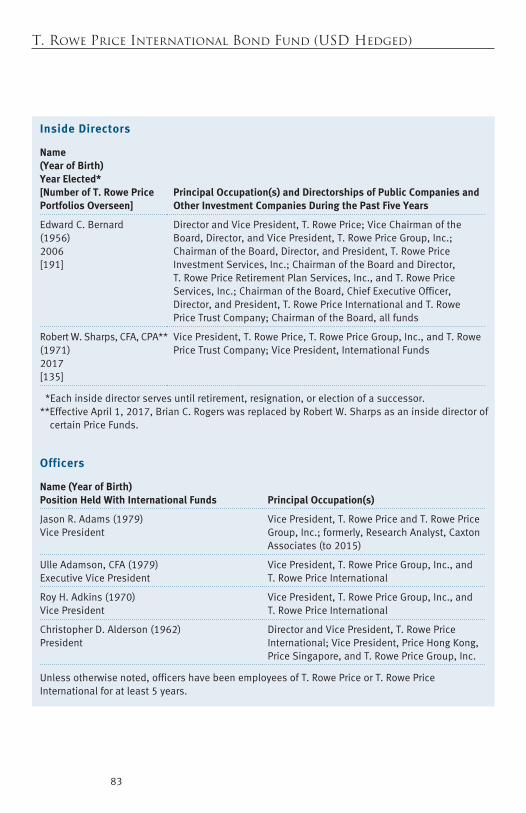
83
T. Rowe Price International Bond Fund (USD Hedged)
Inside Directors
Name(Year of Birth)Year Elected*[Number of T. Rowe Price Portfolios Overseen]
Principal Occupation(s) and Directorships of Public Companies and Other Investment Companies During the Past Five Years
EdwardC.Bernard(1956)2006[191]
DirectorandVicePresident,T.RowePrice;ViceChairmanoftheBoard,Director,andVicePresident,T.RowePriceGroup,Inc.;ChairmanoftheBoard,Director,andPresident,T.RowePriceInvestmentServices,Inc.;ChairmanoftheBoardandDirector,T.RowePriceRetirementPlanServices,Inc.,andT.RowePriceServices,Inc.;ChairmanoftheBoard,ChiefExecutiveOfficer,Director,andPresident,T.RowePriceInternationalandT.RowePriceTrustCompany;ChairmanoftheBoard,allfunds
RobertW.Sharps,CFA,CPA**(1971)2017[135]
VicePresident,T.RowePrice,T.RowePriceGroup,Inc.,andT.RowePriceTrustCompany;VicePresident,InternationalFunds
*Eachinsidedirectorservesuntilretirement,resignation,orelectionofasuccessor.**EffectiveApril1,2017,BrianC.RogerswasreplacedbyRobertW.Sharpsasaninsidedirectorof
certainPriceFunds.
Officers
Name (Year of Birth)Position Held With International Funds Principal Occupation(s)
JasonR.Adams(1979)VicePresident
VicePresident,T.RowePriceandT.RowePriceGroup,Inc.;formerly,ResearchAnalyst,CaxtonAssociates(to2015)
UlleAdamson,CFA(1979)ExecutiveVicePresident
VicePresident,T.RowePriceGroup,Inc.,andT.RowePriceInternational
RoyH.Adkins(1970)VicePresident
VicePresident,T.RowePriceGroup,Inc.,andT.RowePriceInternational
ChristopherD.Alderson(1962)President
DirectorandVicePresident,T.RowePriceInternational;VicePresident,PriceHongKong,PriceSingapore,andT.RowePriceGroup,Inc.
Unlessotherwisenoted,officershavebeenemployeesofT.RowePriceorT.RowePriceInternationalforatleast5years.

84
T. Rowe Price International Bond Fund (USD Hedged)
Officers (continued)
Name (Year of Birth)Position Held With International Funds Principal Occupation(s)
SyedH.Ali(1970)VicePresident
VicePresident,PriceSingaporeandT.RowePriceGroup,Inc.
PaulinaAmieva(1981)VicePresident
VicePresident,T.RowePriceandT.RowePriceGroup,Inc.
MalikS.Asif(1981)VicePresident
VicePresident,T.RowePriceGroup,Inc.,andT.RowePriceInternational
HarishankarBalkrishna(1983)VicePresident
VicePresident,T.RowePriceGroup,Inc.,andT.RowePriceInternational
SheenaL.Barbosa(1983)VicePresident
VicePresident,PriceHongKongandT.RowePriceGroup,Inc.
PeterJ.Bates,CFA(1974)ExecutiveVicePresident
VicePresident,T.RowePriceandT.RowePriceGroup,Inc.
LuisM.Baylac(1982)VicePresident
VicePresident,T.RowePriceGroup,Inc.,andT.RowePriceInternational
TimothyBei(1973)VicePresident
VicePresident,T.RowePriceandT.RowePriceGroup,Inc.
OliverD.M.Bell,IMC(1969)ExecutiveVicePresident
VicePresident,T.RowePriceGroup,Inc.,andT.RowePriceInternational
R.ScottBerg,CFA(1972)ExecutiveVicePresident
VicePresident,T.RowePriceandT.RowePriceGroup,Inc.
StevenE.Boothe,CFA(1977)VicePresident
VicePresident,T.RowePriceandT.RowePriceGroup,Inc.
PeterI.Botoucharov(1965)VicePresident
VicePresident,T.RowePriceGroup,Inc.,andT.RowePriceInternational
TalaBoulos(1984)VicePresident
VicePresident,T.RowePriceGroup,Inc.,andT.RowePriceInternational;formerly,VicePresident,CEEMEACorporateCreditResearch,DeutscheBank(to2013)
DarrellN.Braman(1963)VicePresidentandSecretary
VicePresident,PriceHongKong,PriceSingapore,T.RowePrice,T.RowePriceGroup,Inc.,T.RowePriceInternational,T.RowePriceInvestmentServices,Inc.,andT.RowePriceServices,Inc.
Unlessotherwisenoted,officershavebeenemployeesofT.RowePriceorT.RowePriceInternationalforatleast5years.

85
T. Rowe Price International Bond Fund (USD Hedged)
Officers (continued)
Name (Year of Birth)Position Held With International Funds Principal Occupation(s)
RyanN.Burgess,CFA(1974)VicePresident
VicePresident,T.RowePriceandT.RowePriceGroup,Inc.
SheldonChan(1981)VicePresident
VicePresident,PriceHongKongandT.RowePriceGroup,Inc.
AndrewChang(1983)VicePresident
VicePresident,T.RowePriceGroup,Inc.
TakYiuCheng,CFA,CPA(1974)VicePresident
VicePresident,PriceHongKongandT.RowePriceGroup,Inc.
CarolynHoiCheChu(1974)VicePresident
VicePresident,PriceHongKongandT.RowePriceGroup,Inc.
ArchibaldCiganerAlbeniz,CFA(1976)ExecutiveVicePresident
VicePresident,T.RowePriceGroup,Inc.,andT.RowePriceInternational
RichardN.Clattenburg,CFA(1979)ExecutiveVicePresident
VicePresident,PriceSingapore,T.RowePrice,T.RowePriceGroup,Inc.,andT.RowePriceInternational
MichaelJ.Conelius,CFA(1964)ExecutiveVicePresident
VicePresident,T.RowePrice,T.RowePriceGroup,Inc.,T.RowePriceInternational,andT.RowePriceTrustCompany
MichaelF.Connelly,CFA(1977)VicePresident
VicePresident,T.RowePriceandT.RowePriceGroup,Inc.
AndrewS.Davis(1978)VicePresident
VicePresident,T.RowePriceandT.RowePriceGroup,Inc.
RicharddelosReyes(1975)VicePresident
VicePresident,T.RowePrice,T.RowePriceGroup,Inc.,andT.RowePriceTrustCompany
MichaelDellaVedova(1969)ExecutiveVicePresident
VicePresident,T.RowePriceGroup,Inc.,andT.RowePriceInternational
ShawnT.Driscoll(1975)VicePresident
VicePresident,T.RowePrice,T.RowePriceGroup,Inc.,andT.RowePriceTrustCompany
BridgetA.Ebner(1970)VicePresident
VicePresident,T.RowePriceandT.RowePriceGroup,Inc.
DavidJ.Eiswert,CFA(1972)ExecutiveVicePresident
VicePresident,T.RowePrice,T.RowePriceGroup,Inc.,andT.RowePriceInternational
Unlessotherwisenoted,officershavebeenemployeesofT.RowePriceorT.RowePriceInternationalforatleast5years.

86
T. Rowe Price International Bond Fund (USD Hedged)
Officers (continued)
Name (Year of Birth)Position Held With International Funds Principal Occupation(s)
HenryM.Ellenbogen(1973)VicePresident
VicePresident,T.RowePrice,T.RowePriceGroup,Inc.,andT.RowePriceTrustCompany
RyanW.Ferro(1985)VicePresident
VicePresident,T.RowePriceandT.RowePriceGroup,Inc.;formerly,student,TuckSchoolofBusinessatDartmouth(to2014)
MarkS.Finn,CFA,CPA(1963)VicePresident
VicePresident,T.RowePrice,T.RowePriceGroup,Inc.,andT.RowePriceTrustCompany
QuentinS.Fitzsimmons(1968)VicePresident
VicePresident,T.RowePriceGroup,Inc.,andT.RowePriceInternational;formerly,PortfolioManager,RoyalBankofScotlandGroup(to2015)
MelissaC.Gallagher(1974)VicePresident
VicePresident,T.RowePriceGroup,Inc.,andT.RowePriceInternational
JustinT.Gerbereux,CFA(1975)VicePresident
VicePresident,T.RowePrice,T.RowePriceGroup,Inc.,andT.RowePriceTrustCompany
JohnR.Gilner(1961)ChiefComplianceOfficer
ChiefComplianceOfficerandVicePresident,T.RowePrice;VicePresident,T.RowePriceGroup,Inc.,andT.RowePriceInvestmentServices,Inc.
VishnuVardhanGopal(1979)VicePresident
VicePresident,PriceHongKongandT.RowePriceGroup,Inc.
JoelGrant(1978)VicePresident
VicePresident,T.RowePriceandT.RowePriceGroup,Inc.;formerly,Analyst,FidelityInternational(to2014)
PaulD.GreeneII(1978)VicePresident
VicePresident,T.RowePriceandT.RowePriceGroup,Inc.
BenjaminGriffiths,CFA(1977)VicePresident
VicePresident,T.RowePriceGroup,Inc.,andT.RowePriceInternational
AmandaB.Hall,CFA(1985)VicePresident
VicePresident,T.RowePriceGroup,Inc.,andT.RowePriceInternational;formerly,student,StanfordGraduateSchoolofBusiness(to2014)
RichardL.Hall(1979)VicePresident
VicePresident,T.RowePriceandT.RowePriceGroup,Inc.
NabilHanano,CFA(1984)VicePresident
VicePresident,T.RowePriceInternational
Unlessotherwisenoted,officershavebeenemployeesofT.RowePriceorT.RowePriceInternationalforatleast5years.

87
T. Rowe Price International Bond Fund (USD Hedged)
Officers (continued)
Name (Year of Birth)Position Held With International Funds Principal Occupation(s)
StevenC.Huber,CFA,FSA(1958)VicePresident
VicePresident,T.RowePrice,T.RowePriceGroup,Inc.,andT.RowePriceInternational
StefanHubrich,Ph.D.,CFA(1974)VicePresident
VicePresident,T.RowePriceandT.RowePriceGroup,Inc.
ArifHusain,CFA(1972)ExecutiveVicePresident
VicePresident,T.RowePriceGroup,Inc.,andT.RowePriceInternational;formerly,Director/HeadofUKandEuroFixedIncome,AllianceBernstein(to2013)
HiromasaIkeda(1971)VicePresident
VicePresident,PriceHongKongandT.RowePriceGroup,Inc.;formerly,Manager,FidelityKorea(to2014)
TetsujiInoue(1971)VicePresident
VicePresident,T.RowePriceGroup,Inc.,andT.RowePriceInternational
MichaelJacobs(1971)VicePresident
VicePresident,T.RowePriceGroup,Inc.,andT.RowePriceInternational;formerly,VicePresident,JPMorganAssetManagement(to2013)
RandalS.Jenneke(1971)VicePresident
VicePresident,T.RowePriceGroup,Inc.,andT.RowePriceInternational
PrashantG.Jeyaganesh(1983)VicePresident
VicePresident,T.RowePriceandT.RowePriceGroup,Inc.
NinaP.Jones,CPA(1980)VicePresident
VicePresident,T.RowePriceandT.RowePriceGroup,Inc.
YoichiroKai(1973)VicePresident
VicePresident,T.RowePriceGroup,Inc.,andT.RowePriceInternational
JacobKann,CFA(1987)VicePresident
VicePresident,T.RowePrice;formerly,EquityResearchAssociate,EatonVanceCorporation(to2013)
JaiKapadia(1982)VicePresident
VicePresident,PriceHongKongandT.RowePriceGroup,Inc.
AndrewJ.Keirle(1974)ExecutiveVicePresident
VicePresident,T.RowePriceGroup,Inc.,andT.RowePriceInternational
PaulJ.Krug,CPA(1964)VicePresident
VicePresident,T.RowePrice,T.RowePriceGroup,Inc.,andT.RowePriceTrustCompany
Unlessotherwisenoted,officershavebeenemployeesofT.RowePriceorT.RowePriceInternationalforatleast5years.

88
T. Rowe Price International Bond Fund (USD Hedged)
Officers (continued)
Name (Year of Birth)Position Held With International Funds Principal Occupation(s)
ChristopherJ.Kushlis,CFA(1976)VicePresident
VicePresident,T.RowePriceGroup,Inc.,andT.RowePriceInternational
ShengrongLau(1982)VicePresident
VicePresident,PriceSingaporeandT.RowePriceGroup,Inc.
MarkJ.Lawrence(1970)VicePresident
VicePresident,T.RowePriceGroup,Inc.,andT.RowePriceInternational
JacquelineLiu(1979)VicePresident
VicePresident,PriceHongKongandT.RowePriceGroup,Inc.;formerly,InvestmentAnalyst,FidelityInternationalHongKongLimited(to2014)
AnhLu(1968)ExecutiveVicePresident
VicePresident,PriceHongKongandT.RowePriceGroup,Inc.
OxanaLyalina(1987)VicePresident
VicePresident,T.RowePriceInternational;formerly,SeniorAnalyst,GoldmanSachsInternational(to2013)
SebastienMallet(1974)VicePresident
VicePresident,T.RowePriceGroup,Inc.,andT.RowePriceInternational
RyanMartyn(1979)VicePresident
VicePresident,T.RowePriceGroup,Inc.,andT.RowePriceInternational
CatherineD.Mathews(1963)TreasurerandVicePresident
VicePresident,T.RowePrice,T.RowePriceGroup,Inc.,andT.RowePriceTrustCompany
JonathanH.W.Matthews,CFA(1975)ExecutiveVicePresident
VicePresident,T.RowePriceGroup,Inc.,andT.RowePriceInternational
RaymondA.Mills,Ph.D.,CFA(1960)ExecutiveVicePresident
VicePresident,T.RowePrice,T.RowePriceGroup,Inc.,T.RowePriceInternational,andT.RowePriceTrustCompany
JihongMin(1979)VicePresident
VicePresident,PriceSingaporeandT.RowePriceGroup,Inc.
EricC.Moffett(1974)ExecutiveVicePresident
VicePresident,PriceHongKongandT.RowePriceGroup,Inc.
SamyB.Muaddi,CFA(1984)ExecutiveVicePresident
VicePresident,T.RowePriceandT.RowePriceGroup,Inc.
TobiasF.Mueller(1980)VicePresident
VicePresident,T.RowePriceGroup,Inc.,andT.RowePriceInternational
Unlessotherwisenoted,officershavebeenemployeesofT.RowePriceorT.RowePriceInternationalforatleast5years.
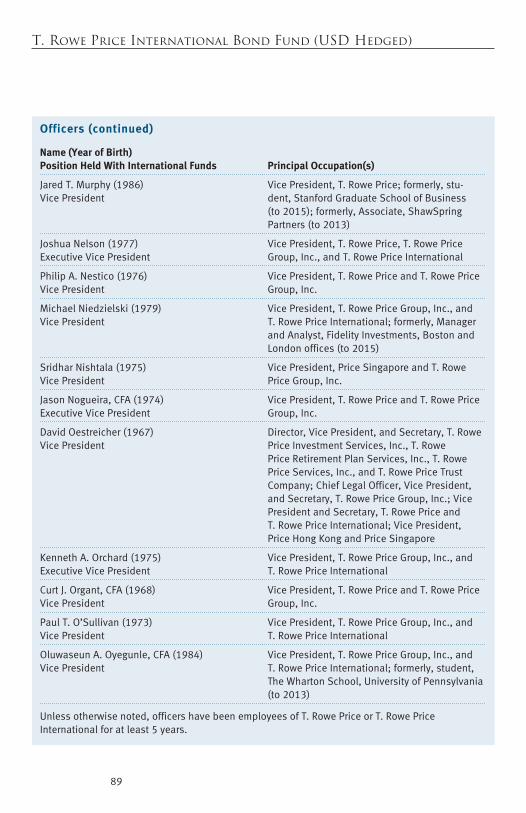
89
T. Rowe Price International Bond Fund (USD Hedged)
Officers (continued)
Name (Year of Birth)Position Held With International Funds Principal Occupation(s)
JaredT.Murphy(1986)VicePresident
VicePresident,T.RowePrice;formerly,stu-dent,StanfordGraduateSchoolofBusiness(to2015);formerly,Associate,ShawSpringPartners(to2013)
JoshuaNelson(1977)ExecutiveVicePresident
VicePresident,T.RowePrice,T.RowePriceGroup,Inc.,andT.RowePriceInternational
PhilipA.Nestico(1976)VicePresident
VicePresident,T.RowePriceandT.RowePriceGroup,Inc.
MichaelNiedzielski(1979)VicePresident
VicePresident,T.RowePriceGroup,Inc.,andT.RowePriceInternational;formerly,ManagerandAnalyst,FidelityInvestments,BostonandLondonoffices(to2015)
SridharNishtala(1975)VicePresident
VicePresident,PriceSingaporeandT.RowePriceGroup,Inc.
JasonNogueira,CFA(1974)ExecutiveVicePresident
VicePresident,T.RowePriceandT.RowePriceGroup,Inc.
DavidOestreicher(1967)VicePresident
Director,VicePresident,andSecretary,T.RowePriceInvestmentServices,Inc.,T.RowePriceRetirementPlanServices,Inc.,T.RowePriceServices,Inc.,andT.RowePriceTrustCompany;ChiefLegalOfficer,VicePresident,andSecretary,T.RowePriceGroup,Inc.;VicePresidentandSecretary,T.RowePriceandT.RowePriceInternational;VicePresident,PriceHongKongandPriceSingapore
KennethA.Orchard(1975)ExecutiveVicePresident
VicePresident,T.RowePriceGroup,Inc.,andT.RowePriceInternational
CurtJ.Organt,CFA(1968)VicePresident
VicePresident,T.RowePriceandT.RowePriceGroup,Inc.
PaulT.O’Sullivan(1973)VicePresident
VicePresident,T.RowePriceGroup,Inc.,andT.RowePriceInternational
OluwaseunA.Oyegunle,CFA(1984)VicePresident
VicePresident,T.RowePriceGroup,Inc.,andT.RowePriceInternational;formerly,student,TheWhartonSchool,UniversityofPennsylvania(to2013)
Unlessotherwisenoted,officershavebeenemployeesofT.RowePriceorT.RowePriceInternationalforatleast5years.
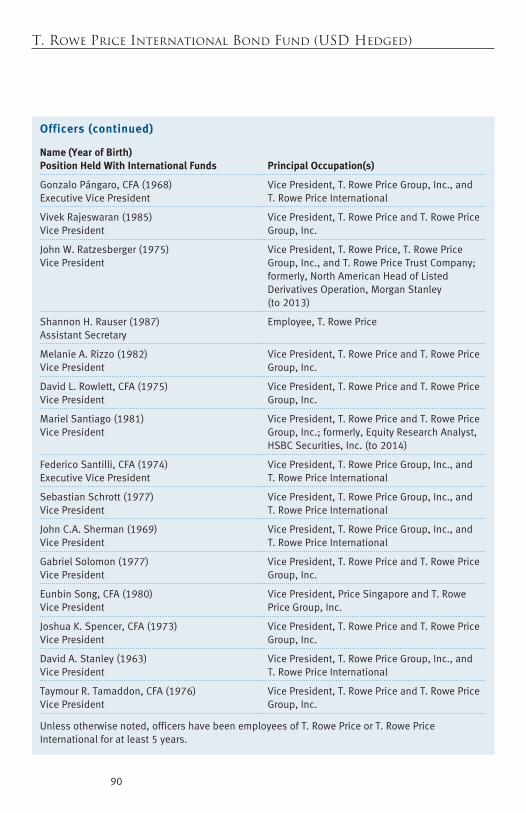
90
T. Rowe Price International Bond Fund (USD Hedged)
Officers (continued)
Name (Year of Birth)Position Held With International Funds Principal Occupation(s)
GonzaloPángaro,CFA(1968)ExecutiveVicePresident
VicePresident,T.RowePriceGroup,Inc.,andT.RowePriceInternational
VivekRajeswaran(1985)VicePresident
VicePresident,T.RowePriceandT.RowePriceGroup,Inc.
JohnW.Ratzesberger(1975)VicePresident
VicePresident,T.RowePrice,T.RowePriceGroup,Inc.,andT.RowePriceTrustCompany;formerly,NorthAmericanHeadofListedDerivativesOperation,MorganStanley(to2013)
ShannonH.Rauser(1987)AssistantSecretary
Employee,T.RowePrice
MelanieA.Rizzo(1982)VicePresident
VicePresident,T.RowePriceandT.RowePriceGroup,Inc.
DavidL.Rowlett,CFA(1975)VicePresident
VicePresident,T.RowePriceandT.RowePriceGroup,Inc.
MarielSantiago(1981)VicePresident
VicePresident,T.RowePriceandT.RowePriceGroup,Inc.;formerly,EquityResearchAnalyst,HSBCSecurities,Inc.(to2014)
FedericoSantilli,CFA(1974)ExecutiveVicePresident
VicePresident,T.RowePriceGroup,Inc.,andT.RowePriceInternational
SebastianSchrott(1977)VicePresident
VicePresident,T.RowePriceGroup,Inc.,andT.RowePriceInternational
JohnC.A.Sherman(1969)VicePresident
VicePresident,T.RowePriceGroup,Inc.,andT.RowePriceInternational
GabrielSolomon(1977)VicePresident
VicePresident,T.RowePriceandT.RowePriceGroup,Inc.
EunbinSong,CFA(1980)VicePresident
VicePresident,PriceSingaporeandT.RowePriceGroup,Inc.
JoshuaK.Spencer,CFA(1973)VicePresident
VicePresident,T.RowePriceandT.RowePriceGroup,Inc.
DavidA.Stanley(1963)VicePresident
VicePresident,T.RowePriceGroup,Inc.,andT.RowePriceInternational
TaymourR.Tamaddon,CFA(1976)VicePresident
VicePresident,T.RowePriceandT.RowePriceGroup,Inc.
Unlessotherwisenoted,officershavebeenemployeesofT.RowePriceorT.RowePriceInternationalforatleast5years.

91
T. Rowe Price International Bond Fund (USD Hedged)
Officers (continued)
Name (Year of Birth)Position Held With International Funds Principal Occupation(s)
JuYenTan(1972)VicePresident
VicePresident,T.RowePriceGroup,Inc.,andT.RowePriceInternational
SinDeeTan,CFA(1979)VicePresident
VicePresident,T.RowePriceGroup,Inc.,andT.RowePriceInternational
DeanTenerelli(1964)ExecutiveVicePresident
VicePresident,T.RowePriceGroup,Inc.,andT.RowePriceInternational
SibyThomas(1979)VicePresident
VicePresident,T.RowePriceandT.RowePriceGroup,Inc.
JustinThomson(1968)ExecutiveVicePresident
VicePresident,T.RowePriceGroup,Inc.,andT.RowePriceInternational
MitchellJ.K.Todd(1974)VicePresident
VicePresident,T.RowePriceGroup,Inc.,andT.RowePriceInternational
MarkJ.Vaselkiv(1958)ExecutiveVicePresident
VicePresident,T.RowePrice,T.RowePriceGroup,Inc.,andT.RowePriceTrustCompany
RupinderVig(1979)VicePresident
VicePresident,T.RowePriceGroup,Inc.,andT.RowePriceInternational;formerly,Partner,EgertonCapital(to2016);ExecutiveDirector,MorganStanley(to2014)
KesVisuvalingam,CFA(1968)VicePresident
Director,ResponsibleOfficer,andVicePresident,PriceHongKong;Director,ChiefExecutiveOfficer,andVicePresident,PriceSingapore;VicePresident,T.RowePriceGroup,Inc.
VerenaE.Wachnitz,CFA(1978)ExecutiveVicePresident
VicePresident,T.RowePriceGroup,Inc.,andT.RowePriceInternational
DavidJ.Wallack(1960)VicePresident
VicePresident,T.RowePrice,T.RowePriceGroup,Inc.,andT.RowePriceTrustCompany
DaiWang(1989)VicePresident
VicePresident,PriceHongKongandT.RowePriceGroup,Inc.;formerly,student,HarvardBusinessSchool(to2014)
MeganWarren(1968)VicePresident
VicePresident,T.RowePrice,T.RowePriceGroup,Inc.,T.RowePriceRetirementPlanServices,Inc.,T.RowePriceServices,Inc.,andT.RowePriceTrustCompany;formerly,ExecutiveDirector,JPMorganChase(to2017)
Unlessotherwisenoted,officershavebeenemployeesofT.RowePriceorT.RowePriceInternationalforatleast5years.
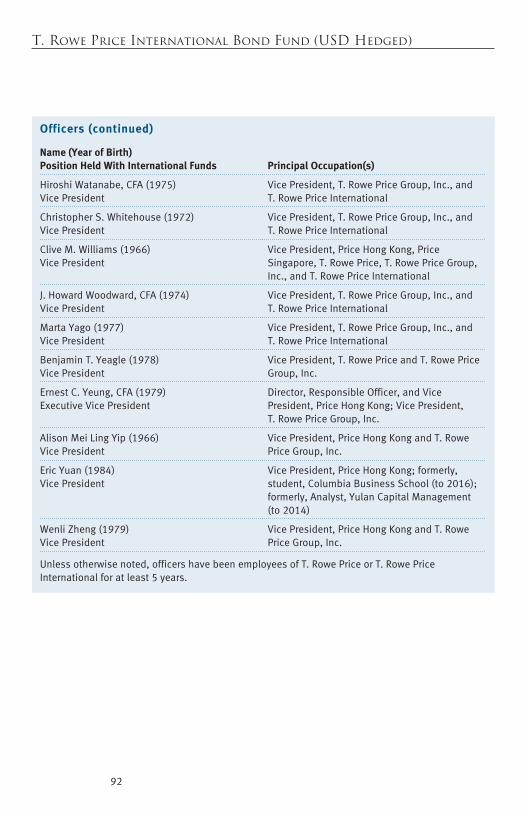
92
T. Rowe Price International Bond Fund (USD Hedged)
Officers (continued)
Name (Year of Birth)Position Held With International Funds Principal Occupation(s)
HiroshiWatanabe,CFA(1975)VicePresident
VicePresident,T.RowePriceGroup,Inc.,andT.RowePriceInternational
ChristopherS.Whitehouse(1972)VicePresident
VicePresident,T.RowePriceGroup,Inc.,andT.RowePriceInternational
CliveM.Williams(1966)VicePresident
VicePresident,PriceHongKong,PriceSingapore,T.RowePrice,T.RowePriceGroup,Inc.,andT.RowePriceInternational
J.HowardWoodward,CFA(1974)VicePresident
VicePresident,T.RowePriceGroup,Inc.,andT.RowePriceInternational
MartaYago(1977)VicePresident
VicePresident,T.RowePriceGroup,Inc.,andT.RowePriceInternational
BenjaminT.Yeagle(1978)VicePresident
VicePresident,T.RowePriceandT.RowePriceGroup,Inc.
ErnestC.Yeung,CFA(1979)ExecutiveVicePresident
Director,ResponsibleOfficer,andVicePresident,PriceHongKong;VicePresident,T.RowePriceGroup,Inc.
AlisonMeiLingYip(1966)VicePresident
VicePresident,PriceHongKongandT.RowePriceGroup,Inc.
EricYuan(1984)VicePresident
VicePresident,PriceHongKong;formerly,student,ColumbiaBusinessSchool(to2016);formerly,Analyst,YulanCapitalManagement(to2014)
WenliZheng(1979)VicePresident
VicePresident,PriceHongKongandT.RowePriceGroup,Inc.
Unlessotherwisenoted,officershavebeenemployeesofT.RowePriceorT.RowePriceInternationalforatleast5years.

This page intentionally left blank.
F1114-050 2/18
STOCK FUNDSDomestic Blue Chip GrowthCapital Appreciation‡
Capital OpportunityDiversified Mid-Cap GrowthDividend GrowthEquity IncomeEquity Index 500Extended Equity Market IndexFinancial ServicesGrowth & IncomeGrowth StockHealth Sciences‡
Media & TelecommunicationsMid-Cap Growth‡
Mid-Cap Value‡
New America GrowthNew EraNew Horizons‡
QM U.S. Small & Mid-Cap Core EquityQM U.S. Small-Cap Growth EquityQM U.S. Value EquityReal EstateScience & TechnologySmall-Cap Stock‡
Small-Cap ValueTax-Efficient Equity Total Equity Market IndexU.S. Large-Cap CoreValue
ASSET ALLOCATION FUNDSBalanced Global AllocationPersonal Strategy BalancedPersonal Strategy GrowthPersonal Strategy IncomeReal AssetsSpectrum GrowthSpectrum IncomeSpectrum InternationalTarget Date Fundsˆ
BOND FUNDSDomestic TaxableCorporate IncomeCredit OpportunitiesFloating RateGNMA High Yield‡
Inflation Protected BondLimited Duration Inflation
Focused BondNew IncomeShort-Term BondTotal ReturnUltra Short-Term BondU.S. Bond Enhanced IndexU.S. High YieldU.S. Treasury IntermediateU.S. Treasury Long-Term
Domestic Tax-FreeCalifornia Tax-Free BondGeorgia Tax-Free BondIntermediate Tax-Free High YieldMaryland Short-Term Tax-Free BondMaryland Tax-Free BondNew Jersey Tax-Free BondNew York Tax-Free BondSummit Municipal IncomeSummit Municipal IntermediateTax-Free High YieldTax-Free IncomeTax-Free Short-IntermediateVirginia Tax-Free Bond
MONEY MARKET FUNDSTaxableCash Reserves1
Government Money2
U.S. Treasury Money2
MONEY MARKET FUNDS (cont.)Tax-FreeCalifornia Tax-Free Money1
Maryland Tax-Free Money1
New York Tax-Free Money1
Summit Municipal Money Market1
Tax-Exempt Money1
INTERNATIONAL/GLOBAL FUNDSStockAfrica & Middle EastAsia OpportunitiesEmerging EuropeEmerging Markets StockEmerging Markets Value StockEuropean Stock Global ConsumerGlobal Growth StockGlobal IndustrialsGlobal Real EstateGlobal StockGlobal Technology‡
International Concentrated EquityInternational DiscoveryInternational Equity IndexInternational StockInternational Value EquityJapanLatin AmericaNew AsiaOverseas StockQM Global Equity
BondDynamic Global BondEmerging Markets BondEmerging Markets Corporate BondEmerging Markets Local Currency BondGlobal High Income BondGlobal Multi-Sector BondInternational BondInternational Bond (USD Hedged)
T.RowePriceInvestmentServices,Inc.100EastPrattStreetBaltimore,MD21202
Thispagecontainssupplementaryinformationthatisnotpartoftheshareholderreport.
T. Rowe Price Mutual Funds
201802-367197
Call 1-800-225-5132 to request a prospectus or summary prospectus; each includes investment objectives, risks, fees, expenses, and other information that you should read and consider carefully before investing. ‡Subjecttocertainexceptions,thefundiscurrentlyclosedtonewinvestorsandnewaccounts.
ˆTheTargetDateFundsareinclusiveoftheRetirementFunds,theTargetFunds,andtheRetirementBalancedFund.
1 Retail Funds: You could lose money by investing in the Fund. Although the Fund seeks to preserve the value of your investment at $1.00 per share, it cannot guarantee it will do so. Beginning October 14, 2016, the Fund may impose a fee upon the sale of your shares or may temporarily suspend your ability to sell shares if the Fund’s liquidity falls below required minimums because of market conditions or other factors. An investment in the Fund is not insured or guaranteed by the Federal Deposit Insurance Corporation or any other government agency. The Fund’s sponsor has no legal obligation to provide financial support to the Fund, and you should not expect that the sponsor will provide financial support to the Fund at any time.
2 Government Funds: You could lose money by investing in the Fund. Although the Fund seeks to preserve the value of your investment at $1.00 per share, it cannot guarantee it will do so. An investment in the Fund is not insured or guaranteed by the Federal Deposit Insurance Corporation or any other government agency. The Fund’s sponsor has no legal obligation to provide financial support to the Fund, and you should not expect that the sponsor will provide financial support to the Fund at any time.