Embed Size (px)
Citation preview
1616 P Street, NW Suite 200 • Washington, DC 20036 www.itep.org • 202.299.1066
December 2017
The Final Trump-GOP Tax Bill: National & 50-State Analysis
(State-by-State Figures in Appendix)
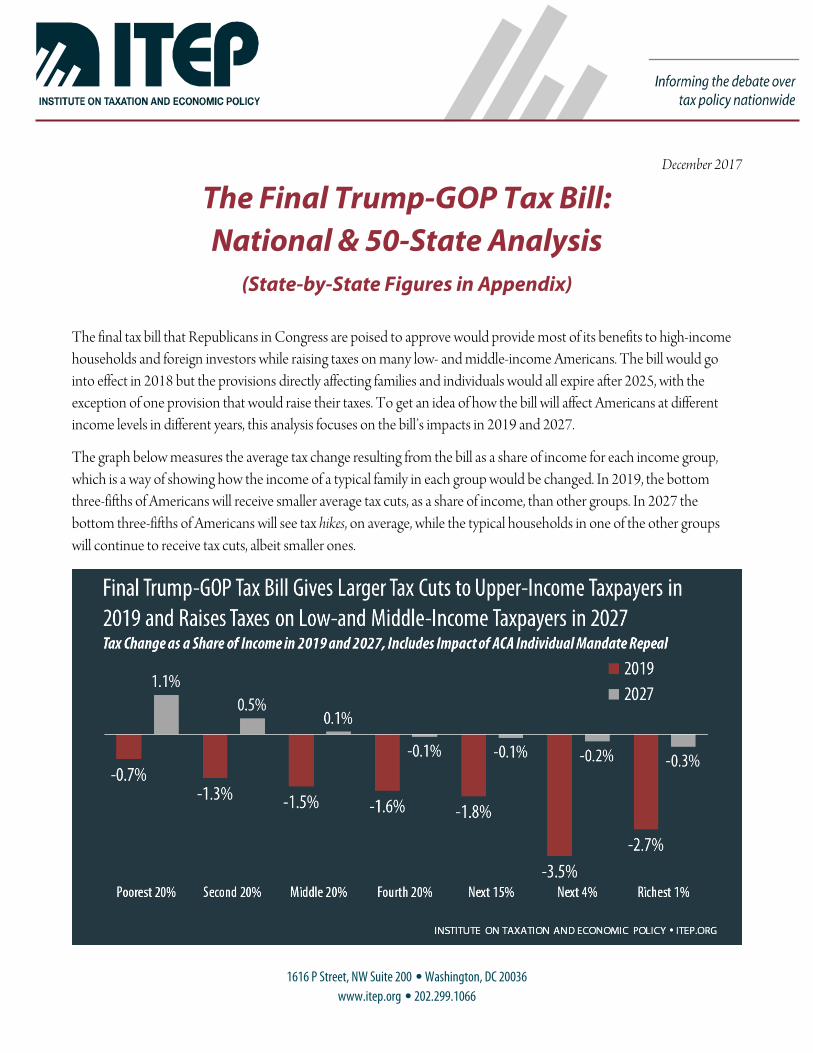
The final tax bill that Republicans in Congress are poised to approve would provide most of its benefits to high-income households and foreign investors while raising taxes on many low- and middle-income Americans. The bill would go into effect in 2018 but the provisions directly affecting families and individuals would all expire after 2025, with the exception of one provision that would raise their taxes. To get an idea of how the bill will affect Americans at different income levels in different years, this analysis focuses on the bill’s impacts in 2019 and 2027.
The graph below measures the average tax change resulting from the bill as a share of income for each income group, which is a way of showing how the income of a typical family in each group would be changed. In 2019, the bottom three-fifths of Americans will receive smaller average tax cuts, as a share of income, than other groups. In 2027 the bottom three-fifths of Americans will see tax hikes, on average, while the typical households in one of the other groups will continue to receive tax cuts, albeit smaller ones.
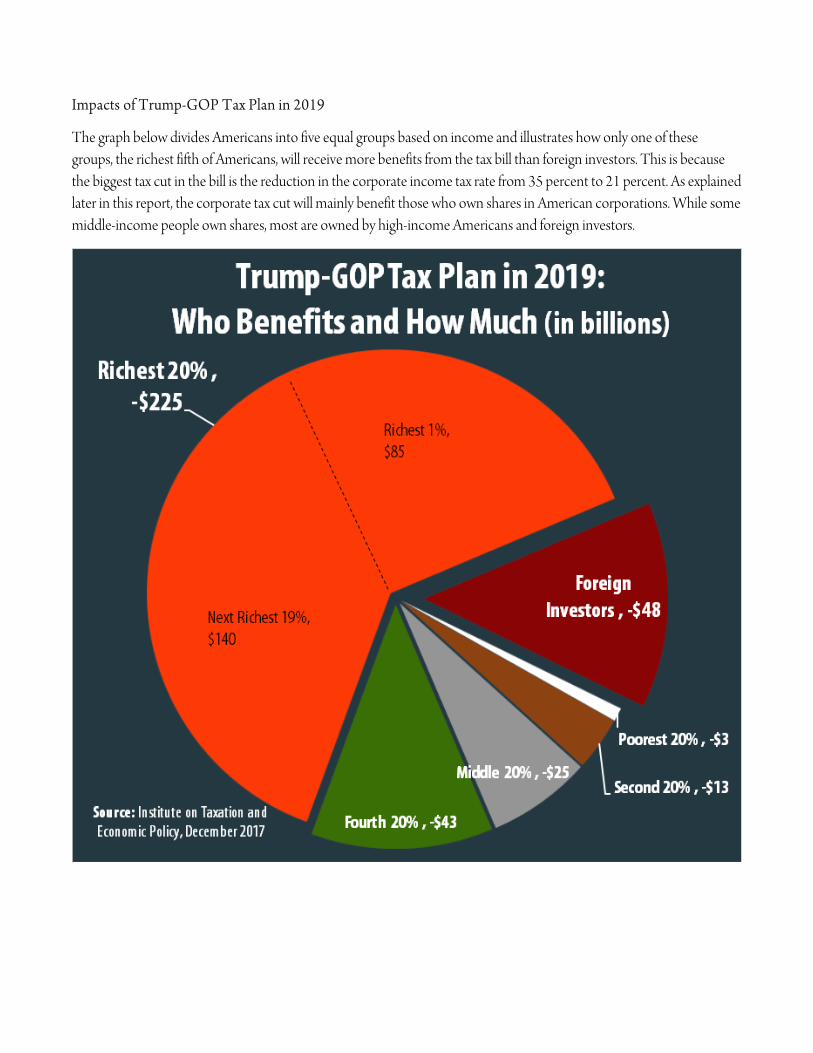
Impacts of Trump-GOP Tax Plan in 2019
The graph below divides Americans into five equal groups based on income and illustrates how only one of these groups, the richest fifth of Americans, will receive more benefits from the tax bill than foreign investors. This is because the biggest tax cut in the bill is the reduction in the corporate income tax rate from 35 percent to 21 percent. As explained later in this report, the corporate tax cut will mainly benefit those who own shares in American corporations. While some middle-income people own shares, most are owned by high-income Americans and foreign investors.
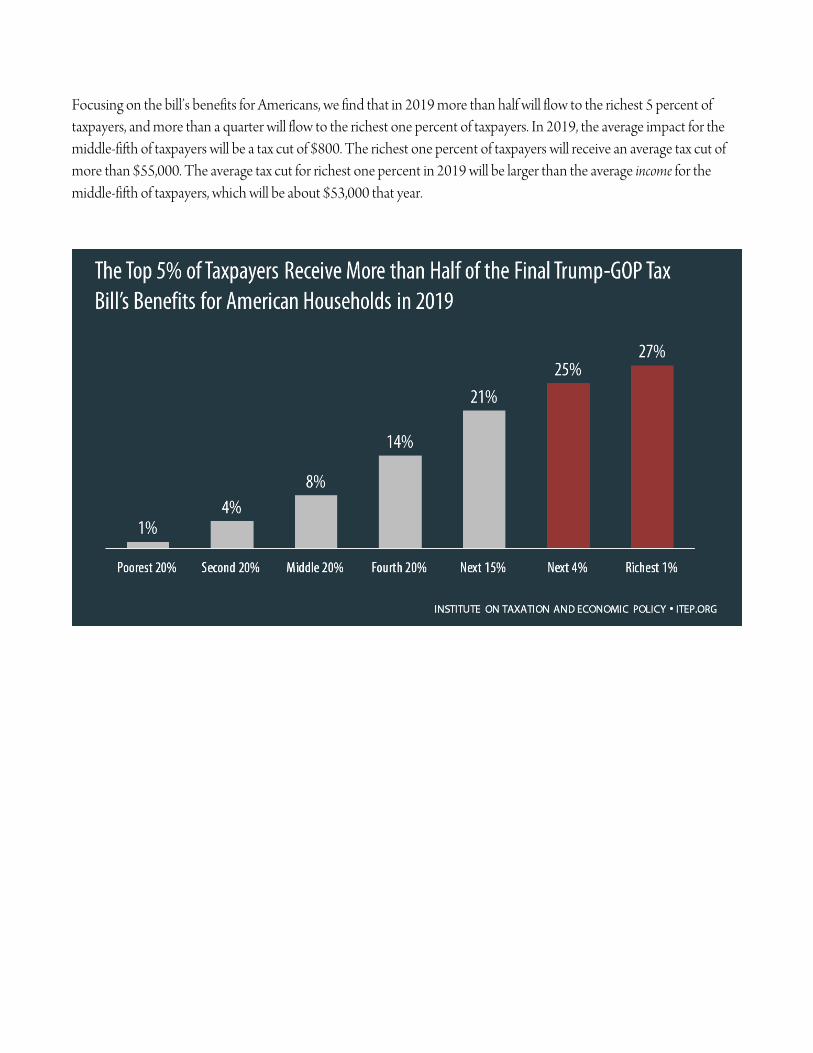
Focusing on the bill’s benefits for Americans, we find that in 2019 more than half will flow to the richest 5 percent of taxpayers, and more than a quarter will flow to the richest one percent of taxpayers. In 2019, the average impact for the middle-fifth of taxpayers will be a tax cut of $800. The richest one percent of taxpayers will receive an average tax cut of more than $55,000. The average tax cut for richest one percent in 2019 will be larger than the average income for the middle-fifth of taxpayers, which will be about $53,000 that year.
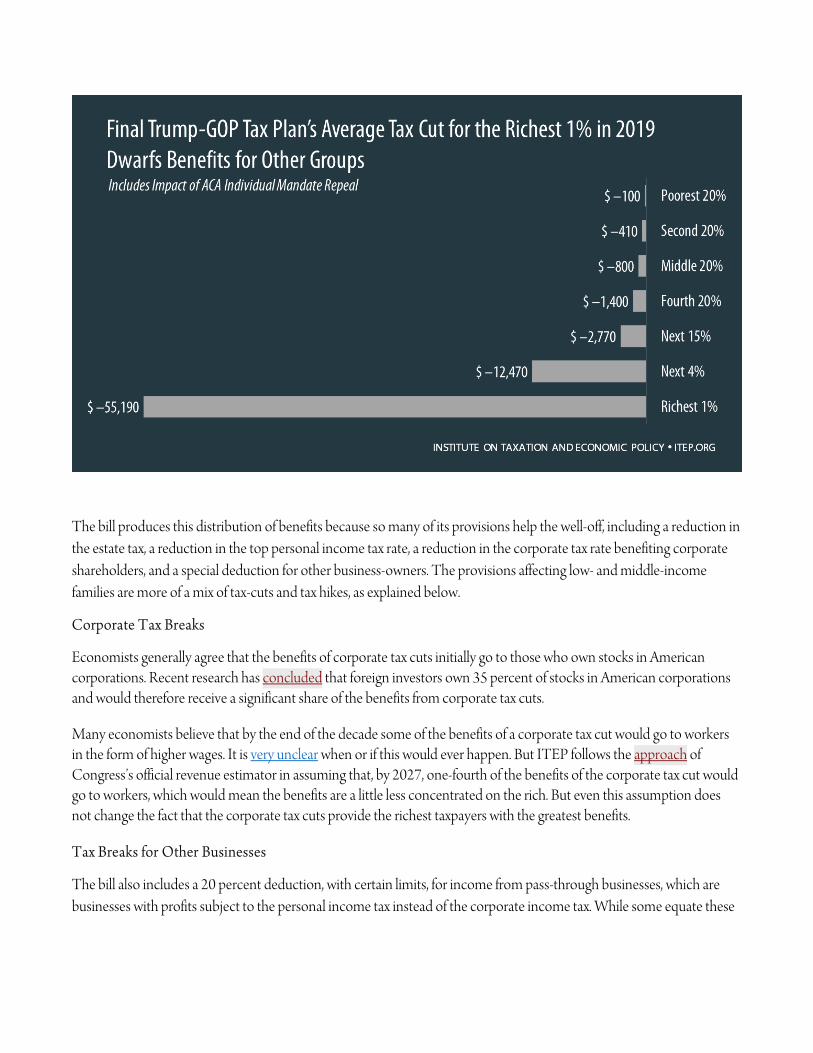
The bill produces this distribution of benefits because so many of its provisions help the well-off, including a reduction in the estate tax, a reduction in the top personal income tax rate, a reduction in the corporate tax rate benefiting corporate shareholders, and a special deduction for other business-owners. The provisions affecting low- and middle-income families are more of a mix of tax-cuts and tax hikes, as explained below.
Corporate Tax Breaks
Economists generally agree that the benefits of corporate tax cuts initially go to those who own stocks in American corporations. Recent research has concluded that foreign investors own 35 percent of stocks in American corporations and would therefore receive a significant share of the benefits from corporate tax cuts.
Many economists believe that by the end of the decade some of the benefits of a corporate tax cut would go to workers in the form of higher wages. It is very unclear when or if this would ever happen. But ITEP follows the approach of Congress’s official revenue estimator in assuming that, by 2027, one-fourth of the benefits of the corporate tax cut would go to workers, which would mean the benefits are a little less concentrated on the rich. But even this assumption does not change the fact that the corporate tax cuts provide the richest taxpayers with the greatest benefits.
Tax Breaks for Other Businesses
The bill also includes a 20 percent deduction, with certain limits, for income from pass-through businesses, which are businesses with profits subject to the personal income tax instead of the corporate income tax. While some equate these
enterprises with “small businesses,” they include law firms, hedge funds and many enormous companies. Most pass-through income flows to the richest one percent of Americans.
Estate Tax Breaks
Another break that favors the wealthy is the bill’s provision to double the amount of assets that can be left to heirs without triggering the estate tax from $11 million for a married couple to $22 million. Under current law only 0.2 percent of estates are taxed, which means reducing the estate tax can only benefit the very wealthiest families.
Repeal of Health Insurance Mandate
The bill would repeal the existing requirement for individuals to obtain health insurance. The figures in this report incorporate the estimates of the Congressional Budget Office on how this change would affect taxes. The existing penalty tax that is imposed on those who do not obtain health insurance will be eliminated, which will reduce taxes for some. But a larger group of people will pay higher taxes because when they go without health insurance, they will no longer collect the tax credits that help them pay premiums under the Affordable Care Act.
Provisions for Families and Individuals
The tax changes that affect families and individuals most directly, the provisions that most families think of as affecting their bottom line, are a mixed bag for low- and middle-income people. Some of these provisions would cut their taxes, like the increase in the standard deduction and child tax credit. Others would raise their taxes, like the repeal of the personal exemption that taxpayers can claim for each member of their family and the new $10,000 limit on the deduction for state and local taxes. Some high-income taxpayers would face tax hikes because of the limit on state and local tax deductions, but others would benefit more from the reduction in the top personal income tax rate from 39.6 percent to 37 percent, as well as other breaks in the bill.
The table below splits the tax changes into the components described here: provisions for families and individuals, the estate tax provisions, the repeal of the health insurance mandate, provisions for pass-through businesses and corporate provisions.
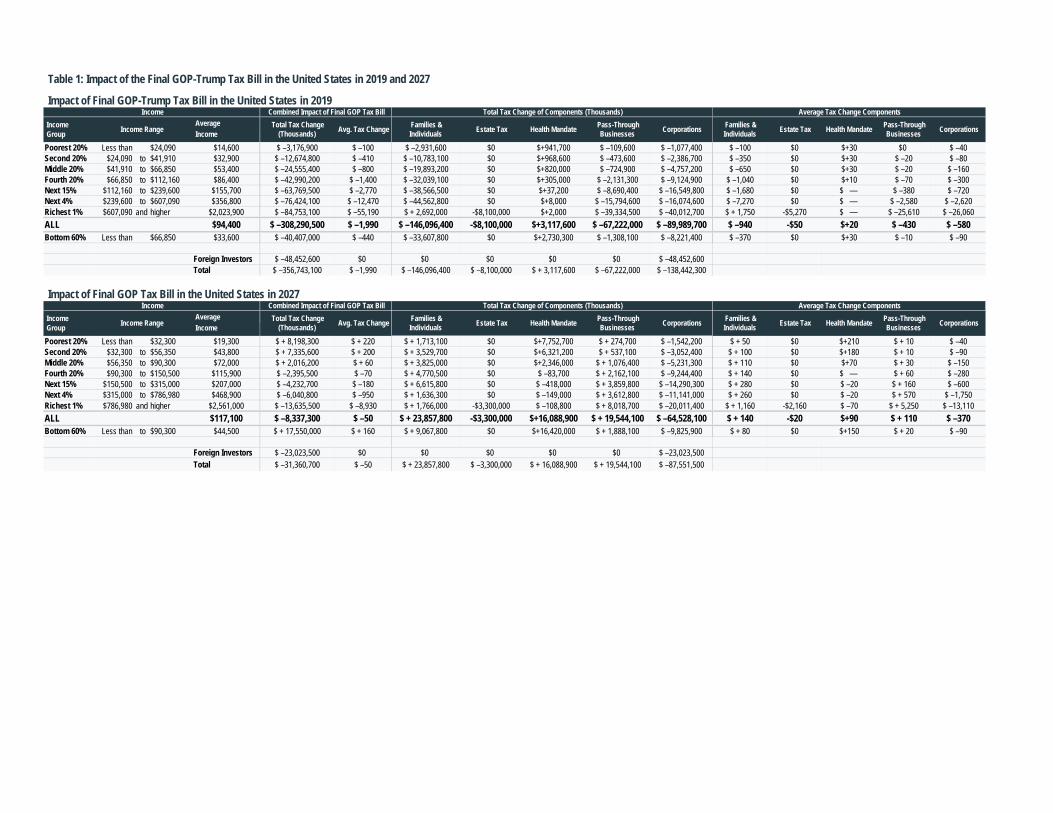
Table 1: Impact of the Final GOP-Trump Tax Bill in the United States in 2019 and 2027
Impact of Final GOP-Trump Tax Bill in the United States in 2019
Income AverageGroup Income
Poorest 20% Less than $24,090 $14,600 $ –3,176,900 $ –100 $ –2,931,600 $0 $+941,700 $ –109,600 $ –1,077,400 $ –100 $0 $+30 $0 $ –40Second 20% $24,090 to $41,910 $32,900 $ –12,674,800 $ –410 $ –10,783,100 $0 $+968,600 $ –473,600 $ –2,386,700 $ –350 $0 $+30 $ –20 $ –80Middle 20% $41,910 to $66,850 $53,400 $ –24,555,400 $ –800 $ –19,893,200 $0 $+820,000 $ –724,900 $ –4,757,200 $ –650 $0 $+30 $ –20 $ –160Fourth 20% $66,850 to $112,160 $86,400 $ –42,990,200 $ –1,400 $ –32,039,100 $0 $+305,000 $ –2,131,300 $ –9,124,900 $ –1,040 $0 $+10 $ –70 $ –300Next 15% $112,160 to $239,600 $155,700 $ –63,769,500 $ –2,770 $ –38,566,500 $0 $+37,200 $ –8,690,400 $ –16,549,800 $ –1,680 $0 $ — $ –380 $ –720Next 4% $239,600 to $607,090 $356,800 $ –76,424,100 $ –12,470 $ –44,562,800 $0 $+8,000 $ –15,794,600 $ –16,074,600 $ –7,270 $0 $ — $ –2,580 $ –2,620Richest 1% $607,090 and higher $2,023,900 $ –84,753,100 $ –55,190 $ + 2,692,000 -$8,100,000 $+2,000 $ –39,334,500 $ –40,012,700 $ + 1,750 -$5,270 $ — $ –25,610 $ –26,060ALL $94,400 $ –308,290,500 $ –1,990 $ –146,096,400 -$8,100,000 $+3,117,600 $ –67,222,000 $ –89,989,700 $ –940 -$50 $+20 $ –430 $ –580Bottom 60% Less than $66,850 $33,600 $ –40,407,000 $ –440 $ –33,607,800 $0 $+2,730,300 $ –1,308,100 $ –8,221,400 $ –370 $0 $+30 $ –10 $ –90
Foreign Investors $ –48,452,600 $0 $0 $0 $0 $0 $ –48,452,600Total $ –356,743,100 $ –1,990 $ –146,096,400 $ –8,100,000 $ + 3,117,600 $ –67,222,000 $ –138,442,300
Impact of Final GOP Tax Bill in the United States in 2027
Income AverageGroup Income
Poorest 20% Less than $32,300 $19,300 $ + 8,198,300 $ + 220 $ + 1,713,100 $0 $+7,752,700 $ + 274,700 $ –1,542,200 $ + 50 $0 $+210 $ + 10 $ –40Second 20% $32,300 to $56,350 $43,800 $ + 7,335,600 $ + 200 $ + 3,529,700 $0 $+6,321,200 $ + 537,100 $ –3,052,400 $ + 100 $0 $+180 $ + 10 $ –90Middle 20% $56,350 to $90,300 $72,000 $ + 2,016,200 $ + 60 $ + 3,825,000 $0 $+2,346,000 $ + 1,076,400 $ –5,231,300 $ + 110 $0 $+70 $ + 30 $ –150Fourth 20% $90,300 to $150,500 $115,900 $ –2,395,500 $ –70 $ + 4,770,500 $0 $ –83,700 $ + 2,162,100 $ –9,244,400 $ + 140 $0 $ — $ + 60 $ –280Next 15% $150,500 to $315,000 $207,000 $ –4,232,700 $ –180 $ + 6,615,800 $0 $ –418,000 $ + 3,859,800 $ –14,290,300 $ + 280 $0 $ –20 $ + 160 $ –600Next 4% $315,000 to $786,980 $468,900 $ –6,040,800 $ –950 $ + 1,636,300 $0 $ –149,000 $ + 3,612,800 $ –11,141,000 $ + 260 $0 $ –20 $ + 570 $ –1,750Richest 1% $786,980 and higher $2,561,000 $ –13,635,500 $ –8,930 $ + 1,766,000 -$3,300,000 $ –108,800 $ + 8,018,700 $ –20,011,400 $ + 1,160 -$2,160 $ –70 $ + 5,250 $ –13,110ALL $117,100 $ –8,337,300 $ –50 $ + 23,857,800 -$3,300,000 $+16,088,900 $ + 19,544,100 $ –64,528,100 $ + 140 -$20 $+90 $ + 110 $ –370Bottom 60% Less than to $90,300 $44,500 $ + 17,550,000 $ + 160 $ + 9,067,800 $0 $+16,420,000 $ + 1,888,100 $ –9,825,900 $ + 80 $0 $+150 $ + 20 $ –90
Foreign Investors $ –23,023,500 $0 $0 $0 $0 $0 $ –23,023,500Total $ –31,360,700 $ –50 $ + 23,857,800 $ –3,300,000 $ + 16,088,900 $ + 19,544,100 $ –87,551,500
Income Combined Impact of Final GOP Tax Bill Total Tax Change of Components (Thousands) Average Tax Change Components
Income Range Total Tax Change (Thousands) Avg. Tax Change Families &
Individuals Estate Tax Health Mandate Pass-Through Businesses Corporations Families &
Individuals Estate Tax Health Mandate
Income Combined Impact of Final GOP Tax Bill Total Tax Change of Components (Thousands) Average Tax Change Components
Pass-Through Businesses Corporations
Income Range Total Tax Change (Thousands) Avg. Tax Change Families &
Individuals Estate Tax Health Mandate Pass-Through Businesses Corporations Families &
Individuals Estate Tax Health Mandate Pass-Through Businesses Corporations
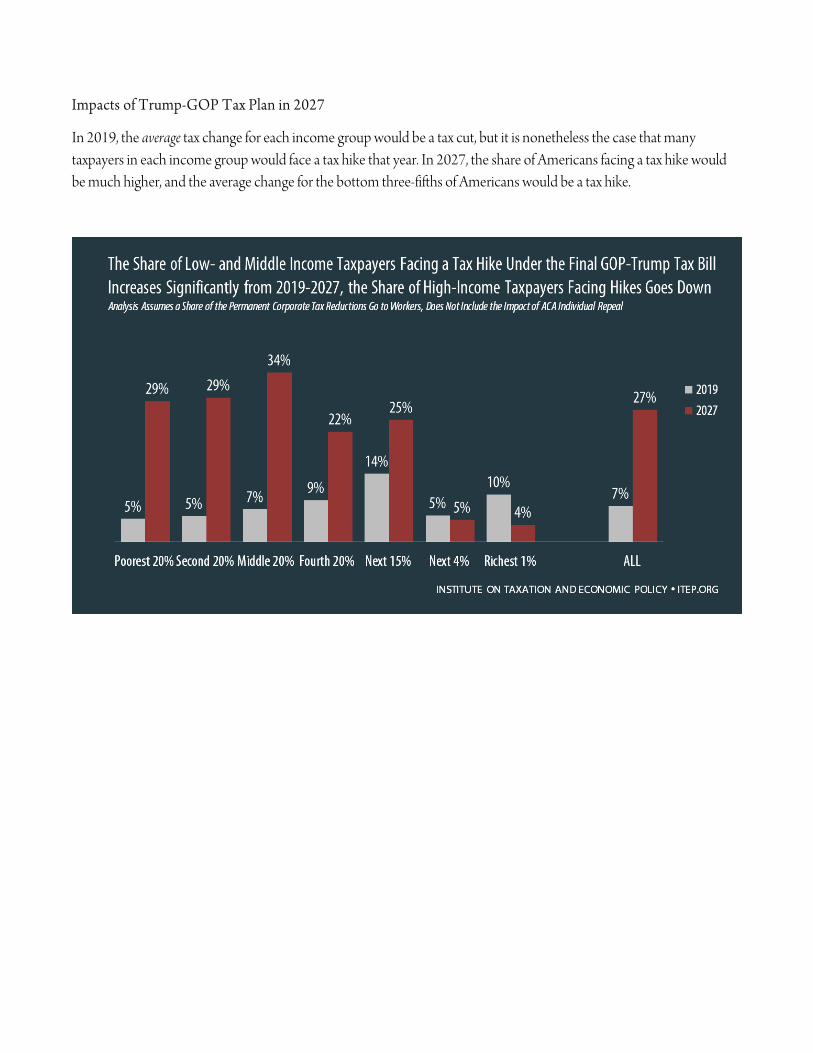
Impacts of Trump-GOP Tax Plan in 2027
In 2019, the average tax change for each income group would be a tax cut, but it is nonetheless the case that many taxpayers in each income group would face a tax hike that year. In 2027, the share of Americans facing a tax hike would be much higher, and the average change for the bottom three-fifths of Americans would be a tax hike.
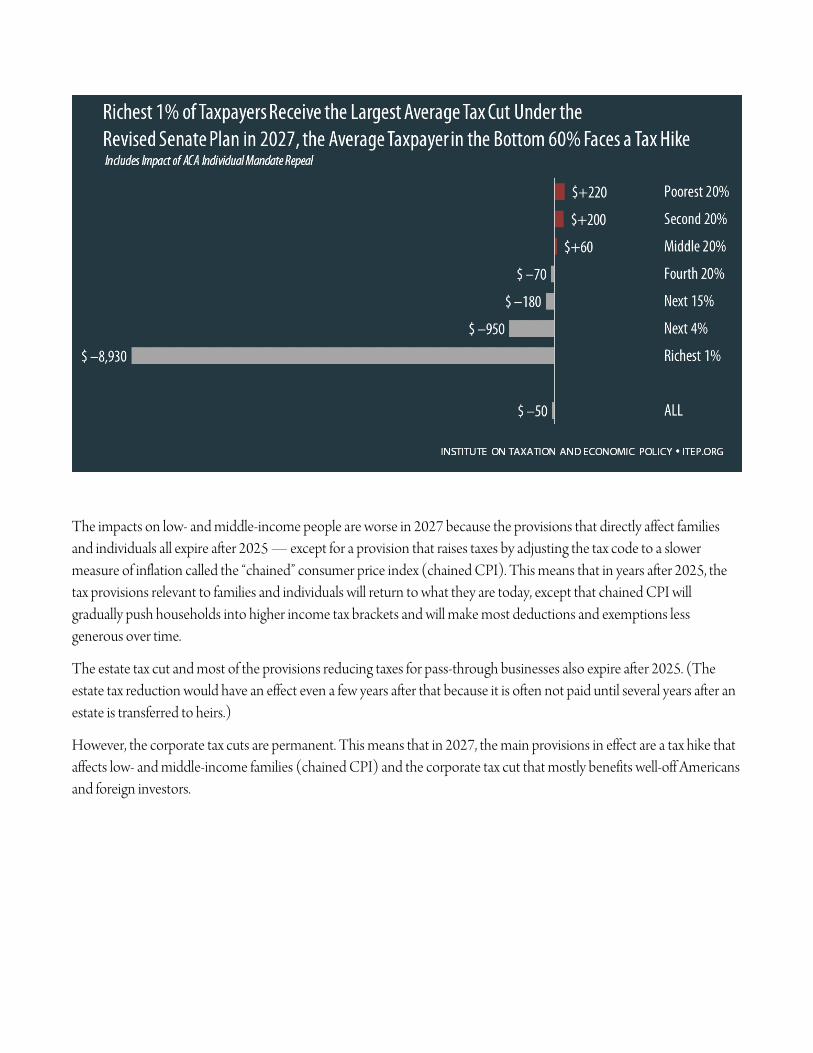
The impacts on low- and middle-income people are worse in 2027 because the provisions that directly affect families and individuals all expire after 2025 — except for a provision that raises taxes by adjusting the tax code to a slower measure of inflation called the “chained” consumer price index (chained CPI). This means that in years after 2025, the tax provisions relevant to families and individuals will return to what they are today, except that chained CPI will gradually push households into higher income tax brackets and will make most deductions and exemptions less generous over time.
The estate tax cut and most of the provisions reducing taxes for pass-through businesses also expire after 2025. (The estate tax reduction would have an effect even a few years after that because it is often not paid until several years after an estate is transferred to heirs.)
However, the corporate tax cuts are permanent. This means that in 2027, the main provisions in effect are a tax hike that affects low- and middle-income families (chained CPI) and the corporate tax cut that mostly benefits well-off Americans and foreign investors.

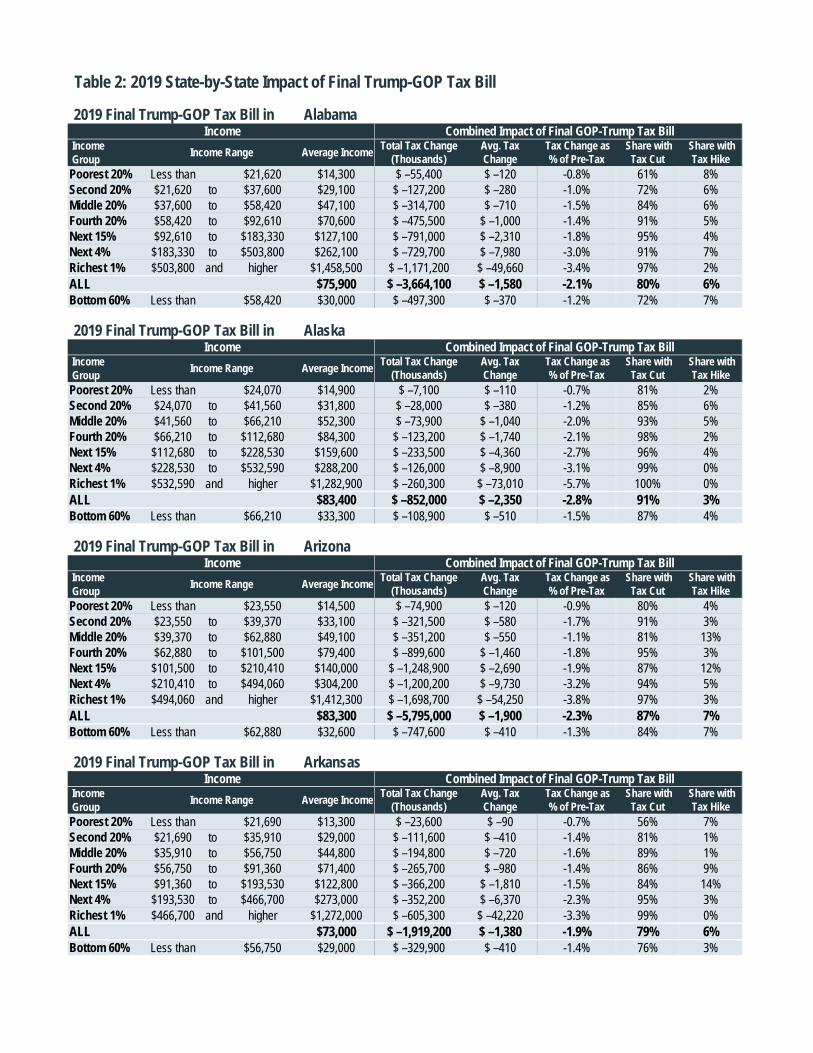
Table 2: 2019 State-by-State Impact of Final Trump-GOP Tax Bill
2019 Final Trump-GOP Tax Bill in Alabama
IncomeGroupPoorest 20% Less than $21,620 $14,300 $ –55,400 $ –120 -0.8% 61% 8%Second 20% $21,620 to $37,600 $29,100 $ –127,200 $ –280 -1.0% 72% 6%Middle 20% $37,600 to $58,420 $47,100 $ –314,700 $ –710 -1.5% 84% 6%Fourth 20% $58,420 to $92,610 $70,600 $ –475,500 $ –1,000 -1.4% 91% 5%Next 15% $92,610 to $183,330 $127,100 $ –791,000 $ –2,310 -1.8% 95% 4%Next 4% $183,330 to $503,800 $262,100 $ –729,700 $ –7,980 -3.0% 91% 7%Richest 1% $503,800 and higher $1,458,500 $ –1,171,200 $ –49,660 -3.4% 97% 2%ALL $75,900 $ –3,664,100 $ –1,580 -2.1% 80% 6%Bottom 60% Less than $58,420 $30,000 $ –497,300 $ –370 -1.2% 72% 7%
2019 Final Trump-GOP Tax Bill in Alaska
IncomeGroupPoorest 20% Less than $24,070 $14,900 $ –7,100 $ –110 -0.7% 81% 2%Second 20% $24,070 to $41,560 $31,800 $ –28,000 $ –380 -1.2% 85% 6%Middle 20% $41,560 to $66,210 $52,300 $ –73,900 $ –1,040 -2.0% 93% 5%Fourth 20% $66,210 to $112,680 $84,300 $ –123,200 $ –1,740 -2.1% 98% 2%Next 15% $112,680 to $228,530 $159,600 $ –233,500 $ –4,360 -2.7% 96% 4%Next 4% $228,530 to $532,590 $288,200 $ –126,000 $ –8,900 -3.1% 99% 0%Richest 1% $532,590 and higher $1,282,900 $ –260,300 $ –73,010 -5.7% 100% 0%ALL $83,400 $ –852,000 $ –2,350 -2.8% 91% 3%Bottom 60% Less than $66,210 $33,300 $ –108,900 $ –510 -1.5% 87% 4%
2019 Final Trump-GOP Tax Bill in Arizona
IncomeGroupPoorest 20% Less than $23,550 $14,500 $ –74,900 $ –120 -0.9% 80% 4%Second 20% $23,550 to $39,370 $33,100 $ –321,500 $ –580 -1.7% 91% 3%Middle 20% $39,370 to $62,880 $49,100 $ –351,200 $ –550 -1.1% 81% 13%Fourth 20% $62,880 to $101,500 $79,400 $ –899,600 $ –1,460 -1.8% 95% 3%Next 15% $101,500 to $210,410 $140,000 $ –1,248,900 $ –2,690 -1.9% 87% 12%Next 4% $210,410 to $494,060 $304,200 $ –1,200,200 $ –9,730 -3.2% 94% 5%Richest 1% $494,060 and higher $1,412,300 $ –1,698,700 $ –54,250 -3.8% 97% 3%ALL $83,300 $ –5,795,000 $ –1,900 -2.3% 87% 7%Bottom 60% Less than $62,880 $32,600 $ –747,600 $ –410 -1.3% 84% 7%
2019 Final Trump-GOP Tax Bill in Arkansas
IncomeGroupPoorest 20% Less than $21,690 $13,300 $ –23,600 $ –90 -0.7% 56% 7%Second 20% $21,690 to $35,910 $29,000 $ –111,600 $ –410 -1.4% 81% 1%Middle 20% $35,910 to $56,750 $44,800 $ –194,800 $ –720 -1.6% 89% 1%Fourth 20% $56,750 to $91,360 $71,400 $ –265,700 $ –980 -1.4% 86% 9%Next 15% $91,360 to $193,530 $122,800 $ –366,200 $ –1,810 -1.5% 84% 14%Next 4% $193,530 to $466,700 $273,000 $ –352,200 $ –6,370 -2.3% 95% 3%Richest 1% $466,700 and higher $1,272,000 $ –605,300 $ –42,220 -3.3% 99% 0%ALL $73,000 $ –1,919,200 $ –1,380 -1.9% 79% 6%Bottom 60% Less than $56,750 $29,000 $ –329,900 $ –410 -1.4% 76% 3%
Tax Change as % of Pre-Tax
Avg. Tax Change
Tax Change as % of Pre-Tax
Share with Tax Cut
Share with Tax Hike Income Range Average Income Total Tax Change
(Thousands) Avg. Tax Change
Total Tax Change (Thousands)
Avg. Tax Change
Tax Change as % of Pre-Tax
Income Combined Impact of Final GOP-Trump Tax Bill
Share with Tax Cut
Share with Tax Hike Income Range Average Income Total Tax Change
(Thousands)
Average Income Total Tax Change (Thousands)
Avg. Tax Change
Tax Change as % of Pre-Tax
Income Combined Impact of Final GOP-Trump Tax Bill
Share with Tax Cut
Share with Tax Hike Income Range Average Income
Income Combined Impact of Final GOP-Trump Tax Bill
Income Combined Impact of Final GOP-Trump Tax Bill
Share with Tax Cut
Share with Tax Hike Income Range
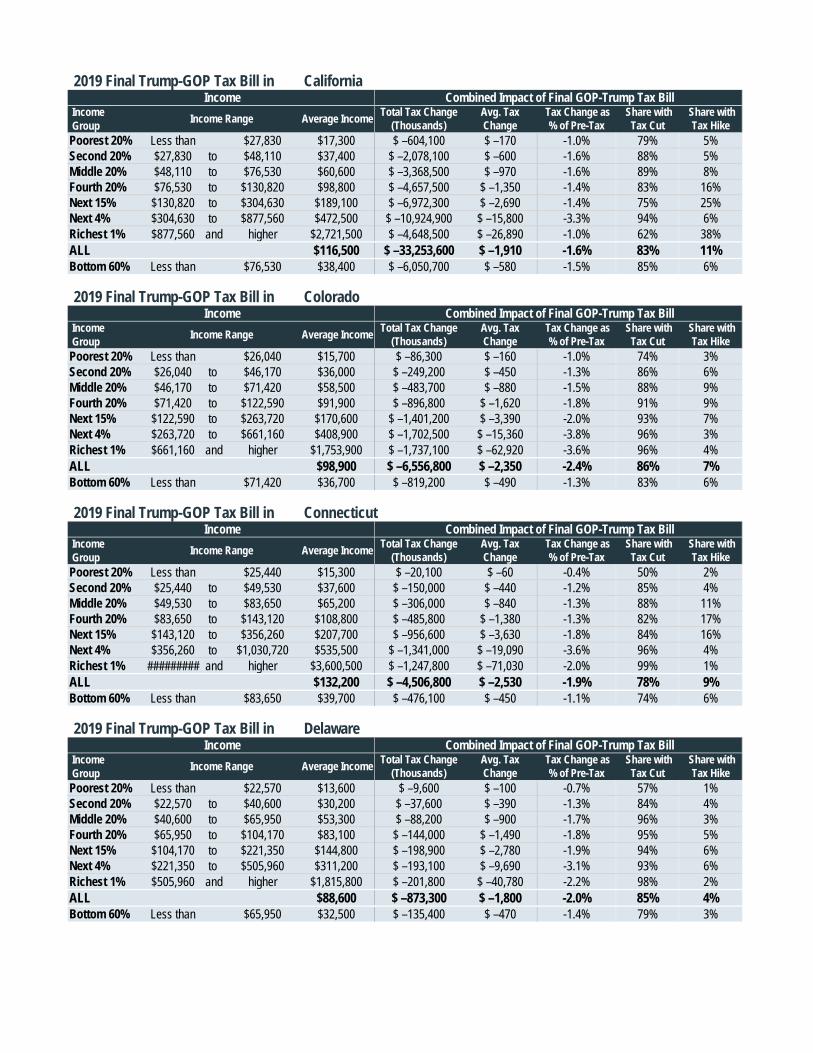
2019 Final Trump-GOP Tax Bill in California
IncomeGroupPoorest 20% Less than $27,830 $17,300 $ –604,100 $ –170 -1.0% 79% 5%Second 20% $27,830 to $48,110 $37,400 $ –2,078,100 $ –600 -1.6% 88% 5%Middle 20% $48,110 to $76,530 $60,600 $ –3,368,500 $ –970 -1.6% 89% 8%Fourth 20% $76,530 to $130,820 $98,800 $ –4,657,500 $ –1,350 -1.4% 83% 16%Next 15% $130,820 to $304,630 $189,100 $ –6,972,300 $ –2,690 -1.4% 75% 25%Next 4% $304,630 to $877,560 $472,500 $ –10,924,900 $ –15,800 -3.3% 94% 6%Richest 1% $877,560 and higher $2,721,500 $ –4,648,500 $ –26,890 -1.0% 62% 38%ALL $116,500 $ –33,253,600 $ –1,910 -1.6% 83% 11%Bottom 60% Less than $76,530 $38,400 $ –6,050,700 $ –580 -1.5% 85% 6%
2019 Final Trump-GOP Tax Bill in Colorado
IncomeGroupPoorest 20% Less than $26,040 $15,700 $ –86,300 $ –160 -1.0% 74% 3%Second 20% $26,040 to $46,170 $36,000 $ –249,200 $ –450 -1.3% 86% 6%Middle 20% $46,170 to $71,420 $58,500 $ –483,700 $ –880 -1.5% 88% 9%Fourth 20% $71,420 to $122,590 $91,900 $ –896,800 $ –1,620 -1.8% 91% 9%Next 15% $122,590 to $263,720 $170,600 $ –1,401,200 $ –3,390 -2.0% 93% 7%Next 4% $263,720 to $661,160 $408,900 $ –1,702,500 $ –15,360 -3.8% 96% 3%Richest 1% $661,160 and higher $1,753,900 $ –1,737,100 $ –62,920 -3.6% 96% 4%ALL $98,900 $ –6,556,800 $ –2,350 -2.4% 86% 7%Bottom 60% Less than $71,420 $36,700 $ –819,200 $ –490 -1.3% 83% 6%
2019 Final Trump-GOP Tax Bill in Connecticut
IncomeGroupPoorest 20% Less than $25,440 $15,300 $ –20,100 $ –60 -0.4% 50% 2%Second 20% $25,440 to $49,530 $37,600 $ –150,000 $ –440 -1.2% 85% 4%Middle 20% $49,530 to $83,650 $65,200 $ –306,000 $ –840 -1.3% 88% 11%Fourth 20% $83,650 to $143,120 $108,800 $ –485,800 $ –1,380 -1.3% 82% 17%Next 15% $143,120 to $356,260 $207,700 $ –956,600 $ –3,630 -1.8% 84% 16%Next 4% $356,260 to $1,030,720 $535,500 $ –1,341,000 $ –19,090 -3.6% 96% 4%Richest 1% ######### and higher $3,600,500 $ –1,247,800 $ –71,030 -2.0% 99% 1%ALL $132,200 $ –4,506,800 $ –2,530 -1.9% 78% 9%Bottom 60% Less than $83,650 $39,700 $ –476,100 $ –450 -1.1% 74% 6%
2019 Final Trump-GOP Tax Bill in Delaware
IncomeGroupPoorest 20% Less than $22,570 $13,600 $ –9,600 $ –100 -0.7% 57% 1%Second 20% $22,570 to $40,600 $30,200 $ –37,600 $ –390 -1.3% 84% 4%Middle 20% $40,600 to $65,950 $53,300 $ –88,200 $ –900 -1.7% 96% 3%Fourth 20% $65,950 to $104,170 $83,100 $ –144,000 $ –1,490 -1.8% 95% 5%Next 15% $104,170 to $221,350 $144,800 $ –198,900 $ –2,780 -1.9% 94% 6%Next 4% $221,350 to $505,960 $311,200 $ –193,100 $ –9,690 -3.1% 93% 6%Richest 1% $505,960 and higher $1,815,800 $ –201,800 $ –40,780 -2.2% 98% 2%ALL $88,600 $ –873,300 $ –1,800 -2.0% 85% 4%Bottom 60% Less than $65,950 $32,500 $ –135,400 $ –470 -1.4% 79% 3%
Share with Tax Cut
Share with Tax Hike Income Range Average Income Total Tax Change
(Thousands) Avg. Tax Change
Tax Change as % of Pre-Tax
Income Combined Impact of Final GOP-Trump Tax Bill
Share with Tax Cut
Share with Tax Hike Income Range Average Income Total Tax Change
(Thousands) Avg. Tax Change
Tax Change as % of Pre-Tax
Tax Change as % of Pre-Tax
Income Combined Impact of Final GOP-Trump Tax Bill
Share with Tax Cut
Share with Tax Hike Income Range Average Income Total Tax Change
(Thousands) Avg. Tax Change
Tax Change as % of Pre-Tax
Income Combined Impact of Final GOP-Trump Tax Bill
Share with Tax Cut
Share with Tax Hike Income Range Average Income Total Tax Change
(Thousands) Avg. Tax Change
Income Combined Impact of Final GOP-Trump Tax Bill

2019 Final Trump-GOP Tax Bill in District of Columbia
IncomeGroupPoorest 20% Less than $28,960 $13,700 $ –8,500 $ –120 -0.8% 79% 7%Second 20% $28,960 to $49,900 $38,600 $ –53,000 $ –730 -1.9% 88% 9%Middle 20% $49,900 to $79,400 $63,200 $ –53,500 $ –730 -1.2% 83% 15%Fourth 20% $79,400 to $135,180 $101,900 $ –87,600 $ –1,200 -1.2% 83% 17%Next 15% $135,180 to $347,520 $206,400 $ –156,600 $ –2,850 -1.4% 84% 15%Next 4% $347,520 to $1,111,620 $549,900 $ –265,900 $ –18,220 -3.3% 91% 8%Richest 1% ######### and higher $3,261,600 $ –298,600 $ –81,240 -2.5% 93% 1%ALL $128,300 $ –923,800 $ –2,510 -2.0% 84% 12%Bottom 60% Less than $79,400 $38,600 $ –115,100 $ –530 -1.4% 83% 11%
2019 Final Trump-GOP Tax Bill in Florida
IncomeGroupPoorest 20% Less than $21,440 $14,000 $ –164,300 $ –80 -0.5% 72% 4%Second 20% $21,440 to $35,500 $28,200 $ –654,900 $ –300 -1.1% 86% 5%Middle 20% $35,500 to $56,970 $44,700 $ –1,271,300 $ –590 -1.3% 90% 5%Fourth 20% $56,970 to $97,370 $74,300 $ –2,614,800 $ –1,210 -1.6% 92% 6%Next 15% $97,370 to $228,720 $141,900 $ –5,198,300 $ –3,220 -2.3% 93% 6%Next 4% $228,720 to $682,090 $359,800 $ –6,097,700 $ –14,190 -3.9% 98% 2%Richest 1% $682,090 and higher $3,076,700 $ –10,662,600 $ –98,480 -3.2% 98% 2%ALL $98,100 $ –26,661,200 $ –2,460 -2.5% 87% 5%Bottom 60% Less than $56,970 $29,000 $ –2,090,500 $ –320 -1.1% 83% 5%
2019 Final Trump-GOP Tax Bill in Georgia
IncomeGroupPoorest 20% Less than $23,520 $15,000 $ –120,300 $ –130 -0.9% 70% 7%Second 20% $23,520 to $39,770 $31,300 $ –347,900 $ –370 -1.2% 83% 6%Middle 20% $39,770 to $61,590 $48,000 $ –568,300 $ –610 -1.3% 85% 10%Fourth 20% $61,590 to $103,320 $78,500 $ –1,008,600 $ –1,070 -1.4% 87% 10%Next 15% $103,320 to $230,980 $146,400 $ –1,701,000 $ –2,410 -1.6% 87% 12%Next 4% $230,980 to $557,860 $340,700 $ –2,075,900 $ –11,020 -3.2% 94% 6%Richest 1% $557,860 and higher $2,055,400 $ –3,041,200 $ –64,620 -3.1% 97% 3%ALL $90,000 $ –8,862,600 $ –1,870 -2.1% 82% 9%Bottom 60% Less than $61,590 $31,400 $ –1,036,500 $ –370 -1.2% 79% 8%
2019 Final Trump-GOP Tax Bill in Hawaii
IncomeGroupPoorest 20% Less than $26,620 $14,200 $ –17,700 $ –130 -0.9% 67% 5%Second 20% $26,620 to $44,590 $33,500 $ –57,900 $ –420 -1.2% 86% 6%Middle 20% $44,590 to $66,980 $53,600 $ –125,400 $ –870 -1.6% 89% 7%Fourth 20% $66,980 to $115,540 $88,300 $ –237,200 $ –1,680 -1.9% 91% 8%Next 15% $115,540 to $230,060 $154,000 $ –308,400 $ –2,880 -1.9% 88% 12%Next 4% $230,060 to $554,230 $336,700 $ –273,400 $ –9,630 -2.9% 90% 10%Richest 1% $554,230 and higher $1,397,500 $ –280,100 $ –39,420 -2.8% 97% 3%ALL $87,900 $ –1,300,200 $ –1,820 -2.1% 84% 7%Bottom 60% Less than $66,980 $33,900 $ –201,000 $ –470 -1.4% 80% 6%
Share with Tax Cut
Share with Tax Hike Income Range Average Income Total Tax Change
(Thousands) Avg. Tax Change
Tax Change as % of Pre-Tax
Income Combined Impact of Final GOP-Trump Tax Bill
Share with Tax Cut
Share with Tax Hike Income Range Average Income Total Tax Change
(Thousands) Avg. Tax Change
Tax Change as % of Pre-Tax
Income Combined Impact of Final GOP-Trump Tax Bill
Share with Tax Cut
Share with Tax Hike Income Range Average Income Total Tax Change
(Thousands) Avg. Tax Change
Tax Change as % of Pre-Tax
Income Combined Impact of Final GOP-Trump Tax Bill
Share with Tax Cut
Share with Tax Hike Income Range Average Income Total Tax Change
(Thousands) Avg. Tax Change
Tax Change as % of Pre-Tax
Income Combined Impact of Final GOP-Trump Tax Bill

2019 Final Trump-GOP Tax Bill in Idaho
IncomeGroupPoorest 20% Less than $21,910 $12,000 $ –15,700 $ –110 -0.9% 61% 7%Second 20% $21,910 to $40,440 $29,600 $ –50,700 $ –320 -1.1% 84% 4%Middle 20% $40,440 to $63,230 $49,900 $ –116,800 $ –690 -1.4% 88% 6%Fourth 20% $63,230 to $94,400 $77,400 $ –196,600 $ –1,260 -1.6% 93% 6%Next 15% $94,400 to $182,550 $125,400 $ –278,700 $ –2,380 -1.9% 92% 8%Next 4% $182,550 to $484,120 $274,500 $ –261,700 $ –8,350 -3.0% 93% 7%Richest 1% $484,120 and higher $1,493,800 $ –374,200 $ –48,220 -3.2% 96% 3%ALL $78,700 $ –1,294,400 $ –1,650 -2.1% 84% 6%Bottom 60% Less than $63,230 $31,600 $ –183,200 $ –390 -1.2% 78% 6%
2019 Final Trump-GOP Tax Bill in Illinois
IncomeGroupPoorest 20% Less than $26,880 $15,800 $ –193,000 $ –160 -1.0% 72% 3%Second 20% $26,880 to $46,230 $36,100 $ –607,700 $ –520 -1.4% 87% 5%Middle 20% $46,230 to $73,810 $59,700 $ –1,087,700 $ –930 -1.6% 88% 9%Fourth 20% $73,810 to $123,200 $94,900 $ –1,910,500 $ –1,630 -1.7% 92% 7%Next 15% $123,200 to $262,750 $172,100 $ –2,616,100 $ –2,970 -1.7% 86% 14%Next 4% $262,750 to $672,640 $405,700 $ –3,192,400 $ –13,610 -3.4% 96% 4%Richest 1% $672,640 and higher $2,822,600 $ –3,433,900 $ –58,750 -2.1% 99% 1%ALL $110,800 $ –13,041,800 $ –2,210 -2.0% 85% 7%Bottom 60% Less than $73,810 $37,200 $ –1,888,400 $ –540 -1.4% 82% 6%
2019 Final Trump-GOP Tax Bill in Indiana
IncomeGroupPoorest 20% Less than $24,730 $14,700 $ –71,000 $ –110 -0.8% 74% 5%Second 20% $24,730 to $44,050 $35,300 $ –269,800 $ –430 -1.2% 86% 5%Middle 20% $44,050 to $67,170 $54,900 $ –524,600 $ –840 -1.5% 95% 2%Fourth 20% $67,170 to $105,420 $83,700 $ –936,300 $ –1,500 -1.8% 95% 4%Next 15% $105,420 to $204,090 $141,500 $ –1,317,400 $ –2,820 -2.0% 93% 7%Next 4% $204,090 to $518,040 $291,200 $ –1,235,500 $ –9,860 -3.4% 95% 4%Richest 1% $518,040 and higher $1,616,600 $ –1,532,800 $ –48,840 -3.0% 99% 1%ALL $86,200 $ –5,887,200 $ –1,870 -2.2% 88% 4%Bottom 60% Less than $67,170 $35,000 $ –865,400 $ –460 -1.3% 85% 4%
2019 Final Trump-GOP Tax Bill in Iowa
IncomeGroupPoorest 20% Less than $26,290 $14,600 $ –33,500 $ –110 -0.8% 70% 2%Second 20% $26,290 to $46,760 $37,300 $ –148,200 $ –490 -1.3% 92% 2%Middle 20% $46,760 to $70,350 $58,200 $ –261,700 $ –870 -1.5% 90% 7%Fourth 20% $70,350 to $114,730 $89,600 $ –460,100 $ –1,530 -1.7% 93% 5%Next 15% $114,730 to $194,770 $141,100 $ –518,000 $ –2,320 -1.6% 92% 7%Next 4% $194,770 to $475,120 $275,300 $ –469,300 $ –7,630 -2.8% 93% 7%Richest 1% $475,120 and higher $1,223,700 $ –646,500 $ –43,060 -3.5% 99% 1%ALL $83,900 $ –2,537,400 $ –1,680 -2.0% 88% 5%Bottom 60% Less than $70,350 $36,800 $ –443,400 $ –490 -1.3% 84% 4%
Share with Tax Cut
Share with Tax Hike Income Range Average Income Total Tax Change
(Thousands) Avg. Tax Change
Tax Change as % of Pre-Tax
Income Combined Impact of Final GOP-Trump Tax Bill
Share with Tax Cut
Share with Tax Hike Income Range Average Income Total Tax Change
(Thousands) Avg. Tax Change
Tax Change as % of Pre-Tax
Income Combined Impact of Final GOP-Trump Tax Bill
Share with Tax Cut
Share with Tax Hike Income Range Average Income Total Tax Change
(Thousands) Avg. Tax Change
Tax Change as % of Pre-Tax
Income Combined Impact of Final GOP-Trump Tax Bill
Share with Tax Cut
Share with Tax Hike Income Range Average Income Total Tax Change
(Thousands) Avg. Tax Change
Tax Change as % of Pre-Tax
Income Combined Impact of Final GOP-Trump Tax Bill

2019 Final Trump-GOP Tax Bill in Kansas
IncomeGroupPoorest 20% Less than $26,250 $14,700 $ –19,300 $ –70 -0.5% 58% 6%Second 20% $26,250 to $45,170 $36,400 $ –126,000 $ –470 -1.3% 90% 4%Middle 20% $45,170 to $70,960 $57,400 $ –260,900 $ –970 -1.7% 94% 4%Fourth 20% $70,960 to $113,640 $88,700 $ –438,600 $ –1,640 -1.8% 97% 2%Next 15% $113,640 to $211,760 $149,900 $ –601,700 $ –3,000 -2.0% 92% 7%Next 4% $211,760 to $531,850 $316,800 $ –634,600 $ –11,840 -3.7% 96% 4%Richest 1% $531,850 and higher $1,815,900 $ –802,600 $ –60,150 -3.3% 98% 1%ALL $92,300 $ –2,883,800 $ –2,140 -2.3% 86% 4%Bottom 60% Less than $70,960 $36,200 $ –406,200 $ –510 -1.4% 80% 5%
2019 Final Trump-GOP Tax Bill in Kentucky
IncomeGroupPoorest 20% Less than $21,190 $12,100 $ –38,400 $ –90 -0.8% 62% 4%Second 20% $21,190 to $37,570 $29,000 $ –139,600 $ –340 -1.2% 79% 4%Middle 20% $37,570 to $56,160 $46,500 $ –260,500 $ –630 -1.4% 86% 7%Fourth 20% $56,160 to $94,350 $73,200 $ –472,800 $ –1,150 -1.6% 92% 5%Next 15% $94,350 to $180,210 $124,100 $ –629,900 $ –2,050 -1.6% 90% 10%Next 4% $180,210 to $449,200 $255,600 $ –665,100 $ –7,970 -3.1% 91% 9%Richest 1% $449,200 and higher $1,274,800 $ –781,200 $ –37,870 -3.0% 94% 5%ALL $73,000 $ –2,987,600 $ –1,440 -2.0% 81% 6%Bottom 60% Less than $56,160 $29,200 $ –438,500 $ –350 -1.2% 75% 5%
2019 Final Trump-GOP Tax Bill in Louisiana
IncomeGroupPoorest 20% Less than $19,370 $12,200 $ –34,000 $ –80 -0.7% 58% 11%Second 20% $19,370 to $37,010 $27,900 $ –124,400 $ –310 -1.1% 81% 4%Middle 20% $37,010 to $56,260 $46,900 $ –256,800 $ –610 -1.3% 91% 4%Fourth 20% $56,260 to $92,600 $71,000 $ –453,400 $ –1,060 -1.5% 83% 14%Next 15% $92,600 to $192,520 $129,400 $ –787,300 $ –2,530 -2.0% 94% 6%Next 4% $192,520 to $489,060 $271,400 $ –727,500 $ –8,440 -3.1% 95% 5%Richest 1% $489,060 and higher $1,184,000 $ –1,142,300 $ –54,230 -4.6% 97% 3%ALL $72,900 $ –3,525,100 $ –1,660 -2.3% 81% 8%Bottom 60% Less than $56,260 $29,100 $ –415,200 $ –330 -1.1% 76% 6%
2019 Final Trump-GOP Tax Bill in Maine
IncomeGroupPoorest 20% Less than $24,390 $14,100 $ –9,400 $ –70 -0.5% 60% 15%Second 20% $24,390 to $41,650 $32,900 $ –48,800 $ –360 -1.1% 74% 4%Middle 20% $41,650 to $64,580 $52,000 $ –91,600 $ –670 -1.3% 83% 9%Fourth 20% $64,580 to $106,240 $82,100 $ –177,000 $ –1,300 -1.6% 90% 6%Next 15% $106,240 to $198,470 $137,600 $ –269,200 $ –2,650 -1.9% 91% 8%Next 4% $198,470 to $506,560 $286,600 $ –222,400 $ –8,160 -2.8% 91% 8%Richest 1% $506,560 and higher $1,273,100 $ –220,600 $ –31,900 -2.5% 98% 2%ALL $80,500 $ –1,038,800 $ –1,510 -1.9% 80% 8%Bottom 60% Less than $64,580 $33,000 $ –149,900 $ –370 -1.1% 73% 9%
Share with Tax Cut
Share with Tax Hike Income Range Average Income Total Tax Change
(Thousands) Avg. Tax Change
Tax Change as % of Pre-Tax
Income Combined Impact of Final GOP-Trump Tax Bill
Share with Tax Cut
Share with Tax Hike Income Range Average Income Total Tax Change
(Thousands) Avg. Tax Change
Tax Change as % of Pre-Tax
Income Combined Impact of Final GOP-Trump Tax Bill
Share with Tax Cut
Share with Tax Hike Income Range Average Income Total Tax Change
(Thousands) Avg. Tax Change
Tax Change as % of Pre-Tax
Income Combined Impact of Final GOP-Trump Tax Bill
Share with Tax Cut
Share with Tax Hike Income Range Average Income Total Tax Change
(Thousands) Avg. Tax Change
Tax Change as % of Pre-Tax
Income Combined Impact of Final GOP-Trump Tax Bill

2019 Final Trump-GOP Tax Bill in Maryland
IncomeGroupPoorest 20% Less than $28,070 $15,200 $ –77,300 $ –130 -0.9% 72% 2%Second 20% $28,070 to $50,520 $38,400 $ –290,600 $ –490 -1.3% 82% 13%Middle 20% $50,520 to $76,590 $61,800 $ –462,600 $ –770 -1.3% 88% 11%Fourth 20% $76,590 to $131,540 $100,900 $ –762,900 $ –1,290 -1.3% 83% 16%Next 15% $131,540 to $265,790 $183,700 $ –985,600 $ –2,190 -1.2% 76% 24%Next 4% $265,790 to $676,760 $400,100 $ –1,608,800 $ –13,450 -3.4% 94% 6%Richest 1% $676,760 and higher $1,874,700 $ –1,540,600 $ –52,360 -2.8% 99% 1%ALL $104,700 $ –5,728,300 $ –1,910 -1.8% 81% 12%Bottom 60% Less than $76,590 $38,500 $ –830,400 $ –460 -1.2% 80% 9%
2019 Final Trump-GOP Tax Bill in Massachusetts
IncomeGroupPoorest 20% Less than $26,060 $15,800 $ –62,900 $ –90 -0.6% 59% 2%Second 20% $26,060 to $48,770 $36,600 $ –342,000 $ –490 -1.3% 88% 2%Middle 20% $48,770 to $83,450 $64,600 $ –763,800 $ –1,090 -1.7% 90% 8%Fourth 20% $83,450 to $143,650 $109,100 $ –1,221,300 $ –1,750 -1.6% 91% 9%Next 15% $143,650 to $332,600 $204,100 $ –1,821,000 $ –3,480 -1.7% 88% 11%Next 4% $332,600 to $808,270 $495,100 $ –2,503,600 $ –17,860 -3.6% 96% 4%Richest 1% $808,270 and higher $3,010,400 $ –2,960,200 $ –84,720 -2.8% 99% 1%ALL $124,500 $ –9,674,900 $ –2,750 -2.2% 83% 6%Bottom 60% Less than $83,450 $39,000 $ –1,168,700 $ –560 -1.4% 79% 4%
2019 Final Trump-GOP Tax Bill in Michigan
IncomeGroupPoorest 20% Less than $23,560 $13,800 $ –84,000 $ –90 -0.6% 65% 3%Second 20% $23,560 to $43,890 $33,400 $ –378,100 $ –400 -1.2% 85% 4%Middle 20% $43,890 to $68,950 $55,000 $ –750,200 $ –790 -1.4% 88% 6%Fourth 20% $68,950 to $111,100 $86,700 $ –1,437,300 $ –1,520 -1.8% 93% 5%Next 15% $111,100 to $218,870 $150,400 $ –1,819,400 $ –2,560 -1.7% 88% 9%Next 4% $218,870 to $516,650 $319,300 $ –1,923,300 $ –10,160 -3.2% 96% 4%Richest 1% $516,650 and higher $1,636,000 $ –2,728,100 $ –57,700 -3.5% 98% 1%ALL $88,000 $ –9,120,200 $ –1,890 -2.2% 84% 5%Bottom 60% Less than $68,950 $34,100 $ –1,212,300 $ –430 -1.3% 79% 4%
2019 Final Trump-GOP Tax Bill in Minnesota
IncomeGroupPoorest 20% Less than $29,880 $16,200 $ –76,000 $ –140 -0.9% 70% 4%Second 20% $29,880 to $49,840 $39,500 $ –286,100 $ –540 -1.4% 93% 4%Middle 20% $49,840 to $76,450 $62,000 $ –473,400 $ –860 -1.4% 90% 8%Fourth 20% $76,450 to $123,840 $96,700 $ –830,000 $ –1,540 -1.6% 93% 7%Next 15% $123,840 to $255,280 $167,500 $ –1,023,500 $ –2,540 -1.5% 87% 13%Next 4% $255,280 to $640,480 $384,200 $ –1,436,500 $ –13,360 -3.5% 95% 5%Richest 1% $640,480 and higher $2,598,200 $ –1,148,600 $ –42,700 -1.6% 96% 4%ALL $108,700 $ –5,274,100 $ –1,950 -1.8% 87% 7%Bottom 60% Less than $76,450 $39,400 $ –835,500 $ –520 -1.3% 84% 5%
Share with Tax Cut
Share with Tax Hike Income Range Average Income Total Tax Change
(Thousands) Avg. Tax Change
Tax Change as % of Pre-Tax
Income Combined Impact of Final GOP-Trump Tax Bill
Share with Tax Cut
Share with Tax Hike Income Range Average Income Total Tax Change
(Thousands) Avg. Tax Change
Tax Change as % of Pre-Tax
Income Combined Impact of Final GOP-Trump Tax Bill
Share with Tax Cut
Share with Tax Hike Income Range Average Income Total Tax Change
(Thousands) Avg. Tax Change
Tax Change as % of Pre-Tax
Income Combined Impact of Final GOP-Trump Tax Bill
Share with Tax Cut
Share with Tax Hike Income Range Average Income Total Tax Change
(Thousands) Avg. Tax Change
Tax Change as % of Pre-Tax
Income Combined Impact of Final GOP-Trump Tax Bill
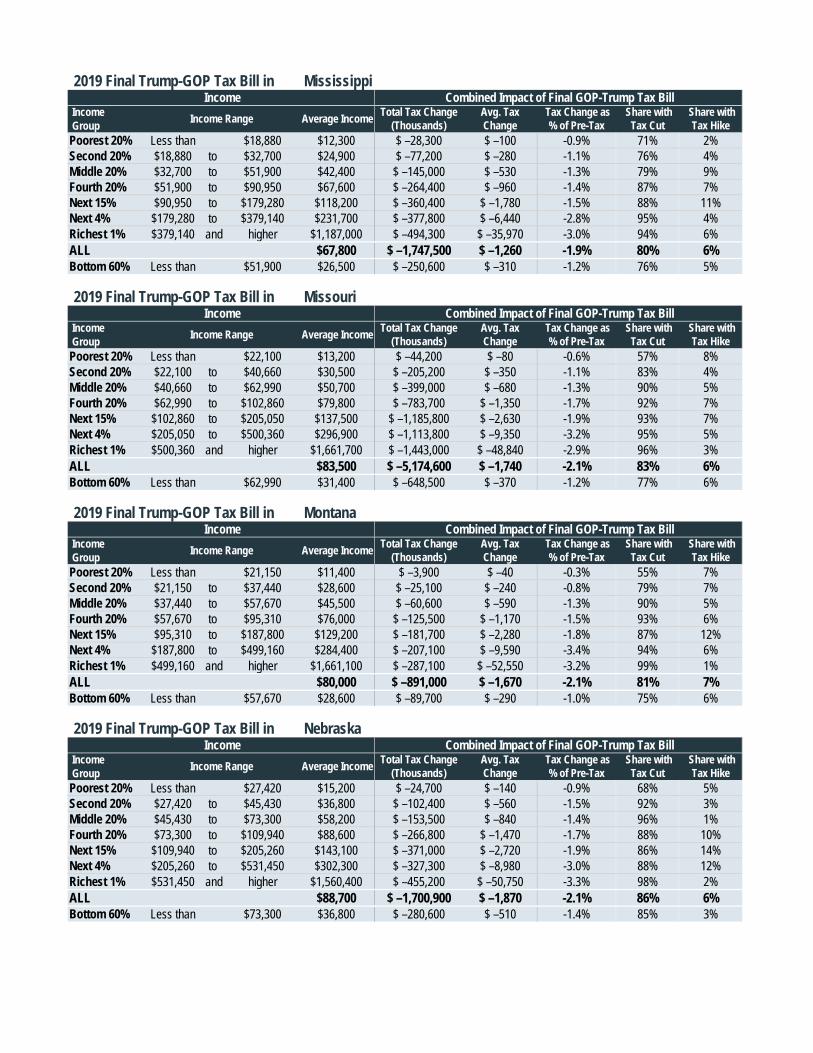
2019 Final Trump-GOP Tax Bill in Mississippi
IncomeGroupPoorest 20% Less than $18,880 $12,300 $ –28,300 $ –100 -0.9% 71% 2%Second 20% $18,880 to $32,700 $24,900 $ –77,200 $ –280 -1.1% 76% 4%Middle 20% $32,700 to $51,900 $42,400 $ –145,000 $ –530 -1.3% 79% 9%Fourth 20% $51,900 to $90,950 $67,600 $ –264,400 $ –960 -1.4% 87% 7%Next 15% $90,950 to $179,280 $118,200 $ –360,400 $ –1,780 -1.5% 88% 11%Next 4% $179,280 to $379,140 $231,700 $ –377,800 $ –6,440 -2.8% 95% 4%Richest 1% $379,140 and higher $1,187,000 $ –494,300 $ –35,970 -3.0% 94% 6%ALL $67,800 $ –1,747,500 $ –1,260 -1.9% 80% 6%Bottom 60% Less than $51,900 $26,500 $ –250,600 $ –310 -1.2% 76% 5%
2019 Final Trump-GOP Tax Bill in Missouri
IncomeGroupPoorest 20% Less than $22,100 $13,200 $ –44,200 $ –80 -0.6% 57% 8%Second 20% $22,100 to $40,660 $30,500 $ –205,200 $ –350 -1.1% 83% 4%Middle 20% $40,660 to $62,990 $50,700 $ –399,000 $ –680 -1.3% 90% 5%Fourth 20% $62,990 to $102,860 $79,800 $ –783,700 $ –1,350 -1.7% 92% 7%Next 15% $102,860 to $205,050 $137,500 $ –1,185,800 $ –2,630 -1.9% 93% 7%Next 4% $205,050 to $500,360 $296,900 $ –1,113,800 $ –9,350 -3.2% 95% 5%Richest 1% $500,360 and higher $1,661,700 $ –1,443,000 $ –48,840 -2.9% 96% 3%ALL $83,500 $ –5,174,600 $ –1,740 -2.1% 83% 6%Bottom 60% Less than $62,990 $31,400 $ –648,500 $ –370 -1.2% 77% 6%
2019 Final Trump-GOP Tax Bill in Montana
IncomeGroupPoorest 20% Less than $21,150 $11,400 $ –3,900 $ –40 -0.3% 55% 7%Second 20% $21,150 to $37,440 $28,600 $ –25,100 $ –240 -0.8% 79% 7%Middle 20% $37,440 to $57,670 $45,500 $ –60,600 $ –590 -1.3% 90% 5%Fourth 20% $57,670 to $95,310 $76,000 $ –125,500 $ –1,170 -1.5% 93% 6%Next 15% $95,310 to $187,800 $129,200 $ –181,700 $ –2,280 -1.8% 87% 12%Next 4% $187,800 to $499,160 $284,400 $ –207,100 $ –9,590 -3.4% 94% 6%Richest 1% $499,160 and higher $1,661,100 $ –287,100 $ –52,550 -3.2% 99% 1%ALL $80,000 $ –891,000 $ –1,670 -2.1% 81% 7%Bottom 60% Less than $57,670 $28,600 $ –89,700 $ –290 -1.0% 75% 6%
2019 Final Trump-GOP Tax Bill in Nebraska
IncomeGroupPoorest 20% Less than $27,420 $15,200 $ –24,700 $ –140 -0.9% 68% 5%Second 20% $27,420 to $45,430 $36,800 $ –102,400 $ –560 -1.5% 92% 3%Middle 20% $45,430 to $73,300 $58,200 $ –153,500 $ –840 -1.4% 96% 1%Fourth 20% $73,300 to $109,940 $88,600 $ –266,800 $ –1,470 -1.7% 88% 10%Next 15% $109,940 to $205,260 $143,100 $ –371,000 $ –2,720 -1.9% 86% 14%Next 4% $205,260 to $531,450 $302,300 $ –327,300 $ –8,980 -3.0% 88% 12%Richest 1% $531,450 and higher $1,560,400 $ –455,200 $ –50,750 -3.3% 98% 2%ALL $88,700 $ –1,700,900 $ –1,870 -2.1% 86% 6%Bottom 60% Less than $73,300 $36,800 $ –280,600 $ –510 -1.4% 85% 3%
Share with Tax Cut
Share with Tax Hike Income Range Average Income Total Tax Change
(Thousands) Avg. Tax Change
Tax Change as % of Pre-Tax
Income Combined Impact of Final GOP-Trump Tax Bill
Share with Tax Cut
Share with Tax Hike Income Range Average Income Total Tax Change
(Thousands) Avg. Tax Change
Tax Change as % of Pre-Tax
Income Combined Impact of Final GOP-Trump Tax Bill
Share with Tax Cut
Share with Tax Hike Income Range Average Income Total Tax Change
(Thousands) Avg. Tax Change
Tax Change as % of Pre-Tax
Income Combined Impact of Final GOP-Trump Tax Bill
Share with Tax Cut
Share with Tax Hike Income Range Average Income Total Tax Change
(Thousands) Avg. Tax Change
Tax Change as % of Pre-Tax
Income Combined Impact of Final GOP-Trump Tax Bill
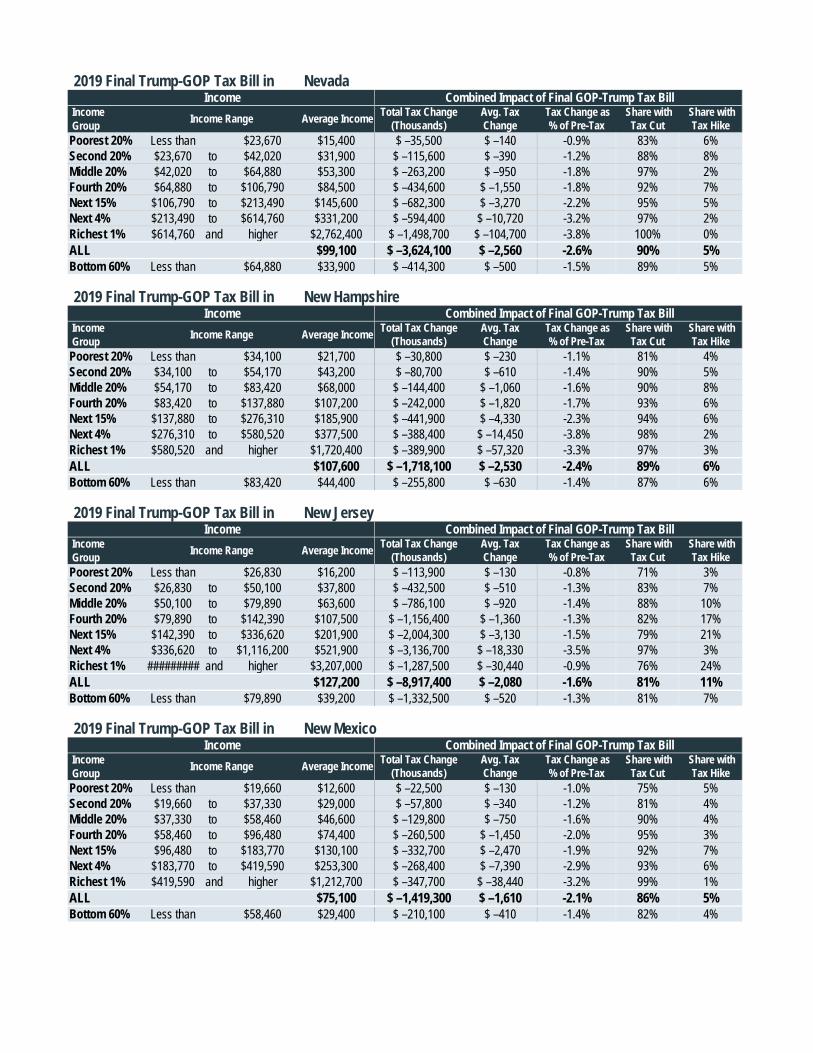
2019 Final Trump-GOP Tax Bill in Nevada
IncomeGroupPoorest 20% Less than $23,670 $15,400 $ –35,500 $ –140 -0.9% 83% 6%Second 20% $23,670 to $42,020 $31,900 $ –115,600 $ –390 -1.2% 88% 8%Middle 20% $42,020 to $64,880 $53,300 $ –263,200 $ –950 -1.8% 97% 2%Fourth 20% $64,880 to $106,790 $84,500 $ –434,600 $ –1,550 -1.8% 92% 7%Next 15% $106,790 to $213,490 $145,600 $ –682,300 $ –3,270 -2.2% 95% 5%Next 4% $213,490 to $614,760 $331,200 $ –594,400 $ –10,720 -3.2% 97% 2%Richest 1% $614,760 and higher $2,762,400 $ –1,498,700 $ –104,700 -3.8% 100% 0%ALL $99,100 $ –3,624,100 $ –2,560 -2.6% 90% 5%Bottom 60% Less than $64,880 $33,900 $ –414,300 $ –500 -1.5% 89% 5%
2019 Final Trump-GOP Tax Bill in New Hampshire
IncomeGroupPoorest 20% Less than $34,100 $21,700 $ –30,800 $ –230 -1.1% 81% 4%Second 20% $34,100 to $54,170 $43,200 $ –80,700 $ –610 -1.4% 90% 5%Middle 20% $54,170 to $83,420 $68,000 $ –144,400 $ –1,060 -1.6% 90% 8%Fourth 20% $83,420 to $137,880 $107,200 $ –242,000 $ –1,820 -1.7% 93% 6%Next 15% $137,880 to $276,310 $185,900 $ –441,900 $ –4,330 -2.3% 94% 6%Next 4% $276,310 to $580,520 $377,500 $ –388,400 $ –14,450 -3.8% 98% 2%Richest 1% $580,520 and higher $1,720,400 $ –389,900 $ –57,320 -3.3% 97% 3%ALL $107,600 $ –1,718,100 $ –2,530 -2.4% 89% 6%Bottom 60% Less than $83,420 $44,400 $ –255,800 $ –630 -1.4% 87% 6%
2019 Final Trump-GOP Tax Bill in New Jersey
IncomeGroupPoorest 20% Less than $26,830 $16,200 $ –113,900 $ –130 -0.8% 71% 3%Second 20% $26,830 to $50,100 $37,800 $ –432,500 $ –510 -1.3% 83% 7%Middle 20% $50,100 to $79,890 $63,600 $ –786,100 $ –920 -1.4% 88% 10%Fourth 20% $79,890 to $142,390 $107,500 $ –1,156,400 $ –1,360 -1.3% 82% 17%Next 15% $142,390 to $336,620 $201,900 $ –2,004,300 $ –3,130 -1.5% 79% 21%Next 4% $336,620 to $1,116,200 $521,900 $ –3,136,700 $ –18,330 -3.5% 97% 3%Richest 1% ######### and higher $3,207,000 $ –1,287,500 $ –30,440 -0.9% 76% 24%ALL $127,200 $ –8,917,400 $ –2,080 -1.6% 81% 11%Bottom 60% Less than $79,890 $39,200 $ –1,332,500 $ –520 -1.3% 81% 7%
2019 Final Trump-GOP Tax Bill in New Mexico
IncomeGroupPoorest 20% Less than $19,660 $12,600 $ –22,500 $ –130 -1.0% 75% 5%Second 20% $19,660 to $37,330 $29,000 $ –57,800 $ –340 -1.2% 81% 4%Middle 20% $37,330 to $58,460 $46,600 $ –129,800 $ –750 -1.6% 90% 4%Fourth 20% $58,460 to $96,480 $74,400 $ –260,500 $ –1,450 -2.0% 95% 3%Next 15% $96,480 to $183,770 $130,100 $ –332,700 $ –2,470 -1.9% 92% 7%Next 4% $183,770 to $419,590 $253,300 $ –268,400 $ –7,390 -2.9% 93% 6%Richest 1% $419,590 and higher $1,212,700 $ –347,700 $ –38,440 -3.2% 99% 1%ALL $75,100 $ –1,419,300 $ –1,610 -2.1% 86% 5%Bottom 60% Less than $58,460 $29,400 $ –210,100 $ –410 -1.4% 82% 4%
Share with Tax Cut
Share with Tax Hike Income Range Average Income Total Tax Change
(Thousands) Avg. Tax Change
Tax Change as % of Pre-Tax
Income Combined Impact of Final GOP-Trump Tax Bill
Share with Tax Cut
Share with Tax Hike Income Range Average Income Total Tax Change
(Thousands) Avg. Tax Change
Tax Change as % of Pre-Tax
Income Combined Impact of Final GOP-Trump Tax Bill
Share with Tax Cut
Share with Tax Hike Income Range Average Income Total Tax Change
(Thousands) Avg. Tax Change
Tax Change as % of Pre-Tax
Income Combined Impact of Final GOP-Trump Tax Bill
Share with Tax Cut
Share with Tax Hike Income Range Average Income Total Tax Change
(Thousands) Avg. Tax Change
Tax Change as % of Pre-Tax
Income Combined Impact of Final GOP-Trump Tax Bill

2019 Final Trump-GOP Tax Bill in New York
IncomeGroupPoorest 20% Less than $24,130 $14,100 $ –187,400 $ –100 -0.7% 59% 5%Second 20% $24,130 to $40,700 $32,300 $ –718,200 $ –370 -1.1% 81% 8%Middle 20% $40,700 to $67,910 $53,400 $ –1,374,700 $ –710 -1.3% 86% 10%Fourth 20% $67,910 to $120,560 $91,200 $ –2,276,300 $ –1,180 -1.3% 80% 19%Next 15% $120,560 to $280,210 $172,000 $ –3,109,800 $ –2,150 -1.2% 72% 27%Next 4% $280,210 to $888,520 $450,100 $ –5,257,900 $ –13,610 -3.0% 91% 9%Richest 1% $888,520 and higher $3,161,300 $ –2,881,000 $ –29,890 -0.9% 56% 43%ALL $112,300 $ –15,805,400 $ –1,620 -1.4% 76% 13%Bottom 60% Less than $67,910 $33,300 $ –2,280,300 $ –390 -1.2% 75% 8%
2019 Final Trump-GOP Tax Bill in North Carolina
IncomeGroupPoorest 20% Less than $21,430 $13,300 $ –61,700 $ –60 -0.5% 61% 5%Second 20% $21,430 to $35,200 $28,400 $ –324,700 $ –330 -1.2% 79% 7%Middle 20% $35,200 to $60,570 $46,900 $ –692,000 $ –700 -1.5% 89% 5%Fourth 20% $60,570 to $99,930 $77,600 $ –1,192,100 $ –1,210 -1.6% 88% 11%Next 15% $99,930 to $217,460 $139,000 $ –1,652,300 $ –2,230 -1.6% 89% 10%Next 4% $217,460 to $530,930 $319,000 $ –2,245,600 $ –11,380 -3.6% 93% 6%Richest 1% $530,930 and higher $1,674,300 $ –2,207,100 $ –44,760 -2.7% 99% 1%ALL $82,800 $ –8,374,300 $ –1,680 -2.0% 81% 7%Bottom 60% Less than $60,570 $29,600 $ –1,078,400 $ –360 -1.2% 76% 6%
2019 Final Trump-GOP Tax Bill in North Dakota
IncomeGroupPoorest 20% Less than $25,720 $16,600 $ –8,100 $ –120 -0.7% 77% 2%Second 20% $25,720 to $44,400 $33,500 $ –27,600 $ –400 -1.2% 95% 0%Middle 20% $44,400 to $75,220 $57,000 $ –57,800 $ –780 -1.4% 93% 5%Fourth 20% $75,220 to $114,110 $90,900 $ –121,700 $ –1,590 -1.7% 97% 0%Next 15% $114,110 to $218,320 $145,700 $ –182,700 $ –3,290 -2.3% 99% 0%Next 4% $218,320 to $604,800 $311,500 $ –135,700 $ –9,440 -3.0% 98% 1%Richest 1% $604,800 and higher $1,397,700 $ –218,500 $ –60,280 -4.3% 93% 6%ALL $88,600 $ –752,100 $ –2,060 -2.3% 92% 2%Bottom 60% Less than $75,220 $36,200 $ –93,400 $ –440 -1.2% 89% 2%
2019 Final Trump-GOP Tax Bill in Ohio
IncomeGroupPoorest 20% Less than $23,670 $13,600 $ –118,400 $ –100 -0.8% 59% 5%Second 20% $23,670 to $40,770 $32,100 $ –428,900 $ –370 -1.2% 82% 8%Middle 20% $40,770 to $62,100 $50,600 $ –926,500 $ –800 -1.6% 91% 5%Fourth 20% $62,100 to $101,530 $78,300 $ –1,436,500 $ –1,240 -1.6% 91% 8%Next 15% $101,530 to $197,590 $135,100 $ –2,284,000 $ –2,640 -2.0% 91% 9%Next 4% $197,590 to $507,230 $293,000 $ –2,403,200 $ –10,300 -3.5% 94% 6%Richest 1% $507,230 and higher $1,602,700 $ –2,756,300 $ –47,510 -3.0% 98% 2%ALL $82,200 $ –10,353,800 $ –1,770 -2.2% 83% 7%Bottom 60% Less than $62,100 $32,100 $ –1,473,800 $ –420 -1.3% 77% 6%
Share with Tax Cut
Share with Tax Hike Income Range Average Income Total Tax Change
(Thousands) Avg. Tax Change
Tax Change as % of Pre-Tax
Income Combined Impact of Final GOP-Trump Tax Bill
Share with Tax Cut
Share with Tax Hike Income Range Average Income Total Tax Change
(Thousands) Avg. Tax Change
Tax Change as % of Pre-Tax
Income Combined Impact of Final GOP-Trump Tax Bill
Share with Tax Cut
Share with Tax Hike Income Range Average Income Total Tax Change
(Thousands) Avg. Tax Change
Tax Change as % of Pre-Tax
Income Combined Impact of Final GOP-Trump Tax Bill
Share with Tax Cut
Share with Tax Hike Income Range Average Income Total Tax Change
(Thousands) Avg. Tax Change
Tax Change as % of Pre-Tax
Income Combined Impact of Final GOP-Trump Tax Bill
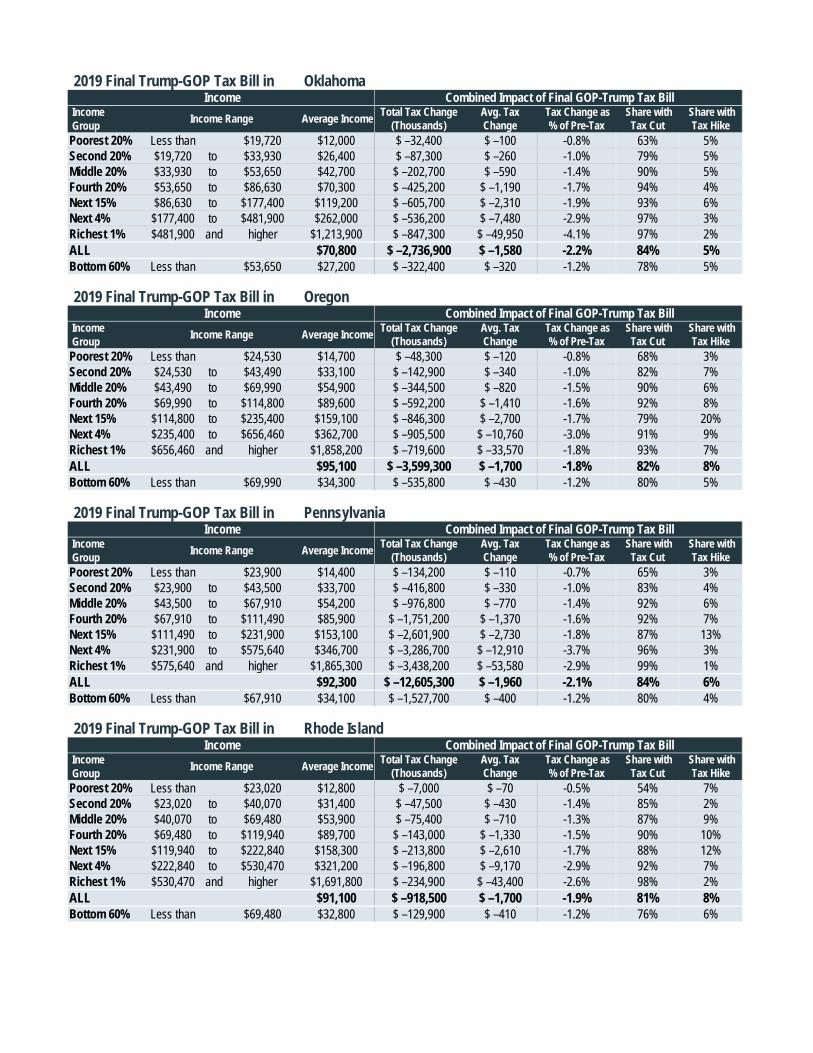
2019 Final Trump-GOP Tax Bill in Oklahoma
IncomeGroupPoorest 20% Less than $19,720 $12,000 $ –32,400 $ –100 -0.8% 63% 5%Second 20% $19,720 to $33,930 $26,400 $ –87,300 $ –260 -1.0% 79% 5%Middle 20% $33,930 to $53,650 $42,700 $ –202,700 $ –590 -1.4% 90% 5%Fourth 20% $53,650 to $86,630 $70,300 $ –425,200 $ –1,190 -1.7% 94% 4%Next 15% $86,630 to $177,400 $119,200 $ –605,700 $ –2,310 -1.9% 93% 6%Next 4% $177,400 to $481,900 $262,000 $ –536,200 $ –7,480 -2.9% 97% 3%Richest 1% $481,900 and higher $1,213,900 $ –847,300 $ –49,950 -4.1% 97% 2%ALL $70,800 $ –2,736,900 $ –1,580 -2.2% 84% 5%Bottom 60% Less than $53,650 $27,200 $ –322,400 $ –320 -1.2% 78% 5%
2019 Final Trump-GOP Tax Bill in Oregon
IncomeGroupPoorest 20% Less than $24,530 $14,700 $ –48,300 $ –120 -0.8% 68% 3%Second 20% $24,530 to $43,490 $33,100 $ –142,900 $ –340 -1.0% 82% 7%Middle 20% $43,490 to $69,990 $54,900 $ –344,500 $ –820 -1.5% 90% 6%Fourth 20% $69,990 to $114,800 $89,600 $ –592,200 $ –1,410 -1.6% 92% 8%Next 15% $114,800 to $235,400 $159,100 $ –846,300 $ –2,700 -1.7% 79% 20%Next 4% $235,400 to $656,460 $362,700 $ –905,500 $ –10,760 -3.0% 91% 9%Richest 1% $656,460 and higher $1,858,200 $ –719,600 $ –33,570 -1.8% 93% 7%ALL $95,100 $ –3,599,300 $ –1,700 -1.8% 82% 8%Bottom 60% Less than $69,990 $34,300 $ –535,800 $ –430 -1.2% 80% 5%
2019 Final Trump-GOP Tax Bill in Pennsylvania
IncomeGroupPoorest 20% Less than $23,900 $14,400 $ –134,200 $ –110 -0.7% 65% 3%Second 20% $23,900 to $43,500 $33,700 $ –416,800 $ –330 -1.0% 83% 4%Middle 20% $43,500 to $67,910 $54,200 $ –976,800 $ –770 -1.4% 92% 6%Fourth 20% $67,910 to $111,490 $85,900 $ –1,751,200 $ –1,370 -1.6% 92% 7%Next 15% $111,490 to $231,900 $153,100 $ –2,601,900 $ –2,730 -1.8% 87% 13%Next 4% $231,900 to $575,640 $346,700 $ –3,286,700 $ –12,910 -3.7% 96% 3%Richest 1% $575,640 and higher $1,865,300 $ –3,438,200 $ –53,580 -2.9% 99% 1%ALL $92,300 $ –12,605,300 $ –1,960 -2.1% 84% 6%Bottom 60% Less than $67,910 $34,100 $ –1,527,700 $ –400 -1.2% 80% 4%
2019 Final Trump-GOP Tax Bill in Rhode Island
IncomeGroupPoorest 20% Less than $23,020 $12,800 $ –7,000 $ –70 -0.5% 54% 7%Second 20% $23,020 to $40,070 $31,400 $ –47,500 $ –430 -1.4% 85% 2%Middle 20% $40,070 to $69,480 $53,900 $ –75,400 $ –710 -1.3% 87% 9%Fourth 20% $69,480 to $119,940 $89,700 $ –143,000 $ –1,330 -1.5% 90% 10%Next 15% $119,940 to $222,840 $158,300 $ –213,800 $ –2,610 -1.7% 88% 12%Next 4% $222,840 to $530,470 $321,200 $ –196,800 $ –9,170 -2.9% 92% 7%Richest 1% $530,470 and higher $1,691,800 $ –234,900 $ –43,400 -2.6% 98% 2%ALL $91,100 $ –918,500 $ –1,700 -1.9% 81% 8%Bottom 60% Less than $69,480 $32,800 $ –129,900 $ –410 -1.2% 76% 6%
Share with Tax Cut
Share with Tax Hike Income Range Average Income Total Tax Change
(Thousands) Avg. Tax Change
Tax Change as % of Pre-Tax
Income Combined Impact of Final GOP-Trump Tax Bill
Share with Tax Cut
Share with Tax Hike Income Range Average Income Total Tax Change
(Thousands) Avg. Tax Change
Tax Change as % of Pre-Tax
Income Combined Impact of Final GOP-Trump Tax Bill
Share with Tax Cut
Share with Tax Hike Income Range Average Income Total Tax Change
(Thousands) Avg. Tax Change
Tax Change as % of Pre-Tax
Income Combined Impact of Final GOP-Trump Tax Bill
Share with Tax Cut
Share with Tax Hike Income Range Average Income Total Tax Change
(Thousands) Avg. Tax Change
Tax Change as % of Pre-Tax
Income Combined Impact of Final GOP-Trump Tax Bill
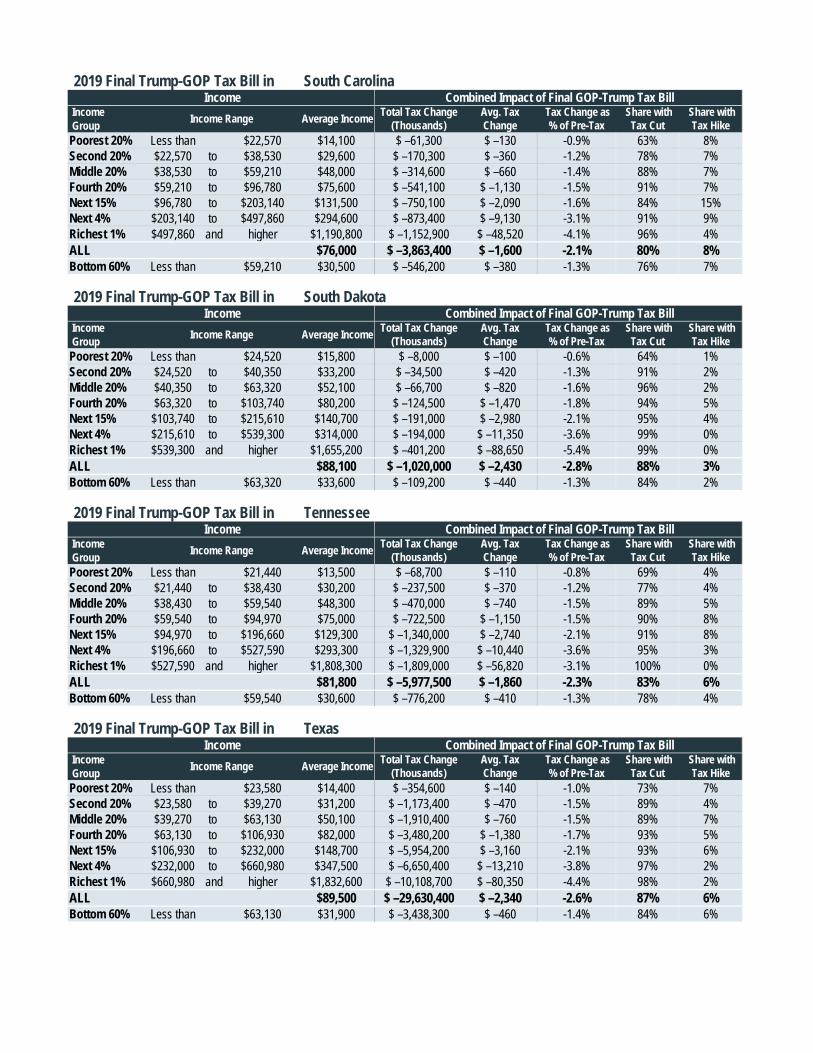
2019 Final Trump-GOP Tax Bill in South Carolina
IncomeGroupPoorest 20% Less than $22,570 $14,100 $ –61,300 $ –130 -0.9% 63% 8%Second 20% $22,570 to $38,530 $29,600 $ –170,300 $ –360 -1.2% 78% 7%Middle 20% $38,530 to $59,210 $48,000 $ –314,600 $ –660 -1.4% 88% 7%Fourth 20% $59,210 to $96,780 $75,600 $ –541,100 $ –1,130 -1.5% 91% 7%Next 15% $96,780 to $203,140 $131,500 $ –750,100 $ –2,090 -1.6% 84% 15%Next 4% $203,140 to $497,860 $294,600 $ –873,400 $ –9,130 -3.1% 91% 9%Richest 1% $497,860 and higher $1,190,800 $ –1,152,900 $ –48,520 -4.1% 96% 4%ALL $76,000 $ –3,863,400 $ –1,600 -2.1% 80% 8%Bottom 60% Less than $59,210 $30,500 $ –546,200 $ –380 -1.3% 76% 7%
2019 Final Trump-GOP Tax Bill in South Dakota
IncomeGroupPoorest 20% Less than $24,520 $15,800 $ –8,000 $ –100 -0.6% 64% 1%Second 20% $24,520 to $40,350 $33,200 $ –34,500 $ –420 -1.3% 91% 2%Middle 20% $40,350 to $63,320 $52,100 $ –66,700 $ –820 -1.6% 96% 2%Fourth 20% $63,320 to $103,740 $80,200 $ –124,500 $ –1,470 -1.8% 94% 5%Next 15% $103,740 to $215,610 $140,700 $ –191,000 $ –2,980 -2.1% 95% 4%Next 4% $215,610 to $539,300 $314,000 $ –194,000 $ –11,350 -3.6% 99% 0%Richest 1% $539,300 and higher $1,655,200 $ –401,200 $ –88,650 -5.4% 99% 0%ALL $88,100 $ –1,020,000 $ –2,430 -2.8% 88% 3%Bottom 60% Less than $63,320 $33,600 $ –109,200 $ –440 -1.3% 84% 2%
2019 Final Trump-GOP Tax Bill in Tennessee
IncomeGroupPoorest 20% Less than $21,440 $13,500 $ –68,700 $ –110 -0.8% 69% 4%Second 20% $21,440 to $38,430 $30,200 $ –237,500 $ –370 -1.2% 77% 4%Middle 20% $38,430 to $59,540 $48,300 $ –470,000 $ –740 -1.5% 89% 5%Fourth 20% $59,540 to $94,970 $75,000 $ –722,500 $ –1,150 -1.5% 90% 8%Next 15% $94,970 to $196,660 $129,300 $ –1,340,000 $ –2,740 -2.1% 91% 8%Next 4% $196,660 to $527,590 $293,300 $ –1,329,900 $ –10,440 -3.6% 95% 3%Richest 1% $527,590 and higher $1,808,300 $ –1,809,000 $ –56,820 -3.1% 100% 0%ALL $81,800 $ –5,977,500 $ –1,860 -2.3% 83% 6%Bottom 60% Less than $59,540 $30,600 $ –776,200 $ –410 -1.3% 78% 4%
2019 Final Trump-GOP Tax Bill in Texas
IncomeGroupPoorest 20% Less than $23,580 $14,400 $ –354,600 $ –140 -1.0% 73% 7%Second 20% $23,580 to $39,270 $31,200 $ –1,173,400 $ –470 -1.5% 89% 4%Middle 20% $39,270 to $63,130 $50,100 $ –1,910,400 $ –760 -1.5% 89% 7%Fourth 20% $63,130 to $106,930 $82,000 $ –3,480,200 $ –1,380 -1.7% 93% 5%Next 15% $106,930 to $232,000 $148,700 $ –5,954,200 $ –3,160 -2.1% 93% 6%Next 4% $232,000 to $660,980 $347,500 $ –6,650,400 $ –13,210 -3.8% 97% 2%Richest 1% $660,980 and higher $1,832,600 $ –10,108,700 $ –80,350 -4.4% 98% 2%ALL $89,500 $ –29,630,400 $ –2,340 -2.6% 87% 6%Bottom 60% Less than $63,130 $31,900 $ –3,438,300 $ –460 -1.4% 84% 6%
Share with Tax Cut
Share with Tax Hike Income Range Average Income Total Tax Change
(Thousands) Avg. Tax Change
Tax Change as % of Pre-Tax
Income Combined Impact of Final GOP-Trump Tax Bill
Share with Tax Cut
Share with Tax Hike Income Range Average Income Total Tax Change
(Thousands) Avg. Tax Change
Tax Change as % of Pre-Tax
Income Combined Impact of Final GOP-Trump Tax Bill
Share with Tax Cut
Share with Tax Hike Income Range Average Income Total Tax Change
(Thousands) Avg. Tax Change
Tax Change as % of Pre-Tax
Income Combined Impact of Final GOP-Trump Tax Bill
Share with Tax Cut
Share with Tax Hike Income Range Average Income Total Tax Change
(Thousands) Avg. Tax Change
Tax Change as % of Pre-Tax
Income Combined Impact of Final GOP-Trump Tax Bill
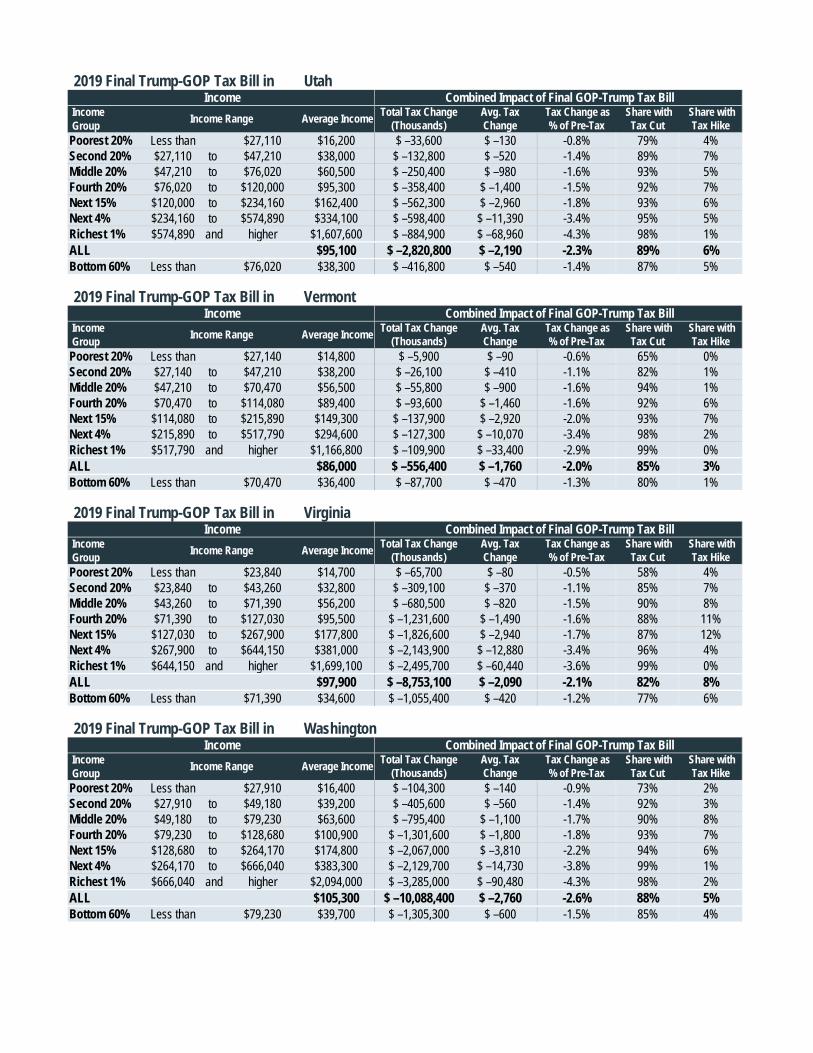
2019 Final Trump-GOP Tax Bill in Utah
IncomeGroupPoorest 20% Less than $27,110 $16,200 $ –33,600 $ –130 -0.8% 79% 4%Second 20% $27,110 to $47,210 $38,000 $ –132,800 $ –520 -1.4% 89% 7%Middle 20% $47,210 to $76,020 $60,500 $ –250,400 $ –980 -1.6% 93% 5%Fourth 20% $76,020 to $120,000 $95,300 $ –358,400 $ –1,400 -1.5% 92% 7%Next 15% $120,000 to $234,160 $162,400 $ –562,300 $ –2,960 -1.8% 93% 6%Next 4% $234,160 to $574,890 $334,100 $ –598,400 $ –11,390 -3.4% 95% 5%Richest 1% $574,890 and higher $1,607,600 $ –884,900 $ –68,960 -4.3% 98% 1%ALL $95,100 $ –2,820,800 $ –2,190 -2.3% 89% 6%Bottom 60% Less than $76,020 $38,300 $ –416,800 $ –540 -1.4% 87% 5%
2019 Final Trump-GOP Tax Bill in Vermont
IncomeGroupPoorest 20% Less than $27,140 $14,800 $ –5,900 $ –90 -0.6% 65% 0%Second 20% $27,140 to $47,210 $38,200 $ –26,100 $ –410 -1.1% 82% 1%Middle 20% $47,210 to $70,470 $56,500 $ –55,800 $ –900 -1.6% 94% 1%Fourth 20% $70,470 to $114,080 $89,400 $ –93,600 $ –1,460 -1.6% 92% 6%Next 15% $114,080 to $215,890 $149,300 $ –137,900 $ –2,920 -2.0% 93% 7%Next 4% $215,890 to $517,790 $294,600 $ –127,300 $ –10,070 -3.4% 98% 2%Richest 1% $517,790 and higher $1,166,800 $ –109,900 $ –33,400 -2.9% 99% 0%ALL $86,000 $ –556,400 $ –1,760 -2.0% 85% 3%Bottom 60% Less than $70,470 $36,400 $ –87,700 $ –470 -1.3% 80% 1%
2019 Final Trump-GOP Tax Bill in Virginia
IncomeGroupPoorest 20% Less than $23,840 $14,700 $ –65,700 $ –80 -0.5% 58% 4%Second 20% $23,840 to $43,260 $32,800 $ –309,100 $ –370 -1.1% 85% 7%Middle 20% $43,260 to $71,390 $56,200 $ –680,500 $ –820 -1.5% 90% 8%Fourth 20% $71,390 to $127,030 $95,500 $ –1,231,600 $ –1,490 -1.6% 88% 11%Next 15% $127,030 to $267,900 $177,800 $ –1,826,600 $ –2,940 -1.7% 87% 12%Next 4% $267,900 to $644,150 $381,000 $ –2,143,900 $ –12,880 -3.4% 96% 4%Richest 1% $644,150 and higher $1,699,100 $ –2,495,700 $ –60,440 -3.6% 99% 0%ALL $97,900 $ –8,753,100 $ –2,090 -2.1% 82% 8%Bottom 60% Less than $71,390 $34,600 $ –1,055,400 $ –420 -1.2% 77% 6%
2019 Final Trump-GOP Tax Bill in Washington
IncomeGroupPoorest 20% Less than $27,910 $16,400 $ –104,300 $ –140 -0.9% 73% 2%Second 20% $27,910 to $49,180 $39,200 $ –405,600 $ –560 -1.4% 92% 3%Middle 20% $49,180 to $79,230 $63,600 $ –795,400 $ –1,100 -1.7% 90% 8%Fourth 20% $79,230 to $128,680 $100,900 $ –1,301,600 $ –1,800 -1.8% 93% 7%Next 15% $128,680 to $264,170 $174,800 $ –2,067,000 $ –3,810 -2.2% 94% 6%Next 4% $264,170 to $666,040 $383,300 $ –2,129,700 $ –14,730 -3.8% 99% 1%Richest 1% $666,040 and higher $2,094,000 $ –3,285,000 $ –90,480 -4.3% 98% 2%ALL $105,300 $ –10,088,400 $ –2,760 -2.6% 88% 5%Bottom 60% Less than $79,230 $39,700 $ –1,305,300 $ –600 -1.5% 85% 4%
Share with Tax Cut
Share with Tax Hike Income Range Average Income Total Tax Change
(Thousands) Avg. Tax Change
Tax Change as % of Pre-Tax
Income Combined Impact of Final GOP-Trump Tax Bill
Share with Tax Cut
Share with Tax Hike Income Range Average Income Total Tax Change
(Thousands) Avg. Tax Change
Tax Change as % of Pre-Tax
Income Combined Impact of Final GOP-Trump Tax Bill
Share with Tax Cut
Share with Tax Hike Income Range Average Income Total Tax Change
(Thousands) Avg. Tax Change
Tax Change as % of Pre-Tax
Income Combined Impact of Final GOP-Trump Tax Bill
Share with Tax Cut
Share with Tax Hike Income Range Average Income Total Tax Change
(Thousands) Avg. Tax Change
Tax Change as % of Pre-Tax
Income Combined Impact of Final GOP-Trump Tax Bill
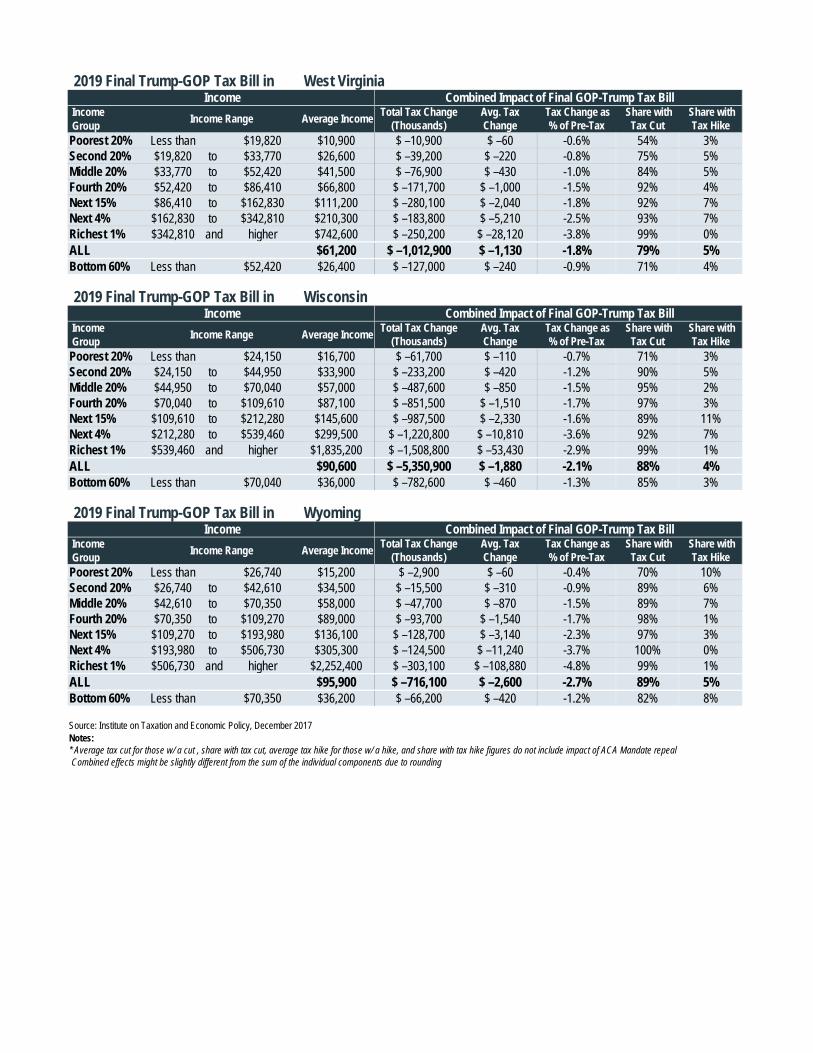
2019 Final Trump-GOP Tax Bill in West Virginia
IncomeGroupPoorest 20% Less than $19,820 $10,900 $ –10,900 $ –60 -0.6% 54% 3%Second 20% $19,820 to $33,770 $26,600 $ –39,200 $ –220 -0.8% 75% 5%Middle 20% $33,770 to $52,420 $41,500 $ –76,900 $ –430 -1.0% 84% 5%Fourth 20% $52,420 to $86,410 $66,800 $ –171,700 $ –1,000 -1.5% 92% 4%Next 15% $86,410 to $162,830 $111,200 $ –280,100 $ –2,040 -1.8% 92% 7%Next 4% $162,830 to $342,810 $210,300 $ –183,800 $ –5,210 -2.5% 93% 7%Richest 1% $342,810 and higher $742,600 $ –250,200 $ –28,120 -3.8% 99% 0%ALL $61,200 $ –1,012,900 $ –1,130 -1.8% 79% 5%Bottom 60% Less than $52,420 $26,400 $ –127,000 $ –240 -0.9% 71% 4%
2019 Final Trump-GOP Tax Bill in Wisconsin
IncomeGroupPoorest 20% Less than $24,150 $16,700 $ –61,700 $ –110 -0.7% 71% 3%Second 20% $24,150 to $44,950 $33,900 $ –233,200 $ –420 -1.2% 90% 5%Middle 20% $44,950 to $70,040 $57,000 $ –487,600 $ –850 -1.5% 95% 2%Fourth 20% $70,040 to $109,610 $87,100 $ –851,500 $ –1,510 -1.7% 97% 3%Next 15% $109,610 to $212,280 $145,600 $ –987,500 $ –2,330 -1.6% 89% 11%Next 4% $212,280 to $539,460 $299,500 $ –1,220,800 $ –10,810 -3.6% 92% 7%Richest 1% $539,460 and higher $1,835,200 $ –1,508,800 $ –53,430 -2.9% 99% 1%ALL $90,600 $ –5,350,900 $ –1,880 -2.1% 88% 4%Bottom 60% Less than $70,040 $36,000 $ –782,600 $ –460 -1.3% 85% 3%
2019 Final Trump-GOP Tax Bill in Wyoming
IncomeGroupPoorest 20% Less than $26,740 $15,200 $ –2,900 $ –60 -0.4% 70% 10%Second 20% $26,740 to $42,610 $34,500 $ –15,500 $ –310 -0.9% 89% 6%Middle 20% $42,610 to $70,350 $58,000 $ –47,700 $ –870 -1.5% 89% 7%Fourth 20% $70,350 to $109,270 $89,000 $ –93,700 $ –1,540 -1.7% 98% 1%Next 15% $109,270 to $193,980 $136,100 $ –128,700 $ –3,140 -2.3% 97% 3%Next 4% $193,980 to $506,730 $305,300 $ –124,500 $ –11,240 -3.7% 100% 0%Richest 1% $506,730 and higher $2,252,400 $ –303,100 $ –108,880 -4.8% 99% 1%ALL $95,900 $ –716,100 $ –2,600 -2.7% 89% 5%Bottom 60% Less than $70,350 $36,200 $ –66,200 $ –420 -1.2% 82% 8%
Source: Institute on Taxation and Economic Policy, December 2017Notes:* Average tax cut for those w/ a cut , share with tax cut, average tax hike for those w/ a hike, and share with tax hike figures do not include impact of ACA Mandate repeal
Combined effects might be slightly different from the sum of the individual components due to rounding
Share with Tax Cut
Share with Tax Hike Income Range Average Income Total Tax Change
(Thousands) Avg. Tax Change
Tax Change as % of Pre-Tax
Income Combined Impact of Final GOP-Trump Tax Bill
Share with Tax Cut
Share with Tax Hike Income Range Average Income Total Tax Change
(Thousands) Avg. Tax Change
Tax Change as % of Pre-Tax
Income Combined Impact of Final GOP-Trump Tax Bill
Share with Tax Cut
Share with Tax Hike Income Range Average Income Total Tax Change
(Thousands) Avg. Tax Change
Tax Change as % of Pre-Tax
Income Combined Impact of Final GOP-Trump Tax Bill
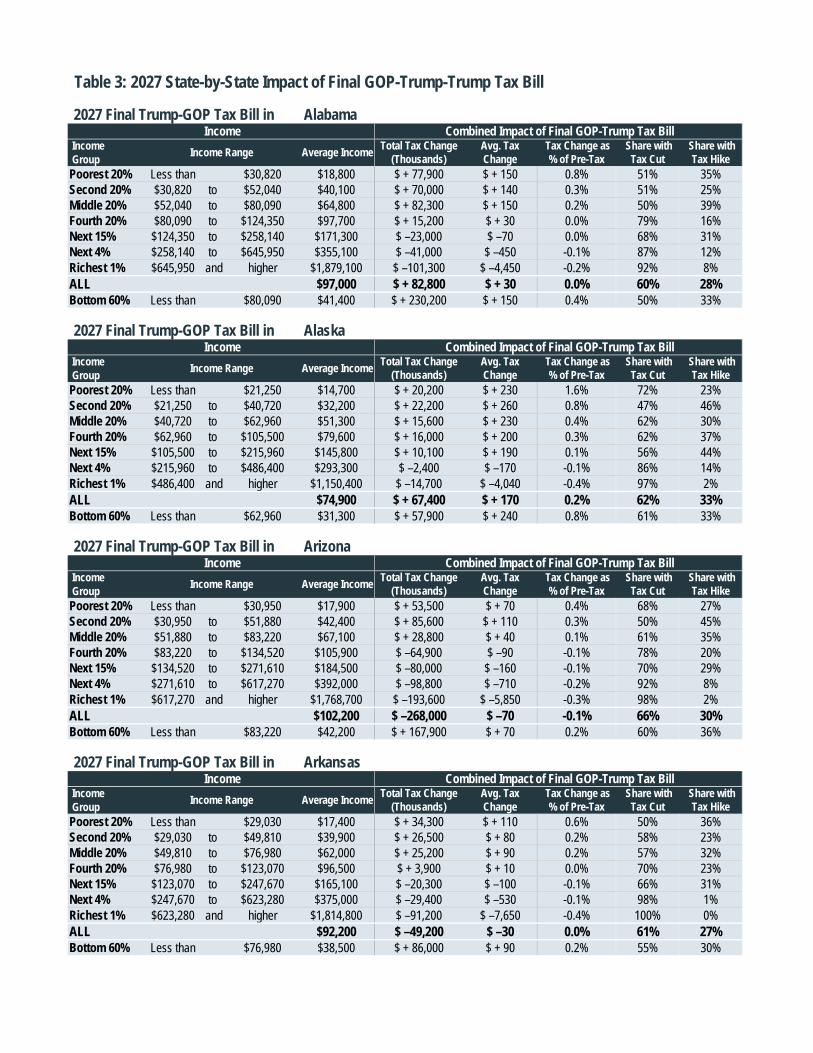
Table 3: 2027 State-by-State Impact of Final GOP-Trump-Trump Tax Bill
2027 Final Trump-GOP Tax Bill in Alabama
IncomeGroupPoorest 20% Less than $30,820 $18,800 $ + 77,900 $ + 150 0.8% 51% 35%Second 20% $30,820 to $52,040 $40,100 $ + 70,000 $ + 140 0.3% 51% 25%Middle 20% $52,040 to $80,090 $64,800 $ + 82,300 $ + 150 0.2% 50% 39%Fourth 20% $80,090 to $124,350 $97,700 $ + 15,200 $ + 30 0.0% 79% 16%Next 15% $124,350 to $258,140 $171,300 $ –23,000 $ –70 0.0% 68% 31%Next 4% $258,140 to $645,950 $355,100 $ –41,000 $ –450 -0.1% 87% 12%Richest 1% $645,950 and higher $1,879,100 $ –101,300 $ –4,450 -0.2% 92% 8%ALL $97,000 $ + 82,800 $ + 30 0.0% 60% 28%Bottom 60% Less than $80,090 $41,400 $ + 230,200 $ + 150 0.4% 50% 33%
2027 Final Trump-GOP Tax Bill in Alaska
IncomeGroupPoorest 20% Less than $21,250 $14,700 $ + 20,200 $ + 230 1.6% 72% 23%Second 20% $21,250 to $40,720 $32,200 $ + 22,200 $ + 260 0.8% 47% 46%Middle 20% $40,720 to $62,960 $51,300 $ + 15,600 $ + 230 0.4% 62% 30%Fourth 20% $62,960 to $105,500 $79,600 $ + 16,000 $ + 200 0.3% 62% 37%Next 15% $105,500 to $215,960 $145,800 $ + 10,100 $ + 190 0.1% 56% 44%Next 4% $215,960 to $486,400 $293,300 $ –2,400 $ –170 -0.1% 86% 14%Richest 1% $486,400 and higher $1,150,400 $ –14,700 $ –4,040 -0.4% 97% 2%ALL $74,900 $ + 67,400 $ + 170 0.2% 62% 33%Bottom 60% Less than $62,960 $31,300 $ + 57,900 $ + 240 0.8% 61% 33%
2027 Final Trump-GOP Tax Bill in Arizona
IncomeGroupPoorest 20% Less than $30,950 $17,900 $ + 53,500 $ + 70 0.4% 68% 27%Second 20% $30,950 to $51,880 $42,400 $ + 85,600 $ + 110 0.3% 50% 45%Middle 20% $51,880 to $83,220 $67,100 $ + 28,800 $ + 40 0.1% 61% 35%Fourth 20% $83,220 to $134,520 $105,900 $ –64,900 $ –90 -0.1% 78% 20%Next 15% $134,520 to $271,610 $184,500 $ –80,000 $ –160 -0.1% 70% 29%Next 4% $271,610 to $617,270 $392,000 $ –98,800 $ –710 -0.2% 92% 8%Richest 1% $617,270 and higher $1,768,700 $ –193,600 $ –5,850 -0.3% 98% 2%ALL $102,200 $ –268,000 $ –70 -0.1% 66% 30%Bottom 60% Less than $83,220 $42,200 $ + 167,900 $ + 70 0.2% 60% 36%
2027 Final Trump-GOP Tax Bill in Arkansas
IncomeGroupPoorest 20% Less than $29,030 $17,400 $ + 34,300 $ + 110 0.6% 50% 36%Second 20% $29,030 to $49,810 $39,900 $ + 26,500 $ + 80 0.2% 58% 23%Middle 20% $49,810 to $76,980 $62,000 $ + 25,200 $ + 90 0.2% 57% 32%Fourth 20% $76,980 to $123,070 $96,500 $ + 3,900 $ + 10 0.0% 70% 23%Next 15% $123,070 to $247,670 $165,100 $ –20,300 $ –100 -0.1% 66% 31%Next 4% $247,670 to $623,280 $375,000 $ –29,400 $ –530 -0.1% 98% 1%Richest 1% $623,280 and higher $1,814,800 $ –91,200 $ –7,650 -0.4% 100% 0%ALL $92,200 $ –49,200 $ –30 0.0% 61% 27%Bottom 60% Less than $76,980 $38,500 $ + 86,000 $ + 90 0.2% 55% 30%
Tax Change as % of Pre-Tax
Avg. Tax Change
Tax Change as % of Pre-Tax
Share with Tax Cut
Share with Tax Hike Income Range Average Income Total Tax Change
(Thousands) Avg. Tax Change
Total Tax Change (Thousands)
Avg. Tax Change
Tax Change as % of Pre-Tax
Income Combined Impact of Final GOP-Trump Tax Bill
Share with Tax Cut
Share with Tax Hike Income Range Average Income Total Tax Change
(Thousands)
Average Income Total Tax Change (Thousands)
Avg. Tax Change
Tax Change as % of Pre-Tax
Income Combined Impact of Final GOP-Trump Tax Bill
Share with Tax Cut
Share with Tax Hike Income Range Average Income
Income Combined Impact of Final GOP-Trump Tax Bill
Income Combined Impact of Final GOP-Trump Tax Bill
Share with Tax Cut
Share with Tax Hike Income Range
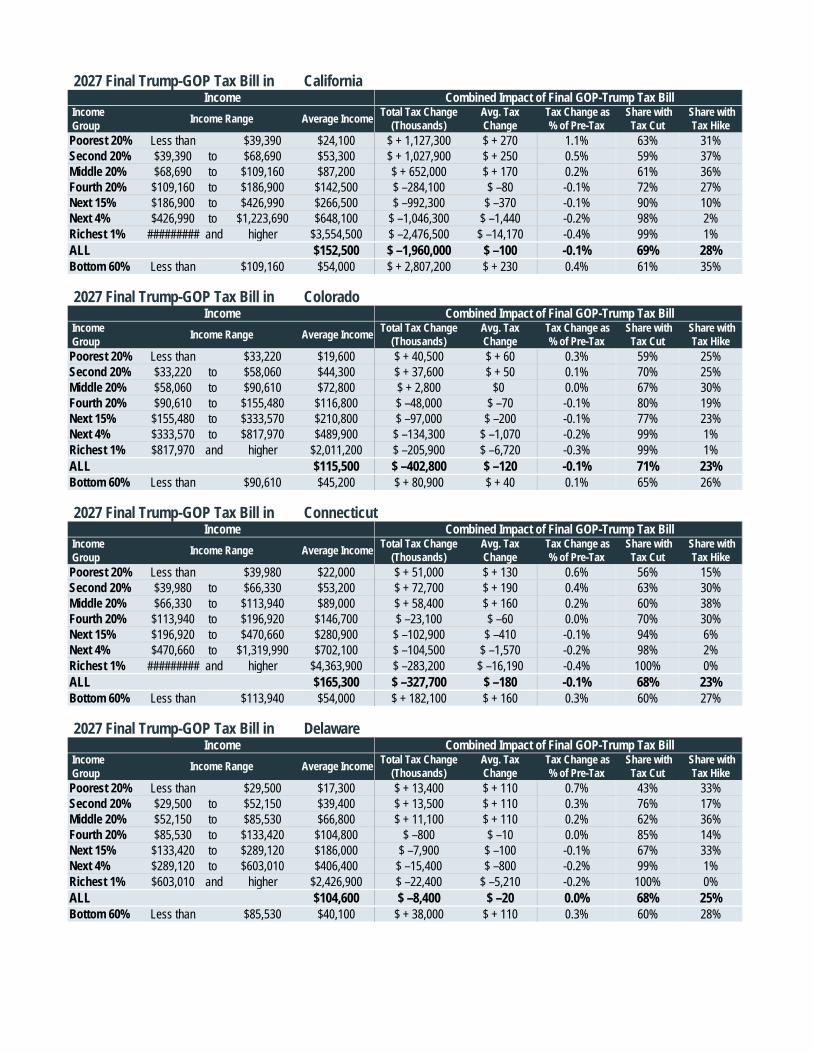
2027 Final Trump-GOP Tax Bill in California
IncomeGroupPoorest 20% Less than $39,390 $24,100 $ + 1,127,300 $ + 270 1.1% 63% 31%Second 20% $39,390 to $68,690 $53,300 $ + 1,027,900 $ + 250 0.5% 59% 37%Middle 20% $68,690 to $109,160 $87,200 $ + 652,000 $ + 170 0.2% 61% 36%Fourth 20% $109,160 to $186,900 $142,500 $ –284,100 $ –80 -0.1% 72% 27%Next 15% $186,900 to $426,990 $266,500 $ –992,300 $ –370 -0.1% 90% 10%Next 4% $426,990 to $1,223,690 $648,100 $ –1,046,300 $ –1,440 -0.2% 98% 2%Richest 1% ######### and higher $3,554,500 $ –2,476,500 $ –14,170 -0.4% 99% 1%ALL $152,500 $ –1,960,000 $ –100 -0.1% 69% 28%Bottom 60% Less than $109,160 $54,000 $ + 2,807,200 $ + 230 0.4% 61% 35%
2027 Final Trump-GOP Tax Bill in Colorado
IncomeGroupPoorest 20% Less than $33,220 $19,600 $ + 40,500 $ + 60 0.3% 59% 25%Second 20% $33,220 to $58,060 $44,300 $ + 37,600 $ + 50 0.1% 70% 25%Middle 20% $58,060 to $90,610 $72,800 $ + 2,800 $0 0.0% 67% 30%Fourth 20% $90,610 to $155,480 $116,800 $ –48,000 $ –70 -0.1% 80% 19%Next 15% $155,480 to $333,570 $210,800 $ –97,000 $ –200 -0.1% 77% 23%Next 4% $333,570 to $817,970 $489,900 $ –134,300 $ –1,070 -0.2% 99% 1%Richest 1% $817,970 and higher $2,011,200 $ –205,900 $ –6,720 -0.3% 99% 1%ALL $115,500 $ –402,800 $ –120 -0.1% 71% 23%Bottom 60% Less than $90,610 $45,200 $ + 80,900 $ + 40 0.1% 65% 26%
2027 Final Trump-GOP Tax Bill in Connecticut
IncomeGroupPoorest 20% Less than $39,980 $22,000 $ + 51,000 $ + 130 0.6% 56% 15%Second 20% $39,980 to $66,330 $53,200 $ + 72,700 $ + 190 0.4% 63% 30%Middle 20% $66,330 to $113,940 $89,000 $ + 58,400 $ + 160 0.2% 60% 38%Fourth 20% $113,940 to $196,920 $146,700 $ –23,100 $ –60 0.0% 70% 30%Next 15% $196,920 to $470,660 $280,900 $ –102,900 $ –410 -0.1% 94% 6%Next 4% $470,660 to $1,319,990 $702,100 $ –104,500 $ –1,570 -0.2% 98% 2%Richest 1% ######### and higher $4,363,900 $ –283,200 $ –16,190 -0.4% 100% 0%ALL $165,300 $ –327,700 $ –180 -0.1% 68% 23%Bottom 60% Less than $113,940 $54,000 $ + 182,100 $ + 160 0.3% 60% 27%
2027 Final Trump-GOP Tax Bill in Delaware
IncomeGroupPoorest 20% Less than $29,500 $17,300 $ + 13,400 $ + 110 0.7% 43% 33%Second 20% $29,500 to $52,150 $39,400 $ + 13,500 $ + 110 0.3% 76% 17%Middle 20% $52,150 to $85,530 $66,800 $ + 11,100 $ + 110 0.2% 62% 36%Fourth 20% $85,530 to $133,420 $104,800 $ –800 $ –10 0.0% 85% 14%Next 15% $133,420 to $289,120 $186,000 $ –7,900 $ –100 -0.1% 67% 33%Next 4% $289,120 to $603,010 $406,400 $ –15,400 $ –800 -0.2% 99% 1%Richest 1% $603,010 and higher $2,426,900 $ –22,400 $ –5,210 -0.2% 100% 0%ALL $104,600 $ –8,400 $ –20 0.0% 68% 25%Bottom 60% Less than $85,530 $40,100 $ + 38,000 $ + 110 0.3% 60% 28%
Share with Tax Cut
Share with Tax Hike Income Range Average Income Total Tax Change
(Thousands) Avg. Tax Change
Tax Change as % of Pre-Tax
Income Combined Impact of Final GOP-Trump Tax Bill
Share with Tax Cut
Share with Tax Hike Income Range Average Income Total Tax Change
(Thousands) Avg. Tax Change
Tax Change as % of Pre-Tax
Tax Change as % of Pre-Tax
Income Combined Impact of Final GOP-Trump Tax Bill
Share with Tax Cut
Share with Tax Hike Income Range Average Income Total Tax Change
(Thousands) Avg. Tax Change
Tax Change as % of Pre-Tax
Income Combined Impact of Final GOP-Trump Tax Bill
Share with Tax Cut
Share with Tax Hike Income Range Average Income Total Tax Change
(Thousands) Avg. Tax Change
Income Combined Impact of Final GOP-Trump Tax Bill

2027 Final Trump-GOP Tax Bill in District of Columbia
IncomeGroupPoorest 20% Less than $36,620 $19,400 $ + 4,700 $ + 50 0.2% 55% 38%Second 20% $36,620 to $66,940 $50,000 $ + 500 $ + 10 0.0% 71% 25%Middle 20% $66,940 to $102,020 $82,500 $ –4,300 $ –40 -0.1% 49% 49%Fourth 20% $102,020 to $175,030 $135,600 $ –8,300 $ –100 -0.1% 86% 13%Next 15% $175,030 to $438,070 $266,900 $ –21,600 $ –370 -0.1% 96% 4%Next 4% $438,070 to $1,373,450 $696,000 $ –26,900 $ –1,650 -0.2% 99% 1%Richest 1% ######### and higher $3,816,000 $ –70,200 $ –16,580 -0.4% 94% 0%ALL $153,800 $ –126,200 $ –280 -0.2% 70% 27%Bottom 60% Less than $102,020 $50,500 $ + 900 $0 0.0% 57% 39%
2027 Final Trump-GOP Tax Bill in Florida
IncomeGroupPoorest 20% Less than $29,270 $18,600 $ + 975,600 $ + 340 1.9% 55% 31%Second 20% $29,270 to $48,100 $38,400 $ + 980,700 $ + 350 0.9% 63% 29%Middle 20% $48,100 to $78,500 $61,600 $ + 875,600 $ + 330 0.5% 65% 30%Fourth 20% $78,500 to $132,980 $102,200 $ + 418,800 $ + 160 0.2% 74% 24%Next 15% $132,980 to $306,580 $193,300 $ –262,500 $ –150 -0.1% 70% 29%Next 4% $306,580 to $901,670 $477,100 $ –391,800 $ –820 -0.2% 90% 9%Richest 1% $901,670 and higher $3,689,700 $ –1,523,700 $ –12,130 -0.3% 100% 0%ALL $121,800 $ + 1,100,700 $ + 80 0.1% 66% 28%Bottom 60% Less than $78,500 $39,100 $ + 2,832,000 $ + 340 0.9% 61% 30%
2027 Final Trump-GOP Tax Bill in Georgia
IncomeGroupPoorest 20% Less than $33,840 $20,500 $ + 264,900 $ + 230 1.1% 58% 32%Second 20% $33,840 to $54,810 $43,700 $ + 261,900 $ + 220 0.5% 53% 37%Middle 20% $54,810 to $88,450 $68,600 $ + 231,000 $ + 220 0.3% 57% 36%Fourth 20% $88,450 to $145,690 $111,300 $ + 17,500 $ + 20 0.0% 74% 24%Next 15% $145,690 to $323,100 $204,500 $ –117,900 $ –150 -0.1% 74% 25%Next 4% $323,100 to $752,190 $467,200 $ –183,900 $ –940 -0.2% 96% 3%Richest 1% $752,190 and higher $2,711,500 $ –355,900 $ –7,040 -0.3% 99% 1%ALL $118,600 $ + 122,800 $ + 20 0.0% 64% 30%Bottom 60% Less than $88,450 $43,400 $ + 757,800 $ + 220 0.5% 56% 35%
2027 Final Trump-GOP Tax Bill in Hawaii
IncomeGroupPoorest 20% Less than $38,300 $21,600 $ + 3,900 $ + 20 0.1% 57% 25%Second 20% $38,300 to $65,280 $51,200 $ + 3,000 $ + 20 0.0% 65% 26%Middle 20% $65,280 to $98,540 $79,400 $ –2,600 $ –20 0.0% 54% 42%Fourth 20% $98,540 to $168,940 $130,800 $ –13,500 $ –90 -0.1% 76% 23%Next 15% $168,940 to $345,210 $233,300 $ –24,000 $ –230 -0.1% 86% 13%Next 4% $345,210 to $759,520 $499,300 $ –25,300 $ –1,010 -0.2% 97% 2%Richest 1% $759,520 and higher $1,925,000 $ –46,700 $ –6,910 -0.4% 98% 2%ALL $120,800 $ –105,100 $ –140 -0.1% 67% 25%Bottom 60% Less than $98,540 $48,700 $ + 4,300 $ + 10 0.0% 59% 30%
Share with Tax Cut
Share with Tax Hike Income Range Average Income Total Tax Change
(Thousands) Avg. Tax Change
Tax Change as % of Pre-Tax
Income Combined Impact of Final GOP-Trump Tax Bill
Share with Tax Cut
Share with Tax Hike Income Range Average Income Total Tax Change
(Thousands) Avg. Tax Change
Tax Change as % of Pre-Tax
Income Combined Impact of Final GOP-Trump Tax Bill
Share with Tax Cut
Share with Tax Hike Income Range Average Income Total Tax Change
(Thousands) Avg. Tax Change
Tax Change as % of Pre-Tax
Income Combined Impact of Final GOP-Trump Tax Bill
Share with Tax Cut
Share with Tax Hike Income Range Average Income Total Tax Change
(Thousands) Avg. Tax Change
Tax Change as % of Pre-Tax
Income Combined Impact of Final GOP-Trump Tax Bill

2027 Final Trump-GOP Tax Bill in Idaho
IncomeGroupPoorest 20% Less than $26,440 $15,400 $ + 52,600 $ + 260 1.7% 70% 25%Second 20% $26,440 to $52,220 $40,400 $ + 49,600 $ + 230 0.6% 57% 31%Middle 20% $52,220 to $79,790 $65,100 $ + 41,000 $ + 220 0.3% 62% 31%Fourth 20% $79,790 to $114,400 $95,300 $ + 26,700 $ + 150 0.2% 78% 20%Next 15% $114,400 to $222,560 $153,000 $ –14,300 $ –110 -0.1% 77% 22%Next 4% $222,560 to $575,000 $334,300 $ –22,700 $ –690 -0.2% 97% 3%Richest 1% $575,000 and higher $1,676,400 $ –41,500 $ –4,670 -0.3% 100% 0%ALL $90,000 $ + 93,500 $ + 100 0.1% 69% 25%Bottom 60% Less than $79,790 $39,600 $ + 143,300 $ + 240 0.6% 63% 29%
2027 Final Trump-GOP Tax Bill in Illinois
IncomeGroupPoorest 20% Less than $36,500 $21,800 $ + 123,300 $ + 90 0.4% 57% 32%Second 20% $36,500 to $65,760 $50,600 $ + 108,200 $ + 90 0.2% 65% 27%Middle 20% $65,760 to $102,990 $83,100 $ + 53,500 $ + 50 0.1% 61% 36%Fourth 20% $102,990 to $170,450 $130,900 $ –61,500 $ –50 0.0% 66% 33%Next 15% $170,450 to $355,880 $234,100 $ –199,900 $ –230 -0.1% 82% 17%Next 4% $355,880 to $887,910 $551,700 $ –227,900 $ –1,060 -0.2% 94% 6%Richest 1% $887,910 and higher $3,583,600 $ –525,200 $ –9,390 -0.3% 99% 1%ALL $141,000 $ –728,000 $ –120 -0.1% 66% 29%Bottom 60% Less than $102,990 $50,600 $ + 284,900 $ + 80 0.1% 61% 32%
2027 Final Trump-GOP Tax Bill in Indiana
IncomeGroupPoorest 20% Less than $36,160 $20,700 $ + 115,200 $ + 160 0.8% 61% 33%Second 20% $36,160 to $63,460 $49,500 $ + 95,800 $ + 140 0.3% 64% 27%Middle 20% $63,460 to $95,590 $78,400 $ + 92,300 $ + 130 0.2% 56% 40%Fourth 20% $95,590 to $146,130 $117,700 $ –16,800 $ –30 0.0% 72% 27%Next 15% $146,130 to $283,650 $196,000 $ –52,600 $ –110 -0.1% 63% 37%Next 4% $283,650 to $714,660 $417,600 $ –82,800 $ –690 -0.2% 96% 4%Richest 1% $714,660 and higher $2,202,800 $ –145,100 $ –4,840 -0.2% 92% 7%ALL $113,500 $ + 8,100 $0 0.0% 64% 31%Bottom 60% Less than $95,590 $49,300 $ + 303,300 $ + 140 0.3% 60% 33%
2027 Final Trump-GOP Tax Bill in Iowa
IncomeGroupPoorest 20% Less than $33,580 $18,800 $ + 25,300 $ + 70 0.4% 65% 23%Second 20% $33,580 to $59,300 $46,700 $ + 20,800 $ + 60 0.1% 77% 17%Middle 20% $59,300 to $87,080 $72,400 $ + 10,700 $ + 30 0.0% 69% 28%Fourth 20% $87,080 to $138,880 $110,800 $ –25,000 $ –80 -0.1% 84% 15%Next 15% $138,880 to $275,620 $180,100 $ –22,400 $ –100 -0.1% 61% 38%Next 4% $275,620 to $570,990 $348,800 $ –23,900 $ –420 -0.1% 71% 29%Richest 1% $570,990 and higher $1,463,100 $ –66,500 $ –4,690 -0.3% 98% 2%ALL $97,900 $ –80,700 $ –50 0.0% 72% 23%Bottom 60% Less than $87,080 $44,900 $ + 56,800 $ + 60 0.1% 70% 22%
Share with Tax Cut
Share with Tax Hike Income Range Average Income Total Tax Change
(Thousands) Avg. Tax Change
Tax Change as % of Pre-Tax
Income Combined Impact of Final GOP-Trump Tax Bill
Share with Tax Cut
Share with Tax Hike Income Range Average Income Total Tax Change
(Thousands) Avg. Tax Change
Tax Change as % of Pre-Tax
Income Combined Impact of Final GOP-Trump Tax Bill
Share with Tax Cut
Share with Tax Hike Income Range Average Income Total Tax Change
(Thousands) Avg. Tax Change
Tax Change as % of Pre-Tax
Income Combined Impact of Final GOP-Trump Tax Bill
Share with Tax Cut
Share with Tax Hike Income Range Average Income Total Tax Change
(Thousands) Avg. Tax Change
Tax Change as % of Pre-Tax
Income Combined Impact of Final GOP-Trump Tax Bill

2027 Final Trump-GOP Tax Bill in Kansas
IncomeGroupPoorest 20% Less than $35,610 $19,600 $ + 30,600 $ + 100 0.5% 63% 23%Second 20% $35,610 to $60,790 $49,300 $ + 32,600 $ + 100 0.2% 64% 28%Middle 20% $60,790 to $93,970 $77,500 $ + 19,800 $ + 70 0.1% 65% 31%Fourth 20% $93,970 to $147,500 $117,100 $ –10,600 $ –40 0.0% 83% 16%Next 15% $147,500 to $278,870 $192,100 $ –20,700 $ –100 -0.1% 65% 34%Next 4% $278,870 to $700,220 $410,800 $ –42,200 $ –810 -0.2% 98% 2%Richest 1% $700,220 and higher $2,306,800 $ –87,500 $ –7,010 -0.3% 92% 8%ALL $113,300 $ –77,700 $ –50 0.0% 69% 25%Bottom 60% Less than $93,970 $47,700 $ + 83,000 $ + 90 0.2% 64% 27%
2027 Final Trump-GOP Tax Bill in Kentucky
IncomeGroupPoorest 20% Less than $27,310 $16,200 $ + 32,600 $ + 70 0.4% 64% 19%Second 20% $27,310 to $49,440 $38,500 $ + 39,900 $ + 90 0.2% 61% 24%Middle 20% $49,440 to $74,540 $60,900 $ + 30,400 $ + 70 0.1% 57% 32%Fourth 20% $74,540 to $120,460 $94,800 $ –23,600 $ –50 -0.1% 80% 13%Next 15% $120,460 to $226,410 $158,100 $ –28,000 $ –90 -0.1% 69% 29%Next 4% $226,410 to $547,480 $327,300 $ –48,300 $ –590 -0.2% 94% 5%Richest 1% $547,480 and higher $1,559,000 $ –92,200 $ –4,700 -0.3% 98% 2%ALL $88,300 $ –88,800 $ –40 0.0% 67% 22%Bottom 60% Less than $74,540 $37,500 $ + 102,900 $ + 70 0.2% 61% 25%
2027 Final Trump-GOP Tax Bill in Louisiana
IncomeGroupPoorest 20% Less than $22,920 $14,200 $ + 92,800 $ + 190 1.3% 63% 30%Second 20% $22,920 to $45,990 $34,200 $ + 102,600 $ + 210 0.6% 47% 39%Middle 20% $45,990 to $67,110 $56,700 $ + 75,700 $ + 160 0.3% 69% 25%Fourth 20% $67,110 to $112,730 $86,600 $ + 42,100 $ + 100 0.1% 75% 20%Next 15% $112,730 to $224,070 $151,900 $ –21,900 $ –70 0.0% 68% 30%Next 4% $224,070 to $562,600 $317,100 $ –40,600 $ –480 -0.2% 95% 5%Richest 1% $562,600 and higher $1,353,500 $ –103,000 $ –5,230 -0.4% 91% 9%ALL $80,500 $ + 153,000 $ + 70 0.1% 65% 27%Bottom 60% Less than $67,110 $34,700 $ + 271,100 $ + 190 0.5% 59% 31%
2027 Final Trump-GOP Tax Bill in Maine
IncomeGroupPoorest 20% Less than $34,830 $19,800 $ + 53,900 $ + 340 1.7% 59% 27%Second 20% $34,830 to $59,650 $47,400 $ + 43,500 $ + 300 0.6% 63% 21%Middle 20% $59,650 to $93,340 $74,100 $ + 44,700 $ + 280 0.4% 51% 36%Fourth 20% $93,340 to $147,140 $116,600 $ + 8,000 $ + 60 0.0% 74% 21%Next 15% $147,140 to $277,340 $194,700 $ –12,600 $ –130 -0.1% 70% 29%Next 4% $277,340 to $670,470 $410,400 $ –22,800 $ –890 -0.2% 99% 1%Richest 1% $670,470 and higher $1,755,700 $ –28,500 $ –4,640 -0.3% 97% 3%ALL $106,700 $ + 88,300 $ + 120 0.1% 64% 25%Bottom 60% Less than $93,340 $47,000 $ + 142,200 $ + 310 0.7% 57% 28%
Share with Tax Cut
Share with Tax Hike Income Range Average Income Total Tax Change
(Thousands) Avg. Tax Change
Tax Change as % of Pre-Tax
Income Combined Impact of Final GOP-Trump Tax Bill
Share with Tax Cut
Share with Tax Hike Income Range Average Income Total Tax Change
(Thousands) Avg. Tax Change
Tax Change as % of Pre-Tax
Income Combined Impact of Final GOP-Trump Tax Bill
Share with Tax Cut
Share with Tax Hike Income Range Average Income Total Tax Change
(Thousands) Avg. Tax Change
Tax Change as % of Pre-Tax
Income Combined Impact of Final GOP-Trump Tax Bill
Share with Tax Cut
Share with Tax Hike Income Range Average Income Total Tax Change
(Thousands) Avg. Tax Change
Tax Change as % of Pre-Tax
Income Combined Impact of Final GOP-Trump Tax Bill

2027 Final Trump-GOP Tax Bill in Maryland
IncomeGroupPoorest 20% Less than $38,690 $21,000 $ + 53,500 $ + 80 0.4% 64% 22%Second 20% $38,690 to $67,900 $53,100 $ + 41,400 $ + 60 0.1% 69% 25%Middle 20% $67,900 to $106,430 $84,900 $ –7,800 $ –10 0.0% 63% 35%Fourth 20% $106,430 to $180,230 $139,200 $ –51,400 $ –80 -0.1% 76% 23%Next 15% $180,230 to $368,700 $249,600 $ –134,100 $ –300 -0.1% 94% 6%Next 4% $368,700 to $910,710 $547,100 $ –141,700 $ –1,200 -0.2% 99% 1%Richest 1% $910,710 and higher $2,545,500 $ –213,100 $ –7,860 -0.3% 99% 0%ALL $133,900 $ –451,800 $ –140 -0.1% 73% 22%Bottom 60% Less than $106,430 $52,000 $ + 87,100 $ + 40 0.1% 65% 27%
2027 Final Trump-GOP Tax Bill in Massachusetts
IncomeGroupPoorest 20% Less than $38,290 $22,800 $ + 36,900 $ + 50 0.2% 57% 18%Second 20% $38,290 to $70,430 $53,600 $ + 39,700 $ + 50 0.1% 64% 24%Middle 20% $70,430 to $119,580 $93,900 $ –20,600 $ –30 0.0% 56% 41%Fourth 20% $119,580 to $206,160 $155,800 $ –71,900 $ –100 -0.1% 69% 31%Next 15% $206,160 to $454,840 $287,500 $ –206,600 $ –390 -0.1% 93% 7%Next 4% $454,840 to $1,209,880 $682,000 $ –175,300 $ –1,270 -0.2% 93% 7%Richest 1% ######### and higher $3,906,500 $ –472,700 $ –13,230 -0.3% 100% 0%ALL $163,700 $ –869,600 $ –220 -0.1% 67% 24%Bottom 60% Less than $119,580 $56,200 $ + 56,100 $ + 20 0.0% 59% 28%
2027 Final Trump-GOP Tax Bill in Michigan
IncomeGroupPoorest 20% Less than $34,160 $19,900 $ + 125,800 $ + 120 0.6% 61% 25%Second 20% $34,160 to $63,390 $48,000 $ + 140,100 $ + 130 0.3% 63% 26%Middle 20% $63,390 to $99,770 $79,700 $ + 110,900 $ + 110 0.1% 65% 31%Fourth 20% $99,770 to $159,850 $125,000 $ –19,700 $ –20 0.0% 74% 24%Next 15% $159,850 to $310,810 $209,700 $ –82,400 $ –120 -0.1% 74% 26%Next 4% $310,810 to $698,540 $449,600 $ –147,900 $ –840 -0.2% 98% 2%Richest 1% $698,540 and higher $2,235,300 $ –299,600 $ –6,720 -0.3% 100% 0%ALL $116,300 $ –165,300 $ –30 0.0% 68% 25%Bottom 60% Less than $99,770 $48,600 $ + 376,900 $ + 120 0.2% 63% 27%
2027 Final Trump-GOP Tax Bill in Minnesota
IncomeGroupPoorest 20% Less than $37,600 $20,900 $ + 10,100 $ + 20 0.1% 70% 21%Second 20% $37,600 to $63,320 $50,500 $ –700 $0 0.0% 74% 22%Middle 20% $63,320 to $99,710 $80,000 $ –20,900 $ –30 0.0% 64% 33%Fourth 20% $99,710 to $153,800 $123,600 $ –50,400 $ –90 -0.1% 81% 19%Next 15% $153,800 to $316,870 $209,900 $ –72,500 $ –170 -0.1% 74% 25%Next 4% $316,870 to $798,030 $485,700 $ –104,000 $ –1,030 -0.2% 99% 1%Richest 1% $798,030 and higher $2,970,400 $ –177,600 $ –6,050 -0.2% 100% 0%ALL $128,100 $ –415,700 $ –140 -0.1% 73% 23%Bottom 60% Less than $99,710 $49,700 $ –11,600 $ –10 0.0% 69% 25%
Share with Tax Cut
Share with Tax Hike Income Range Average Income Total Tax Change
(Thousands) Avg. Tax Change
Tax Change as % of Pre-Tax
Income Combined Impact of Final GOP-Trump Tax Bill
Share with Tax Cut
Share with Tax Hike Income Range Average Income Total Tax Change
(Thousands) Avg. Tax Change
Tax Change as % of Pre-Tax
Income Combined Impact of Final GOP-Trump Tax Bill
Share with Tax Cut
Share with Tax Hike Income Range Average Income Total Tax Change
(Thousands) Avg. Tax Change
Tax Change as % of Pre-Tax
Income Combined Impact of Final GOP-Trump Tax Bill
Share with Tax Cut
Share with Tax Hike Income Range Average Income Total Tax Change
(Thousands) Avg. Tax Change
Tax Change as % of Pre-Tax
Income Combined Impact of Final GOP-Trump Tax Bill
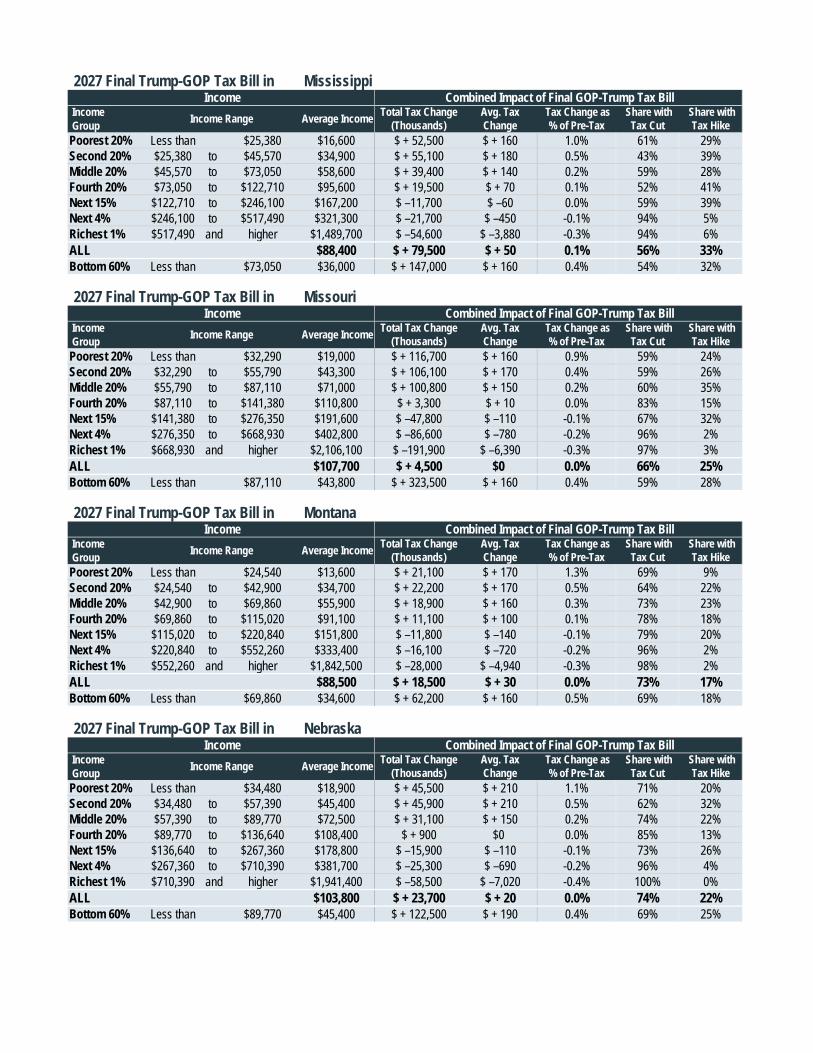
2027 Final Trump-GOP Tax Bill in Mississippi
IncomeGroupPoorest 20% Less than $25,380 $16,600 $ + 52,500 $ + 160 1.0% 61% 29%Second 20% $25,380 to $45,570 $34,900 $ + 55,100 $ + 180 0.5% 43% 39%Middle 20% $45,570 to $73,050 $58,600 $ + 39,400 $ + 140 0.2% 59% 28%Fourth 20% $73,050 to $122,710 $95,600 $ + 19,500 $ + 70 0.1% 52% 41%Next 15% $122,710 to $246,100 $167,200 $ –11,700 $ –60 0.0% 59% 39%Next 4% $246,100 to $517,490 $321,300 $ –21,700 $ –450 -0.1% 94% 5%Richest 1% $517,490 and higher $1,489,700 $ –54,600 $ –3,880 -0.3% 94% 6%ALL $88,400 $ + 79,500 $ + 50 0.1% 56% 33%Bottom 60% Less than $73,050 $36,000 $ + 147,000 $ + 160 0.4% 54% 32%
2027 Final Trump-GOP Tax Bill in Missouri
IncomeGroupPoorest 20% Less than $32,290 $19,000 $ + 116,700 $ + 160 0.9% 59% 24%Second 20% $32,290 to $55,790 $43,300 $ + 106,100 $ + 170 0.4% 59% 26%Middle 20% $55,790 to $87,110 $71,000 $ + 100,800 $ + 150 0.2% 60% 35%Fourth 20% $87,110 to $141,380 $110,800 $ + 3,300 $ + 10 0.0% 83% 15%Next 15% $141,380 to $276,350 $191,600 $ –47,800 $ –110 -0.1% 67% 32%Next 4% $276,350 to $668,930 $402,800 $ –86,600 $ –780 -0.2% 96% 2%Richest 1% $668,930 and higher $2,106,100 $ –191,900 $ –6,390 -0.3% 97% 3%ALL $107,700 $ + 4,500 $0 0.0% 66% 25%Bottom 60% Less than $87,110 $43,800 $ + 323,500 $ + 160 0.4% 59% 28%
2027 Final Trump-GOP Tax Bill in Montana
IncomeGroupPoorest 20% Less than $24,540 $13,600 $ + 21,100 $ + 170 1.3% 69% 9%Second 20% $24,540 to $42,900 $34,700 $ + 22,200 $ + 170 0.5% 64% 22%Middle 20% $42,900 to $69,860 $55,900 $ + 18,900 $ + 160 0.3% 73% 23%Fourth 20% $69,860 to $115,020 $91,100 $ + 11,100 $ + 100 0.1% 78% 18%Next 15% $115,020 to $220,840 $151,800 $ –11,800 $ –140 -0.1% 79% 20%Next 4% $220,840 to $552,260 $333,400 $ –16,100 $ –720 -0.2% 96% 2%Richest 1% $552,260 and higher $1,842,500 $ –28,000 $ –4,940 -0.3% 98% 2%ALL $88,500 $ + 18,500 $ + 30 0.0% 73% 17%Bottom 60% Less than $69,860 $34,600 $ + 62,200 $ + 160 0.5% 69% 18%
2027 Final Trump-GOP Tax Bill in Nebraska
IncomeGroupPoorest 20% Less than $34,480 $18,900 $ + 45,500 $ + 210 1.1% 71% 20%Second 20% $34,480 to $57,390 $45,400 $ + 45,900 $ + 210 0.5% 62% 32%Middle 20% $57,390 to $89,770 $72,500 $ + 31,100 $ + 150 0.2% 74% 22%Fourth 20% $89,770 to $136,640 $108,400 $ + 900 $0 0.0% 85% 13%Next 15% $136,640 to $267,360 $178,800 $ –15,900 $ –110 -0.1% 73% 26%Next 4% $267,360 to $710,390 $381,700 $ –25,300 $ –690 -0.2% 96% 4%Richest 1% $710,390 and higher $1,941,400 $ –58,500 $ –7,020 -0.4% 100% 0%ALL $103,800 $ + 23,700 $ + 20 0.0% 74% 22%Bottom 60% Less than $89,770 $45,400 $ + 122,500 $ + 190 0.4% 69% 25%
Share with Tax Cut
Share with Tax Hike Income Range Average Income Total Tax Change
(Thousands) Avg. Tax Change
Tax Change as % of Pre-Tax
Income Combined Impact of Final GOP-Trump Tax Bill
Share with Tax Cut
Share with Tax Hike Income Range Average Income Total Tax Change
(Thousands) Avg. Tax Change
Tax Change as % of Pre-Tax
Income Combined Impact of Final GOP-Trump Tax Bill
Share with Tax Cut
Share with Tax Hike Income Range Average Income Total Tax Change
(Thousands) Avg. Tax Change
Tax Change as % of Pre-Tax
Income Combined Impact of Final GOP-Trump Tax Bill
Share with Tax Cut
Share with Tax Hike Income Range Average Income Total Tax Change
(Thousands) Avg. Tax Change
Tax Change as % of Pre-Tax
Income Combined Impact of Final GOP-Trump Tax Bill
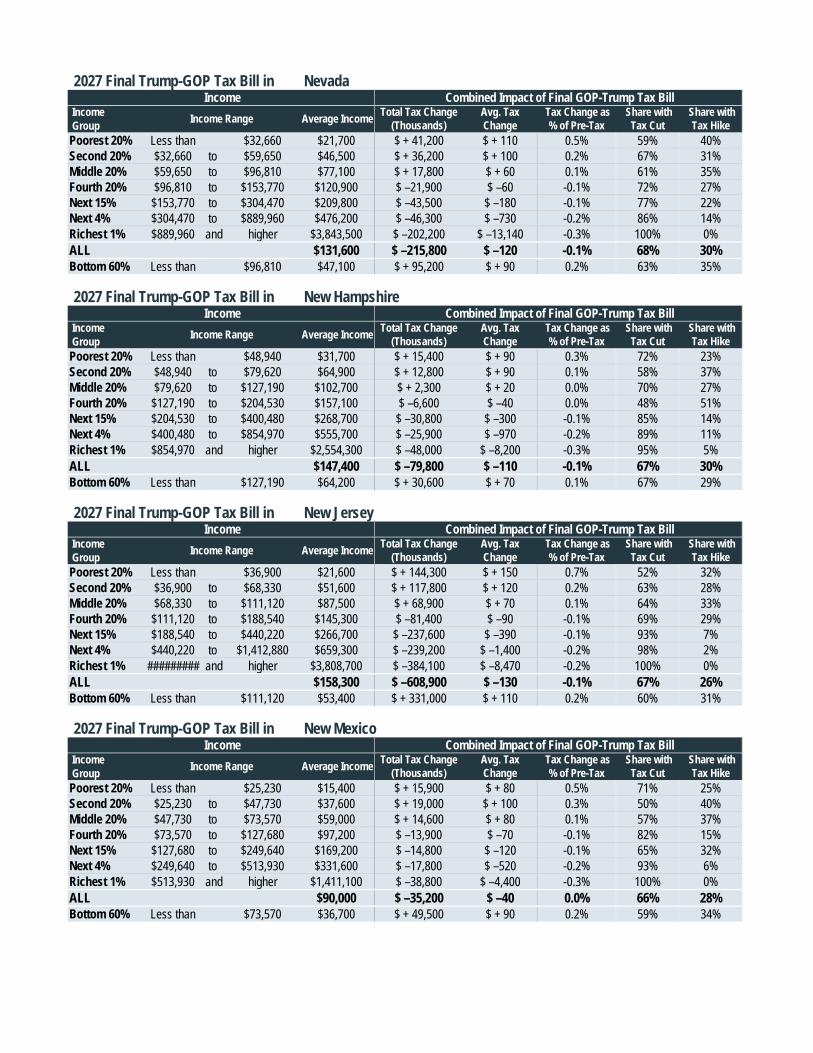
2027 Final Trump-GOP Tax Bill in Nevada
IncomeGroupPoorest 20% Less than $32,660 $21,700 $ + 41,200 $ + 110 0.5% 59% 40%Second 20% $32,660 to $59,650 $46,500 $ + 36,200 $ + 100 0.2% 67% 31%Middle 20% $59,650 to $96,810 $77,100 $ + 17,800 $ + 60 0.1% 61% 35%Fourth 20% $96,810 to $153,770 $120,900 $ –21,900 $ –60 -0.1% 72% 27%Next 15% $153,770 to $304,470 $209,800 $ –43,500 $ –180 -0.1% 77% 22%Next 4% $304,470 to $889,960 $476,200 $ –46,300 $ –730 -0.2% 86% 14%Richest 1% $889,960 and higher $3,843,500 $ –202,200 $ –13,140 -0.3% 100% 0%ALL $131,600 $ –215,800 $ –120 -0.1% 68% 30%Bottom 60% Less than $96,810 $47,100 $ + 95,200 $ + 90 0.2% 63% 35%
2027 Final Trump-GOP Tax Bill in New Hampshire
IncomeGroupPoorest 20% Less than $48,940 $31,700 $ + 15,400 $ + 90 0.3% 72% 23%Second 20% $48,940 to $79,620 $64,900 $ + 12,800 $ + 90 0.1% 58% 37%Middle 20% $79,620 to $127,190 $102,700 $ + 2,300 $ + 20 0.0% 70% 27%Fourth 20% $127,190 to $204,530 $157,100 $ –6,600 $ –40 0.0% 48% 51%Next 15% $204,530 to $400,480 $268,700 $ –30,800 $ –300 -0.1% 85% 14%Next 4% $400,480 to $854,970 $555,700 $ –25,900 $ –970 -0.2% 89% 11%Richest 1% $854,970 and higher $2,554,300 $ –48,000 $ –8,200 -0.3% 95% 5%ALL $147,400 $ –79,800 $ –110 -0.1% 67% 30%Bottom 60% Less than $127,190 $64,200 $ + 30,600 $ + 70 0.1% 67% 29%
2027 Final Trump-GOP Tax Bill in New Jersey
IncomeGroupPoorest 20% Less than $36,900 $21,600 $ + 144,300 $ + 150 0.7% 52% 32%Second 20% $36,900 to $68,330 $51,600 $ + 117,800 $ + 120 0.2% 63% 28%Middle 20% $68,330 to $111,120 $87,500 $ + 68,900 $ + 70 0.1% 64% 33%Fourth 20% $111,120 to $188,540 $145,300 $ –81,400 $ –90 -0.1% 69% 29%Next 15% $188,540 to $440,220 $266,700 $ –237,600 $ –390 -0.1% 93% 7%Next 4% $440,220 to $1,412,880 $659,300 $ –239,200 $ –1,400 -0.2% 98% 2%Richest 1% ######### and higher $3,808,700 $ –384,100 $ –8,470 -0.2% 100% 0%ALL $158,300 $ –608,900 $ –130 -0.1% 67% 26%Bottom 60% Less than $111,120 $53,400 $ + 331,000 $ + 110 0.2% 60% 31%
2027 Final Trump-GOP Tax Bill in New Mexico
IncomeGroupPoorest 20% Less than $25,230 $15,400 $ + 15,900 $ + 80 0.5% 71% 25%Second 20% $25,230 to $47,730 $37,600 $ + 19,000 $ + 100 0.3% 50% 40%Middle 20% $47,730 to $73,570 $59,000 $ + 14,600 $ + 80 0.1% 57% 37%Fourth 20% $73,570 to $127,680 $97,200 $ –13,900 $ –70 -0.1% 82% 15%Next 15% $127,680 to $249,640 $169,200 $ –14,800 $ –120 -0.1% 65% 32%Next 4% $249,640 to $513,930 $331,600 $ –17,800 $ –520 -0.2% 93% 6%Richest 1% $513,930 and higher $1,411,100 $ –38,800 $ –4,400 -0.3% 100% 0%ALL $90,000 $ –35,200 $ –40 0.0% 66% 28%Bottom 60% Less than $73,570 $36,700 $ + 49,500 $ + 90 0.2% 59% 34%
Share with Tax Cut
Share with Tax Hike Income Range Average Income Total Tax Change
(Thousands) Avg. Tax Change
Tax Change as % of Pre-Tax
Income Combined Impact of Final GOP-Trump Tax Bill
Share with Tax Cut
Share with Tax Hike Income Range Average Income Total Tax Change
(Thousands) Avg. Tax Change
Tax Change as % of Pre-Tax
Income Combined Impact of Final GOP-Trump Tax Bill
Share with Tax Cut
Share with Tax Hike Income Range Average Income Total Tax Change
(Thousands) Avg. Tax Change
Tax Change as % of Pre-Tax
Income Combined Impact of Final GOP-Trump Tax Bill
Share with Tax Cut
Share with Tax Hike Income Range Average Income Total Tax Change
(Thousands) Avg. Tax Change
Tax Change as % of Pre-Tax
Income Combined Impact of Final GOP-Trump Tax Bill
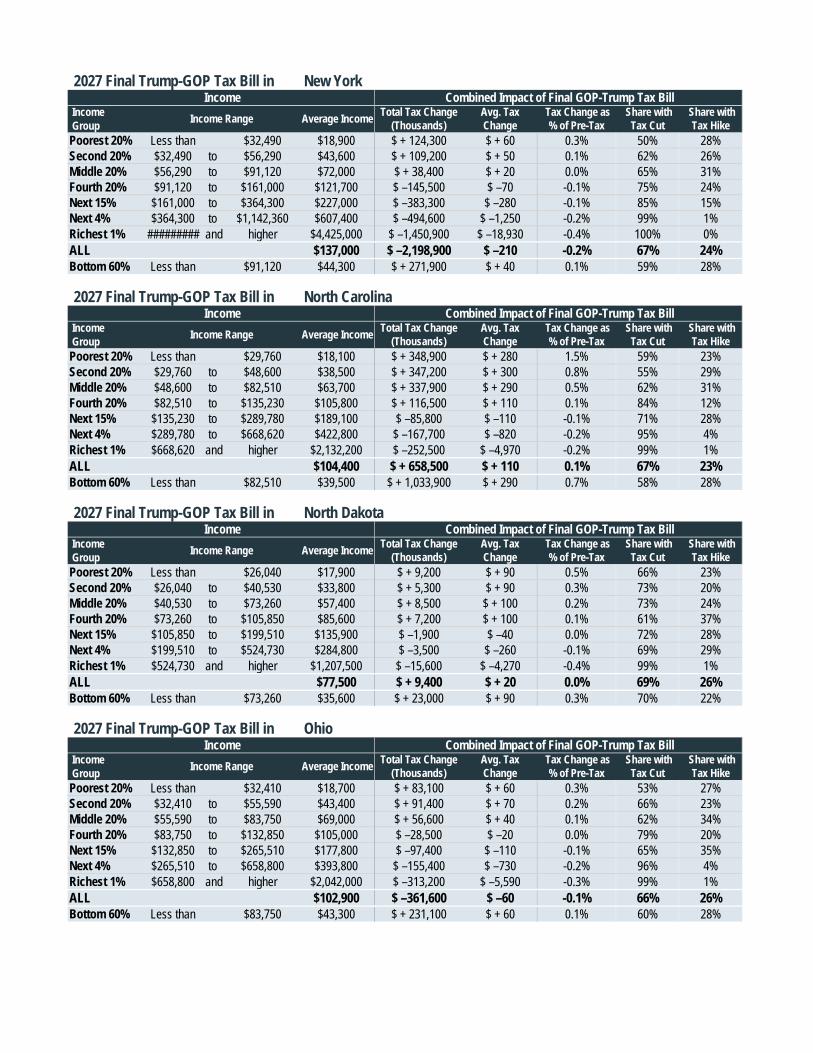
2027 Final Trump-GOP Tax Bill in New York
IncomeGroupPoorest 20% Less than $32,490 $18,900 $ + 124,300 $ + 60 0.3% 50% 28%Second 20% $32,490 to $56,290 $43,600 $ + 109,200 $ + 50 0.1% 62% 26%Middle 20% $56,290 to $91,120 $72,000 $ + 38,400 $ + 20 0.0% 65% 31%Fourth 20% $91,120 to $161,000 $121,700 $ –145,500 $ –70 -0.1% 75% 24%Next 15% $161,000 to $364,300 $227,000 $ –383,300 $ –280 -0.1% 85% 15%Next 4% $364,300 to $1,142,360 $607,400 $ –494,600 $ –1,250 -0.2% 99% 1%Richest 1% ######### and higher $4,425,000 $ –1,450,900 $ –18,930 -0.4% 100% 0%ALL $137,000 $ –2,198,900 $ –210 -0.2% 67% 24%Bottom 60% Less than $91,120 $44,300 $ + 271,900 $ + 40 0.1% 59% 28%
2027 Final Trump-GOP Tax Bill in North Carolina
IncomeGroupPoorest 20% Less than $29,760 $18,100 $ + 348,900 $ + 280 1.5% 59% 23%Second 20% $29,760 to $48,600 $38,500 $ + 347,200 $ + 300 0.8% 55% 29%Middle 20% $48,600 to $82,510 $63,700 $ + 337,900 $ + 290 0.5% 62% 31%Fourth 20% $82,510 to $135,230 $105,800 $ + 116,500 $ + 110 0.1% 84% 12%Next 15% $135,230 to $289,780 $189,100 $ –85,800 $ –110 -0.1% 71% 28%Next 4% $289,780 to $668,620 $422,800 $ –167,700 $ –820 -0.2% 95% 4%Richest 1% $668,620 and higher $2,132,200 $ –252,500 $ –4,970 -0.2% 99% 1%ALL $104,400 $ + 658,500 $ + 110 0.1% 67% 23%Bottom 60% Less than $82,510 $39,500 $ + 1,033,900 $ + 290 0.7% 58% 28%
2027 Final Trump-GOP Tax Bill in North Dakota
IncomeGroupPoorest 20% Less than $26,040 $17,900 $ + 9,200 $ + 90 0.5% 66% 23%Second 20% $26,040 to $40,530 $33,800 $ + 5,300 $ + 90 0.3% 73% 20%Middle 20% $40,530 to $73,260 $57,400 $ + 8,500 $ + 100 0.2% 73% 24%Fourth 20% $73,260 to $105,850 $85,600 $ + 7,200 $ + 100 0.1% 61% 37%Next 15% $105,850 to $199,510 $135,900 $ –1,900 $ –40 0.0% 72% 28%Next 4% $199,510 to $524,730 $284,800 $ –3,500 $ –260 -0.1% 69% 29%Richest 1% $524,730 and higher $1,207,500 $ –15,600 $ –4,270 -0.4% 99% 1%ALL $77,500 $ + 9,400 $ + 20 0.0% 69% 26%Bottom 60% Less than $73,260 $35,600 $ + 23,000 $ + 90 0.3% 70% 22%
2027 Final Trump-GOP Tax Bill in Ohio
IncomeGroupPoorest 20% Less than $32,410 $18,700 $ + 83,100 $ + 60 0.3% 53% 27%Second 20% $32,410 to $55,590 $43,400 $ + 91,400 $ + 70 0.2% 66% 23%Middle 20% $55,590 to $83,750 $69,000 $ + 56,600 $ + 40 0.1% 62% 34%Fourth 20% $83,750 to $132,850 $105,000 $ –28,500 $ –20 0.0% 79% 20%Next 15% $132,850 to $265,510 $177,800 $ –97,400 $ –110 -0.1% 65% 35%Next 4% $265,510 to $658,800 $393,800 $ –155,400 $ –730 -0.2% 96% 4%Richest 1% $658,800 and higher $2,042,000 $ –313,200 $ –5,590 -0.3% 99% 1%ALL $102,900 $ –361,600 $ –60 -0.1% 66% 26%Bottom 60% Less than $83,750 $43,300 $ + 231,100 $ + 60 0.1% 60% 28%
Share with Tax Cut
Share with Tax Hike Income Range Average Income Total Tax Change
(Thousands) Avg. Tax Change
Tax Change as % of Pre-Tax
Income Combined Impact of Final GOP-Trump Tax Bill
Share with Tax Cut
Share with Tax Hike Income Range Average Income Total Tax Change
(Thousands) Avg. Tax Change
Tax Change as % of Pre-Tax
Income Combined Impact of Final GOP-Trump Tax Bill
Share with Tax Cut
Share with Tax Hike Income Range Average Income Total Tax Change
(Thousands) Avg. Tax Change
Tax Change as % of Pre-Tax
Income Combined Impact of Final GOP-Trump Tax Bill
Share with Tax Cut
Share with Tax Hike Income Range Average Income Total Tax Change
(Thousands) Avg. Tax Change
Tax Change as % of Pre-Tax
Income Combined Impact of Final GOP-Trump Tax Bill
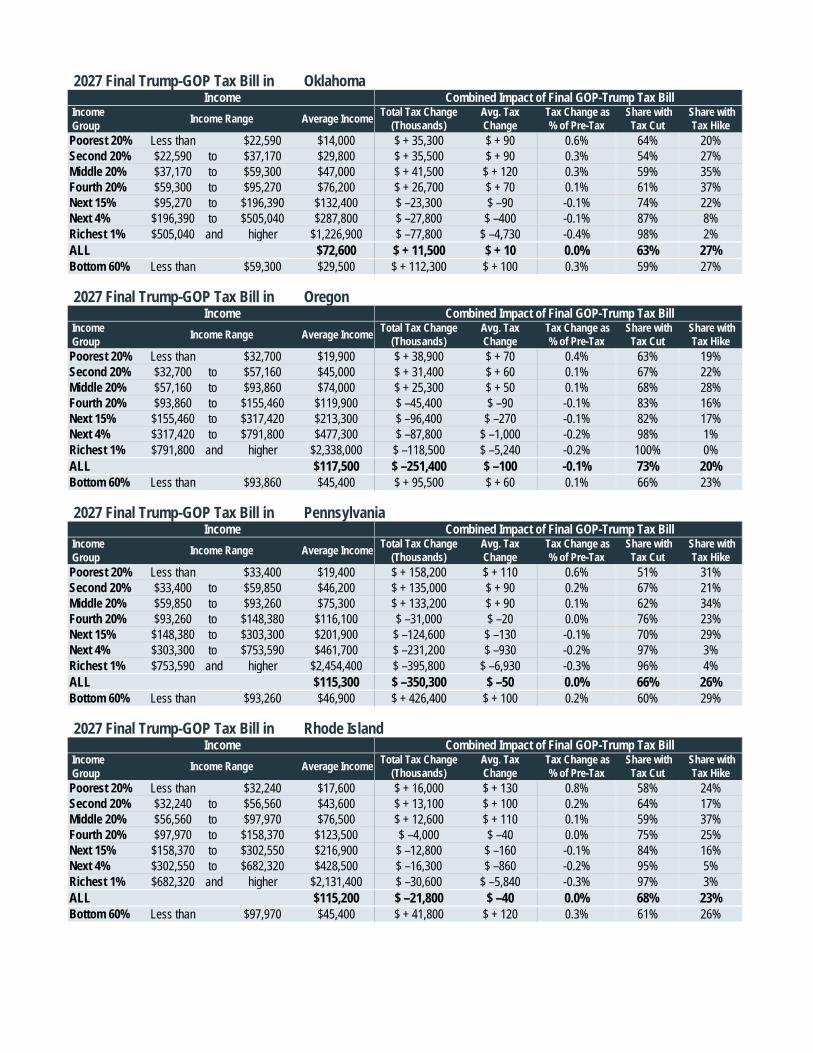
2027 Final Trump-GOP Tax Bill in Oklahoma
IncomeGroupPoorest 20% Less than $22,590 $14,000 $ + 35,300 $ + 90 0.6% 64% 20%Second 20% $22,590 to $37,170 $29,800 $ + 35,500 $ + 90 0.3% 54% 27%Middle 20% $37,170 to $59,300 $47,000 $ + 41,500 $ + 120 0.3% 59% 35%Fourth 20% $59,300 to $95,270 $76,200 $ + 26,700 $ + 70 0.1% 61% 37%Next 15% $95,270 to $196,390 $132,400 $ –23,300 $ –90 -0.1% 74% 22%Next 4% $196,390 to $505,040 $287,800 $ –27,800 $ –400 -0.1% 87% 8%Richest 1% $505,040 and higher $1,226,900 $ –77,800 $ –4,730 -0.4% 98% 2%ALL $72,600 $ + 11,500 $ + 10 0.0% 63% 27%Bottom 60% Less than $59,300 $29,500 $ + 112,300 $ + 100 0.3% 59% 27%
2027 Final Trump-GOP Tax Bill in Oregon
IncomeGroupPoorest 20% Less than $32,700 $19,900 $ + 38,900 $ + 70 0.4% 63% 19%Second 20% $32,700 to $57,160 $45,000 $ + 31,400 $ + 60 0.1% 67% 22%Middle 20% $57,160 to $93,860 $74,000 $ + 25,300 $ + 50 0.1% 68% 28%Fourth 20% $93,860 to $155,460 $119,900 $ –45,400 $ –90 -0.1% 83% 16%Next 15% $155,460 to $317,420 $213,300 $ –96,400 $ –270 -0.1% 82% 17%Next 4% $317,420 to $791,800 $477,300 $ –87,800 $ –1,000 -0.2% 98% 1%Richest 1% $791,800 and higher $2,338,000 $ –118,500 $ –5,240 -0.2% 100% 0%ALL $117,500 $ –251,400 $ –100 -0.1% 73% 20%Bottom 60% Less than $93,860 $45,400 $ + 95,500 $ + 60 0.1% 66% 23%
2027 Final Trump-GOP Tax Bill in Pennsylvania
IncomeGroupPoorest 20% Less than $33,400 $19,400 $ + 158,200 $ + 110 0.6% 51% 31%Second 20% $33,400 to $59,850 $46,200 $ + 135,000 $ + 90 0.2% 67% 21%Middle 20% $59,850 to $93,260 $75,300 $ + 133,200 $ + 90 0.1% 62% 34%Fourth 20% $93,260 to $148,380 $116,100 $ –31,000 $ –20 0.0% 76% 23%Next 15% $148,380 to $303,300 $201,900 $ –124,600 $ –130 -0.1% 70% 29%Next 4% $303,300 to $753,590 $461,700 $ –231,200 $ –930 -0.2% 97% 3%Richest 1% $753,590 and higher $2,454,400 $ –395,800 $ –6,930 -0.3% 96% 4%ALL $115,300 $ –350,300 $ –50 0.0% 66% 26%Bottom 60% Less than $93,260 $46,900 $ + 426,400 $ + 100 0.2% 60% 29%
2027 Final Trump-GOP Tax Bill in Rhode Island
IncomeGroupPoorest 20% Less than $32,240 $17,600 $ + 16,000 $ + 130 0.8% 58% 24%Second 20% $32,240 to $56,560 $43,600 $ + 13,100 $ + 100 0.2% 64% 17%Middle 20% $56,560 to $97,970 $76,500 $ + 12,600 $ + 110 0.1% 59% 37%Fourth 20% $97,970 to $158,370 $123,500 $ –4,000 $ –40 0.0% 75% 25%Next 15% $158,370 to $302,550 $216,900 $ –12,800 $ –160 -0.1% 84% 16%Next 4% $302,550 to $682,320 $428,500 $ –16,300 $ –860 -0.2% 95% 5%Richest 1% $682,320 and higher $2,131,400 $ –30,600 $ –5,840 -0.3% 97% 3%ALL $115,200 $ –21,800 $ –40 0.0% 68% 23%Bottom 60% Less than $97,970 $45,400 $ + 41,800 $ + 120 0.3% 61% 26%
Share with Tax Cut
Share with Tax Hike Income Range Average Income Total Tax Change
(Thousands) Avg. Tax Change
Tax Change as % of Pre-Tax
Income Combined Impact of Final GOP-Trump Tax Bill
Share with Tax Cut
Share with Tax Hike Income Range Average Income Total Tax Change
(Thousands) Avg. Tax Change
Tax Change as % of Pre-Tax
Income Combined Impact of Final GOP-Trump Tax Bill
Share with Tax Cut
Share with Tax Hike Income Range Average Income Total Tax Change
(Thousands) Avg. Tax Change
Tax Change as % of Pre-Tax
Income Combined Impact of Final GOP-Trump Tax Bill
Share with Tax Cut
Share with Tax Hike Income Range Average Income Total Tax Change
(Thousands) Avg. Tax Change
Tax Change as % of Pre-Tax
Income Combined Impact of Final GOP-Trump Tax Bill
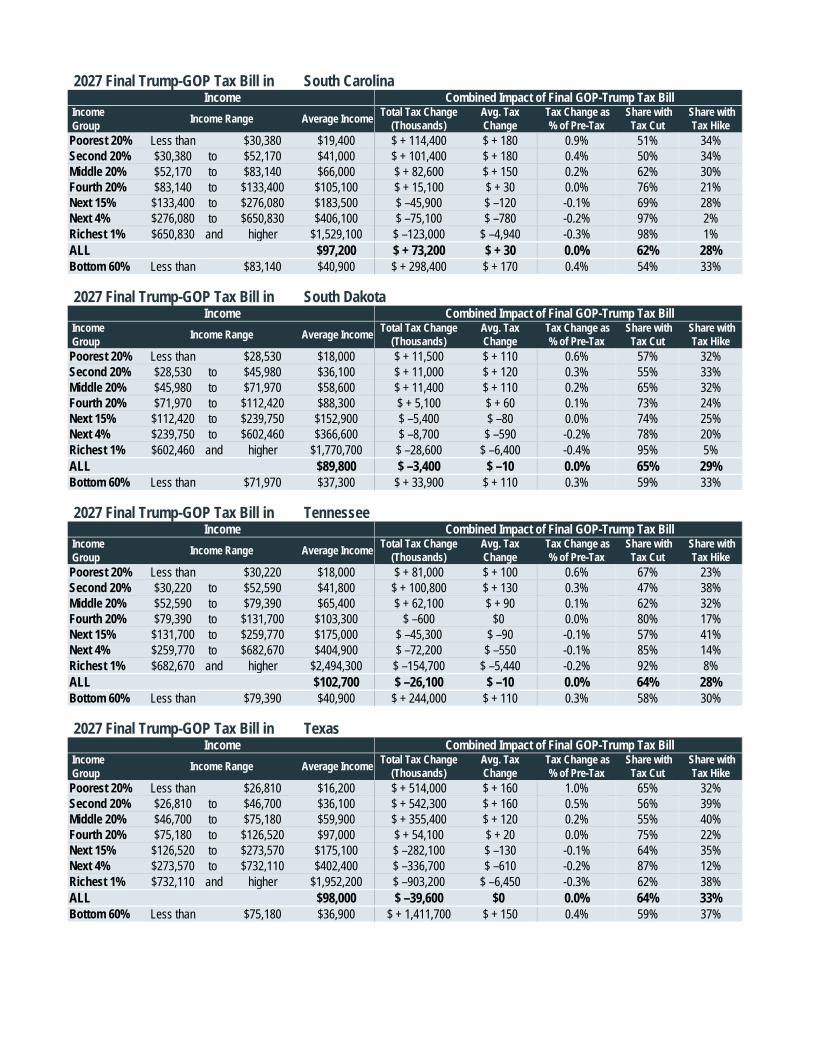
2027 Final Trump-GOP Tax Bill in South Carolina
IncomeGroupPoorest 20% Less than $30,380 $19,400 $ + 114,400 $ + 180 0.9% 51% 34%Second 20% $30,380 to $52,170 $41,000 $ + 101,400 $ + 180 0.4% 50% 34%Middle 20% $52,170 to $83,140 $66,000 $ + 82,600 $ + 150 0.2% 62% 30%Fourth 20% $83,140 to $133,400 $105,100 $ + 15,100 $ + 30 0.0% 76% 21%Next 15% $133,400 to $276,080 $183,500 $ –45,900 $ –120 -0.1% 69% 28%Next 4% $276,080 to $650,830 $406,100 $ –75,100 $ –780 -0.2% 97% 2%Richest 1% $650,830 and higher $1,529,100 $ –123,000 $ –4,940 -0.3% 98% 1%ALL $97,200 $ + 73,200 $ + 30 0.0% 62% 28%Bottom 60% Less than $83,140 $40,900 $ + 298,400 $ + 170 0.4% 54% 33%
2027 Final Trump-GOP Tax Bill in South Dakota
IncomeGroupPoorest 20% Less than $28,530 $18,000 $ + 11,500 $ + 110 0.6% 57% 32%Second 20% $28,530 to $45,980 $36,100 $ + 11,000 $ + 120 0.3% 55% 33%Middle 20% $45,980 to $71,970 $58,600 $ + 11,400 $ + 110 0.2% 65% 32%Fourth 20% $71,970 to $112,420 $88,300 $ + 5,100 $ + 60 0.1% 73% 24%Next 15% $112,420 to $239,750 $152,900 $ –5,400 $ –80 0.0% 74% 25%Next 4% $239,750 to $602,460 $366,600 $ –8,700 $ –590 -0.2% 78% 20%Richest 1% $602,460 and higher $1,770,700 $ –28,600 $ –6,400 -0.4% 95% 5%ALL $89,800 $ –3,400 $ –10 0.0% 65% 29%Bottom 60% Less than $71,970 $37,300 $ + 33,900 $ + 110 0.3% 59% 33%
2027 Final Trump-GOP Tax Bill in Tennessee
IncomeGroupPoorest 20% Less than $30,220 $18,000 $ + 81,000 $ + 100 0.6% 67% 23%Second 20% $30,220 to $52,590 $41,800 $ + 100,800 $ + 130 0.3% 47% 38%Middle 20% $52,590 to $79,390 $65,400 $ + 62,100 $ + 90 0.1% 62% 32%Fourth 20% $79,390 to $131,700 $103,300 $ –600 $0 0.0% 80% 17%Next 15% $131,700 to $259,770 $175,000 $ –45,300 $ –90 -0.1% 57% 41%Next 4% $259,770 to $682,670 $404,900 $ –72,200 $ –550 -0.1% 85% 14%Richest 1% $682,670 and higher $2,494,300 $ –154,700 $ –5,440 -0.2% 92% 8%ALL $102,700 $ –26,100 $ –10 0.0% 64% 28%Bottom 60% Less than $79,390 $40,900 $ + 244,000 $ + 110 0.3% 58% 30%
2027 Final Trump-GOP Tax Bill in Texas
IncomeGroupPoorest 20% Less than $26,810 $16,200 $ + 514,000 $ + 160 1.0% 65% 32%Second 20% $26,810 to $46,700 $36,100 $ + 542,300 $ + 160 0.5% 56% 39%Middle 20% $46,700 to $75,180 $59,900 $ + 355,400 $ + 120 0.2% 55% 40%Fourth 20% $75,180 to $126,520 $97,000 $ + 54,100 $ + 20 0.0% 75% 22%Next 15% $126,520 to $273,570 $175,100 $ –282,100 $ –130 -0.1% 64% 35%Next 4% $273,570 to $732,110 $402,400 $ –336,700 $ –610 -0.2% 87% 12%Richest 1% $732,110 and higher $1,952,200 $ –903,200 $ –6,450 -0.3% 62% 38%ALL $98,000 $ –39,600 $0 0.0% 64% 33%Bottom 60% Less than $75,180 $36,900 $ + 1,411,700 $ + 150 0.4% 59% 37%
Share with Tax Cut
Share with Tax Hike Income Range Average Income Total Tax Change
(Thousands) Avg. Tax Change
Tax Change as % of Pre-Tax
Income Combined Impact of Final GOP-Trump Tax Bill
Share with Tax Cut
Share with Tax Hike Income Range Average Income Total Tax Change
(Thousands) Avg. Tax Change
Tax Change as % of Pre-Tax
Income Combined Impact of Final GOP-Trump Tax Bill
Share with Tax Cut
Share with Tax Hike Income Range Average Income Total Tax Change
(Thousands) Avg. Tax Change
Tax Change as % of Pre-Tax
Income Combined Impact of Final GOP-Trump Tax Bill
Share with Tax Cut
Share with Tax Hike Income Range Average Income Total Tax Change
(Thousands) Avg. Tax Change
Tax Change as % of Pre-Tax
Income Combined Impact of Final GOP-Trump Tax Bill
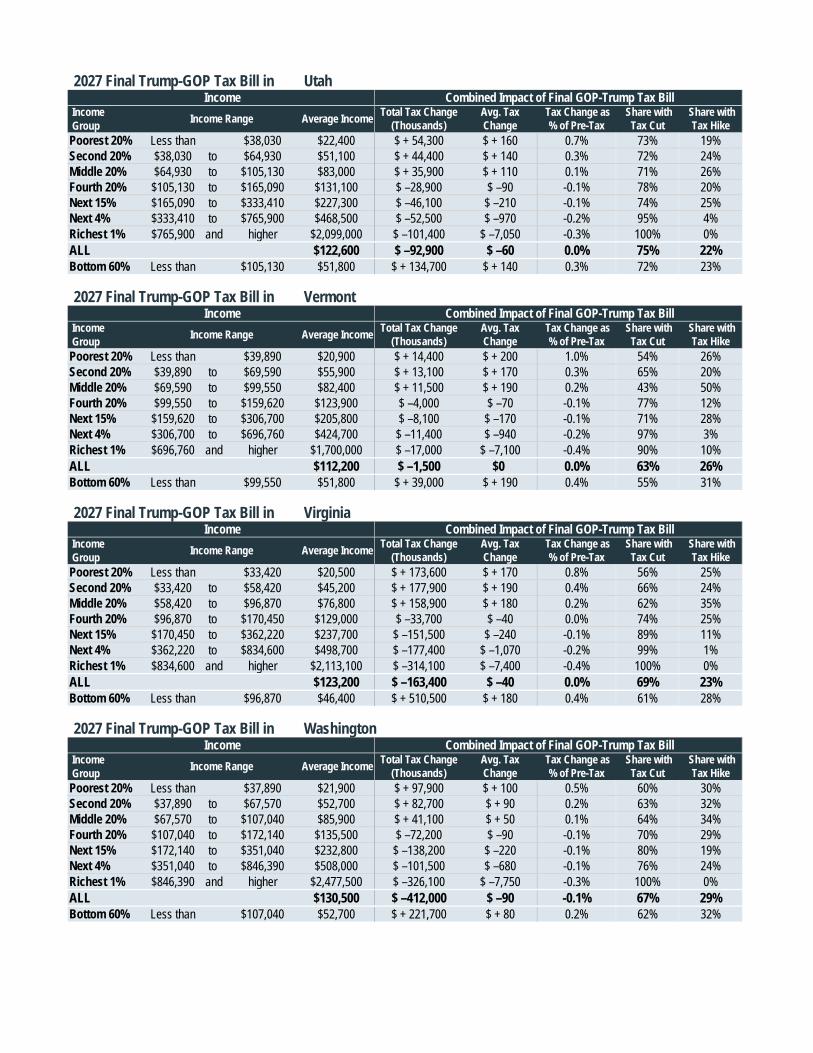
2027 Final Trump-GOP Tax Bill in Utah
IncomeGroupPoorest 20% Less than $38,030 $22,400 $ + 54,300 $ + 160 0.7% 73% 19%Second 20% $38,030 to $64,930 $51,100 $ + 44,400 $ + 140 0.3% 72% 24%Middle 20% $64,930 to $105,130 $83,000 $ + 35,900 $ + 110 0.1% 71% 26%Fourth 20% $105,130 to $165,090 $131,100 $ –28,900 $ –90 -0.1% 78% 20%Next 15% $165,090 to $333,410 $227,300 $ –46,100 $ –210 -0.1% 74% 25%Next 4% $333,410 to $765,900 $468,500 $ –52,500 $ –970 -0.2% 95% 4%Richest 1% $765,900 and higher $2,099,000 $ –101,400 $ –7,050 -0.3% 100% 0%ALL $122,600 $ –92,900 $ –60 0.0% 75% 22%Bottom 60% Less than $105,130 $51,800 $ + 134,700 $ + 140 0.3% 72% 23%
2027 Final Trump-GOP Tax Bill in Vermont
IncomeGroupPoorest 20% Less than $39,890 $20,900 $ + 14,400 $ + 200 1.0% 54% 26%Second 20% $39,890 to $69,590 $55,900 $ + 13,100 $ + 170 0.3% 65% 20%Middle 20% $69,590 to $99,550 $82,400 $ + 11,500 $ + 190 0.2% 43% 50%Fourth 20% $99,550 to $159,620 $123,900 $ –4,000 $ –70 -0.1% 77% 12%Next 15% $159,620 to $306,700 $205,800 $ –8,100 $ –170 -0.1% 71% 28%Next 4% $306,700 to $696,760 $424,700 $ –11,400 $ –940 -0.2% 97% 3%Richest 1% $696,760 and higher $1,700,000 $ –17,000 $ –7,100 -0.4% 90% 10%ALL $112,200 $ –1,500 $0 0.0% 63% 26%Bottom 60% Less than $99,550 $51,800 $ + 39,000 $ + 190 0.4% 55% 31%
2027 Final Trump-GOP Tax Bill in Virginia
IncomeGroupPoorest 20% Less than $33,420 $20,500 $ + 173,600 $ + 170 0.8% 56% 25%Second 20% $33,420 to $58,420 $45,200 $ + 177,900 $ + 190 0.4% 66% 24%Middle 20% $58,420 to $96,870 $76,800 $ + 158,900 $ + 180 0.2% 62% 35%Fourth 20% $96,870 to $170,450 $129,000 $ –33,700 $ –40 0.0% 74% 25%Next 15% $170,450 to $362,220 $237,700 $ –151,500 $ –240 -0.1% 89% 11%Next 4% $362,220 to $834,600 $498,700 $ –177,400 $ –1,070 -0.2% 99% 1%Richest 1% $834,600 and higher $2,113,100 $ –314,100 $ –7,400 -0.4% 100% 0%ALL $123,200 $ –163,400 $ –40 0.0% 69% 23%Bottom 60% Less than $96,870 $46,400 $ + 510,500 $ + 180 0.4% 61% 28%
2027 Final Trump-GOP Tax Bill in Washington
IncomeGroupPoorest 20% Less than $37,890 $21,900 $ + 97,900 $ + 100 0.5% 60% 30%Second 20% $37,890 to $67,570 $52,700 $ + 82,700 $ + 90 0.2% 63% 32%Middle 20% $67,570 to $107,040 $85,900 $ + 41,100 $ + 50 0.1% 64% 34%Fourth 20% $107,040 to $172,140 $135,500 $ –72,200 $ –90 -0.1% 70% 29%Next 15% $172,140 to $351,040 $232,800 $ –138,200 $ –220 -0.1% 80% 19%Next 4% $351,040 to $846,390 $508,000 $ –101,500 $ –680 -0.1% 76% 24%Richest 1% $846,390 and higher $2,477,500 $ –326,100 $ –7,750 -0.3% 100% 0%ALL $130,500 $ –412,000 $ –90 -0.1% 67% 29%Bottom 60% Less than $107,040 $52,700 $ + 221,700 $ + 80 0.2% 62% 32%
Share with Tax Cut
Share with Tax Hike Income Range Average Income Total Tax Change
(Thousands) Avg. Tax Change
Tax Change as % of Pre-Tax
Income Combined Impact of Final GOP-Trump Tax Bill
Share with Tax Cut
Share with Tax Hike Income Range Average Income Total Tax Change
(Thousands) Avg. Tax Change
Tax Change as % of Pre-Tax
Income Combined Impact of Final GOP-Trump Tax Bill
Share with Tax Cut
Share with Tax Hike Income Range Average Income Total Tax Change
(Thousands) Avg. Tax Change
Tax Change as % of Pre-Tax
Income Combined Impact of Final GOP-Trump Tax Bill
Share with Tax Cut
Share with Tax Hike Income Range Average Income Total Tax Change
(Thousands) Avg. Tax Change
Tax Change as % of Pre-Tax
Income Combined Impact of Final GOP-Trump Tax Bill
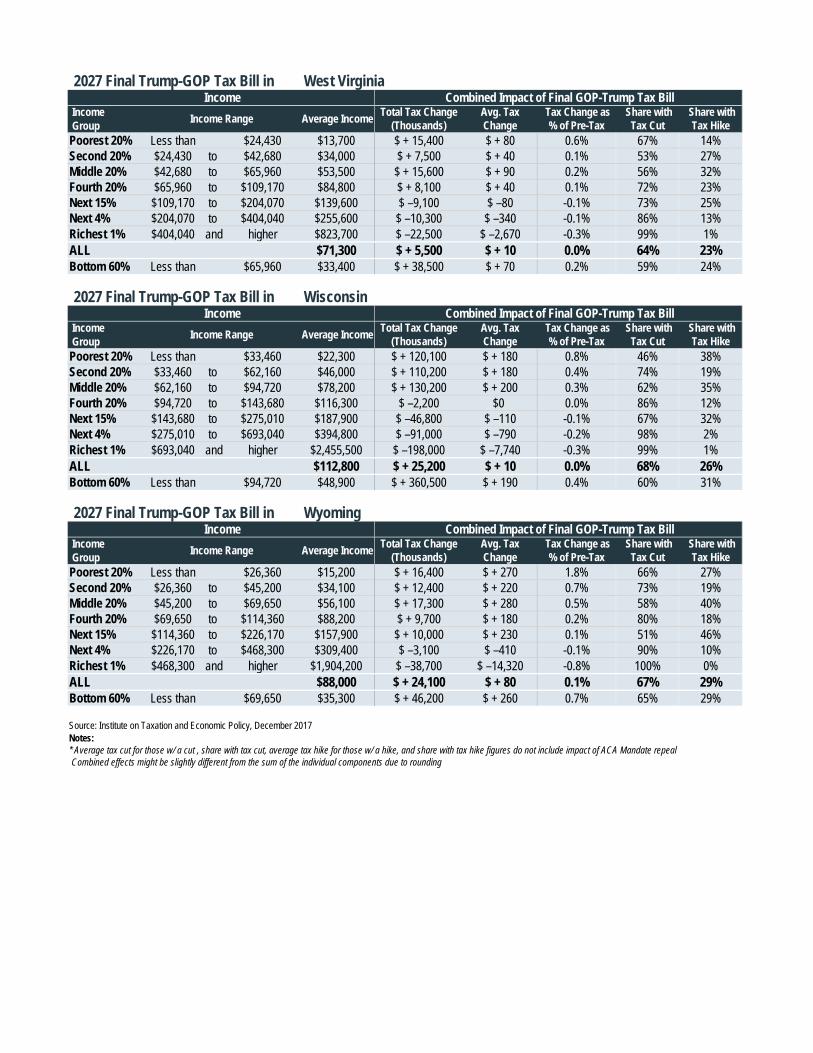
2027 Final Trump-GOP Tax Bill in West Virginia
IncomeGroupPoorest 20% Less than $24,430 $13,700 $ + 15,400 $ + 80 0.6% 67% 14%Second 20% $24,430 to $42,680 $34,000 $ + 7,500 $ + 40 0.1% 53% 27%Middle 20% $42,680 to $65,960 $53,500 $ + 15,600 $ + 90 0.2% 56% 32%Fourth 20% $65,960 to $109,170 $84,800 $ + 8,100 $ + 40 0.1% 72% 23%Next 15% $109,170 to $204,070 $139,600 $ –9,100 $ –80 -0.1% 73% 25%Next 4% $204,070 to $404,040 $255,600 $ –10,300 $ –340 -0.1% 86% 13%Richest 1% $404,040 and higher $823,700 $ –22,500 $ –2,670 -0.3% 99% 1%ALL $71,300 $ + 5,500 $ + 10 0.0% 64% 23%Bottom 60% Less than $65,960 $33,400 $ + 38,500 $ + 70 0.2% 59% 24%
2027 Final Trump-GOP Tax Bill in Wisconsin
IncomeGroupPoorest 20% Less than $33,460 $22,300 $ + 120,100 $ + 180 0.8% 46% 38%Second 20% $33,460 to $62,160 $46,000 $ + 110,200 $ + 180 0.4% 74% 19%Middle 20% $62,160 to $94,720 $78,200 $ + 130,200 $ + 200 0.3% 62% 35%Fourth 20% $94,720 to $143,680 $116,300 $ –2,200 $0 0.0% 86% 12%Next 15% $143,680 to $275,010 $187,900 $ –46,800 $ –110 -0.1% 67% 32%Next 4% $275,010 to $693,040 $394,800 $ –91,000 $ –790 -0.2% 98% 2%Richest 1% $693,040 and higher $2,455,500 $ –198,000 $ –7,740 -0.3% 99% 1%ALL $112,800 $ + 25,200 $ + 10 0.0% 68% 26%Bottom 60% Less than $94,720 $48,900 $ + 360,500 $ + 190 0.4% 60% 31%
2027 Final Trump-GOP Tax Bill in Wyoming
IncomeGroupPoorest 20% Less than $26,360 $15,200 $ + 16,400 $ + 270 1.8% 66% 27%Second 20% $26,360 to $45,200 $34,100 $ + 12,400 $ + 220 0.7% 73% 19%Middle 20% $45,200 to $69,650 $56,100 $ + 17,300 $ + 280 0.5% 58% 40%Fourth 20% $69,650 to $114,360 $88,200 $ + 9,700 $ + 180 0.2% 80% 18%Next 15% $114,360 to $226,170 $157,900 $ + 10,000 $ + 230 0.1% 51% 46%Next 4% $226,170 to $468,300 $309,400 $ –3,100 $ –410 -0.1% 90% 10%Richest 1% $468,300 and higher $1,904,200 $ –38,700 $ –14,320 -0.8% 100% 0%ALL $88,000 $ + 24,100 $ + 80 0.1% 67% 29%Bottom 60% Less than $69,650 $35,300 $ + 46,200 $ + 260 0.7% 65% 29%
Source: Institute on Taxation and Economic Policy, December 2017Notes:* Average tax cut for those w/ a cut , share with tax cut, average tax hike for those w/ a hike, and share with tax hike figures do not include impact of ACA Mandate repeal
Combined effects might be slightly different from the sum of the individual components due to rounding
Share with Tax Cut
Share with Tax Hike Income Range Average Income Total Tax Change
(Thousands) Avg. Tax Change
Tax Change as % of Pre-Tax
Income Combined Impact of Final GOP-Trump Tax Bill
Share with Tax Cut
Share with Tax Hike Income Range Average Income Total Tax Change
(Thousands) Avg. Tax Change
Tax Change as % of Pre-Tax
Income Combined Impact of Final GOP-Trump Tax Bill
Share with Tax Cut
Share with Tax Hike Income Range Average Income Total Tax Change
(Thousands) Avg. Tax Change
Tax Change as % of Pre-Tax
Income Combined Impact of Final GOP-Trump Tax Bill