Embed Size (px)
Citation preview

Human Journals
Research Article
December 2015 Vol.:5, Issue:1
© All rights are reserved by Punam Yadav et al.
Physico-Chemical Analysis of Paon Dhoi River Water and Its
Impact on Human Health in Saharanpur (U.P.)
www.ijppr.humanjournals.com
Keywords: Agricultural runoff, Total Hardness, Industrial
waste, Total Dissolved Solids, Physico-Chemical analysis, Paon
Dhoi River
ABSTRACT
The water quality of Paon Dhoi River, an important domestic
and irrigation water source of Saharanpur, has been assessed.
Water samples were collected from seven different locations of
the river and analyzed for various physico-chemical quality
parameters before monsoon, during heavy rain and one month
after monsoon season. The results obtained from chemical
analysis were compared with four standards namely ISI, ICMR,
BIS and WHO. Effects of industrial wastes, municipality
sewage and agricultural runoff on the river water were
investigated. It is found that this water body is not suitable for
drinking and irrigation purpose, so possible remedial methods
should be adopted for this water resource for improving its
quality.
Dinkar Malik, Punam Yadav, Sandeep Kumar
Department of Chemistry, M. S. College, Saharanpur
U.P. India.
Submission: 21 November 2015
Accepted: 27 November 2015
Published: 25 December 2015
www.ijppr.humanjournals.com
Citation: Punam Yadav et al. Ijppr.Human, 2015; Vol. 5 (1): 42-54.
43
INTRODUCTION
Paon Dhoi water is essential for the survival of all forms of life. Though 80% of earth’s surface
is covered by water, the fresh water supply has increasingly become a limiting factor because of
various reasons. The human activities like open domestic sewage, agriculture run-off, sewage
coming through sewerage pipes, untreated or inadequately treated effluent discharged from
several types of industrial units change the chemical, physical, biological and radiological quality
of water which make the water of Paon Dhoi River polluted. The water bodies: rivers and lakes
are continuously subjected to a dynamic state of change with respect to their geological age and
geo chemical characteristics. This dynamic balance in the aquatic ecosystem is upset by human
activities results in pollution which in turn manifests dramatically as fish kill, bad taste of
drinking water, offensive odors and unchecked growth of aquatic weeds etc. The aquatic
environment for living organisms can be affected & bio-accumulation of harmful substances in
water-dependent food chain can occur. Overall the inland surface water quality in monsoon
season is within tolerable limit with respect to the standard set by Department of Environment
(DOE). However quality degrades in the dry season. It is a fact that good water quality produces
healthier humans than one with poor water quality. Paon Dhoi River is life line of Saharanpur
and its water is used for domestic and agriculture purposes. Therefore, effective maintenance of
water quality is required through appropriate measurements. The assimilation of waste water
treatment mechanism is essential to have a sustainable environment (Shivaraju 2011). The
pollution problems in industrial areas are significant. In particular, the water quality around
Saharanpur city is so poor that water from the surrounding rivers can no longer be considered as
a source of water supply for human consumptions (Agarwal et. al. 2011, Kumar et. al. 2004,
APHA 1989, ISI 1983, WHO 1984, Malik 2015). Salinity is identity of a saline water body and
accounts for the total amount of salts. Salinity may be affected by human interference in case any
industrial waste water is released at sites of low dispersed. Temperature, pH, turbidity,
conductivity, total suspended solid (TSS), nitrates, total nitrogen & total phosphate are the most
important physico-chemical properties of water (APHA 1992). The main objectives of the study
were to assess the river water quality. The physico-chemical properties like pH, Temperature,
Turbidity, Color, Total Dissolved Solids (TDS), Total Hardness (TH), Calcium Hardness and
Alkalinity of water samples from seven different sampling sites were analyzed.

www.ijppr.humanjournals.com
Citation: Punam Yadav et al. Ijppr.Human, 2015; Vol. 5 (1): 42-54.
44
Table I - Sampling Station in Paon Dhoi River
Sampling
Site Number
Location of
sampling Sites
Description
I Mansapur Starting point where Agricultural runoff sources
II Sakla Puri Domestic wastes and Agricultural runoff sources
III Dhobi Ghat Municipality wastes and Domestic waste sources
IV Rameshwar
Temple
Municipality wastes, Car and Animal wash, Soaps,
Detergents and Domestic waste sources
V Dal Mandi Pul Municipality wastes, Industrial Waste, Car and Animal
wash, Soaps, Detergents and Domestic waste sources
VI Jogiyan Pul Municipality wastes, Industrial Waste, Car and Animal
wash, Soaps, Detergents and Domestic waste sources
VII Rakesh Cinema Municipality wastes, Industrial Waste, Car and Animal
wash, Soaps, Detergents and Domestic waste sources
Methodology:
Sampling Area: In the present study, water samples were collected from seven different
locations of Paon Dhoi river of Saharanpur in U.P. State. India, namely S-I (Mansapur), S-II
(Sakla Puri), S-III (Dhobi Ghat), S-IV (Rameshwar Temple), S-V (Dal Mandi Pul), S-VI
(Jogiyan Pul) and S-VII (Rakesh Cinema) for physico-chemical analysis. Water samples were
collected from sampling sites before monsoon, immediately after heavy rain and approximately
after one month of monsoon season.
Eight water quality parameters; four physical and four chemical were tested for the samples
collected for this research work. Physical parameters tested were pH, temperature, color and
turbidity. These four parameters play an important role in the disinfection of water. Turbidity
should be less than 5.0 Nephelometric Turbidity Units (NTU) and pH should be less than 8 for
effective disinfection (WHO 2004). Chemical parameters chosen were Total Dissolved Solids
(TDS), Total Hardness (TH), Calcium Hardness and Alkalinity. Total Dissolved Solids (TDS),
Total Hardness (TH) and Calcium Hardness results in excessive use of soap for washing
purposes in household use while water with high TDS may impart taste. Scales are mainly

www.ijppr.humanjournals.com
Citation: Punam Yadav et al. Ijppr.Human, 2015; Vol. 5 (1): 42-54.
45
formed due to carbonate hardness and cause enormous loss of fuel in boilers. Scales deposited
mainly due to increase in pH to 9 at which bicarbonates are converted as carbonates are formed
in distribution mains reducing their carrying capacity.
The pH and turbidity were measured and estimated at sampling sites by using water analysis kit
(systolic).The other parameters were measured by the procedure given by APHA in the
laboratory.
Sampling Methodology
From each sampling location, samples were collected before monsoon then immediately after
heavy rain and approximately after one month of monsoon season as recommended in WHO
guidelines (WHO 2004, 2009). For statistical significance of the test results, each sampling
location was sampled three times before monsoon, during the monsoon and three times after the
monsoon on the dates as shown in Table II. On a specific date, samples from all the seven
sampling locations were collected. In this way a total of 63 samples were collected and tested
during this study.
For physico-chemical analysis, water samples were collected in a one liter polyethylene (PET)
bottle 15-20 cm below the water surface which was filled to the top to exclude air, analyzed
within 24 hours and stored at 1- 40 c temperature. Care must be taken not to catch any floating
material or bed material into the container.
Table II - Sampling Schedule:
The samples were collected as per the schedule given in the table:
S. No. Sampling Date
Sample No. 1 2 3
1 Pre Monsoon 21.06.2015 01.07.2015 10.07.2015
2 During monsoon
(Heavy Rain) 09.08.2015 11.08.2015 13.08.2015
3 After monsoon 13.09.2015 23.09.2015 30.09.2015
www.ijppr.humanjournals.com
Citation: Punam Yadav et al. Ijppr.Human, 2015; Vol. 5 (1): 42-54.
46
Determination of water quality parameters
The analysis of various physico-chemical parameters namely pH, Temperature, Turbidity, Color,
Total Dissolved Solids (TDS), Total Hardness (TH), Calcium Hardness and Alkalinity were
carried out as per the method described in (APHA 1998). The instruments used were in the limit
of précised accuracy. The chemicals used were of AR grade. Utmost care was taken during
sampling to avoid any kind of contamination. Temperature and pH were measured at the time of
sampling itself.
The standard limits of water quality parameters in drinking water prescribed by ISI, ICMR, BIS
and WHO is shown in the Table III.
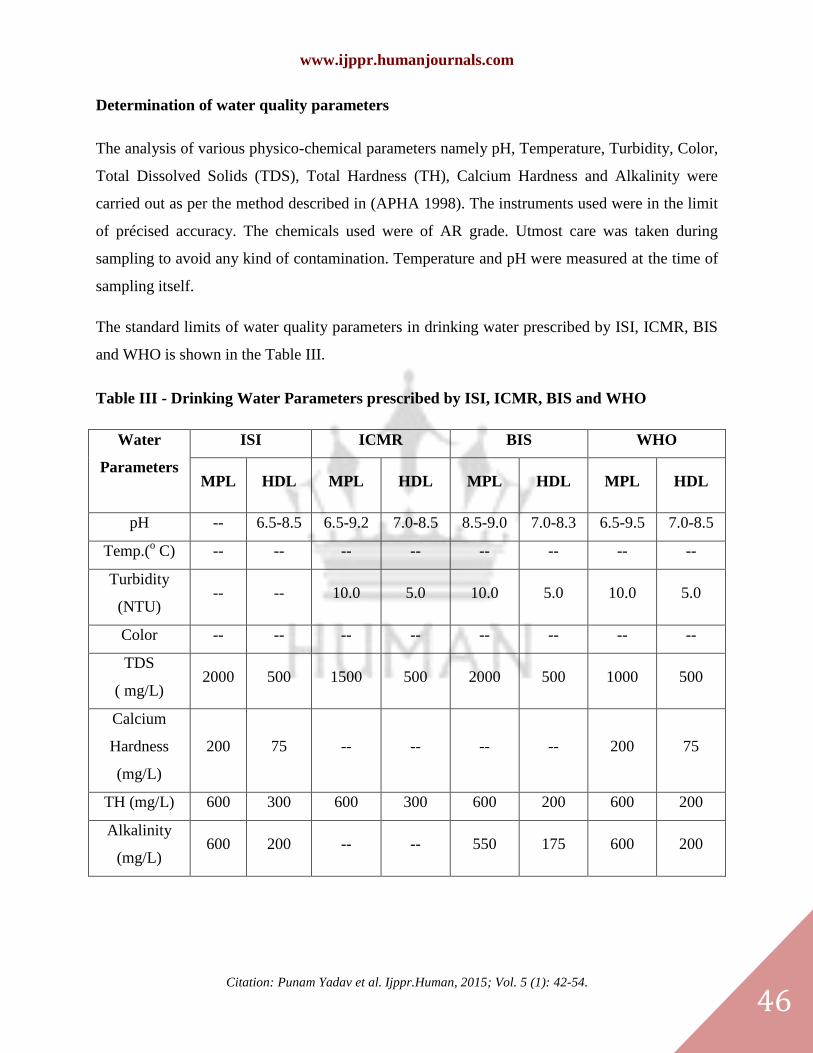
Table III - Drinking Water Parameters prescribed by ISI, ICMR, BIS and WHO
Water
Parameters
ISI ICMR BIS WHO
MPL HDL MPL HDL MPL HDL MPL HDL
pH -- 6.5-8.5 6.5-9.2 7.0-8.5 8.5-9.0 7.0-8.3 6.5-9.5 7.0-8.5
Temp.(o C) -- -- -- -- -- -- -- --
Turbidity
(NTU) -- -- 10.0 5.0 10.0 5.0 10.0 5.0
Color -- -- -- -- -- -- -- --
TDS
( mg/L) 2000 500 1500 500 2000 500 1000 500
Calcium
Hardness
(mg/L)
200 75 -- -- -- -- 200 75
TH (mg/L) 600 300 600 300 600 200 600 200
Alkalinity
(mg/L) 600 200 -- -- 550 175 600 200
www.ijppr.humanjournals.com
Citation: Punam Yadav et al. Ijppr.Human, 2015; Vol. 5 (1): 42-54.
47
MPL (Maximum Permissible Limit), HDL (Highest Desirable Level), ISI (Indian Standard
Institute), ICMR (Indian Council of Medical Research), BIS (Bureau of Indian Standard), WHO
(World Health Organization)
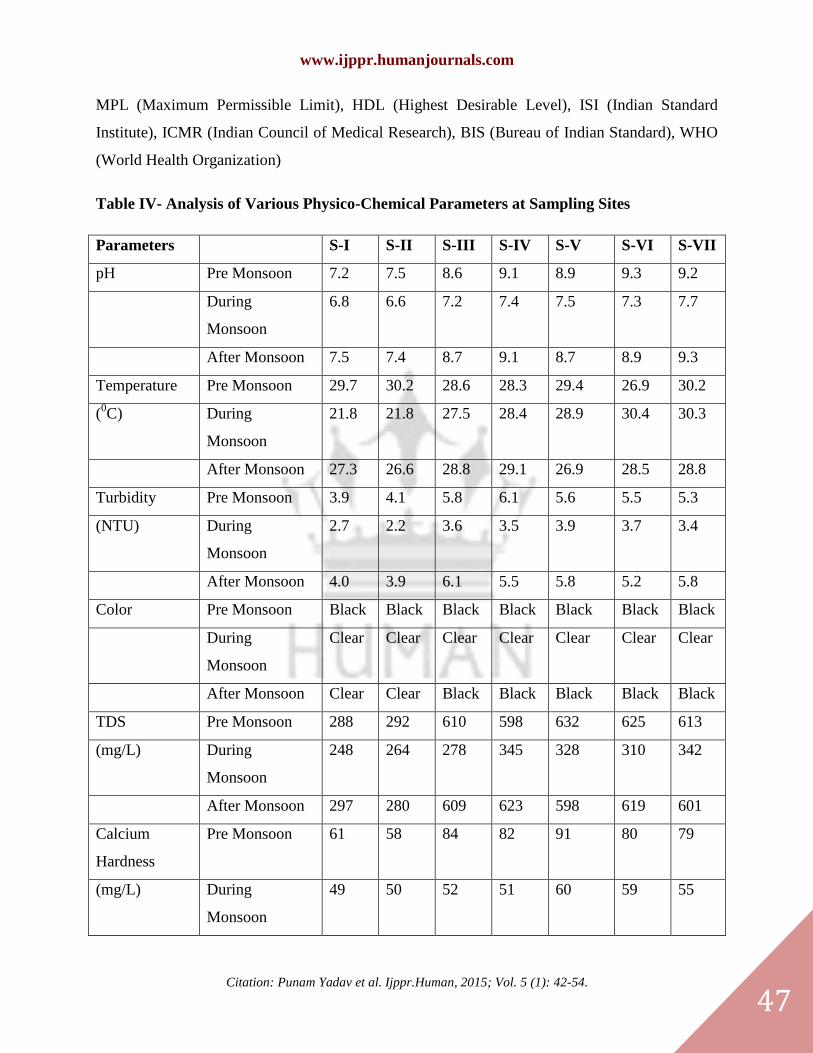
Table IV- Analysis of Various Physico-Chemical Parameters at Sampling Sites
Parameters S-I S-II S-III S-IV S-V S-VI S-VII
pH Pre Monsoon 7.2 7.5 8.6 9.1 8.9 9.3 9.2
During
Monsoon
6.8 6.6 7.2 7.4 7.5 7.3 7.7
After Monsoon 7.5 7.4 8.7 9.1 8.7 8.9 9.3
Temperature Pre Monsoon 29.7 30.2 28.6 28.3 29.4 26.9 30.2
(0C) During
Monsoon
21.8 21.8 27.5 28.4 28.9 30.4 30.3
After Monsoon 27.3 26.6 28.8 29.1 26.9 28.5 28.8
Turbidity Pre Monsoon 3.9 4.1 5.8 6.1 5.6 5.5 5.3
(NTU) During
Monsoon
2.7 2.2 3.6 3.5 3.9 3.7 3.4
After Monsoon 4.0 3.9 6.1 5.5 5.8 5.2 5.8
Color Pre Monsoon Black Black Black Black Black Black Black
During
Monsoon
Clear Clear Clear Clear Clear Clear Clear
After Monsoon Clear Clear Black Black Black Black Black
TDS Pre Monsoon 288 292 610 598 632 625 613
(mg/L) During
Monsoon
248 264 278 345 328 310 342
After Monsoon 297 280 609 623 598 619 601
Calcium
Hardness
Pre Monsoon 61 58 84 82 91 80 79
(mg/L) During
Monsoon
49 50 52 51 60 59 55
www.ijppr.humanjournals.com
Citation: Punam Yadav et al. Ijppr.Human, 2015; Vol. 5 (1): 42-54.
48
After Monsoon 57 63 86 93 89 97 101
Total
Hardness
Pre Monsoon 115 126 321 330 325 339 341
(mg/L) During
Monsoon
164 170 163 151 179 158 159
After Monsoon 165 171 458 447 461 466 459
Alkalinity Pre Monsoon 152 159 255 239 243 240 230
(mg/L) During
Monsoon
160 148 158 162 154 162 169
After Monsoon 170 169 237 235 246 249 241
RESULTS AND DISCUSSION
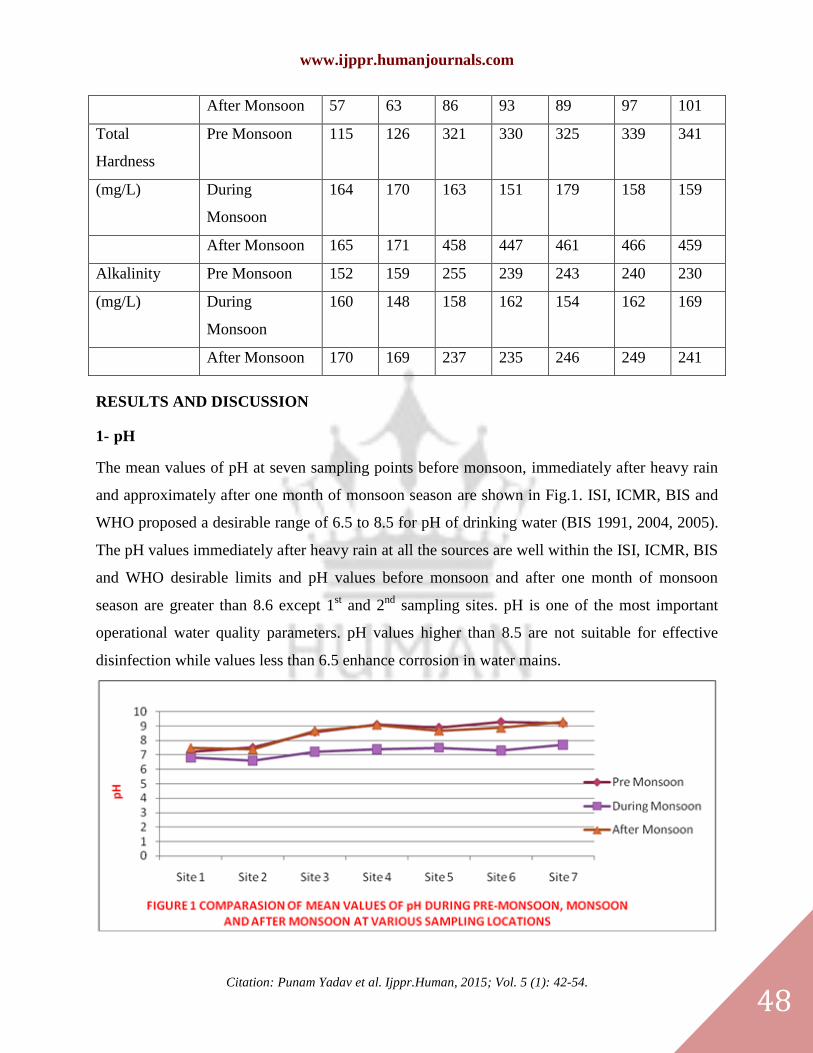
1- pH
The mean values of pH at seven sampling points before monsoon, immediately after heavy rain
and approximately after one month of monsoon season are shown in Fig.1. ISI, ICMR, BIS and
WHO proposed a desirable range of 6.5 to 8.5 for pH of drinking water (BIS 1991, 2004, 2005).
The pH values immediately after heavy rain at all the sources are well within the ISI, ICMR, BIS
and WHO desirable limits and pH values before monsoon and after one month of monsoon
season are greater than 8.6 except 1st and 2
nd sampling sites. pH is one of the most important
operational water quality parameters. pH values higher than 8.5 are not suitable for effective
disinfection while values less than 6.5 enhance corrosion in water mains.

www.ijppr.humanjournals.com
Citation: Punam Yadav et al. Ijppr.Human, 2015; Vol. 5 (1): 42-54.
49
2- Temperature
The mean values of temperature at seven sampling points before monsoon, immediately after
heavy rain and approximately after one month of monsoon season are shown in Fig 2 No health
based guidelines are proposed for temperature by ISI, ICMR, BIS and WHO. The temperature of
the collected water samples varies in between 19 0C to 30
0C at all sampling sites before
monsoon, immediately after heavy rain and approximately after one month of monsoon season.
3- Turbidity
The mean values of turbidity at seven sampling points before monsoon, immediately after heavy
rain and approximately after one month of monsoon season are shown in Fig 3 No health based
guidelines are proposed for turbidity by ISI, ICMR, BIS and WHO. Nevertheless, a value of 5.0
NTU is recommended for effective disinfection. It is evident from Fig. 3 that at all the sources,
the turbidity in water is in the desirable limit immediately after heavy rain. It rose above 5.0
NTU before monsoon and after one month of monsoon season except 1st and 2
nd sampling sites.
No apparent reason could be described to this phenomenon on the basis of this study and further
research is recommended to find out the facts.

www.ijppr.humanjournals.com
Citation: Punam Yadav et al. Ijppr.Human, 2015; Vol. 5 (1): 42-54.
50
4- Color
The water samples are generally colored due to the presence of colloidal substance, inorganic
impurity, aquatic growth, and decomposition of vegetation. The water sample collected was
found to be odorless, colorless and clear immediately after heavy rain. It becomes blackish
before monsoon and after one month of monsoon season except 1st and 2
nd sampling sites.
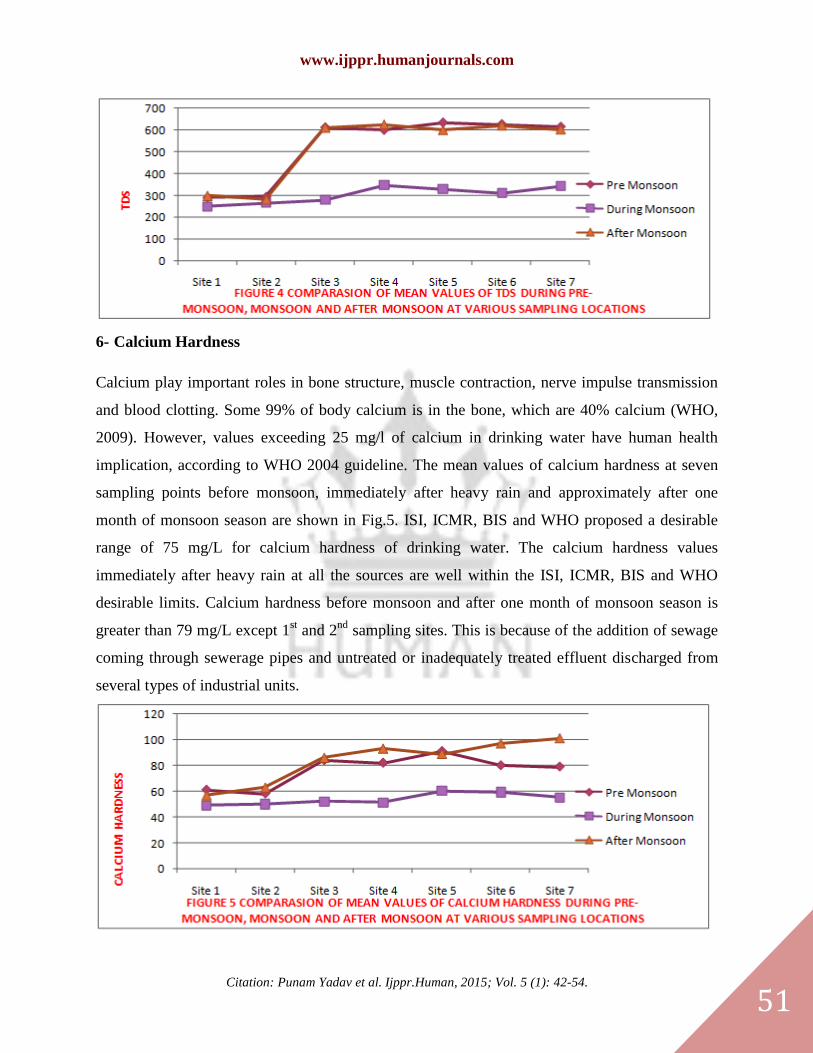
5- Total Dissolved Solid
The quantity of TDS was proportional to the degree of pollution (Rain et. al.1990, Nasrullah
2006). The mean values of TDS at seven sampling points before monsoon, immediately after
heavy rain and approximately after one month of monsoon season are shown in Fig.4. ISI,
ICMR, BIS and WHO proposed a desirable range of 500 mg/L for TDS of drinking water. The
TDS values immediately after heavy rain at all the sources are well within the ISI, ICMR, BIS
and WHO desirable limits of 250-455 mg/L and TDS values before monsoon and after one
month of monsoon season are greater than 598 mg/L except 1st and 2
nd sampling sites. This is
because of the addition of solids from open domestic sewage, agriculture run-off, sewage coming
through sewerage pipes and untreated or inadequately treated effluent discharged from several
types of industrial units.
www.ijppr.humanjournals.com
Citation: Punam Yadav et al. Ijppr.Human, 2015; Vol. 5 (1): 42-54.
51
6- Calcium Hardness
Calcium play important roles in bone structure, muscle contraction, nerve impulse transmission
and blood clotting. Some 99% of body calcium is in the bone, which are 40% calcium (WHO,
2009). However, values exceeding 25 mg/l of calcium in drinking water have human health
implication, according to WHO 2004 guideline. The mean values of calcium hardness at seven
sampling points before monsoon, immediately after heavy rain and approximately after one
month of monsoon season are shown in Fig.5. ISI, ICMR, BIS and WHO proposed a desirable
range of 75 mg/L for calcium hardness of drinking water. The calcium hardness values
immediately after heavy rain at all the sources are well within the ISI, ICMR, BIS and WHO
desirable limits. Calcium hardness before monsoon and after one month of monsoon season is
greater than 79 mg/L except 1st and 2
nd sampling sites. This is because of the addition of sewage
coming through sewerage pipes and untreated or inadequately treated effluent discharged from
several types of industrial units.
www.ijppr.humanjournals.com
Citation: Punam Yadav et al. Ijppr.Human, 2015; Vol. 5 (1): 42-54.
52
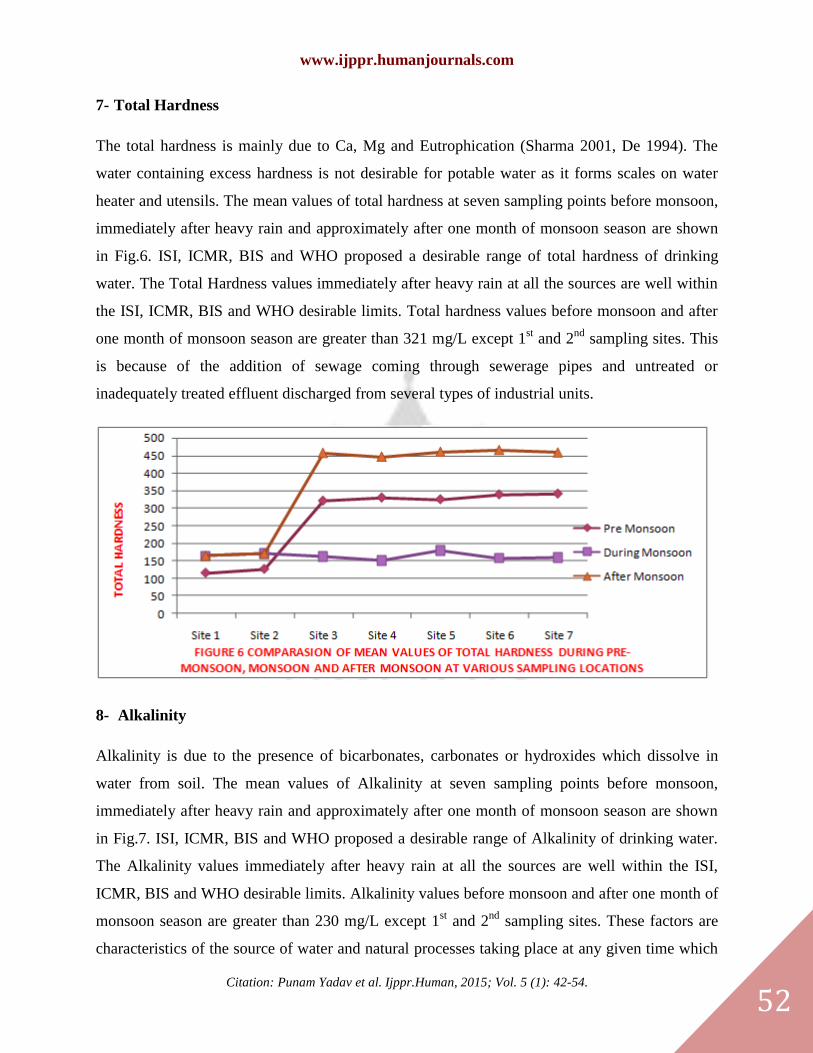
7- Total Hardness
The total hardness is mainly due to Ca, Mg and Eutrophication (Sharma 2001, De 1994). The
water containing excess hardness is not desirable for potable water as it forms scales on water
heater and utensils. The mean values of total hardness at seven sampling points before monsoon,
immediately after heavy rain and approximately after one month of monsoon season are shown
in Fig.6. ISI, ICMR, BIS and WHO proposed a desirable range of total hardness of drinking
water. The Total Hardness values immediately after heavy rain at all the sources are well within
the ISI, ICMR, BIS and WHO desirable limits. Total hardness values before monsoon and after
one month of monsoon season are greater than 321 mg/L except 1st and 2
nd sampling sites. This
is because of the addition of sewage coming through sewerage pipes and untreated or
inadequately treated effluent discharged from several types of industrial units.
8- Alkalinity
Alkalinity is due to the presence of bicarbonates, carbonates or hydroxides which dissolve in
water from soil. The mean values of Alkalinity at seven sampling points before monsoon,
immediately after heavy rain and approximately after one month of monsoon season are shown
in Fig.7. ISI, ICMR, BIS and WHO proposed a desirable range of Alkalinity of drinking water.
The Alkalinity values immediately after heavy rain at all the sources are well within the ISI,
ICMR, BIS and WHO desirable limits. Alkalinity values before monsoon and after one month of
monsoon season are greater than 230 mg/L except 1st and 2
nd sampling sites. These factors are
characteristics of the source of water and natural processes taking place at any given time which

www.ijppr.humanjournals.com
Citation: Punam Yadav et al. Ijppr.Human, 2015; Vol. 5 (1): 42-54.
53
do not have proper drainage system. They discharge the waste waters into the soil. This may lead
to increase in alkalinity of water in these areas.
CONCLUSION
The Paon Dhoi River is one of the most important River of Saharanpur that feeding the city in
many ways. The major sources of pollutants are local anthropogenic activities, open domestic
sewage, sewage coming through sewerage pipes, agricultural runoff containing fertilizers,
pesticides, insecticides and industrial effluent containing toxic chemicals in higher amount. From
the beginning the importance of the river was very much and increasing day by day. But at
present that river is under pollution. Like other rivers in the city its water quality is losing day by
day. The physicochemical parameters (pH, Temperature, Turbidity, Color, Total Dissolved
Solids (TDS), Total Hardness (TH), Calcium Hardness and Alkalinity) at all the sampling sites
in the study area were within the limits after heavy rain but before monsoon and after one month
of monsoon season are greater than desirable limits at all sampling sites except 1st and 2
nd
sampling sites. It can, therefore, be concluded that it is not suitable for drinking and irrigation
purposes without any form of treatment, so possible remedial methods should be adopted for this
water resource for improving its quality. It is very much necessary to conduct more research on
this river and has to make awareness among the people about the pollution problem.
www.ijppr.humanjournals.com
Citation: Punam Yadav et al. Ijppr.Human, 2015; Vol. 5 (1): 42-54.
54
Recommendations:
1. In order to address the non point source pollution of water, many agencies have come up with
various proposals & some programs are been effectively organized targeting various programs,
funds, training, technical assistance, incentives and other management tools. The assimilation of
waste water treatment mechanism is essential to have a sustainable environment.
2. Pounding of wastewater in the streets be avoided through effective wastewater collection
system.
3. Sewer lines are laid on the opposite sides of the river to avoid pollution.
4. Water must not be used for drinking and irrigation purposes without proper treatment.
REFERENCES
1. Shivaraju HP. Impact assessment of sewage discharge on underground water qualities around municipal sewage
treatment plant. International Journal of Research in chemistry and Environment. 2011; (1) : 124-130.
2. Agarwal A, Saxena M Assessment of pollution by physicochemical water parameters. Advanced applied science
research 2011; 2 (2): 185-189.
3. Kumar A. Water Pollution. Nisha Enterprises New Delhi, India. 2004 ; 1-331.
4. APHA. Standard methods for the examination of water and waste water, American Public Health Association,
Washington, America. 1989.
5. ISI. Indian Standard specification for drinking water, IS10500, ISI, New Delhi, India. 1983.
6. W.H.O. Guidelines for drinking water quality, Vol.1, Recommendations WHO, Geneva, Switzerland. 1984.
7. Malik Dinkar. Assessment of water quality at Paon Dhoi river during monsoon and after season, saharanpur
(U.P.). Int. J. Phy. & App. Sci. 2015;5(3): 92-102.
8. American Public Health Association. Standard Methods of Examination of Water and Waste Water’, 18th
Ed,
(Eds. Greenberg, Clesceri and Eaton), Washington, America. 1992; 2340.
9. Guidelines for drinking-water quality; 3rd edition, volume 1. World Health Organization WHO. Geneva,
Switzerland. 2004; 143-220.
10. WHO. Calcium and Magnesium in Drinking-water: Public health significance, Geneva, Switzerland. 2009; 276.
11. WHO. Guidelines for drinking water. Second Edition WHO, Geneva, Switzerland. 2004; 224-230.
12. APHA. Standard methods for the examination of water and waste water’, AWWA and WPCF Washington,
America. 1998; 20.
13. BIS IS 10500. Standard parameters given by Government of India, New Delhi, India. 1991.
14. BIS IS 10500. Standard parameters given by Government of India, New Delhi, India. 2004.
15. BIS IS 13428. Standard parameters of drinking water given by Government of India, New Delhi, India. 2005.
16. Rain FH, Thatcher LL. Methods for Collection and Analysis of Water Samples. U. S. Govt. Office Washington,
America. 1990.
17. Nasrullah, Rafia Naz, Hamida Bibi, Mudassar Iqbal, Ilyas Durrani M. Inadequately treated effluent discharged
from several types of industrial units. Journal of Agricultural and Biological Science2006;1( 3):18.
18. BK Sharma. Industrial Chemistry, Goel publishing house Meerut, India. 2001.
19. De AK. Environment chemistry (III edu), New Delhi, India. 1994.