Embed Size (px)
Citation preview
DECEMBER 2006 REPORT OF THEACADEMIC ADVISORY COMMITTEE TO
VIRGINIA DEPARTMENT OF ENVIRONMENTAL QUALITY:
FRESHWATER NUTRIENT CRITERIA FORRIVERS AND STREAMS
VIRGINIA POLYTECHNIC INSTITUTE AND STATE UNIVERSITY
BLACKSBURG, VIRGINIA 2007

2
This special report is a publication of the Virginia Water Resources Research Center. Funds for the support of this project and publication are provided in part by the Virginia Department of Environmental Quality. The contents of this publication do not necessarily reflect the views or policies of the Virginia Department of Environmental Quality or the Virginia Water Resources Research Center. The mention of commercial products, trade
names, or services does not constitute an endorsement or recommendation.
This report is available online. Hard copies may be obtained from the Virginia Water Resources Research Center for a small fee.
210 Cheatham Hall Blacksburg, VA 24061 Phone: (540) 231-5624
Fax: (540) 231-6673 E-mail: [email protected]
Web address: http://www.vwrrc.vt.edu
Stephen Schoenholtz, Director
Virginia Tech does not discriminate against employees, students, or applicants on the basis of race, color, sex, sexual orientation, disability, age, veteran status, national origin, religion, or
political affiliation. Anyone with questions that concern discrimination should contact the Equal Opportunity and Affirmative Action Office.
December 2006 Report of theAcademic Advisory Committee to
Virginia Department of Environmental Quality: Freshwater Nutrient Criteria for Rivers and Streams
Prepared byCarl E. Zipper, Department of Crop and soil Environmental Sciences, Virginia Tech
Gene Yagow, Department of Biological Systems Engineering, Virginia Tech
Jane L. Walker, Virginia Water Resources Research Center, Virginia Tech
Eric. P. Smith, Department of Statistics, Virginia Tech
Leonard A. Shabman, Resources for the Future
Leonard A. Smock, Department of Biology, Virginia Commonwealth University
Carl H. Hershner, Center for Coastal Resources Management, Virginia Institute for Marine Science
Tamim Younos, Virginia Water Resources Research Center, Virginia Tech
E. Fred Benfield, Department of Biological Sciences, Virginia Tech
Paul A. Bukaveckas, Department of Biology, Virginia Commonwealth University
Greg C. Garman, Center of Environmental Studies, Department of Biology, Virginia Commonwealth University
Howard I. Kator, Department of Environmental & Aquatic Animal Health, Virginia Institute for Marine Science
Wu-Seng Lung, Department of Civil Engineering, University of Virginia
and
Kurt Stephenson, Department of Agricultural and Applied Economics, Virginia Tech
Virginia Water Resources Research Center 210 Cheatham Hall
Virginia Tech Blacksburg, VA 24061
January 10, 2007 VWRRC Special Report SR33-2007

i
Acknowledgements This report was prepared by the Academic Advisory Committee to the Virginia Department
of Environmental Quality (DEQ). This effort is partially funded through the Virginia DEQ. DEQ staff participated in the various meetings and discussions concerning the development of nutrient criteria in Virginia and provided data. Special thanks to Roger Stewart and Jason Hill at DEQ for assembling the databases used in the analysis in Section I.C. Thanks to Carl Hershner and Dan Schatt, Virginia Institute of Marine Sciences GIS lab, for conducting analysis of land use within monitoring station watershed areas. We also appreciate the contributions of the Virginia Department of Conservation and Recreation in providing Virginia Tributary Strategy cap-load data for 2010 used in Section II.A.

ii

iii
Members of the Academic Advisory Committee Dr. Carl E. Zipper (Committee Chair) Associate Professor Department of Crop and Soil Environmental
Sciences Virginia Tech 330 Smyth Hall (0404) Blacksburg, VA 24061 Phone: 540-231-9782 Fax: 540-231-3431 E-mail: [email protected] Dr. Tamim Younos (Project Leader) Associate Director Virginia Water Resources Research Center Virginia Tech 210 Cheatham Hall (0444) Blacksburg, VA 24061 Phone: 540-231-8039 Fax: 540-231-6673 E-mail: [email protected] Dr. E. Fred Benfield Professor and Associate Dept. Head Department of Biology Virginia Tech 2125 Derring Hall (0406) Blacksburg, VA 24061 Phone: 540-231-5802 Fax: 540-231-9307 E-mail: [email protected] Dr. Paul Bukaveckas Associate Professor Department of Biology Center for Environmental Studies Virginia Commonwealth University P.O. Box 842012 Richmond, VA 23284-2012 Phone: 804-828-0168 Fax: 804-828-0503 E-mail: [email protected]
Dr. Gregory C. Garman Associate Professor and Director Department of Biology Center for Environmental Studies Virginia Commonwealth University P.O. Box 842012 Richmond, VA 23284-2012 Phone: 804-828–7202 Fax: 804-828-0503 E-mail: [email protected] Dr. Carl H. Hershner, Jr. Associate Professor and Director School of Marine Science Center for Coastal Resources Management Virginia Institute of Marine Science P.O. Box 1346 Gloucester Point, VA 23062-1346 Phone: 804-684-7387 Fax: 804-684-7179 E-mail: [email protected] Dr. Howard I. Kator Associate Professor School of Marine Science Virginia Institute of Marine Science P.O. Box 1346 Gloucester Point, VA 23062-1346 Phone: 804-684-7341 Fax: 804-684-7097 E-mail: [email protected] Dr. Wu-Seng Lung Professor Department of Civil Engineering University of Virginia P.O. Box 400742 Charlottesville, VA 22904-4742 Phone: 434-924-3722 Fax: 434-982-2951 Email: [email protected]
iv
Dr. Leonard A. Shabman Resident Scholar Resources for the Future 1616 P Street, NW Washington, DC 20036 Phone: 202-328-5139 E-mail: [email protected] Dr. Eric P. Smith Professor and Interim Dept. Chair Department of Statistics Virginia Tech 406-A Hutcheson Hall (0439) Blacksburg, VA 24061 Phone: 540-231-7929 Fax: 540-231-3863 E-mail: [email protected] Dr. Leonard A. Smock Professor and Department Chair Department of Biology Virginia Commonwealth University P.O. Box 842012 Richmond, VA 23284-2012 Phone: 804-828-1562 Fax: 804-828-0503 E-mail: [email protected] Dr. Kurt Stephenson Associate Professor Department of Agricultural and Applied
Economics Virginia Tech 208-B Hutcheson Hall (0401) Blacksburg, VA 24061 Phone: 540-231-5381 Fax: 540-231-7417 E-mail: [email protected]
Ms. Jane L. Walker Research Associate Virginia Water Resources Research Center Virginia Tech 210 Cheatham Hall (0444) Blacksburg, VA 24061 Phone: 540-231-4159 Fax: 540-231-6673 E-mail: [email protected] Dr. Gene Yagow Research Scientist Department of Biological Systems
Engineering Virginia Tech 200 Seitz Hall (0303) Blacksburg, VA 24061 Phone: 540-231-2538 Fax: 540-231-3199 E-mail: [email protected]
Acronyms and Abbreviations
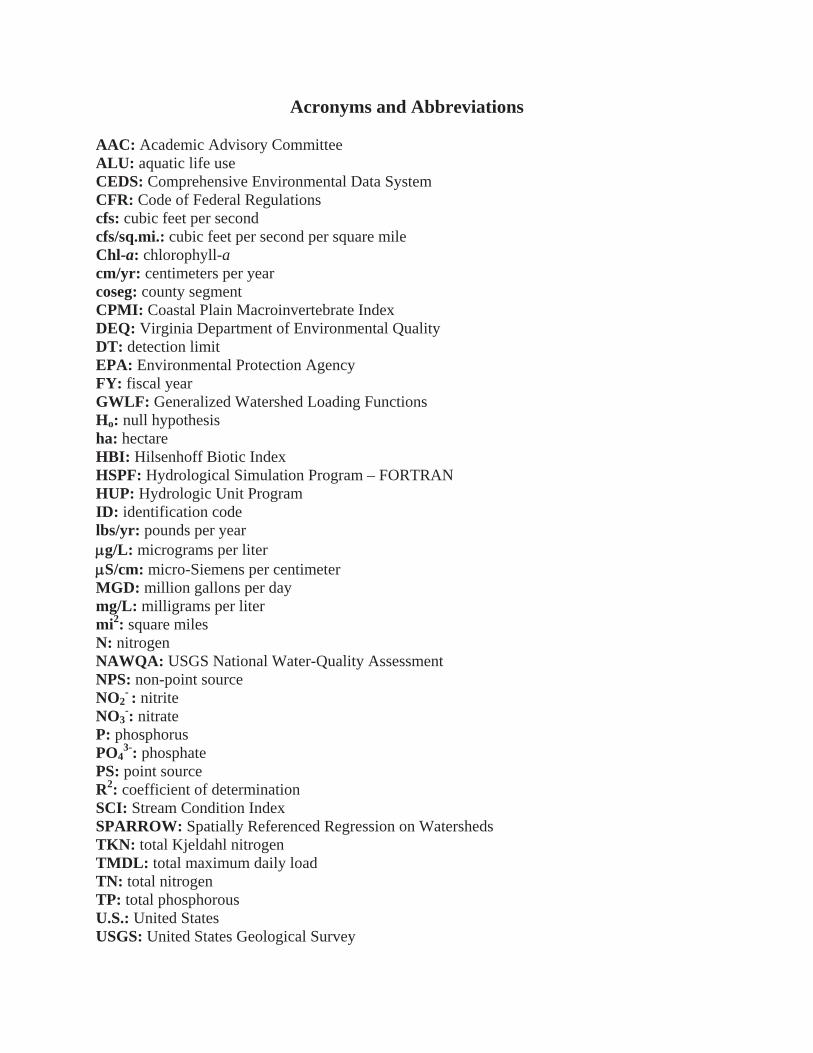
AAC: Academic Advisory Committee ALU: aquatic life use CEDS: Comprehensive Environmental Data System CFR: Code of Federal Regulations cfs: cubic feet per second cfs/sq.mi.: cubic feet per second per square mile Chl-a: chlorophyll-a cm/yr: centimeters per year coseg: county segment CPMI: Coastal Plain Macroinvertebrate IndexDEQ: Virginia Department of Environmental Quality DT: detection limit EPA: Environmental Protection Agency FY: fiscal year GWLF: Generalized Watershed Loading Functions Ho: null hypothesis ha: hectare HBI: Hilsenhoff Biotic Index HSPF: Hydrological Simulation Program – FORTRAN HUP: Hydrologic Unit Program ID: identification code lbs/yr: pounds per year
g/L: micrograms per liter S/cm: micro-Siemens per centimeter
MGD: million gallons per daymg/L: milligrams per liter mi2: square miles N: nitrogen NAWQA: USGS National Water-Quality Assessment NPS: non-point source NO2
- : nitriteNO3
-: nitrate P: phosphorus PO4
3-: phosphate PS: point source R2: coefficient of determination SCI: Stream Condition Index SPARROW: Spatially Referenced Regression on WatershedsTKN: total Kjeldahl nitrogen TMDL: total maximum daily load TN: total nitrogen TP: total phosphorous U.S.: United States USGS: United States Geological Survey

vii
Contents
Acknowledgements p. i
Members of the Academic Advisory Committee p. iii
Acronyms and Abbreviations p. v
Contents p. vii
Summary p. 1
Section I. Localized Criteria for Wadeable Streams p. 3
A. Review of Other Studies with Relevance to Development ofNutrient Criteria for Wadeable Streams in Virginia. p. 3
B. Analysis of Nutrient Concentrations in Approved TMDLs inVirginia p. 9
C. Analysis of DEQ Monitoring Data to Develop Nutrient ScreeningValues p. 11
D. Ambient Monitoring Nutrient Distributions p. 27
Section II. Downstream Loading p. 29
A. Pilot Application of Load-Duration Approach to Rappahannock River Basin p. 29
B. Downstream-loading Component of Nutrient Criteria forFreshwater Rivers and Streams: Recommended Approach p. 49
References p. 53

1
Summary This report reviews activities conducted by the Academic Advisory Committee to the
Virginia Department of Environmental Quality (DEQ) between July and December 2006. Activities were conducted for the purpose of developing recommendations for DEQ regarding nutrient criteria for freshwater rivers and streams.
In its June 2006 report to DEQ, the AAC recommended that DEQ establish nutrient criteria for rivers and streams by addressing independently the two effects described by the Environmental Protection Agency (EPA): localized and downstream-loading effects. The current report and activities address nutrient criteria development within that framework.
Section I of this report addresses the development of screening values for wadeable streams. Reference (i.e., characteristics of relatively undisturbed or least disturbed streams) and effect-threshold concentrations for in-stream nutrients that have been suggested by other studies are reviewed. Reference values for total nitrogen (TN) and total phosphorus (TP) tend to vary by U.S. EPA’s Nutrient Ecoregions and are generally higher in the eastern portions of the state than in the west. Effect-threshold values derived from other studies tend to vary more widely in part due to the variety of effect endpoints that have been employed in developing these threshold-concentration estimates. A review of TMDL studies that have been completed for nutrient-impaired streams revealed few usable reference concentrations because they are generally load-based studies (and do not report the streamflow information that could be used to calculate nutrient concentrations). An analysis of DEQ monitoring data found that Stream Condition Index (SCI, an indicator of benthic macroinvertebrate community status) values tend to vary negatively with nutrient concentrations. When using a statewide data set, these data allow the development of statistically significant regression models of the in-stream nutrient-SCI relationships. Application of these models yields “critical values” (i.e., nutrient values corresponding with the SCI = 60 impairment threshold) for TN (0.8 mg/L), total Kjeldahl nitrogen (TKN) (0.3 mg/L), and TP (0.05 mg/L). However, even after a data-selection process intended to focus analysis on sites where no influence by non-nutrient stressors is evident, the variability of SCI response to nutrients is large; thus, the analysis did not allow direct derivation of appropriate screening values.
The committee is also conducting analyses to address development of localized criteria in wadeable streams; those analyses are not described in this report.
Section II of the report addresses the downstream-loading component of nutrient criteria. A pilot-scale analysis using data from the Rappahannock River Basin illustrates a potential approach to developing numeric nutrient criteria to address downstream-loading effects. The committee recommends that the downstream-loading component be developed as narrative criteria within an effective water-quality management framework. This framework includes localized criteria with numeric components, clearly defined impairment-designation processes, and water-quality management processes that are effective in addressing and mitigating impairments.
The report is presented as a draft, in anticipation of interactions among AAC members, interactions between the AAC and DEQ, and further analyses to be conducted in the coming months. A final report for the current fiscal year is due to DEQ in the summer of 2007.

2
3
I.A. Review of Other Studies with Relevance to Development of Nutrient Criteria for Wadeable Streams in Virginia
C. E. Zipper and J. L. Walker
This section reviews studies conducted by others with relevance to the development of nutrient criteria for wadeable streams in Virginia. Numeric values suggested by other studies that pertain to wadeable streams in Virginia, its neighboring states, and the mid-Atlantic region are provided in Table 1. Because the AAC has completed an extensive review of scientific literature on nutrient criteria development (Walker et al. 2006), this review will be brief. Several of the studies summarized below have been reviewed with greater detail in Walker et al. (2006).
Reference Values Representing “Relatively Undisturbed” or “Least Disturbed” Conditions
U.S. EPA calculated 25th-percentile values for water-borne nutrients in rivers and streams from all available data by aggregate nutrient ecoregions for the conterminous U.S. (for Virginia’s waters, see U.S. EPA 2000a-c). EPA designated these 25th percentiles as “reference values,” noting that the 25th percentiles of “all water bodies” tend to correspond with the 75th percentiles of reference water bodies (i.e., relatively undisturbed or least disturbed water bodies of a given type). The AAC (2006) calculated comparable values for Virginia using Virginia DEQ ambient (10/99 – 9/05) and probabilistic (2001 – 2004) monitoring data for the ecoregions in Virginia (Because only a few streams in Aggregate Ecoregion 14 were sampled by the probabilistic monitoring program, the 25th percentile was not calculated from this data set). The AAC suggested that subregion 63 of Aggregate Ecoregion 14 was a more appropriate reference for Virginia because of its development status.
Smith et al. (2003) used modeling procedures (Spatially Referenced Regression on Watersheds, SPARROW) to estimate by EPA Aggregate Nutrient Ecoregion the natural background nutrient concentrations in rivers and streams. SPARROW is a recognized water-quality monitoring procedure that was developed over an extended time period by the U.S. Geological Survey (USGS). SPARROW utilizes USGS in-stream water-quality databases for calibration. Smith et al. (2003) note that the EPA assumption that the 25th percentiles of “all water bodies” tends to correspond with the 75th percentiles of reference water bodies is supported by very few studies, and that such findings may be influenced by the fact that most reference water bodies occur in relatively small streams. They expressed their results as the 75th percentile of predicted natural-background concentrations by ecoregion to allow comparisons to EPA’s calculated 25th-percentile “reference” values. These comparisons were made with and without consideration of recent atmospheric nitrogen deposition.
In another study, the researchers followed the U.S. EPA reference approach in proposing nutrient criteria values but developed alternative nutrient regions, called environmental nutrient zones. The ecoregion subdivisions were based on differences in many factors (e.g., soils, climate, vegetation, geology, and land use). The nutrient zones were determined from the relations between median TN or median TP and the most statistically significant environmental characteristics (excluding land use). The zones that included data from the New and Big Sandy rivers in Virginia (from the Kanawha-New River Basins NAWQA study) are Environmental Nitrogen Zone-4 (ENZ-4) and Environmental Phosphorus Zone-2 (EPZ-2). Criteria were
4
proposed using the 75th percentile of data from sites within each zone that represent “reference” conditions, i.e., sites in watersheds with less than 25 percent agricultural land use. Proposed criteria values for the zones that included data from the New River and Big Sandy River were 0.67 mg/L for TN and 0.05 mg/L for TP (Robertson et al. 2001). Criteria were also suggested based on the 25th percentile of all the data within a given zone. From the 25th percentile of all the data for ENZ-4, a TN criterion of 0.51 mg/L could be expected. The 25th percentile for EPZ-2 would yield a TP criterion of 0.02 mg/L (Robertson et al. 2001).
Clark et al. (2000) obtained data from 85 sites across the United States and used those data to estimate concentrations and yields of selected nutrients in streams draining relatively undeveloped basins. The median values in Table 1 are from sites in Virginia, its neighboring states, and other states within EPA Region 3. Nitrate-N data were available for 16 sites of this type, whereas other nutrient parameters were only available from 7 sites. The data represent mean annual flow-weighted concentrations for the 1990 – 1995 time periods.
The AAC has recommended to Virginia DEQ that nutrient concentrations in “relatively undisturbed” or least-disturbed streams should not be considered as an appropriate basis for establishing nutrient criteria in the rivers and streams of Virginia. Instead, the numeric criteria should be based on a method that adheres closely to the Code of Federal Regulations (CFR) by protecting the designated uses of the water body. In fact, the CFR defines the term criteria as “elements of State water quality standards, expressed as constituent concentrations, levels, or narrative statements, representing a quality of water that supports a particular use. When criteria are met, water quality will generally protect the designated use” [40 CFR 131.3(b)].
Other Suggested Nutrient Thresholds
A nutrient threshold can be defined as the concentration at which an effect, such as eutrophication or biological impairment, begins to occur. Potential threshold values derived from studies conducted within Virginia and the region are included here. Some of the published nitrogen and phosphorus values discussed in this section, however, were not presented in the literature as “threshold values.” For example, Hornberger et al. (1977) recommend not using the values from their study as strict thresholds but rather general indications of the trophic condition.
Hornberger et al. (1977) used a subjective ranking of the eutrophic state of six river sites, five in Virginia and one in New Hampshire, based on their best professional judgment, knowledge of the land use, and measurements of nitrates, phosphates, and chlorophyll-a. They also determined the productivity at each site from continuous measurements of dissolved oxygen, temperature, and solar radiation and then compared their proposed eutrophic state with the results from the productivity study. They determined that productivity measurements can be used to classify the eutrophic state of rivers. Based on the production and respiration measurements, Hornberger et al. (1977) classified Baker River in New Hampshire as “clean” (oligotrophic). This river had NO3+NO2(N) concentrations of 0.1 – 0.2 mg/L and PO4(P) concentrations of <0.003 mg/L. From the productivity measurements in the Rappahannock River, the water quality was listed as possibly eutrophic even though the river seemed “unpolluted” from the qualitative impressions of the authors. The range of nutrient concentrations for the Rapphannock River overlapped with those of the high eutrophic rivers (NO3+NO2[N] = 0.3 – 0.7 mg/L; PO4[P] = 0.003 – 0.05 mg/L). The nutrient concentrations for the four rivers rated eutrophic from the productivity measurements (Mechums, South Fork
5
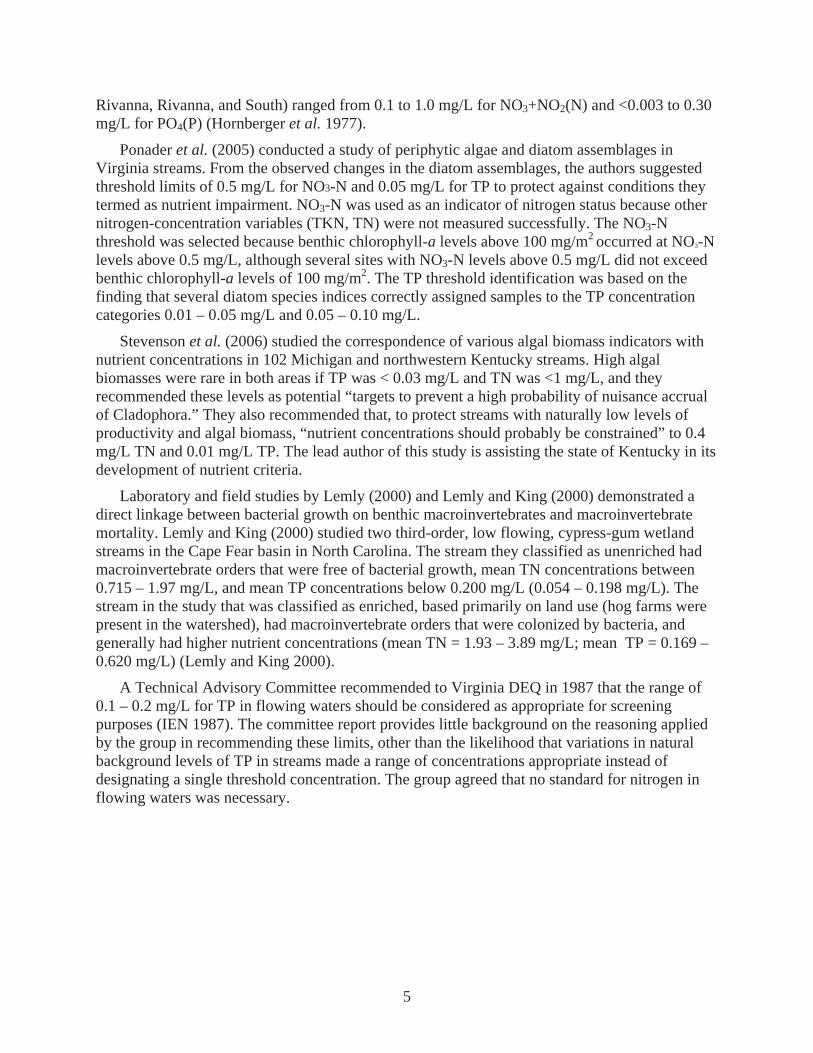
Rivanna, Rivanna, and South) ranged from 0.1 to 1.0 mg/L for NO3+NO2(N) and <0.003 to 0.30 mg/L for PO4(P) (Hornberger et al. 1977).
Ponader et al. (2005) conducted a study of periphytic algae and diatom assemblages in Virginia streams. From the observed changes in the diatom assemblages, the authors suggested threshold limits of 0.5 mg/L for NO3-N and 0.05 mg/L for TP to protect against conditions they termed as nutrient impairment. NO3-N was used as an indicator of nitrogen status because other nitrogen-concentration variables (TKN, TN) were not measured successfully. The NO3-N threshold was selected because benthic chlorophyll-a levels above 100 mg/m2
occurred at NO3-N levels above 0.5 mg/L, although several sites with NO3-N levels above 0.5 mg/L did not exceed benthic chlorophyll-a levels of 100 mg/m2. The TP threshold identification was based on the finding that several diatom species indices correctly assigned samples to the TP concentration categories 0.01 – 0.05 mg/L and 0.05 – 0.10 mg/L.
Stevenson et al. (2006) studied the correspondence of various algal biomass indicators with nutrient concentrations in 102 Michigan and northwestern Kentucky streams. High algal biomasses were rare in both areas if TP was < 0.03 mg/L and TN was <1 mg/L, and they recommended these levels as potential “targets to prevent a high probability of nuisance accrual of Cladophora.” They also recommended that, to protect streams with naturally low levels of productivity and algal biomass, “nutrient concentrations should probably be constrained” to 0.4 mg/L TN and 0.01 mg/L TP. The lead author of this study is assisting the state of Kentucky in its development of nutrient criteria.
Laboratory and field studies by Lemly (2000) and Lemly and King (2000) demonstrated a direct linkage between bacterial growth on benthic macroinvertebrates and macroinvertebrate mortality. Lemly and King (2000) studied two third-order, low flowing, cypress-gum wetland streams in the Cape Fear basin in North Carolina. The stream they classified as unenriched had macroinvertebrate orders that were free of bacterial growth, mean TN concentrations between 0.715 – 1.97 mg/L, and mean TP concentrations below 0.200 mg/L (0.054 – 0.198 mg/L). The stream in the study that was classified as enriched, based primarily on land use (hog farms were present in the watershed), had macroinvertebrate orders that were colonized by bacteria, and generally had higher nutrient concentrations (mean TN = 1.93 – 3.89 mg/L; mean TP = 0.169 – 0.620 mg/L) (Lemly and King 2000).
A Technical Advisory Committee recommended to Virginia DEQ in 1987 that the range of 0.1 – 0.2 mg/L for TP in flowing waters should be considered as appropriate for screening purposes (IEN 1987). The committee report provides little background on the reasoning applied by the group in recommending these limits, other than the likelihood that variations in natural background levels of TP in streams made a range of concentrations appropriate instead of designating a single threshold concentration. The group agreed that no standard for nitrogen in flowing waters was necessary.
6
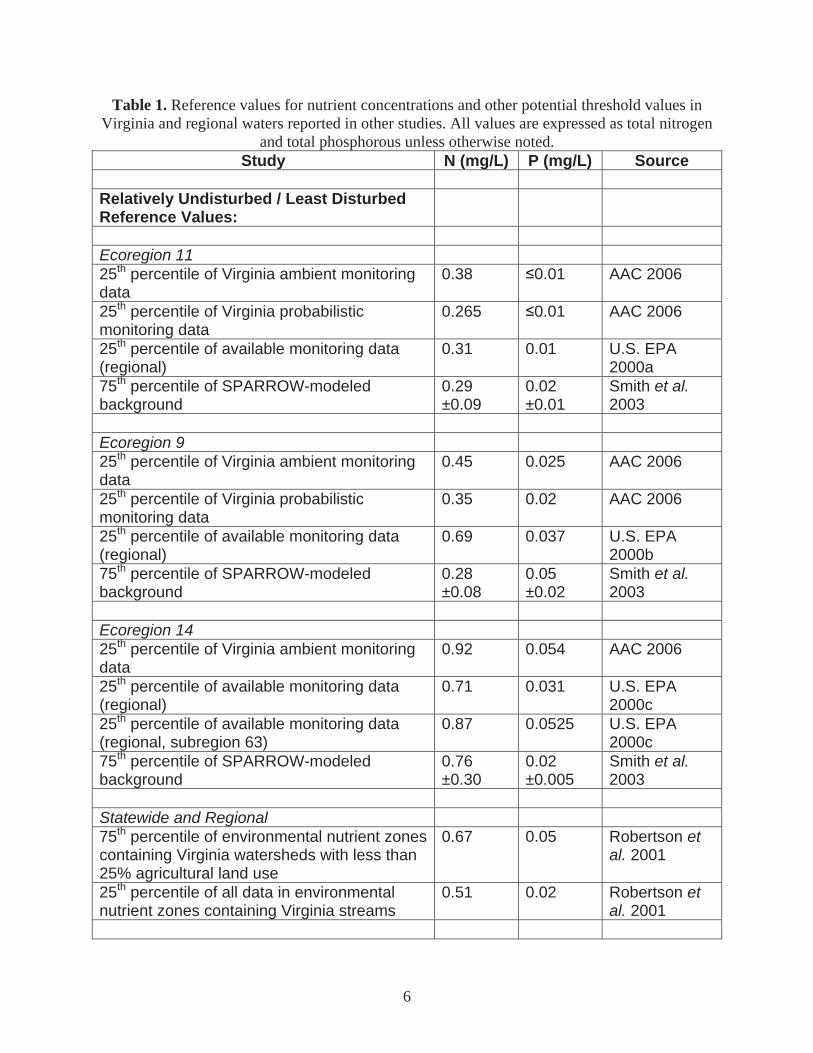
Table 1. Reference values for nutrient concentrations and other potential threshold values in Virginia and regional waters reported in other studies. All values are expressed as total nitrogen
and total phosphorous unless otherwise noted. Study N (mg/L) P (mg/L) Source
Relatively Undisturbed / Least Disturbed Reference Values:
Ecoregion 11 25th percentile of Virginia ambient monitoring data
0.38 0.01 AAC 2006
25th percentile of Virginia probabilistic monitoring data
0.265 0.01 AAC 2006
25th percentile of available monitoring data (regional)
0.31 0.01 U.S. EPA 2000a
75th percentile of SPARROW-modeled background
0.29 ±0.09
0.02 ±0.01
Smith et al. 2003
Ecoregion 9 25th percentile of Virginia ambient monitoring data
0.45 0.025 AAC 2006
25th percentile of Virginia probabilistic monitoring data
0.35 0.02 AAC 2006
25th percentile of available monitoring data (regional)
0.69 0.037 U.S. EPA 2000b
75th percentile of SPARROW-modeled background
0.28 ±0.08
0.05 ±0.02
Smith et al. 2003
Ecoregion 14 25th percentile of Virginia ambient monitoring data
0.92 0.054 AAC 2006
25th percentile of available monitoring data (regional)
0.71 0.031 U.S. EPA 2000c
25th percentile of available monitoring data (regional, subregion 63)
0.87 0.0525 U.S. EPA 2000c
75th percentile of SPARROW-modeled background
0.76 ±0.30
0.02 ±0.005
Smith et al. 2003
Statewide and Regional 75th percentile of environmental nutrient zones containing Virginia watersheds with less than 25% agricultural land use
0.67 0.05 Robertson etal. 2001
25th percentile of all data in environmental nutrient zones containing Virginia streams
0.51 0.02 Robertson etal. 2001
7
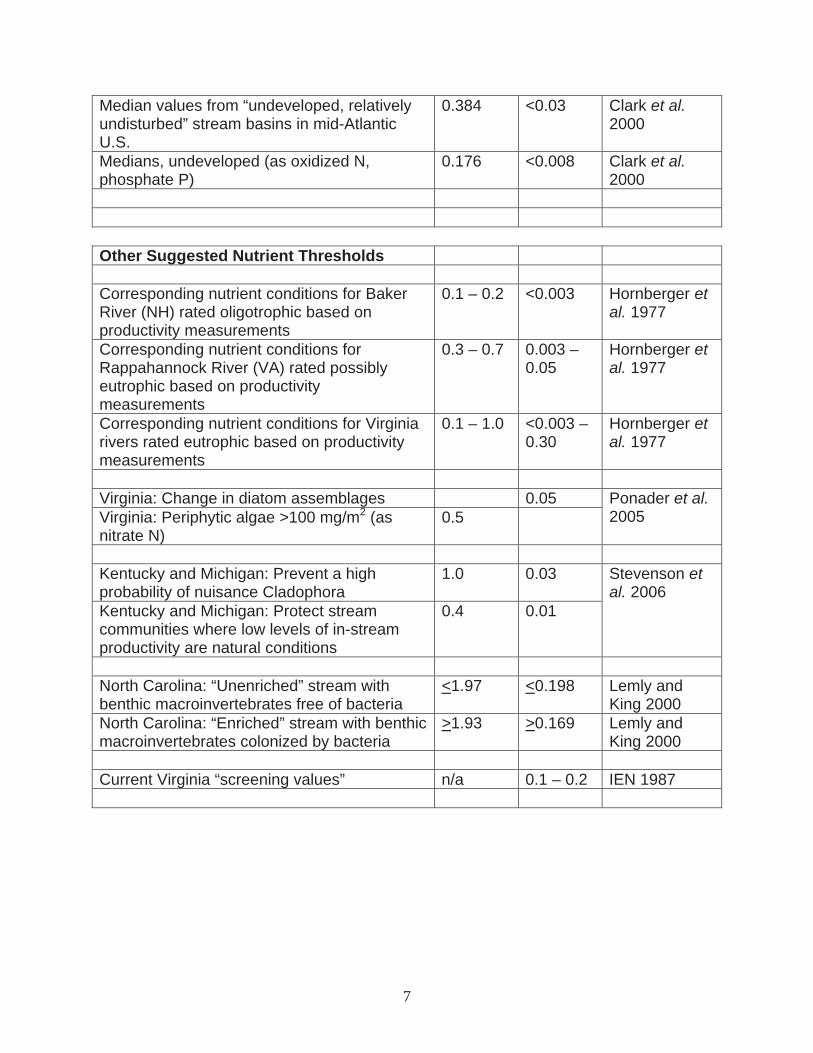
Median values from “undeveloped, relatively undisturbed” stream basins in mid-Atlantic U.S.
0.384 <0.03 Clark et al. 2000
Medians, undeveloped (as oxidized N, phosphate P)
0.176 <0.008 Clark et al. 2000
Other Suggested Nutrient Thresholds Corresponding nutrient conditions for Baker River (NH) rated oligotrophic based on productivity measurements
0.1 – 0.2 <0.003 Hornberger etal. 1977
Corresponding nutrient conditions for Rappahannock River (VA) rated possibly eutrophic based on productivity measurements
0.3 – 0.7 0.003 – 0.05
Hornberger etal. 1977
Corresponding nutrient conditions for Virginia rivers rated eutrophic based on productivity measurements
0.1 – 1.0 <0.003 – 0.30
Hornberger etal. 1977
Virginia: Change in diatom assemblages 0.05 Virginia: Periphytic algae >100 mg/m2 (as nitrate N)
0.5 Ponader et al. 2005
Kentucky and Michigan: Prevent a high probability of nuisance Cladophora
1.0 0.03
Kentucky and Michigan: Protect stream communities where low levels of in-stream productivity are natural conditions
0.4 0.01
Stevenson etal. 2006
North Carolina: “Unenriched” stream with benthic macroinvertebrates free of bacteria
<1.97 <0.198 Lemly and King 2000
North Carolina: “Enriched” stream with benthic macroinvertebrates colonized by bacteria
>1.93 >0.169 Lemly and King 2000
Current Virginia “screening values” n/a 0.1 – 0.2 IEN 1987

8
9
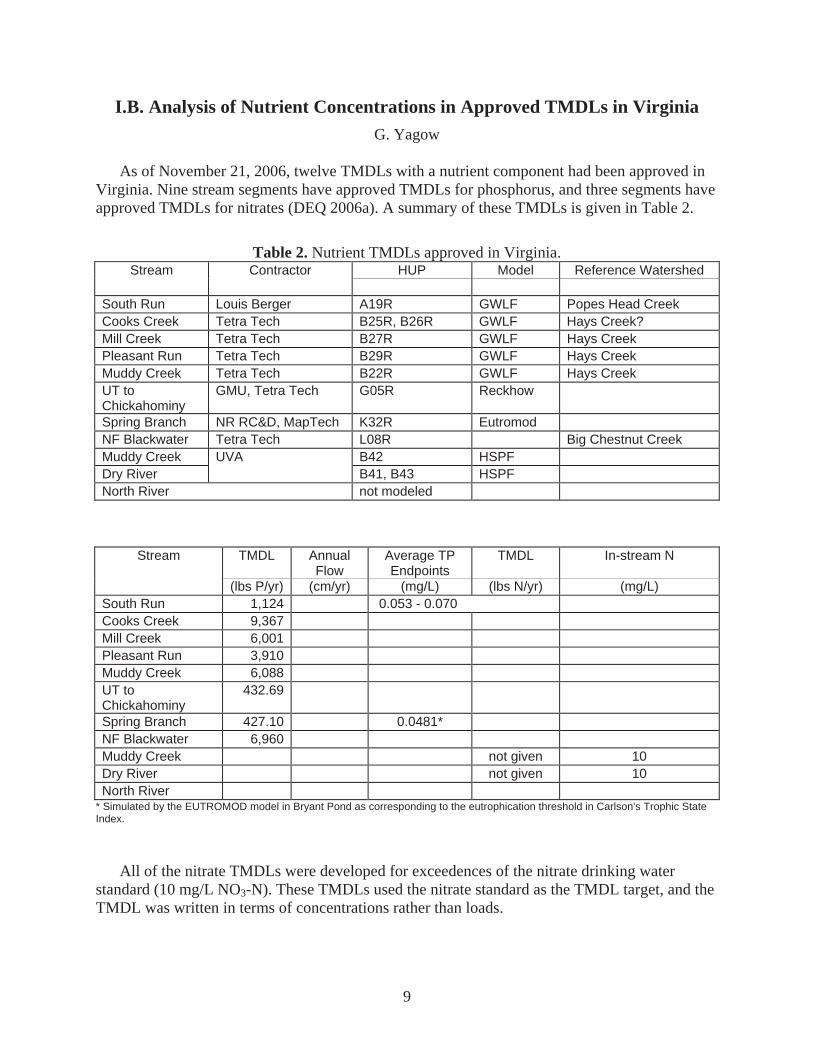
I.B. Analysis of Nutrient Concentrations in Approved TMDLs in Virginia G. Yagow
As of November 21, 2006, twelve TMDLs with a nutrient component had been approved in
Virginia. Nine stream segments have approved TMDLs for phosphorus, and three segments have approved TMDLs for nitrates (DEQ 2006a). A summary of these TMDLs is given in Table 2.
Table 2. Nutrient TMDLs approved in Virginia.
Stream Contractor HUP Model Reference Watershed
South Run Louis Berger A19R GWLF Popes Head Creek Cooks Creek Tetra Tech B25R, B26R GWLF Hays Creek? Mill Creek Tetra Tech B27R GWLF Hays Creek Pleasant Run Tetra Tech B29R GWLF Hays Creek Muddy Creek Tetra Tech B22R GWLF Hays Creek UT to Chickahominy
GMU, Tetra Tech G05R Reckhow
Spring Branch NR RC&D, MapTech K32R Eutromod NF Blackwater Tetra Tech L08R Big Chestnut Creek Muddy Creek UVA B42 HSPF Dry River B41, B43 HSPF North River not modeled
Stream TMDL Annual Flow
Average TP Endpoints
TMDL In-stream N
(lbs P/yr) (cm/yr) (mg/L) (lbs N/yr) (mg/L) South Run 1,124 0.053 - 0.070 Cooks Creek 9,367 Mill Creek 6,001 Pleasant Run 3,910 Muddy Creek 6,088 UT to Chickahominy
432.69
Spring Branch 427.10 0.0481* NF Blackwater 6,960 Muddy Creek not given 10 Dry River not given 10 North River
* Simulated by the EUTROMOD model in Bryant Pond as corresponding to the eutrophication threshold in Carlson's Trophic State Index.
All of the nitrate TMDLs were developed for exceedences of the nitrate drinking water standard (10 mg/L NO3-N). These TMDLs used the nitrate standard as the TMDL target, and the TMDL was written in terms of concentrations rather than loads.
10
All of the phosphorus TMDLs were based on stressor analyses for identified benthic impairments and used the reference watershed approach for setting the TMDL endpoints. All of the phosphorus TMDLs were defined in terms of annual loads. Only two of these TMDLs included information in their online reports related to in-stream concentration equivalents, as shown in Table 2.
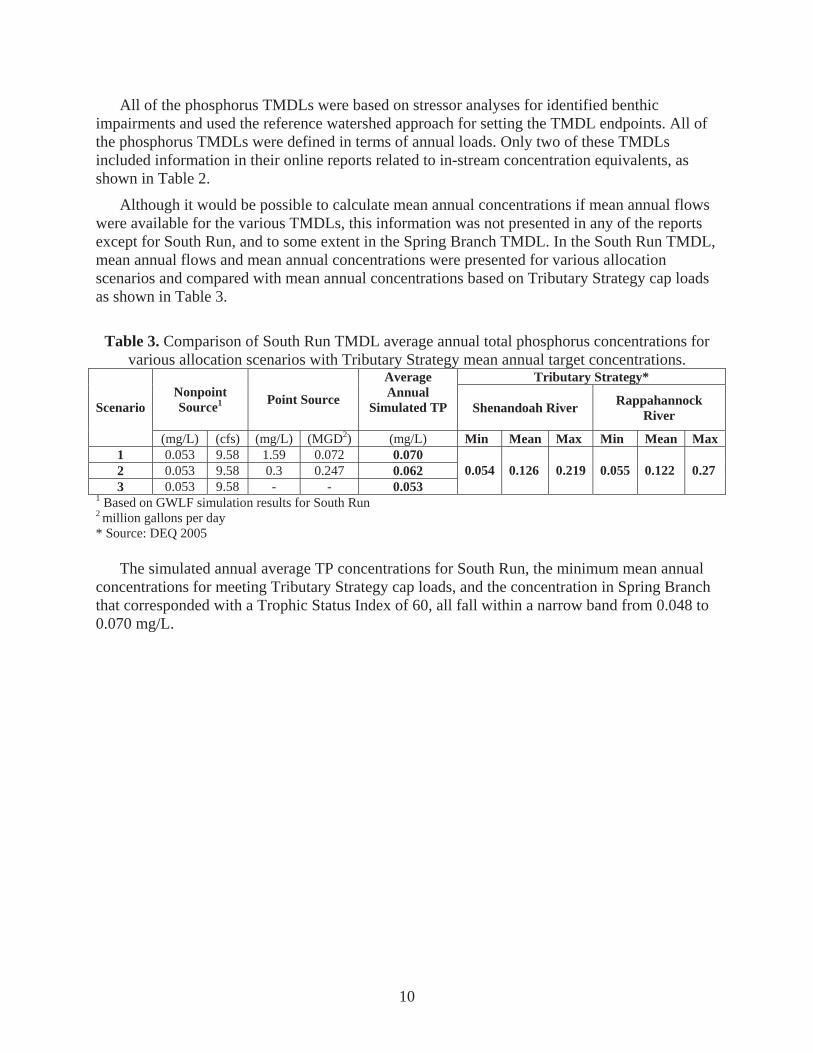
Although it would be possible to calculate mean annual concentrations if mean annual flows were available for the various TMDLs, this information was not presented in any of the reports except for South Run, and to some extent in the Spring Branch TMDL. In the South Run TMDL, mean annual flows and mean annual concentrations were presented for various allocation scenarios and compared with mean annual concentrations based on Tributary Strategy cap loads as shown in Table 3.
Table 3. Comparison of South Run TMDL average annual total phosphorus concentrations for
various allocation scenarios with Tributary Strategy mean annual target concentrations. Tributary Strategy*
Nonpoint Source1 Point Source
Average Annual
Simulated TP Shenandoah River Rappahannock RiverScenario
(mg/L) (cfs) (mg/L) (MGD2) (mg/L) Min Mean Max Min Mean Max 1 0.053 9.58 1.59 0.072 0.070 2 0.053 9.58 0.3 0.247 0.062 3 0.053 9.58 - - 0.053
0.054 0.126 0.219 0.055 0.122 0.27
1 Based on GWLF simulation results for South Run 2 million gallons per day * Source: DEQ 2005
The simulated annual average TP concentrations for South Run, the minimum mean annual concentrations for meeting Tributary Strategy cap loads, and the concentration in Spring Branch that corresponded with a Trophic Status Index of 60, all fall within a narrow band from 0.048 to 0.070 mg/L.
11
I.C. Analysis of DEQ Monitoring Data to Develop Nutrient Screening Values C. E. Zipper and E. P. Smith
Summary
This section describes an analysis of Virginia DEQ monitoring data conducted for the purpose of developing nutrient screening values. DEQ provided a data set that included both biological monitoring (benthic macroinvertebrates) and water-quality monitoring data for identical locations and similar times. Those data were screened for the purpose of identifying and removing observations for which the data record contains evidence of potential effects on the aquatic community by non-nutrient stressors. The data were then analyzed with the goal of defining relationships between in-stream nutrient concentrations and the Stream Condition Index (SCI), an indicator of the benthic community status. The analysis yielded statistically significant relationships between SCI and log-transformed nutrient variables (TKN, TN, and TP, expressed as mg/L concentrations). These relationships indicate that “critical values” (nutrient concentrations that correspond with the SCI = 60 impairment threshold) for TKN, TN, and TP are 0.3, 0.8, and 0.05 mg/L respectively. These levels are similar to the nutrient thresholds identified by prior studies (Section I.A. of this report) and TP impairment thresholds estimated by the few TMDL studies that cited concentrations (Section I.B.). However, SCI responses to nutrient concentrations are highly variable, as indicated by the wide prediction intervals occurring within the SCI-prediction models. Therefore, we consider this analysis to be inconclusive as a basis for recommending in-stream nutrient concentrations that may be used as screening values.
Introduction
The screening-value approach differs from other methods for defining water-quality criteria because nutrients differ from traditional stressors in a fundamental manner. Whereas traditional stressors generally exert toxic influences that directly degrade the system, low-level inputs of nutrients serve to increase the productivity of the system. At higher levels (over enrichment), nutrients may become a stress to the system. Furthermore, variations among physical characteristics of river-and-stream systems affect the responses of those systems to nutrient enrichment. As a result, biotic responses to nutrient enrichment at specific concentration levels are highly variable among river and stream systems.
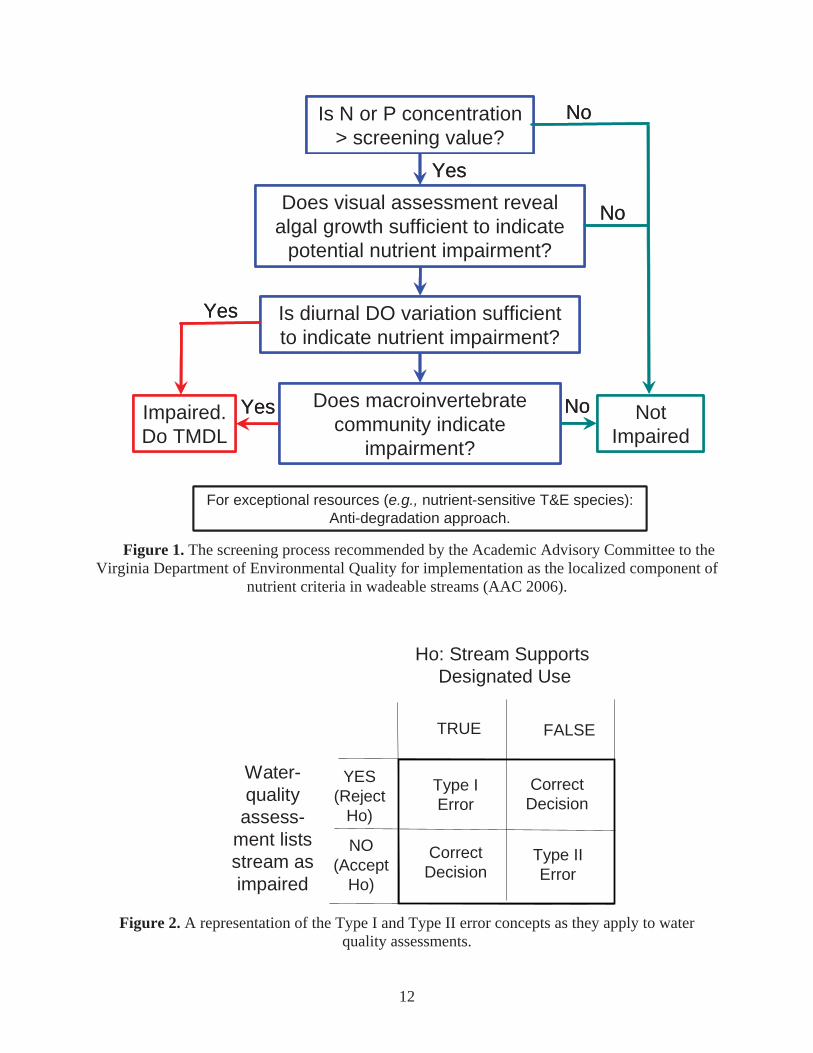
The screening value approach recommended to protect localized uses in wadeable streams in Virginia was described more fully in the June 2006 AAC report to DEQ. The process is summarized in Figure 1. The screening value approach is applied with the intention of limiting assessment errors despite the inherent variability of responses to nutrients by aquatic systems. Type I errors occur when water quality assessments list the stream as impaired, but the stream supports its designated uses. Type II errors occur when the water quality assessment fails to list the stream as impaired even though the stream does not support its designated uses (Figure 2).
12
Is N or P concentration > screening value?
No
Not Impaired
Does visual assessment reveal algal growth sufficient to indicate
potential nutrient impairment?
Is diurnal DO variation sufficient to indicate nutrient impairment?
Does macroinvertebratecommunity indicate
impairment?
Impaired. Do TMDL
No
NoYes
Yes
Yes
For exceptional resources (e.g., nutrient-sensitive T&E species): Anti-degradation approach.
Figure 1. The screening process recommended by the Academic Advisory Committee to the Virginia Department of Environmental Quality for implementation as the localized component of
nutrient criteria in wadeable streams (AAC 2006).
Type IError
Type IIError
Correct Decision
Correct Decision
Ho: Stream Supports Designated Use
TRUE FALSE
Water-quality assess-
ment lists stream as impaired
NO(Accept
Ho)
YES(Reject
Ho)
Figure 2. A representation of the Type I and Type II error concepts as they apply to water
quality assessments.
13
A secondary goal of using the screening value approach is to efficiently utilize DEQ’s resources while meeting the goals of the Clean Water Act. A screening-value exceedance does not necessarily result in an impairment designation. Instead, the response to a screening-value exceedance is additional stream monitoring. The purpose of the additional monitoring is to provide a more definitive assessment. Therefore the screening value can be established conservatively so as to limit Type II errors despite the nutrient-response variability of stream communities. Type I errors (and the consequent resource expenditures for TMDL studies of streams where the designated use has not been impaired) can also be limited by this approach.
Application of the screening-value approach, however, does require an evaluation of trade-
offs: Setting the screening value very conservatively, so as reduce the Type II error, probably increases the number of non-impaired sites caught by the screen. For each of these sites, DEQ must expend resources to make the correct assessment decision (limit Type I errors). Thus, the screening value approach embodies a trade-off between error limitation and water-monitoring resource expenditures. In this analysis, we evaluate potential screening values within the above conceptual framework.
Methods
A data set for use in this analysis was prepared by DEQ and provided to the AAC in late November 2006. As a first step in data preparation, DEQ personnel accessed the Ecological Data Application System (EDAS) database (1989 to present) to identify all records of benthic macroinvertebrate community assessment in Virginia streams that were conducted at a level sufficient to calculate a stream condition index (SCI) value (Burton and Gerritson 2003). All water-quality records associated with the biological monitoring location were accessed and used to create two data files: (1) all records within the three months preceding and one month following each biological monitoring observation, and (2) all water-quality monitoring records for locations where biological monitoring observations had been recorded since 1989. DEQ probabilistic, routine ambient, and special study biological monitoring observations were included. The biological monitoring records contained a calculated SCI value and various benthic macroinvertebrate and habitat metrics. The water-quality monitoring records contained site-measured parameters such as conductivity, pH, and dissolved oxygen. Laboratory measured nutrient parameters and other associated water-quality constituents such as non-filterable residue (total suspended solids) were also included.
Nutrient Variables
Various analytical procedures have been used to estimate in-stream nutrients. The nutrient parameters in the data set, therefore, were analyzed and in some cases adjusted to produce a consistent water-quality data set suitable for subsequent analysis.
When total nitrogen (TN) was not measured directly but constituent components were measured, TN was calculated as the sum of the constituents. Where nitrite-N was reported as
0.05 mg/L, a proxy value for nitrite-N was estimated based on the corresponding nitrate-N value (the majority of nitrite-N values 0.05 mg/L were assigned as 0.01 mg/L). Where total Kjeldahl N (TKN) or oxidized N was not measured directly but could be calculated from measured values of TN and the corresponding TN component, those values were calculated and
14
used in the analysis. The majority of TKN values were reported at 0.1 mg/L precision; those few values reported at 0.01 precision and >0.07 mg/L were rounded to 0.1 mg/L. When TKN was reported as 0.1 mg/L, that value was rounded to 0.05 mg/L for use in the analyses.
Because TP was analyzed only to the 0.1 mg/L level of precision prior to July 1999, all data prior to July 1999 were deleted. Additionally, TP observations made after June 1999 that were reported as 0.1 mg/L (14 of 1286 TP observations) were deleted. The correspondence of measured ortho-P with measured TP values was evaluated to determine the feasibility of using measured ortho-P to estimate missing TP values; that possibility was rejected. The ortho-P variable was determined as unsuitable for use in subsequent analyses because of a high number of observations reported as 0.05 mg/L during the 2003 – 2004 period.
Data Record Screening and Selection
Data were screened to identify and eliminate biological monitoring observations potentially influenced by non-nutrient stressors. Any monitoring location described or coded as being below a point-source discharge was removed from the database. DEQ “reference filters” (i.e., criteria used by DEQ biologists in locating biological monitoring references) were applied (Table 4, DEQ 2006b). Any location demonstrating a consistent pattern of failing to satisfy the reference filtering screens for reasons other than TN, TP, and dissolved oxygen (DO) were eliminated from subsequent analyses. The “% Urban” composition of watershed areas was determined for pre-2005 probabilistic monitoring locations using land-use data compiled by the DEQ probabilistic monitoring group. Additionally, land-use data assembled by the Virginia Institute of Marine Sciences GIS lab in late 2005 was applied to DEQ monitoring stations to identify urban land-use percentages. For those monitoring locations represented in both DEQ and VIMS databases, the urban land-use percentages were in close agreement.
Each biological monitoring observation was paired with a single water-quality observation. For most probabilistic samples, only one water-quality monitoring observation was available during the 3 months prior to or 1 month following the biological monitoring event. For locations where more than one water-quality measurement was available, criteria used to select the water-quality monitoring observation included (a) availability and completeness of water-quality nutrient measurements, (b) temporal proximity, and (c) measured total suspended solids concentrations that indicated a non-stormflow sampling event.
15
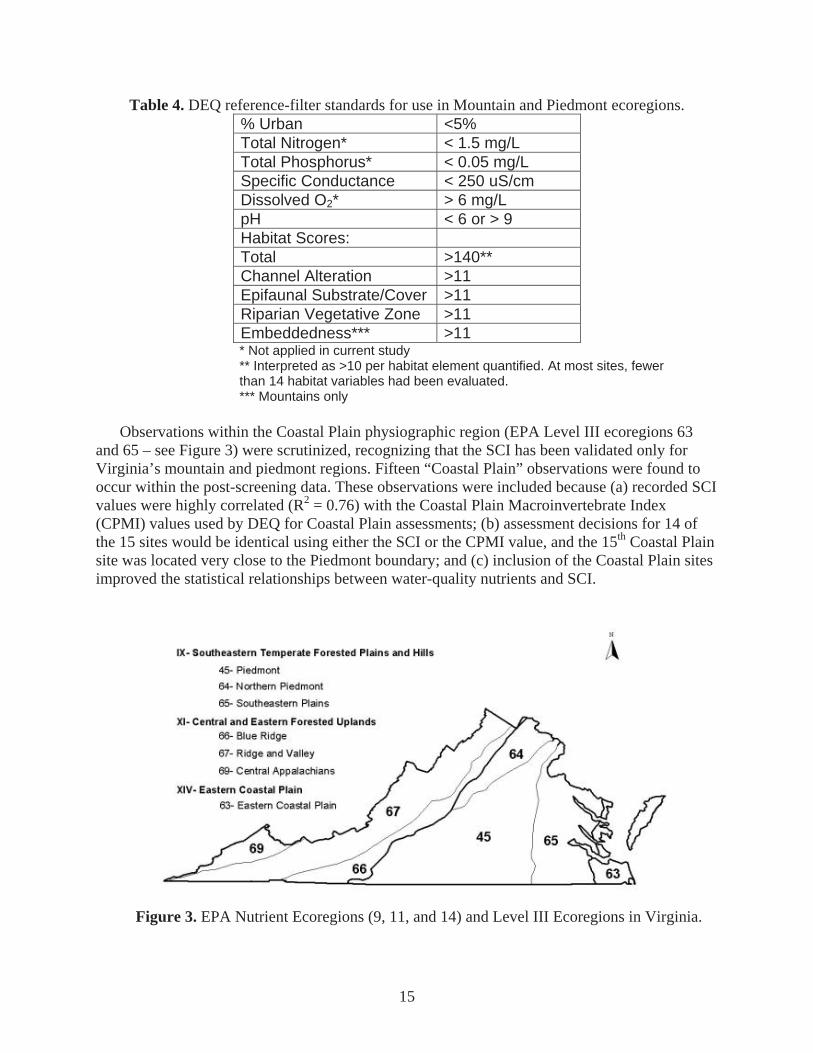
Table 4. DEQ reference-filter standards for use in Mountain and Piedmont ecoregions. % Urban <5% Total Nitrogen* < 1.5 mg/L Total Phosphorus* < 0.05 mg/L Specific Conductance < 250 uS/cm Dissolved O2* > 6 mg/L pH < 6 or > 9 Habitat Scores: Total >140** Channel Alteration >11 Epifaunal Substrate/Cover >11 Riparian Vegetative Zone >11 Embeddedness*** >11 * Not applied in current study ** Interpreted as >10 per habitat element quantified. At most sites, fewer than 14 habitat variables had been evaluated. *** Mountains only
Observations within the Coastal Plain physiographic region (EPA Level III ecoregions 63
and 65 – see Figure 3) were scrutinized, recognizing that the SCI has been validated only for Virginia’s mountain and piedmont regions. Fifteen “Coastal Plain” observations were found to occur within the post-screening data. These observations were included because (a) recorded SCI values were highly correlated (R2 = 0.76) with the Coastal Plain Macroinvertebrate Index (CPMI) values used by DEQ for Coastal Plain assessments; (b) assessment decisions for 14 of the 15 sites would be identical using either the SCI or the CPMI value, and the 15th Coastal Plain site was located very close to the Piedmont boundary; and (c) inclusion of the Coastal Plain sites improved the statistical relationships between water-quality nutrients and SCI.
Figure 3. EPA Nutrient Ecoregions (9, 11, and 14) and Level III Ecoregions in Virginia.
16
Correspondence of SCI Values to Water-Quality Nutrient Levels
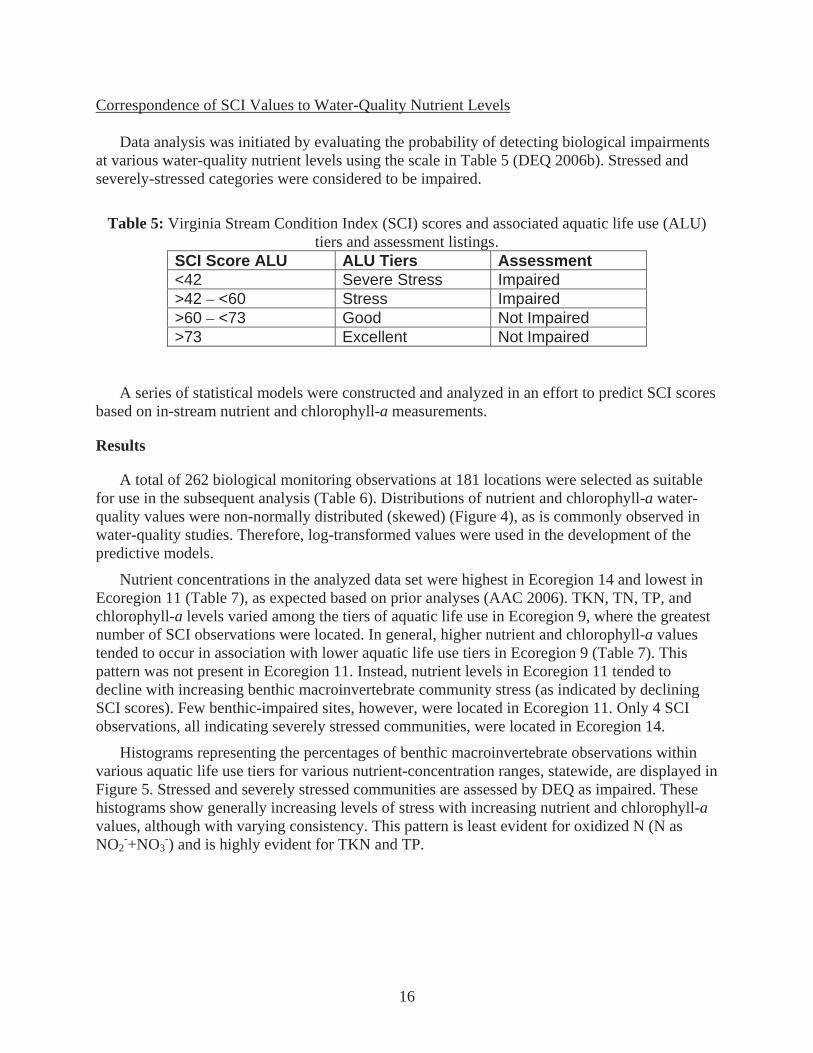
Data analysis was initiated by evaluating the probability of detecting biological impairments at various water-quality nutrient levels using the scale in Table 5 (DEQ 2006b). Stressed and severely-stressed categories were considered to be impaired.
Table 5: Virginia Stream Condition Index (SCI) scores and associated aquatic life use (ALU)
tiers and assessment listings. SCI Score ALU ALU Tiers Assessment<42 Severe Stress Impaired >42 – <60 Stress Impaired >60 – <73 Good Not Impaired >73 Excellent Not Impaired
A series of statistical models were constructed and analyzed in an effort to predict SCI scores based on in-stream nutrient and chlorophyll-a measurements.
Results
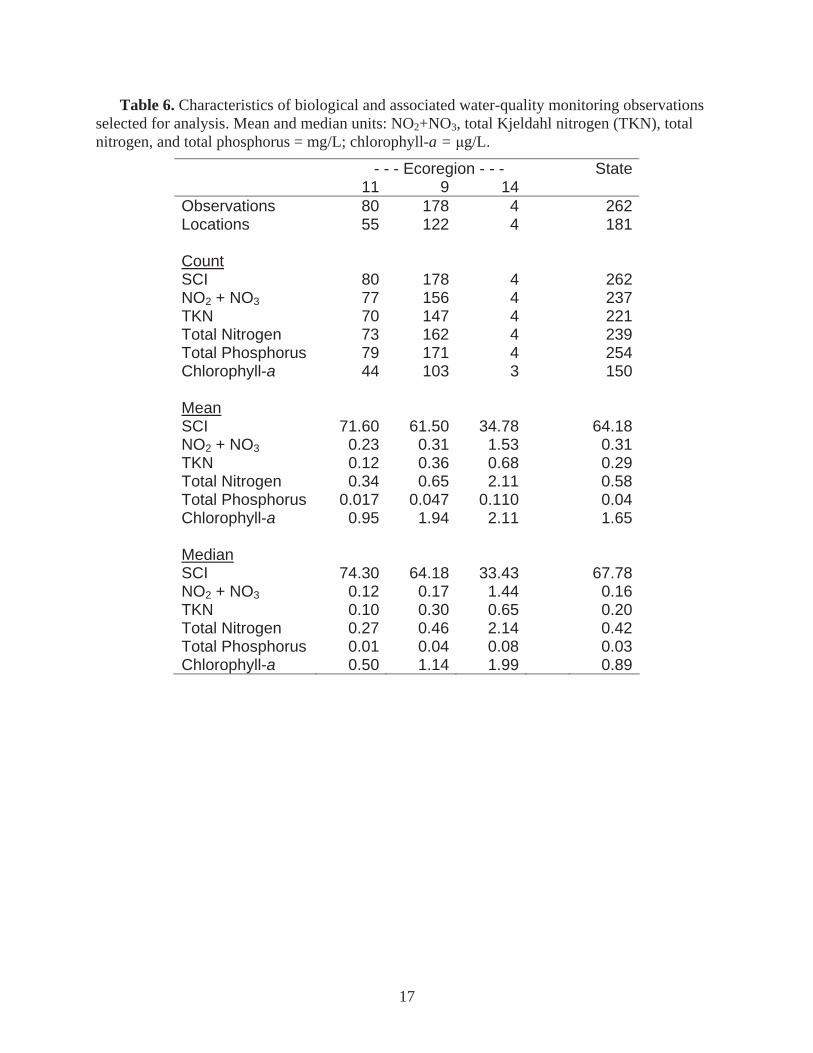
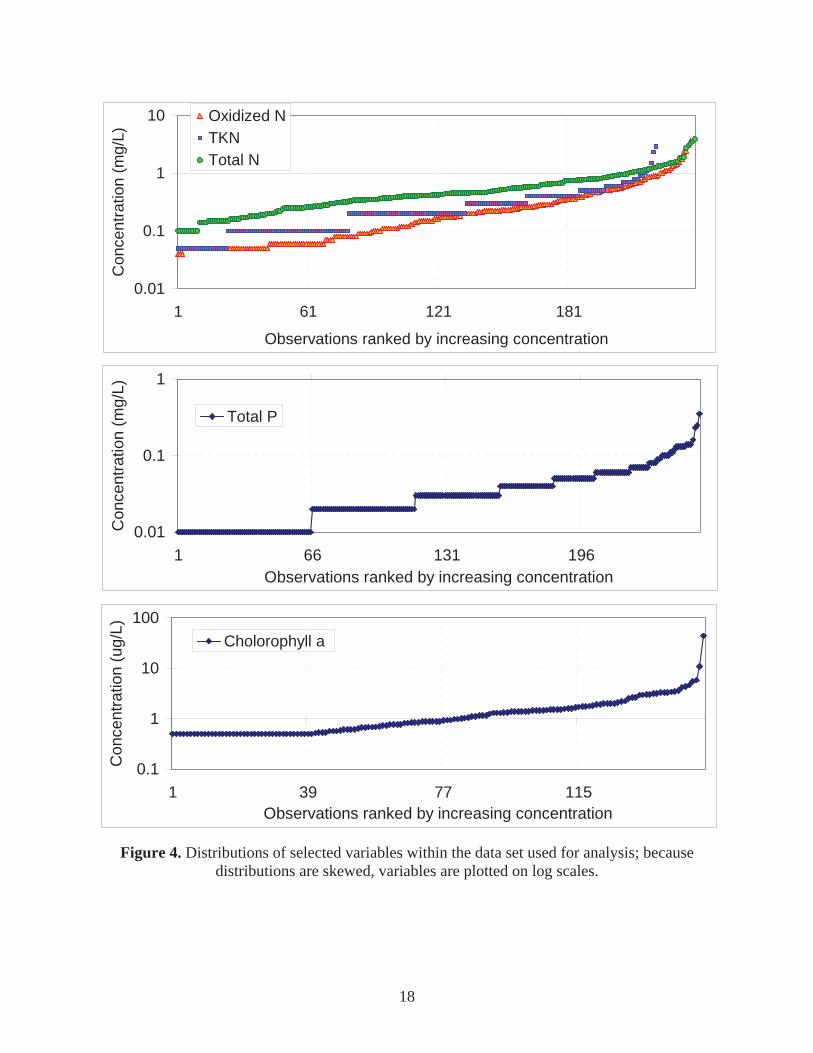
A total of 262 biological monitoring observations at 181 locations were selected as suitable for use in the subsequent analysis (Table 6). Distributions of nutrient and chlorophyll-a water-quality values were non-normally distributed (skewed) (Figure 4), as is commonly observed in water-quality studies. Therefore, log-transformed values were used in the development of the predictive models.
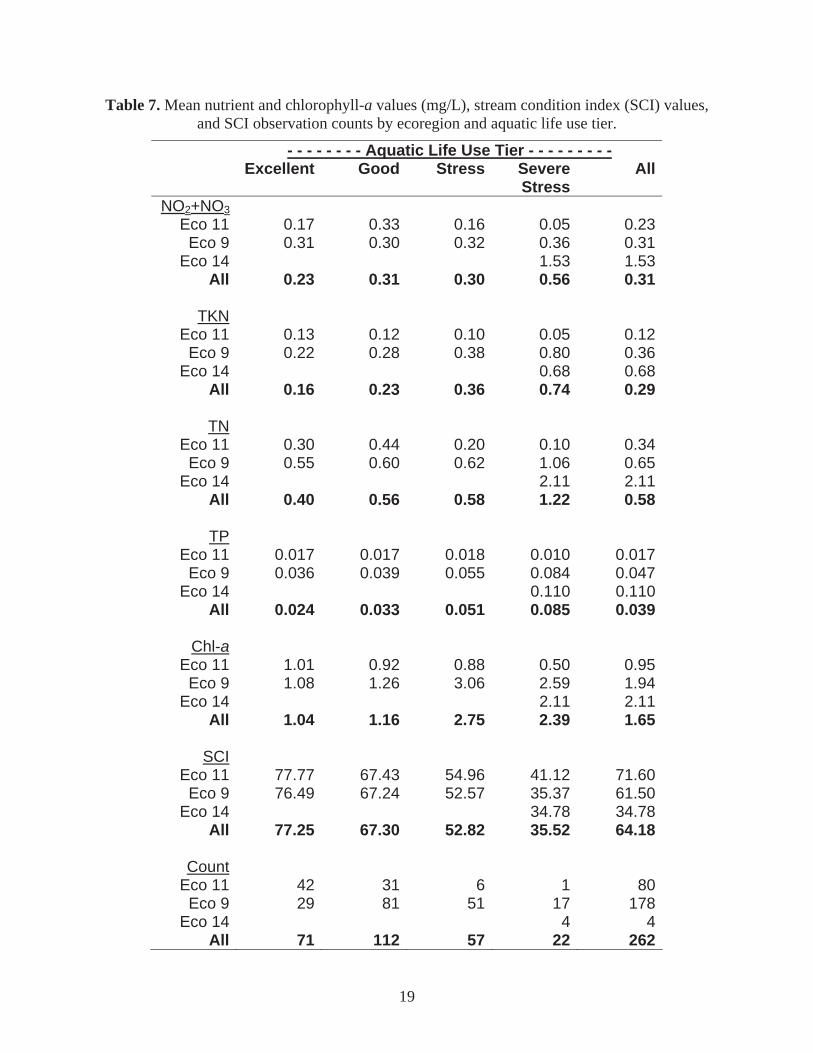
Nutrient concentrations in the analyzed data set were highest in Ecoregion 14 and lowest in Ecoregion 11 (Table 7), as expected based on prior analyses (AAC 2006). TKN, TN, TP, and chlorophyll-a levels varied among the tiers of aquatic life use in Ecoregion 9, where the greatest number of SCI observations were located. In general, higher nutrient and chlorophyll-a values tended to occur in association with lower aquatic life use tiers in Ecoregion 9 (Table 7). This pattern was not present in Ecoregion 11. Instead, nutrient levels in Ecoregion 11 tended to decline with increasing benthic macroinvertebrate community stress (as indicated by declining SCI scores). Few benthic-impaired sites, however, were located in Ecoregion 11. Only 4 SCI observations, all indicating severely stressed communities, were located in Ecoregion 14.
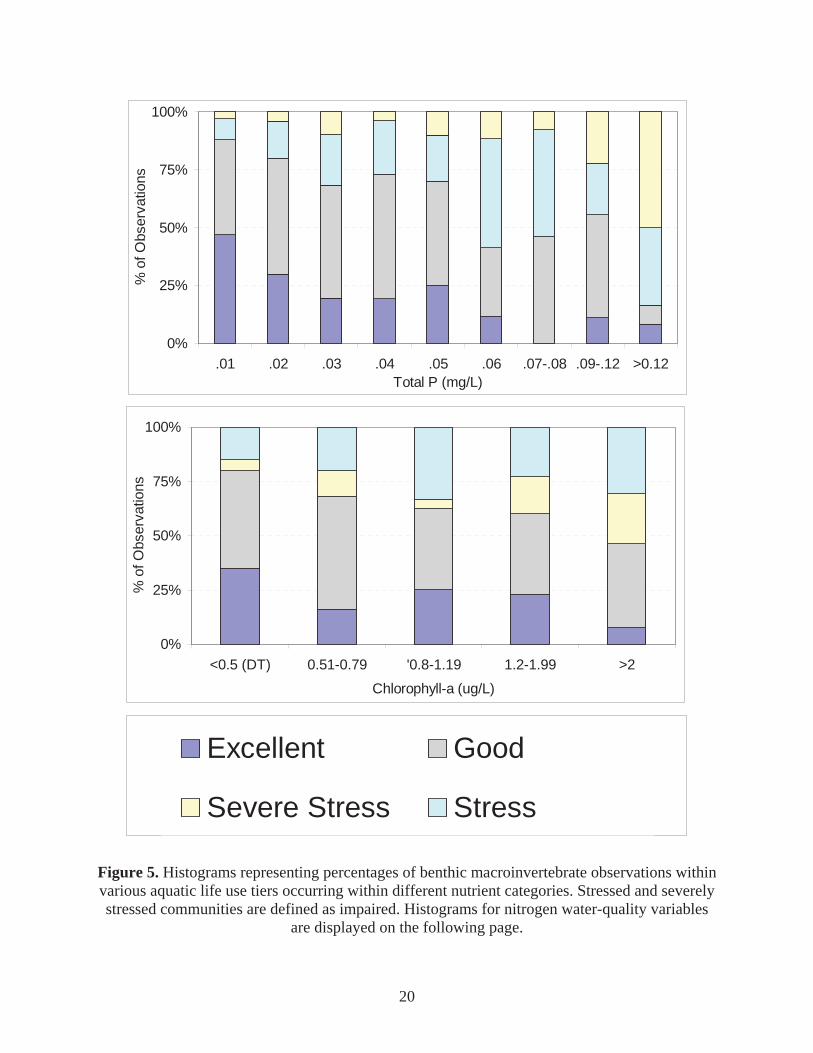
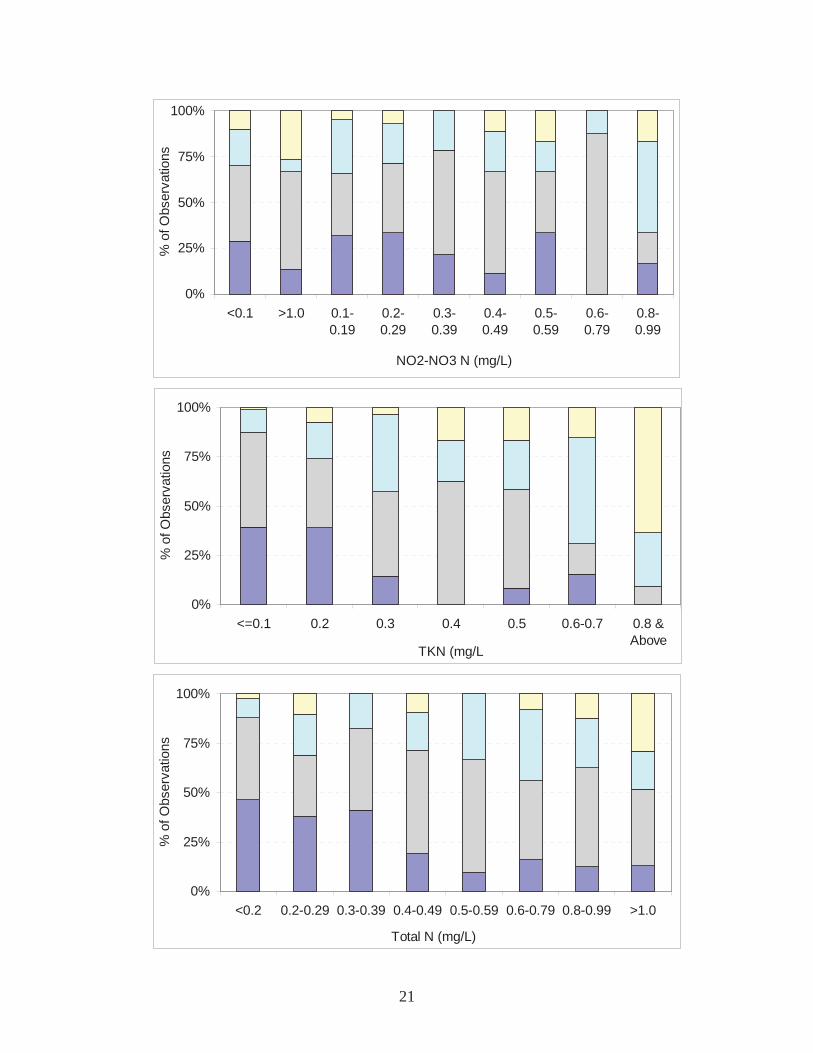
Histograms representing the percentages of benthic macroinvertebrate observations within various aquatic life use tiers for various nutrient-concentration ranges, statewide, are displayed in Figure 5. Stressed and severely stressed communities are assessed by DEQ as impaired. These histograms show generally increasing levels of stress with increasing nutrient and chlorophyll-a values, although with varying consistency. This pattern is least evident for oxidized N (N as NO2
-+NO3-) and is highly evident for TKN and TP.
17
Table 6. Characteristics of biological and associated water-quality monitoring observations selected for analysis. Mean and median units: NO2+NO3, total Kjeldahl nitrogen (TKN), total nitrogen, and total phosphorus = mg/L; chlorophyll-a = g/L.
- - - Ecoregion - - - State 11 9 14
Observations 80 178 4 262 Locations 55 122 4 181
Count SCI 80 178 4 262 NO2 + NO3 77 156 4 237 TKN 70 147 4 221 Total Nitrogen 73 162 4 239 Total Phosphorus 79 171 4 254 Chlorophyll-a 44 103 3 150
Mean SCI 71.60 61.50 34.78 64.18 NO2 + NO3 0.23 0.31 1.53 0.31 TKN 0.12 0.36 0.68 0.29 Total Nitrogen 0.34 0.65 2.11 0.58 Total Phosphorus 0.017 0.047 0.110 0.04 Chlorophyll-a 0.95 1.94 2.11 1.65
Median SCI 74.30 64.18 33.43 67.78 NO2 + NO3 0.12 0.17 1.44 0.16 TKN 0.10 0.30 0.65 0.20 Total Nitrogen 0.27 0.46 2.14 0.42 Total Phosphorus 0.01 0.04 0.08 0.03 Chlorophyll-a 0.50 1.14 1.99 0.89
18
0.01
0.1
1
10
1 61 121 181
Observations ranked by increasing concentration
Con
cent
ratio
n (m
g/L)
Oxidized NTKNTotal N
0.01
0.1
1
1 66 131 196Observations ranked by increasing concentration
Con
cent
ratio
n (m
g/L)
Total P
0.1
1
10
100
1 39 77 115Observations ranked by increasing concentration
Con
cent
ratio
n (u
g/L)
Cholorophyll a
Figure 4. Distributions of selected variables within the data set used for analysis; because
distributions are skewed, variables are plotted on log scales.
19
Table 7. Mean nutrient and chlorophyll-a values (mg/L), stream condition index (SCI) values, and SCI observation counts by ecoregion and aquatic life use tier.
- - - - - - - - Aquatic Life Use Tier - - - - - - - - - Excellent Good Stress Severe
StressAll
NO2+NO3 Eco 11 0.17 0.33 0.16 0.05 0.23Eco 9 0.31 0.30 0.32 0.36 0.31
Eco 14 1.53 1.53All 0.23 0.31 0.30 0.56 0.31
TKN
Eco 11 0.13 0.12 0.10 0.05 0.12Eco 9 0.22 0.28 0.38 0.80 0.36
Eco 14 0.68 0.68All 0.16 0.23 0.36 0.74 0.29
TN
Eco 11 0.30 0.44 0.20 0.10 0.34Eco 9 0.55 0.60 0.62 1.06 0.65
Eco 14 2.11 2.11All 0.40 0.56 0.58 1.22 0.58
TP
Eco 11 0.017 0.017 0.018 0.010 0.017Eco 9 0.036 0.039 0.055 0.084 0.047
Eco 14 0.110 0.110All 0.024 0.033 0.051 0.085 0.039
Chl-a
Eco 11 1.01 0.92 0.88 0.50 0.95Eco 9 1.08 1.26 3.06 2.59 1.94
Eco 14 2.11 2.11All 1.04 1.16 2.75 2.39 1.65
SCI
Eco 11 77.77 67.43 54.96 41.12 71.60Eco 9 76.49 67.24 52.57 35.37 61.50
Eco 14 34.78 34.78All 77.25 67.30 52.82 35.52 64.18
Count
Eco 11 42 31 6 1 80Eco 9 29 81 51 17 178
Eco 14 4 4All 71 112 57 22 262
20
0%
25%
50%
75%
100%
.01 .02 .03 .04 .05 .06 .07-.08 .09-.12 >0.12Total P (mg/L)
% o
f Obs
erva
tions
0%
25%
50%
75%
100%
<0.5 (DT) 0.51-0.79 '0.8-1.19 1.2-1.99 >2
Chlorophyll-a (ug/L)
% o
f Obs
erva
tions
0%
25%
50%
75%
100%
<0.5 (DT) 0.51-0.79 '0.8-1.19 1.2-1.99 >2
Chlorophyll-a (ug/L)
% o
f Obs
erva
tions
Excellent Good
Severe Stress Stress
Figure 5. Histograms representing percentages of benthic macroinvertebrate observations within various aquatic life use tiers occurring within different nutrient categories. Stressed and severely stressed communities are defined as impaired. Histograms for nitrogen water-quality variables
are displayed on the following page.
21
0%
25%
50%
75%
100%
<0.1 >1.0 0.1-0.19
0.2-0.29
0.3-0.39
0.4-0.49
0.5-0.59
0.6-0.79
0.8-0.99
NO2-NO3 N (mg/L)
% o
f Obs
erva
tions
0%
25%
50%
75%
100%
<=0.1 0.2 0.3 0.4 0.5 0.6-0.7 0.8 &Above
TKN (mg/L
% o
f Obs
erva
tions
0%
25%
50%
75%
100%
<0.2 0.2-0.29 0.3-0.39 0.4-0.49 0.5-0.59 0.6-0.79 0.8-0.99 >1.0
Total N (mg/L)
% o
f Obs
erva
tions
22
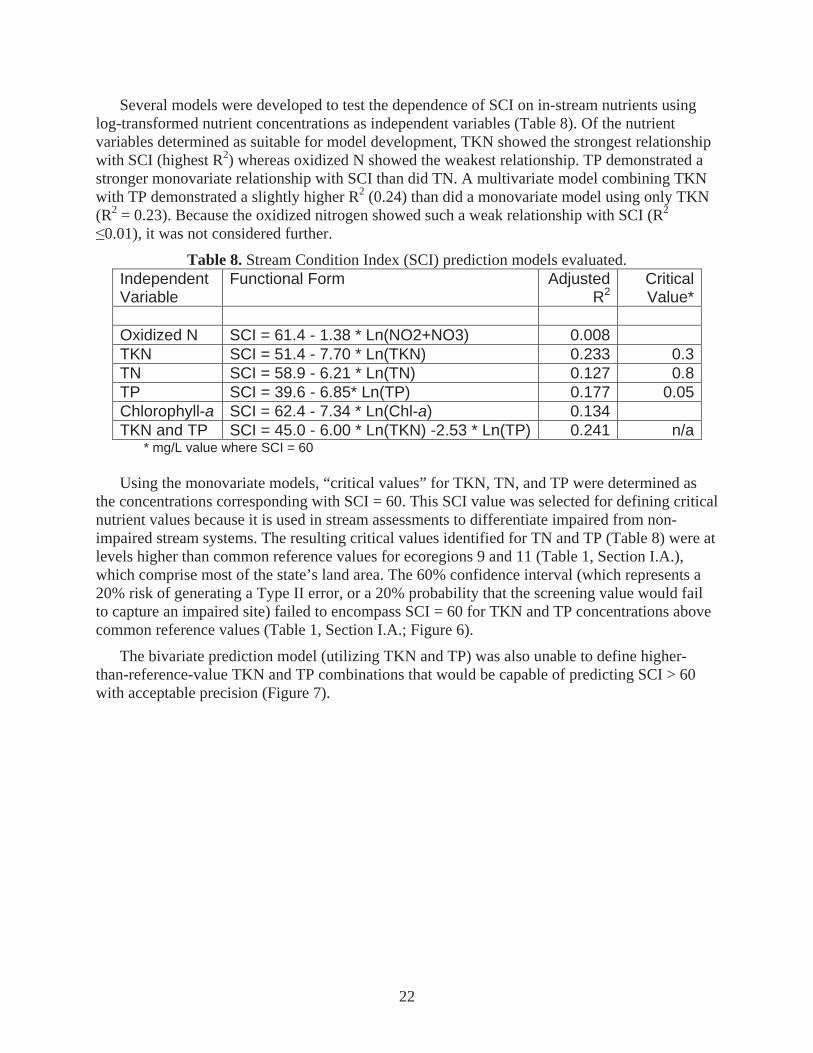
Several models were developed to test the dependence of SCI on in-stream nutrients using log-transformed nutrient concentrations as independent variables (Table 8). Of the nutrient variables determined as suitable for model development, TKN showed the strongest relationship with SCI (highest R2) whereas oxidized N showed the weakest relationship. TP demonstrated a stronger monovariate relationship with SCI than did TN. A multivariate model combining TKN with TP demonstrated a slightly higher R2 (0.24) than did a monovariate model using only TKN (R2 = 0.23). Because the oxidized nitrogen showed such a weak relationship with SCI (R2
0.01), it was not considered further.
Table 8. Stream Condition Index (SCI) prediction models evaluated. Independent Variable
Functional Form Adjusted R2
Critical Value*
Oxidized N SCI = 61.4 - 1.38 * Ln(NO2+NO3) 0.008 TKN SCI = 51.4 - 7.70 * Ln(TKN) 0.233 0.3 TN SCI = 58.9 - 6.21 * Ln(TN) 0.127 0.8TP SCI = 39.6 - 6.85* Ln(TP) 0.177 0.05Chlorophyll-a SCI = 62.4 - 7.34 * Ln(Chl-a) 0.134 TKN and TP SCI = 45.0 - 6.00 * Ln(TKN) -2.53 * Ln(TP) 0.241 n/a
* mg/L value where SCI = 60
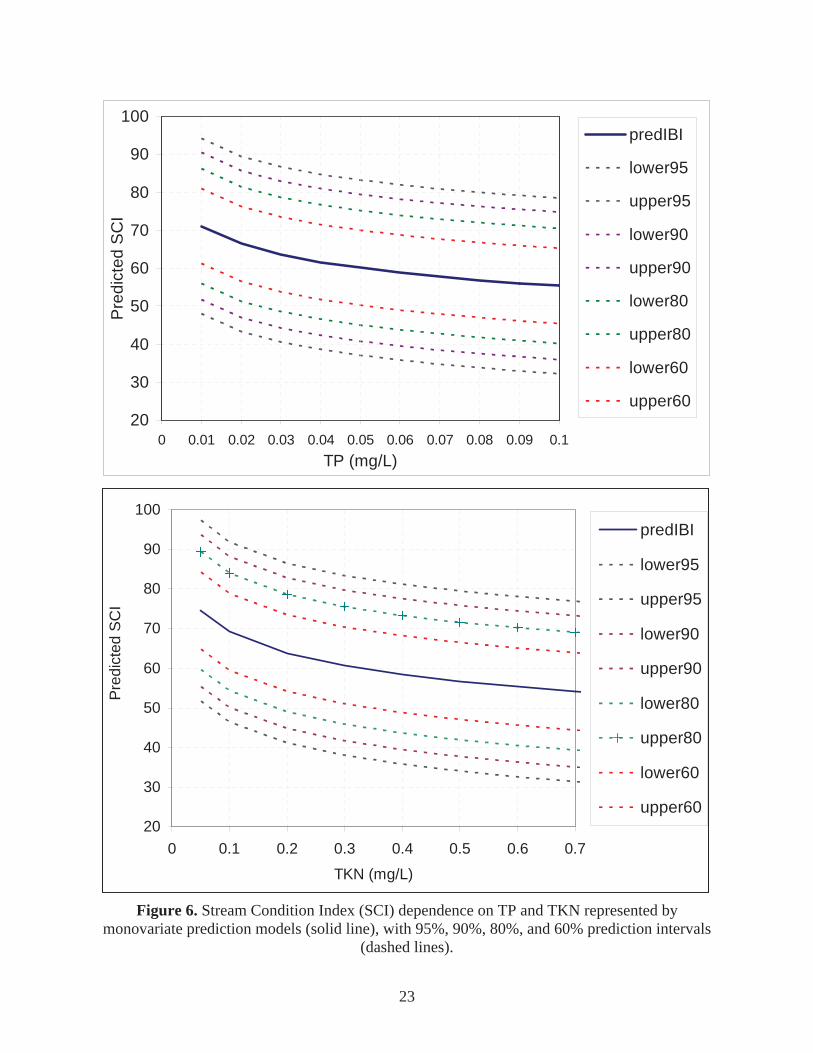
Using the monovariate models, “critical values” for TKN, TN, and TP were determined as the concentrations corresponding with SCI = 60. This SCI value was selected for defining critical nutrient values because it is used in stream assessments to differentiate impaired from non-impaired stream systems. The resulting critical values identified for TN and TP (Table 8) were at levels higher than common reference values for ecoregions 9 and 11 (Table 1, Section I.A.), which comprise most of the state’s land area. The 60% confidence interval (which represents a 20% risk of generating a Type II error, or a 20% probability that the screening value would fail to capture an impaired site) failed to encompass SCI = 60 for TKN and TP concentrations above common reference values (Table 1, Section I.A.; Figure 6).
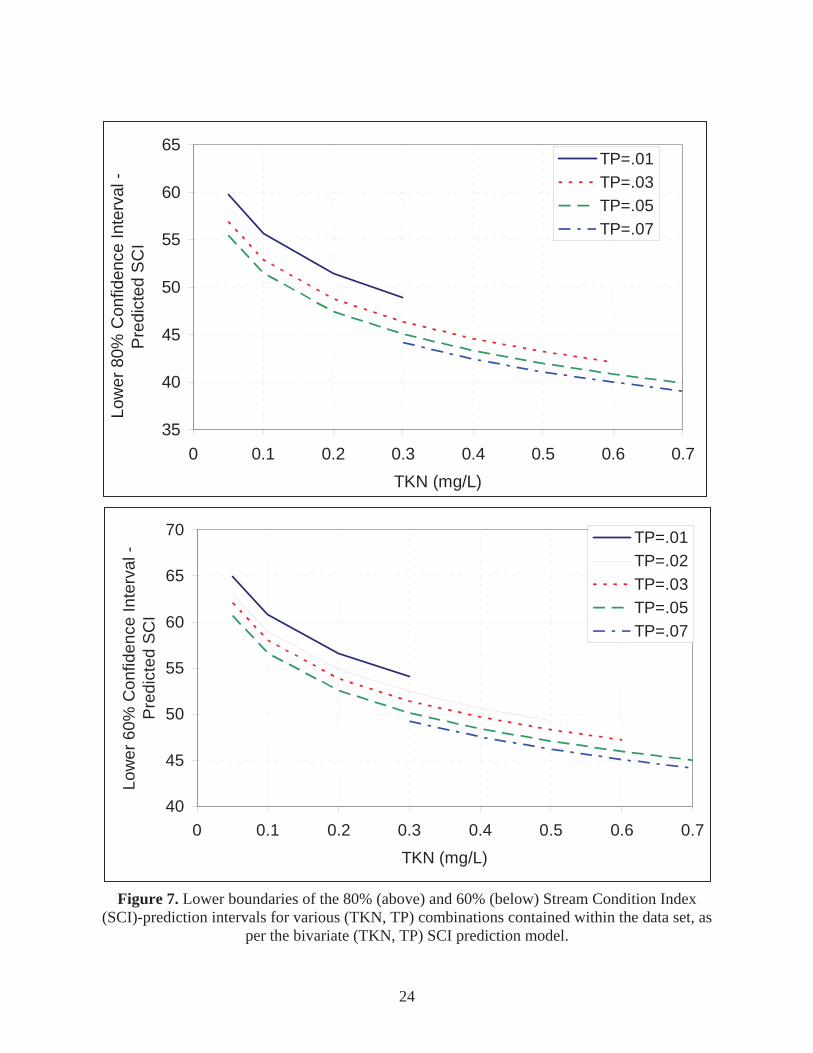
The bivariate prediction model (utilizing TKN and TP) was also unable to define higher-than-reference-value TKN and TP combinations that would be capable of predicting SCI > 60 with acceptable precision (Figure 7).
23
20
30
40
50
60
70
80
90
100
0 0.01 0.02 0.03 0.04 0.05 0.06 0.07 0.08 0.09 0.1TP (mg/L)
Pre
dict
ed S
CI
predIBI
lower95
upper95
lower90
upper90
lower80
upper80
lower60
upper60
20
30
40
50
60
70
80
90
100
0 0.1 0.2 0.3 0.4 0.5 0.6 0.7
TKN (mg/L)
Pre
dict
ed S
CI
predIBI
lower95
upper95
lower90
upper90
lower80
upper80
lower60
upper60
Figure 6. Stream Condition Index (SCI) dependence on TP and TKN represented by
monovariate prediction models (solid line), with 95%, 90%, 80%, and 60% prediction intervals (dashed lines).
24
35
40
45
50
55
60
65
0 0.1 0.2 0.3 0.4 0.5 0.6 0.7TKN (mg/L)
Low
er 8
0% C
onfid
ence
Inte
rval
-P
redi
cted
SC
I TP=.01TP=.03TP=.05TP=.07
40
45
50
55
60
65
70
0 0.1 0.2 0.3 0.4 0.5 0.6 0.7
TKN (mg/L)
Low
er 6
0% C
onfid
ence
Inte
rval
- P
redi
cted
SC
I
TP=.01TP=.02TP=.03TP=.05TP=.07
Figure 7. Lower boundaries of the 80% (above) and 60% (below) Stream Condition Index
(SCI)-prediction intervals for various (TKN, TP) combinations contained within the data set, as per the bivariate (TKN, TP) SCI prediction model.
25
Discussion
The indication that TKN is a better predictor of SCI than TN is consistent with the observation that TKN measurements from unfiltered samples (such as those which are utilized by DEQ monitoring) include planktonic algae biomass N. It appears reasonable to expect that planktonic algae levels would be higher in nutrient-impaired streams than in other streams.
The nitrogen critical values of 0.8 mg/L for TN and 0.3 mg/L for TKN are consistent with the threshold value identified by Ponader et al. (2005) for periphytic algae > 100 mg/m2 (0.5 mg/L nitrate N). These critical values are comparable to nutrient thresholds identified in other studies (Section I.A.). The critical value for TP (0.05 mg/L) is identical to the TP value identified by Ponader et al. (2005) as a threshold for change in algal species composition in Virginia waters. The TP critical value is also comparable to in-stream P concentrations for the two nutrient TMDL studies that included TMDL restoration target concentrations (Section I.B.).
The nutrient-SCI relationships embodied by the SCI prediction models are consistent with expectations and with the assumption that underlie the analysis: In all statewide relationships analyzed, high water-quality nutrient concentrations are related negatively to measured SCI values. These relationships, however, are highly variable, as evidenced by their low R2 values and wide prediction intervals. Results indicate that the use of the critical values in Table 8 as screening values would be likely result in numerous Type II errors (waters with a SCI < 60 but not identified as possibly nutrient impaired by the TKN, TN, and TP screening values). Thus, if the screening values are to be defined with the goal of limiting Type II errors, defining screening values as nutrient concentrations lower than the critical values would be warranted. However, the data variance embodied by the models creates prediction intervals that are sufficiently wide to render them unusable as a basis for recommending statistically valid screening values.
It is possible that the nutrient concentration-SCI variance may, in reality, be less than that indicated by the data set. Part of the variance could have occurred due to influences by non-nutrient stressors that were not successfully identified by the data screening procedure. Some low SCI scores (including SCI values < 60 that indicate impairment) were found to be present at very low nutrient levels. In fact, for both TN and TP, approximately 10% of the monitoring locations within the lowest concentration category (Figure 5) were associated with SCI < 60. We checked the presumption that such impairments may be non-nutrient related by searching the data set for all observations where low SCI values were associated with low TN and TP concentrations. Of the six observations found to be in the lowest quartile for TN, TP, and SCI, five also exhibited high Hilsenhoff Biotic Index (HBI) scores (highest quartile), indicating a community with a high level of tolerance to organic and nutrient pollution. Unfortunately, most of these observations were taken from probabilistic monitoring samples so we have no way to check whether the low nutrient values recorded by the single water-quality monitoring observation represented are characteristic of the nutrient concentrations that are generally experienced at these locations.
What Are Appropriate Screening Values?
It is possible that the data set used for the analysis reflects both nutrient and non-nutrient stressor effects. Although an effort was made to discard all SCI observations affected by non-nutrient stressors prior to data analysis, there is no guarantee that this goal was achieved. The possibility that the data set includes both nutrient and non-nutrient stressor effects must be considered given that analysis results include apparent benthic impairments (SCI values < 60) at
26
locations with nutrient concentrations that are quite low relative to effect-based thresholds cited in Section I.A.
Considering only the analysis that was described above, one interpretation could be that screening values could be defined as equivalent to reference values characteristic of “relatively undisturbed” or “least disturbed” waters because there appears to be some opportunity for Type II error regardless of the screening value selected. However, we would not argue for this interpretation, given the possibility that some of the low-nutrient concentration impairments (SCI values < 60) considered in the above analysis may have occurred in response to non-nutrient stressors.
Therefore, we consider this analysis to be inconclusive as a basis for recommending in-stream nutrient concentrations that may be used as screening values.
27
I.D. Ambient Monitoring Nutrient Distributions C. E. Zipper
One task described by the AAC’s FY07 work program is to estimate the implications of a recommended screening hierarchy on additional monitoring that might be required as a result of implementing that screening hierarchy. Although we are not recommending a specific screening mechanism at this time, we believe it is useful to consider the potential DEQ monitoring-resource requirements as if screening values were to be implemented. As a general example, the resources required to conduct a visual assessment would be far less than those required to conduct a benthic macroinvertebrate assessment.
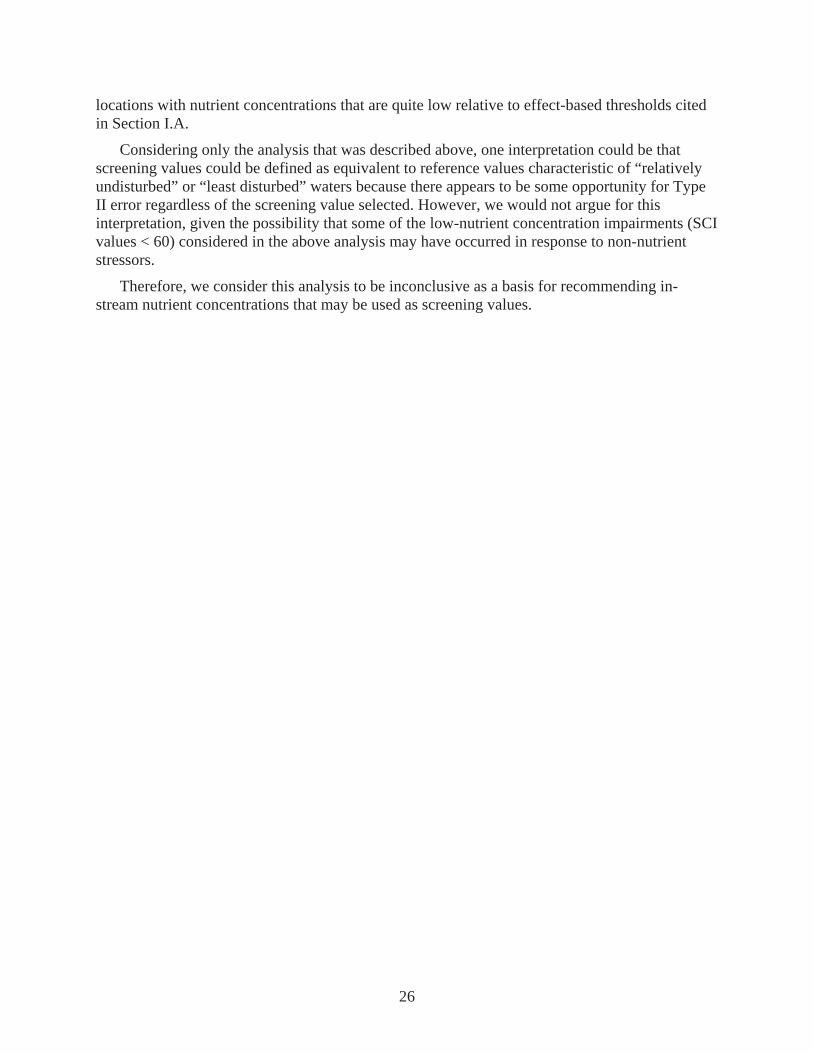
The data included in Figure 8 are intended to serve as a first step in a consideration of the monitoring-resource requirements. These data are only a first step because the DEQ resources required by a screening-value exceedance will be influenced by how the screening process proceeds (See Figure 1, Section I.C.). These data were generated from analysis of the database assembled and analyzed in the course of completing the AAC FY06 work program. The database underlying this analysis was comprised of all DEQ ambient chemical monitoring observations collected over the October 1999 – September 2005 time periods, as provided by DEQ to the AAC. When total nitrogen (TN) values were not measured directly, they were calculated from measured values as described previously (Section I.C.). The few TP concentrations for samples collected after June 1999 that were recorded as less than or equal to 0.10 mg/L were removed from the database prior to analysis. All values recorded as being less than or equal to a detection limit have been analyzed as if they were equal to the detection limit value. An annual median was calculated for a monitoring site and included in Figure 8 only if 5 or more observations were recorded at that site during that year.
28
00.10.20.30.40.50.60.70.80.9
1
0% 10% 20% 30% 40% 50% 60% 70% 80% 90% 100%Percentile
TKN
(mg/
L)Annual MedianIndividual Observations
00.20.40.60.8
11.21.41.61.8
2
0% 10% 20% 30% 40% 50% 60% 70% 80% 90% 100%
Percentile
TN (m
g/L)
Annual Median
Individual Observations
00.020.040.060.080.1
0.120.140.160.180.2
0 0.1 0.2 0.3 0.4 0.5 0.6 0.7 0.8 0.9 1
Percentile
TP (m
g/L)
Annual MedianIndividual Observations
Figure 8. Percentile distributions of Virginia DEQ monitoring data: Individual observations
(10/99 – 9/05), and annual medians (all monitoring stations with 5 or more monitoring observations per year), 2000 – 2004.
29
II.A. Pilot Application of Load-Duration Approach toRappahannock River Basin
G. Yagow Task
Develop a pilot application of the load-duration approach at four or five locations within a smaller basin, possibly the Rappahannock, to identify more specifically the issues that might be involved with flow estimation at DEQ sites without flow measurements and their translation into load thresholds for related 2010 cap-load allocations.
Summary
This section reports on an exploratory study to develop procedures for, create examples of, and identify other issues related to the use of load-duration curves as the basis for a possible flow-variable nutrient criteria. Along the way, a simpler approach, referred to as the cap-load method, evolved as a component of, and an alternative to, the more complex load-duration approach. Both approaches could be developed to set numeric nutrient criteria by major river basin and could be used in protecting the uses of downstream receiving waters.
The cap-load approach is based on the point source (PS) and non-point source (NPS) cap
loads assigned to county segments upstream of each monitoring station (determined from the Chesapeake Bay Tributary Strategy cap loads for the Rappahannock example). This approach is based on annual averages with numeric criteria developed from the annual cap loads and average daily flows estimated at the monitoring sites.
The load-duration approach is similar to the cap-load approach but requires more in-depth
analysis. This approach recognizes that PS contributions are not dependent on surface runoff and NPS load contributions may not increase linearly with increases in runoff and streamflow. This approach uses target cap loads and flow frequency curves (which represent the relationship between the daily streamflow and the percent days the given flow is exceeded) to produce load-duration curves. Loads estimated for each water sample (based on the nutrient concentration and daily flow) could be compared to the load-duration curve for the particular flow to determine if the criterion is exceeded.
Introduction
There are three types of data that must be measured or estimated as the basis for setting, and
assessing compliance with a load-based nutrient criterion: (1) an allowable nutrient load to quantify the target load; (2) flow associated with the monitoring data, and (3) monitored nutrient concentrations. Each of these three parameters must be evaluated at the desired assessment points and aggregated over some time period. For this study, the following data sources were used for these three data types: Tributary Strategy cap loads, daily USGS flow data, and DEQ nutrient monitoring data. The boundary of the study area was the Chesapeake Bay model
30
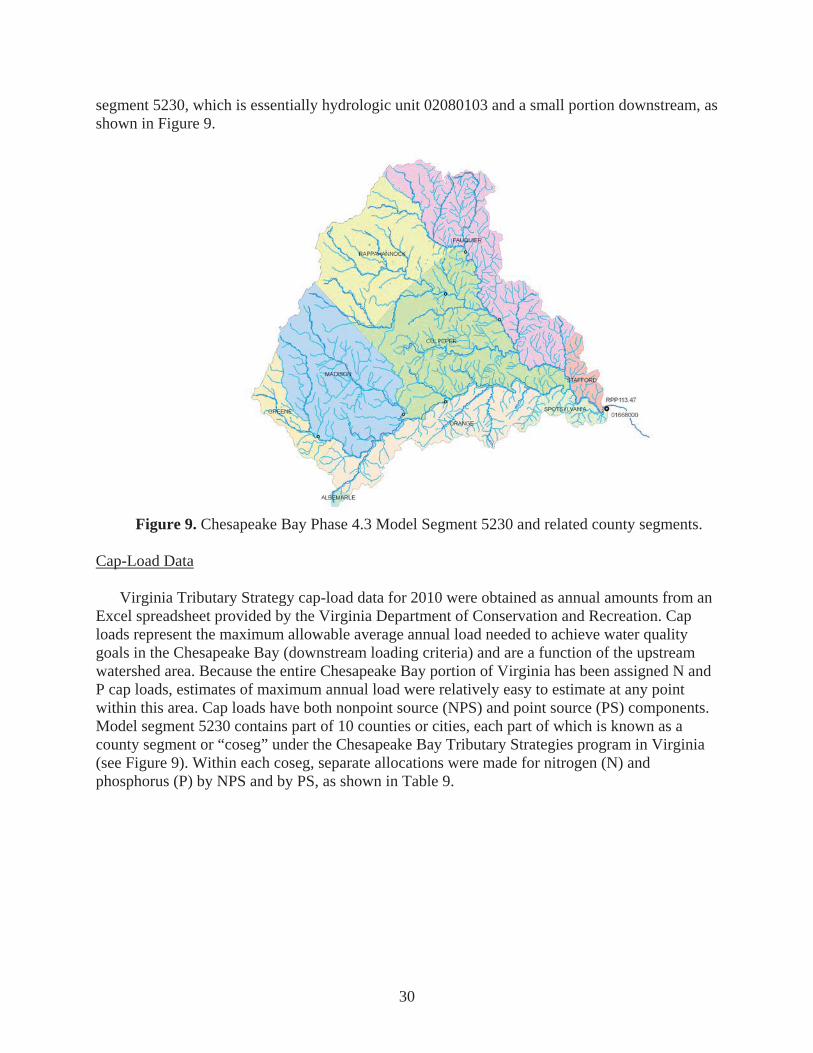
segment 5230, which is essentially hydrologic unit 02080103 and a small portion downstream, as shown in Figure 9.
Figure 9. Chesapeake Bay Phase 4.3 Model Segment 5230 and related county segments.
Cap-Load Data
Virginia Tributary Strategy cap-load data for 2010 were obtained as annual amounts from an Excel spreadsheet provided by the Virginia Department of Conservation and Recreation. Cap loads represent the maximum allowable average annual load needed to achieve water quality goals in the Chesapeake Bay (downstream loading criteria) and are a function of the upstream watershed area. Because the entire Chesapeake Bay portion of Virginia has been assigned N and P cap loads, estimates of maximum annual load were relatively easy to estimate at any point within this area. Cap loads have both nonpoint source (NPS) and point source (PS) components. Model segment 5230 contains part of 10 counties or cities, each part of which is known as a county segment or “coseg” under the Chesapeake Bay Tributary Strategies program in Virginia (see Figure 9). Within each coseg, separate allocations were made for nitrogen (N) and phosphorus (P) by NPS and by PS, as shown in Table 9.
31
Table 9. Model 5230 coseg cap-load allocations for total nitrogen and total phosphorus. TN Cap Load (lbs/yr) TP Cap Load (lbs/yr) County Coseg ID PS NPS PS NPS
Albemarle 230051003 0 5,009 0 710 Culpeper 230051047 68,162 570,781 34,405 84,260 Fauquier 230051061 40,177 444,563 14,203 68,279 Fredericksburg 230051630 0 757 0 120 Greene 230051079 0 81,024 0 13,465 Madison 230051113 0 492,795 0 84,769 Orange 230051137 35,526 264,254 13,839 38,982 Rappahannock 230051157 0 326,545 0 54,454 Spotsylvania 230051177 0 52,903 0 5,591 Stafford 230051179 0 45,354 0 4,940
Daily Flow Data
Daily flow data were obtained from selected USGS flow stations with at least 30-years of record, as shown in Table 10. A 30-year span was chosen as a reasonable basis for calculating long-term average daily flow since many statistics are based on 30-year weather normals. Daily streamflow data were downloaded for USGS stations from http://nwis.waterdata.usgs.gov/va/nwis/.
Table 10. Selected USGS daily flow stations in Model Segment 5230.
Station ID Stream NameDrainage Area (mi2)
1975-2004 Unit-Area Flow
(cfs/mi2)Period of Record
01662000 Rappahannock River nr. Warrenton 194.98 0.99 1942 - 198601663500 Hazel River at Rixeyville 285.68 1.30 1942 - 2004*01664000 Rappahannock River nr. Warrenton 619.58 1.20 1942 - 200401665500 Rapidan River nr. Ruckersville 114.65 1.40 1942 - 2004**01666500 Robinson River nr. Locust Dale 179.00 1.35 1943 - 200401667500 Rapidan River nr. Culpeper 466.62 1.29 1930 - 200401668000 Rappahannock River nr. Fredericksburg 1,341.23 1.35 1907 - 2004
* Data missing between 10/92 and 10/02, and after 09/04.** Data missing between 07/95 and 07/98.
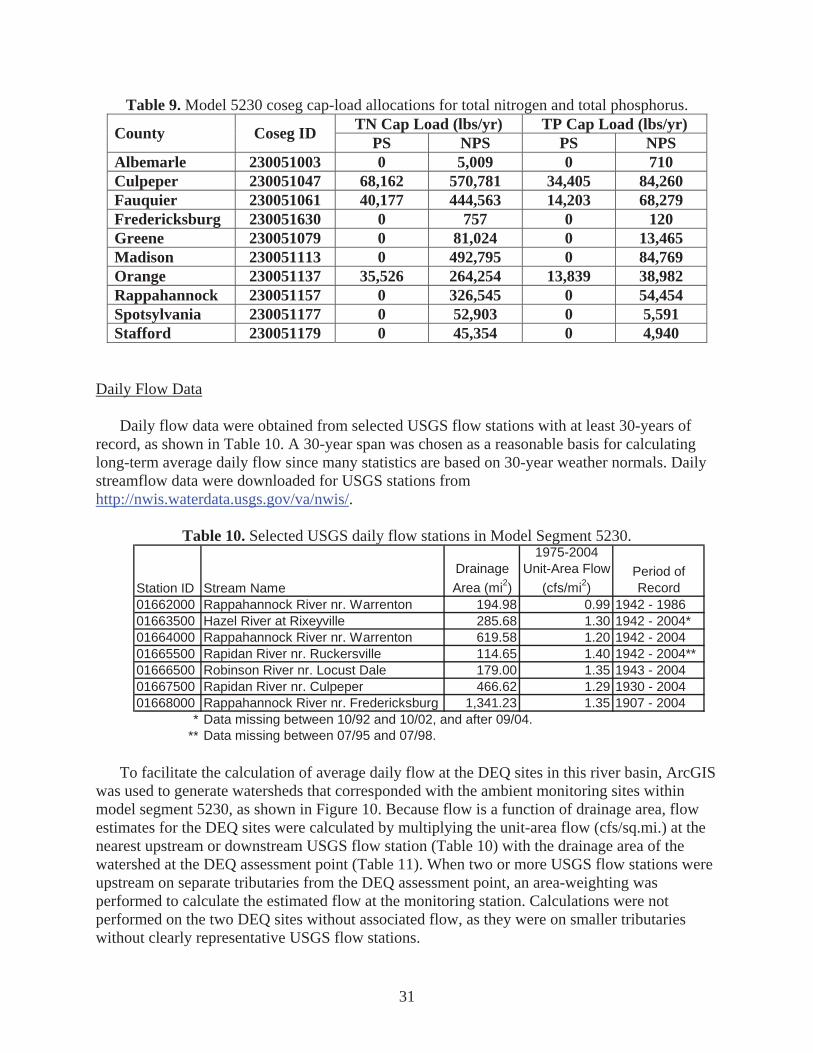
To facilitate the calculation of average daily flow at the DEQ sites in this river basin, ArcGIS
was used to generate watersheds that corresponded with the ambient monitoring sites within model segment 5230, as shown in Figure 10. Because flow is a function of drainage area, flow estimates for the DEQ sites were calculated by multiplying the unit-area flow (cfs/sq.mi.) at the nearest upstream or downstream USGS flow station (Table 10) with the drainage area of the watershed at the DEQ assessment point (Table 11). When two or more USGS flow stations were upstream on separate tributaries from the DEQ assessment point, an area-weighting was performed to calculate the estimated flow at the monitoring station. Calculations were not performed on the two DEQ sites without associated flow, as they were on smaller tributaries without clearly representative USGS flow stations.
32
Figure 10. Watershed boundaries for Virginia Department of Environmental Quality (DEQ)
ambient monitoring sites for Model Segment 5230. Also shows nearby U.S. Geological Survey flow stations.
Table 11. DEQ ambient monitoring sites and associated USGS flow stations.
DEQ Site ID Stream NameDrainage Area (mi2)
Period of Record
No. of Samples
USGS Station
Calculated Average Daily
Flow (cfs)
HAZ018.29 Hazel River 114.87 1987 - 2005 113 01663500 149.8LDR000.70 Little Dark Run 109.58 1975 - 2004 214 01666500 148.4RAP006.53 Rapidan River 674.28 1985 - 2005 193 01667500 868.2RAP045.08 Rapidan River 237.89 1987 - 2005 173 01665500 334.0ROB001.90 Robinson River 179.00 1975 - 2005 300 01666500 242.4RPP113.47 Rappahannock River 1,341.23 1985 - 2004 574 01668000 1,811.1RPP147.10 Rappahannock River 619.58 1975 - 2005 305 01664000 742.7THO006.50 Thornton River 138.44 1985 - 2005 135 01663500 180.6
CAE000.25 Carter Run 54.95 2002 - 2005 26 01662000 54.5GRT001.70 Great Run 25.02 1985 - 2005 114 01662000 24.8RPP175.51 Rappahannock River 74.03 1987 - 2005 150 01662000 73.5MTN000.59 Mountain Run 1990 - 2005 01665000MTN022.45 Mountain Run 1973 - 2005 01665000
DPR001.70 Deep Run 1974 - 2005MIR004.05 Mine Run 1974 - 2005
DEQ Sites with Associated Flow and Load-Duration Curves
DEQ Sites with Associated Flow Only
DEQ Sites with no Associated Flow
33
DEQ Nutrient Data
Monitored nutrient data were obtained for selected DEQ ambient monitoring sites from the following DEQ web site: http://gisweb.deq.virginia.gov/monapp/mon_query_form.cfm. Available nutrient data were downloaded for each site. Because nutrient analysis procedures and recorded parameters have changed over time, the following equations were made for the calculation of TN and TP. The numbers represent DEQ’s Comprehensive Environmental Data System (CEDS) parameter codes, as explained below:
TN = ((((613 OR 615) AND (618 OR 620)) OR 630) AND 625) OR 600
TP = 665 OR 70507 where the numbers represent the following CEDS parameter codes: 613 = NO2-N Dissolved 615 = NO2-N Total 618 = NO3-N Dissolved 620 = NO3-N Total 630 = NO3-N + NO2-N Total 625 = Total Kjeldahl Nitrogen 600 = Total Nitrogen 665 = Total Phosphorus 70507 = Total Ortho-Phosphorus (only used when no value was recorded for 665). Cap-Load-Based Nutrient Criteria
At the March 2006 AAC meeting, the Chesapeake Bay Tributary Strategy cap loads were
discussed as a possible basis for setting variable nutrient criteria by major basin. This section illustrates the use of such a procedure at select DEQ sites in the Upper Rappahannock River Basin.
PS cap loads were assigned to individual facilities and were manually assigned to appropriate watersheds based on facility location. NPS cap loads were distributed to each of the watersheds draining to DEQ ambient monitoring sites on an area-weighted basis as a fraction of each coseg (and their associated NPS cap-load allocation) contained within each watershed. A summary of PS and NPS loads summed for the watershed draining to each DEQ ambient site are shown in Table 12.
34
Table 12. Cap-load allocations for point sources (PS) and non-point sources (NPS) calculated at DEQ ambient sites.
PS NPS PS NPSCAE000.25 14,206.39 40,177 85,863 14,203 13,187DPR001.70 6,111.52 0 33,916 0 4,757GRT001.70 6,465.11 0 39,075 0 6,001HAZ018.29 29,746.81 0 158,334 0 25,827LDR000.70 28,369.91 0 167,652 0 28,807MTN019.75 9,858.88 68,162 56,692 34,405 8,369RAP006.53 174,515.94 35,526 979,170 13,839 156,348RAP045.08 61,542.93 35,526 337,754 13,839 55,486ROB001.90 46,350.26 0 273,212 0 46,337RPP113.47 412,735.99 143,865 2,283,228 62,447 355,451RPP147.10 160,350.99 40,177 861,247 14,203 135,752RPP175.51 19,143.26 0 100,682 0 16,176THO006.50 35,823.36 0 169,471 0 28,261
Assessment Point Upstream Area (ha)
TN Cap Load (lbs/yr) TP Cap Load (lbs/yr)
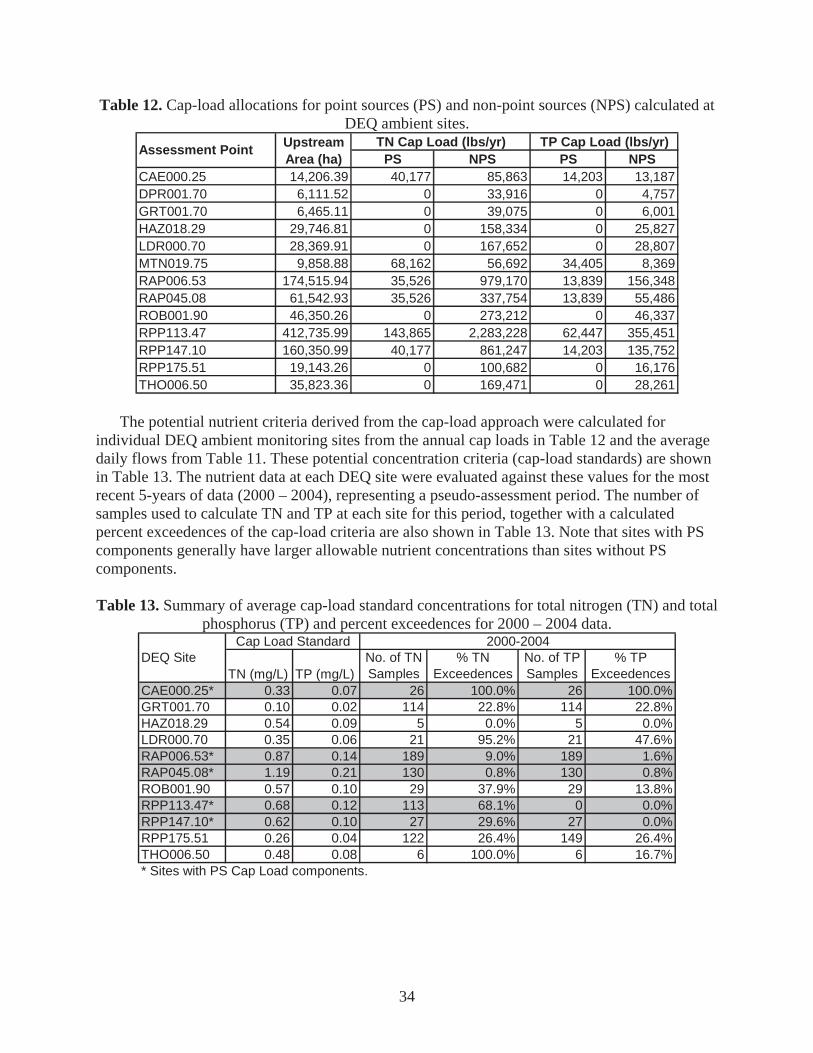
The potential nutrient criteria derived from the cap-load approach were calculated for
individual DEQ ambient monitoring sites from the annual cap loads in Table 12 and the average daily flows from Table 11. These potential concentration criteria (cap-load standards) are shown in Table 13. The nutrient data at each DEQ site were evaluated against these values for the most recent 5-years of data (2000 – 2004), representing a pseudo-assessment period. The number of samples used to calculate TN and TP at each site for this period, together with a calculated percent exceedences of the cap-load criteria are also shown in Table 13. Note that sites with PS components generally have larger allowable nutrient concentrations than sites without PS components. Table 13. Summary of average cap-load standard concentrations for total nitrogen (TN) and total
phosphorus (TP) and percent exceedences for 2000 – 2004 data.
TN (mg/L) TP (mg/L)No. of TN Samples
% TN Exceedences
No. of TP Samples
% TP Exceedences
CAE000.25* 0.33 0.07 26 100.0% 26 100.0%GRT001.70 0.10 0.02 114 22.8% 114 22.8%HAZ018.29 0.54 0.09 5 0.0% 5 0.0%LDR000.70 0.35 0.06 21 95.2% 21 47.6%RAP006.53* 0.87 0.14 189 9.0% 189 1.6%RAP045.08* 1.19 0.21 130 0.8% 130 0.8%ROB001.90 0.57 0.10 29 37.9% 29 13.8%RPP113.47* 0.68 0.12 113 68.1% 0 0.0%RPP147.10* 0.62 0.10 27 29.6% 27 0.0%RPP175.51 0.26 0.04 122 26.4% 149 26.4%THO006.50 0.48 0.08 6 100.0% 6 16.7%* Sites with PS Cap Load components.
2000-2004Cap Load StandardDEQ Site
35
Load-Duration-Based Nutrient Criteria
The load-duration approach is essentially an extension of the cap-load approach but requires more in-depth analysis. The constant cap-load criteria, given in terms of concentrations, assume that nutrient loads increase linearly with increases in daily flow. However, we know that PS contributions are fairly constant over time and are independent of surface runoff, whereas NPS nutrient loads are more dependent on runoff and thus streamflow. Modeling data for one stream segment presented in last year’s AAC report showed increasing TP concentrations but decreasing TN concentrations with increasing flow. The load-duration approach permits variable allowable nutrient loads at different flows based on the combination of expected PS and NPS contributions in a watershed. Use of these variable target loads at different flows leads to criteria that are flow-variable concentrations. In watersheds with no PS contributions, or where a long-term average concentration criterion is preferred, there is no advantage to the load-duration approach.
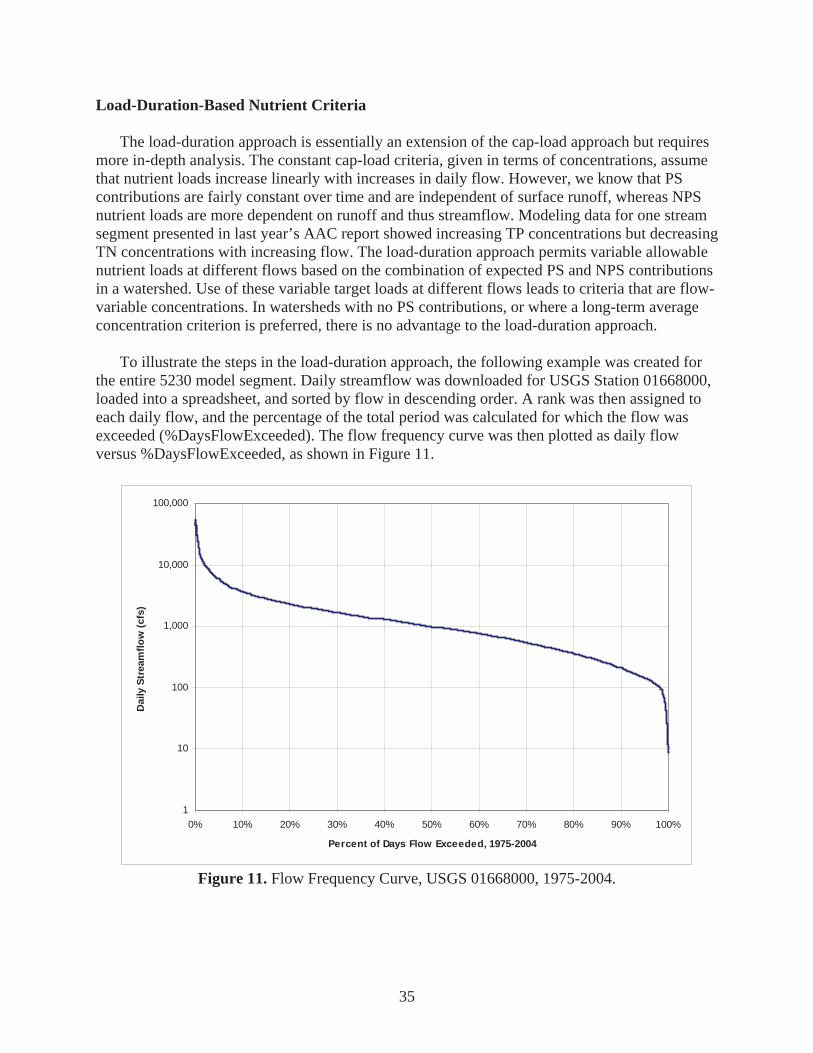
To illustrate the steps in the load-duration approach, the following example was created for
the entire 5230 model segment. Daily streamflow was downloaded for USGS Station 01668000, loaded into a spreadsheet, and sorted by flow in descending order. A rank was then assigned to each daily flow, and the percentage of the total period was calculated for which the flow was exceeded (%DaysFlowExceeded). The flow frequency curve was then plotted as daily flow versus %DaysFlowExceeded, as shown in Figure 11.
1
10
100
1,000
10,000
100,000
0% 10% 20% 30% 40% 50% 60% 70% 80% 90% 100%
Percent of Days Flow Exceeded, 1975-2004
Dai
ly S
trea
mflo
w (c
fs)
Figure 11. Flow Frequency Curve, USGS 01668000, 1975-2004.
36
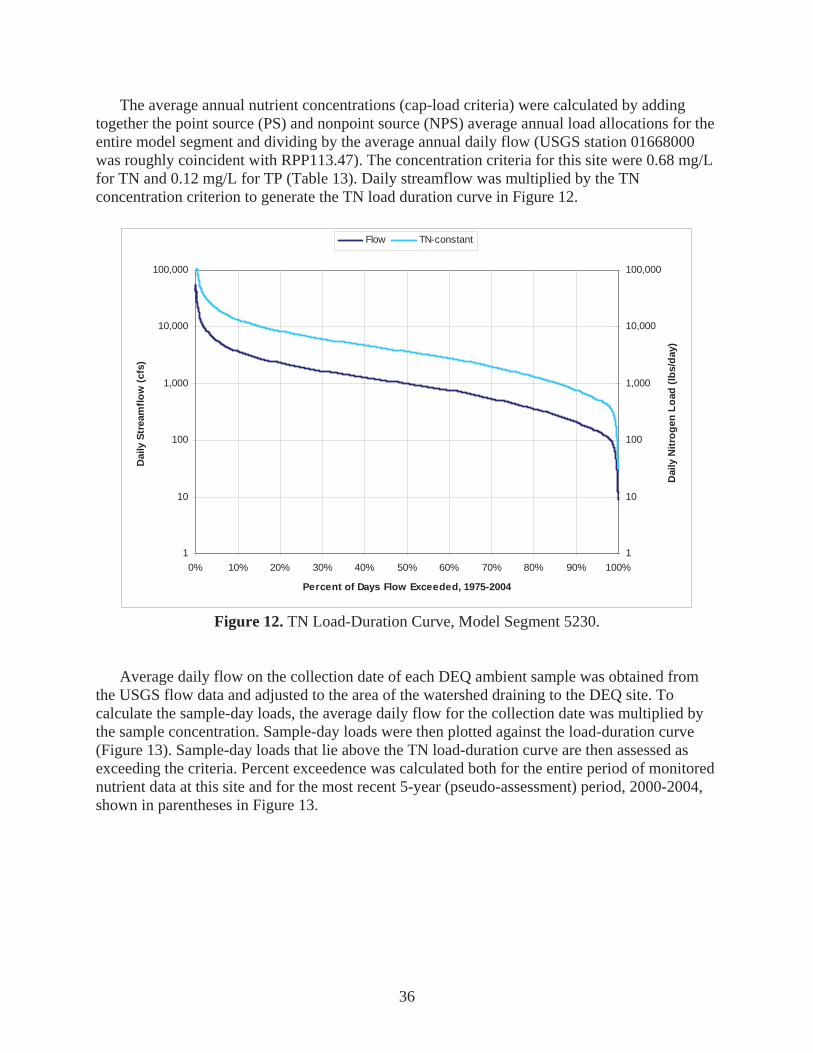
The average annual nutrient concentrations (cap-load criteria) were calculated by adding together the point source (PS) and nonpoint source (NPS) average annual load allocations for the entire model segment and dividing by the average annual daily flow (USGS station 01668000 was roughly coincident with RPP113.47). The concentration criteria for this site were 0.68 mg/L for TN and 0.12 mg/L for TP (Table 13). Daily streamflow was multiplied by the TN concentration criterion to generate the TN load duration curve in Figure 12.
1
10
100
1,000
10,000
100,000
0% 10% 20% 30% 40% 50% 60% 70% 80% 90% 100%
Percent of Days Flow Exceeded, 1975-2004
Dai
ly S
trea
mflo
w (c
fs)
1
10
100
1,000
10,000
100,000
Dai
ly N
itrog
en L
oad
(lbs/
day)
Flow TN-constant
Figure 12. TN Load-Duration Curve, Model Segment 5230.
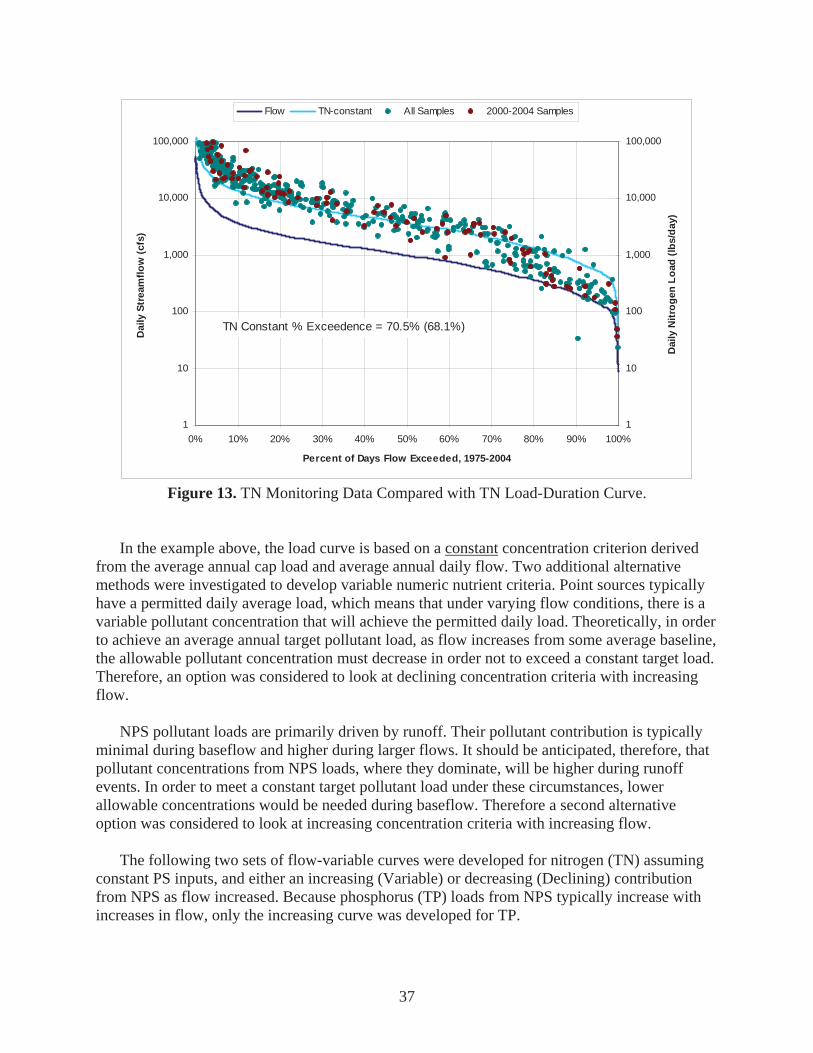
Average daily flow on the collection date of each DEQ ambient sample was obtained from the USGS flow data and adjusted to the area of the watershed draining to the DEQ site. To calculate the sample-day loads, the average daily flow for the collection date was multiplied by the sample concentration. Sample-day loads were then plotted against the load-duration curve (Figure 13). Sample-day loads that lie above the TN load-duration curve are then assessed as exceeding the criteria. Percent exceedence was calculated both for the entire period of monitored nutrient data at this site and for the most recent 5-year (pseudo-assessment) period, 2000-2004, shown in parentheses in Figure 13.
37
1
10
100
1,000
10,000
100,000
0% 10% 20% 30% 40% 50% 60% 70% 80% 90% 100%
Percent of Days Flow Exceeded, 1975-2004
Dai
ly S
trea
mflo
w (c
fs)
1
10
100
1,000
10,000
100,000
Dai
ly N
itrog
en L
oad
(lbs/
day)
Flow TN-constant All Samples 2000-2004 Samples
TN Constant % Exceedence = 70.5% (68.1%)
Figure 13. TN Monitoring Data Compared with TN Load-Duration Curve.
In the example above, the load curve is based on a constant concentration criterion derived
from the average annual cap load and average annual daily flow. Two additional alternative methods were investigated to develop variable numeric nutrient criteria. Point sources typically have a permitted daily average load, which means that under varying flow conditions, there is a variable pollutant concentration that will achieve the permitted daily load. Theoretically, in order to achieve an average annual target pollutant load, as flow increases from some average baseline, the allowable pollutant concentration must decrease in order not to exceed a constant target load. Therefore, an option was considered to look at declining concentration criteria with increasing flow.
NPS pollutant loads are primarily driven by runoff. Their pollutant contribution is typically
minimal during baseflow and higher during larger flows. It should be anticipated, therefore, that pollutant concentrations from NPS loads, where they dominate, will be higher during runoff events. In order to meet a constant target pollutant load under these circumstances, lower allowable concentrations would be needed during baseflow. Therefore a second alternative option was considered to look at increasing concentration criteria with increasing flow.
The following two sets of flow-variable curves were developed for nitrogen (TN) assuming
constant PS inputs, and either an increasing (Variable) or decreasing (Declining) contribution from NPS as flow increased. Because phosphorus (TP) loads from NPS typically increase with increases in flow, only the increasing curve was developed for TP.
38
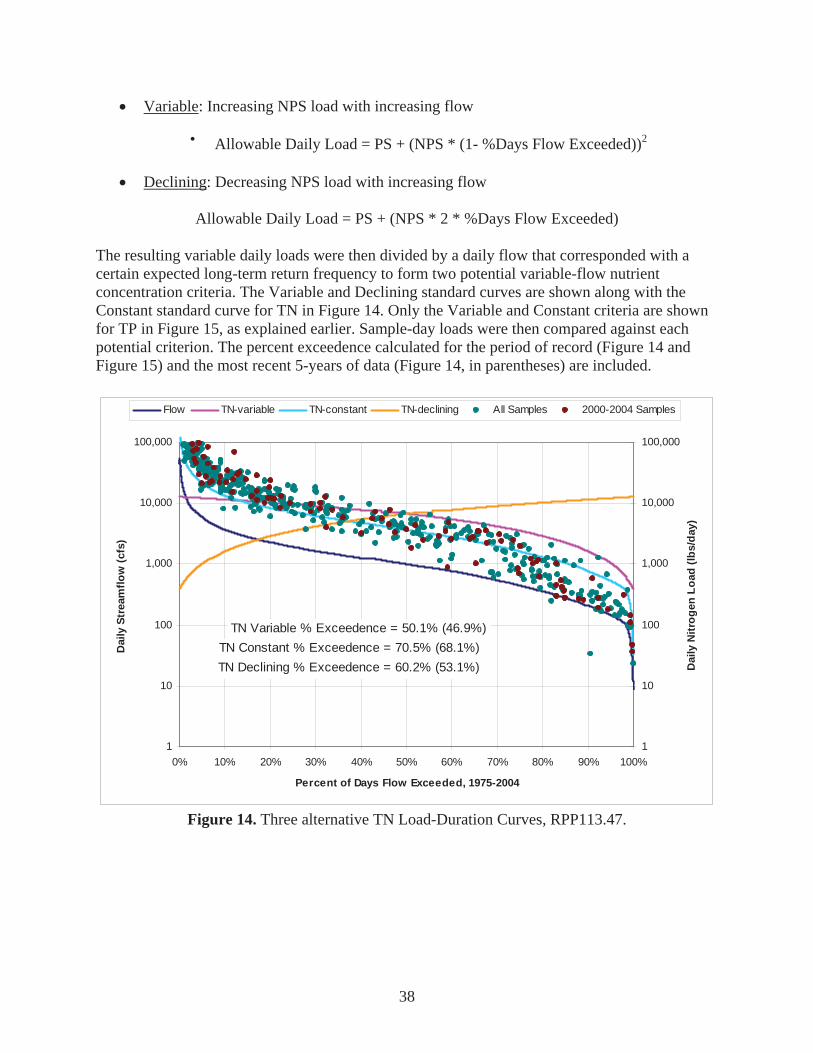
Variable: Increasing NPS load with increasing flow
Allowable Daily Load = PS + (NPS * (1- %Days Flow Exceeded))2
Declining: Decreasing NPS load with increasing flow
Allowable Daily Load = PS + (NPS * 2 * %Days Flow Exceeded)
The resulting variable daily loads were then divided by a daily flow that corresponded with a certain expected long-term return frequency to form two potential variable-flow nutrient concentration criteria. The Variable and Declining standard curves are shown along with the Constant standard curve for TN in Figure 14. Only the Variable and Constant criteria are shown for TP in Figure 15, as explained earlier. Sample-day loads were then compared against each potential criterion. The percent exceedence calculated for the period of record (Figure 14 and Figure 15) and the most recent 5-years of data (Figure 14, in parentheses) are included.
1
10
100
1,000
10,000
100,000
0% 10% 20% 30% 40% 50% 60% 70% 80% 90% 100%
Percent of Days Flow Exceeded, 1975-2004
Dai
ly S
trea
mflo
w (c
fs)
1
10
100
1,000
10,000
100,000
Dai
ly N
itrog
en L
oad
(lbs/
day)
Flow TN-variable TN-constant TN-declining All Samples 2000-2004 Samples
TN Variable % Exceedence = 50.1% (46.9%)TN Constant % Exceedence = 70.5% (68.1%)TN Declining % Exceedence = 60.2% (53.1%)
Figure 14. Three alternative TN Load-Duration Curves, RPP113.47.
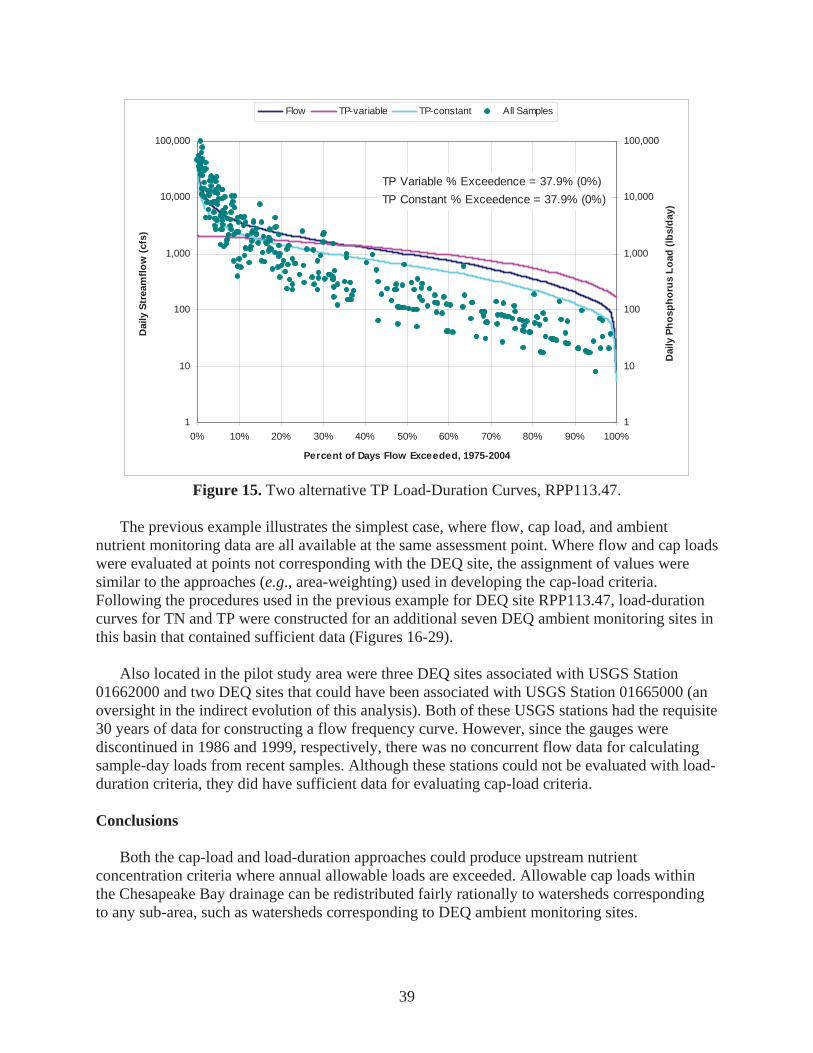
39
1
10
100
1,000
10,000
100,000
0% 10% 20% 30% 40% 50% 60% 70% 80% 90% 100%
Percent of Days Flow Exceeded, 1975-2004
Dai
ly S
trea
mflo
w (c
fs)
1
10
100
1,000
10,000
100,000
Dai
ly P
hosp
horu
s Lo
ad (l
bs/d
ay)
Flow TP-variable TP-constant All Samples
TP Variable % Exceedence = 37.9% (0%)TP Constant % Exceedence = 37.9% (0%)
Figure 15. Two alternative TP Load-Duration Curves, RPP113.47.
The previous example illustrates the simplest case, where flow, cap load, and ambient nutrient monitoring data are all available at the same assessment point. Where flow and cap loads were evaluated at points not corresponding with the DEQ site, the assignment of values were similar to the approaches (e.g., area-weighting) used in developing the cap-load criteria. Following the procedures used in the previous example for DEQ site RPP113.47, load-duration curves for TN and TP were constructed for an additional seven DEQ ambient monitoring sites in this basin that contained sufficient data (Figures 16-29).
Also located in the pilot study area were three DEQ sites associated with USGS Station 01662000 and two DEQ sites that could have been associated with USGS Station 01665000 (an oversight in the indirect evolution of this analysis). Both of these USGS stations had the requisite 30 years of data for constructing a flow frequency curve. However, since the gauges were discontinued in 1986 and 1999, respectively, there was no concurrent flow data for calculating sample-day loads from recent samples. Although these stations could not be evaluated with load-duration criteria, they did have sufficient data for evaluating cap-load criteria. Conclusions
Both the cap-load and load-duration approaches could produce upstream nutrient concentration criteria where annual allowable loads are exceeded. Allowable cap loads within the Chesapeake Bay drainage can be redistributed fairly rationally to watersheds corresponding to any sub-area, such as watersheds corresponding to DEQ ambient monitoring sites.
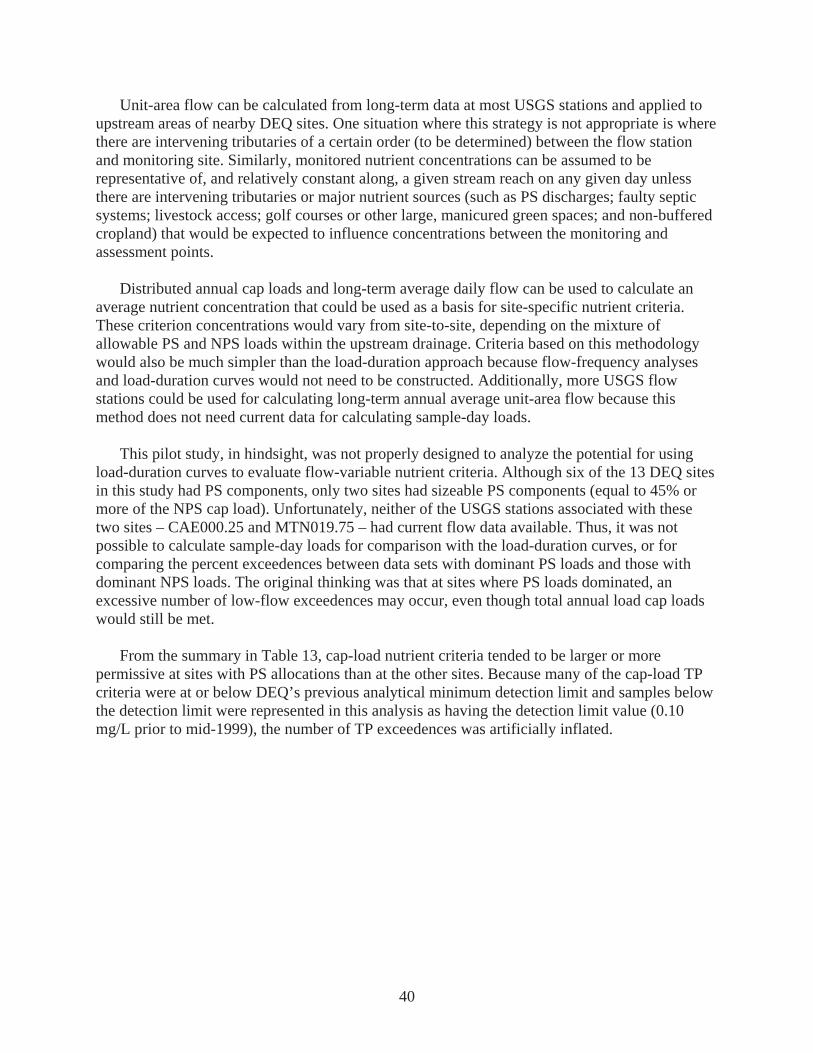
40
Unit-area flow can be calculated from long-term data at most USGS stations and applied to upstream areas of nearby DEQ sites. One situation where this strategy is not appropriate is where there are intervening tributaries of a certain order (to be determined) between the flow station and monitoring site. Similarly, monitored nutrient concentrations can be assumed to be representative of, and relatively constant along, a given stream reach on any given day unless there are intervening tributaries or major nutrient sources (such as PS discharges; faulty septic systems; livestock access; golf courses or other large, manicured green spaces; and non-buffered cropland) that would be expected to influence concentrations between the monitoring and assessment points.
Distributed annual cap loads and long-term average daily flow can be used to calculate an average nutrient concentration that could be used as a basis for site-specific nutrient criteria. These criterion concentrations would vary from site-to-site, depending on the mixture of allowable PS and NPS loads within the upstream drainage. Criteria based on this methodology would also be much simpler than the load-duration approach because flow-frequency analyses and load-duration curves would not need to be constructed. Additionally, more USGS flow stations could be used for calculating long-term annual average unit-area flow because this method does not need current data for calculating sample-day loads.
This pilot study, in hindsight, was not properly designed to analyze the potential for using load-duration curves to evaluate flow-variable nutrient criteria. Although six of the 13 DEQ sites in this study had PS components, only two sites had sizeable PS components (equal to 45% or more of the NPS cap load). Unfortunately, neither of the USGS stations associated with these two sites – CAE000.25 and MTN019.75 – had current flow data available. Thus, it was not possible to calculate sample-day loads for comparison with the load-duration curves, or for comparing the percent exceedences between data sets with dominant PS loads and those with dominant NPS loads. The original thinking was that at sites where PS loads dominated, an excessive number of low-flow exceedences may occur, even though total annual load cap loads would still be met.
From the summary in Table 13, cap-load nutrient criteria tended to be larger or more permissive at sites with PS allocations than at the other sites. Because many of the cap-load TP criteria were at or below DEQ’s previous analytical minimum detection limit and samples below the detection limit were represented in this analysis as having the detection limit value (0.10 mg/L prior to mid-1999), the number of TP exceedences was artificially inflated.
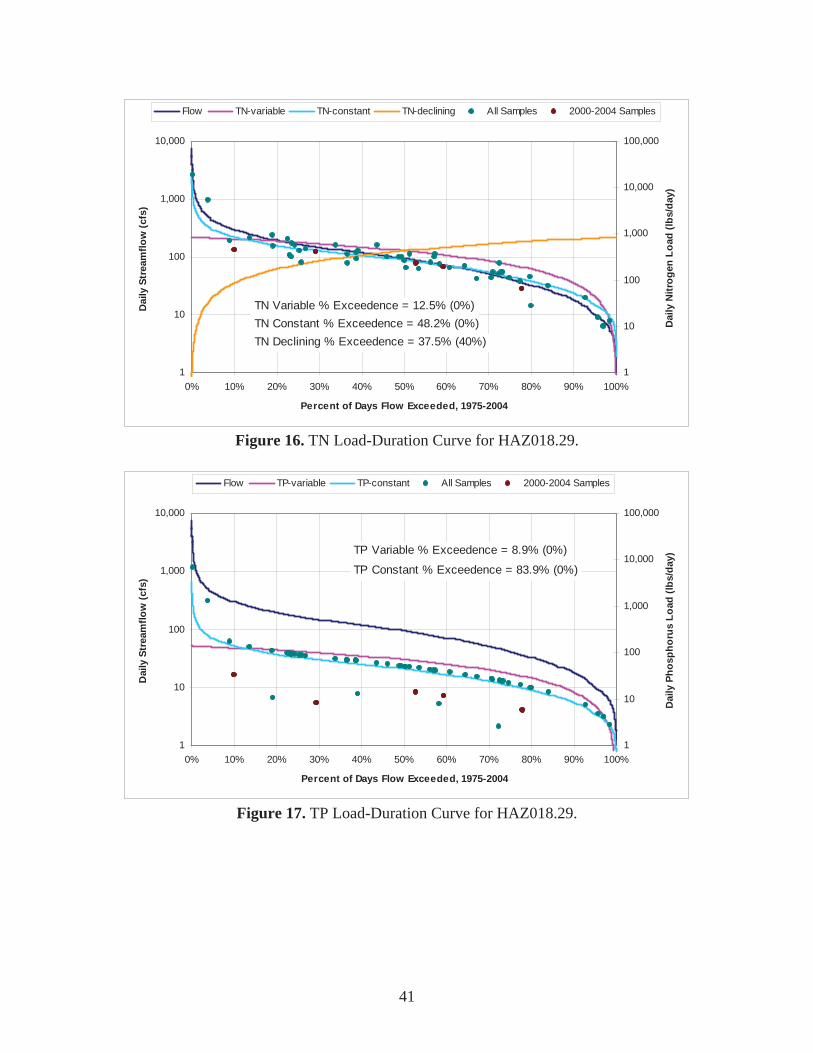
41
1
10
100
1,000
10,000
0% 10% 20% 30% 40% 50% 60% 70% 80% 90% 100%
Percent of Days Flow Exceeded, 1975-2004
Dai
ly S
trea
mflo
w (c
fs)
1
10
100
1,000
10,000
100,000
Dai
ly N
itrog
en L
oad
(lbs/
day)
Flow TN-variable TN-constant TN-declining All Samples 2000-2004 Samples
TN Variable % Exceedence = 12.5% (0%)TN Constant % Exceedence = 48.2% (0%)TN Declining % Exceedence = 37.5% (40%)
Figure 16. TN Load-Duration Curve for HAZ018.29.
1
10
100
1,000
10,000
0% 10% 20% 30% 40% 50% 60% 70% 80% 90% 100%
Percent of Days Flow Exceeded, 1975-2004
Dai
ly S
trea
mflo
w (c
fs)
1
10
100
1,000
10,000
100,000
Dai
ly P
hosp
horu
s Lo
ad (l
bs/d
ay)
Flow TP-variable TP-constant All Samples 2000-2004 Samples
TP Variable % Exceedence = 8.9% (0%)
TP Constant % Exceedence = 83.9% (0%)
Figure 17. TP Load-Duration Curve for HAZ018.29.
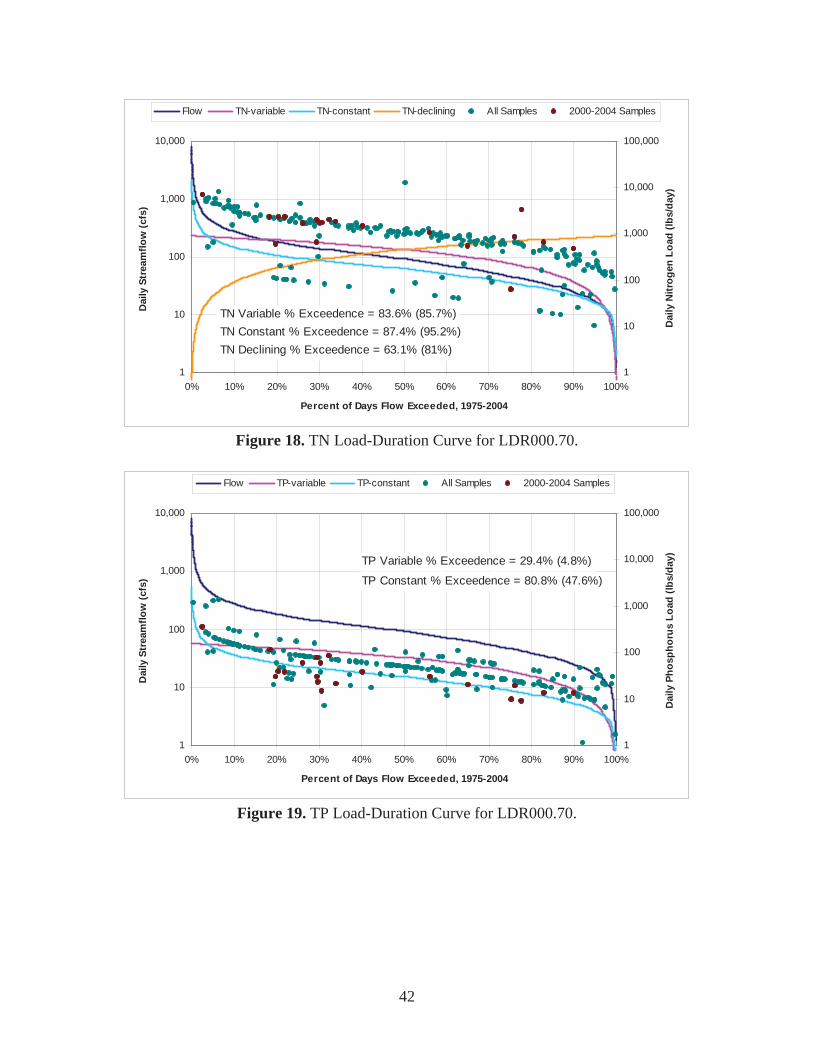
42
1
10
100
1,000
10,000
0% 10% 20% 30% 40% 50% 60% 70% 80% 90% 100%
Percent of Days Flow Exceeded, 1975-2004
Dai
ly S
trea
mflo
w (c
fs)
1
10
100
1,000
10,000
100,000
Dai
ly N
itrog
en L
oad
(lbs/
day)
Flow TN-variable TN-constant TN-declining All Samples 2000-2004 Samples
TN Variable % Exceedence = 83.6% (85.7%)TN Constant % Exceedence = 87.4% (95.2%)TN Declining % Exceedence = 63.1% (81%)
Figure 18. TN Load-Duration Curve for LDR000.70.
1
10
100
1,000
10,000
0% 10% 20% 30% 40% 50% 60% 70% 80% 90% 100%
Percent of Days Flow Exceeded, 1975-2004
Dai
ly S
trea
mflo
w (c
fs)
1
10
100
1,000
10,000
100,000
Dai
ly P
hosp
horu
s Lo
ad (l
bs/d
ay)
Flow TP-variable TP-constant All Samples 2000-2004 Samples
TP Variable % Exceedence = 29.4% (4.8%)
TP Constant % Exceedence = 80.8% (47.6%)
Figure 19. TP Load-Duration Curve for LDR000.70.
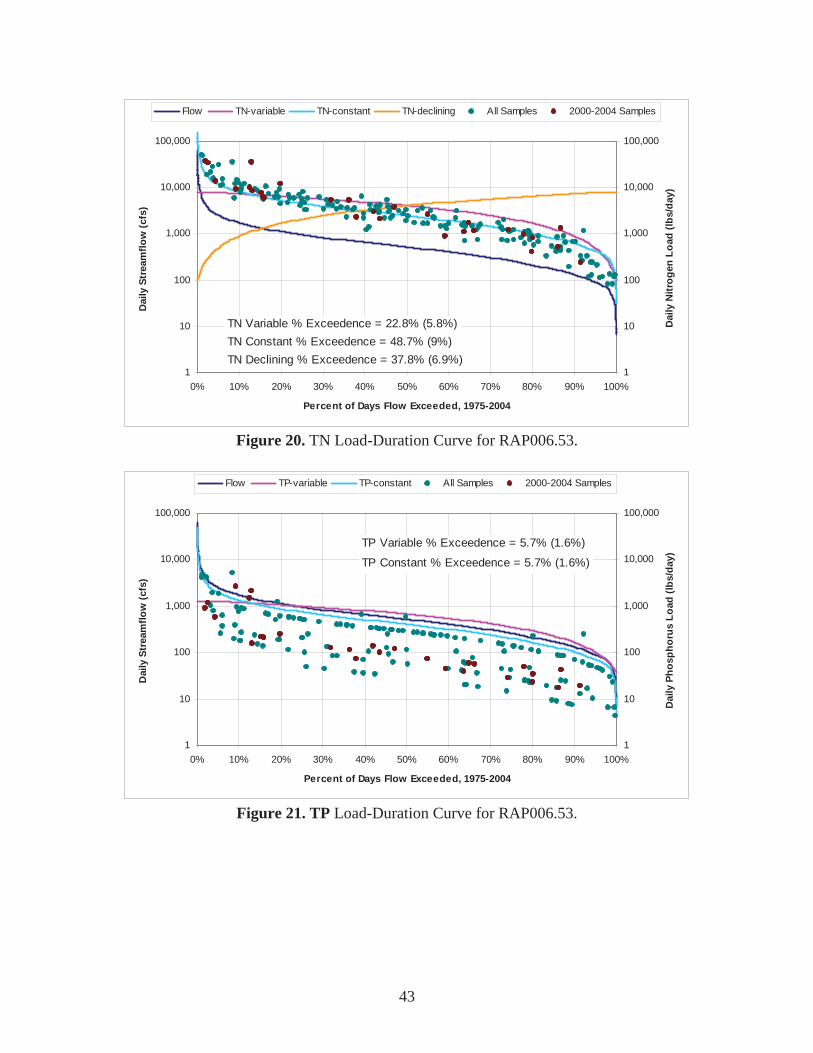
43
1
10
100
1,000
10,000
100,000
0% 10% 20% 30% 40% 50% 60% 70% 80% 90% 100%
Percent of Days Flow Exceeded, 1975-2004
Dai
ly S
trea
mflo
w (c
fs)
1
10
100
1,000
10,000
100,000
Dai
ly N
itrog
en L
oad
(lbs/
day)
Flow TN-variable TN-constant TN-declining All Samples 2000-2004 Samples
TN Variable % Exceedence = 22.8% (5.8%)TN Constant % Exceedence = 48.7% (9%)TN Declining % Exceedence = 37.8% (6.9%)
Figure 20. TN Load-Duration Curve for RAP006.53.
1
10
100
1,000
10,000
100,000
0% 10% 20% 30% 40% 50% 60% 70% 80% 90% 100%
Percent of Days Flow Exceeded, 1975-2004
Dai
ly S
trea
mflo
w (c
fs)
1
10
100
1,000
10,000
100,000
Dai
ly P
hosp
horu
s Lo
ad (l
bs/d
ay)
Flow TP-variable TP-constant All Samples 2000-2004 Samples
TP Variable % Exceedence = 5.7% (1.6%)
TP Constant % Exceedence = 5.7% (1.6%)
Figure 21. TP Load-Duration Curve for RAP006.53.
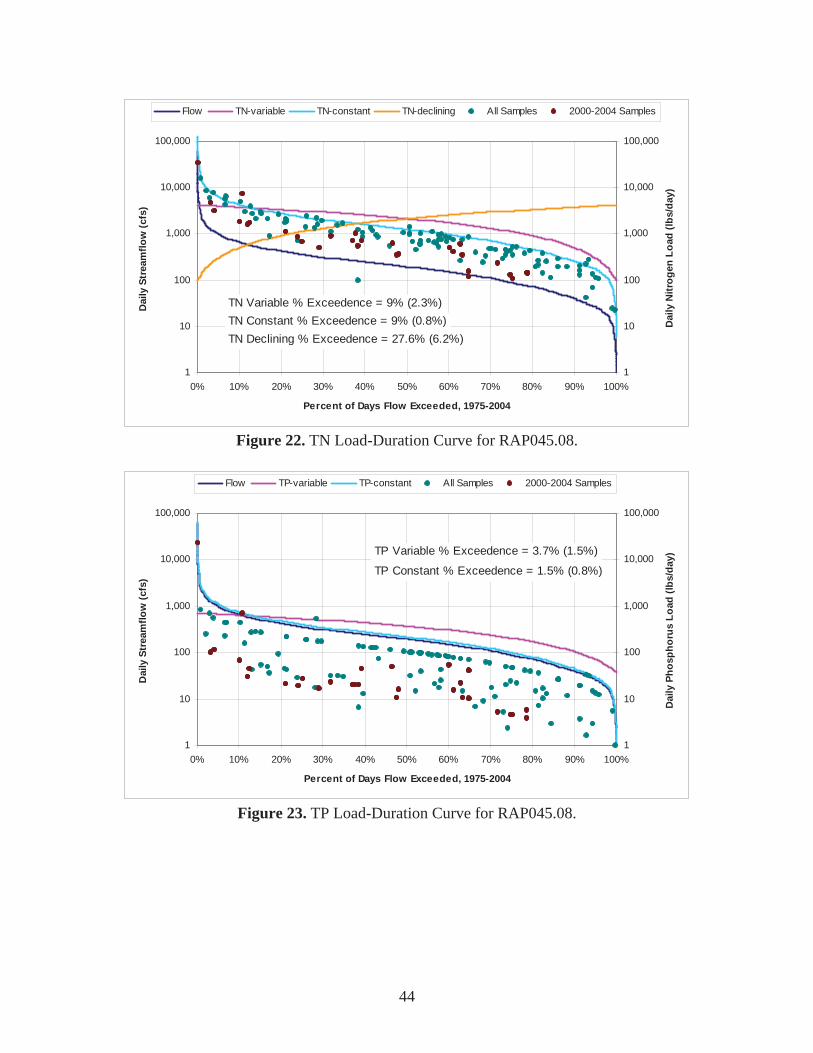
44
1
10
100
1,000
10,000
100,000
0% 10% 20% 30% 40% 50% 60% 70% 80% 90% 100%
Percent of Days Flow Exceeded, 1975-2004
Dai
ly S
trea
mflo
w (c
fs)
1
10
100
1,000
10,000
100,000
Dai
ly N
itrog
en L
oad
(lbs/
day)
Flow TN-variable TN-constant TN-declining All Samples 2000-2004 Samples
TN Variable % Exceedence = 9% (2.3%)TN Constant % Exceedence = 9% (0.8%)TN Declining % Exceedence = 27.6% (6.2%)
Figure 22. TN Load-Duration Curve for RAP045.08.
1
10
100
1,000
10,000
100,000
0% 10% 20% 30% 40% 50% 60% 70% 80% 90% 100%
Percent of Days Flow Exceeded, 1975-2004
Dai
ly S
trea
mflo
w (c
fs)
1
10
100
1,000
10,000
100,000
Dai
ly P
hosp
horu
s Lo
ad (l
bs/d
ay)
Flow TP-variable TP-constant All Samples 2000-2004 Samples
TP Variable % Exceedence = 3.7% (1.5%)
TP Constant % Exceedence = 1.5% (0.8%)
Figure 23. TP Load-Duration Curve for RAP045.08.
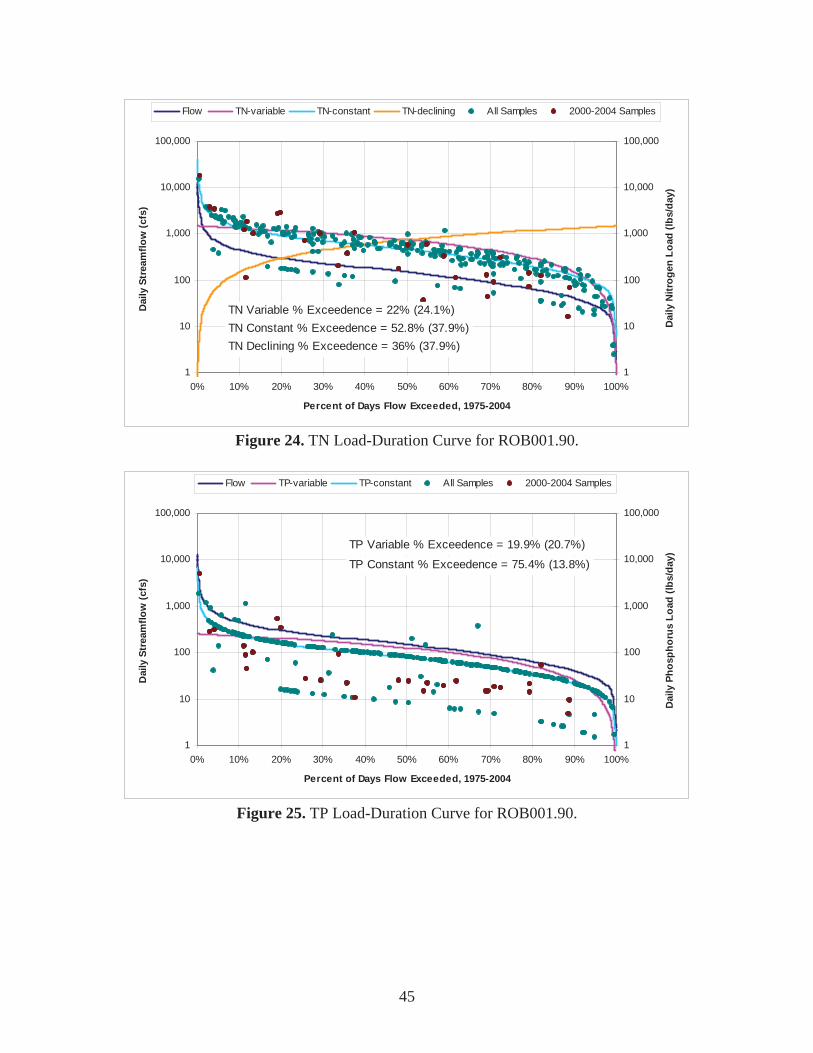
45
1
10
100
1,000
10,000
100,000
0% 10% 20% 30% 40% 50% 60% 70% 80% 90% 100%
Percent of Days Flow Exceeded, 1975-2004
Dai
ly S
trea
mflo
w (c
fs)
1
10
100
1,000
10,000
100,000
Dai
ly N
itrog
en L
oad
(lbs/
day)
Flow TN-variable TN-constant TN-declining All Samples 2000-2004 Samples
TN Variable % Exceedence = 22% (24.1%)TN Constant % Exceedence = 52.8% (37.9%)TN Declining % Exceedence = 36% (37.9%)
Figure 24. TN Load-Duration Curve for ROB001.90.
1
10
100
1,000
10,000
100,000
0% 10% 20% 30% 40% 50% 60% 70% 80% 90% 100%
Percent of Days Flow Exceeded, 1975-2004
Dai
ly S
trea
mflo
w (c
fs)
1
10
100
1,000
10,000
100,000
Dai
ly P
hosp
horu
s Lo
ad (l
bs/d
ay)
Flow TP-variable TP-constant All Samples 2000-2004 Samples
TP Variable % Exceedence = 19.9% (20.7%)
TP Constant % Exceedence = 75.4% (13.8%)
Figure 25. TP Load-Duration Curve for ROB001.90.
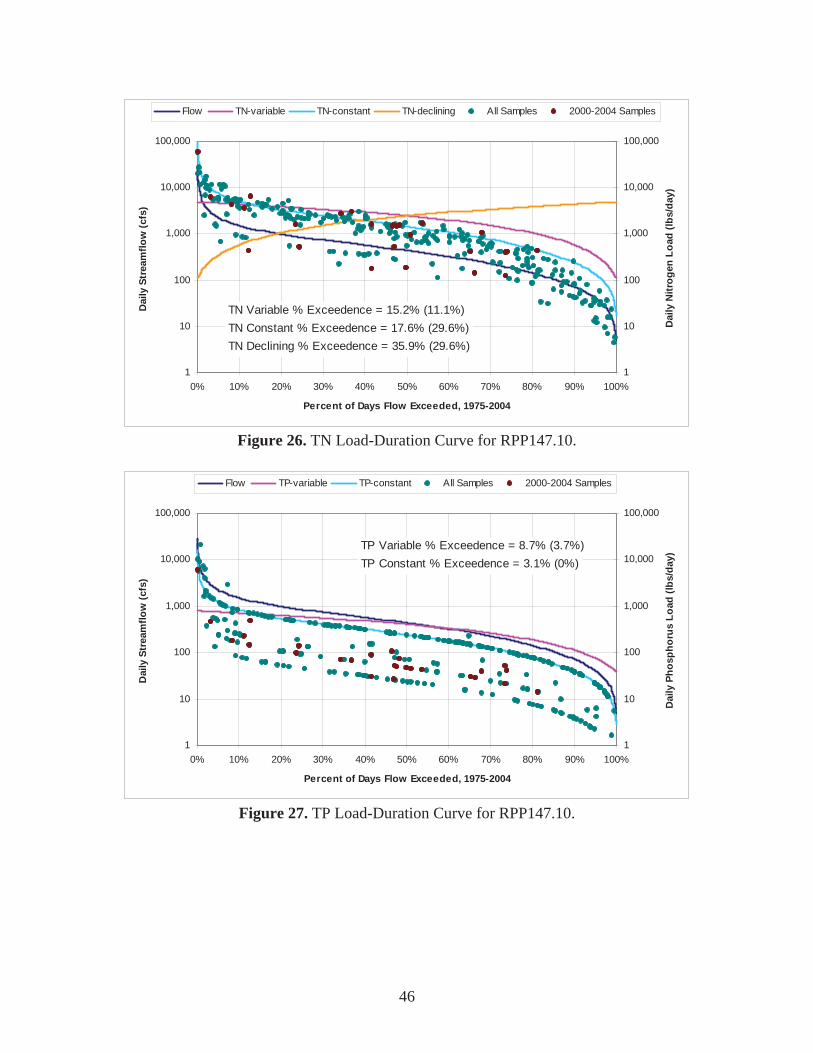
46
1
10
100
1,000
10,000
100,000
0% 10% 20% 30% 40% 50% 60% 70% 80% 90% 100%
Percent of Days Flow Exceeded, 1975-2004
Dai
ly S
trea
mflo
w (c
fs)
1
10
100
1,000
10,000
100,000
Dai
ly N
itrog
en L
oad
(lbs/
day)
Flow TN-variable TN-constant TN-declining All Samples 2000-2004 Samples
TN Variable % Exceedence = 15.2% (11.1%)TN Constant % Exceedence = 17.6% (29.6%)TN Declining % Exceedence = 35.9% (29.6%)
Figure 26. TN Load-Duration Curve for RPP147.10.
1
10
100
1,000
10,000
100,000
0% 10% 20% 30% 40% 50% 60% 70% 80% 90% 100%
Percent of Days Flow Exceeded, 1975-2004
Dai
ly S
trea
mflo
w (c
fs)
1
10
100
1,000
10,000
100,000
Dai
ly P
hosp
horu
s Lo
ad (l
bs/d
ay)
Flow TP-variable TP-constant All Samples 2000-2004 Samples
TP Variable % Exceedence = 8.7% (3.7%)TP Constant % Exceedence = 3.1% (0%)
Figure 27. TP Load-Duration Curve for RPP147.10.
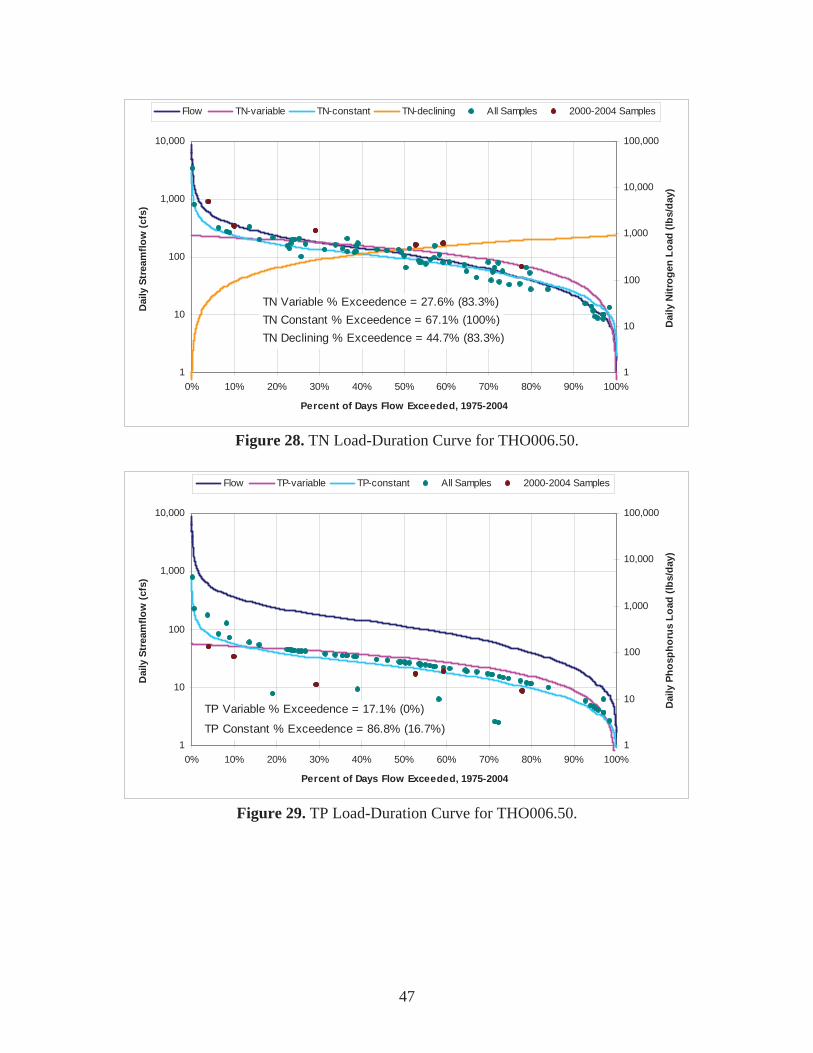
47
1
10
100
1,000
10,000
0% 10% 20% 30% 40% 50% 60% 70% 80% 90% 100%
Percent of Days Flow Exceeded, 1975-2004
Dai
ly S
trea
mflo
w (c
fs)
1
10
100
1,000
10,000
100,000
Dai
ly N
itrog
en L
oad
(lbs/
day)
Flow TN-variable TN-constant TN-declining All Samples 2000-2004 Samples
TN Variable % Exceedence = 27.6% (83.3%)TN Constant % Exceedence = 67.1% (100%)TN Declining % Exceedence = 44.7% (83.3%)
Figure 28. TN Load-Duration Curve for THO006.50.
1
10
100
1,000
10,000
0% 10% 20% 30% 40% 50% 60% 70% 80% 90% 100%
Percent of Days Flow Exceeded, 1975-2004
Dai
ly S
trea
mflo
w (c
fs)
1
10
100
1,000
10,000
100,000
Dai
ly P
hosp
horu
s Lo
ad (l
bs/d
ay)
Flow TP-variable TP-constant All Samples 2000-2004 Samples
TP Variable % Exceedence = 17.1% (0%)
TP Constant % Exceedence = 86.8% (16.7%)
Figure 29. TP Load-Duration Curve for THO006.50.

48
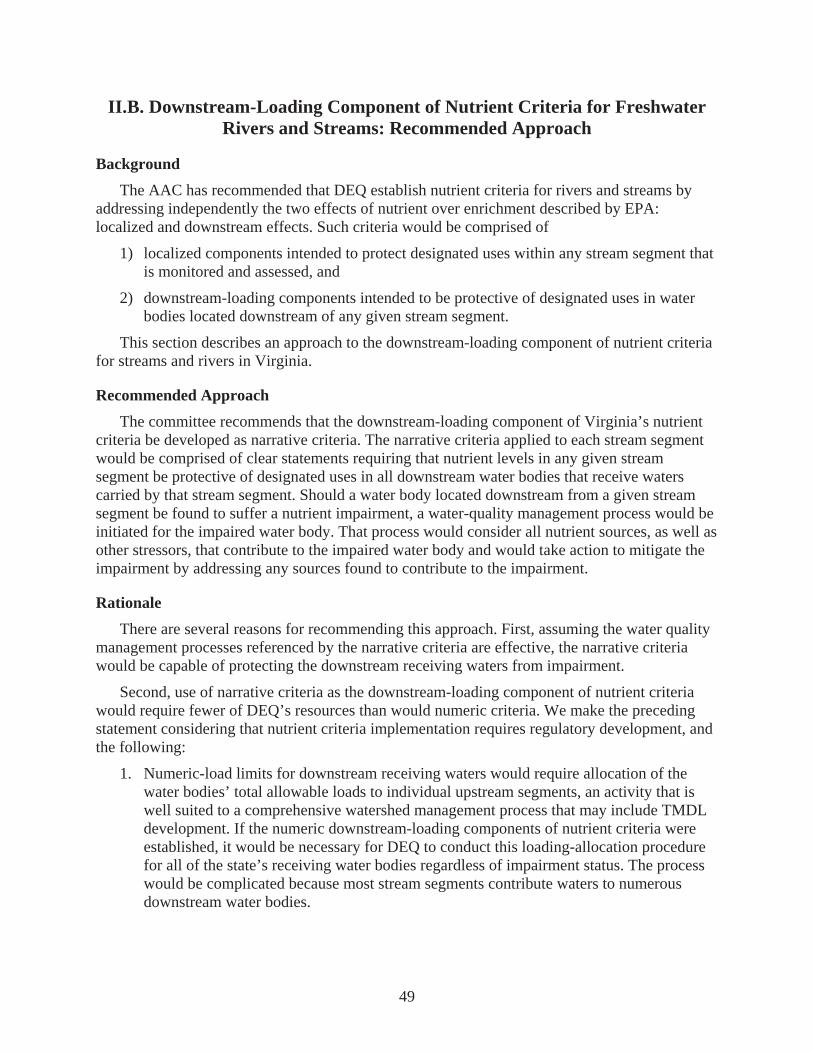
49
II.B. Downstream-Loading Component of Nutrient Criteria for Freshwater Rivers and Streams: Recommended Approach
BackgroundThe AAC has recommended that DEQ establish nutrient criteria for rivers and streams by
addressing independently the two effects of nutrient over enrichment described by EPA: localized and downstream effects. Such criteria would be comprised of
1) localized components intended to protect designated uses within any stream segment that is monitored and assessed, and
2) downstream-loading components intended to be protective of designated uses in water bodies located downstream of any given stream segment.
This section describes an approach to the downstream-loading component of nutrient criteria for streams and rivers in Virginia.
Recommended Approach The committee recommends that the downstream-loading component of Virginia’s nutrient
criteria be developed as narrative criteria. The narrative criteria applied to each stream segment would be comprised of clear statements requiring that nutrient levels in any given stream segment be protective of designated uses in all downstream water bodies that receive waters carried by that stream segment. Should a water body located downstream from a given stream segment be found to suffer a nutrient impairment, a water-quality management process would be initiated for the impaired water body. That process would consider all nutrient sources, as well as other stressors, that contribute to the impaired water body and would take action to mitigate the impairment by addressing any sources found to contribute to the impairment.
Rationale There are several reasons for recommending this approach. First, assuming the water quality
management processes referenced by the narrative criteria are effective, the narrative criteria would be capable of protecting the downstream receiving waters from impairment.
Second, use of narrative criteria as the downstream-loading component of nutrient criteria would require fewer of DEQ’s resources than would numeric criteria. We make the preceding statement considering that nutrient criteria implementation requires regulatory development, and the following:
1. Numeric-load limits for downstream receiving waters would require allocation of the water bodies’ total allowable loads to individual upstream segments, an activity that is well suited to a comprehensive watershed management process that may include TMDL development. If the numeric downstream-loading components of nutrient criteria were established, it would be necessary for DEQ to conduct this loading-allocation procedure for all of the state’s receiving water bodies regardless of impairment status. The process would be complicated because most stream segments contribute waters to numerous downstream water bodies.
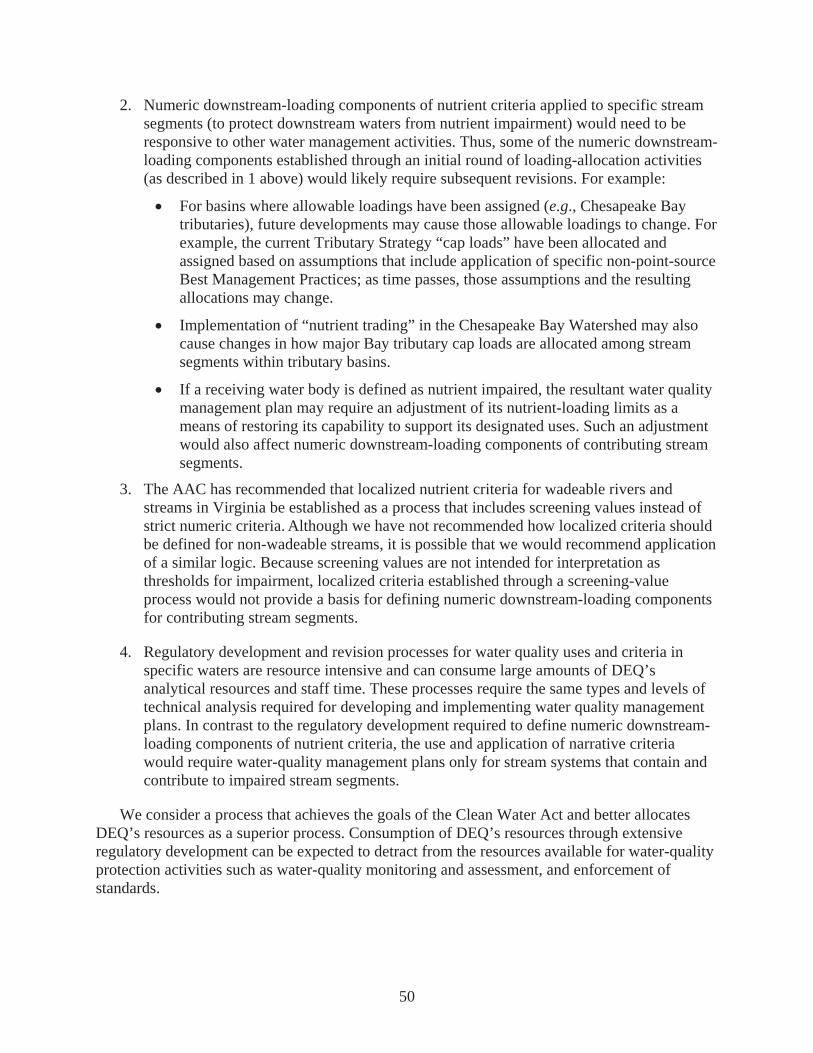
50
2. Numeric downstream-loading components of nutrient criteria applied to specific stream segments (to protect downstream waters from nutrient impairment) would need to be responsive to other water management activities. Thus, some of the numeric downstream-loading components established through an initial round of loading-allocation activities (as described in 1 above) would likely require subsequent revisions. For example:
For basins where allowable loadings have been assigned (e.g., Chesapeake Bay tributaries), future developments may cause those allowable loadings to change. For example, the current Tributary Strategy “cap loads” have been allocated and assigned based on assumptions that include application of specific non-point-source Best Management Practices; as time passes, those assumptions and the resulting allocations may change.
Implementation of “nutrient trading” in the Chesapeake Bay Watershed may also cause changes in how major Bay tributary cap loads are allocated among stream segments within tributary basins.
If a receiving water body is defined as nutrient impaired, the resultant water quality management plan may require an adjustment of its nutrient-loading limits as a means of restoring its capability to support its designated uses. Such an adjustment would also affect numeric downstream-loading components of contributing stream segments.
3. The AAC has recommended that localized nutrient criteria for wadeable rivers and streams in Virginia be established as a process that includes screening values instead of strict numeric criteria. Although we have not recommended how localized criteria should be defined for non-wadeable streams, it is possible that we would recommend application of a similar logic. Because screening values are not intended for interpretation as thresholds for impairment, localized criteria established through a screening-value process would not provide a basis for defining numeric downstream-loading components for contributing stream segments.
4. Regulatory development and revision processes for water quality uses and criteria in specific waters are resource intensive and can consume large amounts of DEQ’s analytical resources and staff time. These processes require the same types and levels of technical analysis required for developing and implementing water quality management plans. In contrast to the regulatory development required to define numeric downstream-loading components of nutrient criteria, the use and application of narrative criteria would require water-quality management plans only for stream systems that contain and contribute to impaired stream segments.
We consider a process that achieves the goals of the Clean Water Act and better allocates DEQ’s resources as a superior process. Consumption of DEQ’s resources through extensive regulatory development can be expected to detract from the resources available for water-quality protection activities such as water-quality monitoring and assessment, and enforcement of standards.
51
Conditions and Caveats We make the recommendation for a narrative downstream-loading component of nutrient
criteria with several conditions and caveats. As stated above, it is intended for application within a context that also includes:
1. localized criteria that have numeric components and clearly defined impairment-designation processes, and
2. water-quality management processes (including TMDLs) that are effective in addressing and mitigating impairments.
We suggest that DEQ accept the recommendation only if DEQ is also willing to accept a logical consequence: implementation of the downstream-loading component as narrative criteria, as suggested above, would likely affect Virginia’s TMDL process. We make this statement considering that almost all nutrient problems occur due to nutrient contributions from both localized and upstream nutrient sources, and that the most nutrient-sensitive regions of many surface water systems are often the furthest downstream.
An inherent assumption of this recommendation is that the water-quality management process referenced by the narrative criteria would be effective. The effects of elevated nutrient concentrations in individual water bodies are responsive to water-body characteristics and therefore highly variable among water bodies and difficult to predict. We believe that an effective way to enact narrative criteria would be to link them with a flexible and responsive water-quality management framework, such as the adaptive TMDL implementation framework that was recently endorsed by the U.S. EPA.1 An adaptive implementation approach utilizes new information made available from monitoring activities conducted after initial TMDL implementation to refine further water-quality management actions so as to achieve water-quality management goals. We cite adaptive implementation as an example of the flexible and responsive water-quality management process that we believe would complement a decision by DEQ to rely on a narrative mechanism to define the downstream-loading component of nutrient criteria. Furthermore, we believe that adaptive implementation would enhance the potential for a narrative criteria mechanism to be effective.
1. See: Memorandum, EPA Assessment and Watershed Protection Division to Regions I-X Water Division Directors.
“Clarification Regarding ‘Phased’ Total Maximum Daily Loads.” 2 August 2006.

52
53
References
AAC, Academic Advisory Committee to Virginia DEQ. 2006. Report of the Academic Advisory Committee to the Virginia Department of Environmental Quality: Freshwater Nutrient Criteria for Rivers and Streams. Special Report SR30-2006. Virginia Water Resources Research Center. Blacksburg, Va. http://www.deq.virginia.gov/wqs/documents/AAC2006River_StreamNutr_000.pdf (accessed January 3, 2007).
Burton, J, and J. Gerritson. 2003. A Stream Condition Index for Virginia Non-Coastal Streams. September 2003. Tetra Tech. Owings Mills, Md. http://www.deq.virginia.gov/watermonitoring/pdf/vastrmcon.pdf (accessed January 3, 2007).
Clark, G.M., D. Mueller, and M. Mast. 2000. Nutrient concentrations and yields in undeveloped stream basins of the United States. Journal of the American Water Resource Association 36(4):849-860 (with supporting data supplement).
DEQ, Virginia Department of Environmental Quality. 2005. Freshwater Nutrient Criteria – Analysis of Downstream Loading Effects.
DEQ, Virginia Department of Environmental Quality. 2006a. DEQ Search for Approved TMDLs. http://gisweb.deq.virginia.gov/tmdlapp/tmdl_report_search.cfm (accessed January 3, 2007).
DEQ, Virginia Department of Environmental Quality. 2006b. Using Probabilistic Monitoring Data to Validate the Non-Coastal Virginia Stream Condition Index (Draft). VDEQ Technical Bulletin WQA/2006-001. January 2006. Water Quality Monitoring, Biological Monitoring and Water Quality Assessment Programs, Virginia Department of Environmental Quality. Richmond, Va. http://www.deq.virginia.gov/probmon/pdf/scival.pdf (accessed January 3, 2007).
Hornberger, G.M., M.G. Kelly, and B.J. Cosby. 1977. Evaluating eutrophication potential from river community productivity. Water Research 11(1):65-69.
IEN, Institute for Environmental Negotiation. 1987. Nutrient Standards Control Workshop, May 14-15, 1987, Williamsburg, Virginia, Summary Report. Institute for Environmental Negotiation, Division of Urban & Environmental Planning, University of Virginia. Charlottesville, Va. http://www.deq.virginia.gov/wqs/pdf/appE.pdf (accessed January 3, 2007).
Lemly, A.D. 2000. Using bacterial growth on insects to assess nutrient impacts in streams. Environmental Monitoring and Assessment 63:431-446.
Lemly, A.D. and R.S. King. 2000. An insect-bacteria bioindicator for assessing detrimental nutrient enrichment in wetlands. Wetlands 20(1):91-100.
Ponader, K., C. Flinders, and D. Charles. 2005. The Development of Algae-based Water Quality Monitoring Tools for Virginia Streams. Report No. 05-09 for the West Central Regional Office, Virginia Department of Environmental Quality. Patrick Center for Environmental Research, The Academy of Natural Sciences. Philadelphia, Pa.
54
Robertson, D.M., D.A. Saad, A.M. Wieben, U.S. Environmental Protection Agency Region V, U.S. Environmental Protection Agency Region VII, and U.S. Geological Survey. 2001. An Alternative Regionalization Scheme for Defining Nutrient Criteria for Rivers and Streams. U.S. Geological Survey Water-Resources Investigations Report 01-4073. Middleton, Wis. 57 pp. http://wi.water.usgs.gov/pubs/wrir-01-4073/wrir-01-4073.pdf (accessed January 3, 2007).
Smith, R.A., R.B. Alexander, and G.E. Schwarz. 2003. Natural background concentrations of nutrients in streams and rivers of the conterminous United States. Environmental Science & Technology 37:2029-2047.
Stevenson, R.J., S.T. Rier, C.M. Riseng, R. E. Schultz, and M. J. Wiley. 2006. Comparing effects of nutrients on algal biomass in streams in two regions with different disturbance regimes and with applications for developing nutrient criteria. Hydrobiologia 561:149–165.
U.S. EPA (U.S. Environmental Protection Agency). 2000a. Ambient Water Quality Criteria Recommendations: Information Supporting The Development Of State And Tribal Nutrient Criteria For Rivers And Streams In Nutrient Ecoregion XI. EPA 822-B-00-020. Office of Water—Office of Science and Technology Health and Ecological Criteria Division, United States Environmental Protection Agency. Washington, D.C. 94 pp. http://www.epa.gov/waterscience/criteria/nutrient/ecoregions/rivers/index.html (accessed January 3, 2007).
U.S. EPA, U.S. Environmental Protection Agency. 2000b. Ambient Water Quality Criteria Recommendations: Information Supporting The Development Of State And Tribal Nutrient Criteria For Rivers And Streams In Nutrient Ecoregion IX. EPA 822-B-00-019. Office of Water—Office of Science and Technology Health and Ecological Criteria Division, United States Environmental Protection Agency. Washington, D.C. 103 pp. http://www.epa.gov/waterscience/criteria/nutrient/ecoregions/rivers/index.html (accessed January 3, 2007).
U.S. EPA, U.S. Environmental Protection Agency. 2000c. Ambient Water Quality Criteria Recommendations: Information Supporting The Development Of State And Tribal Nutrient Criteria For Rivers And Streams In Nutrient Ecoregion XIV. EPA 822-B-00-022. Office of Water—Office of Science and Technology Health and Ecological Criteria Division, United States Environmental Protection Agency. Washington, D.C. 79 pp. http://www.epa.gov/waterscience/criteria/nutrient/ecoregions/rivers/index.html (accessed January 3, 2007).
Walker, J., C. Zipper, L. Shabman, T. Younos. 2006. A Literature Review for Use in Nutrient Criteria Development for Freshwater Streams and Rivers in Virginia. Special Report SR28-2006. Virginia Water Resources Research Center. Blacksburg, Va. 101 pages. http://www.deq.virginia.gov/wqs/documents/LIT_REVU_STRMS.pdf (accessed January 3, 2007).