Embed Size (px)
Citation preview
L.S.U. Earth Resources ReportAOP No. 3December, 1973
(wASA-CR-136676) A STUDY OF SEDIBENT 974-160 56TRANSPORT AND EROSION IN THE FOURCHONWBEA OF SOUTH LOUISIANA (Louisiana StateUniv.)- 30 p HC $3.50 CSCL 08H Unclas
G3/13 28338
A Study of
Sediment Transport and Erosion in
the Fourchon Area of South Louisiana
Division of Engineering ResearchLouisiana State UniversityBaton Rouge, Louisiana 70803
https://ntrs.nasa.gov/search.jsp?R=19740007943 2018-08-21T02:03:07+00:00Z
AOP EARTH RESOURCES REPORTS
The "ACTION ORIENTED PROJECT" Series has been es-
tablished under the NASA Office of University of Affairs
Grant 19-001-105 to Louisiana State University.
This project series was established to facilitate
further development and application of Earth Resources
Technology. Technology transfer is encouraged and no pro-
ject is initiated without the cooperation and endorsement
of an interested state, local or even private agency.
Projects are restricted to the geographical region of South
Louisiana.
Each report in this series describes action taken
to solve a particular problem, or to understand natural
phenomena affecting the solution of a problem. Recom-
mendations are offered to the interested agency. Remedial
action and/or the adoption of techniques used are en-couragea.
217
A STUDY OF
SEDIMENT TRANSPORT AND EROSION IN
THE FOURCHON AREA OF SOUTH LOUISIANA
BY
R. P. Self
Earth Sciences DepartmentNicholls State University
/
TABLE OF CONTENTS
INTRODUCTION. . .... . . . . . . . . . . . . . . . . . .1
PURPOSE. . .. .. .... ...... . . . . . ........ . .. 4
Techniques ....... ... ...... ... .... 4
Results--Fourchon ................... . 4
SUMMARY AND CONCLUSIONS . . . ... .. . ... . . . . . 23
RECOMMENDATIONS ............... ....... . 26
REFERENCES.......... ............. .27
//
A STUDY OF SEDIMENT TRANSPORT AND EROSION INTHE FOURCHON AREA OF SOUTH LOUISIANA
R. P. SELF
SYNOPSIS
NASA aerial photography in the form of color infrared andcolor positive transparencies is used as an aid in evaluating therate and effect of erosion and sediment transports in Bay ChampagneLouisiana.
1. Introduction
During the summer of 1972, studies of the marshlands of South
Louisiana were initiated, using airborne infrared and multispectral
imagery. This study, under the sponsorship of the National Aeronautics
and Space Administration is a joint effort of the Division of Engineering
Research, Louisiana State University, and Nicholls State University.
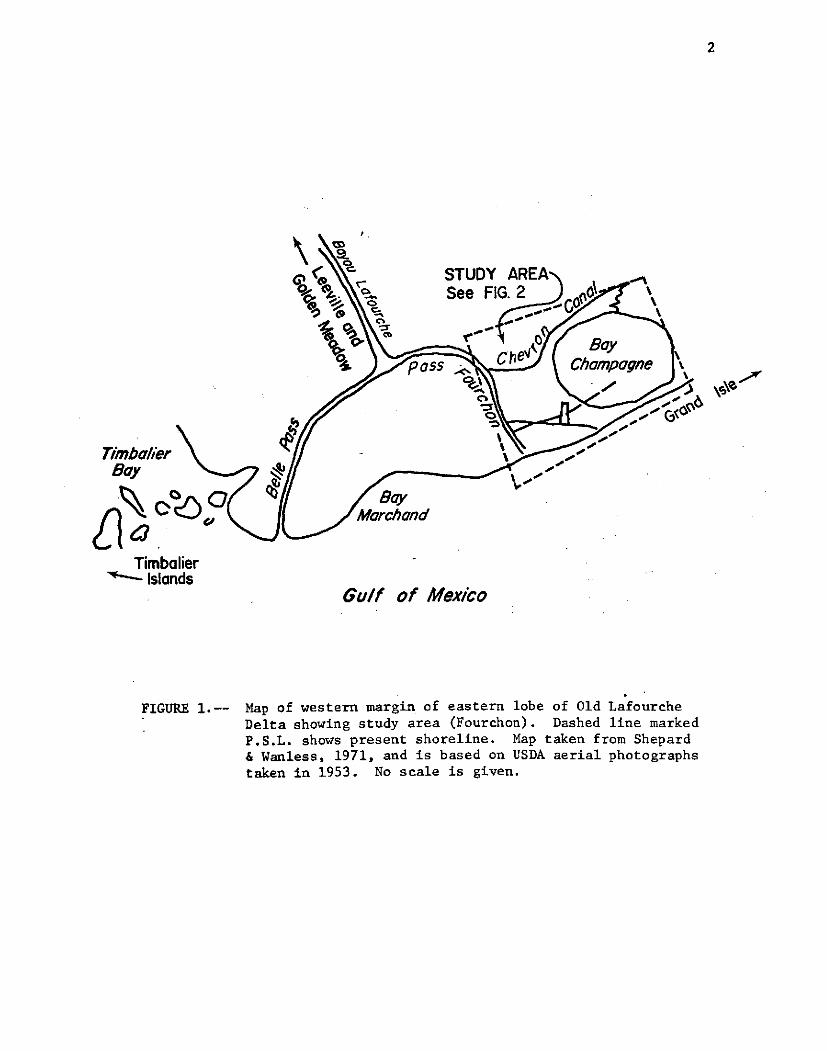
During 1973, work continued in the Fourchon area, between Leeville
and Grand Isle, (Figure 1) in Lafourche Parish, Louisiana, and was ex-
tended to the brackish marsh in the Pointe au Chien area, south of Houma
in Terrabonne Parish.
This report deals only with that portion of the study related to
the Fourchon-Belle Pass area. The results from other study areas will
be submitted in a later report.
The Fourchon study area is bound by the Gulf of Mexico on the
south, Lake Champagne on the east, Pass Fourchon on the west and the canal
leading to Belle Pass on the north. It encompasses an area slightly
greater than one square mile and is typical of the coastal environment
of South Louisiana.
*Assistant Professor, Earth Sciences, Nicholls State University
1
2
STUDY AREAOR -, , See FIG. 2
% s,
By BayPass Champagne
TimbalierSIslands
Gulf of Mexico
FIGURE 1.-- Map of western margin of eastern lobe of Old LafourcheDelta showing study area (Fourchon). Dashed line markedP.S.L. shows present shoreline. Map taken from Shepard& Wanless, 1971, and is based on USDA aerial photographstaken in 1953. No scale is given.
0
S Bridge NSUMARINE ^
, AREA SHOWN
Boy Champogne
L C. Stone dam
Small Island
Long Island
Gulf of MexicoScale: 1/16" 100'
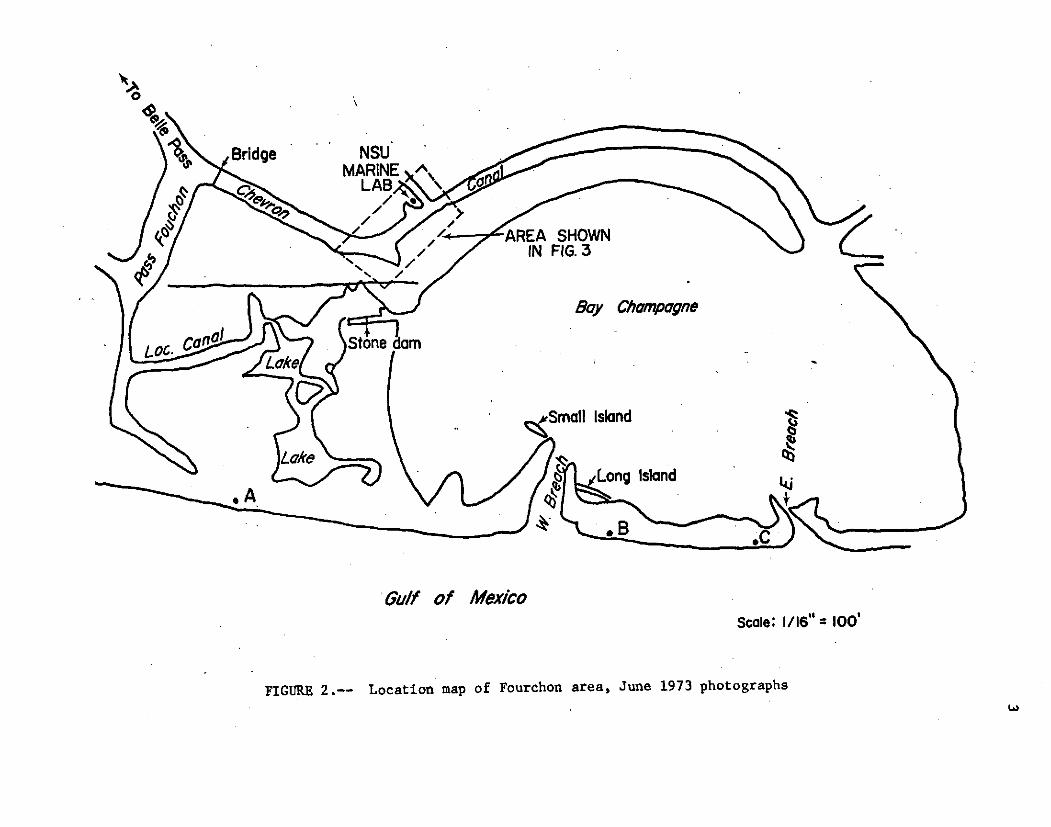
FIGURE 2.-- Location map of Fourchon area, June 1973 photographs
PURPbSE
The original purpose of the particular project was to define the
biological, geological and hydrological environments in the Bayou Lafourche
area of South Louisiana and to relate the ground truth data to data obtained
from remote sensors, notably color infrared, I2S and RS-18 imagery. The
research teams were to provide "ground truth" upon which the interpretation
of the imagery was based. A specific objective was to use remotely sensed
data in the planning activities of the local port and harbor commission and
to provide this commission with environmental protection recommendations.
The basic environments in the salt water marsh of the Fourchon area
and the fresh water marsh of the Lake Boeuf area (northeast of Raceland,
Lafourche Parish) were delineated in 1972 when the chemical composition and
texture of the surface sediments were determined. In 1973, Fourchon was
studied to see if any changes, especially erosion of beaches and canals
had occurred between the overflights of August, 1972, and May, 1973.
Techniques
The dimensions of several man-made objects which would remain con-
stant over a long period of time were measured in the Fourchon area. These
included the bridge across Chevron Canal (Figure 2) and a small stone dam
(Figure 2) which were used to scale the photographs. The original widths of
canals and beaches and erosion factors were measured from photographs from
the ERL, NASA Mississippi (Table I). In addition, profiles across Chevron
Canal and current velocities and directions were obtained and compared with
data from 1972. Photographs typical of the ones used are included in the
attached packet.
Results--Fourchon
There are four distinctive sedimentary environments in the study area:
(1) beach, (2) marsh,:(3) spoil banks, and (4) channels. These environments
are easily distinguished with I2S, infrared and normal aerial photography.
5
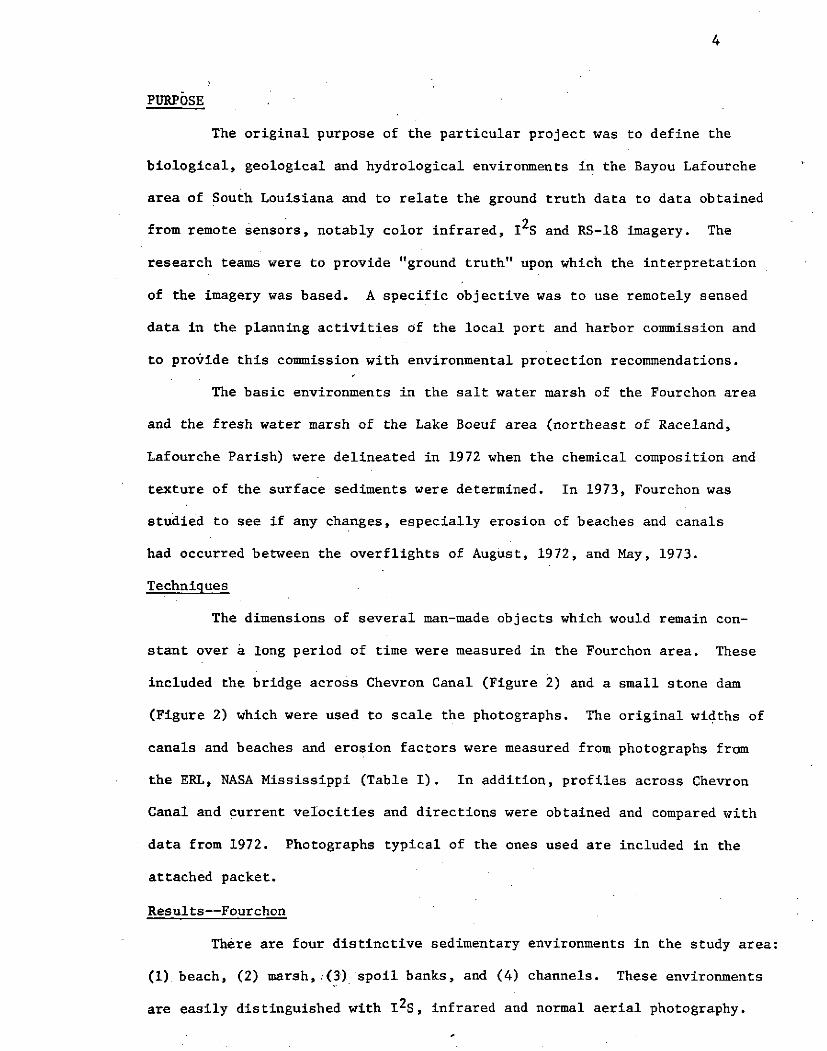
TABLE I
MEASUREMENTS FROM AERIAL PHOTOGRAPHS
Location Aug. 1973 May 1973
Width of Chevron Canal atWing Net 247.3 ft 244 ft
Width of Chevron Canal atLab 195.3 ft 195.6
Max. width of beach nearlake 400 397
From beach on bar to W.tip of ?? long I.S 759 over-rode by spit on
E. side of W. beach
From Beach on bar to E.end of long I.S. 505 423
Backside of bar to E.end of long I.S. 165 over-rode
From beach to E. tip ofsmall I.S. 1009 over-rode (see below)
Length of spit on W. sideof W. breach 1124
Length of E. side of breach - 645
Max. width of bar 354 40> (293 ft at 1972Max.)
(see next p.)
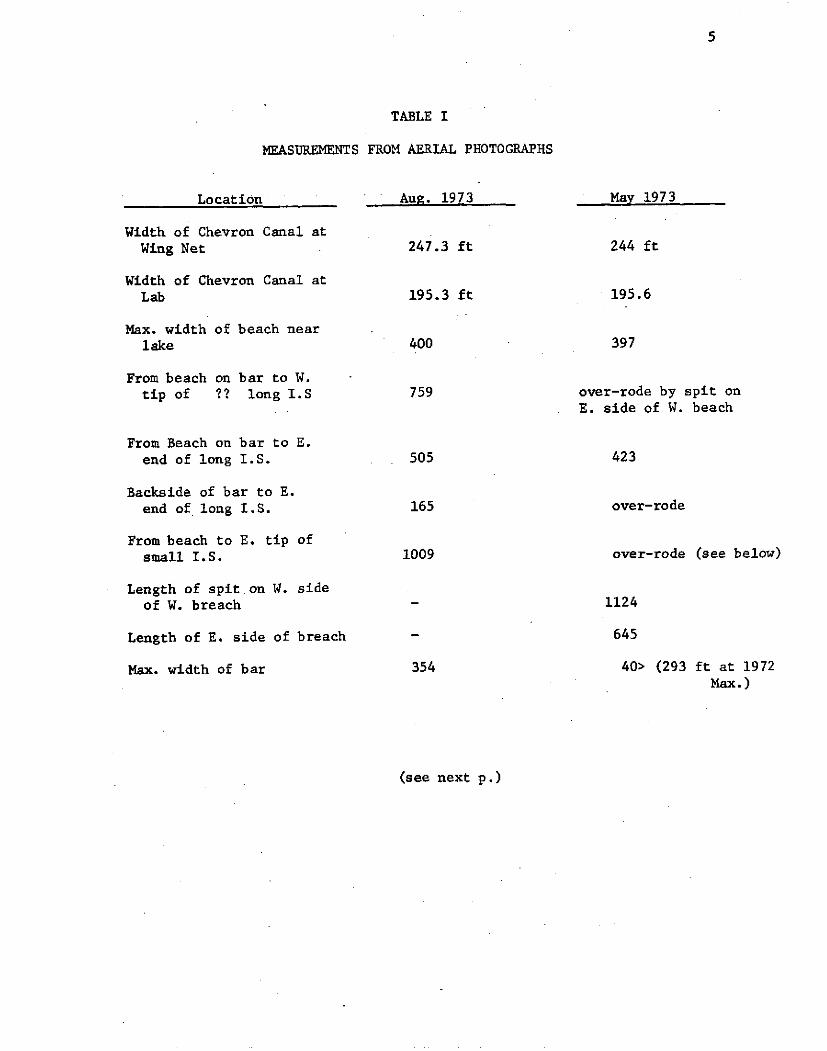
6
TABLE I CONTINUED
Location Aug. '72 May '73 June '73
Table I -- continued
Width of a breach -0- 456 ft 416 ft
Narrowest part of abreach -0- 260 182
Width of E. breach * -0- 157 112
Narrowest part of E.breach -0- 58 49
* Closed by newly constructed spoil bank (by dragline) Aug. 1973
(locations of all points mentioned above are shown in Fig. 2)
7
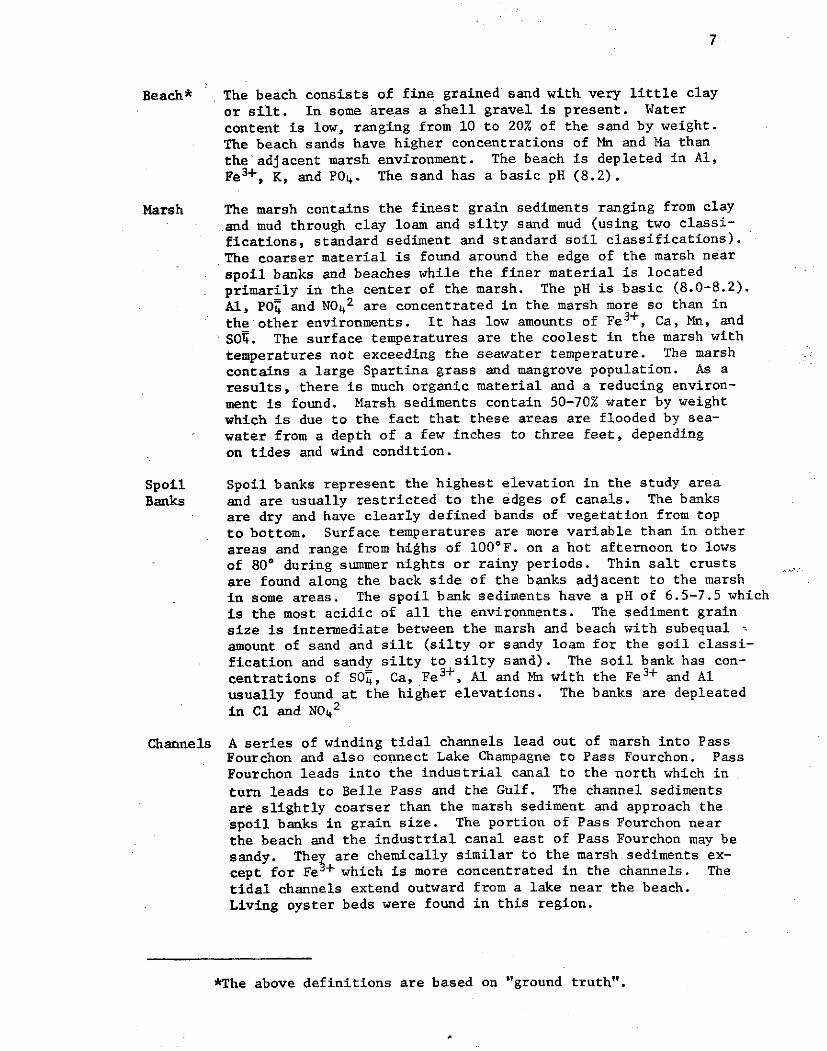
Beach* The beach consists of fine grained sand with very little clayor silt. In some areas a shell gravel is present. Watercontent is low, ranging from 10 to 20% of the sand by weight.The beach sands have higher concentrations of Mn and Ma thanthe adjacent marsh environment. The beach is depleted in Al,Fe3+, K, and PO4 . The sand has a basic pH (8.2).
Marsh The marsh contains the finest grain sediments ranging from clayand mud through clay loam and silty sand mud (using two classi-fications, standard sediment and standard soil classifications).The coarser material is found around the edge of the marsh near
spoil banks and beaches while the finer material is locatedprimarily in the center of the marsh. The pH is basic (8.0-8.2).Al, POI and N04 2 are concentrated in the marsh more so than inthe other environments. It has low amounts of Fe3+, Ca, Mn, andSO . The surface temperatures are the coolest in the marsh with
temperatures not exceeding the seawater temperature. The marshcontains a large Spartina grass and mangrove population. As aresults, there is much organic material and a reducing environ-ment is found. Marsh sediments contain 50-70% water by weightwhich is due to the fact that these areas are flooded by sea-water from a depth of a few inches to three feet, dependingon tides and wind condition.
Spoil Spoil banks represent the highest elevation in the study areaBanks and are usually restricted to the edges of canals. The banks
are dry and have clearly defined bands of vegetation from topto bottom. Surface temperatures are more variable than in otherareas and range from highs of 1000F. on a hot afternoon to lowsof 80* during summer nights or rainy periods. Thin salt crustsare found along the back side of the banks adjacent to the marshin some areas. The spoil bank sediments have a pH of 6.5-7.5 whichis the most acidic of all the environments. The sediment grainsize is intermediate between the marsh and beach with subequalamount of sand and silt (silty or sandy loam for the soil classi-fication and sandy silty to silty sand). The soil bank has con-centrations of SO, Ca, Fe3+, Al and Mn with the Fe3+ and Alusually found at the higher elevations. The banks are depleatedin C1 and N04
2
Channels A series of winding tidal channels lead out of marsh into PassFourchon and also connect Lake Champagne to Pass Fourchon. PassFourchon leads into the industrial canal to the north which in
turn leads to Belle Pass and the Gulf. The channel sedimentsare slightly coarser than the marsh sediment and approach the
spoil banks in grain size. The portion of Pass Fourchon nearthe beach and the industrial canal east of Pass Fourchon may besandy. They are chemically similar to the marsh sediments ex-cept for Fe + which is more concentrated in the channels. Thetidal channels extend outward from a lake near the beach.Living oyster beds were found in this region.
*The above definitions are based on "ground truth".
8
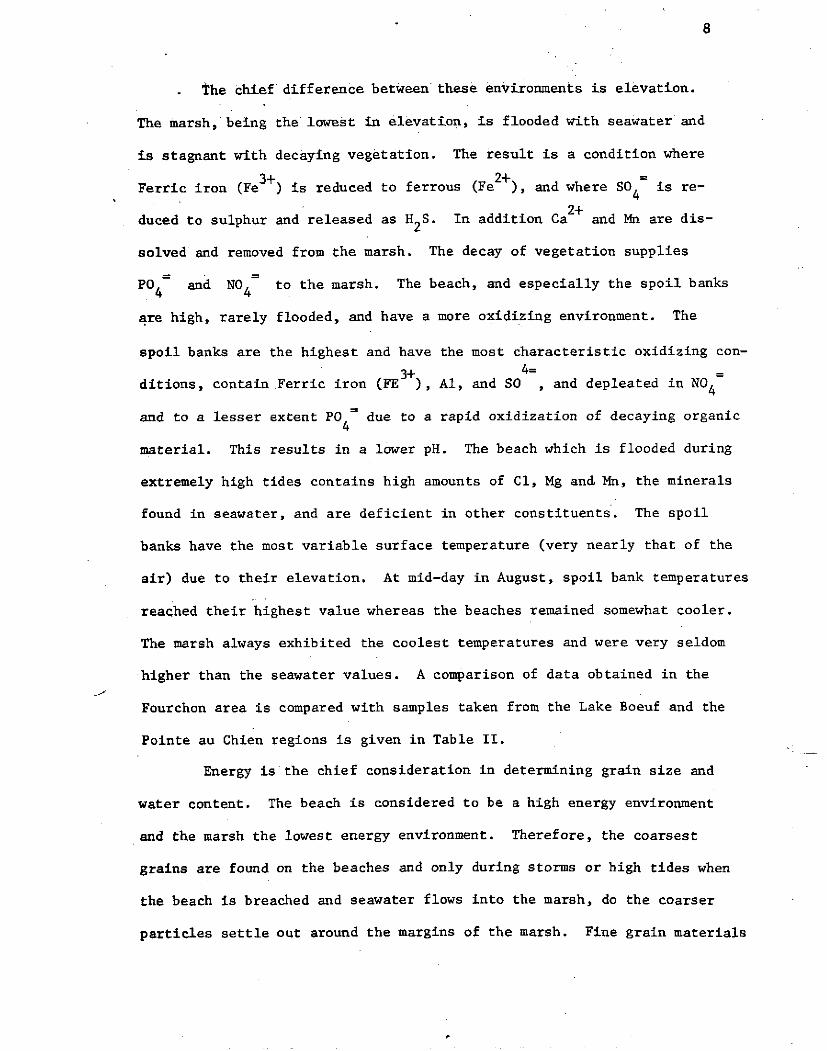
The chief difference between these environments is elevation.
The marsh, being the lowest in elevation, is flooded with seawater and
is stagnant with decaying vegetation. The result is a condition where
3+ 2+Ferric iron (Fe ) is reduced to ferrous (Fe ), and where SO is re-
duced to sulphur and released as H2S. In addition Ca2+ and Mn are dis-
solved and removed from the marsh. The decay of vegetation supplies
PO4 and NO4 to the marsh. The beach, and especially the spoil banks
are high, rarely flooded, and have a more oxidizing environment. The
spoil banks are the highest and have the most characteristic oxidizing con-
3+4=ditions, contain Ferric iron (FE ), Al, and SO , and depleated in NO4
and to a lesser extent PO due to a rapid oxidization of decaying organic
material. This results in a lower pH. The beach which is flooded during
extremely high tides contains high amounts of Cl, Mg and Mn, the minerals
found in seawater, and are deficient in other constituents. The spoil
banks have the most variable surface temperature (very nearly that of the
air) due to their elevation. At mid-day in August, spoil bank temperatures
reached their highest value whereas the beaches remained somewhat cooler.
The marsh always exhibited the coolest temperatures and were very seldom
higher than the seawater values. A comparison of data obtained in the
Fourchon area is compared with samples taken from the Lake Boeuf and the
Pointe au Chien regions is given in Table II.
Energy is the chief consideration in determining grain size and
water content. The beach is considered to be a high energy environment
and the marsh the lowest energy environment. Therefore, the coarsest
grains are found on the beaches and only during storms or high tides when
the beach is breached and seawater flows into the marsh, do the coarser
particles settle out around the margins of the marsh. Fine grain materials
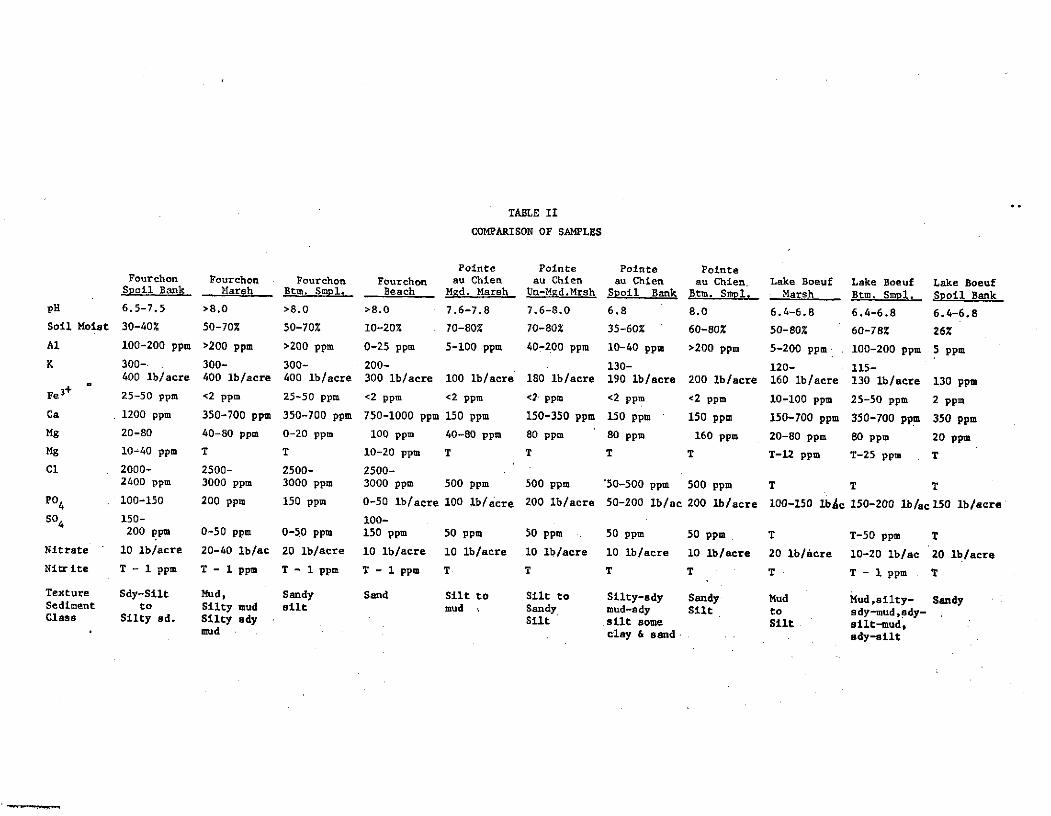
TABLE II
COMPARISON OF SAMPLES
Pointe Pointe Pointe PointeFourchon Fourchon Fourchon Fourchon au Chien au Chien au Chien au Chien. Lake Boeuf Lake Boeuf Lake Boeuf
Spoil Bank Marsh Btm. Smpl. Beach Mgd. Marsh Un-Mgd.Mrsh Spoil Bank Btm. Smpl, Marsh Btm. Smpl. Spoil BankpH 6.5-7.5 >8.0 >8.0 >8.0 7.6-7.8 7.6-8.0 6.8 8.0 6.4-6.8 6.4-6.8 6.4-6.8Soil Moist 30-40% 50-70% 50-70% 10-20% 70-80% 70-80% 35-60% 60-80% 50-80% 60-78% 26%Al 100-200 ppm >200 ppm >200 ppm 0-25 ppm 5-100 ppm 40-200 ppm 10-40 ppm >200 ppm 5-200 ppm-. 100-200 ppm 5 ppmK 300-. 300- 300- 200- 130- 120- 115-
400 lb/acre 400 lb/acre 400 lb/acre 300 lb/acre 100 lb/acre 180 lb/acre 190 lb/acre 200 lb/acre 160 lb/acre 130 lb/acre 130 ppmFe 3 25-50 ppm <2 ppm 25-50 ppm <2 ppm <2 ppm <2 ppm <2 ppm <2 ppm 10-100 ppm 25-50 ppm 2 ppmCa 1200 ppm 350-700 ppm 350-700 ppm 750-1000 ppm 150 ppm 150-350 ppm 150 ppm 150 ppm 150-700 ppm 350-700 ppm 350 ppmMg 20-80 40-80 ppm 0-20 ppm 100 ppm 40-80 ppm 80 ppm 80 ppm 160 ppm 20-80 ppm 80 ppm 20 ppmMg 10-40 ppm T T 10-20 ppm T T T T T-12 ppm T-25 ppm TCl 2000- 2500- 2500- 2500-
2400 ppm 3000 ppm 3000 ppm 3000 ppm 500 ppm 500 ppm '50-500 ppm 500 ppm T T TPO4 100-150 200 ppm 150 ppm 0-50 lb/acre 100 lb/acre 200 lb/acre 50-200 lb/ac 200 lb/acre 100-150 IbAc 150-200 lb/acl50 b/acreS04 150- 100-
200 ppm 0-50 ppm 0-50 ppm 150 ppm 50 ppm 50 ppm 50 ppm 50 ppm T T-50 ppm TNitrate 10 lb/acre 20-40 lb/ac 20 lb/acre 10 lb/acre 10 lb/acre 10 lb/acre 10 lb/acre 10 lb/acre 20 lb/acre 10-20 lb/ac 20 lb/acreNitrite T - 1 ppm T - 1 ppm T - 1 ppm T - 1 ppm T T T T T T -l ppm T
Texture Sdy-Silt Mud, Sandy Sand Silt to Silt to Silty-ady Sandy Mud Mud,silty- SandySediment to Silty mud silt mud Sandy mud-sdy Silt to sdy-mud,sdy-Class Silty ad. Silty ady Silt silt some Silt silt-mud,mud clay & sand ady-silt
10
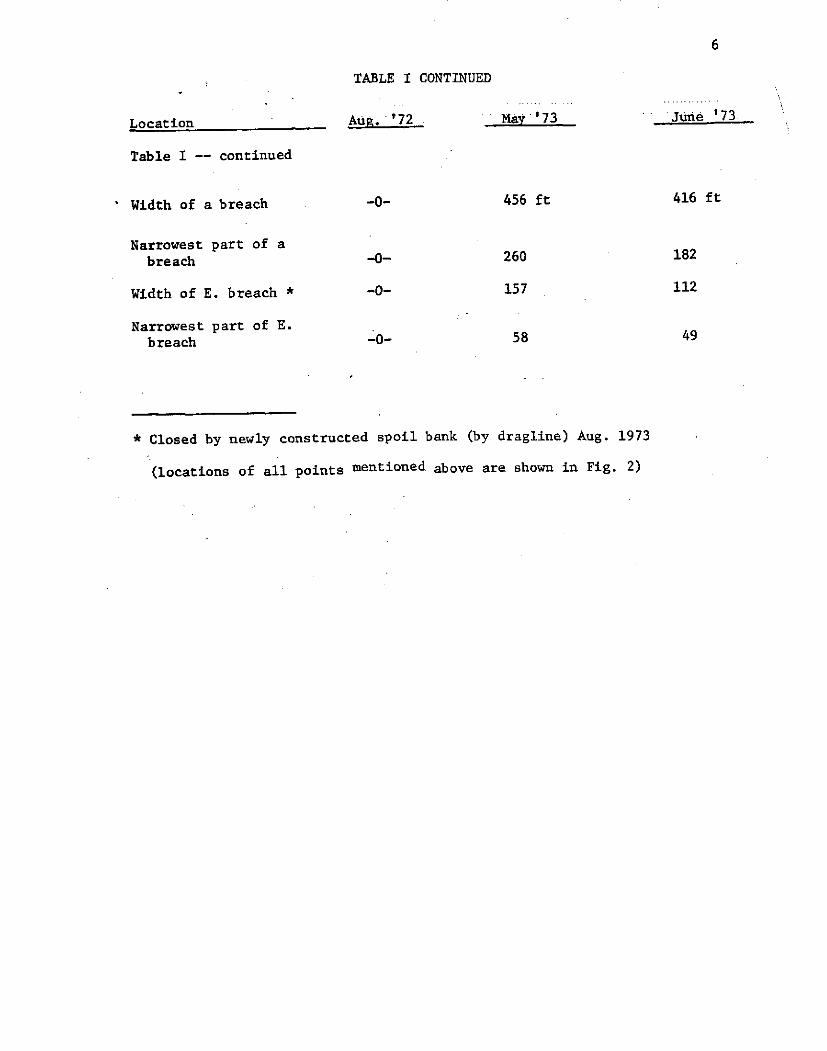
E-c
.C
Small ChannelMarir.-
NSU "Marine
Lab
Area of erosion
- -s Flood tide-b-- Ebb tide
-- Belle Pass
ChevMon Canao/
Wing net
Area of erosion
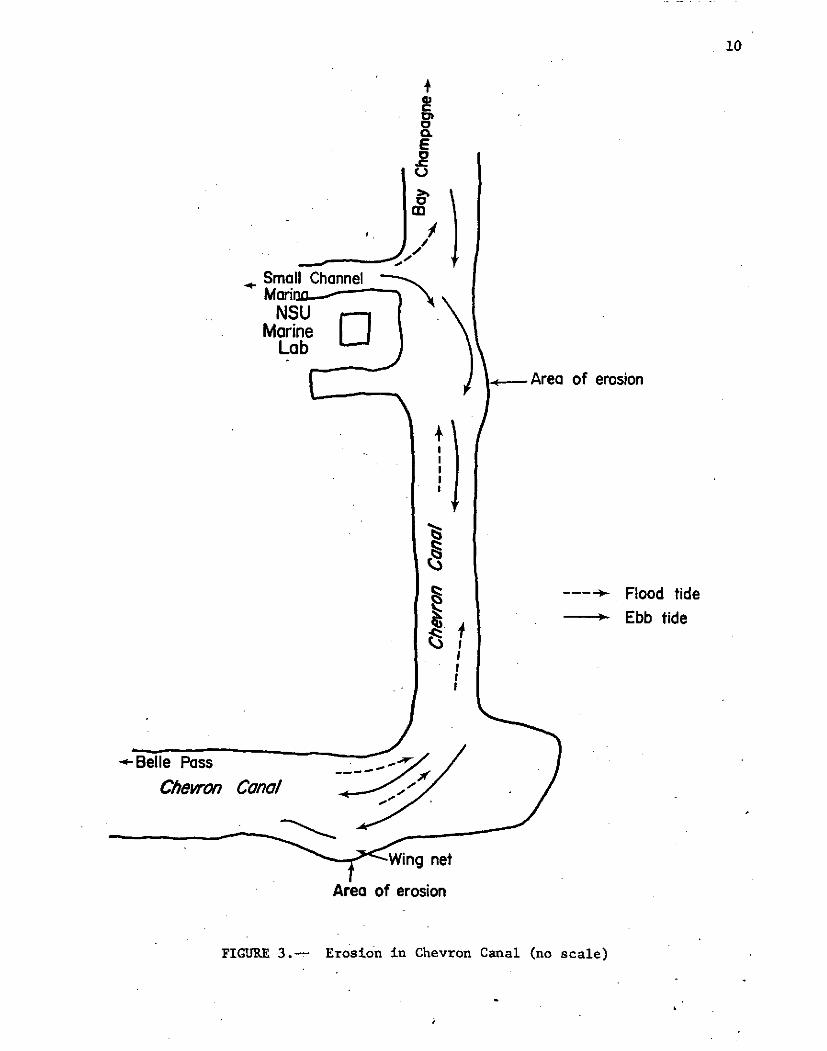
FIGURE 3.-- Erosion in Chevron Canal (no scale)
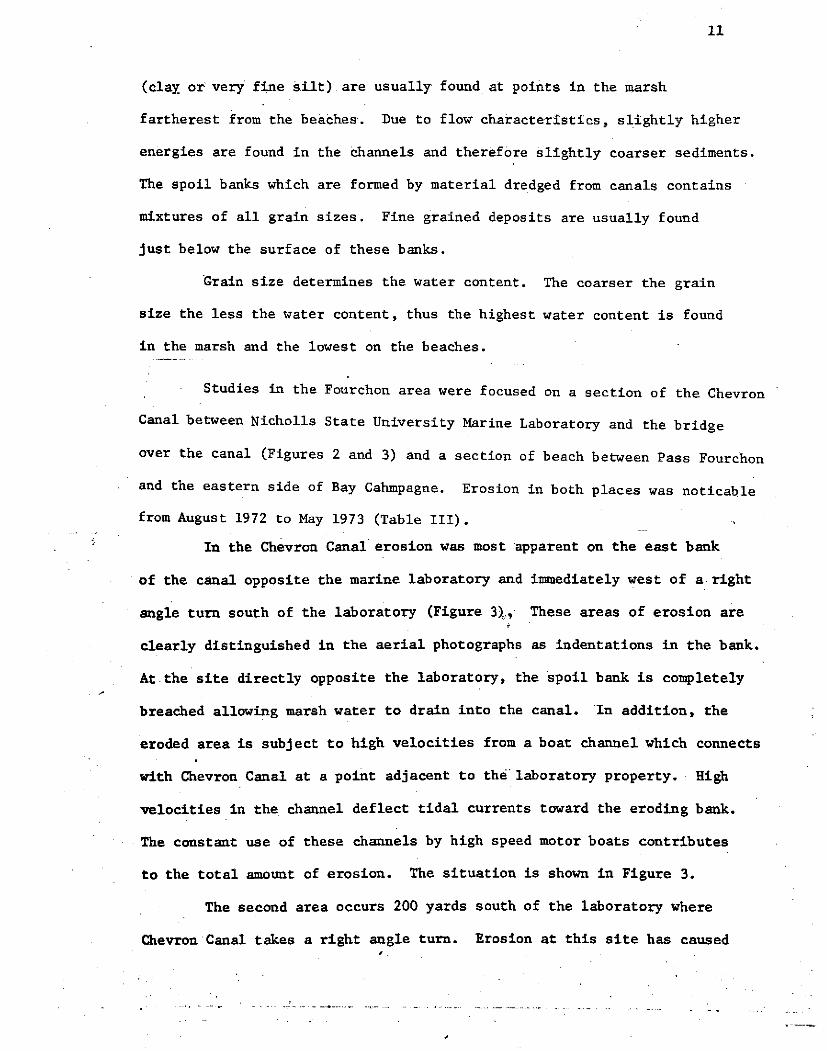
(clay or very fine silt) are usually found at points in the marsh
fartherest from the beaches. Due to flow characteristics, slightly higher
energies are found in the channels and therefore slightly coarser sediments.
The spoil banks which are formed by material dredged from canals contains
mixtures of all grain sizes. Fine grained deposits are usually found
just below the surface of these banks.
Grain size determines the water content. The coarser the grain
size the less the water content, thus the highest water content is found
in the marsh and the lowest on the beaches.
Studies in the Fourchon area were focused on a section of the Chevron
Canal between Nicholls State University Marine Laboratory and the bridge
over the canal (Figures 2 and 3) and a section of beach between Pass Fourchon
and the eastern side of Bay Cahmpagne. Erosion in both places was noticable
from August 1972 to May 1973 (Table III).
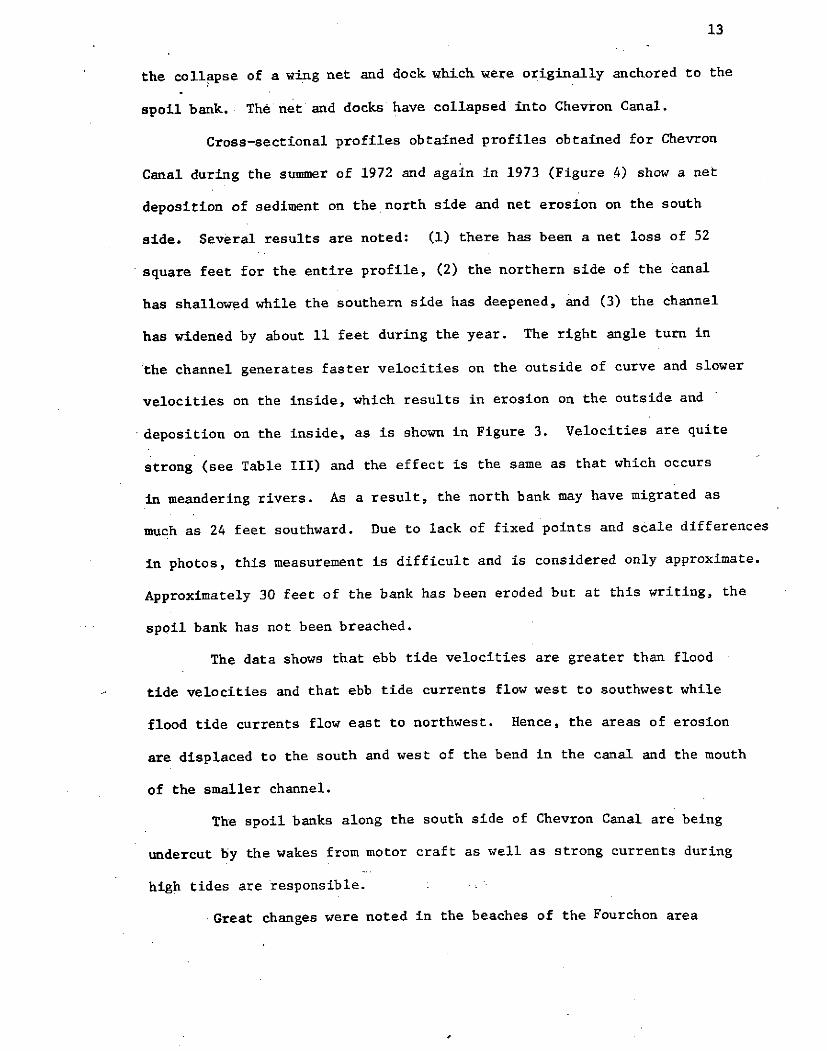
In the Chevron Canal erosion was most apparent on the east bank
of the canal opposite the marine laboratory and immediately west of a right
angle turn south of the laboratory (Figure 3),, These areas of erosion are
clearly distinguished in the aerial photographs as indentations in the bank.
At the site directly opposite the laboratory, the spoil bank is completely
breached allowing marsh water to drain into the canal. In addition, the
eroded area is subject to high velocities from a boat channel which connects
with Chevron Canal at a point adjacent to the laboratory property. High
velocities in the channel deflect tidal currents toward the eroding bank.
The constant use of these channels by high speed motor boats contributes
to the total amount of erosion. The situation is shown in Figure 3.
The second area occurs 200 yards south of the laboratory where
Chevron Canal takes a right angle turn. Erosion at this site has caused
12
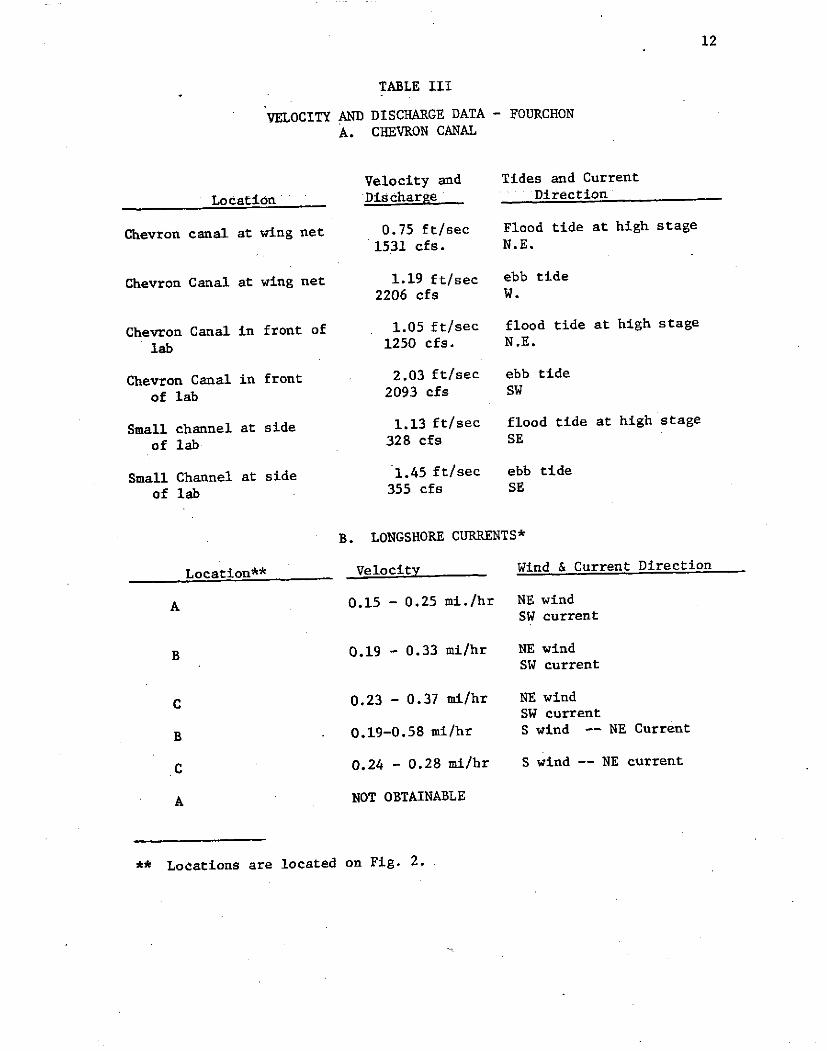
TABLE III
VELOCITY AND DISCHARGE DATA - FOURCHON
A. CHEVRON CANAL
Velocity and Tides and Current
Location 'Discharge Direction
Chevron canal at wing net 0.75 ft/sec Flood tide at high stage
1531 cfs. N.E.
Chevron Canal at wing net 1.19 ft/sec ebb tide2206 cfs W.
Chevron Canal in front of 1.05 ft/sec flood tide at high stage
lab 1250 cfs. N.E.
Chevron Canal in front 2.03 ft/sec ebb tide
of lab 2093 cfs SW
Small channel at side 1.13 ft/sec flood tide at high stage
of lab 328 cfs SE
Small Channel at side 1.45 ft/sec ebb tide
of lab 355 cfs SE
B. LONGSHORE CURRENTS*
Location** Velocity Wind & Current Direction
A 0.15 - 0.25 mi./hr NE windSW current
B 0.19 - 0.33 mi/hr NE windSW current
C 0.23 - 0.37 mi/hr NE windSW current
B 0.19-0.58 mi/hr S wind -- NE Current
C 0.24 - 0.28 mi/hr S wind -- NE current
A NOT OBTAINABLE
** Locations are located on Fig. 2.
13
the collapse of a wing net and dock which were originally anchored to the
spoil bank. The net and docks have collapsed into Chevron Canal.
Cross-sectional profiles obtained profiles obtained for Chevron
Canal during the summer of 1972 and again in 1973 (Figure 4) show a net
deposition of sediment on the north side and net erosion on the south
side. Several results are noted: (1) there has been a net loss of 52
square feet for the entire profile, (2) the northern side of the canal
has shallowed while the southern side has deepened, and (3) the channel
has widened by about 11 feet during the year. The right angle turn in
the channel generates faster velocities on the outside of curve and slower
velocities on the inside, which results in erosion on the outside and
deposition on the inside, as is shown in Figure 3. Velocities are quite
strong (see Table III) and the effect is the same as that which occurs
in meandering rivers. As a result, the north bank may have migrated as
much as 24 feet southward. Due to lack of fixed points and scale differences
in photos, this measurement is difficult and is considered only approximate.
Approximately 30 feet of the bank has been eroded but at this writing, the
spoil bank has not been breached.
The data shows that ebb tide velocities are greater than flood
tide velocities and that ebb tide currents flow west to southwest while
flood tide currents flow east to northwest. Hence, the areas of erosion
are displaced to the south and west of the bend in the canal and the mouth
of the smaller channel.
The spoil banks along the south side of Chevron Canal are being
undercut by the wakes from motor craft as well as strong currents during
high tides are responsible.
Great changes were noted in the beaches of the Fourchon area
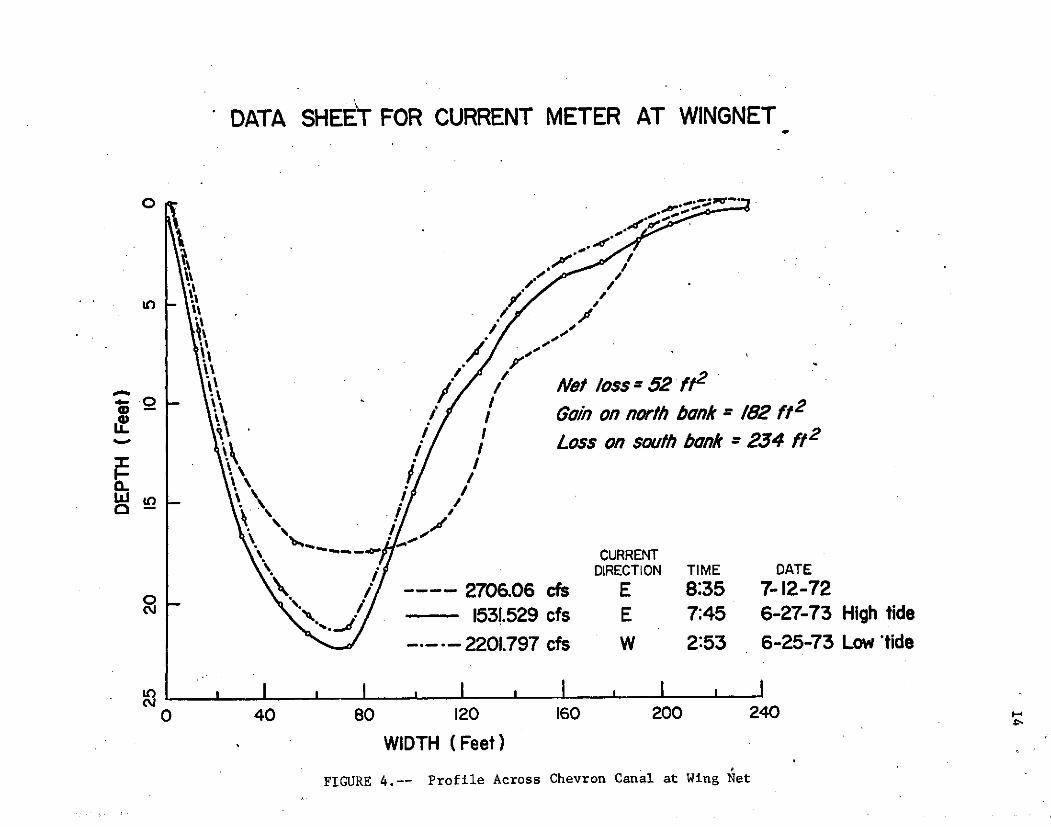
DATA SHEET FOR CURRENT METER AT WINGNET
SNet Ioss 52 ft 2
n/ Gn on north bank' /82 ft2
/ Loss on south bank 234 ft 2
0-o
\ -. o CURRENTSN DIRECTION TIME DATE
S-- 2706.06 cfs E 8:35 7- 12 -721531.529 cfs E 7:45 6-27-73 High tide
2201.797 cfs W 2:53 6-25-73 Low *tide
FIGURE 4.-- Profile Across Chevron Canal at Wing NetFIGURE 4.-- Profile Across Chevron Canal at Wing Net
15
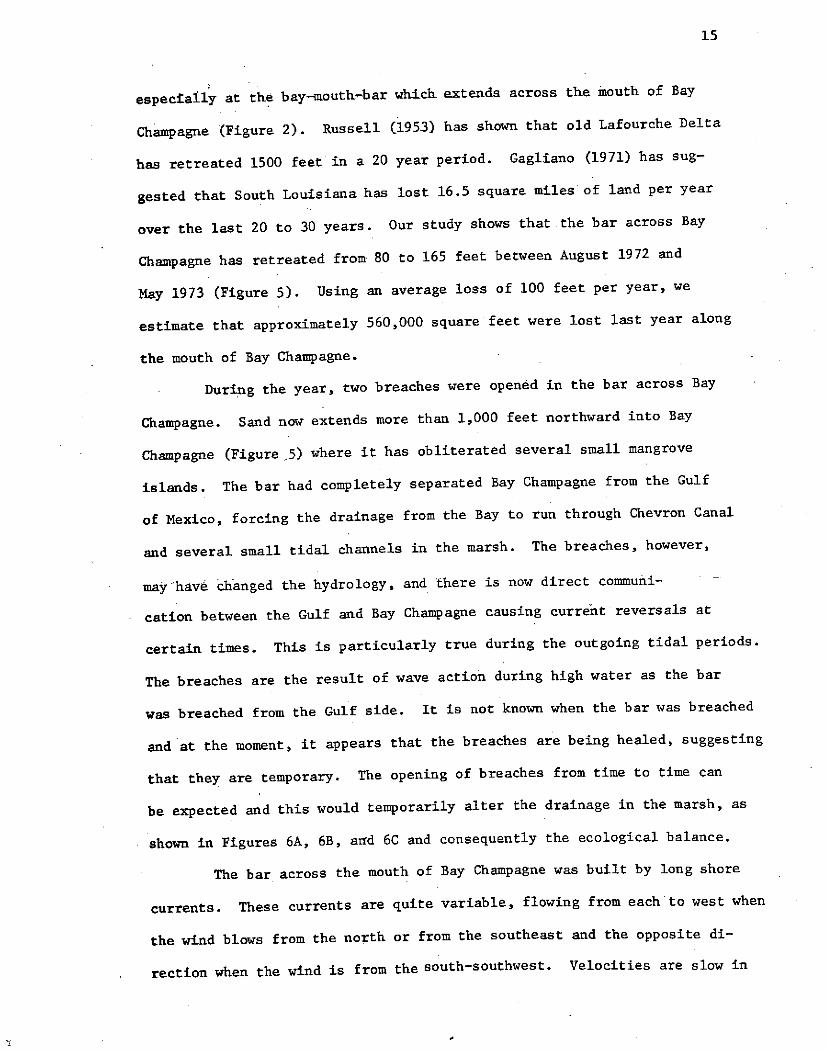
especially at the bay-mouth-bar which extends across the mouth of Bay
Champagne (Figure 2). Russell (1953) has shown that old Lafourche Delta
has retreated 1500 feet in a 20 year period. Gagliano (1971) has sug-
gested that South Louisiana has lost 16.5 square miles of land per year
over the last 20 to 30 years. Our study shows that the bar across Bay
Champagne has retreated from 80 to 165 feet between August 1972 and
May 1973 (Figure 5). Using an average loss of 100 feet per year, we
estimate that approximately 560,000 square feet were lost last year along
the mouth of Bay Champagne.
During the year, two breaches were opened in the bar across Bay
Champagne. Sand now extends more than 1,000 feet northward into Bay
Champagne (Figure,5) where it has obliterated several small mangrove
islands. The bar had completely separated Bay Champagne from the Gulf
of Mexico, forcing the drainage from the Bay to run through Chevron Canal
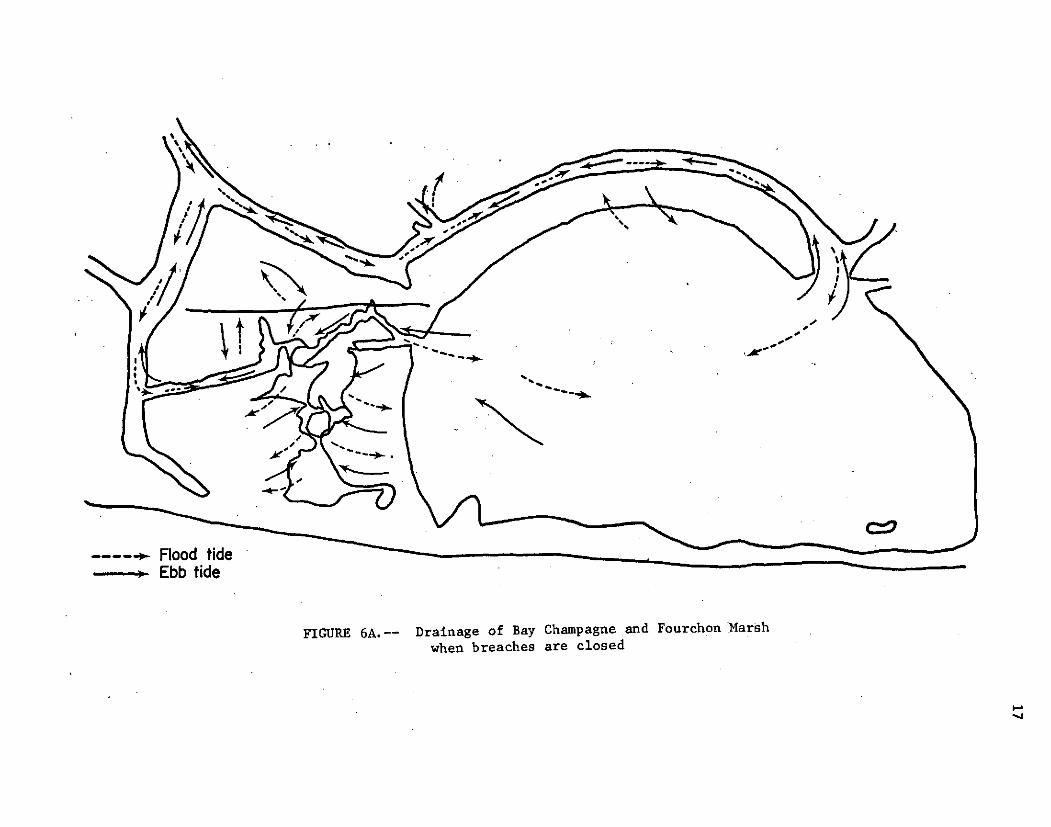
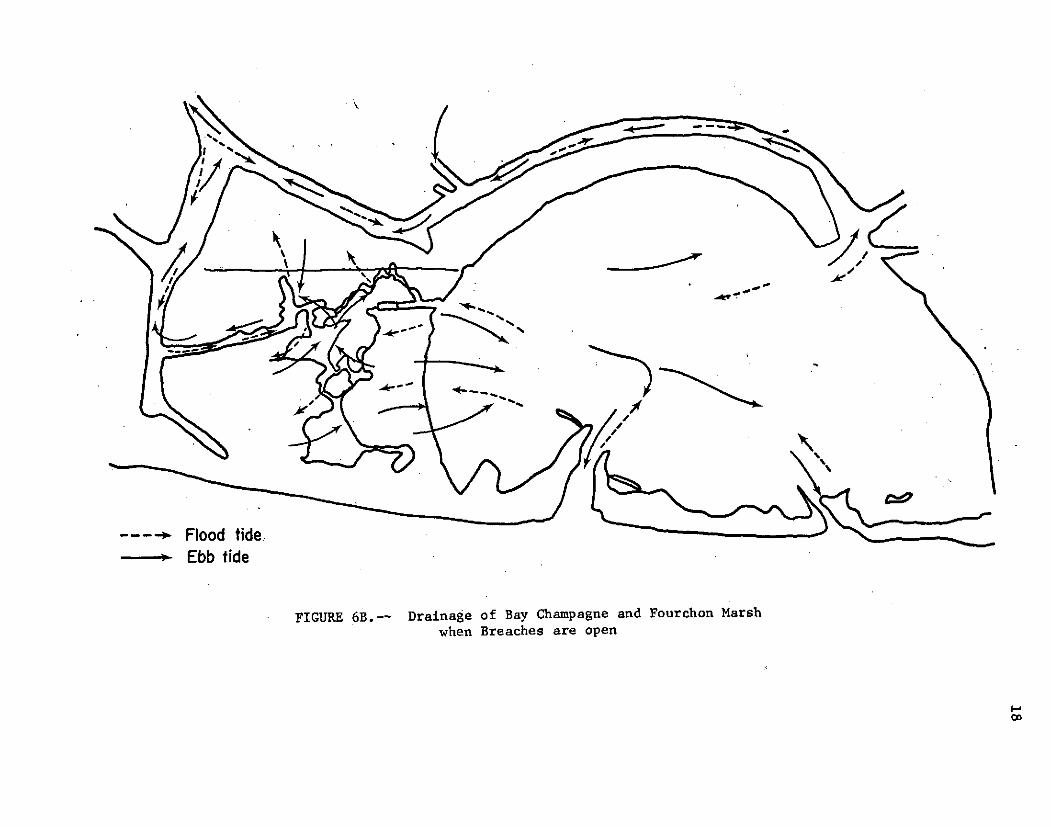
and several small tidal channels in the marsh. The breaches, however,
may have changed the hydrology, and there is now direct communi-
cation between the Gulf and Bay Champagne causing current reversals at
certain times. This is particularly true during the outgoing tidal periods.
The breaches are the result of wave action during high water as the bar
was breached from the Gulf side. It is not known when the bar was breached
and at the moment, it appears that the breaches are being healed, suggesting
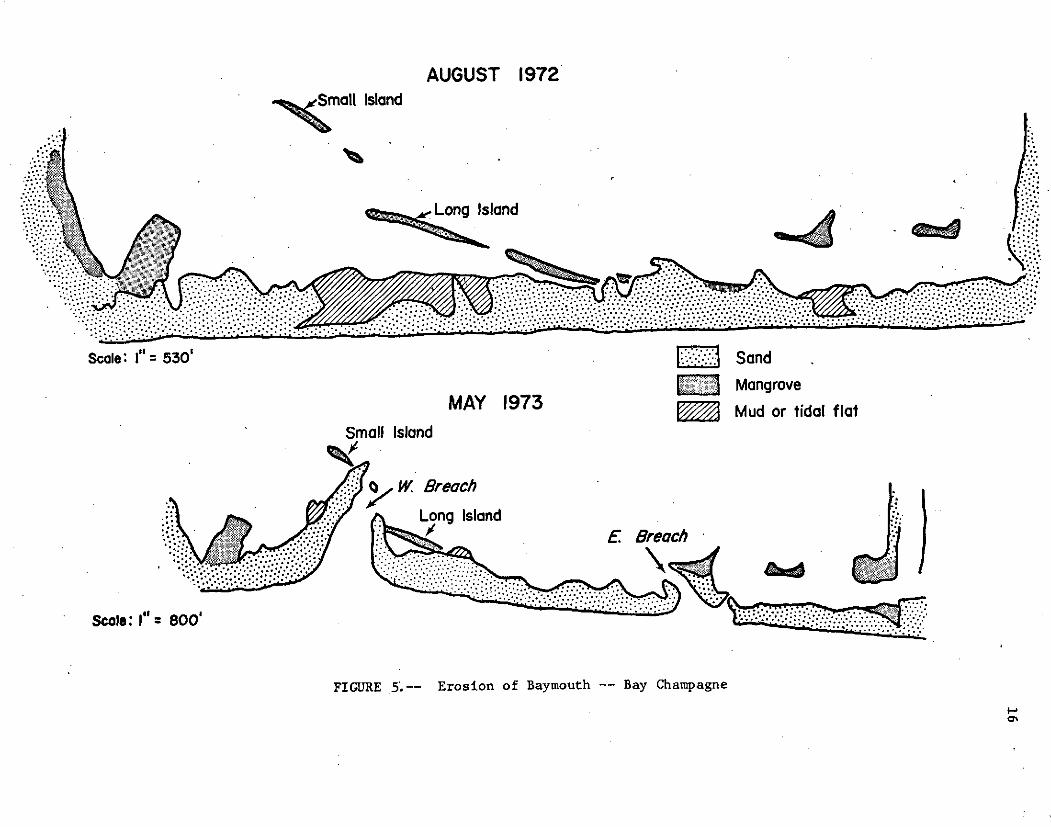
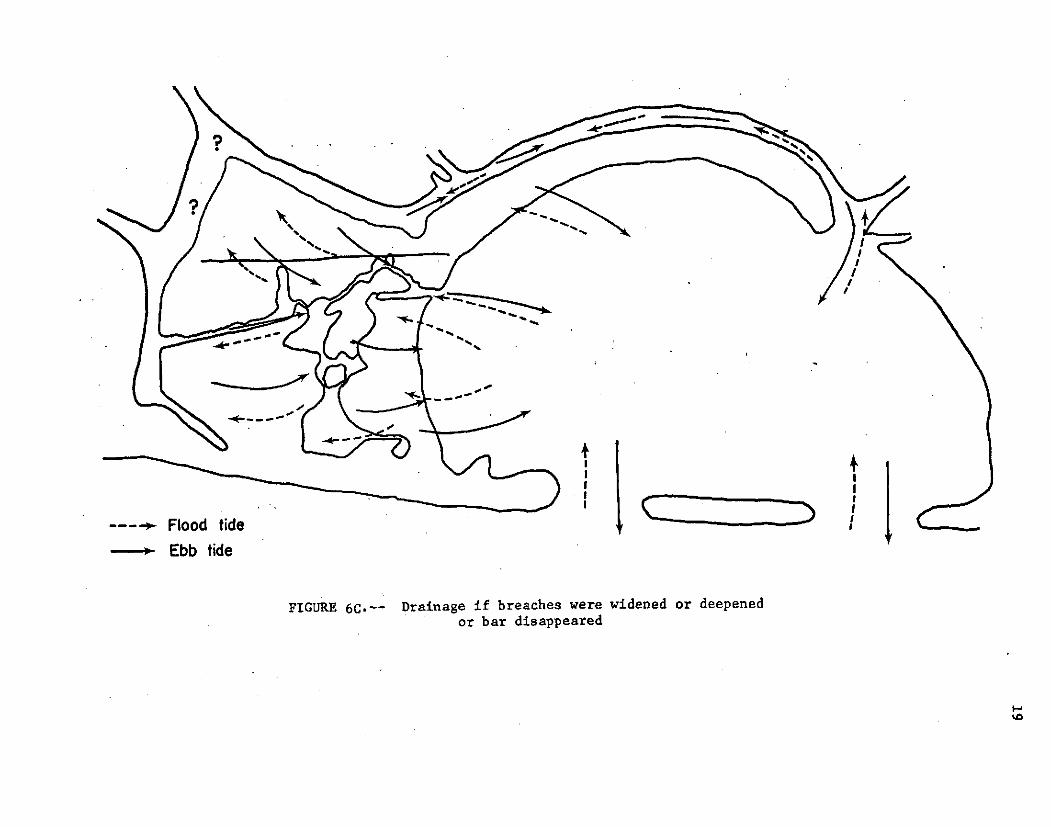
that they are temporary. The opening of breaches from time to time can
be expected and this would temporarily alter the drainage in the marsh, as
shown in Figures 6A, 6B, and 6C and consequently the ecological balance.
The bar across the mouth of Bay Champagne was built by long shore
currents. These currents are quite variable, flowing from each to west when
the wind blows from the north or from the southeast and the opposite di-
rection when the wind is from the south-southwest. Velocities are slow in
AUGUST 1972Small Island
Long Island
.. -. ........... ............................ .''"" . . .
Scale: I"= 530' I Sand
SMangroveMAY 1973 Mud or tidal flat
Small Island
0 W. Breach
Long Island. . : E. Breach
Scale: "= 800'
FIGURE 5.-- Erosion of Baymouth -- Bay Champagne
f%
Flo tid
ICI
- Ebb tide
FIGURE 6A.-- Drainage of Bay Champagne and Fourchon Marsh
when breaches are closed
I.-
Flood tide
Ebb tide
FIGURE 6B.-- Drainage of Bay Champagne and Fourchon Marshwhen Breaches are open
00
- Ebb tide
FIGURE 6C.-- Drainage if breaches were widened or deepened
or bar disappeared
1L ~'.0
20
in both directions (Table III) and are less than one mile per hour.
The beach from the western end of Bay Champagne to Pass Fourchon
has been stable over the year. Comparison with USGS Topographic maps
(Belle Pass Quad.) however indicate that the area has been cut back tre-
.mendously in the last few years. This suggests that areas of erosion
shift from year to year along the shoreline, possibly due to changing
wave conditions which may reflect changes in bottom configuration due to
storms.
Patterns within the saline marsh have changed during the year,
but the type of sediment has not changed. The changes are due to seasonal
(and even shorter time intervals) changes in vegetation in the marsh.
Rectangular patterns present in the August 1972 photographs are not pre-
sent in the May, 1973, photographs.
There are problems in the use of color infrared imagery in sedimen-
tological studies in the marsh areas of South Louisiana. The ground is
covered by lush vegetation which obscures the soil and sediments and which
may or may not reflect changes in the underlying sediment. Spoil banks,
canals, marshes and beaches have been located from the photographs, but
they, and the soil differences, especially in texture, are obvious from
the ground. Some vegetational changes, like the change from grass to
mangrove (1972 report) in the Fourchon area are not related to sediment or
soil changes while others, such as the Juncus in the Pointe au Chien area,
may reflect such changes. The sediments or soils were relatively homo-
genious over the marsh areas which include the vast majority of the acreage
under study. Most sedimentological changes were as obvious from the ground
21
as from the photographs. The photographs do distinguish between spoil
banks7, channels and marshes and can be used to map. large areas of South
Louisiana and to locate ancient levees and channels which are not so
obvious from the ground.
Sands or sandy soil and sediments usually found on spoil banks,
levees and beaches can be easily seen on the color infrared photographs
as it shows up as a white or light area. The photographs could be used
to explore for sand over a wide area since sand is important as a founda-
tion material and is not widespread in the marsh. Many ancient levees
and channels are buried a few feet below the surface so they are not
apparent from the ground. The soil over them may be sandy, however, en-
abling them to be recognized by the remote sensing imagery. The location
of surface or near surface sand bodies is important in regional planning
(i.e.. location of buildings. etc.).
The infrared imagery may be very valuable in the study of sediments
suspended in water, the direction of sediment transport and sediment traps by
determining discharge patterns. Another project in this series does illustrate
the utility of this type imagery in these cases.
This study does not negate the use of infrared and other remote
sensing devices in other geological investigations such as the location
of oil and gas seeps, salt domes, faults, etc.
The erosion of the South Louisiana coastline due to subsidence
(1972) report is serious. The shoreline is being cut back in places at
rates ranging from 75 to 100 feet per year. The areas of erosion may move
from time to time, possibly in response to changes in offshore bathymetry
which effects wave refraction. The bathymetric changes are due to wave
erosion during storm periods. It is recommended that, prior to the de-
velopment of the beaches for recreational or other use, engineering
structures such as retaining embankments be placed behind the beach to
slow or prevent breaching action.
22
Erosion is also serious in sections of Chevron Canal. The ef-
fected areas show up in aerial photographs as a slight indentation along
the bank. Erosion occurs opposite places where fast currents enter the
canql and on the outside of sharp turns or curves in the canal. The inside
of curve is becoming more shallow as the outside deepens. The outside bank
should be shored up with timbering and inside portion of the canal occa-
sionally dredged if stabilization is desired. A speed limit on motor craft
may help reduce bank erosion. The aerial photographs of South Louisiana
should be checked for areas of erosion in canals and channels.
Occasionally, breaches are opened in the bay mouth bar separating
Bay Champagne from the Gulf of Mexico. Drainage, which normally flowed
out through the Chevron Canal and inter tidal channels in the marsh can
now.flow directly into the Gulf of Mexico. This may greatly effect erosion
and deposition in Bay Champagne and the surrounding marshes by reversing
current flow especially during ebb tide and should be taken into consideration
in stabilization programs in the marsh. Erosion would be drastically in-
creased in the marshes around Bay Champagne if the bar were badly breached
dordipsappeared since-the-- bar-protects the- shore of the bay- from wave action.
In addition, several man-made structures and actions were made
while this report was in preparation. A dragline was run down the eastern
side of Bay Champagne and then along the backside of the bar more than
half way across the bay, piling up a bank behind the bar and closing off
one breach. This will slow down erosion on the eastern part of the bar,
but not the western. This will possibly result in a slight bend in the
bar at first followed by a permanent breach which might effect the drainage
of Bay Champagne and the surrounding marsh as discussed above. If the
bank were extended completely across the backside of the bar, erosion
would be slowed down at a uniform rate and the bending and breach would
23
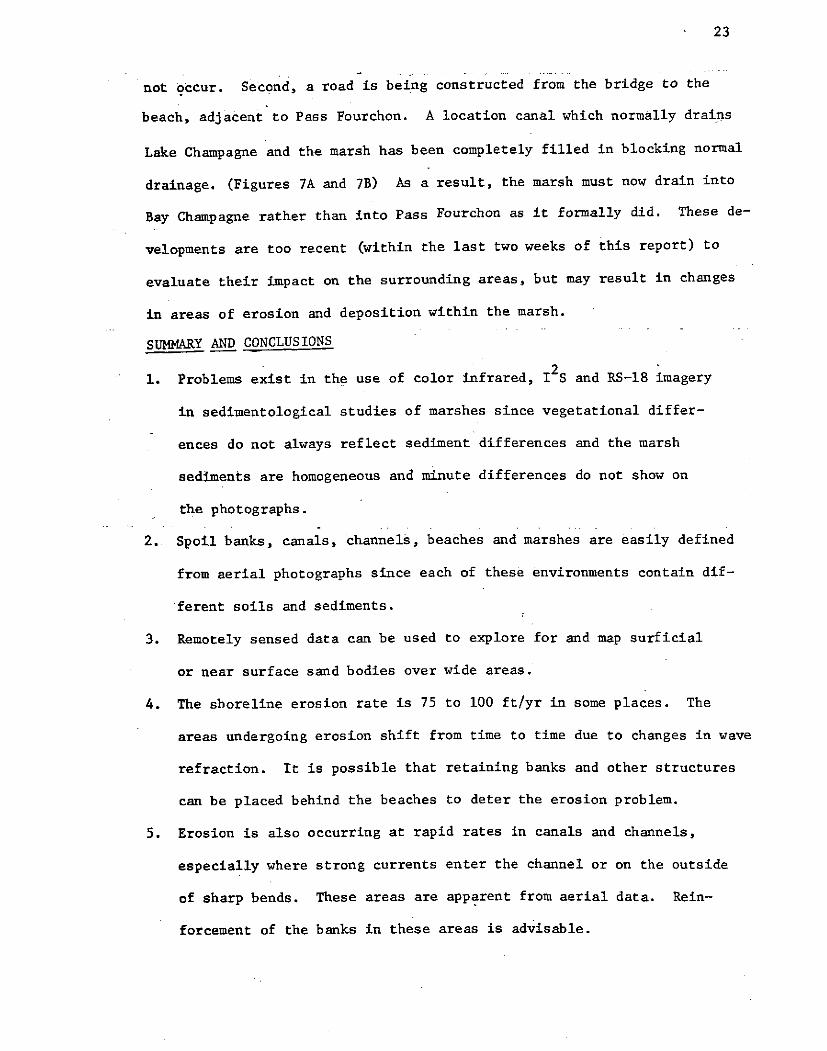
not occur. Second, a road is being constructed from the bridge to the
beach, adjacent to Pass Fourchon. A location canal which normally drains
Lake Champagne and the marsh has been completely filled in blocking normal
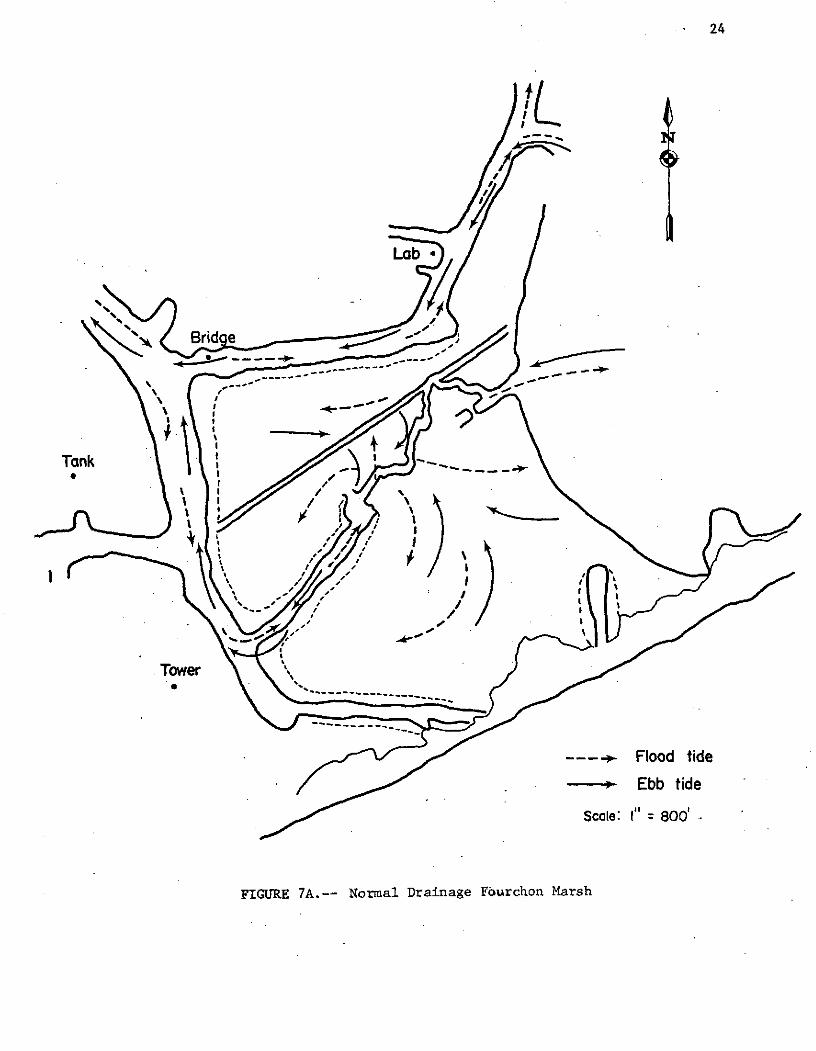
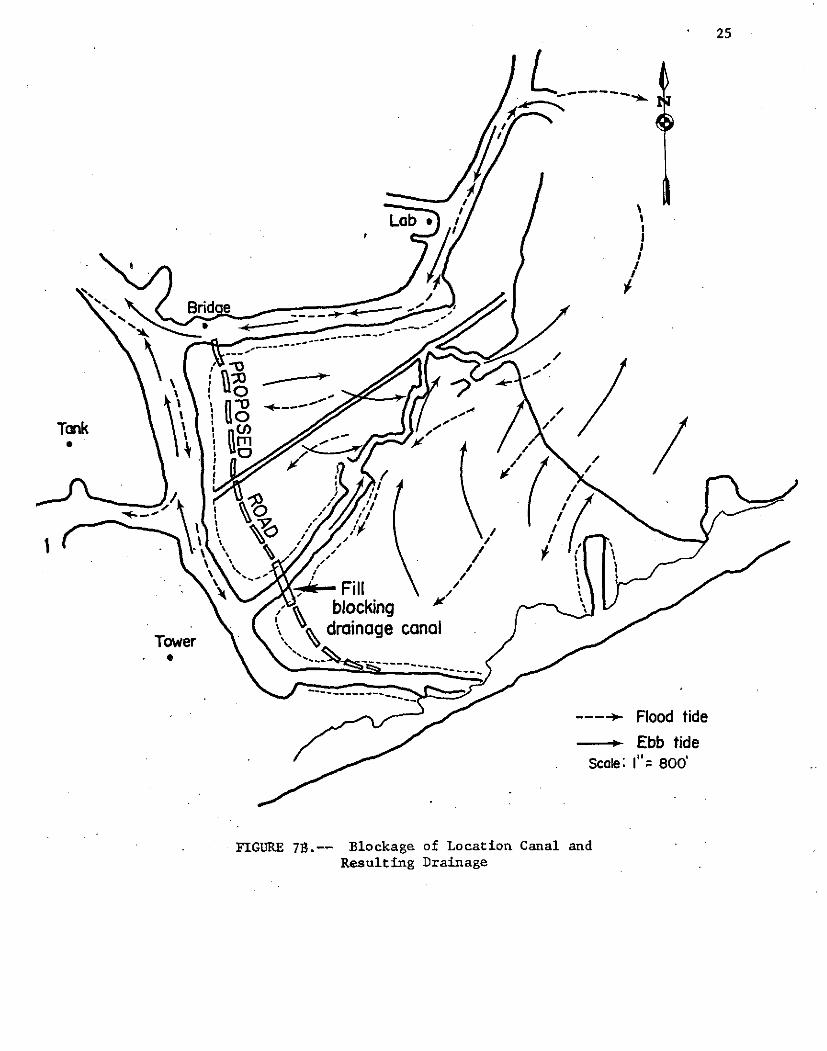
drainage. (Figures 7A and 7B) As a result, the marsh must now drain into
Bay Champagne rather than into Pass Fourchon as it formally did. These de-
velopments are too recent (within the last two weeks of this report) to
evaluate their impact on the surrounding areas, but may result in changes
in areas of erosion and deposition within the marsh.
SUMMARY AND CONCLUSIONS
1. Problems exist in the use of color infrared, 12S and RS-18 imagery
in sedimentological studies of marshes since vegetational differ-
ences do not always reflect sediment differences and the marsh
sediments are homogeneous and minute differences do not show on
the photographs.
2. Spoil banks, canals, channels, beaches and marshes are easily defined
from aerial photographs since each of these environments contain dif-
ferent soils and sediments.
3. Remotely sensed data can be used to explore for and map surficial
or near surface sand bodies over wide areas.
4. The shoreline erosion rate is 75 to 100 ft/yr in some places. The
areas undergoing erosion shift from time to time due to changes in wave
refraction. It is possible that retaining banks and other structures
can be placed behind the beaches to deter the erosion problem.
5. Erosion is also occurring at rapid rates in canals and channels,
especially where strong currents enter the channel or on the outside
of sharp bends. These areas are apparent from aerial data. Rein-
forcement of the banks in these areas is advisable.
24
%/
Jf/11,V3- ----------
Tank
Oi l
/I I
1
Tower
---- p. Flood tide
Ebb tide
Scale: 1" = 800' -
FIGURE 7A.-- Normal Drainage Fourchon Marsh
25
I
qO 1/
Tank (n
1 \
blockingdrainage canal
Tower
------ Flood tide-- Ebb tide
Scale: 1"= 800'
FIGURE 71.-- Blockage of Location Canal andResulting Drainage
26
6. Breaches in bay mouth bars may open and close from time to time
greatly effecting local drainage near Bay Champagne. Drainage
patterns in the marsh should be studied before any permanent
breach is made. The bay mouth bars protect the marshes in back of
them from erosion and should be preserved. Man-made changes may
reverse drainage in the Bay Champagne area.
Recommendations
1. The photos can be used to map areas of marsh, spoil banks, beaches,
and channels in the coastal areas of South Louisiana.
2. The photographs may be used to explore large areas for sand bodies
which make better foundation materials than the mud in the surrounding
marsh.
3. Engineering structures, such as goins and retaining embankments be
placed on or behind beaches prior to development. This may slow down
or prevent excessive erosion.
4. Aerial photographs can be used to check canals and channels for areas
of excessive erosion. These areas should be reinforced.
5. A speed limit on motor craft may help reduce bank erosion along
channels and canals.
6. Care should be taken not to block tidal channels and other areas
which affect tidal drainage
7. The barrier islands or bars acrossthe mouth of bays should be
preserved since they protect the marsh from waves and hence prevent
erosion of the marsh.
8. Seasonal changes in vegetation can be studied by use of the photo.
27
REFERENCES
Gagliano, S., 1971, Building New Marshes and Estuaries in Coastal Louisiana
Through Controlled Sedimentation: 56th Annual Meeting, American
Association Petroleum Geologist, Houston, Texas
Russell, R., 1953, Coastal Advance and Retreat in Louisiana: Congress Ged.
Intl., 19th Sess., Competes Rendus, V. 4, pp. 108-118.
Self, R., 1972, The Uses of Color Infrared, T2 S and RS-18, in DeterminingSediment and Soil Types in the Fourchon Area, South Louisiana: Un-
published Report of Division of Engineering Research, Louisiana State
University.
Shepard, F., and Wonless, H., 1971, Our Changing Coastlines: McGraw-Hill,New York, N.Y. 579 pp.