Embed Size (px)
Citation preview
Assessment of the Costs, Performance, and Characteristics of UK Heat Networks
Final Report

2
© Crown copyright 2015 URN 15D/022– Assessment of the Costs, Performance, and Characteristics of Heat UK Networks You may re-use this information (not including logos) free of charge in any format or medium, under the terms of the Open Government Licence. To view this licence, visit www.nationalarchives.gov.uk/doc/open-government-licence/ or write to the Information Policy Team, The National Archives, Kew, London TW9 4DU, or email: [email protected]. Any enquiries regarding this publication should be sent to us at [email protected]
3
Contents
Executive summary ..................................................................................................................... 6 Introduction ............................................................................................................................... 6 Data collection .......................................................................................................................... 6 Cost data .................................................................................................................................. 7 Typical benchmark assessment ............................................................................................... 7 Heat sales ............................................................................................................................... 11 Carbon dioxide emissions ....................................................................................................... 11 Conclusions ............................................................................................................................ 11 Data collection ..................................................................................................................... 11 Data benchmarking ............................................................................................................. 11 Heat sales ........................................................................................................................... 12 CO2 emissions ..................................................................................................................... 12
1. Introduction ........................................................................................................................ 14 Background to this study ........................................................................................................ 14 Purpose of this project ............................................................................................................ 14 Scope of this report ................................................................................................................. 15 Confidentiality ......................................................................................................................... 15 The project team ..................................................................................................................... 15
2. Data capture methodology ................................................................................................. 16 Outline approach .................................................................................................................... 16 Data collection ........................................................................................................................ 16 Selecting schemes .............................................................................................................. 16 Statistical background ......................................................................................................... 17 Collecting data .................................................................................................................... 17 Feasibility studies ................................................................................................................ 18 Online survey ...................................................................................................................... 18
Scope of data collection .......................................................................................................... 19 Heat supply plant ................................................................................................................ 19 Internal distribution .............................................................................................................. 20 Heat network schemes evolvement and history .................................................................. 21
4
Data checking and verification ................................................................................................ 21 Cost data ................................................................................................................................ 22 Identifying gaming and bias .................................................................................................... 22
3. Description of data captured .............................................................................................. 23 Introduction ............................................................................................................................. 23 Description of heat network schemes by size ......................................................................... 23 Description of heat network schemes by delivery type ........................................................... 24 Typical benchmark assessment ............................................................................................. 24 Thermal storage .................................................................................................................. 26
Capital cost typical benchmarks ............................................................................................. 28 Operational cost benchmarks ................................................................................................. 32 Heat sales ............................................................................................................................... 33 Carbon dioxide emissions ....................................................................................................... 36 Calculation of CO2 emissions .............................................................................................. 36 CO2 emissions from heat sources ....................................................................................... 37 CO2 emissions from heat network schemes ....................................................................... 38
4. Conclusions ........................................................................................................................ 40 Data collection and availability ................................................................................................ 40 Data benchmarking ................................................................................................................. 40 Heat sales ........................................................................................................................... 41 CO2 emissions ..................................................................................................................... 41
Appendix: Description of metrics ............................................................................................... 43

5
This document has been prepared by AECOM Limited for the sole use of DECC and in accordance with generally accepted consultancy principles, the budget for fees and the terms of reference agreed between AECOM Limited and the DECC. Any information provided by third parties and referred to herein has not been checked or verified by AECOM Limited, unless otherwise expressly stated in the document. No third party may rely upon this document without the prior and express written agreement of AECOM Limited.
6
Executive summary
Introduction There are thought to be over 2,000 heat networks and communal heating schemes of various sizes in the UK serving 200,000 dwellings and 2,000 commercial and public buildings. 1 The largest heat network schemes are predominantly found in cities and on university campuses. There are also a large number of smaller schemes in the domestic sector, often linking communally heated blocks of flats. This extent of heat networks represents around 2% of the domestic, public sector, and commercial buildings heat demand. Benefits from the increased use of heat networks could include energy cost and Carbon Dioxide (CO2) emissions reductions for the UK, through allowing the exploitation of lower CO2 and higher efficiency forms of generation. These could include the use of CHP, biomass, heat pumps, waste heat and low grade heat sources. The key aim of this project is to provide evidence-based knowledge on costs of heat networks, as well as on their performance and characteristics to support the evaluation of policy options involving heat networks. This would address the information gap identified by DECC. This work has focused on the gathering of robust data and evidence to enhance the understanding of typical mixed residential and commercial heat network schemes in the UK. This project was led by AECOM, and supported by Sweett Group for the purposes of cost benchmarking and verification.
Data collection A list of data requirements was prepared and agreed with DECC to form the basis of the data collection. This comprised those variables relating to the performance and costs of heat networks. The data collection was separated into three complementary data gathering exercises carried out in parallel with the aim to obtain accurate and completed sets of broken down data on cost, performance and other characteristics. These consisted of:
• An in-depth questionnaire sent to stakeholders with information on a selection of existing heat network schemes considered to be representative of the main types of networks in the UK. This was subsequently followed up by further engagement to look to clarify information provided and fill-in data gaps;;
• Identification and examination of hypothetical schemes taken from feasibility studies, deemed representative of current and future heat network developments;;
1 The Summary Evidence on District Heating Networks in the UK. DECC, 2013 paper identified 1,765 heat networks but DECC believe this figure to be nearer to 2,000. The nature of the heat network market means that there are no robust datasets collating information on all networks. https://www.gov.uk/government/uploads/system/uploads/attachment_data/file/212565/summary_evidence_district_heating_networks_uk.pdf.
7
• An on-line survey addressed to a wide range of stakeholders involved in different aspects of heat networks with a view to obtain additional and/or complementary information. The aim of collecting this data was to provide additional information for benchmarking the existing schemes and feasibility studies, and to further inform DECC’s evidence base on heat networks’ cost and performance.
A selection of 14 existing heat network schemes considered to be representative of schemes in the UK were identified by experts from both AECOM and DECC. The selection process included considerations such as successful implementation and level of performance. This was to ensure that the data from the schemes would represent a successful and deliverable scheme. The selection of 14 heat networks limits the extent to which detailed statistical analysis could be conducted on the received datasets. This was impacted further by only receiving suitable data from 7 of the 14 schemes.
Cost data All capital costs are presented as 2013/14 prices. For heat network schemes where capital cost information is one or more years prior to this, the RICS Building Cost Information Service (BCIS) General Building Cost Index has been used to provide an uplift.
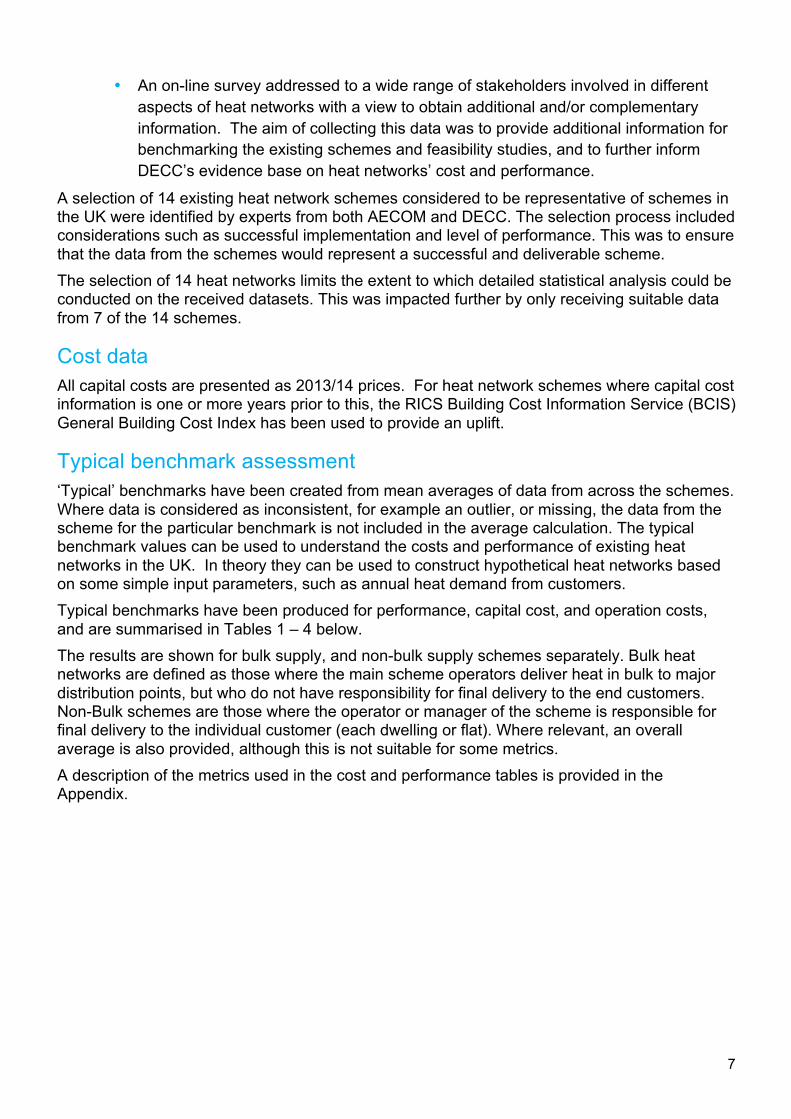
Typical benchmark assessment ‘Typical’ benchmarks have been created from mean averages of data from across the schemes. Where data is considered as inconsistent, for example an outlier, or missing, the data from the scheme for the particular benchmark is not included in the average calculation. The typical benchmark values can be used to understand the costs and performance of existing heat networks in the UK. In theory they can be used to construct hypothetical heat networks based on some simple input parameters, such as annual heat demand from customers. Typical benchmarks have been produced for performance, capital cost, and operation costs, and are summarised in Tables 1 – 4 below. The results are shown for bulk supply, and non-bulk supply schemes separately. Bulk heat networks are defined as those where the main scheme operators deliver heat in bulk to major distribution points, but who do not have responsibility for final delivery to the end customers. Non-Bulk schemes are those where the operator or manager of the scheme is responsible for final delivery to the individual customer (each dwelling or flat). Where relevant, an overall average is also provided, although this is not suitable for some metrics. A description of the metrics used in the cost and performance tables is provided in the Appendix.
8
Table 1: Typical benchmarks describing the performance of heat networks. All heat demand figures are presented as aggregate customer (at customer connection or bulk supply point) heat demands.
OVERALL
PERFORMANCE BENCHMARKS
AVERAGE AVERAGE MAX MIN Number AVERAGE MAX MIN Number
% seasonal heat load factor of network
% na 23% 28% 20% 4 17% 24% 13% 3
Distribution losses1% heat generated
na 6% 11% 3% 4 28% 43% 12% 3
Distribution losses1 per m distribution network
kWh / m na 544 850 231 4 767 5942 416 3
Linear heat density MWh demand per m network2
MWh / m 7.6 9.7 18.3 5.9 4 4.7 7.8 3.1 3
Thermal store capacity per MWh heat demand3
m3/MWh 0.015 0.016 0.016 0.016 1 0.014 0.014 1
Length of internal pipework per dwelling / flat4
m 13.3 0 13.3 20.8 9.2 3
Operating temperature -‐ flow
Degrees C 88 92 95 82 4 84 85 81 3
Operating temperature -‐ return
Degrees C 62 68 75 55 4 54 60 46 3
Network parasitic electricity consumption
% heat demand
na 2.9% 4.0% 1.0% 4 1.9% 2.0% 1.7% 2
1 Difference between heat generation and heat demand served divided by the heat generation2 Average figure for heat demand served per m of buried pipe in the network3 Average figures for schemes with thermal storage is provided. 4 Only applicable to non bulk schemes which serve individual dwellings/flats/units
BULK SCHEMES NON BULK SCHEMES
9
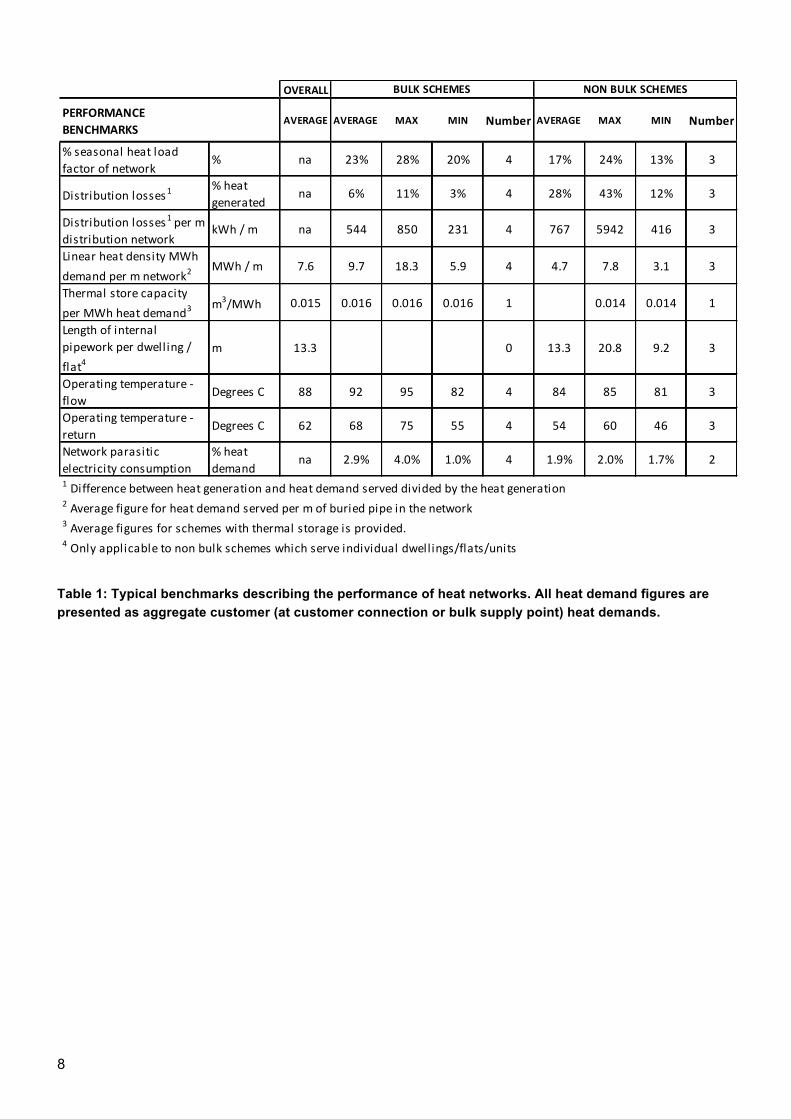
Table 2: Capital cost typical benchmarks normalised to annual heat demand (D – Domestic, ND – Non Domestic, HIU – Hydraulic Interface Unit). The data presented in BOLD is provided as an aggregate where available by the heat network scheme though the data collection process. All values presented in italics are provided by heat network schemes at the disaggregated level where available. Therefore the aggregate, and sum of disaggregated values are not always equivalent.
OVERALL
CAPITAL COSTS AVERAGE AVERAGE MAX MIN Number AVERAGE MAX MIN Number
Heat Connections £ / MWh na £25 £36 £8 4 £624 £1,179 £129 3Cost substations ND and Dblocks
£ / MWh £16 £12 £16 £8 2 £19 £39 £5 3
Cost heat meters ND and Dblocks
£ / MWh £4 £3.7 £3.7 £3.7 1 £4.4 £8.0 £0.8 2
Cost HIUs Dwellings 1 £ / MWh £253 0 £253 £461 £46 3Cost heat metersDwellings 1
£ / MWh £170 0 £170 £232 £107 2
Cost internal pipeworkconnection to HIUs 1
£ / MWh £492 0 £492 £782 £203 2
Cost for connectionsprelims 2
£ / MWh
Overhead and profitconnections 2
£ / MWh
SUM OF DISAGGREGATED CONNECTION COSTS
£ / MWh na £16 £20 £12 0 £939 £1,523 £362 0
Heat Network £ / MWh £150 £150 £239 £80 4 £150 £168 £132 2Mechanical capital cost –total
£ / MWh £70 £62 £102 £42 4 £80 £92 £72 3
Civil capital cost – total £ / MWh £74 £79 £136 £25 4 £64 £76 £52 2Preliminary capital cost –total 3
£ / MWh £8 £10 £13 £7 2 £3 £3 £3 1
Overhead and profit –total
£ / MWh £10 £10 £13 £7 2 0
SUM OF DISAGGREGATED HEAT NETWORK COSTS
£ / MWh £161 £160 £265 £80 £148 £171 £128
Ancillary plant associated with network (eg pumping, treatment, etc)
£ / MWh na £68 £68 £68 1 £137 £137 £137 1
Thermal store £ / MWh £14 £17 £17 £17 1 £12 £12 £12 11 Only applicable to non bulk schemes which serve individual dwellings/flats/units2 None reported -‐ 2 schemes indicated these costs are included but can't be disaggregated3 Prelim costs are believed to be mainly included within mechanical, civil and/or total costs
BULK SCHEME NON BULK SCHEMES
no data
no data
10
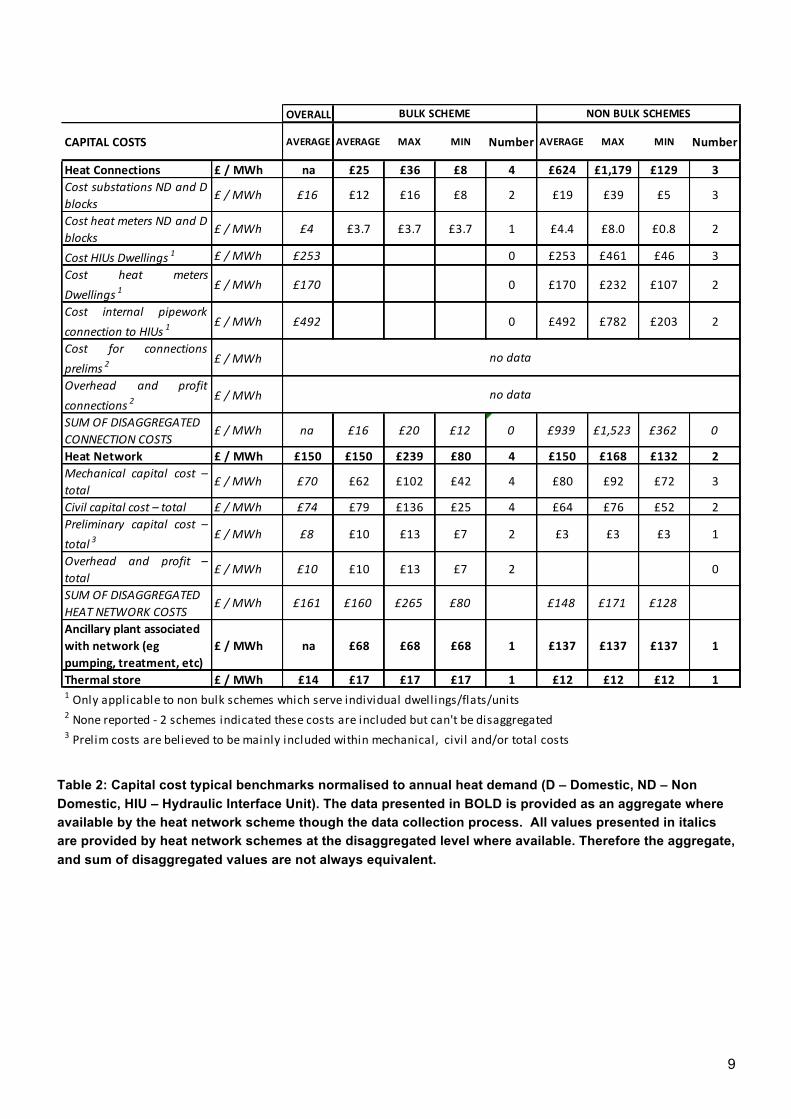
Table 3: Capital cost typical benchmarks normalised to non MWh metrics
Table 4: Operation cost typical benchmarks normalised to annual heat demand and capacity.
OVERALL
OPERATION COSTS AVERAGE AVERAGE MAX MIN Number AVERAGE MAX MIN Number
Heat network maintenance cost
£ / MWh £0.6 £0.4 £0.4 £0.4 1 £0.6 £0.9 £0.3 3
Heat network management cost
£ / MWh
Substation maintenance cost
£ / MWh
HIUs maintenance cost £ / MWh £9 0 £9 £16 £2 3HIUs maintenance cost £/MW £820 0 £820 £1,039 £658 3Heat meter maintenance cost
£ / MWh £3.4 0 £3.4 £9.0 £0.1 3
Avg annual staff cost for metering, bil l ing and revenue collection
£ / MWh £11.1 £2.5 £4.6 £0.4 2 £16.9 £34.8 £0.1 3
Annual business rates £ / MWh £6 £7 £8 £5 2 £6 £8 £2 3
BULK SCHEMES NON BULK SCHEMES
no data
no data
OVERALL
CAPITAL COSTS AVERAGE AVERAGE MAX MIN Number AVERAGE MAX MIN Number
Network capital costs per length (main network-‐buried)
£/m £984 £1,242 £1,472 £874 4 £468 £514 £422 2
Network capital costs per length (internal pipe)
£/m £169 0 £169 £244 £94 2
Substations cost per kW capacity
£/kW £32 £28 £40 £15 2 £35 £53 £16 3
Domestic HIUs cost per dwelling
£/dwelling £1,075 0 £1,075 £1,326 £738 3
Heat meter cost per building (ND and bulk)
£/building £2,878 £1,949 £1,949 £1,949 1 £3,343 £6,136 £551 2
Heat meter cost per dwelling
£/dwelling £579 0 £579 £668 £491 2
Thermal store cost per m3 £/m3 £962 £1,080 £1,080 £1,080 1 £843 £843 £843 1
BULK SCHEMES NON BULK SCHEMES
11
Heat sales Heat prices for heat network schemes are unregulated and calculated using a number of different methods. The price of heat is often determined by the heat source, which can result in a wide range of costs and structures. Information on heat sales prices was collected as part of the data capture exercise and compared with counterfactual prices for the domestic sector which include gas supply, boiler maintenance and replacement.
Carbon dioxide emissions The CO2 savings provided by a heat network scheme can be calculated by comparing the scheme with a counterfactual heating source. The main counterfactual technology appropriate to heat network schemes is the condensing gas boiler which is predominant in urban areas. This report assesses potential CO2 savings from schemes under a range of assumptions describing the current and future electricity grid emissions.
Conclusions Data collection Data has been collected from a representative sample of 7 district heat network schemes and used to assess the costs and performance of heat networks. Additional data from feasibility studies and an online survey has helped validate the data from existing schemes. The data collection exercise has highlighted the difficulty in obtaining accurate and consistent data across existing heat network schemes in the UK, and the need to develop a framework in which the schemes can be better monitored and understood. The fragmented and nascent nature of the heat network industry in the UK means that data is either not collated, or not easily accessible, but could be used if available to help understand and support further heat network development. This study has also identified the complexity of heat network schemes, with many technical and financial approaches. Understanding the boundary of the heat network schemes is important - whilst some heat network schemes are relatively simple with all heat supply, distribution and customer connections financed and operated by the same organisation, the majority are more complex with different organisations responsible for different elements of the scheme. Historic investment and payback on infrastructure also need to be considered when assessing heat networks. A large number of existing schemes have developed over a number of years, and some operators have been able to adopt existing heat supply and distribution infrastructure for little or no charge, effectively a grant to the scheme. Some other more recent schemes have received large capital grants for infrastructure investment. This means that not only is historic cost information difficult to obtain, more importantly it does not feature in the operator’s economic model. Whilst this may enable existing schemes to operate in a financially viable manner, it is not a replicable model for new schemes where all investment costs will need to be included.
Data benchmarking The data collected in this study has been used to produce a set of benchmarks or typical values. Key conclusions are as follows: Performance:
• Distribution losses range widely with averages of 6% and 28% for each type of network. The losses for the bulk schemes are in line with commonly used
12
assumptions with losses of around 10% or less although these are representative of the more urban schemes examined in this report, and the losses could be higher in less dense schemes. The losses for the non-bulk schemes are significant with one scheme at 43%. Evidence suggests that high losses can be experienced through internal distribution pipework within buildings, and it will be important that the specification and design of internal pipework and operating parameters are controlled to reduce losses on schemes.
Capital costs:
• Heat network buried pipe costs are typically around £150 / MWh annual, whilst the connection costs range significantly from £25 / MWh for bulk schemes to £624 / MWh for non-bulk schemes. The key area of sensitivity is therefore around the heat connections and configuration. In particular, individual dwelling connections in the form of HIUs and heat meters appear to dominate the capital cost of domestic schemes with individual connections.
• Buried heat network pipework costs average around £1000 / m over a heat network, although this ranges from £422 / m to £1472 / m depending on the size and nature of the schemes.
Operation costs:
• Operation costs associated with the heat network appear to be low, and not considered significant by organisations. However there will be higher operation costs associated with other elements of the heat network scheme, such as heat sources and energy centre buildings.
• The highest operation costs appear to be associated with HIU and heat meter maintenance, and meter reading / billing activities.
Heat sales This report has assessed the heat sales prices used by the 7 schemes, and compared these with counterfactual prices for the domestic sector. The analysis suggests that in low heat demand dwellings, the counterfactual prices can be relatively high once boiler maintenance and replacement is included, and current heat sales prices from heat networks may be under-valuing the heat. This undervaluation may allow economic operation of some current heat networks which have benefited from historic investment or grant funding, but higher prices may be required for future networks which incur all capital expenditure. The analysis suggests that higher prices may be obtained, whilst still offering consumers a discount over counterfactual heating costs.
CO2 emissions The CO2 emissions from heat distributed by heat networks depend on the type of heat source and the fuel used. Larger heat networks predominantly source heat from gas fired CHP at present although other sources such as energy from waste are also used. The analysis demonstrates the sensitivity of the CO2 calculations to assumptions for grid electricity emissions, and the need for improved advice and guidance for these calculations. In particular, the valuation of grid CO2 at an average or marginal generation factor may not be suitable. It is recommended that a framework is developed for CO2 calculations. This should

13
take into account the future electricity grid emissions projections, the power generation technologies which will be displaced under different load conditions by decentralised generation, and the operation regime for decentralised technologies. Without this, the lifecycle CO2 emissions of heat network schemes cannot be suitably and consistently assessed, making investment in heat networks and heat supply technologies higher risk. DECC is addressing this by investigating CHP operation in further detail.2
2 https://www.gov.uk/government/publications/bespoke-natural-gas-chp-analysis
Introduction
14
1. Introduction
Background to this study There are thought to be over 2,000 heat networks and communal heating schemes of various sizes in the UK serving 200,000 dwellings and 2,000 commercial and public buildings. 3 The largest heat network schemes are predominantly found in cities and on university campuses. There are also a large number of smaller schemes in the domestic sector, often linking communally heated blocks of flats. This extent of heat networks represents around 2% of the domestic, public sector, and commercial buildings heat demand. Benefits from the increased use of heat networks could include energy cost and Carbon Dioxide (CO2) emissions reductions for the UK, through allowing the exploitation of lower CO2 and higher efficiency forms of energy generation including the use of CHP, biomass, heat pumps, waste heat and low grade heat sources. DECC’s response to consultation in December 2013 suggested that heat networks will be part of a future RHI policy review. In order to inform how this may be developed, DECC identified the need for additional evidence to better understand the costs and performance of heat networks before policy options can be assessed.
Purpose of this project The key aim of this project is to provide evidence-based knowledge on costs of heat networks, as well as on their performance and characteristics to support the evaluation of policy options involving heat networks. This would address the information gap identified by DECC. This work has focused on the gathering of robust data and evidence to enhance the understanding of typical mixed residential and commercial heat networks in the UK. To this end, this work has collected data on characteristics, performance and cost of several major existing heat networks in the UK at a high disaggregated level of detail to allow for an analysis and identification of the main impact variables affecting the performance and financial viability of heat networks, as well as to evaluate sensitivities. In addition, and to aid the understanding of and eliminate any potential bias and gaming in the data obtained, several hypothetical schemes were also studied. This part of the work focused on the gathering and close analysis of a sample of published feasibility studies produced to develop heat networks’ schemes. Finally, to enhance the robustness of the findings, additional information was collected via an online survey to stakeholders.
3 The Summary Evidence on District Heating Networks in the UK. DECC, 2013 paper identified 1,765 heat networks but DECC believe this figure to be nearer to 2,000. The nature of the heat network market means that there are no robust datasets collating information on all networks. https://www.gov.uk/government/uploads/system/uploads/attachment_data/file/212565/summary_evidence_district_heating_networks_uk.pdf.

15
Scope of this report The primary output from this study is a dataset of infrastructure cost and performance characteristics for a range of heat networks. This report provides an overview of the data collection undertaken and details of the cost and performance data received. The analysis and outputs presented in this report examine only the heat network infrastructure, which takes heat from a thermal source, and delivers it to customers. The analysis does not include the thermal sources and associated buildings and infrastructure, neither does it include the customer’s own heating systems. Additional data has been collected as part of this work relating to complete heat network schemes including the heat source, and operation costs. This additional data is not presented in this study, but is referred to in the methodology sections. This data has been collected for future analysis by DECC.
Confidentiality The data collected by AECOM for this work includes a large amount of commercially sensitive information. All descriptions and results in this report are anonymous and individual schemes are not identifiable. For this reason, the schemes are characterised by ranges, and all financial information is normalised based on annual heat sales and other metrics.
The project team This project was led by AECOM, and supported by Sweett Group for the purposes of cost benchmarking and verification.
Data capture methodology
16
2. Data capture methodology
Outline approach A list of data requirements was prepared and agreed with DECC to form the basis of the data collection. This comprised those variables relating to the performance and costs of heat networks. The data collection was separated into three complementary data gathering exercises carried out in parallel with the aim to obtain accurate and completed sets of broken down data on cost, performance and other characteristics. These consisted of:
• An in-depth questionnaire sent to stakeholders with information on a selection of existing heat network schemes considered to be representative of the main types of networks in the UK. This was subsequently followed up by further engagement to look to clarify information provided and fill-in data gaps;;
• Identification and examination of hypothetical schemes taken from feasibility studies, deemed representative of current and future heat network developments;;
• An on-line survey addressed to a wide range of stakeholders involved in different aspects of heat networks with a view to obtain additional and/or complementary information. The aim of collecting this data was to provide additional information for benchmarking the existing schemes and feasibility studies, and to further inform DECC’s evidence base on heat networks’ cost and performance.
The following sections describe each of these data gathering exercises in further detail.
Data collection Selecting schemes A selection of 14 existing heat network schemes considered to be representative of schemes in the UK were identified via a process which included a pre-selection of potentially relevant schemes extracted from AECOM’s heat networks database. These schemes were extracted according to:
• Sector: to identify Mixed Residential and Commercial schemes;;
• Age: to concentrate on schemes recently completed but with at least one year in operation;;
• Size: to select large or medium/large schemes (of over 500 dwellings/units connected with a preference for over 1,000 connections);;
• Management / Ownership / Operation: to identify well established organisations who would be more likely to be able to provide complete, good quality data on the different aspects of the schemes (performance, characteristics and costs).
17
A final selection of schemes was made by experts from both AECOM and DECC, which included other considerations such as successful implementation and level of performance. This was to ensure that the data from the schemes would represent a successful and deliverable scheme. In general, the existing schemes selected were based around gas fired CHP, due to the prevalence of these types of schemes at this scale. Energy from waste schemes were also identified and included in the initial data capture process. For the purposes of this report, only the heat network’s characteristics are of interest and information collected on the energy sources is not included in the analysis.
Statistical background The selection of 14 heat networks limits the extent to which detailed statistical analysis could be conducted on the received datasets. This was impacted further by only receiving suitable data from 7 of the 14 schemes. However the study team and steering group believe that the schemes from which data was obtained represent a suitable sample for the analysis of future UK heat networks. Research by Databuild for DECC in 2013 identified 1,765 heat networks in the UK4. However out of these 1,765 networks, only 75 are classified as large (over 500 homes or 10 non-domestic buildings), and these are the scale of network of interest to this study. Of the large networks, around half are identified as sourcing heat from CHP (20 networks have uncertain sources of heat), and two-thirds use gas as the main fuel source. In addition, around 70% of the large networks were developed before 1990. The Databuild research therefore demonstrates that although there are a large number of heat networks in the UK, only a small number of these are at a significant scale, and of these, a majority source their heat from CHP and / or natural gas. The age profile suggests that most of the large networks will also have less accessible data on initial capital costs, and so be less useful for cost data collection. In light of the Databuild research, the targeted sample of 14 networks is considered to be a good representative sample of heat networks systems envisaged applicable for large-scale deployment. It is important to note that this study has identified the lack of collection and coordination of data on schemes by operators and developers. In general, there is little historic information available, and other data is fragmented between a range of stakeholders. Even for recent schemes where it would be expected that sufficient data would be available, incomplete datasets were received and the data collection process was not simple. The state of the industry therefore means that large samples of consistent data which may be used for statistical analysis are not easily accessible and/or available, and this study provides the most comprehensive dataset available to date.
Collecting data Representatives of these schemes were approached with an introduction to the research and to explain the requirements for information and data collection procedures. A questionnaire was then sent to each of these representatives requesting detailed information on the schemes. Following subsequent discussions with some of the stakeholders about the level of detail being requested, a shortened summary questionnaire was prepared and issued which required fewer resources to complete.
4 See footnote Error! Bookmark not defined..
Data capture methodology
18
The data capture process was conducted through a combination of e-mailed responses to the questionnaires, follow up phone calls, and data gathering meetings held between AECOM and the stakeholders. A total of eight questionnaires were returned, and following an assessment of the data quality and completeness, seven were deemed suitable for inclusion in the analysis. One scheme excluded could not provide essential information due to commercial reasons and therefore this scheme was excluded from the analysis. Following subsequent data evaluation for completeness and quality, additional one to one contacts were made with participants for the following purposes:
• To clarify information, confirm validity of suspect data and correct inaccurate data (e.g. wrong units or incorrectly entered numbers). This data cleansing exercise enabled further clarification of certain results obtained, and enhanced the overall level of data quality obtained.
• To supply missing data. This enhanced the overall data quantity obtained.
Feasibility studies In parallel to the data from existing schemes, a number of feasibility studies were identified from different sources and detailed data similar to that requested for the existing schemes was extracted from seven of them. One scheme was then excluded from the seven due to an absence of information relating to size of heat demand preventing the economic model from being constructed. The use of data from feasibility studies has the following benefits:
• By using recent studies, the costs are current and allows for benchmarking and quality checking of the existing schemes where cost information may be missing or out-of-date;;
• Feasibility studies are generally ‘complete’ and include all cost elements to allow a full economic evaluation to be constructed. In existing schemes, the operational structures can mean that not all costs are available or easily attributable (see later);;
• The feasibility studies identified were by parties deemed independent of the schemes. Therefore the scope for bias and gaming should be removed. This allows the data extracted to be used to cross-check the data from existing schemes;;
• The costs in feasibility studies are generally hypothetical and do not reflect costs associated with specific difficulties (for example installation problems) of real schemes. They are therefore more appropriate for developing economic models of generic schemes.
Whilst the data from feasibility studies offer a number of benefits, the data is generally of a more aggregated nature due to lack of detailed information for costing, and therefore is less useful for detailed analysis.
Online survey An online survey was conducted in addition to the data collection from existing schemes and feasibility studies. This was used to collect information covering a wide range of cost and performance parameters from heat network schemes, the operational requirements, and individual items of equipment. The survey was publicised and distributed amongst members of
19
the CHPA5, UKDEA and the urban energy Vanguards Network. In addition, the survey was sent directly to additional stakeholders identified and other AECOM contacts by targeted email. The aim of the survey was not to collect complete datasets describing operational heat network schemes, but to obtain information on different components and elements of heat network schemes to allow comparisons and benchmarking to be conducted. Ten responses were received from participants ranging from energy services companies and scheme operators, to individual component manufacturers. Information on 14 heat network schemes was provided with 4 of these believed to be schemes located outside the UK. The information obtained on schemes was generally not complete, but useful data was extracted to complement benchmarking and the existing scheme and feasibility studies datasets (e.g. information on heat demands served and energy centres characteristics and cost).
Scope of data collection A heat network scheme comprises a number of elements. These can principally be broken down into:
• Heat generation plant
• Distribution network
• Customer connections and customer distribution
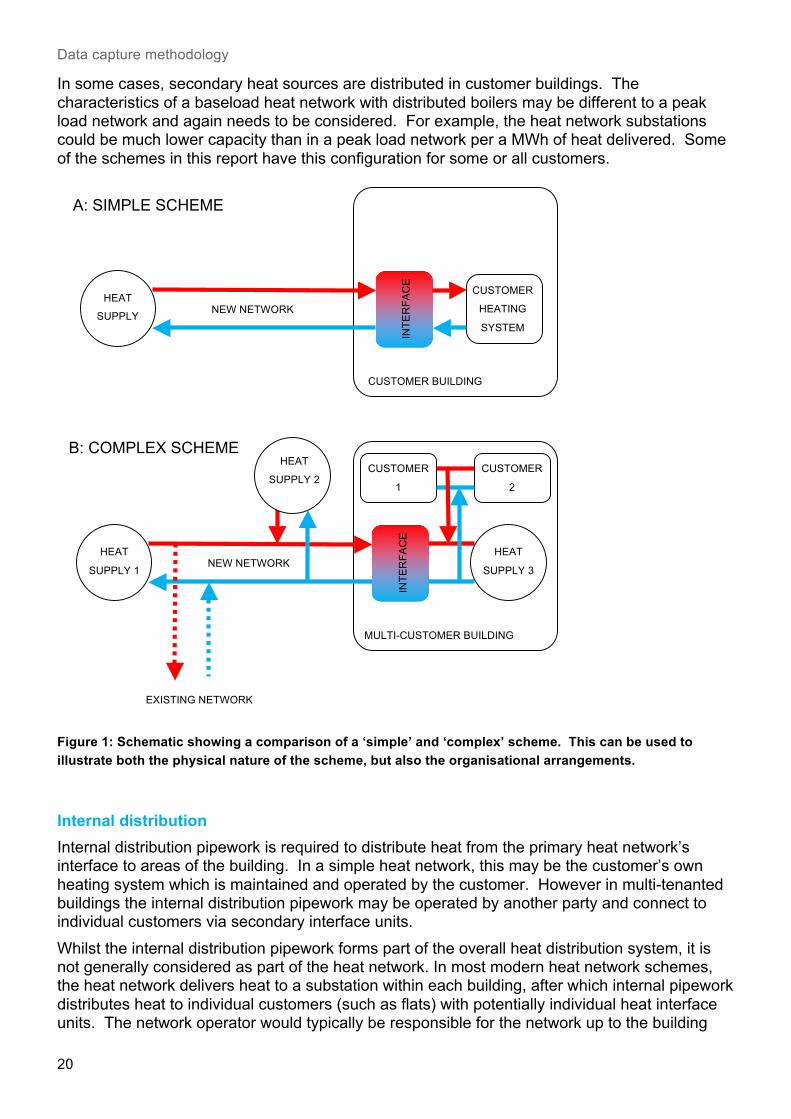
Simplistically, the sale of heat therefore includes the cost of generating the heat, the cost of distribution the heat, and the cost of connecting to the customer. After the point of connection, the customer is responsible for the remaining costs. In reality, the structure of schemes can be more complex with potentially multiple heat sources, and multiple levels of customer connection. In addition, there can be a number of organisations involved with the ownership and operation of the scheme. The following sections describe some of these complexities alongside Figure 1. These are important to consider when interpreting data collected from schemes.
Heat supply plant This report aims to examine heat network components and therefore is not directly concerned with the characteristics of the heat supply plant. However it is important to understand the boundaries of the network in relation to the heat supply plant to ensure that the relevant heat network costs are included. In a simple scheme, all heat supply plant may be in the form of an energy centre and may be operated by a single organisation (the scheme operator) in combination with the heat network. The energy centre which contains the heat supply plant may also contain heat network ancillary components such as pressurisation equipment, water treatment plant and a thermal store. With common ownership, it should be possible to obtain the costs and performance of these heat network components separately to the heat supply plant. In a more complex scheme where there may be multiple organisations and / or energy centres, the heat network components may be dispersed. For example one organisation may be responsible for the heat network pipework, whilst another may be responsible for the ancillary heat network components. It is therefore important to understand what is included in the data provided by respondents.
5 The CHPA has recently renamed itself as the Association for Decentralised Energy (ADE).
Data capture methodology
20
In some cases, secondary heat sources are distributed in customer buildings. The characteristics of a baseload heat network with distributed boilers may be different to a peak load network and again needs to be considered. For example, the heat network substations could be much lower capacity than in a peak load network per a MWh of heat delivered. Some of the schemes in this report have this configuration for some or all customers.
Figure 1: Schematic showing a comparison of a ‘simple’ and ‘complex’ scheme. This can be used to illustrate both the physical nature of the scheme, but also the organisational arrangements.
Internal distribution Internal distribution pipework is required to distribute heat from the primary heat network’s interface to areas of the building. In a simple heat network, this may be the customer’s own heating system which is maintained and operated by the customer. However in multi-tenanted buildings the internal distribution pipework may be operated by another party and connect to individual customers via secondary interface units. Whilst the internal distribution pipework forms part of the overall heat distribution system, it is not generally considered as part of the heat network. In most modern heat network schemes, the heat network delivers heat to a substation within each building, after which internal pipework distributes heat to individual customers (such as flats) with potentially individual heat interface units. The network operator would typically be responsible for the network up to the building
CUSTOMER BUILDING
HEAT
SUPPLY NEW NETWORK
CUSTOMER
HEATING
SYSTEM
A: SIMPLE SCHEME
INTERFACE
MULTI-CUSTOMER BUILDING
NEW NETWORK
EXISTING NETWORK
CUSTOMER
1
CUSTOMER
2
HEAT
SUPPLY 1
HEAT
SUPPLY 2
HEAT
SUPPLY 3
B: COMPLEX SCHEME
INTERFACE
21
and the heat substation, and a third party (such as a social landlord or a management company) would be responsible for the internal pipework. The data in this report presents heat networks as two types based on the scope of the scheme covered by the data provided:
• Bulk heat supply schemes. These provide heat and sell in bulk to multiple customers, such as a block of flats. Another body is responsible for distribution and sales to individual customers.
• Non-bulk schemes. These include distribution and sales to individual customers. It is possible that some schemes included in this report classified as ‘Bulk’ also include extensive secondary internal pipework for distribution to individual customers, and are therefore effectively ‘Non Bulk’. However they are treated as Bulk for this report due to the data provided only covering the Bulk elements of the scheme.
Heat network schemes evolvement and history Due to the complex nature of heat network schemes and the need for large scale investment, heat networks have often developed in a phased process. This means that investment may have taken place over a number of years by a number of parties. It is also possible that existing individual schemes have amalgamated including the connection of individual communally heated blocks. The result of this is that an operational heat network scheme may include components which were developed for another purpose, and which have been effectively paid off during their lifetime. One example is a scheme which has adopted and extended an existing heat network. This means that the economic models for some existing heat network schemes may be very different to new schemes. For example, some existing schemes may be financially viable due to historic investment and adoption of infrastructure, whilst the same scheme as a new build without these historical benefits may be unviable. It is therefore important to understand that the economic characteristics of heat networks when used in an economic model may not be representative of existing schemes performance. It can be argued that some existing heat network schemes in the UK have benefited from some form of grant, whether though direct financial grants, adoption of existing infrastructure, cross subsidies from energy generation, or historic investment pay-off, and that this could be seen to distort the realistic economic performance of heat network schemes in the UK in absence of support mechanisms. In this study, all capital costs of components which form part of the heat network are included where possible. Despite their costs not featuring in particular schemes, they are a required component and as such should be accounted for to understand the characteristics of heat networks.
Data checking and verification AECOM and Sweett Group have conducted a data checking process on the datasets received, to ensure that the resulting financial models are correct. This data checking process included:
• Basic checking of data formats and units to ensure that questionnaires have been correctly interpreted and completed.
• Follow up questions with data providers where information is missing or identified as potentially erroneous.
• Simple checks on data to check for consistency within schemes. For example:
Data capture methodology
22
• Checking that the total heat sales plus heat losses on the network equal the total heat production.
• Assessing efficiencies from fuel consumption and heat and electricity outputs.
• Checking for consistency in data between heat network schemes, including using information from the feasibility studies and on-line survey responses. This was partially conducted through a process of benchmarking, some outputs of which are described in section 3.
• Cross referencing performance data provided by schemes with existing AECOM experience of heat network schemes and best practice performance.
• Cross checking capital cost information with data from a range of other schemes within the Sweett Group experience.
This process identified a number of potential errors or areas of uncertainty which have been resolved. However, it is important to note that whilst the authors have conducted the data checking process, this study is fundamentally reliant on the quality of information provided by external stakeholders.
Cost data All capital costs are presented as 2013/14 prices. For heat network schemes where capital cost information is one or more years prior to this, the RICS Building Cost Information Service (BCIS) General Building Cost Index has been used to provide an uplift to the capital cost data.
Identifying gaming and bias Due to the use of the information from this study to inform future policy analysis, there is a risk of gaming and bias from the data providers. This risk is most likely from commercial organisations rather than public sector heat network scheme operators. The data checking and verification process has been used to identify where this may be a factor, and in the datasets received, no obvious instances of gaming or bias were identified (although this does not rule out the potential). It is important to recognise that due to the relatively limited number of schemes data has been received from, and the range of schemes, it is not possible to conduct robust statistical analysis. In addition to the checking and verification process, the disaggregated level of data requested and inability of data providers to see the impact of data inputs when providing data, means that the potential for gaming is limited. AECOM were actively involved in the collation of data with the operators of some schemes, including having access to the operators’ datasets and models, and through this process observed no instances of where gaming or bias was obviously introduced or where the opportunity had arisen for introduction.
23
3. Description of data captured
Introduction This section provides an overview of the data captured, and characterisation of the heat networks identified. Outputs from the benchmarking exercise are shown which were used to cross check data and assist with gap analysis. The data presented in this section follows the comprehensive data collection and checking process, which included the surveys and substantial follow up including interviews and meetings. As previously described in this report, there is a clear lack of data collection and coordination within the industry, and the analysis presented here is considered to be the most comprehensive dataset describing heat networks in the UK currently available.
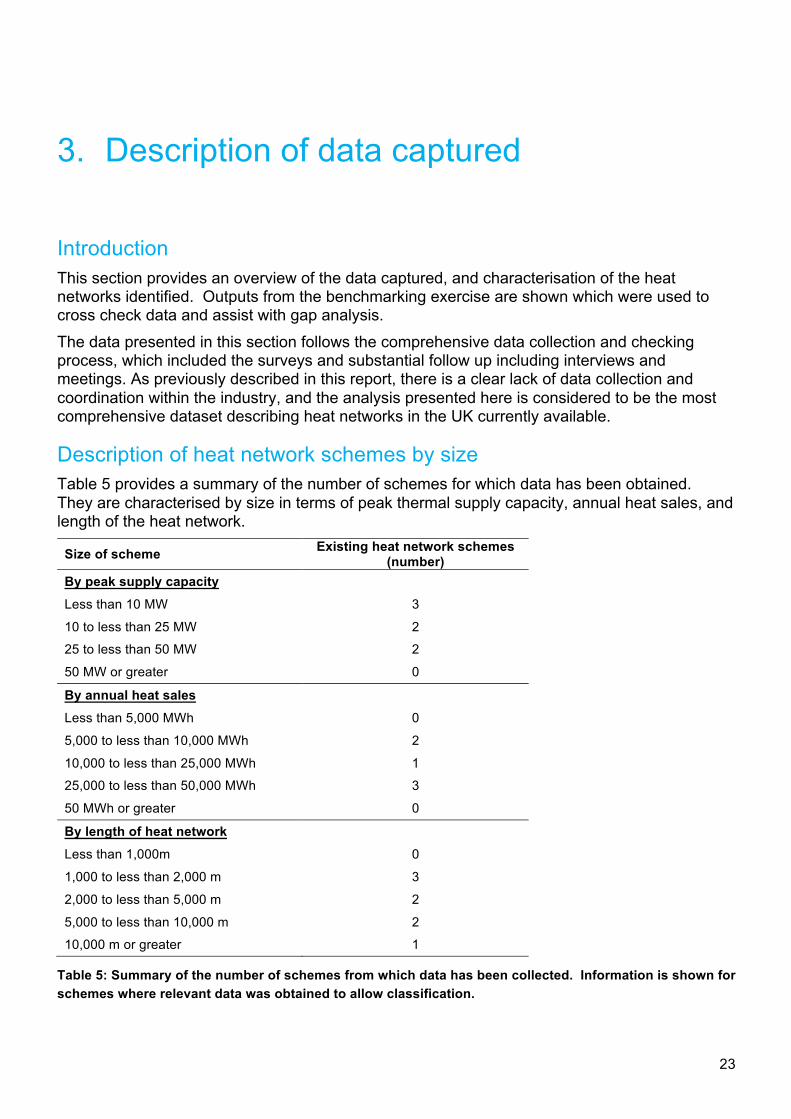
Description of heat network schemes by size Table 5 provides a summary of the number of schemes for which data has been obtained. They are characterised by size in terms of peak thermal supply capacity, annual heat sales, and length of the heat network.
Size of scheme Existing heat network schemes (number)
By peak supply capacity Less than 10 MW 3
10 to less than 25 MW 2
25 to less than 50 MW 2
50 MW or greater 0
By annual heat sales Less than 5,000 MWh 0
5,000 to less than 10,000 MWh 2
10,000 to less than 25,000 MWh 1
25,000 to less than 50,000 MWh 3
50 MWh or greater 0
By length of heat network Less than 1,000m 0
1,000 to less than 2,000 m 3
2,000 to less than 5,000 m 2
5,000 to less than 10,000 m 2
10,000 m or greater 1
Table 5: Summary of the number of schemes from which data has been collected. Information is shown for schemes where relevant data was obtained to allow classification.
Description of data captured
24
Description of heat network schemes by delivery type For the purpose of this study, and to identify any potential specific traits and differences, heat networks were differentiated between Bulk and Non Bulk. Bulk heat networks are defined as those where the main scheme operators deliver heat in a bulk basis to a major distribution point connections but who do not have responsibility for final delivery to the end customers. Non Bulk schemes are those where the operator or manager of the scheme is responsible for final delivery to the individual customer (each dwelling or flat). In identifying differences between Bulk and Non Bulk schemes, a possible rationale for such differences is presented. It is possible that differences in results between the Bulk and Non Bulk schemes are an artefact of the low sample size rather than representing actual differences.
Typical benchmark assessment The following sections provide ‘typical’ benchmark outputs from analysis of the data collected. Due to the significant amount of data collected from across the schemes, it is possible for benchmarks to be formed in a range of ways, using different normalisation factors, and levels of aggregation. The following sections provide some of the main benchmarks identified, but further analysis of the data could be conducted for more in-depth analysis. The ‘typical’ benchmarks are created from mean averages of data from across the schemes. Where data is considered as inconsistent, for example an outlier, or missing, the data from the scheme for the particular benchmark is not included in the average calculation. This means that data from different schemes may be used to form the different benchmarks. Benchmark information is shown for the existing heat networks from which data was collected. As described in the methodology, data has also been collected from feasibility studies and from an online survey. This additional data was helpful to cross check and verify the information collected from the existing heat networks. However, the data from the feasibility studies and online survey data was not sufficiently disaggregated or complete to be directly included within the typical benchmark analysis, and this data is not presented in this report. It should be noted that all of the following analysis is based on a small dataset as previously explained which may explain some of the differences identified. Use of the typical benchmark values The typical benchmark values presented in the following sections can be used to understand the costs and performance of existing heat networks in the UK. In theory they can be used to construct hypothetical heat networks based on some simple input parameters, such as annual heat demand from customers. When using these values, it is important to consider the following:
• The values are based on a small sample of schemes and whilst efforts have been made to check the data and ensure its robustness, the statistical validity cannot be determined.
• In some cases where data was not available or deemed unreliable, the typical benchmark values are based on a smaller sub set of the 7 schemes. This means that if the typical benchmark values are taken for two or more metrics for use in analysis, they may not be consistent as derived from different existing schemes.

25
The following information is presented for each typical benchmark:
• Description / name
• Units
• Mean average across all existing schemes
• Mean average across Bulk supply and Non-Bulk supply schemes.
• Range of values split into Bulk supply and Non-Bulk supply.
• Number of schemes from which the values are calculated
The typical benchmarks are normalised using a number of metrics as shown by the units. For consistency, a complete set of cost typical benchmarks are provided normalised against annual customer (at individual customers or bulk supply point) heat demand (£ / MWh) to allow the analysis of network costs based on heat demand. A description of the metrics used in the cost and performance tables is provided in Appendix A. Performance typical benchmarks The outputs from benchmarking performance metrics are shown in Table 6. Particular points are noted:
• The seasonal heat load factor is generally higher for bulk heat networks than non-bulk heat networks. This is potentially due to the former providing base-load heat with the peak capacity figures provided including some diversity, whilst for the non-bulk schemes, the peak demands are based on customer connections and therefore include less or no diversity.
• Distribution losses range widely with averages of 6% and 28% respectively for the bulk and non-bulk heat networks. The losses for the bulk schemes are in line with the common understanding that losses for heat networks are around 10% or less. The losses for the non-bulk schemes are significant with one scheme at 43%. The data collected for this report cannot accurately attribute these high losses, but it is believed they occur due to thermal losses in internal pipework within buildings, which is not always insulated to the same standards as the buried heat network pipes. The kWh / m metric is based on the length of the buried network, and shows losses orders of magnitude higher for the non-bulk schemes. It is unlikely that the buried network is an order of magnitude higher in terms of thermal loss, which indicates the internal pipework could be the cause. It may be possible to quantify these losses through examination of the heat output profiles and this could be conducted through further analysis of each scheme. Internal losses from communal heating systems in apartment blocks will occur irrespective of whether the building is connected to a heat network, and therefore whilst these losses need considering for heat network schemes, they should be considered a building services design and maintenance issue. Some of the heat loss from internal pipework will provide useful heat gains to buildings during the winter period but the heat loss may increase the risk of overheating in buildings during the summer months.
Description of data captured
26
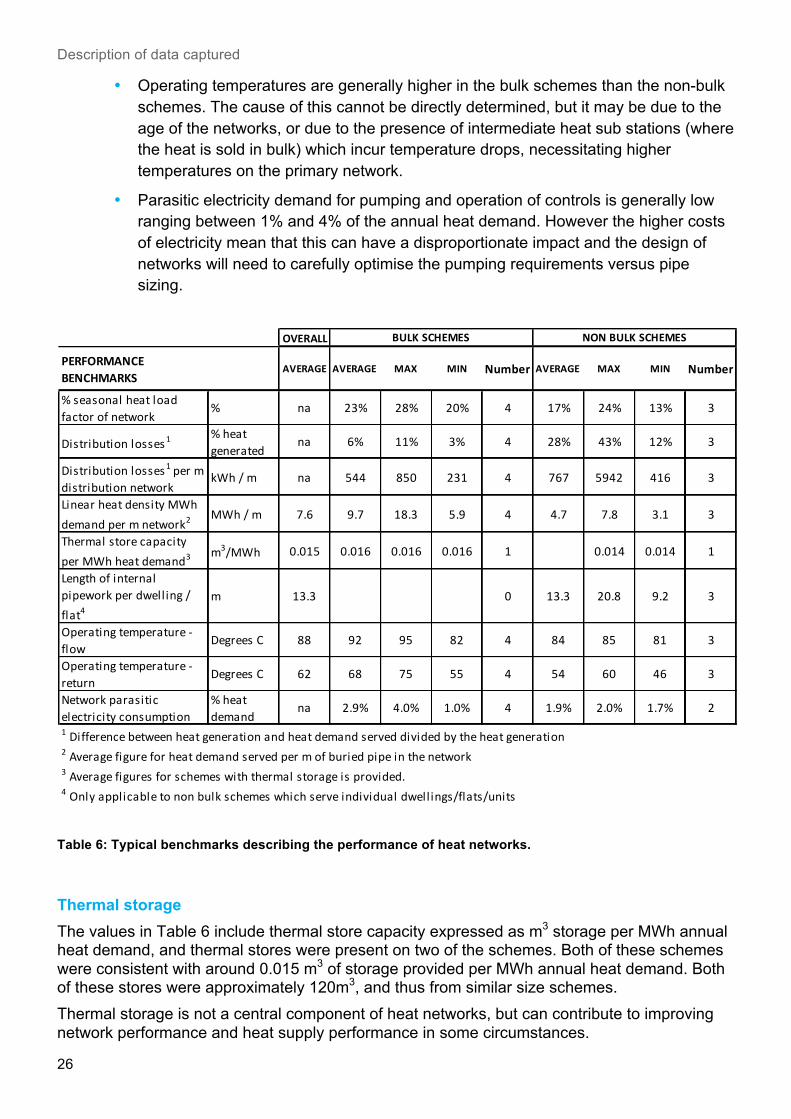
• Operating temperatures are generally higher in the bulk schemes than the non-bulk schemes. The cause of this cannot be directly determined, but it may be due to the age of the networks, or due to the presence of intermediate heat sub stations (where the heat is sold in bulk) which incur temperature drops, necessitating higher temperatures on the primary network.
• Parasitic electricity demand for pumping and operation of controls is generally low ranging between 1% and 4% of the annual heat demand. However the higher costs of electricity mean that this can have a disproportionate impact and the design of networks will need to carefully optimise the pumping requirements versus pipe sizing.
Table 6: Typical benchmarks describing the performance of heat networks.
Thermal storage The values in Table 6 include thermal store capacity expressed as m3 storage per MWh annual heat demand, and thermal stores were present on two of the schemes. Both of these schemes were consistent with around 0.015 m3 of storage provided per MWh annual heat demand. Both of these stores were approximately 120m3, and thus from similar size schemes. Thermal storage is not a central component of heat networks, but can contribute to improving network performance and heat supply performance in some circumstances.
OVERALL
PERFORMANCE BENCHMARKS
AVERAGE AVERAGE MAX MIN Number AVERAGE MAX MIN Number
% seasonal heat load factor of network
% na 23% 28% 20% 4 17% 24% 13% 3
Distribution losses1% heat generated
na 6% 11% 3% 4 28% 43% 12% 3
Distribution losses1 per m distribution network
kWh / m na 544 850 231 4 767 5942 416 3
Linear heat density MWh demand per m network2
MWh / m 7.6 9.7 18.3 5.9 4 4.7 7.8 3.1 3
Thermal store capacity per MWh heat demand3
m3/MWh 0.015 0.016 0.016 0.016 1 0.014 0.014 1
Length of internal pipework per dwelling / flat4
m 13.3 0 13.3 20.8 9.2 3
Operating temperature -‐ flow
Degrees C 88 92 95 82 4 84 85 81 3
Operating temperature -‐ return
Degrees C 62 68 75 55 4 54 60 46 3
Network parasitic electricity consumption
% heat demand
na 2.9% 4.0% 1.0% 4 1.9% 2.0% 1.7% 2
1 Difference between heat generation and heat demand served divided by the heat generation2 Average figure for heat demand served per m of buried pipe in the network3 Average figures for schemes with thermal storage is provided. 4 Only applicable to non bulk schemes which serve individual dwellings/flats/units
BULK SCHEMES NON BULK SCHEMES

27
Thermal storage helps to smooth the load profile, by providing a buffer between the heat supply plant and the building loads. This is particularly true of smaller schemes with a limited customer base, early phases of larger schemes where the heat plant may be initially oversized, and schemes where there is limited diversity. By charging and discharging the thermal store periodically, heat demand peaks can be reduced allowing the heat supply plant to be operated more consistently with less peak load plant (typically gas boilers), and at times when operation may be more economic. Thermal stores typically consist of large insulated water tanks, but the heat network itself could also be used though variable temperature regimes, or the thermal capacity and control systems within buildings could be exploited. The need for, and volume of, thermal storage depends on both the thermal loads and the heat source. Where the thermal capacity may be low cost or have no constraints on capacity compared with load (for example, extraction of heat from a large power station), then thermal storage may not be necessary. However when the thermal capacity may be expensive, and/or benefit from continuous operation (for example, gas CHP engines), or where the capacity may be constrained (such as a smaller waste heat source), then thermal storage can help improve the load profile and make best use of the heat source. The optimisation of the thermal store capacity will depend on a number of parameters which are scheme specific, and suitable data has not been collected as part of this study to allow a detailed analysis. When stakeholders with schemes with no thermal storage were questioned about the absence of stores, the response was often that the inclusion of stores would be preferable, but that spatial or planning limitations prevented their installation. The height of thermal stores means that they are better suited to external locations, and their appearance and height can be seen as unacceptable in some areas. The optimisation of thermal store capacity for one of the schemes with a store was discussed with the scheme owner. Far from being a technically refined process, the capacity was determined by (a) the height which was acceptable to the planners, and (b) the maximum diameter which could be easily delivered by road for a pre-constructed tank. The consensus based on the consultation and data provided therefore appears to be:
• The use of thermal storage is generally of benefit to schemes where it complements the heat source.
• The ability to install a thermal store can be severely limited by space requirements and external considerations such as planning acceptability.
• Where thermal stores are installed, the capacity may be determined by the desire to have as large a volume as possible subject to space requirements and external considerations, and not detailed technical optimisation.
It is suggested that DECC examine the use of thermal storage on heat network schemes in more detail to assess the importance it has on improving efficiency and financial performance. An outcome of this work could be to develop simple criteria which can be used to encourage that appropriate levels of storage are included in schemes, and support heat network developers in demonstrating the importance of thermal storage to other stakeholders such as local authority planning departments.
Description of data captured
28
Characterisation of thermal storage requires load profile modelling to be conducted including scheduling of heat supply plant6. It is often found that where storage is appropriate, the inclusion of any thermal storage, and increases in capacity up to an optimal size, results in large operational benefits which can outweigh the capital expenditure. Once the optimal size has been achieved, further increases in capacity have diminishing returns and become uneconomic. The aim of further work by DECC could be to examine the relation between the optimal capacity, and different load types, including sensitivity testing against variations in load profile, and heat supply characteristics.
Capital cost typical benchmarks The capital costs for heat networks are shown in
Table 7 (normalised to MWh annual heat demand) and
Table 8 (normalised to other metrics). All costs are indexed to 2013/14 prices as described in section 2. The costs of heat network connections and the heat network in
Table 7 are shown at both an aggregate (bold) and disaggregated (italics) level. It should be noted that the disaggregated costs may not add up to the aggregated cost, due to the inclusion of different schemes for each metric. For example, some schemes may have only provided information at an aggregate level, whilst others may only have provided some items at a disaggregated level. To allow comparison, the sum of disaggregated costs is also provided.
6 This modelling would typically be conducted on an hourly or half-hourly basis over a sample year/s.
29
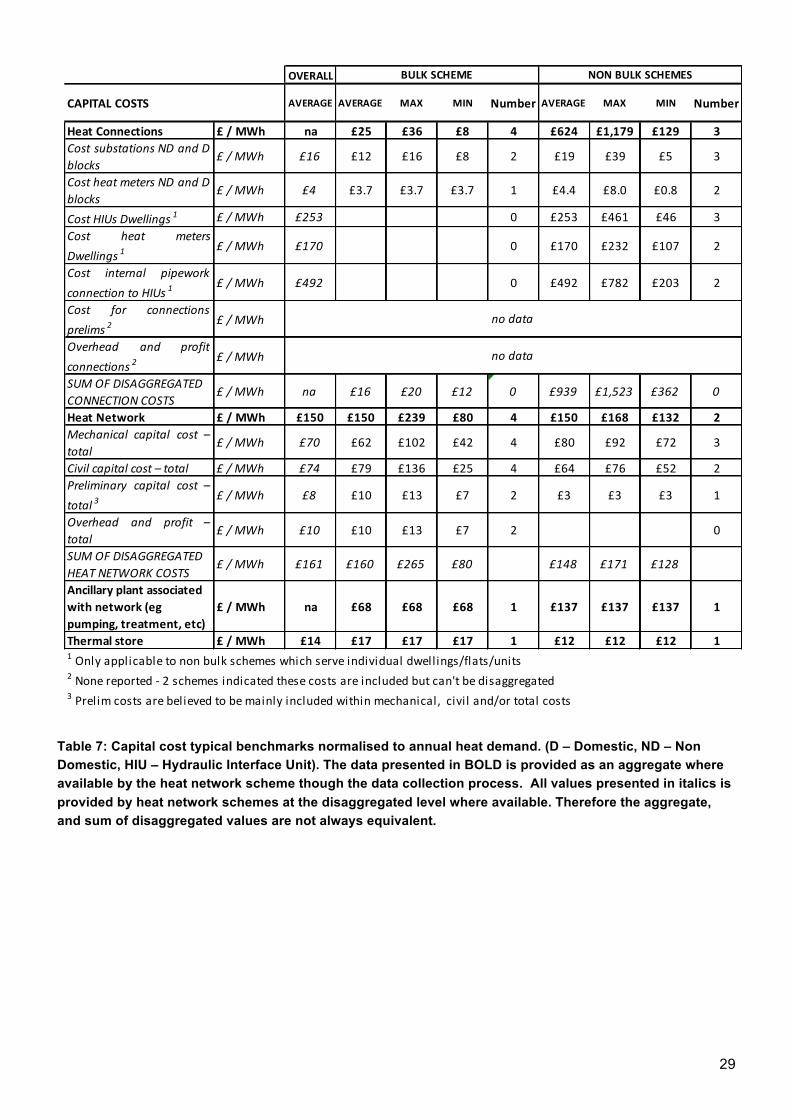
Table 7: Capital cost typical benchmarks normalised to annual heat demand. (D – Domestic, ND – Non Domestic, HIU – Hydraulic Interface Unit). The data presented in BOLD is provided as an aggregate where available by the heat network scheme though the data collection process. All values presented in italics is provided by heat network schemes at the disaggregated level where available. Therefore the aggregate, and sum of disaggregated values are not always equivalent.
OVERALL
CAPITAL COSTS AVERAGE AVERAGE MAX MIN Number AVERAGE MAX MIN Number
Heat Connections £ / MWh na £25 £36 £8 4 £624 £1,179 £129 3Cost substations ND and Dblocks
£ / MWh £16 £12 £16 £8 2 £19 £39 £5 3
Cost heat meters ND and Dblocks
£ / MWh £4 £3.7 £3.7 £3.7 1 £4.4 £8.0 £0.8 2
Cost HIUs Dwellings 1 £ / MWh £253 0 £253 £461 £46 3Cost heat metersDwellings 1
£ / MWh £170 0 £170 £232 £107 2
Cost internal pipeworkconnection to HIUs 1
£ / MWh £492 0 £492 £782 £203 2
Cost for connectionsprelims 2
£ / MWh
Overhead and profitconnections 2
£ / MWh
SUM OF DISAGGREGATED CONNECTION COSTS
£ / MWh na £16 £20 £12 0 £939 £1,523 £362 0
Heat Network £ / MWh £150 £150 £239 £80 4 £150 £168 £132 2Mechanical capital cost –total
£ / MWh £70 £62 £102 £42 4 £80 £92 £72 3
Civil capital cost – total £ / MWh £74 £79 £136 £25 4 £64 £76 £52 2Preliminary capital cost –total 3
£ / MWh £8 £10 £13 £7 2 £3 £3 £3 1
Overhead and profit –total
£ / MWh £10 £10 £13 £7 2 0
SUM OF DISAGGREGATED HEAT NETWORK COSTS
£ / MWh £161 £160 £265 £80 £148 £171 £128
Ancillary plant associated with network (eg pumping, treatment, etc)
£ / MWh na £68 £68 £68 1 £137 £137 £137 1
Thermal store £ / MWh £14 £17 £17 £17 1 £12 £12 £12 11 Only applicable to non bulk schemes which serve individual dwellings/flats/units2 None reported -‐ 2 schemes indicated these costs are included but can't be disaggregated3 Prelim costs are believed to be mainly included within mechanical, civil and/or total costs
BULK SCHEME NON BULK SCHEMES
no data
no data
Description of data captured
30
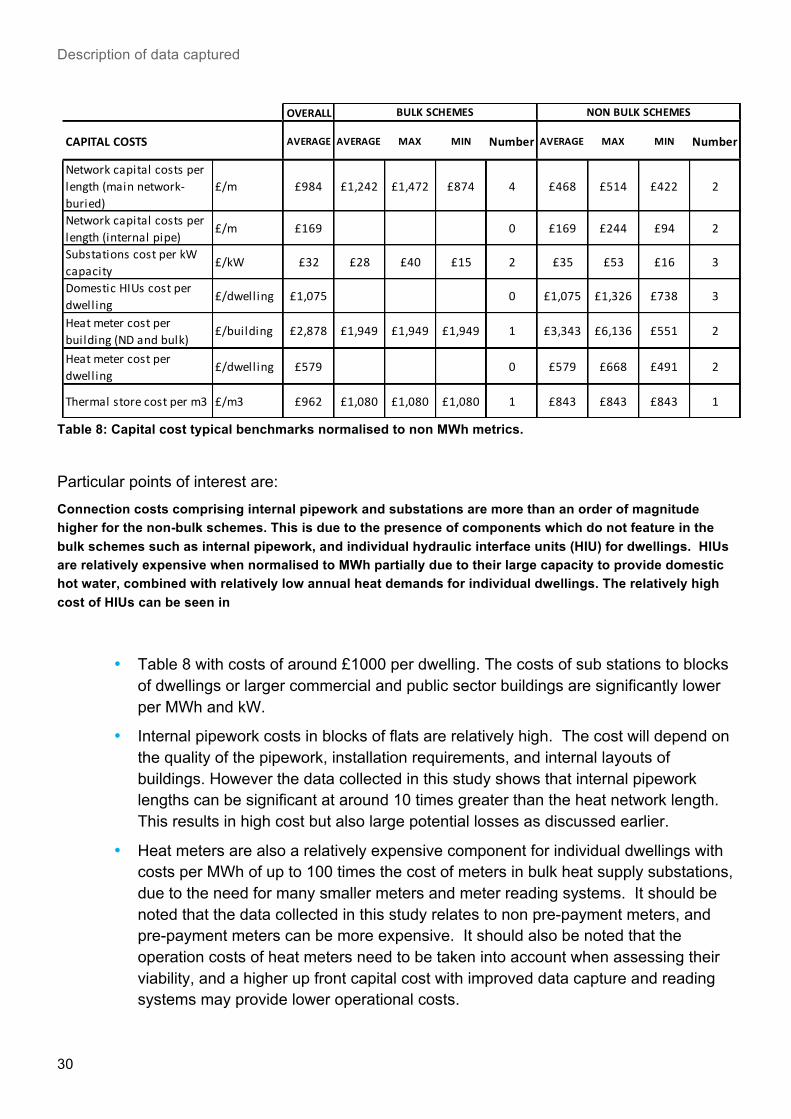
Table 8: Capital cost typical benchmarks normalised to non MWh metrics.
Particular points of interest are: Connection costs comprising internal pipework and substations are more than an order of magnitude higher for the non-bulk schemes. This is due to the presence of components which do not feature in the bulk schemes such as internal pipework, and individual hydraulic interface units (HIU) for dwellings. HIUs are relatively expensive when normalised to MWh partially due to their large capacity to provide domestic hot water, combined with relatively low annual heat demands for individual dwellings. The relatively high cost of HIUs can be seen in
• Table 8 with costs of around £1000 per dwelling. The costs of sub stations to blocks of dwellings or larger commercial and public sector buildings are significantly lower per MWh and kW.
• Internal pipework costs in blocks of flats are relatively high. The cost will depend on the quality of the pipework, installation requirements, and internal layouts of buildings. However the data collected in this study shows that internal pipework lengths can be significant at around 10 times greater than the heat network length. This results in high cost but also large potential losses as discussed earlier.
• Heat meters are also a relatively expensive component for individual dwellings with costs per MWh of up to 100 times the cost of meters in bulk heat supply substations, due to the need for many smaller meters and meter reading systems. It should be noted that the data collected in this study relates to non pre-payment meters, and pre-payment meters can be more expensive. It should also be noted that the operation costs of heat meters need to be taken into account when assessing their viability, and a higher up front capital cost with improved data capture and reading systems may provide lower operational costs.
OVERALL
CAPITAL COSTS AVERAGE AVERAGE MAX MIN Number AVERAGE MAX MIN Number
Network capital costs per length (main network-‐buried)
£/m £984 £1,242 £1,472 £874 4 £468 £514 £422 2
Network capital costs per length (internal pipe)
£/m £169 0 £169 £244 £94 2
Substations cost per kW capacity
£/kW £32 £28 £40 £15 2 £35 £53 £16 3
Domestic HIUs cost per dwelling
£/dwelling £1,075 0 £1,075 £1,326 £738 3
Heat meter cost per building (ND and bulk)
£/building £2,878 £1,949 £1,949 £1,949 1 £3,343 £6,136 £551 2
Heat meter cost per dwelling
£/dwelling £579 0 £579 £668 £491 2
Thermal store cost per m3 £/m3 £962 £1,080 £1,080 £1,080 1 £843 £843 £843 1
BULK SCHEMES NON BULK SCHEMES
31
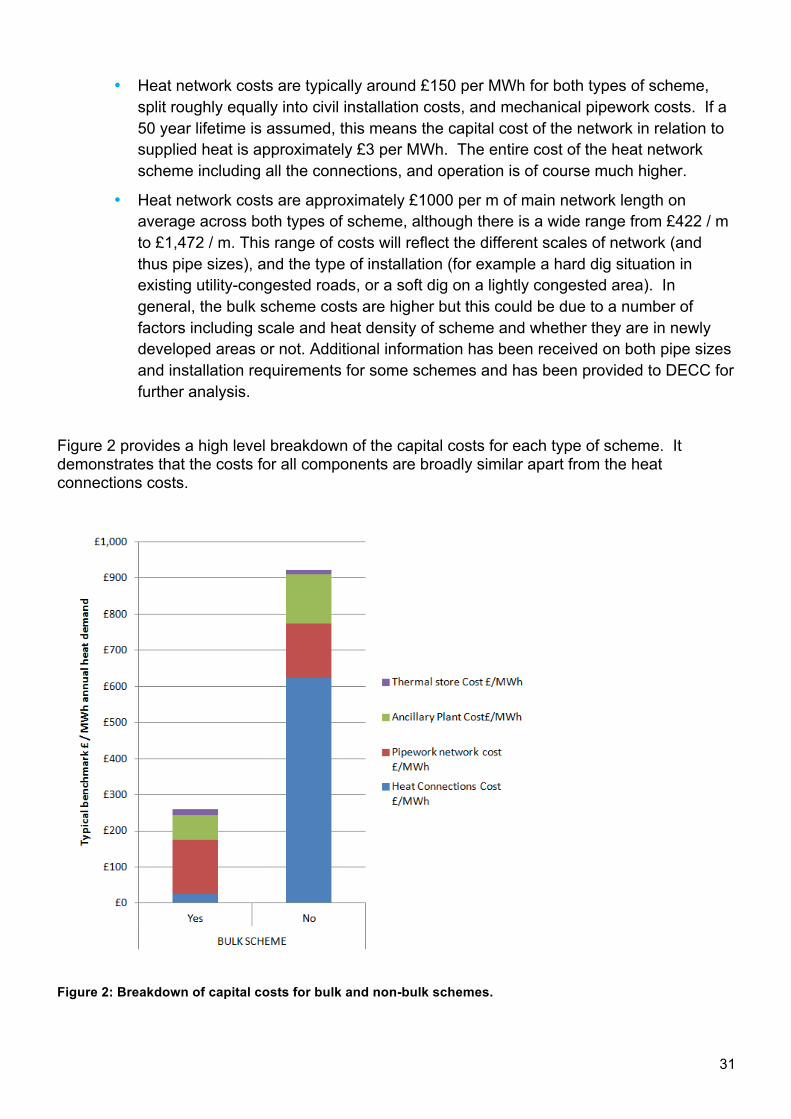
• Heat network costs are typically around £150 per MWh for both types of scheme, split roughly equally into civil installation costs, and mechanical pipework costs. If a 50 year lifetime is assumed, this means the capital cost of the network in relation to supplied heat is approximately £3 per MWh. The entire cost of the heat network scheme including all the connections, and operation is of course much higher.
• Heat network costs are approximately £1000 per m of main network length on average across both types of scheme, although there is a wide range from £422 / m to £1,472 / m. This range of costs will reflect the different scales of network (and thus pipe sizes), and the type of installation (for example a hard dig situation in existing utility-congested roads, or a soft dig on a lightly congested area). In general, the bulk scheme costs are higher but this could be due to a number of factors including scale and heat density of scheme and whether they are in newly developed areas or not. Additional information has been received on both pipe sizes and installation requirements for some schemes and has been provided to DECC for further analysis.
Figure 2 provides a high level breakdown of the capital costs for each type of scheme. It demonstrates that the costs for all components are broadly similar apart from the heat connections costs.
Figure 2: Breakdown of capital costs for bulk and non-bulk schemes.

Description of data captured
32
Operational cost benchmarks Information has also been obtained on operation costs as shown in Table 9. In general, the operation cost associated with the heat network itself, rather than the associated heat supply plant and energy centre buildings, is low. Operation cost data directly associated with the heat network was hard to obtain from operators and in many cases no information was available. The following points were noted from the data capture process:
• Where information was available, it was often a simple estimate or nominal amount.
• The heat network direct operation costs are often not itemised in annual budgets or forecasts, suggesting they are low and not of importance.
• A common response was that these costs are not itemised, and feature as part of wider overheads. For example, a maintenance engineer may not allocate time to a particular network or component, and is funded more centrally.
From the data obtained, maintenance costs for the heat network appear to be negligible and unlikely to impact on the economic performance. It should be noted that where data was available, it generally related to routine maintenance, and it is possible that networks are operated on a responsive maintenance regime. The highest maintenance costs appear to be related to domestic HIU units and heat meters, although the range for both was large, and the sample small. Metering and billing costs also had a large range and these are likely to be heavily influenced by the organisational structure for conducting these services. For example they may be conducted in house along with other billing services, or they may be externally contracted. The costs also will depend on the type of meter reading system available. Business rates were also identified as an operation cost. It is not clear whether these relate to the heat network itself, or associated energy centre buildings or operation buildings. The eligibility of heat network schemes for business rates partially depends on the nature of the customers and location of the energy centre building and therefore there may be variation across schemes7.
7 Valuation Office Agency Rating Manual Section 340: District Heating Undertakings.
33
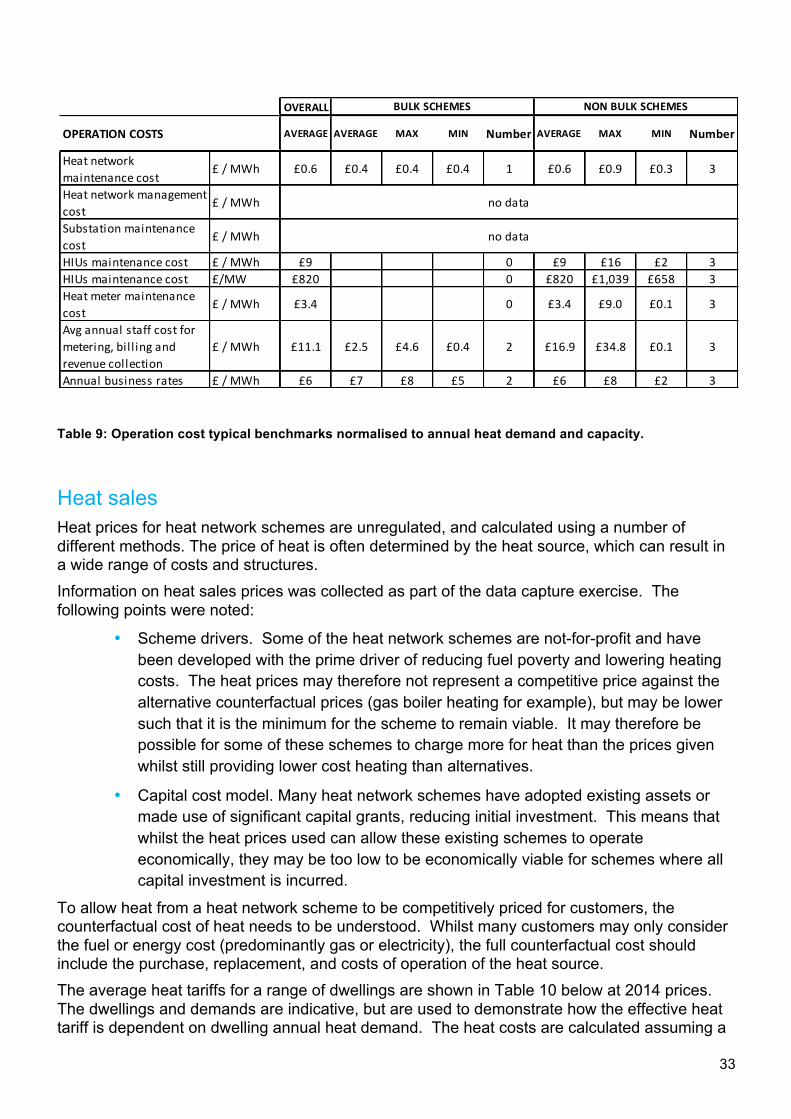
Table 9: Operation cost typical benchmarks normalised to annual heat demand and capacity.
Heat sales Heat prices for heat network schemes are unregulated, and calculated using a number of different methods. The price of heat is often determined by the heat source, which can result in a wide range of costs and structures. Information on heat sales prices was collected as part of the data capture exercise. The following points were noted:
• Scheme drivers. Some of the heat network schemes are not-for-profit and have been developed with the prime driver of reducing fuel poverty and lowering heating costs. The heat prices may therefore not represent a competitive price against the alternative counterfactual prices (gas boiler heating for example), but may be lower such that it is the minimum for the scheme to remain viable. It may therefore be possible for some of these schemes to charge more for heat than the prices given whilst still providing lower cost heating than alternatives.
• Capital cost model. Many heat network schemes have adopted existing assets or made use of significant capital grants, reducing initial investment. This means that whilst the heat prices used can allow these existing schemes to operate economically, they may be too low to be economically viable for schemes where all capital investment is incurred.
To allow heat from a heat network scheme to be competitively priced for customers, the counterfactual cost of heat needs to be understood. Whilst many customers may only consider the fuel or energy cost (predominantly gas or electricity), the full counterfactual cost should include the purchase, replacement, and costs of operation of the heat source. The average heat tariffs for a range of dwellings are shown in Table 10 below at 2014 prices. The dwellings and demands are indicative, but are used to demonstrate how the effective heat tariff is dependent on dwelling annual heat demand. The heat costs are calculated assuming a
OVERALL
OPERATION COSTS AVERAGE AVERAGE MAX MIN Number AVERAGE MAX MIN Number
Heat network maintenance cost
£ / MWh £0.6 £0.4 £0.4 £0.4 1 £0.6 £0.9 £0.3 3
Heat network management cost
£ / MWh
Substation maintenance cost
£ / MWh
HIUs maintenance cost £ / MWh £9 0 £9 £16 £2 3HIUs maintenance cost £/MW £820 0 £820 £1,039 £658 3Heat meter maintenance cost
£ / MWh £3.4 0 £3.4 £9.0 £0.1 3
Avg annual staff cost for metering, bil l ing and revenue collection
£ / MWh £11.1 £2.5 £4.6 £0.4 2 £16.9 £34.8 £0.1 3
Annual business rates £ / MWh £6 £7 £8 £5 2 £6 £8 £2 3
BULK SCHEMES NON BULK SCHEMES
no data
no data

Description of data captured
34
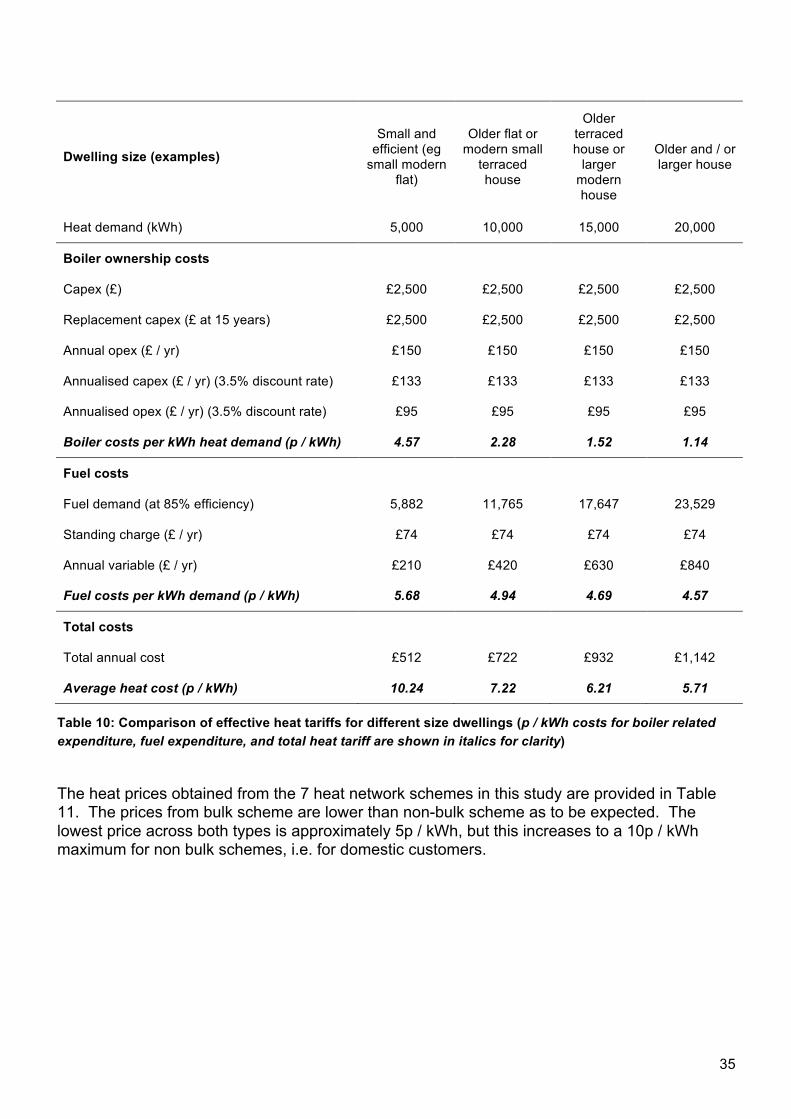
30 year lifecycle, with a 15-year boiler replacement, and costs typical of current capital costs and annual service costs8. The fuel costs are averages taken from the five large UK energy suppliers offering gas-only tariffs assuming standard variable rates and monthly direct debit billing. The resultant prices are an average standing charge of 20.21 p / day, and variable charge of 4.20 p / kWh. No energy price inflation is included, so that the counterfactual heat price can be directly compared with the present-day heat prices from heat network schemes obtained through this work. This analysis therefore does not attempt to compare payback, but simply current cost comparisons. The results show that for a larger dwelling, the boiler costs add approximately 1.1p / kWh to the fuel cost, but for small efficient dwellings, this increases to 4.6 p / kWh giving a total heat cost of just over 10 p / kWh. Heat network schemes are generally deployed in areas of high density consisting typically of smaller high density houses or more usually flats. Therefore the counterfactual heat cost appropriate for heat network schemes is likely to be at the higher end of the range, typically above 7.2 p / kWh.
8 A capital cost of £2500 is assumed in the Green Deal Final Stage Impact Assessment. Reference figures for operation costs vary, but are typically £150 - £200 per year, including servicing and repairs.
35
Dwelling size (examples) Small and efficient (eg small modern
flat)
Older flat or modern small terraced house
Older terraced house or larger modern house
Older and / or larger house
Heat demand (kWh) 5,000 10,000 15,000 20,000
Boiler ownership costs
Capex (£) £2,500 £2,500 £2,500 £2,500
Replacement capex (£ at 15 years) £2,500 £2,500 £2,500 £2,500
Annual opex (£ / yr) £150 £150 £150 £150
Annualised capex (£ / yr) (3.5% discount rate) £133 £133 £133 £133
Annualised opex (£ / yr) (3.5% discount rate) £95 £95 £95 £95
Boiler costs per kWh heat demand (p / kWh) 4.57 2.28 1.52 1.14
Fuel costs
Fuel demand (at 85% efficiency) 5,882 11,765 17,647 23,529
Standing charge (£ / yr) £74 £74 £74 £74
Annual variable (£ / yr) £210 £420 £630 £840
Fuel costs per kWh demand (p / kWh) 5.68 4.94 4.69 4.57
Total costs Total annual cost £512 £722 £932 £1,142
Average heat cost (p / kWh) 10.24 7.22 6.21 5.71
Table 10: Comparison of effective heat tariffs for different size dwellings (p / kWh costs for boiler related expenditure, fuel expenditure, and total heat tariff are shown in italics for clarity)
The heat prices obtained from the 7 heat network schemes in this study are provided in Table 11. The prices from bulk scheme are lower than non-bulk scheme as to be expected. The lowest price across both types is approximately 5p / kWh, but this increases to a 10p / kWh maximum for non bulk schemes, i.e. for domestic customers.
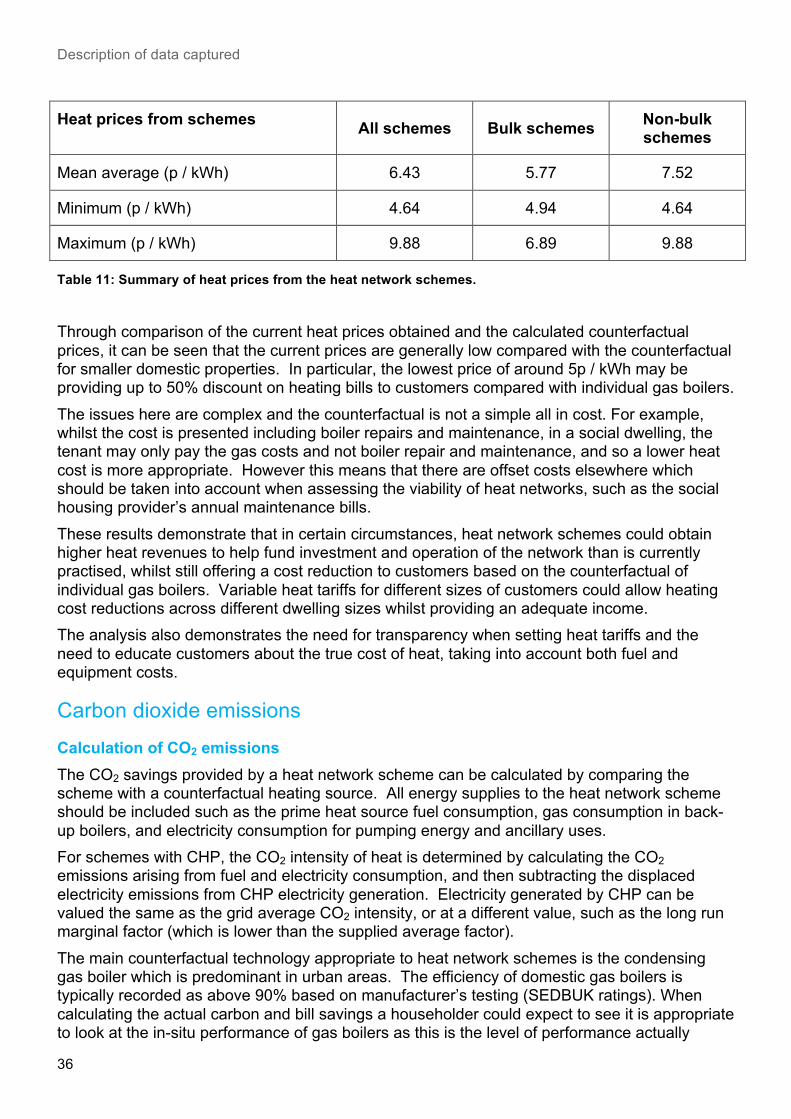
Description of data captured
36
Heat prices from schemes All schemes Bulk schemes Non-bulk schemes
Mean average (p / kWh) 6.43 5.77 7.52
Minimum (p / kWh) 4.64 4.94 4.64
Maximum (p / kWh) 9.88 6.89 9.88
Table 11: Summary of heat prices from the heat network schemes.
Through comparison of the current heat prices obtained and the calculated counterfactual prices, it can be seen that the current prices are generally low compared with the counterfactual for smaller domestic properties. In particular, the lowest price of around 5p / kWh may be providing up to 50% discount on heating bills to customers compared with individual gas boilers. The issues here are complex and the counterfactual is not a simple all in cost. For example, whilst the cost is presented including boiler repairs and maintenance, in a social dwelling, the tenant may only pay the gas costs and not boiler repair and maintenance, and so a lower heat cost is more appropriate. However this means that there are offset costs elsewhere which should be taken into account when assessing the viability of heat networks, such as the social housing provider’s annual maintenance bills. These results demonstrate that in certain circumstances, heat network schemes could obtain higher heat revenues to help fund investment and operation of the network than is currently practised, whilst still offering a cost reduction to customers based on the counterfactual of individual gas boilers. Variable heat tariffs for different sizes of customers could allow heating cost reductions across different dwelling sizes whilst providing an adequate income. The analysis also demonstrates the need for transparency when setting heat tariffs and the need to educate customers about the true cost of heat, taking into account both fuel and equipment costs.
Carbon dioxide emissions Calculation of CO2 emissions The CO2 savings provided by a heat network scheme can be calculated by comparing the scheme with a counterfactual heating source. All energy supplies to the heat network scheme should be included such as the prime heat source fuel consumption, gas consumption in back-up boilers, and electricity consumption for pumping energy and ancillary uses. For schemes with CHP, the CO2 intensity of heat is determined by calculating the CO2 emissions arising from fuel and electricity consumption, and then subtracting the displaced electricity emissions from CHP electricity generation. Electricity generated by CHP can be valued the same as the grid average CO2 intensity, or at a different value, such as the long run marginal factor (which is lower than the supplied average factor). The main counterfactual technology appropriate to heat network schemes is the condensing gas boiler which is predominant in urban areas. The efficiency of domestic gas boilers is typically recorded as above 90% based on manufacturer’s testing (SEDBUK ratings). When calculating the actual carbon and bill savings a householder could expect to see it is appropriate to look at the in-situ performance of gas boilers as this is the level of performance actually
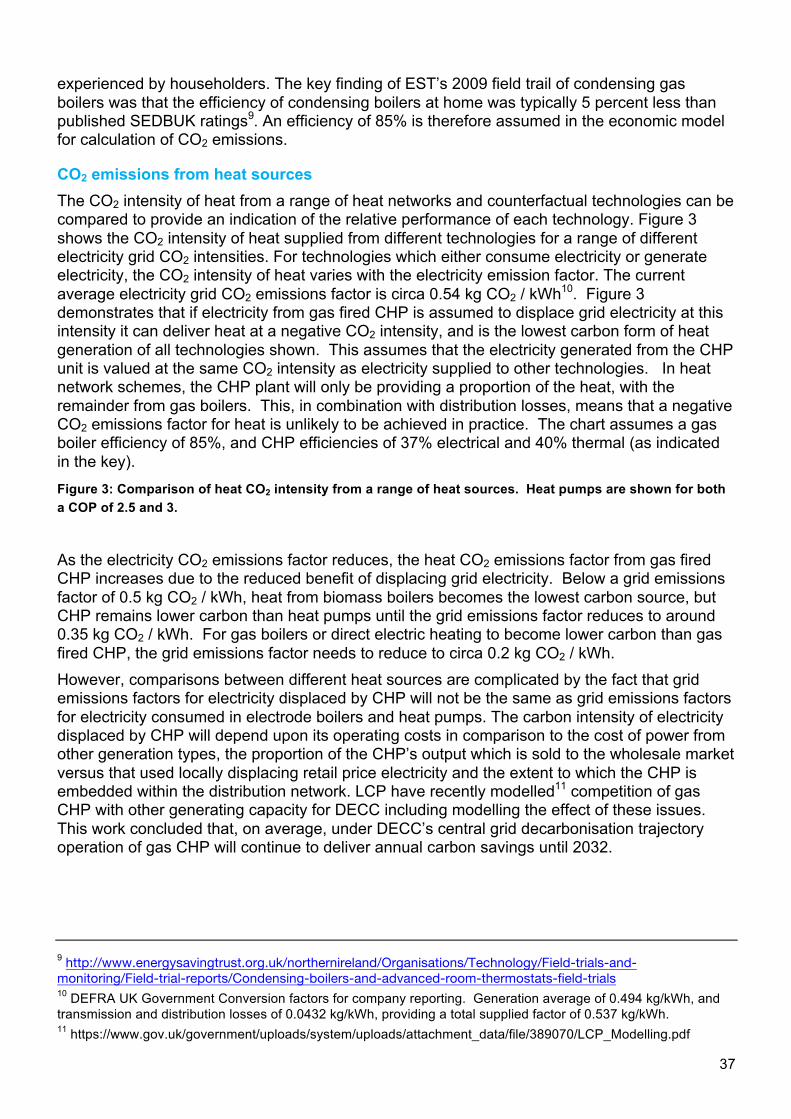
37
experienced by householders. The key finding of EST’s 2009 field trail of condensing gas boilers was that the efficiency of condensing boilers at home was typically 5 percent less than published SEDBUK ratings9. An efficiency of 85% is therefore assumed in the economic model for calculation of CO2 emissions.
CO2 emissions from heat sources The CO2 intensity of heat from a range of heat networks and counterfactual technologies can be compared to provide an indication of the relative performance of each technology. Figure 3 shows the CO2 intensity of heat supplied from different technologies for a range of different electricity grid CO2 intensities. For technologies which either consume electricity or generate electricity, the CO2 intensity of heat varies with the electricity emission factor. The current average electricity grid CO2 emissions factor is circa 0.54 kg CO2 / kWh10. Figure 3 demonstrates that if electricity from gas fired CHP is assumed to displace grid electricity at this intensity it can deliver heat at a negative CO2 intensity, and is the lowest carbon form of heat generation of all technologies shown. This assumes that the electricity generated from the CHP unit is valued at the same CO2 intensity as electricity supplied to other technologies. In heat network schemes, the CHP plant will only be providing a proportion of the heat, with the remainder from gas boilers. This, in combination with distribution losses, means that a negative CO2 emissions factor for heat is unlikely to be achieved in practice. The chart assumes a gas boiler efficiency of 85%, and CHP efficiencies of 37% electrical and 40% thermal (as indicated in the key). Figure 3: Comparison of heat CO2 intensity from a range of heat sources. Heat pumps are shown for both a COP of 2.5 and 3.
As the electricity CO2 emissions factor reduces, the heat CO2 emissions factor from gas fired CHP increases due to the reduced benefit of displacing grid electricity. Below a grid emissions factor of 0.5 kg CO2 / kWh, heat from biomass boilers becomes the lowest carbon source, but CHP remains lower carbon than heat pumps until the grid emissions factor reduces to around 0.35 kg CO2 / kWh. For gas boilers or direct electric heating to become lower carbon than gas fired CHP, the grid emissions factor needs to reduce to circa 0.2 kg CO2 / kWh. However, comparisons between different heat sources are complicated by the fact that grid emissions factors for electricity displaced by CHP will not be the same as grid emissions factors for electricity consumed in electrode boilers and heat pumps. The carbon intensity of electricity displaced by CHP will depend upon its operating costs in comparison to the cost of power from other generation types, the proportion of the CHP’s output which is sold to the wholesale market versus that used locally displacing retail price electricity and the extent to which the CHP is embedded within the distribution network. LCP have recently modelled11 competition of gas CHP with other generating capacity for DECC including modelling the effect of these issues. This work concluded that, on average, under DECC’s central grid decarbonisation trajectory operation of gas CHP will continue to deliver annual carbon savings until 2032.
9 http://www.energysavingtrust.org.uk/northernireland/Organisations/Technology/Field-trials-and-monitoring/Field-trial-reports/Condensing-boilers-and-advanced-room-thermostats-field-trials 10 DEFRA UK Government Conversion factors for company reporting. Generation average of 0.494 kg/kWh, and transmission and distribution losses of 0.0432 kg/kWh, providing a total supplied factor of 0.537 kg/kWh. 11 https://www.gov.uk/government/uploads/system/uploads/attachment_data/file/389070/LCP_Modelling.pdf
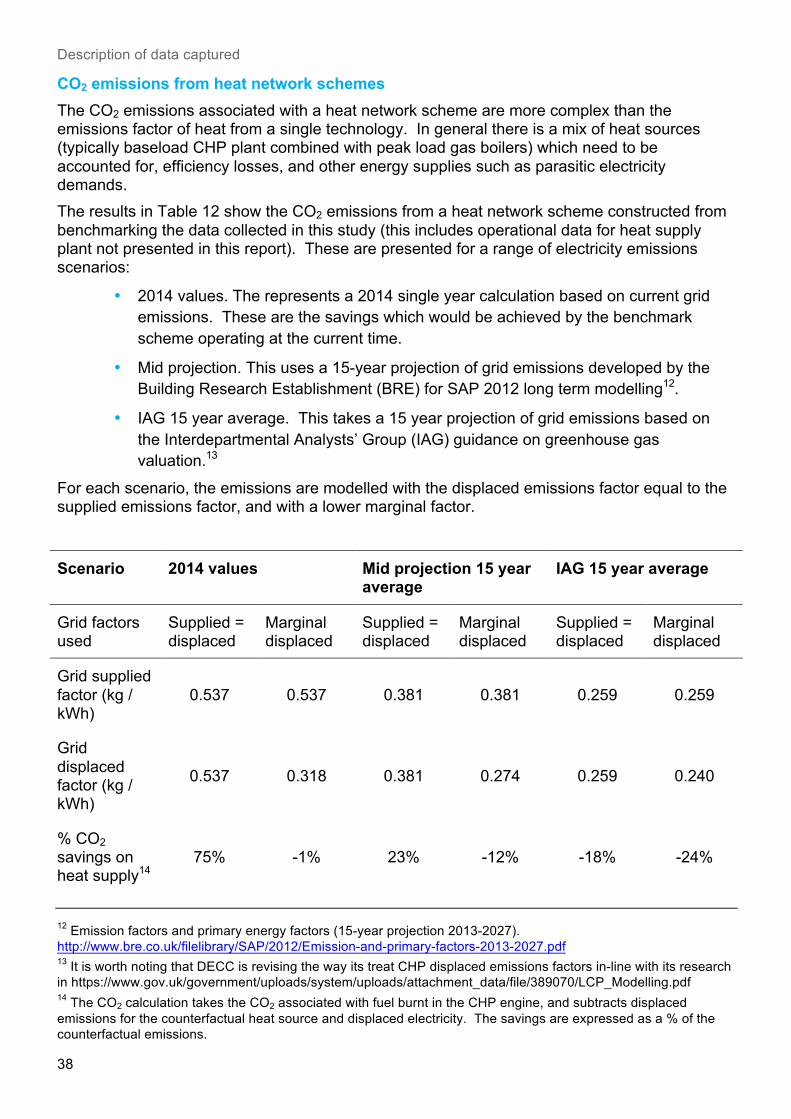
Description of data captured
38
CO2 emissions from heat network schemes The CO2 emissions associated with a heat network scheme are more complex than the emissions factor of heat from a single technology. In general there is a mix of heat sources (typically baseload CHP plant combined with peak load gas boilers) which need to be accounted for, efficiency losses, and other energy supplies such as parasitic electricity demands. The results in Table 12 show the CO2 emissions from a heat network scheme constructed from benchmarking the data collected in this study (this includes operational data for heat supply plant not presented in this report). These are presented for a range of electricity emissions scenarios:
• 2014 values. The represents a 2014 single year calculation based on current grid emissions. These are the savings which would be achieved by the benchmark scheme operating at the current time.
• Mid projection. This uses a 15-year projection of grid emissions developed by the Building Research Establishment (BRE) for SAP 2012 long term modelling12.
• IAG 15 year average. This takes a 15 year projection of grid emissions based on the Interdepartmental Analysts’ Group (IAG) guidance on greenhouse gas valuation.13
For each scenario, the emissions are modelled with the displaced emissions factor equal to the supplied emissions factor, and with a lower marginal factor.
Scenario 2014 values Mid projection 15 year average
IAG 15 year average
Grid factors used
Supplied = displaced
Marginal displaced
Supplied = displaced
Marginal displaced
Supplied = displaced
Marginal displaced
Grid supplied factor (kg / kWh)
0.537 0.537 0.381 0.381 0.259 0.259
Grid displaced factor (kg / kWh)
0.537 0.318 0.381 0.274 0.259 0.240
% CO2 savings on heat supply14
75% -1% 23% -12% -18% -24%
12 Emission factors and primary energy factors (15-year projection 2013-2027). http://www.bre.co.uk/filelibrary/SAP/2012/Emission-and-primary-factors-2013-2027.pdf 13 It is worth noting that DECC is revising the way its treat CHP displaced emissions factors in-line with its research in https://www.gov.uk/government/uploads/system/uploads/attachment_data/file/389070/LCP_Modelling.pdf 14 The CO2 calculation takes the CO2 associated with fuel burnt in the CHP engine, and subtracts displaced emissions for the counterfactual heat source and displaced electricity. The savings are expressed as a % of the counterfactual emissions.
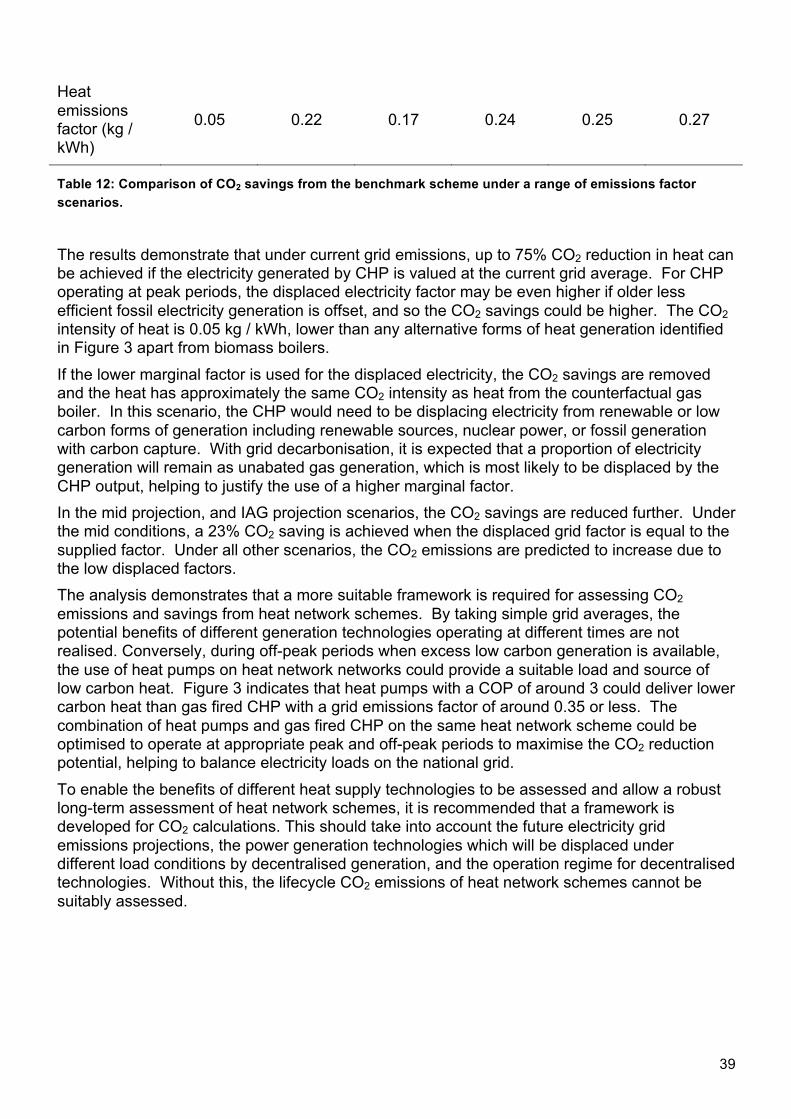
39
Heat emissions factor (kg / kWh)
0.05 0.22 0.17 0.24 0.25 0.27
Table 12: Comparison of CO2 savings from the benchmark scheme under a range of emissions factor scenarios.
The results demonstrate that under current grid emissions, up to 75% CO2 reduction in heat can be achieved if the electricity generated by CHP is valued at the current grid average. For CHP operating at peak periods, the displaced electricity factor may be even higher if older less efficient fossil electricity generation is offset, and so the CO2 savings could be higher. The CO2 intensity of heat is 0.05 kg / kWh, lower than any alternative forms of heat generation identified in Figure 3 apart from biomass boilers. If the lower marginal factor is used for the displaced electricity, the CO2 savings are removed and the heat has approximately the same CO2 intensity as heat from the counterfactual gas boiler. In this scenario, the CHP would need to be displacing electricity from renewable or low carbon forms of generation including renewable sources, nuclear power, or fossil generation with carbon capture. With grid decarbonisation, it is expected that a proportion of electricity generation will remain as unabated gas generation, which is most likely to be displaced by the CHP output, helping to justify the use of a higher marginal factor. In the mid projection, and IAG projection scenarios, the CO2 savings are reduced further. Under the mid conditions, a 23% CO2 saving is achieved when the displaced grid factor is equal to the supplied factor. Under all other scenarios, the CO2 emissions are predicted to increase due to the low displaced factors. The analysis demonstrates that a more suitable framework is required for assessing CO2 emissions and savings from heat network schemes. By taking simple grid averages, the potential benefits of different generation technologies operating at different times are not realised. Conversely, during off-peak periods when excess low carbon generation is available, the use of heat pumps on heat network networks could provide a suitable load and source of low carbon heat. Figure 3 indicates that heat pumps with a COP of around 3 could deliver lower carbon heat than gas fired CHP with a grid emissions factor of around 0.35 or less. The combination of heat pumps and gas fired CHP on the same heat network scheme could be optimised to operate at appropriate peak and off-peak periods to maximise the CO2 reduction potential, helping to balance electricity loads on the national grid. To enable the benefits of different heat supply technologies to be assessed and allow a robust long-term assessment of heat network schemes, it is recommended that a framework is developed for CO2 calculations. This should take into account the future electricity grid emissions projections, the power generation technologies which will be displaced under different load conditions by decentralised generation, and the operation regime for decentralised technologies. Without this, the lifecycle CO2 emissions of heat network schemes cannot be suitably assessed.
Conclusions
40
4. Conclusions
Data collection and availability This study has identified a number of existing heat network schemes from which data has been collected from a representative sample of 7 schemes and used to assess the costs and performance of heat networks. Additional data from feasibility studies and an online survey has helped validate the data from existing schemes. The data collection exercise has highlighted the difficulty in obtaining accurate and consistent data across existing heat network schemes in the UK, and the need to develop a framework in which the schemes can be better monitored and understood. The fragmented and nascent nature of the heat network industry in the UK means that data is either not collated, or not easily accessible, but could be used if available to help understand and support further heat network development. This study has also identified the complexity of heat network schemes, with many technical and financial approaches. Understanding the boundary of the heat network schemes is important - whilst some heat network schemes are relatively simple with all heat supply, distribution and customer connections financed and operated by the same organisation, the majority are more complex with different organisations responsible for different elements of the scheme. Historic investment and payback on infrastructure also need to be considered when assessing heat networks. A large number of existing schemes have developed over a number of years, and some operators have been able to adopt existing heat supply and distribution infrastructure for little or no charge, effectively a grant to the scheme. Some other more recent schemes have received large capital grants for infrastructure investment. This means that not only is historic cost information difficult to obtain, more importantly it does not feature in the operator’s economic model. Whilst this may enable existing schemes to operate in a financially viable manner, it is not a replicable model for new schemes where all investment costs will need to be included.
Data benchmarking The data collected in this study has been used to produce a set of benchmarks or typical values. Key conclusions are as follows: Performance:
• Distribution losses range widely with averages of 6% and 28% for each type of network. The losses for the bulk schemes are in line with commonly used assumptions with losses of around 10% or less although are representative of the more urban schemes examined in this report, and could be higher in less dense schemes. The losses for the non-bulk schemes are significant with one scheme at 43%. Evidence suggests that high losses can be experienced through internal distribution pipework within buildings, and it will be important that the specification

41
and design of internal pipework and operating parameters are controlled to reduce losses on schemes.
Capital costs:
• Heat network buried pipe costs are typically around £150 / MWh annual, whilst the connection costs range significantly from £25 / MWh for bulk schemes to £624 / MWh for non-bulk schemes. The key area of sensitivity is therefore around the heat connections and configuration. In particular, individual dwelling connections in the form of HIUs and heat meters appear to dominate the capital cost of domestic schemes with individual connections.
• Buried heat network pipework costs average around £1000 / m over a heat network, although this ranges from £422 / m to £1472 / m depending on the size and nature of the schemes.
Operation costs:
• Operation costs associated with the heat network appear to be low, and not considered significant by organisations. However there will be higher operation costs associated with other elements of the heat network scheme, such as heat sources and energy centre buildings.
• The highest operation costs appear to be associated with HIU and heat meter maintenance, and meter reading / billing activities.
Heat sales This report has assessed the heat sales prices used by the 7 schemes, and compared these with counterfactual prices for the domestic sector. The analysis suggests that in low heat demand dwellings, the counterfactual prices can be relatively high once boiler maintenance and replacement is included, and current heat sales prices from heat networks may be under-valuing the heat. This undervaluation may allow economic operation of some current heat networks which have benefited from historic investment or grant funding, but higher prices may be required for future networks which incur all capital expenditure. The analysis suggests that higher prices may be obtained, whilst still offering consumers a discount over counterfactual heating costs.
CO2 emissions The CO2 emissions from heat distributed by heat networks depend on the type of heat source and the fuel used. Larger heat networks predominantly source heat from gas fired CHP at present although other sources such as energy from waste are also used. The analysis demonstrates the sensitivity of the CO2 calculations to assumptions for grid electricity emissions, and the need for improved advice and guidance for these calculations. In particular, the valuation of grid CO2 at an average or marginal generation factor may not be suitable. It is recommended that a framework is developed for CO2 calculations. This should take into account the future electricity grid emissions projections, the power generation technologies which will be displaced under different load conditions by decentralised generation, and the operation regime for decentralised technologies. Without this, the lifecycle CO2 emissions of heat network schemes cannot be suitably and consistently assessed, making

Conclusions
42
investment in heat networks and heat supply technologies higher risk. DECC is addressing this by investigating CHP operation in further detail.15
15 https://www.gov.uk/government/publications/bespoke-natural-gas-chp-analysis
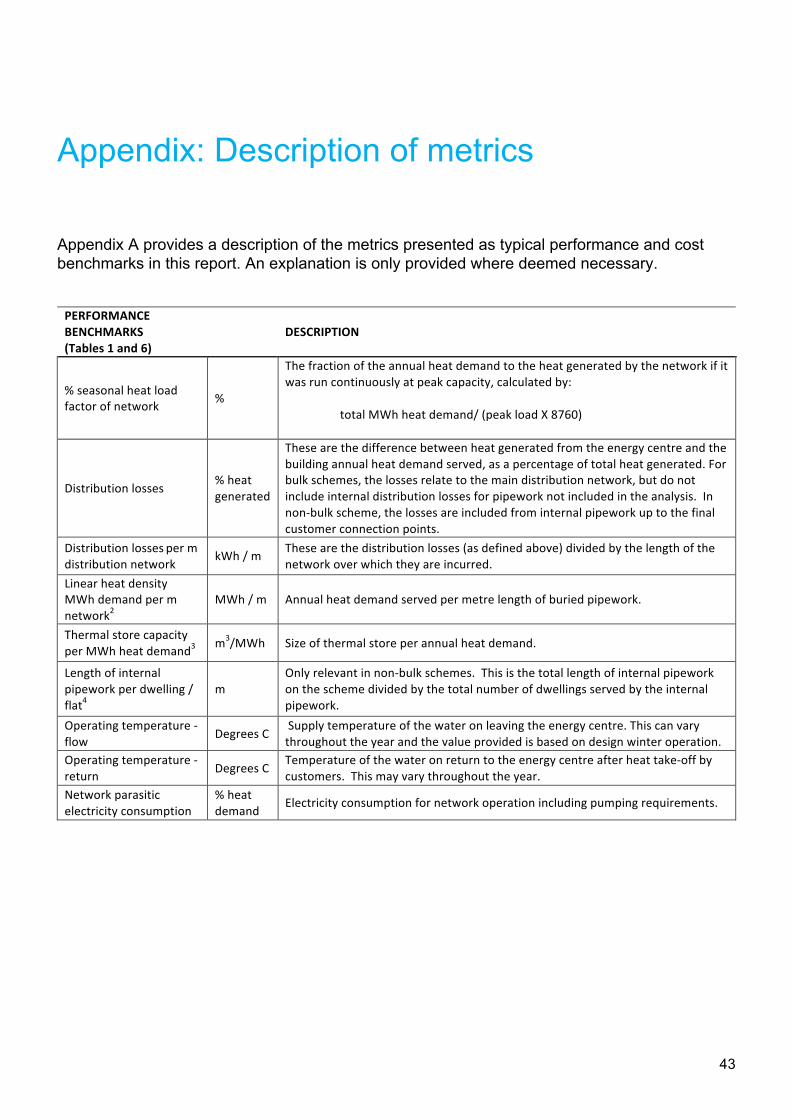
43
Appendix: Description of metrics
Appendix A provides a description of the metrics presented as typical performance and cost benchmarks in this report. An explanation is only provided where deemed necessary. PERFORMANCE BENCHMARKS (Tables 1 and 6)
DESCRIPTION
% seasonal heat load factor of network %
The fraction of the annual heat demand to the heat generated by the network if it was run continuously at peak capacity, calculated by:
total MWh heat demand/ (peak load X 8760)
Distribution losses % heat generated
These are the difference between heat generated from the energy centre and the building annual heat demand served, as a percentage of total heat generated. For bulk schemes, the losses relate to the main distribution network, but do not include internal distribution losses for pipework not included in the analysis. In non-‐bulk scheme, the losses are included from internal pipework up to the final customer connection points.
Distribution losses per m distribution network kWh / m These are the distribution losses (as defined above) divided by the length of the
network over which they are incurred. Linear heat density MWh demand per m network2
MWh / m Annual heat demand served per metre length of buried pipework.
Thermal store capacity per MWh heat demand3 m3/MWh Size of thermal store per annual heat demand.
Length of internal pipework per dwelling / flat4
m Only relevant in non-‐bulk schemes. This is the total length of internal pipework on the scheme divided by the total number of dwellings served by the internal pipework.
Operating temperature -‐ flow Degrees C Supply temperature of the water on leaving the energy centre. This can vary
throughout the year and the value provided is based on design winter operation. Operating temperature -‐ return Degrees C Temperature of the water on return to the energy centre after heat take-‐off by
customers. This may vary throughout the year. Network parasitic electricity consumption
% heat demand Electricity consumption for network operation including pumping requirements.

Appendix: Description of metrics
44
CAPITAL COSTS (Tables 2 and 7) DESCRIPTION
Heat Connections £ / MWh Aggregate cost as supplied by scheme. Cost substations ND and D blocks (Note: D – Domestic, ND – Non Domestic).
£ / MWh
Cost of heat exchangers and associated equipment for large customers and bulk supply points per annual heat demand. A substation comprises all the equipment to allow heat exchange from the primary to the secondary network, including heat exchanger, and all associated pipework, valves, and controls. Heat meters are assumed to be separate (see below).
Cost heat meters ND and D blocks £ / MWh Cost of heat meters for large customers and bulk supply points per annual heat
demand.
Cost HIUs Dwellings1 £ / MWh Cost of individual Hydraulic Interface Units for dwellings (not including heat meters) per annual heat demand.
Cost heat meters Dwellings1 £ / MWh Cost of individual heat meters for individual dwelling connections per annual heat
demand.
Cost internal pipework connection to HIUs1 £ / MWh Cost of internal pipework within domestic blocks from bulk supply substation (if
present) to individual dwelling connection points per annual heat demand.
Cost for connections prelims2 £ / MWh
Prelims associated with connection costs above per annual heat demand. Prelims allow for construction overheads, management fees, and other related expenses not directly attributable to the DH components installation.
Overhead and profit connections2 £ / MWh Overhead and profit associated with connection costs above per annual heat
demand. SUM OF DISAGGREGATED CONNECTION COSTS
£ / MWh Summation of the disaggregated costs above per annual heat demand. NOTE – THIS MAY NOT BE THE SAME AS FOR THE AGGREGATE FIGURE PROVIDED BY THE SCHEME AND PROVIDED IN BOLD ABOVE.
Heat Network £ / MWh Aggregate cost for all components making up the heat distribution network per annual heat demand.
Mechanical capital cost – total £ / MWh Cost of pipes and mechanical installation per annual heat demand.
Civil capital cost – total £ / MWh Cost of civil installation works per annual heat demand,
Preliminary capital cost – total3 £ / MWh
Prelims associated with network installation costs above per annual heat demand Prelims allow for construction overheads, management fees, and other related expenses not directly attributable to the DH components installation.
Overhead and profit – total £ / MWh Overhead and profit associated with network installation costs above per annual
heat demand SUM OF DISAGGREGATED HEAT NETWORK COSTS
£ / MWh Summation of the disaggregated costs above per annual heat demand. NOTE – THIS MAY NOT BE THE SAME AS FOR THE AGGREGATE FIGURE PROVIDED BY THE SCHEME AND PROVIDED IN BOLD ABOVE.
Ancillary plant associated with network (eg pumping, treatment, etc)
£ / MWh
Ancillary plant cost per heat demand Costs for ancillary plant associated with the network operation, but not included as part of the distribution pipework. These may include equipment such as pumping, water treatment, controls, etc. Where cost data has been provided, little additional information has been provided by schemes. However the data sheet requested these costs to be additional to the Heat Network costs above and so additive.
Thermal store £ / MWh The cost of the thermal store which is usually a water tank per annual heat demand served.

45
CAPITAL COSTS Tables 3 and 8) DESCRIPTION
Network capital costs per length (main network-‐buried)
£/m Cost of main heat distribution network divided by length of network. Excludes internal pipework.
Network capital costs per length (internal pipe)
£/m Cost of internal distribution pipework divided by length of internal pipes (non-‐bulk schemes).
Substations cost per kW capacity £/kW Cost of heat exchangers and associated equipment for large customers and bulk
supply points Expressed as £ per kW capacity of substations on the network. Domestic HIUs cost per dwelling £/dwelling Cost of individual Hydraulic Interface Units for dwellings (not including heat
meters) Heat meter cost per building (ND and bulk) £/building Cost of individual heat meter per building for nondomestic building or for bulk
schemes. Heat meter cost per dwelling £/dwelling Cost of individual heat meter per dwelling.
Thermal store cost per m3 £/m3 Thermal store cost per storage volume of thermal store.
OPERATION COSTS DESCRIPTION
Heat network maintenance cost £ / MWh
Cost per annual heat demand. Maintenance costs directly associated with heat network and ancillary equipment. Excludes heat substations and heat supply plant.
Heat network management cost £ / MWh
Cost per annual heat demand. Management costs directly associated with heat network and ancillary equipment. Excludes heat substations and heat supply plant.
Substation maintenance cost £ / MWh
Cost per annual heat demand Maintenance cost of heat exchangers and associated equipment for large customers and bulk supply points.
HIUs maintenance cost £ / MWh
Cost per annual heat demand. Maintenance cost of individual Hydraulic Interface Units for dwellings (not including heat meters)
HIUs maintenance cost £/MW Cost per annual heat demand Maintenance cost of individual Hydraulic Interface Units for dwellings (not including heat meters) Expressed as £ per kW capacity of substations on the network.
Heat meter maintenance cost £ / MWh Cost per annual heat demand across the entire network. Information was not
provided on individual meter heat delivery. Avg annual staff cost for metering, billing and revenue collection
£ / MWh Cost per annual heat demand.
Annual business rates £ / MWh Cost per annual heat demand.

46

© Crown copyright 2015 Department of Energy & Climate Change 3 Whitehall Place London SW1A 2AW www.gov.uk/decc URN 15D/022 Assessment of the Costs, Performance, and Characteristics of Heat UK Networks