Embed Size (px)
Citation preview
Decarbonylation of Carboxylic Acids over Supported Metal Catalysts
A Dissertation
Presented to
the faculty of the School of Engineering and Applied Science
University of Virginia
In Partial Fulfillment
of the requirement for the Degree
Doctor of Philosophy in Chemical Engineering
by
Juan A. Lopez-Ruiz
September 2014
i
Abstract
Removal of oxygen from biomass-derived feedstocks such as carbohydrates and vegetable oil is
often needed to produce chemicals and fuels. In this study, oxygen was removed from the model compounds
heptanoic acid and propanoic acid by either decarboxylation, which yields carbon dioxide (CO2) and an
alkane, and/or decarbonylation, which forms carbon monoxide (CO), water (H2O), and a linear alkene.
Although decarbonylation produces an α-olefin as a primary product, the double bond can be isomerized to
form an internal olefin or be hydrogenated to form an alkane. Recent work on
decarboxylation/decarbonylation of carboxylic acids over transition metal catalysts is often performed in
the presence of dihydrogen to inhibit catalyst deactivation, however, paraffins are the major product in
those systems.
The effects of metal type, support composition, metal loading, reaction phase, acid concentration,
and conversion on activity, selectivity, and stability are presented. We studied the liquid- and gas-phase
decarbonylation of carboxylic acids on Pt, Pd, and Rh nanoparticles supported on carbon and silica supports
in a continuous-flow fixed-bed reactor at temperatures ranging from 533 to 573 K. The liquid-phase
turnover frequency (TOF) of heptanoic acid conversion over Pt at 573 K was fairly constant, 0.0050 s-1, as
the catalyst dispersion and metal loading was varied. The liquid-phase TOF of Pd at 573 K was 0.00070 s-
1 and was independent of support composition, weight loading, and acid concentration. A shift in product
selectivity from decarboxylation products, paraffin and CO2, to decarbonylation products, olefins and CO,
as previously discussed in the literature was most likely a result of changes in conversion. However, the
decarboxylation products observed in the current study were likely formed in secondary side reactions such
as water-gas shift (WGS) and hydrogenation.
Low conversion and high acid concentration experiments in liquid-phase and gas-phase operation
suggest that the main reaction path for heptanoic acid and propanoic acid conversion is the decarbonylation
reaction. Some direct decarboxylation was observed when operating in the gas-phase at very low
concentrations of acid. The reaction was zero order in acid during the liquid-phase operation and high partial

ii
pressures during gas-phase operation, but was observed to be negative order in acid at very low partial
pressures.
Characterization of catalysts after reaction revealed metal sintering, loss of surface area and loss of
exposed metal during the liquid-phase operation. X-ray diffraction and electron microscopy revealed Pd
sintering on a carbon support when operating in the liquid-phase at high acid concentration, but negligible
Pd sintering when acid concentration was below 0.10 M. Palladium nanoparticles were more stable on the
silica support during the liquid-phase operation. Furthermore, Pd sintering was negligible during the gas-
phase experiments regardless of the support composition and acid concentration. Nevertheless, N2
physisorption and H2 chemisorption revealed a loss of surface area and metal exposed during the liquid-
and gas-phase operation, even when metal sintering was not observed. Evidently, there was blocking of
active sites and/or the porous structure by strong absorption of side products or carbonaceous species.
A Pt catalyst recovered from the liquid-phase reaction could not be regenerated after air calcination
and H2 reduction at mild temperatures, and/or hot wash in acid. However, catalyst regeneration after gas-
phase operation was successful. In situ treatment at 623 K with N2 and H2 of the spent catalyst recovered
the initial catalytic activity. This suggested that the main cause for catalyst deactivation in the gas-phase
was deposition of organic molecules onto the active sites.
Keywords
Decarbonylation; Decarboxylation; Deoxygenation; Carboxylic Acid; Heptanoic Acid; Propanoic acid;
Pt/C; Pd/C; Pt/SiO2; Rh/SiO2; Pd/SiO2 ; α-Olefin; Olefin; Paraffin; Ketonization; 1-Hexene; Hexane; 7-
Tridecanone; Ethylene; Ethane; 3-Pentanone.
iii
Acknowledgment
I thank my advisor, Robert J. Davis, for his mentoring and patience during my graduate studies. In
addition, I would like to thank all of the Davis group members, past and present, with whom I have
interacted through the years. I would like to acknowledge the financial support provided by the Center for
Biorenewable Chemicals (CBiRC) and BP, the collaboration with the University of New Mexico and the
Neurock Lab at the University of Virginia, and all the discussions with Dr. John Shabaker, Dr. Drew
Braden, Dr. Matthew Neurock, Dr. Corneliu Buda, Dr. Glen Allen, Dr. Abhaya Datye, and Dr. Hien Pham.
I also would like to thank Dr. Brent Shanks, Dr. Peter Keeling, and Ms. Tonia McCarley from CBiRC.
Many thanks to my classmates for their support and camaraderie over the past years, in particular
to Edward Wong and Joseph Basconi. I express my gratitude also to the staff of the Chemical Engineering
Department, Ms. Vickie Falconer, Ms. Kim Doerr, Ms. Teresa Morris, Mr. Rick Buchanan, and Ms.
Jennifer Davis. I would like to thank the Department of Material Science for their help with the catalyst
characterization, in particular to Mr. Richard White and Matthew Schneider.
Many thanks to Dean Aaron Laushway and the Office of the Dean of students for their continuous
support. Best regards goes to the Teaching Resources Center (TRC) and its supporting stuff, in particular
to Dr. Michael Palmer.
Last but not least, I thank both my Spanish and American families for their overwhelming love and
support that has helped me reach this point. In particular I would like to thank my mother, Maria Luisa
Ruiz-Fernandez, my sisters, Maria Luisa Lopez-Ruiz and Patricia Lopez-Ruiz, my father, Torcuato Lopez-
Garcia, my grandmother, Maria del Carmen Fernandez-Leyva, my mother-in-law, Lisa Fisher, my father-
in-law, Steven Fisher, my brother-in-law, Ross Fisher, my aunt, Carmen Ruiz-Fernandez, my uncle,
Manolo Ruiz-Lopez, and my cousins, Manolo Ruiz-Ruiz and Francisco Javier Ruiz-Ruiz.

iv
To my wife, Morgan Z. Fisher, whose love and support gave me the strength to complete the
Ph.D.
v
Table of Content
Chapter 1: Introduction ..................................................................................................................... 1
1.1.Motivation ....................................................................................................................................... 1
1.2.Effect of Metal ................................................................................................................................ 3
1.3.Effect of support ............................................................................................................................. 4
1.4.Effect of concentration .................................................................................................................... 7
1.5.Catalyst deactivation and regeneration ........................................................................................... 8
1.6.Reaction kinetics and mechanism ................................................................................................... 8
1.7.Focus of this work ........................................................................................................................... 9
1.8.References ..................................................................................................................................... 10
Chapter 2. Decarbonylation of Heptanoic Acid over Carbon-Supported Platinum Nanoparticles ............. 14
2.1. Abstract 14
2.2. Introduction 15
2.3. Experimental Methods 18
2.3.1. Catalyst synthesis ................................................................................................................ 18
2.3.2. Dihydrogen chemisorption .................................................................................................. 18
2.3.3. Dinitrogen physisorption ..................................................................................................... 18
2.3.4. X-ray diffraction ................................................................................................................. 19
2.3.5. Electron microscopy ........................................................................................................... 19
2.3.6. Catalytic conversion of heptanoic acid ............................................................................... 19

vi
2.3.7. Turnover frequency and selectivity calculations ................................................................. 22
2.3.8. Mass transfer limitations ..................................................................................................... 23
2.4. Results and Discussion 24
2.4.1. Effect of carbonaceous support ........................................................................................... 24
2.4.2. Effect of reduction temperature .......................................................................................... 27
2.4.3. Effect of metal loading ........................................................................................................ 32
2.4.4. Effect of flow rate ............................................................................................................... 37
2.4.5. Effect of pressure ................................................................................................................ 40
2.4.6. Catalyst deactivation ........................................................................................................... 42
2.5. Conclusions 47
2.6. Acknowledgement 48
2.7. References 49
Chapter 3. Reactivity and Stability of Supported Pd Nanoparticles during the Liquid-Phase and Gas-Phase
Decarbonylation of Heptanoic Acid ........................................................................................................... 53
Abstract .................................................................................................................................................... 53
3.1.Introduction ................................................................................................................................... 54
3.2.Experimental Methods .................................................................................................................. 56
3.2.1. Catalyst synthesis ................................................................................................................ 56
3.2.2. Dihydrogen chemisorption .................................................................................................. 56
3.2.3. Dinitrogen physisorption ..................................................................................................... 57
3.2.4. X-ray diffraction ................................................................................................................. 57
vii
3.2.5. Electron microscopy ........................................................................................................... 57
3.2.6. Catalytic conversion of heptanoic acid ............................................................................... 57
3.2.7. Post-mortem catalyst characterization ................................................................................ 59
3.2.8. Calculations of rates ............................................................................................................ 59
3.3.Results and Discussion.................................................................................................................. 60
3.3.1. Effect of support and impregnation method during the liquid-phase operation .................. 60
3.3.2. Effect of metal loading and reaction pressure ..................................................................... 68
3.3.3. Effect of liquid-phase conversion on product selectivity .................................................... 73
3.3.4. Gas-phase operation ............................................................................................................ 74
3.4.Conclusions ................................................................................................................................... 80
3.5.Acknowledgement ........................................................................................................................ 81
3.6.References ..................................................................................................................................... 81
Chapter 4. Mechanistic Insights on the Decarbonylation and Decarboxylation of Propanoic Acid over
Palladium Catalysts ................................................................................................................... 86
Abstract 86
4.1. Introduction 87
4.2. Experimental Methods 90
4.2.1. Catalyst synthesis ................................................................................................................ 90
4.2.2. Dihydrogen chemisorption .................................................................................................. 90
4.2.3. Dinitrogen physisorption ..................................................................................................... 91
4.2.4. X-ray diffraction ................................................................................................................. 91

viii
4.2.5. Electron microscopy ........................................................................................................... 91
4.2.6. Catalytic conversion of propanoic acid ............................................................................... 91
4.2.7. Post-mortem catalyst characterization ................................................................................ 94
4.2.8. Calculation of rates ............................................................................................................. 94
4.3.Results and Discussion 96
4.3.1. Effect of metal ..................................................................................................................... 96
4.3.2. Effect of support................................................................................................................ 103
4.3.3. Effect of reaction temperature on TOF and extent of deactivation ................................... 105
4.3.4. Effect of propanoic acid concentration ............................................................................. 110
4.3.5. Propanoic anhydride as potential reaction intermediate ................................................... 113
4.4.Conclusions 115
4.5.Acknowledgement 116
4.6.References 116
Chapter 5. Conclusions and Future Work ................................................................................................. 121
5.1.Conclusions 121
5.2. Future work and recommendations 123
5.2.1. Auto-sampling ................................................................................................................... 123
5.2.2. Co-feeding dihydrogen ..................................................................................................... 124
5.2.3. Bimetallic catalysts ........................................................................................................... 124
5.2.4. Reactive Distillation .......................................................................................................... 126

ix
5.3.References 126
Appendix A. Sample calculation of Weisz-Prater Criterion ..................................................................... 131
Appendix B. Gas chromatography calibrations ........................................................................................ 138
Appendix C. Effect of heptanoic acid concentration ................................................................................ 143
Appendix D. Catalyst deactivation during the decarbonylation of propanoic acid .................................. 145
Appendix E. Catalyst regeneration ........................................................................................................... 148

x
List of Figures
Figure 2.1. Schematic of the reactor system. TC represents a thermocouple, GC represents a gas
chromatograph, PG represents a pressure gauge, and PC represents a back pressure regulator. ................ 21
Figure 2.2. Comparison of the XRD patterns of 5 wt% Pt supported on Norit carbon, Vulcan carbon and
SiC reduced at 623 K under 100 cm3min-1 of H2 at a heating rate of 5 K min-1. represents features of SiC
support. The patterns were offset for clarity. .............................................................................................. 27
Figure 2.3. TEM images of fresh 3 wt% Pt/Norit C catalyst reduced at four different temperatures. A was
reduced at 623 K, B was reduced at 673 K, C was reduced at 773 K, and D was reduced at 873 K. ......... 29
Figure 2.4. Effect of reduction temperature ( represents 623 K, represents 673 K, represents 773
K, and represents 873 K) on heptanoic acid conversion over 3 wt% Pt/Norit C. The reactions conditions
were 573 K, 37 bar, and 0.01 cm3min-1 of feed composed of 95 wt% heptanoic acid and 5 wt% dodecane.
.................................................................................................................................................................... 30
Figure 2.5. Effect of reduction temperature ( represents 623 K, represents 673 K, represents 773
K, and represents 873 K) on the olefin (left) and CO (right) selectivity over time during the conversion
of heptanoic acid over 3 wt% Pt/Norit C. The reactions conditions were 573 K, 37 bar, and 0.01 cm3min-1
of feed composed of 95 wt% heptanoic acid and 5 wt% dodecane. Olefin selectivity is relative to liquid
products only and CO selectivity is relative to CO + CO2. ......................................................................... 31
Figure 2.6. Effect of Pt weight loading supported on Norit C on product selectivity and conversion at 573
K, 37 bar, and 0.01 cm3min-1 of feed composed of 95 wt% heptanoic acid and 5 wt% dodecane. The product
selectivity (%) is represented with color bars and can be read on the left axis. represents 1-hexene,
represents 2 and 3-hexenes, represents hexane, represents 7-tridecanone, and represents the

xi
unknown products. The black squares represent conversion (%) and can be read on the right axis. These
results were recorded after 20 h of reaction. ............................................................................................... 35
Figure 2.7. TEM images of fresh Pt/Norit C catalysts reduced at identical conditions but with four different
Pt loadings. A has 1 wt% loading, B has 3 wt% loading, C has 5 wt% loading, and D has 10 wt% loading.
.................................................................................................................................................................... 36
Figure 2.8. Dependence of conversion of heptanoic acid at different flow rates over 10 wt% Pt/Norit C at
573 K and 37 bar. These results were recorded after 20 h of reaction. The W/F was calculated as the weight
of catalyst used divided by the mass flow rate. ........................................................................................... 37
Figure 2.9. Dependence of decarbonylation product selectivity on conversion over 10 wt% Pt/Norit C at
573 K and 37 bar. represents the selectivity to decarbonylation products, olefins, in the liquid product.
represents the selectivity to decarbonylation product, CO, in the gas product. represents the selectivity
to α-olefins in the liquid product. These results were recorded after 20 h of reaction. ............................... 39
Figure 2.10. Effect of reaction pressure and feed flow rate on catalyst activity and product distribution over
Pt/Norit C with different loadings of Pt during the conversion of heptanoic acid at 573 K. The feed
composition was 95 wt% heptanoic acid and 5 wt% dodecane. The color bars can be read on the left axis
and represents the product distribution. represents 1-hexene, represents 2-3-hexenes, represents
hexane, represents 7-tridecanone, and represents the unknown products. The black squares represent
conversion (%) and can be read on the right axis. These results were recorded after 20 h of reaction. Figure
A was run in liquid phase (37 bar) conditions and flow rate of 0.01 cm3min-1. Figure B was run in gas phase
(1 bar) conditions and a flow rate of 0. 01 cm3min-1. Figure C was run in gas phase (1 bar) conditions and
a flow rate of 0.05 cm3min-1. ....................................................................................................................... 41
Figure 2.11. Effect of deactivation on catalyst activity and product distribution over 10 wt% Pt/Norit C
during the conversion of heptanoic acid at 573 K and a feed flow rate of 0.01 cm3min-1 composed of 95
xii
wt% heptanoic acid and 5 wt% dodecane. The bars with patterns represents the product distribution and
can be read on the left axis. represents 1-hexene, represents 2-3-hexenes, represents hexane,
represents 7-tridecanone, and represents the unknown products. The black squares represent conversion
(%) and can be read on the right axis. These results were recorded after 20 h of reaction. ........................ 43
Figure 2.12. TEM images of spent Pt/Norit C catalysts. The catalysts were prepared by IWI and reduced
with H2 at 623 K at a heating rate of 5 K min-1. A represents a spent sample of 1 wt% Pt, B represents a
spent sample of 5 wt% Pt, and C represent a spent sample of 10 wt% Pt. The spent samples were first run
in liquid-phase operation until steady-state operation and then they were run in gas-phase operation until
deactivation. At that point in time, the spent samples were recovered from the reactor and treated as
described in the Experimental Methods section. The spent catalysts were collected after a total of 80 h under
reaction conditions. ..................................................................................................................................... 44
Figure 2.13. Comparison of the XRD patterns of Norit C support, fresh 10 wt% Pt/Norit C after reduction,
and spent 10 wt% Pt/Norit C after reaction. The spent sample was first run in liquid-phase operation until
steady-state operation and then it was run in gas-phase operation until deactivation. At that point, the spent
sample was recovered from the reactor and treated as described in the Experimental Methods section. The
spent catalyst was collected after a total of 80 h under reaction conditions. The patterns were offset for
clarity. ......................................................................................................................................................... 46
Figure 2.14. Schematic depiction of working hypothesis for catalyst sintering. ........................................ 47
Figure 2.15. Reaction network for the decarbonylation/decarboxylation of heptanoic acid over supported
Pt at low conversion levels. ........................................................................................................................ 48
Figure 3.1. Comparison of the XRD patterns of 5 wt% Pd/Norit C, 5 wt% Pd/Vulcan C, and 5 wt% Pd/SiO2
prepared by alcohol reduction (AR) before (fresh) and after (spent) liquid-phase reaction at 573 K. The
xiii
patterns were offset for clarity. The spent samples were recovered from the reactor and treated as described
in the Experimental Methods section. ......................................................................................................... 63
Figure 3.2. High-angle annular dark field-STEM images of fresh (left) and spent (right) catalysts during the
liquid-phase decarbonylation of heptanoic acid at 573 K. .......................................................................... 64
Figure 3.3. Effect of support on product selectivity and conversion during the liquid-phase decarbonylation
of heptanoic acid at 573 K, and 0.01 cm3min-1 of liquid feed composed of 95 wt% heptanoic acid and 5
wt% dodecane. The product selectivity (%) is represented with color bars and can be read on the left axis.
represents 1-hexene, represents 2 and 3-hexenes, represents hexane, represents 7-tridecanone,
and represents the unknown products. The black squares represent conversion (%) and can be read on
the right axis. The background conversion of the carbon supports was removed for clarity. These results
were recorded after 20 h of reaction. .......................................................................................................... 66
Figure 3.4. Effect of Pd weight loading on Norit C on product selectivity and conversion during the liquid-
phase decarbonylation of heptanoic acid at 573 K, and 0.01 cm3min-1 of liquid feed composed of 95 wt%
heptanoic acid and 5 wt% dodecane. The product selectivity (%) is represented with color bars and can be
read on the left axis. represents 1-hexene, represents 2 and 3-hexenes, represents hexane,
represents 7-tridecanone, and represents the unknown products. The black squares represent conversion
(%) and can be read on the right axis. The background conversion of the carbon supports was removed for
clarity. These results were recorded after 20 h of reaction. ........................................................................ 67
Figure 3.5. Comparison of the XRD patterns of 1, 5, and 20 wt% Pd/Norit C prepared by incipient wetness
impregnation (IWI) before (fresh) and after (spent) liquid-phase reaction at 573 K. The patterns were offset
for clarity. The spent samples were recovered from the reactor and treated as described in the Experimental
Methods section. ......................................................................................................................................... 69

xiv
Figure 3.6. Bright field HRTEM images of fresh (left) and spent (right) Pd/Norit C samples after the liquid-
phase decarbonylation of heptanoic acid at 573 K. The spent samples were recovered from the reactor and
treated as described in the Experimental Methods section. ........................................................................ 70
Figure 3.7. Dependence of product selectivity on liquid-phase conversion of heptanoic acid over 10 wt%
Pd/Norit C at 573 K and 37 bar. represents the selectivity to olefins (1-, 2- and 3-hexenes)
decarbonylation products, olefins, in the liquid product. represents the carbon oxide selectivity to CO.
represents the selectivity to α-olefin relative to all olefins in the liquid product. These results were
recorded after 20 h of reaction. ................................................................................................................... 72
Figure 3.8. Time evolution of the (a) conversion and (b) CO selectivity represented by and (c) product
selectivity during the gas-phase decarbonylation of heptanoic acid over 10 wt% Pd/Norit C at 573 K and
0.05 cm3 min-1 of liquid feed composed by 95 wt% heptanoic acid (6.6 M) and 5 wt% dodecane. The product
selectivity in (c) is represented with color bars where represents 1-hexene, represents 2 and 3-hexenes,
represents hexane, represents 7-tridecanone, and represents the unknown products. ................... 75
Figure 3.9. Comparison of the XRD patterns of 10 wt% Pd/Norit C run at 573 K after different reaction
conditions. The patterns were offset for clarity. ......................................................................................... 77
Figure 3.10. Bright field HRTEM images of 10 wt% Pd/Norit C fresh (left), spent during liquid-phase
operation, and spent during the gas-phase operation at 573 K. The spent samples were recovered from the
reactor and treated as described in the Experimental Methods section. ...................................................... 78
Figure 3.11. Comparison of the XRD patterns of 20 wt% Pd/Norit C after the liquid-phase operation at 573
K and different acid concentrations. The patterns were offset for clarity. The spent samples were recovered
from the reactor and treated as described in the Experimental Methods section ........................................ 79
xv
Figure 3.12. BF-HRTEM images of 20 wt% Pd/Norit C after the liquid-phase operation at 573 K and
different acid concentrations. The spent samples were recovered from the reactor and treated as described
in the Experimental Methods section. ......................................................................................................... 80
Figure 4.1. Schematic of the reactor system. TC refers to temperature controller, PG refers to pressure
gauge, PC refers to the back pressure regulator. ......................................................................................... 92
Figure 4.2. Comparison of the XRD patterns of 5 wt% Rh/SiO2, 10 wt% Pt/SiO2, 5 wt% Pd/SiO2, and 20
wt% Pd/Carbon before (fresh) and after (spent) reaction at 573 K. The patterns were offset for clarity. The
spent samples were recovered from the reactor and treated as described in the Experimental Methods
section. The spent catalysts were collected after 25 h under reaction conditions. ...................................... 98
Figure 4.3. TEM images of fresh (left) and spent at 573 K (right) of 5 wt% Rh/SiO2, 10 wt% Pt/SiO2, 5
wt% Pd/SiO2, and 20 wt% Pd/Carbon, respectively. The spent samples were recovered from the reactor and
treated as described in the Experimental Methods section. The spent catalysts were collected after 25 h
under reaction conditions. ........................................................................................................................... 99
Figure 4.4. Time evolution of the (a) deoxygenation conversion, (b) CO selectivity during the
deoxygenation of propanoic acid at 573 K over 5 wt% Rh/SiO2, 10 wt% Pt/SiO2, and 5 wt% Pd/SiO2, run
at 1 bar, and 0.05 cm3min-1 of liquid feed composed of 95 wt% propanoic acid and 5 wt% octane. The time
evolution of the deoxygenation product selectivity is represented in (c) for 5 wt% Rh/SiO2, (d) for 10 wt%
Pt/SiO2, and (e) for 5 wt% Pd/SiO2. .......................................................................................................... 101
Figure 4.5. Determination of initial rates (mol h-1) by extrapolation to t = 0 h. represents 5 wt% Rh/SiO2,
represents 10 wt% Pt/SiO2, and represents 5 wt% Pd/SiO2. The reactions conditions were 573 K and
1 bar, and 0.05 cm3min-1 of liquid feed composed of 95 wt% propanoic acid and 5 wt% octane. ........... 102

xvi
Figure 4.6. Time evolution of the (a) deoxygenation conversion, (b) CO selectivity, and (c) deoxygenation
product selectivity during the deoxygenation of propanoic acid at 573 K over 20 wt% Pd/Carbon run at 1
bar, and 0.05 cm3min-1 of liquid feed composed of 95 wt% propanoic acid and 5 wt% octane. .............. 104
Figure 4.7. TEM images of spent 20 wt% Pd/Carbon (left) and spent 5 wt% Pd/SiO2 (right) at 553 (top) and
533 K (bottom). The spent samples were recovered from the reactor and treated as described in the
Experimental Methods section. The spent catalysts were collected after 25 h under reaction conditions.
.................................................................................................................................................................. 106
Figure 4.8. Time evolution of the (a) deoxygenation conversion and (b) CO selectivity during the
deoxygenation of propanoic acid at 533 K over 5 wt% Pd/SiO2 and 20 wt% Pd/Carbon run at 1 bar, and
0.05 cm3min-1 of liquid feed composed of 95 wt% propanoic acid and 5 wt% octane. The time evolution of
the deoxygenation product selectivity is represented in (c) for over 5 wt% Pd/SiO2 and (d) for 20 wt%
Pd/Carbon. ................................................................................................................................................ 108
Figure 4.9. Arrhenius-type plots of the initial rates for propanoic acid conversion over (a) 5 wt% Pd/SiO2
and (b) 20 wt% Pd/Carbon. ....................................................................................................................... 109
Figure 4.10. Effect of partial pressure of propanoic acid (PPAc) on initial TOF over 20 wt% Pd/C at 1 bar of
total pressure and 533 K. The average PPA was determined from the initial and final PPA. The dotted lines
are not linear fits, they are meant to guide the reader. .............................................................................. 110
Figure 4.11. Effect of partial pressure on site time yield (STY) during the deoxygenation of propanoic acid
over 20 wt% Pd/C at 533 K. The initial partial pressure of propanoic acid was (a) 1.00, (b) 0.10, and (c)
0.05 bar. represents ethylene, represents ethane, represents 3-pentanone, represents CO, and
represents CO2. The STY was calculated using the Pd dispersion of the fresh catalysts. .................... 112
Figure 4.12. Deoxygenation of propanoic anhydride at (a) 1.00 bar for the high initial partial pressure
experiment and (b) 0.025 bar for the low initial partial pressure experiment over 20 wt% Pd/Carbon at 533

xvii
K and 1 bar. represents ethylene, represents ethane, represents 3-pentanone, represents
propanoic acid, represents CO, and represents CO2. The STY was calculated using the Pd dispersion
of the fresh catalysts. ................................................................................................................................. 114
Figure B.1. Calibration curve for 1-hexene .............................................................................................. 138
Figure B.2. Calibration curve for hexane .................................................................................................. 138
Figure B.3. Calibration curve for 7-tridecanone ....................................................................................... 139
Figure B.4. Calibration curve for heptanoic acid ...................................................................................... 139
Figure B.5. Calibration curve for CO2 ...................................................................................................... 140
Figure B.6. Calibration curve for CO ....................................................................................................... 140
Figure B. 7. Calibration curve for propanoic acid .................................................................................... 141
Figure B. 8. Calibration curve for 3-pentanone ........................................................................................ 141
Figure B. 9. Calibration curve for ethane .................................................................................................. 142
Figure B. 10. Calibration curve for ethylene ............................................................................................ 142
Figure D. 1. Catalytic conversion of propanoic anhydride diluted (33 mol %) with ethylene (A) and 3-
pentanone (B) over 20 wt% Pd/Norit C at 573 K and 1 bar. represents ethylene, represents ethane,
represents 3-pentanone, represents propanoic acid, represents CO, and represents CO2. The STY
was calculated using the Pd dispersion of the fresh catalysts. ................................................................. 146
xviii
Figure E. 1. Thermogravimetric analysis of spent 5 wt% Pd/SiO2 with Air up to 1295 K. represents
Weight (%) and can be read on the left hand axis. represents Deriv. Weight (% K-1) and can be read on
the right hand axis. The spent catalyst was recovered after the decarbonylation of propanoic acid at 533 K
and 1 bar. .................................................................................................................................................. 148
Figure E. 2. TEM images of spent 5 wt% Pd/SiO2 after TGA analysis with Air flowing at 100 cm3 min-1 at
1475 K (A), 1173 K (B), 1073 K (C), 873 K (D), 773 K (E), and 623 K (D) (left) and spent 5 wt% Pd/SiO2
(right) at 553 (top) and 533 K (bottom). ................................................................................................... 149
Figure E. 3. Thermogravimetric analysis of spent 20 wt% Pd/Norit C with Air (top), He (middle), and H2
(bottom) up to 1095 K. represents Weight (%) and can be read on the left hand axis. represents Deriv.
Weight (% K-1) and can be read on the right hand axis. ........................................................................... 150
Figure E. 4. TEM images of 20 wt% Pd/Norit C after regeneration at 623 K with and N2 plus H2 treatment
(A) and H2 treatment (B). .......................................................................................................................... 151

xix
List of Tables
Table 1.1. Summary of literature results during the liquid-phase reaction obtained using a semibatch reactor
...................................................................................................................................................................... 5
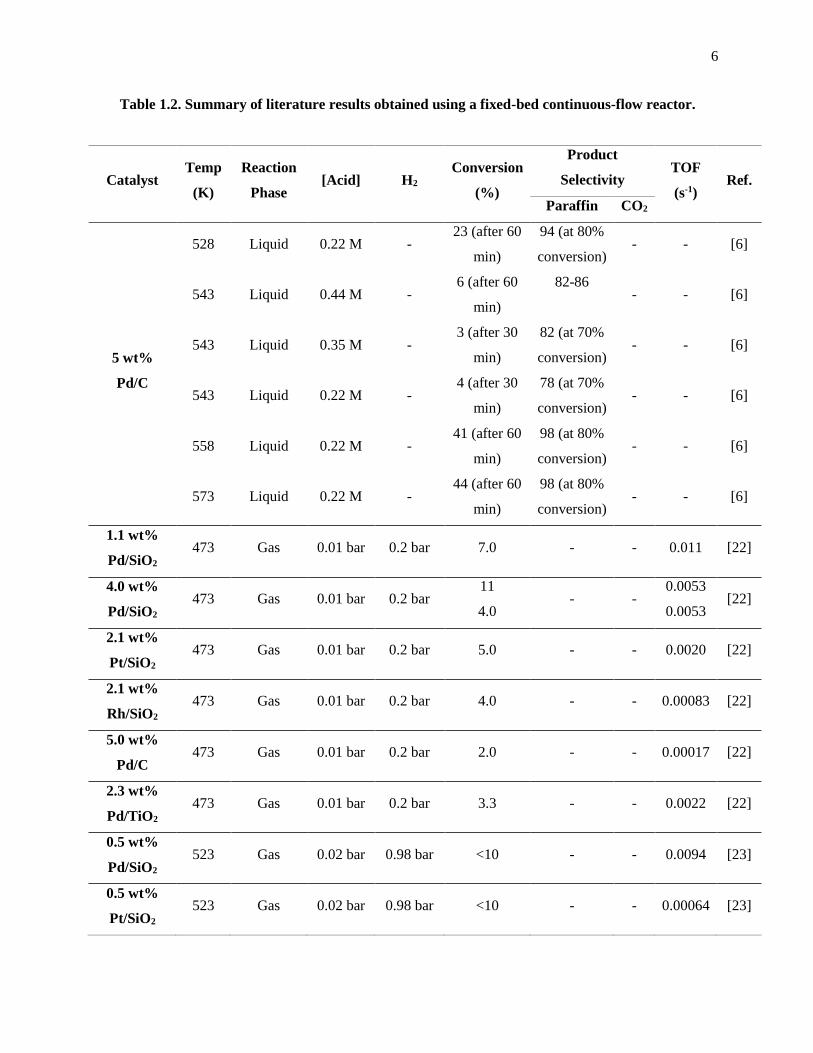
Table 1.2. Summary of literature results obtained using a fixed-bed continuous flow reactor..................... 6
Table 2.1. Summary of the characterization results for 5 wt% Pt on different supports. ........................... 25
Table 2.2. Effect of support on the reaction of heptanoic acid over Pt nanoparticles. ................................ 26
Table 2.3. Result of the characterization of 3 wt% Pt/Norit C reduced at 4 different temperatures ........... 28
Table 2.4. Effect of metal dispersion on the decarbonylation/decarboxylation of heptanoic acid over 3 wt%
Pt/Norit C. ................................................................................................................................................... 32
Table 2.5. Effect of Pt loading on heptanoic acid reaction over Pt/Norit C at 553 K and 573 K. .............. 33
Table 3.1. Summary of the catalyst characterization and reactivity results for Pd catalysts synthesized by
alcohol reduction (AR) during the liquid-phase reaction at 573 K. ............................................................ 61
Table 3.2. Summary of catalysts characterization and reactivity results for Pd catalysts synthesized by
incipient wetness impregnation (IWI) during the liquid-phase reaction at 573 K. ..................................... 62
Table 4.1. Summary of the catalyst characterization and reactivity results for silica-supported Rh and Pt
catalysts. ...................................................................................................................................................... 97
Table 4.2. Summary of catalysts characterization and reactivity results for Pd catalysts ........................... 97
Table A.1. Summary of transport phenomena analysis ............................................................................ 137

xx
Table C.1. Summary of reactivity results for 20 wt% Pd/NoritC operated at different acid concentrations at
573 K and liquid-phase conditions............................................................................................................. 144
Table D. 1. Result of reactivity of propanoic anhydride (33 mol%) co-fed with ethylene (67 mol%) or 3-
pentanone (67 mol%) over 20 wt% Pd/Norit C at 533 K. ......................................................................... 146
Table E. 1. Result of reactivity of propanoic anhydride over 20 wt% Pd/Norit C at 533 K after regeneration
with N2 and H2 treatments ......................................................................................................................... 152
xxi
List of Schemes
Scheme 1.1. Deoxygenation reactions of carboxylic acids ........................................................................... 2
Scheme 1.2. Hydrogenation/dehydrogenation of decarbonylation/decarboxylation products ...................... 2
Scheme 1.3. Ketonization of heptanoic acid scheme 3
Scheme 2.1. Decarbonylation and decarboxylation of heptanoic acid ....................................................... 15
Scheme 2.2. Ketonization of heptanoic acid ............................................................................................... 16
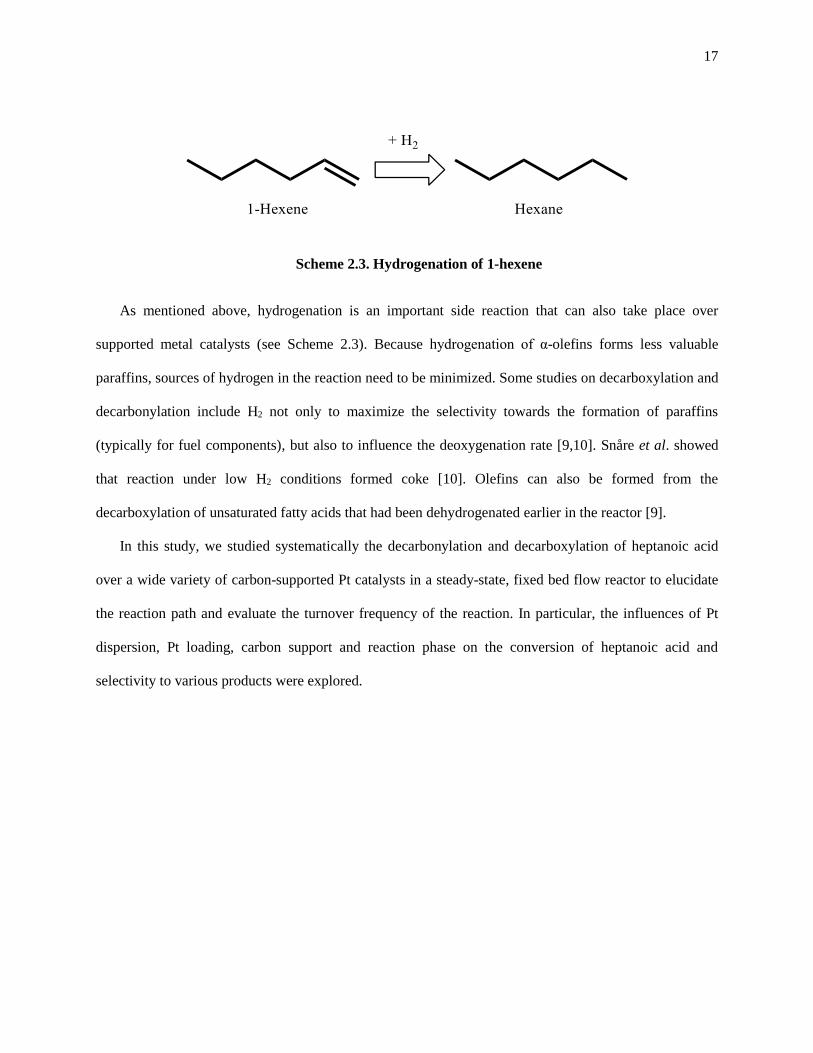
Scheme 2.3. Hydrogenation of 1-hexene .................................................................................................... 17
Scheme 2.4. Water-gas shift (WGS) reaction 39
Scheme 3.1. Decarbonylation and decarboxylation of heptanoic acid ....................................................... 54
Scheme 3.2. Ketonization of heptanoic acid ............................................................................................... 55
Scheme 3.3. Some possible side reactions during the conversion of heptanoic acid .................................. 74
Scheme 4.1. Decarbonylation and decarboxylation of propanoic acid ....................................................... 87
Scheme 4.2. Ketonization of propanoic acid .............................................................................................. 88
Scheme 4.3. Propanoic anhydride as a reaction intermediate for the decarbonylation of propanoic acid.113
Scheme D. 1. Formation of 3-pentanone through a coupling reaction of propanyl and ethylene ............. 147
Scheme D. 2. Formation of propanoic acid through the dimerization of 3-pentanone. R’ represents CH2-
CH3 and R’’ represents CH3 ...................................................................................................................... 147
xxii
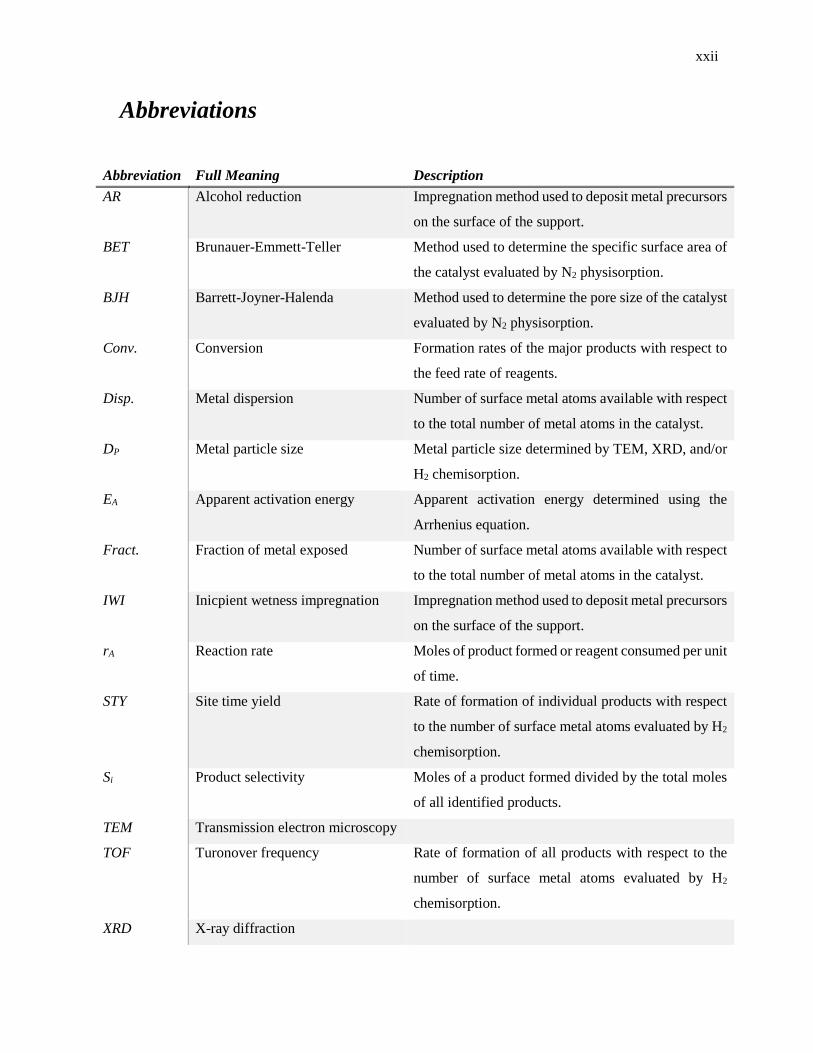
Abbreviations
Abbreviation Full Meaning Description
AR Alcohol reduction Impregnation method used to deposit metal precursors
on the surface of the support.
BET Brunauer-Emmett-Teller Method used to determine the specific surface area of
the catalyst evaluated by N2 physisorption.
BJH Barrett-Joyner-Halenda Method used to determine the pore size of the catalyst
evaluated by N2 physisorption.
Conv. Conversion Formation rates of the major products with respect to
the feed rate of reagents.
Disp. Metal dispersion Number of surface metal atoms available with respect
to the total number of metal atoms in the catalyst.
DP Metal particle size Metal particle size determined by TEM, XRD, and/or
H2 chemisorption.
EA Apparent activation energy Apparent activation energy determined using the
Arrhenius equation.
Fract. Fraction of metal exposed Number of surface metal atoms available with respect
to the total number of metal atoms in the catalyst.
IWI Inicpient wetness impregnation Impregnation method used to deposit metal precursors
on the surface of the support.
rA Reaction rate Moles of product formed or reagent consumed per unit
of time.
STY Site time yield Rate of formation of individual products with respect
to the number of surface metal atoms evaluated by H2
chemisorption.
Si Product selectivity Moles of a product formed divided by the total moles
of all identified products.
TEM Transmission electron microscopy
TOF Turonover frequency Rate of formation of all products with respect to the
number of surface metal atoms evaluated by H2
chemisorption.
XRD X-ray diffraction

1
Chapter 1: Introduction
Portions of this Introduction Chapter are based on the content of Chapters 2, 3, and 4.
1.1. Motivation
The world is now approaching a great turning point like never before. Societies all over the world are
encouraged to utilize renewable energies such as solar, wind, hydroelectricity, and biomass [1]. One of
the major driving forces to use renewable energy is to secure access to energy at an affordable price,
which is complicated since the world demand for energy is constantly growing due to the increased
consumption in the developing world. Another driving force to develop clean and renewable energy
sources is the threat of climate change that results from the anthropogenic emission of CO2 into the
atmosphere [1]. Biomass represents an alternative to fossil fuels as an abundant carbon-neutral resource.
However, it represents a chemical challenge because biomass requires a set of oxygen removal reactions
to convert over-functionalized molecules into oxygen-free hydrocarbons [2]. Therefore, new renewable
conversion technologies need to be developed using biomass as feedstock to meet the growing energy,
fuel, and chemical demand of the 21st century.
Conversion of biomass feedstocks to oxygen-free hydrocarbons can be accomplished reactions such
as dehydration, ketonization, decarbonylation and decarboxylation [2]. This set of reactions is collectively
known as deoxygenation. Decarbonylation and decarboxylation reactions are of special interest because
they represent a novel method for production of fuels from carbon neutral renewable resources such as
vegetable oils and animal fats. The carbonyl group is removed from the fatty acid structure via production
of CO2, and/or CO, thus producing a linear alkane or alkene present at the fatty acid alkyl group, as
shown in Scheme 1.1.
2
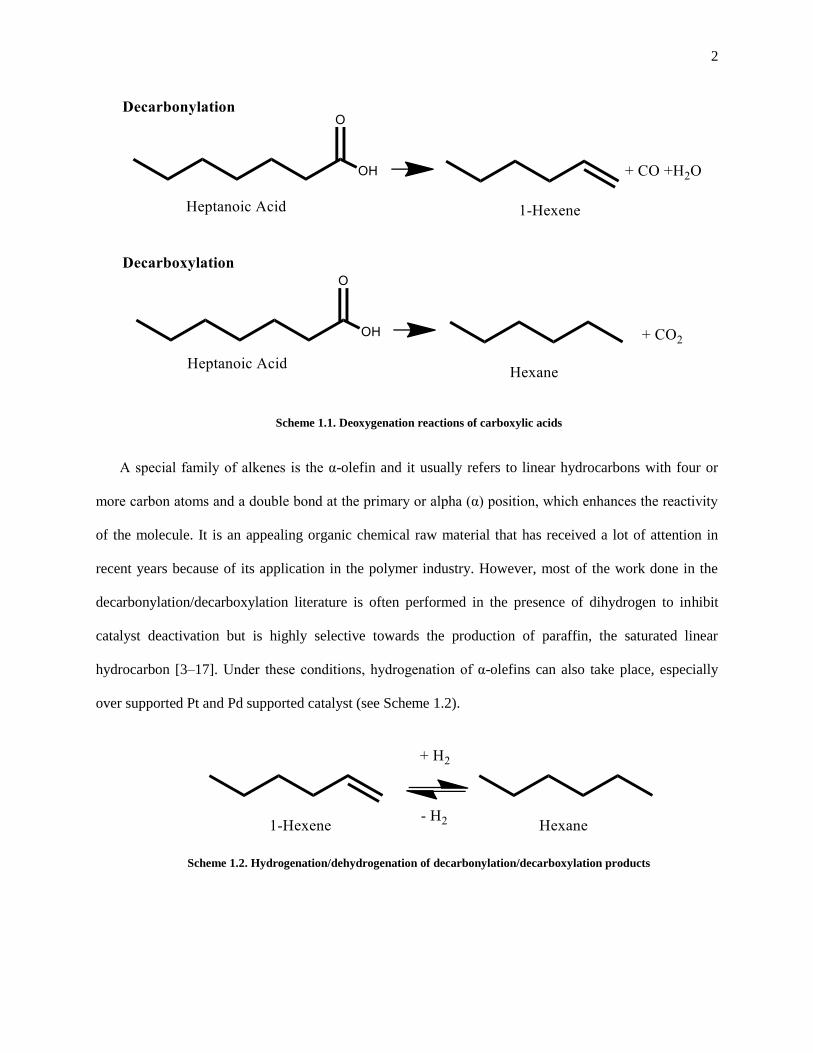
Scheme 1.1. Deoxygenation reactions of carboxylic acids
A special family of alkenes is the α-olefin and it usually refers to linear hydrocarbons with four or
more carbon atoms and a double bond at the primary or alpha (α) position, which enhances the reactivity
of the molecule. It is an appealing organic chemical raw material that has received a lot of attention in
recent years because of its application in the polymer industry. However, most of the work done in the
decarbonylation/decarboxylation literature is often performed in the presence of dihydrogen to inhibit
catalyst deactivation but is highly selective towards the production of paraffin, the saturated linear
hydrocarbon [3–17]. Under these conditions, hydrogenation of α-olefins can also take place, especially
over supported Pt and Pd supported catalyst (see Scheme 1.2).
Scheme 1.2. Hydrogenation/dehydrogenation of decarbonylation/decarboxylation products

3
Scheme 1.3. Ketonization of heptanoic acid scheme
Gaertner et al. showed that ketonization can play a key role in upgrading fatty acids into fine
chemicals [18]. This process allows the coupling of two carboxylic acids into a larger ketone with the
simultaneous removal of oxygen in the form of CO2 and H2O, as depicted in Scheme 1.3. Gaertner et al.
also theorized that ketonization could be an intermediate step in the deoxygenation reaction [19], and in
the presence of a transition metal, the ketone could further react to form olefins, mostly α-olefins, and
CO. The ketonization reaction is often referred to as ketonic decarboxylation.
1.2. Effect of Metal
In 1982, Maier et al. studied the decarboxylation of fatty acid for production of fuel-like
hydrocarbons [20]. In their work, they showed that supported metal catalysts, especially palladium (Pd)
and nickel (Ni), are highly selective towards deoxygenation products however, the use of hydrogen as
reaction gas was essential. Murzin and co-workers studied several other supported metals such as
ruthenium (Ru), platinum (Pt), iridium (Ir), osmium (Os), and rhodium (Rh), and it was concluded that
the most promising transition metals are Pd and Pt, which achieved more than 90% selectivity towards
alkane and alkene production when supported on carbon [14]. Nickel has also been extensively studied
for deoxygenation, but it is not an attractive metal because it particularly favors alkane production and
cracking [6,10,12,21].
Relatively little has been reported on the conversion of fatty acids to olefins, with generally poor
results achieved in terms of catalyst efficiency and selectivity towards terminal olefin formation in the
product [3]. Because the different studies were run at different concentrations of H2, conversion levels,
4
amounts of catalyst, time on stream, and the results such as turnover frequency (TOF), conversions, and
product selectivities were not always reported, it is still unclear which metals are more selective towards
the formation of alpha-olefins. Furthermore, TOF values were not always provided because of a lack of
catalyst characterization and/or proper data analysis [4]. Therefore, the field would benefit from a greater
understanding of the different behaviors of the metals under H2-free conditions to determine which one is
more selective towards the formation of α-olefins. Some of the literature results are summarized in Tables
1.1 and 1.2 for studies performed using a semibatch reactor and continuous flow fixed-bed reactor,
respectively.
1.3. Effect of support
Snåre et al. showed that Pt, Rh, and Pd nanoparticles displayed very different activity and product
distribution when supported on alumina instead of carbon during liquid-phase operation [3]. Ford et al.
showed that when Pd nanoparticles were supported on carbon instead of silica, the TOF of the reaction
increased an order of magnitude, from 0.055 to 0.206 s-1, for the liquid-phase deoxygenation of succinic
acid at 573 K [17]. However, Lugo-José et al. showed a TOF decrease of an order of magnitude when Pd
nanoparticles were supported over carbon instead of silica, from 0.0053 to 0.0002 s-1, for the gas-phase
deoxygenation of propanoic acid at 573 K.
Although seemingly contradictory, it is very difficult to explain these behaviors because the catalysts
were run under completely different conditions and they were not completely characterized before and
after reaction. Therefore, various supports will be used in this work to deposit transition metal
nanoparticles. These supported catalysts will be then tested under identical conditions and characterized
before and after reaction to explain differences in behaviors (if any).

5
Table 1.1. Summary of literature results during the liquid-phase reaction obtained using a
semibatch reactor.
Catalyst Temp
(K) [Acid] H2
Conversion
(%)
Product Selectivity TOF
(s-1) Ref.
Paraffin CO2
1 wt% Pd/C
573 0.14 M - 33.4 (after 6 h) 52 (after 6 h) - - [3]
573 0.15 M 1 vol% 23 (after 5.5 h) - - 0.01 [9]
573 - 5 vol%
(17.5 bar)
68
100
99
96
49
52
54
51
-
-
-
-
0.030
0.076
0.110
0.012
[14]
[14]
[14]
[14]
4 wt% Pd/C
543
573
603
- - - - -
0.13
1.1
1.7
[5]
[5]
[5]
5 wt% Pd/C
573 0.14 M - 100 (after 6 h) 95 (after 6 h) - - [3]
573 - - 41 - 0.067 [10]
633 - 1290 kPa 49 - 0.078 [10]
633 - 70 kPa 62 - 0.126 [10]
573 1.6 M - 22 (after 6 h) 80 (at 30%
conversion) - 0.01 [11]
573 - 5 vol%
(15 atm) - -
95
92
0.083
0.053
[15]
[15]
573 - 10 vol%
(15 atm) - -
92
89
0.018
0.076
[16]
[16]
573 0.19 M 5 vol%
(15 atm) - - 95 0.21 [17]
5 wt%
Pd/SiO2 573 0.19 M
5 vol%
(15 atm) - -
49
66
0.089
0.055
[17]
[17]
5 wt%
Pd/Al2O3 573 0.19 M
5 vol%
(15 atm) - - 84 0.029 [17]
10 wt% Pd/C 573 0.14 M - 48 (after 6 h) 60 (after 6 h) - - [3]
5 wt% Pt/C 573 0.14 M - 86 (after 6 h) 87 (after 6 h) - - [3]
1 wt% Rh/C 573 0.14 M - 18 (after 6 h) 18 (after 6 h) - - [3]
6
Table 1.2. Summary of literature results obtained using a fixed-bed continuous-flow reactor.
Catalyst Temp
(K)
Reaction
Phase [Acid] H2
Conversion
(%)
Product
Selectivity TOF
(s-1) Ref.
Paraffin CO2
5 wt%
Pd/C
528 Liquid 0.22 M - 23 (after 60
min)
94 (at 80%
conversion) - - [6]
543 Liquid 0.44 M - 6 (after 60
min)
82-86
- - [6]
543 Liquid 0.35 M - 3 (after 30
min)
82 (at 70%
conversion) - - [6]
543 Liquid 0.22 M - 4 (after 30
min)
78 (at 70%
conversion) - - [6]
558 Liquid 0.22 M - 41 (after 60
min)
98 (at 80%
conversion) - - [6]
573 Liquid 0.22 M - 44 (after 60
min)
98 (at 80%
conversion) - - [6]
1.1 wt%
Pd/SiO2 473 Gas 0.01 bar 0.2 bar 7.0 - - 0.011 [22]
4.0 wt%
Pd/SiO2 473 Gas 0.01 bar 0.2 bar
11
4.0 - -
0.0053
0.0053 [22]
2.1 wt%
Pt/SiO2 473 Gas 0.01 bar 0.2 bar 5.0 - - 0.0020 [22]
2.1 wt%
Rh/SiO2 473 Gas 0.01 bar 0.2 bar 4.0 - - 0.00083 [22]
5.0 wt%
Pd/C 473 Gas 0.01 bar 0.2 bar 2.0 - - 0.00017 [22]
2.3 wt%
Pd/TiO2 473 Gas 0.01 bar 0.2 bar 3.3 - - 0.0022 [22]
0.5 wt%
Pd/SiO2 523 Gas 0.02 bar 0.98 bar <10 - - 0.0094 [23]
0.5 wt%
Pt/SiO2 523 Gas 0.02 bar 0.98 bar <10 - - 0.00064 [23]
7
1.4. Effect of concentration
Most of the experiments with carboxylic acid deoxygenation over Pd catalysts involved a long chain
hydrocarbon as solvent [3,8,9,11,12,15–17,22–25] and co-feeding H2 [9,10,14–17,22,23,25] to enhance
the TOF and the stability of the catalyst. Under these conditions, liquid-phase TOF values reported over
Pd ranged from 0.01 to 0.96 s-1 for batch reaction at 573 K [10,11,15,16] and from 0.027 to 0.004 s-1 for
fixed-bed operation at 543 K [4,6].
Mäki-Arvela et al. showed that when the concentration of lauric acid decreases from 0.44 to 0.22 mol
L-1 the steady state reaction rates did not change [6]. Similarly, Snåre et al. reported a zero order regime at
concentrations between 0.15 and 1.5 mol L-1 [8]. However, Bartosz et al. showed that the reaction rate
increases when the concentration of fatty acid decreases from 0.6 to 0.15 mol L-1 [7]. Furthermore, Immer
et al. showed that as the concentration of fatty acid decreases, the decarboxylation rate decays rapidly
whereas the decarbonylation rate increases [16]. This led to a switchover in product selectivity from
paraffins and CO2 (typical of decarboxylation) to olefins and CO (typical of decarbonylation) which led
to a decrease in total deoxygenation rate. However, when the concentration of fatty acid was lowered, the
decarbonylation rate decreased and the decarboxylation rate increased and the product switchover was
reversed [16]. More recently, Lugo-José et al. showed that during gas-phase reaction of propanoic acid at
1 bar and 473 K, there were two reaction orders as a function of the propanoic acid partial pressure, zero
at high partial pressures and 0.5 at low partial pressures [22]. While the zero reaction order regime that
Lugo-José et al. reported is in agreement with Mäki-Arvela et al. [6] results, the 0.5 reaction order regime
at low partial pressures is in disagreement with the findings of Immer et al. [16].
Whereas the literature results seem to be inconsistent and sometimes contradictory, differences in
acid concentrations, reactor configuration, and reaction phase, could account for some of the differences
observed among studies. The field would benefit from understanding the effect of acid concentration on
catalyst stability, activity, and product distribution, during the liquid- and gas-phase reaction.

8
1.5. Catalyst deactivation and regeneration
Catalyst deactivation during the deoxygenation of carboxylic acids has been widely reported in the
literature. Snåre et al. [12] and Mäki-Arvela et al. [6] suggested that deactivation of Pd/carbon originated
from poisoning of the metal by the reactants and products (especially CO), as well as by coking.
Furthermore, Simakova et al. reported that deactivating aromatics are formed in reactions performed
under H2-scarce conditions [9]. However, Ping et al. concluded that the observed deactivation did not
result from coke formation, but from deposition of organic molecules onto the active sites [24]. In that
study, Ping et al. regained the catalytic activity of Pd/SiO2 after hot extraction with solvent and
subsequent reduction in H2 at 573 K [24]. The initial concentration of carboxylic acid was also proposed
to influence catalyst deactivation. Mäki-Arvela et al. observed that deactivation was more extensive with
higher initial concentration of carboxylic acid [6].
Whereas it is clear that a metal catalyst could deactivate during reaction and, in some cases, the
catalytic activity can be recovered using mild regeneration methods, the lack of catalyst characterization
after reaction and/or regeneration makes it difficult to understand the deactivation mechanism. The field
would benefit from using standard characterization techniques of deactivated catalysts to determine the
deactivation mechanism and regeneration of the catalyst.
1.6. Reaction kinetics and mechanism
Whereas most of the previous studies concluded that decarboxylation is the main reaction of
carboxylic acid over Pd catalysts, more recent studies showed that decarbonylation is in fact the main
reaction [22,25]. However, some of these studies showed that the formation rate of alkenes did not match
that of CO [4,11].
As mentioned earlier, Immer et al. showed that as the concentration of fatty acids decreases, the
decarboxylation rate decayed rapidly whereas the decarbonylation rate increased [16]. This led to a
switchover in product selectivity from paraffins and CO2 to olefins and CO which led to a decrease in
total deoxygenation rate. However, when the concentration of fatty acid was decreased, the

9
decarbonylation rate decreased and the decarboxylation rate increased and the product switchover was
reversed [16]. This implies a complex relationship exists between the metal surface and surrounding
environment.
Although Snåre et al. reported a zero order regime at concentrations between 0.15 and 1.5 mol L-1,
first order kinetics were used to estimate activation barriers [8]. In the same study, Snåre et al. reported
catalyst deactivation during their kinetic study, but they did not account for it when obtaining activation
barriers or reaction orders. As mentioned above, Lugo-José et al. showed that during gas-phase reaction
of propanoic acid at 1 bar and 473 K, there were two reaction orders as a function of the propanoic acid
partial pressure, zero at high partial pressures and 0.5 at low partial pressures [22]. While the zero
reaction order regime that Lugo-José et al. reported is in agreement with Mäki-Arvela et al. [6] results,
the 0.5 reaction order regime at low partial pressures is in disagreement with the findings of Immer et al.
[16] Although seemingly contradictory, the differences in reaction mechanism and reaction order reported
in the literature could be the result of performing the experiments on deactivated catalysts and/or under
different reaction conditions such as conversion, acid concentration, and reaction phase. The field would
strongly benefit from developing a fundamental understanding of how to perform reaction kinetics under
reaction conditions that deactivate catalysts.
1.7. Focus of this work
While there is already extensive work on the decarbonylation/decarboxylation of fatty acids, the
differences in reaction conditions between studies have led to conflicting results, especially in terms of
turnover frequency (TOF), catalyst stability, and reaction mechanism. In light of the previous discussion,
this thesis addresses the following topics:
1. The effect of metal and support on catalyst activity and product selectivity
2. The effect of reaction conditions on catalyst stability and product selectivity
3. The reaction mechanism and possible reaction intermediates at different reaction conditions

10
Chapter 2 presents a study of the decarbonylation of heptanoic acid with a goal of forming α-olefins
over Pt nanoparticles during the liquid- and gas-phase operation at different conversion levels. Chapter 3
focuses on the stability of Pd nanoparticles during the liquid- and gas-phase conversion of heptanoic acid.
Chapter 4 provides an in depth investigation of gas-phase decarbonylation unveils mechanistic insights on
the decarbonylation of propanoic acid over silica- and carbon-supported Pt, Rh and Pd nanoparticles.
In this work, a laboratory scale continuous flow fixed bed reactor system was designed and built to
study the liquid- and gas-phase deoxygenation reaction over different transition metal catalysts with two
different carboxylic acids, heptanoic and propanoic acid. The reagents, diluents, and reaction products
were analyzed using gas chromatography. A flame ionization detector (FID) was used to analyze
condensable products (mainly hexane, 1-hexene, hexenes, 7-tridecanone, and 3-tridecanone), unreacted
reagents (mainly heptanoic acid and propanoic acid), internal standard (octane and dodecane), and
diluents (hexane and tetradecane). A thermal conductivity detector (TCD) was used to analyze products
that cannot be condensed at room temperature (mainly CO, CO2, ethylene, and ethane) and gaseous
external standards (N2 and methane).
A variety of characterization techniques were used to study the fresh catalysts, used catalysts and
regenerated catalysts, including X-ray diffraction (XRD), transmission electron microscopy (TEM), N2
physisorption, H2 chemisorption, and thermogravimetric analysis (TGA).
1.8. References
[1] 2008, National Research council. America’s Energy Future. Summary of a meeting 2008.
[2] Ragauskas, A. J., Williams, C. K., Davison, B. H., Britovsek, G., Cairney, J., Eckert, C. A.,
Frederick, W. J., Hallett, J. P., Leak, D. J., Liotta, C. L., Mielenz, J. R., Murphy, R., Templer, R.,
and Tschaplinski, T., 2006, “The path forward for biofuels and biomaterials.,” Science, 311(5760),
pp. 484–9.
11
[3] Snåre, M., Kubicková, I., Mäki-Arvela, P., Eränen, K., and Murzin, D. Y., 2006, “Heterogeneous
Catalytic Deoxygenation of Stearic Acid for Production of Biodiesel,” Ind Eng Chem Res, 45(45),
pp. 5708–5715.
[4] Lestari, S., Mäki-Arvela, P., Bernas, H., Simakova, O., Sjoholm, R., Beltramini, J., Lu, G. Q. M.,
Myllyoja, J., Simakova, I., and Murzin, D. Y., 2009, “Catalytic Deoxygenation of Stearic Acid in
a Continuous Reactor over a Mesoporous Carbon-Supported Pd Catalyst,” Energ Fuel, 23(8), pp.
3842–3845.
[5] Lestari, S., Simakova, I., Tokarev, A., Mäki-Arvela, P., Eränen, K., and Murzin, D. Y., 2008,
“Synthesis of Biodiesel via Deoxygenation of Stearic Acid over Supported Pd / C Catalyst,” Catal
Lett, 122(3-4), pp. 247–251.
[6] Mäki-Arvela, P., Snåre, M., Eränen, K., Myllyoja, J., and Murzin, D. Y., 2008, “Continuous
decarboxylation of lauric acid over Pd/C catalyst,” Fuel, 87(17-18), pp. 3543–3549.
[7] Rozmysłowicz, B., Mäki-Arvela, P., Lestari, S., Simakova, O. A., Eränen, K., Simakova, I. L.,
Murzin, D. Y., and Salmi, T. O., 2010, “Catalytic Deoxygenation of Tall Oil Fatty Acids Over a
Palladium-Mesoporous Carbon Catalyst : A New Source of Biofuels,” Top Catal, 53(15-18), pp.
1274–1277.
[8] Snåre, M., Kubicková, I., Mäki-Arvela, P., Eränen, K., Wärnå, J., and Murzin, D. Y., 2007,
“Production of diesel fuel from renewable feeds : Kinetics of ethyl stearate decarboxylation,”
Chem Eng J, 134, pp. 29–34.
[9] Simakova, I., Rozmysłowicz, B., Simakova, O. A., Mäki-Arvela, P., Simakov, A., and Murzin, D.
Y., 2011, “Catalytic Deoxygenation of C18 Fatty Acids Over Mesoporous Pd / C Catalyst for
Synthesis of Biofuels,” Top Catal, 54(8-9), pp. 460–466.
12
[10] Kubicková, I., Snåre, M., Eränen, K., Mäki-Arvela, P., and Murzin, D., 2005, “Hydrocarbons for
diesel fuel via decarboxylation of vegetable oils,” Catal Today, 106(1-4), pp. 197–200.
[11] Mäki-Arvela, P., Kubicková, I., Snåre, M., Eränen, K., and Murzin, D. Y., 2007, “Catalytic
Deoxygenation of Fatty Acids and Their Derivatives,” Energ Fuel, 21(1), pp. 30–41.
[12] Snåre, M., Kubicková, I., Mäki-Arvela, P., Chichova, D., Eränen, K., and Murzin, D. Y., 2008,
“Catalytic deoxygenation of unsaturated renewable feedstocks for production of diesel fuel
hydrocarbons,” Fuel, 87(6), pp. 933–945.
[13] Lestari, S., Mäki-Arvela, P., Simakova, I., Beltramini, J., Lu, G. Q. M., and Murzin, D. Y., 2009,
“Catalytic Deoxygenation of Stearic Acid and Palmitic Acid in Semibatch Mode,” Catal Lett,
130(1-2), pp. 48–51.
[14] Simakova, I., Simakova, O., Mäki-Arvela, P., Simakov, A., Estrada, M., and Murzin, D. Y., 2009,
“Deoxygenation of palmitic and stearic acid over supported Pd catalysts : Effect of metal
dispersion,” Appl Catal A-Gen, 355, pp. 100–108.
[15] Immer, J. G., and Lamb, H. H., 2010, “Fed-Batch Catalytic Deoxygenation of Free Fatty Acids,”
Energ Fuel, 130(10), pp. 5291–5299.
[16] Immer, J. G., Kelly, M. J., and Lamb, H. H., 2010, “Catalytic reaction pathways in liquid-phase
deoxygenation of C18 free fatty acids,” Appl Catal A-Gen, 375(1), pp. 134–139.
[17] Ford, J. P., Immer, J. G., and Lamb, H. H., 2012, “Palladium Catalysts for Fatty Acid
Deoxygenation: Influence of the Support and Fatty Acid Chain Length on Decarboxylation
Kinetics,” Top Catal, 55(3-4), pp. 175–184.
13
[18] Gaertner, C. A., Serrano-Ruiz, J. C., Braden, D. J., and Dumesic, J. A., 2010, “Ketonization
Reactions of Carboxylic Acids and Esters over Ceria−Zirconia as Biomass-Upgrading Processes,”
Ind Eng Chem Res, 49(13), pp. 6027–6033.
[19] Gaertner, C. A., Serrano-Ruiz, J. C., Braden, D. J., and Dumesic, J. A., 2009, “Catalytic coupling
of carboxylic acids by ketonization as a processing step in biomass conversion,” J Catal, 266(1),
pp. 71–78.
[20] Maier, W. F., Roth, W., Thies, I., v. Rague Schleyer, P., Ragukschleyer, P., and Schleyer, R.,
1982, “Gas Phase Decarboxylation of Carboxylic Acids,” Chem Ber, 115, pp. 808–812.
[21] Simakova, I., Simakova, O., Mäki-Arvela, P., and Murzin, D. Y., 2010, “Decarboxylation of fatty
acids over Pd supported on mesoporous carbon,” Catal Today, 150(1-2), pp. 28–31.
[22] Lugo-José, Y. K., Monnier, J. R., and Williams, C. T., 2014, “Gas-Phase, Catalytic
Hydrodeoxygenation of Propanoic Acid, Over Supported Group VIII Noble Metals: Metal and
Support Effects,” Appl Catal A-Gen, 469, pp. 410–418.
[23] Alotaibi, M. A., Kozhevnikova, E. F., and Kozhevnikov, I. V., 2012, “Deoxygenation of propionic
acid on heteropoly acid and bifunctional metal-loaded heteropoly acid catalysts: Reaction
pathways and turnover rates,” Appl Catal A-Gen, 447-448, pp. 32–40.
[24] Ping, E. W., Pierson, J., Wallace, R., Miller, J. T., Fuller, T. F., and Jones, C. W., 2011, “On the
nature of the deactivation of supported palladium nanoparticle catalysts in the decarboxylation of
fatty acids,” Appl Catal A-Gen, 396(1-2), pp. 85–90.
[25] Boda, L., Onyestyák, G., Solt, H., Lónyi, F., Valyon, J., and Thernesz, A., 2010, “Catalytic
hydroconversion of tricaprylin and caprylic acid as model reaction for biofuel production from
triglycerides,” Appl Catal A-Gen, 374(1-2), pp. 158–169.

14
Chapter 2. Decarbonylation of Heptanoic Acid over Carbon-Supported
Platinum Nanoparticles
This chapter appears in: Juan A. Lopez-Ruiz and Robert J. Davis, “Decarbonylation of Heptanoic Acid
over Carbon-Supported Platinum Nanoparticles” Green Chem, 2014, 16, 683–694, Copyright (2014) RSC
Green Chemistry
Abstract
The decarbonylation and decarboxylation of heptanoic acid over carbon-supported Pt nanoparticles
were studied in a continuous flow fixed bed reactor at 573 K and 37 bar for liquid-phase operation and 1
bar for gas-phase operation. Under liquid-phase conditions, the TOF over Pt supported on Norit carbon
was 0.0052 s-1 and independent of Pt loading. At very low conversions, approaching zero, the product
selectivity was consistent with decarbonylation as the primary reaction, producing mostly hexenes and
CO. As conversion increased from 1% to 5% at 37 bar, substantial amounts of hexane and CO2 were
observed, presumably from secondary side reactions such as water-gas shift (WGS) and hydrogenation
instead of direct decarboxylation. The terminal olefin was observed with high selectivity (57%) only
during gas-phase operation (1 bar) which facilitated transport of the olefin away from the Pt that also
catalyzed double bond isomerization. Some sintering of the Pt metal particles during reaction of heptanoic
acid was observed by X-ray diffraction analysis of the spent catalyst. Catalyst regeneration studies were
performed over spent catalyst but they failed to restore any catalytic activity.
15
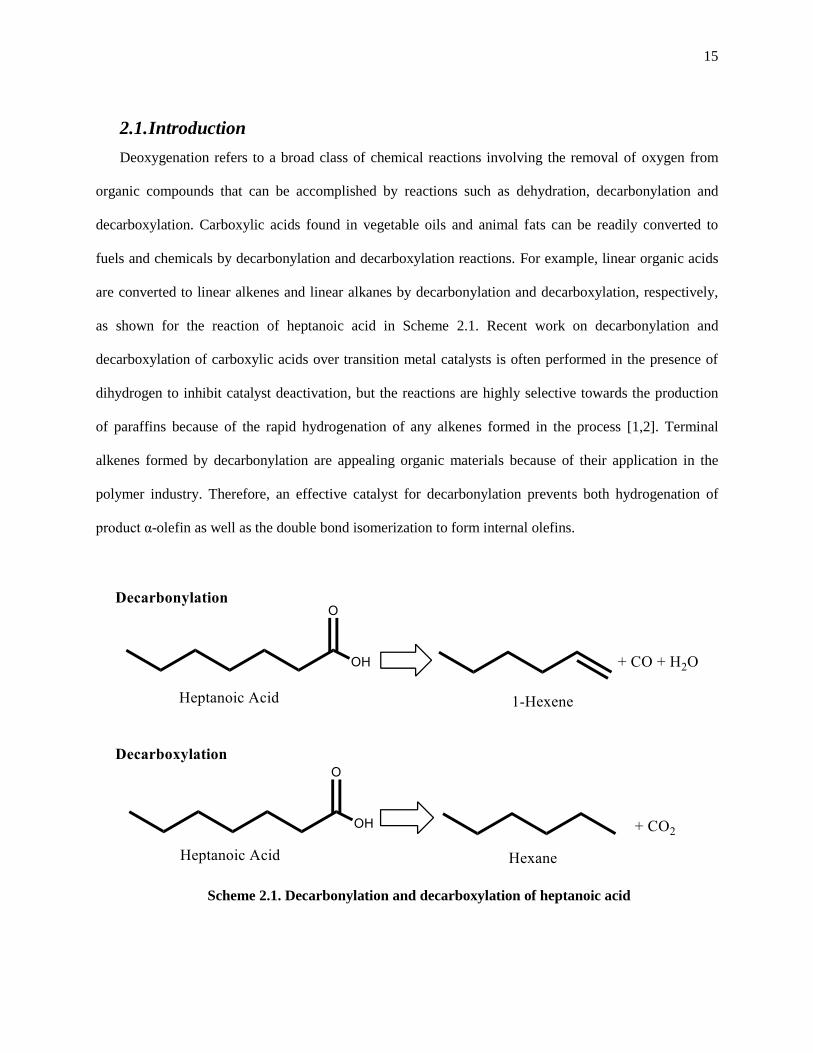
2.1. Introduction
Deoxygenation refers to a broad class of chemical reactions involving the removal of oxygen from
organic compounds that can be accomplished by reactions such as dehydration, decarbonylation and
decarboxylation. Carboxylic acids found in vegetable oils and animal fats can be readily converted to
fuels and chemicals by decarbonylation and decarboxylation reactions. For example, linear organic acids
are converted to linear alkenes and linear alkanes by decarbonylation and decarboxylation, respectively,
as shown for the reaction of heptanoic acid in Scheme 2.1. Recent work on decarbonylation and
decarboxylation of carboxylic acids over transition metal catalysts is often performed in the presence of
dihydrogen to inhibit catalyst deactivation, but the reactions are highly selective towards the production
of paraffins because of the rapid hydrogenation of any alkenes formed in the process [1,2]. Terminal
alkenes formed by decarbonylation are appealing organic materials because of their application in the
polymer industry. Therefore, an effective catalyst for decarbonylation prevents both hydrogenation of
product α-olefin as well as the double bond isomerization to form internal olefins.
Scheme 2.1. Decarbonylation and decarboxylation of heptanoic acid
16
Relatively little has been reported on the conversion of fatty acids to olefins, with generally poor
results being presented in terms of catalyst efficiency and selectivity towards terminal olefin formation in
the product [1,3]. In 1982, Maier et al. studied the decarboxylation of carboxylic acids for production of
fuel-like hydrocarbons [4]. In their work, they showed that supported Pd and Ni catalysts were highly
selective towards deoxygenation products. In 2006, Murzin and coworkers studied several other
supported metals such as Ru, Pt, Ir, Os, and Rh, and they concluded that the most promising of the
transition metals are Pd and Pt, which achieved more than 90% selectivity towards alkane and alkene
production when the metals were supported on carbon [1]. Nickel has also been extensively studied for
deoxygenation of fatty acids and triglycerides, but is not an attractive metal because it favors alkane
production and cracking [1,5,6]. Furthermore, Maier et al. showed that a variety of fatty acids can be
converted over Ni and Pd catalysts via decarboxylation, however, the use of H2 in the reaction was
essential [4].
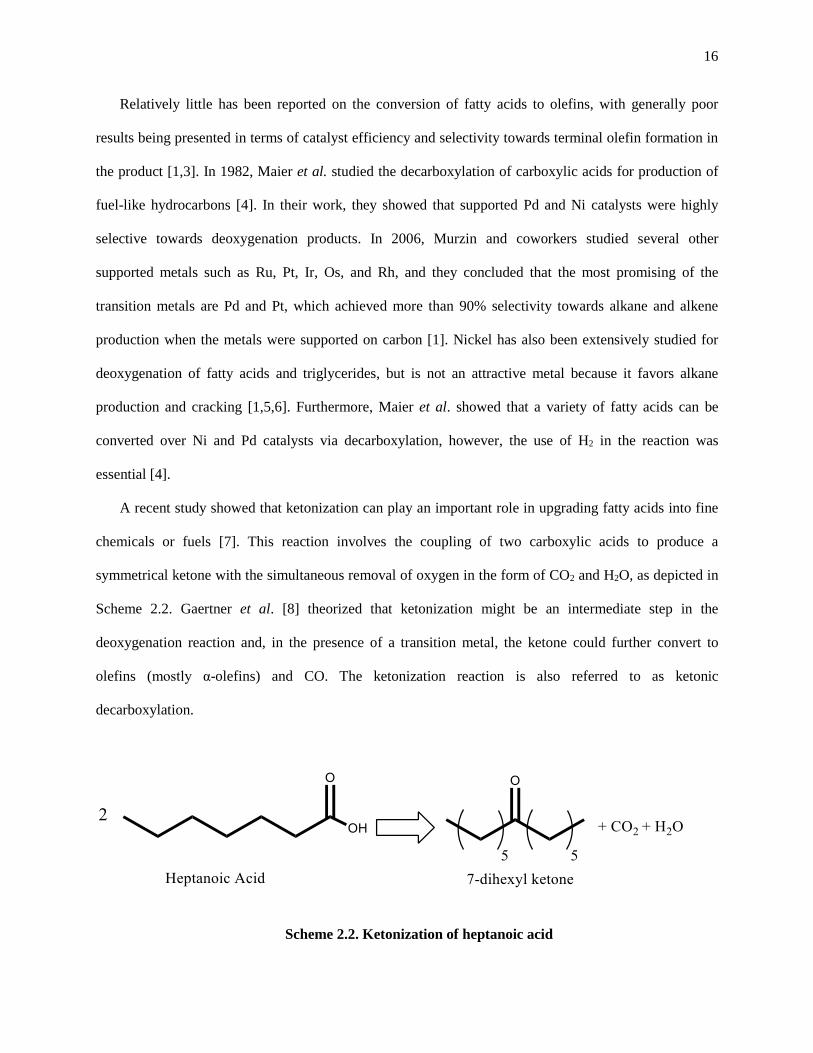
A recent study showed that ketonization can play an important role in upgrading fatty acids into fine
chemicals or fuels [7]. This reaction involves the coupling of two carboxylic acids to produce a
symmetrical ketone with the simultaneous removal of oxygen in the form of CO2 and H2O, as depicted in
Scheme 2.2. Gaertner et al. [8] theorized that ketonization might be an intermediate step in the
deoxygenation reaction and, in the presence of a transition metal, the ketone could further convert to
olefins (mostly α-olefins) and CO. The ketonization reaction is also referred to as ketonic
decarboxylation.
Scheme 2.2. Ketonization of heptanoic acid
17
Scheme 2.3. Hydrogenation of 1-hexene
As mentioned above, hydrogenation is an important side reaction that can also take place over
supported metal catalysts (see Scheme 2.3). Because hydrogenation of α-olefins forms less valuable
paraffins, sources of hydrogen in the reaction need to be minimized. Some studies on decarboxylation and
decarbonylation include H2 not only to maximize the selectivity towards the formation of paraffins
(typically for fuel components), but also to influence the deoxygenation rate [9,10]. Snåre et al. showed
that reaction under low H2 conditions formed coke [10]. Olefins can also be formed from the
decarboxylation of unsaturated fatty acids that had been dehydrogenated earlier in the reactor [9].
In this study, we studied systematically the decarbonylation and decarboxylation of heptanoic acid
over a wide variety of carbon-supported Pt catalysts in a steady-state, fixed bed flow reactor to elucidate
the reaction path and evaluate the turnover frequency of the reaction. In particular, the influences of Pt
dispersion, Pt loading, carbon support and reaction phase on the conversion of heptanoic acid and
selectivity to various products were explored.
18
2.2. Experimental Methods
2.2.1. Catalyst synthesis
The catalysts were prepared by an incipient wetness impregnation method using aqueous
solutions of tetraammineplatinum (II) nitrate, (NH3)4Pt(NO3)2 (Sigma Aldrich) to obtain 1, 3, 5, and
10 wt% Pt loadings. Norit activated carbon (ROX 0.9), SiC (SICAT β-SiC), and Vulcan carbon
(VXC72R) were used as supports for the metal particles. Prior to impregnation, Norit C and SiC
support particles were crushed and sieved between 180 μm and 425 μm. Vulcan C powder was used
as received. After impregnation of the desired Pt precursor solution, the catalyst was dried in air at
393 K overnight. The dried solids were then reduced in H2 (GT&S 99.999%) flowing at 100 cm3 min-
1. The temperature of reduction was increased at 5 K min-1 from room temperature to the desired
value, which ranged from 623 to 873 K, and held isothermally for 3 h. The catalyst was then cooled,
exposed to air, and stored in a vial.
2.2.2. Dihydrogen chemisorption
The metal dispersion was measured by H2 chemisorption performed on a Micromeritics ASAP
2020 adsorption system. The catalyst was evacuated at 573 K for 10 h under vacuum followed by
heating to 623 K at a rate of 5 K min-1 after which it was reduced with flowing H2 (GT&S 99.999%)
at 623 K for 2 h.
Following reduction, the catalyst sample was evacuated at 623 K and cooled to 308 K in vacuum.
The chemisorption of H2 was performed at 308 K over the pressure range of 40 to 450 Torr. The
amount of metal on the surface was evaluated by the total amount of H2 adsorbed extrapolated to zero
pressure, assuming a stoichiometric relationship between H2 to metal (H2: Pt) of 1:2 (i.e. H/Pt = 1).
2.2.3. Dinitrogen physisorption
The specific surface area and pore size were measured by N2 physisorption using a Micromeritics
ASAP 2020. The samples were evacuated for 180 min at 373 K prior to the N2 physisorption, after

19
which adsorption isotherms were measured at 77 K. The Brunauer-Emmett-Teller (BET) and the
Barrett-Joyner-Halenda (BJH) methods were used to determine the specific surface area and the pore
size, respectively.
2.2.4. X-ray diffraction
Powder X-ray diffraction (XRD) analysis was carried out on a X’Pert Pro MPD with
monochromatic Cu Kα-radiation (λ=1.54056 Å) using a step size of 1/4° and a time step of 1 s.
Diffraction angles were measured from 2Ө = 20° to 100°. The Scherrer equation was used to estimate
the particle size as described in Patterson et al. [11].
2.2.5. Electron microscopy
Transmission electron microscopy (TEM) was performed on a FEI Titan operated at 300 keV in
EFTEM mode. Energy dispersive X-ray spectroscopy (EDS) was used to obtain elemental analysis of
the nanoparticles. Catalyst samples were deposited on a SPI lacey-carbon coated Cu grid after being
dispersed in methanol [12]. Fresh (after catalyst synthesis) and spent (after exposure to reaction
conditions) catalyst samples were imaged to determine the effect of reaction conditions on particle
morphology. The spent samples were recovered from the reactor, washed with 25 mL of methanol
and sonicated in a methanol solution for 30 min to remove reactant and products from the surface of
the catalyst. After sonication, the solids were recovered by filtration and dried overnight in air at 400
K.
2.2.6. Catalytic conversion of heptanoic acid
The decarbonylation/decarboxylation of fatty acids can be a challenging reaction, mainly because
of low reaction rates and rapid catalyst deactivation [2]. Furthermore, saturated fatty acids with more
than 9 carbons in the aliphatic chain have a high melting point. This physical property makes
operation in a continuous mode particularly challenging since the entire pumping system as well as
the reactor must be heated. In this study, heptanoic acid was selected as the reactant because it is a

20
liquid at room temperature, therefore eliminating the need to pre-heat the lines and the pumping
system.
Decarbonylation/decarboxylation reactions are often performed in a solvent with H2
simultaneously fed to the reactor to extend catalyst life. Under these conditions, the fatty acid could
be hydrogenated before deoxygenation, leading to the formation of alcohols and other products,
which can react with the acid substrate to form esters [2–4,7–9,13,14]. To avoid undesirable side
reactions, neither solvent nor H2 was cofed with the heptanoic acid. Dodecane was used as an internal
standard because it has a similar boiling point to heptanoic acid and is thermally stable. The amount
of dodecane was minimized (5 wt%) to avoid hydrogen transfer from it to the products [9].
The main organic products from converting heptanoic acid were expected to be 6 carbon
hydrocarbons, hexane, 1, 2, and 3-hexene, and the ketonization product 7-dihexyl ketone (a
symmetrical ketone). These compounds were therefore monitored by gas chromatography. Gas
chromatography calibration curves can be found in Appendix B.
The catalytic decarboxylation/decarbonylation of heptanoic acid (Sigma Aldrich 99.0 %) was
performed in a 1/4" OD x 8” length x 0.035” wall thickness stainless steel fixed bed reactor. After
loading the catalyst in the reactor, the system was first flushed for 30 min with 100 cm3min-1 of N2
(GT&S 99.999%) at 40 bar to remove any dioxygen from the system and to perform a leak test. Then,
the temperature was increased to the desired reduction temperature, 623 – 873 K, under 100 cm3min-1
of N2 at 5 K min-1 at 1 bar. The temperature was held isothermally for 2 h as the catalyst was reduced
in H2 (GT&S 99.999%) flowing at 100 cm3min-1 at atmospheric pressure. The reactor was finally
cooled to the reaction temperature, 573 K, and pressurized to 37 bar in 100 cm3min-1 of N2 (GT&S
99.999%). The feed mixture was composed of 95 wt% heptanoic acid (Sigma Aldrich 99.00 %) and 5
wt% dodecane (Sigma Aldrich anhydrous 99.00 %). The feed was pumped into the reactor containing
0.25 g of catalyst using a syringe pump (ISCO 500D) operating at different liquid flow rates (0.005,
0.01, or 0.05 cm3min-1). The acid feed passed through a heated zone before entering the catalytic
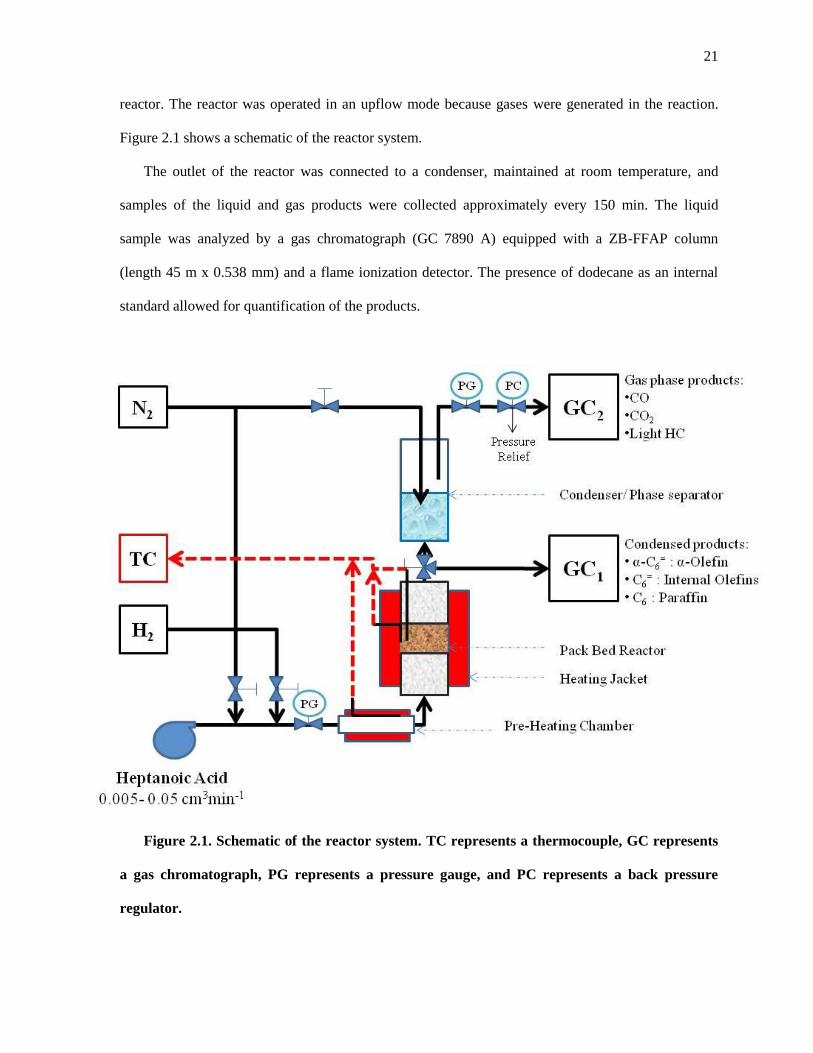
21
reactor. The reactor was operated in an upflow mode because gases were generated in the reaction.
Figure 2.1 shows a schematic of the reactor system.
The outlet of the reactor was connected to a condenser, maintained at room temperature, and
samples of the liquid and gas products were collected approximately every 150 min. The liquid
sample was analyzed by a gas chromatograph (GC 7890 A) equipped with a ZB-FFAP column
(length 45 m x 0.538 mm) and a flame ionization detector. The presence of dodecane as an internal
standard allowed for quantification of the products.
Figure 2.1. Schematic of the reactor system. TC represents a thermocouple, GC represents
a gas chromatograph, PG represents a pressure gauge, and PC represents a back pressure
regulator.
22
The product gas was continuously removed from the condenser by an N2 (GT&S 99.999%) purge
gas, which was fed to an on-line gas chromatograph (HP 5890 Series II) equipped with a packed
column, ShinCarbon ST 80/100, and a thermal conductivity detector (TCD) for detection of N2, CO,
CO2, and light hydrocarbons (if any). The N2 purge gas was also used to maintain pressure in the
system and was the internal standard for GC analysis.
A series of control experiments was performed to determine the background conversion of the
system at our typical reaction conditions (573 K, 37 or 1 bar, and 0.01 cm3min-1 of liquid feed
composed of 95 wt% heptanoic acid and 5 wt% dodecane). In the absence of catalyst, no conversion
of heptanoic acid was observed. However, when Norit carbon and Vulcan carbon supports were used,
a background conversion of 2 - 3% was detected. No conversion was observed over SiC.
2.2.7. Turnover frequency and selectivity calculations
The turnover frequency (TOF) was defined by Boudart as the number of revolutions of the
catalytic cycle per unit time [15]. In this work the TOF was calculated as the rate of formation of the
products referred to the number of surface Pt atoms. The main components in the liquid products
were hexane (C6), 1-hexene (α-C6), 2 and 3-hexenes (i-hexenes, i-C6), 7-tridecanone (ketone), and
minor amounts of heavier unknown products (which accounted for ≈ 3 % of the total detected liquid
product). The TOF was therefore calculated as [(rate of production (mol s-1) of C6 + α-C6 + i-C6 + 2
x moles of ketone + others) / (mol of surface Pt counted by H2 chemisorption)]. The major gas
products observed were CO and CO2. The product selectivity was defined as the moles of a product
formed divided by the total moles of all identified products present in the same phase (liquid or gas),
i.e. selectivity of 1-hexene [(rate of α-C6) / (rate of all C6 products + 2x moles of 7-tridecanone +
moles of unknowns)] and selectivity of CO [(rate of CO) / (rate of CO + rate of CO2)]. Selectivities of
liquid and gas products were calculated independently. The TOF associated with the Pt was based on
measured rates after subtracting the background conversion from the support and normalized by the
dispersion of Pt evaluated on a freshly prepared catalyst.

23
2.2.8. Mass transfer limitations
The mass transfer characteristics were estimated using the Weisz-Prater criterion for internal
transport limitations (ΦI), Equation 2.1, and the analogous expression for external transport
limitations (ΦE), Equation 2.2, assuming first order reaction [16]. In Equations 2.1 and 2.2, robs is the
observed rate, RP is the radius of the support particle, ρp is the density of the catalyst pellet, DEA is the
effective
1r 2
obs
ASEA
pp
ICD
R Equation 2.1
15.0robs
ABA
pp
ECk
R Equation 2.2
diffusivity, kA is the external mass transfer coefficient, CAS is the surface concentration, and CAB is the
bulk concentration of heptanoic acid [16,17].
The effective diffusivity (DEA) was estimated using a porosity (εP) of 0.5 and a tortuosity (τ) of 3
as recommended in Davis and Davis [17]. The self-diffusion coefficient (DAA) for heptanoic acid was
calculated using the Stokes-Einstein equation for analysis of the liquid-phase and using gas kinetic
theory for analysis of the gas-phase reaction. Because the average Pt particle size was ≈ 2 nm or
greater, it was assumed for this analysis that the size of the pore in which the catalytic reaction takes
place is at least 2 nm, which was used to calculate the Knudsen diffusivity (DKA) for the gas-phase
operation. The external mass transfer coefficient (kA) was obtained using a mass transfer correlation
for fluid-solid interface for packed bed reactors obtained from Cussler [18].
Using the highest observed rates, ΦI was calculated to be much less than 1 for the liquid and gas
phase reactions (0.005 and 0.012, respectively) and ΦE was much less than 0.15 for the liquid and gas
phase reactions (0.004 and 0.001, respectively) for a catalyst particle size of 425 μm. The criteria
24
suggest that the system was not mass transfer limited with respect to the reactant. Detailed
calculations of the mass transfer criteria can be found in Appendix A.
2.3. Results and Discussion
2.3.1. Effect of carbonaceous support
Carbon is a widely used support for transition metals in deoxygenation reactions because of its
high surface area (700 – 1500 m2g-1) and relative inertness [1,2,19–24]. Carbon supports are available
in different particle sizes, surface areas, and pore size distributions. Most carbon supports are difficult
to pelletize, which may account for why so many of the earlier studies in the field were performed in
batch systems. Operation of a fixed bed reactor system with a fine powder can develop a very large
pressure drop across the catalyst bed. Therefore, we chose to explore some of the pelletized carbons
as supports for Pt nanoparticles.
Three different carbonaceous supports were tested in this study, each having very different
physical properties. Norit carbon is a high surface area support that can be purchased in pellet form,
which can be easily crushed to the desired particle size. However, it has many small pores that might
influence the transport rates of products out of the pellets and therefore affect the side reactions.
Vulcan carbon is nonporous, but has a much smaller surface area than Norit carbon. Furthermore, the
as-received Vulcan carbon could not be easily pelletized. Preliminary tests of Vulcan carbon powder
in our fixed bed reactor revealed a very large pressure drop when we tried to pump liquid reactant
through the bed. Therefore, Vulcan carbon was only used as a support for Pt in experiments with
gaseous heptanoic acid. Silicon carbide is a macroporous support that was obtained in pellet form.
However, it has a much lower surface area than Norit carbon.

25
Table 2.1. Summary of the characterization results for 5 wt% Pt on different supports.
Support
Dispersion
(%)
Surface Area
(m2g-1)
Pore Size
(nm)
Pt Particle Size
(nm)
Norit Carbon 31 a 1428 N.D. b 3.7 a
Vulcan Carbon - 217 7.3 21 c
SiC - 26 20 40 c
a Result estimated from H2 chemisorption
b Not determined, both micropores and mesopores are present on this sample
c Result obtained using XRD patterns and Scherrer equation
Catalysts composed of 5 wt% Pt supported on the various carbon supports were characterized
using N2 physisorption, H2 chemisorption, and XRD, and the results are summarized in Table 2.1.
While a high Pt dispersion of 31 % was obtained on Norit carbon, very large Pt particles were formed
on Vulcan carbon and SiC. The diffraction peaks in Figure 2.2 observed at about 39.5° , 45.5°, 57°,
and 79.5° are attributed to the (111), (200), (220), and (311) reflections of Pt [25]. Analysis of the
peak width by the Scherrer equation gave an average Pt crystallite size of 21 and 40 nm for Pt
supported on Vulcan C and SiC, respectively. The lack of a Pt diffraction pattern associated with
Pt/Norit C was consistent with the high metal dispersion revealed by H2 chemisorption.
The three catalysts were tested under the same reaction conditions (573 K, 0.25 g of catalyst, and
a flow rate of 0.01 cm3min-1) and their performance is summarized in Table 2.2.
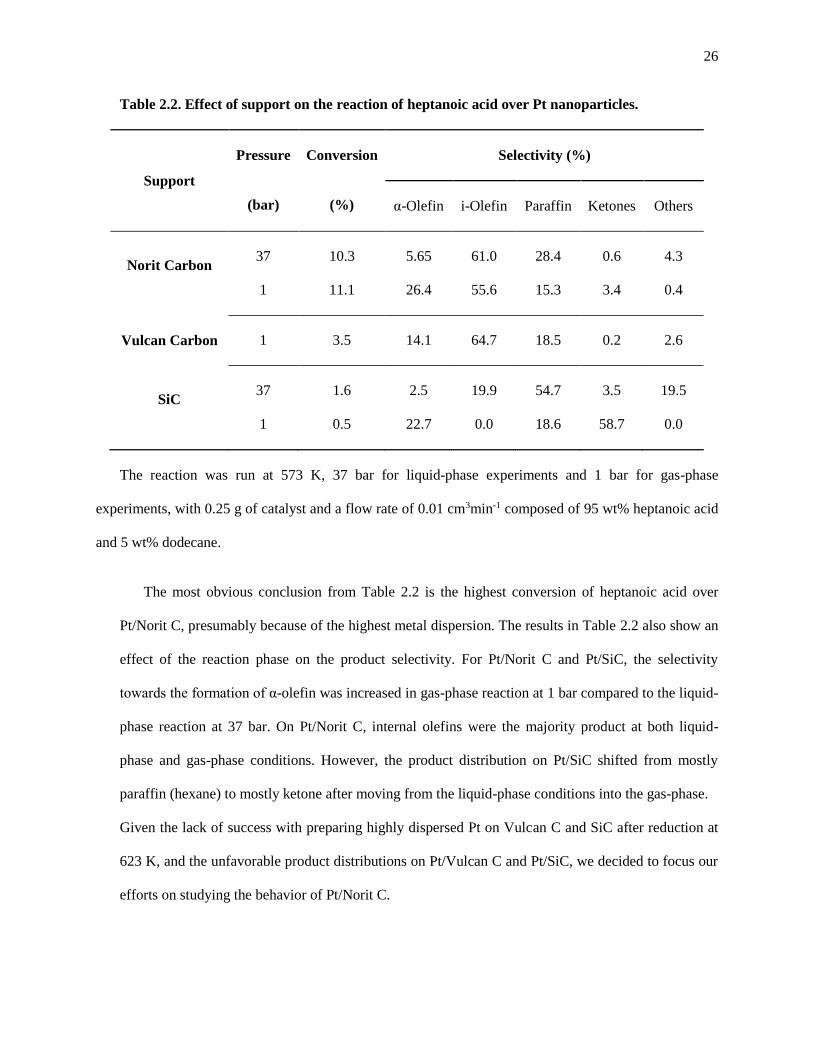
26
Table 2.2. Effect of support on the reaction of heptanoic acid over Pt nanoparticles.
Support
Pressure
(bar)
Conversion
(%)
Selectivity (%)
α-Olefin i-Olefin Paraffin Ketones Others
Norit Carbon 37
1
10.3
11.1
5.65
26.4
61.0
55.6
28.4
15.3
0.6
3.4
4.3
0.4
Vulcan Carbon 1 3.5 14.1 64.7 18.5 0.2 2.6
SiC 37
1
1.6
0.5
2.5
22.7
19.9
0.0
54.7
18.6
3.5
58.7
19.5
0.0
The reaction was run at 573 K, 37 bar for liquid-phase experiments and 1 bar for gas-phase
experiments, with 0.25 g of catalyst and a flow rate of 0.01 cm3min-1 composed of 95 wt% heptanoic acid
and 5 wt% dodecane.
The most obvious conclusion from Table 2.2 is the highest conversion of heptanoic acid over
Pt/Norit C, presumably because of the highest metal dispersion. The results in Table 2.2 also show an
effect of the reaction phase on the product selectivity. For Pt/Norit C and Pt/SiC, the selectivity
towards the formation of α-olefin was increased in gas-phase reaction at 1 bar compared to the liquid-
phase reaction at 37 bar. On Pt/Norit C, internal olefins were the majority product at both liquid-
phase and gas-phase conditions. However, the product distribution on Pt/SiC shifted from mostly
paraffin (hexane) to mostly ketone after moving from the liquid-phase conditions into the gas-phase.
Given the lack of success with preparing highly dispersed Pt on Vulcan C and SiC after reduction at
623 K, and the unfavorable product distributions on Pt/Vulcan C and Pt/SiC, we decided to focus our
efforts on studying the behavior of Pt/Norit C.
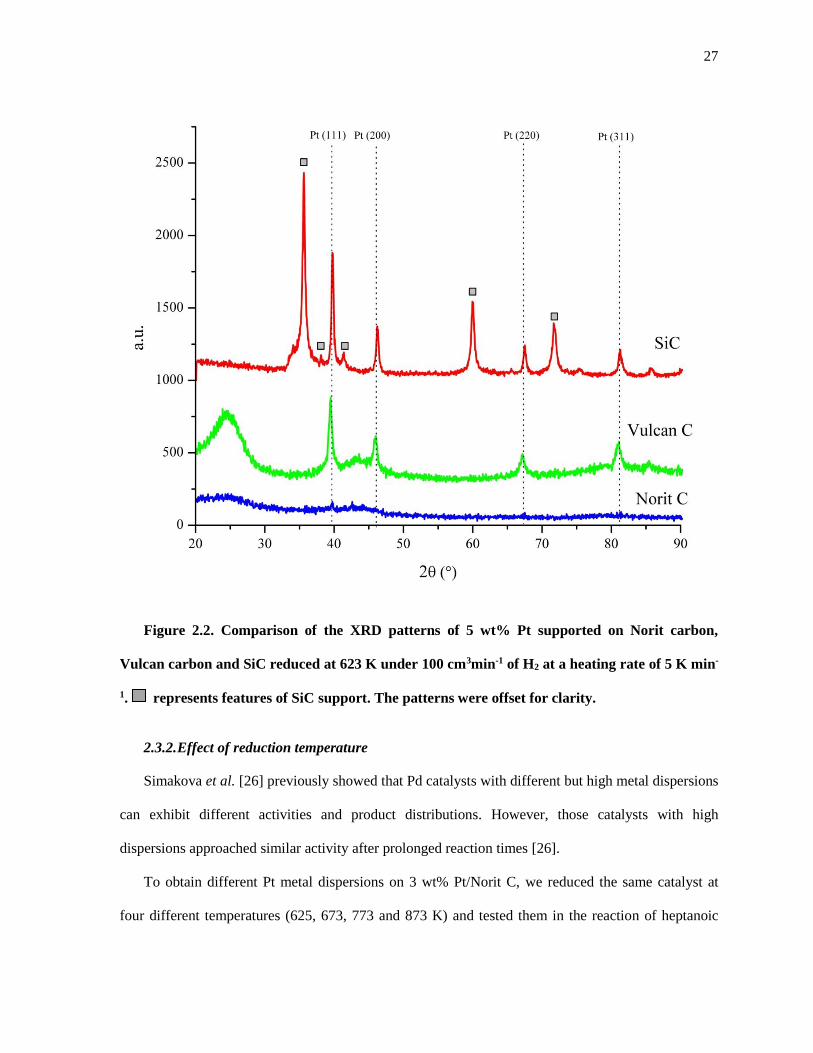
27
Figure 2.2. Comparison of the XRD patterns of 5 wt% Pt supported on Norit carbon,
Vulcan carbon and SiC reduced at 623 K under 100 cm3min-1 of H2 at a heating rate of 5 K min-
1. represents features of SiC support. The patterns were offset for clarity.
2.3.2. Effect of reduction temperature
Simakova et al. [26] previously showed that Pd catalysts with different but high metal dispersions
can exhibit different activities and product distributions. However, those catalysts with high
dispersions approached similar activity after prolonged reaction times [26].
To obtain different Pt metal dispersions on 3 wt% Pt/Norit C, we reduced the same catalyst at
four different temperatures (625, 673, 773 and 873 K) and tested them in the reaction of heptanoic

28
acid. Table 2.3 summarizes the results of the catalyst characterization by chemisorption,
physisorption and electron microscopy.
Although the dihydrogen uptake decreased on the samples reduced at elevated temperatures,
electron microscopy revealed very little growth of the small particles (from 2 to 3 nm). These
contrasting findings could be the result of some Pt migrating outside of the Norit C pores to form
large particles on the external surface. It should be noted that a wider Pt particle size distribution was
observed by microscopy, which is consistent with Pt migration on the sample. Figure 2.3 shows the
images of the catalysts obtained by TEM.
Table 2.3. Result of the characterization of 3 wt% Pt/Norit C reduced at 4 different
temperatures
Reduction
Temperature
(K)
Metal Dispersion
(%)
Pt Particle Size
(nm)
Surface Area
(m2g-1)
Chemisorption TEM
623 49 2.3 1.9 ± 0.2 1477
673 21 5.3 2.1 ± 0.5 1348
773 13 8.9 2.5 ± 0.8 1495
873 13 8.4 3.1 ± 1.0 1374

29
Figure 2.3. TEM images of fresh 3 wt% Pt/Norit C catalyst reduced at four different
temperatures. A was reduced at 623 K, B was reduced at 673 K, C was reduced at 773 K, and D was
reduced at 873 K.
A B
D
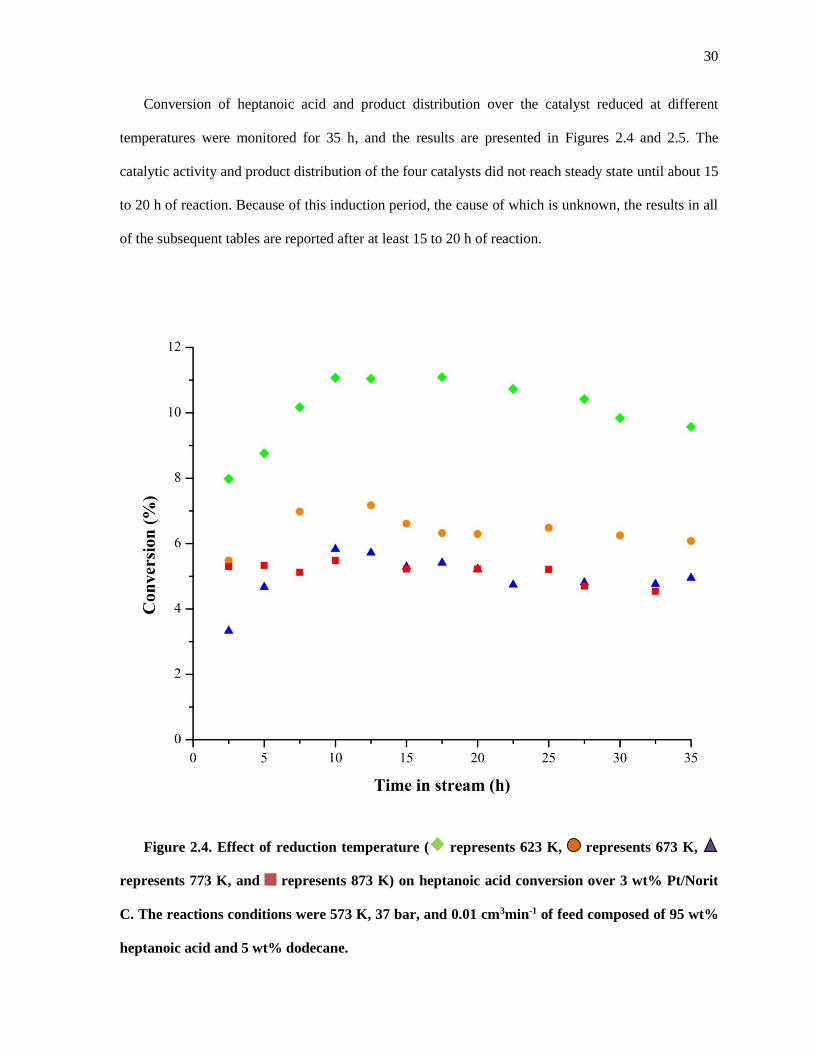
30
Conversion of heptanoic acid and product distribution over the catalyst reduced at different
temperatures were monitored for 35 h, and the results are presented in Figures 2.4 and 2.5. The
catalytic activity and product distribution of the four catalysts did not reach steady state until about 15
to 20 h of reaction. Because of this induction period, the cause of which is unknown, the results in all
of the subsequent tables are reported after at least 15 to 20 h of reaction.
Figure 2.4. Effect of reduction temperature ( represents 623 K, represents 673 K,
represents 773 K, and represents 873 K) on heptanoic acid conversion over 3 wt% Pt/Norit
C. The reactions conditions were 573 K, 37 bar, and 0.01 cm3min-1 of feed composed of 95 wt%
heptanoic acid and 5 wt% dodecane.
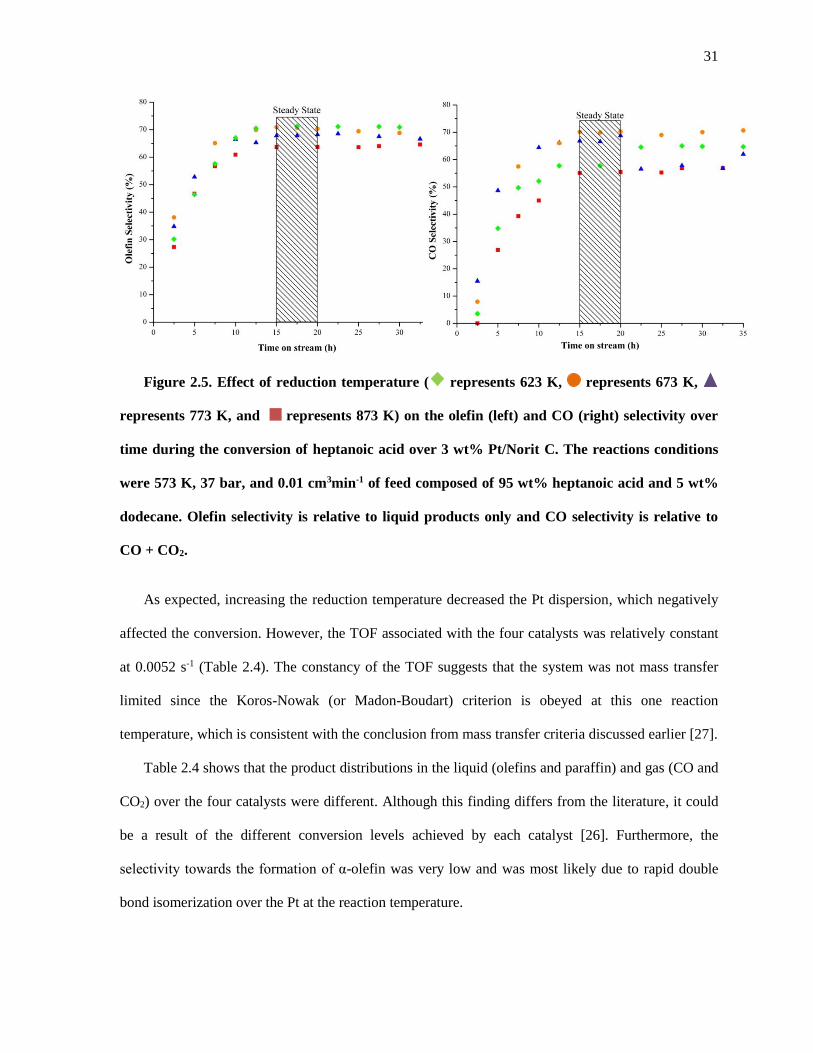
31
Figure 2.5. Effect of reduction temperature ( represents 623 K, represents 673 K,
represents 773 K, and represents 873 K) on the olefin (left) and CO (right) selectivity over
time during the conversion of heptanoic acid over 3 wt% Pt/Norit C. The reactions conditions
were 573 K, 37 bar, and 0.01 cm3min-1 of feed composed of 95 wt% heptanoic acid and 5 wt%
dodecane. Olefin selectivity is relative to liquid products only and CO selectivity is relative to
CO + CO2.
As expected, increasing the reduction temperature decreased the Pt dispersion, which negatively
affected the conversion. However, the TOF associated with the four catalysts was relatively constant
at 0.0052 s-1 (Table 2.4). The constancy of the TOF suggests that the system was not mass transfer
limited since the Koros-Nowak (or Madon-Boudart) criterion is obeyed at this one reaction
temperature, which is consistent with the conclusion from mass transfer criteria discussed earlier [27].
Table 2.4 shows that the product distributions in the liquid (olefins and paraffin) and gas (CO and
CO2) over the four catalysts were different. Although this finding differs from the literature, it could
be a result of the different conversion levels achieved by each catalyst [26]. Furthermore, the
selectivity towards the formation of α-olefin was very low and was most likely due to rapid double
bond isomerization over the Pt at the reaction temperature.

32
Table 2.4. Effect of metal dispersion on the decarbonylation/decarboxylation of heptanoic acid
over 3 wt% Pt/Norit C.
Reduction
Temperature
(K)
Dispersion
(%)
TOF
(s-1)
Conversion a
(%)
Product Selectivity
(%)
Liquid Gas
α-Olefin i-Olefins Paraffin Ketone Others CO
623 49 0.0052 9.1 5.2 63.2 27.7 1.2 2.7 58
673 21 0.0051 3.8 5.0 62.9 28.2 1.4 2.5 69
773 13 0.0052 2.4 4.8 61.1 31.5 0.5 1.6 67
873 13 0.0051 2.5 5.0 54.7 34.0 4.0 2.3 55
The reactions conditions were 573 K, 37 bar, 0.01 cm3min-1 of feed composed of 95 wt% heptanoic
acid and 5 wt% dodecane. Results were recorded after 20 h of reaction.
a Background conversion has been removed
2.3.3. Effect of metal loading
Given the non-uniformity of the Pt particle size distribution formed by varying the reduction rate,
we decided to test the performance of heptanoic acid conversion over catalysts with different Pt
loadings but reduced at the same temperature. Therefore, four catalysts with different metal loadings
of 1, 3, 5, and 10 wt% Pt were synthesized and tested at two different reaction temperatures. The
results from characterization and reaction testing are summarized in Table 2.5 and Figure 2.6.

33
Table 2.5. Effect of Pt loading on heptanoic acid reaction over Pt/Norit C at 553 K and 573 K.
Loading
(wt % Pt/C)
Dispersion
(%)
Pt Particle Size
(nm)
Conversion a
(%)
TOF a
(s-1)
Chemisorption TEM 553 K 573K 553 K 573 K
1.0 28 4.0 1.8 ± 0.4 0.7 1.7 0.0022 0.0052
3.0 49 2.3 1.9 ± 0.2 - 9.1 - 0.0052
5.0 31 3.7 1.9 ± 0.3 4.4 8.2 0.0024 0.0045
10.0 39 2.9 2.1 ± 0.5 10.1 24.3 0.0021 0.0051
The catalysts were tested at 37 bar and 0.01 cm3min-1 of feed composed of 95 wt% heptanoic acid and
5 wt% dodecane. Results were recorded after 20 h of reaction.
As expected, the conversion of heptanoic acid increased with the amount of surface Pt in the
reactor. The TOF at 553 and 573 K was constant at each temperature over the four different metal
loadings tested with an average value of 0.0022 s-1 and 0.0052 s-1, respectively. Furthermore, the TOF
obtained at 573 K matched the one obtained over 3 wt% Pt/Norit C reduced at different temperatures
(Table 2.4).
Increasing the Pt loading did not considerably increase the Pt particle size but instead increased
the number of particles per unit of area, as shown by the TEM images in Figure 2.7. The average Pt
particle size obtained by TEM was relatively constant at a value of about 2 nm for all the samples,
while the value estimated by H2 chemisorption varied between 2.3 and 4.0 nm (Table 2.5). Again, this
difference might be due to some large Pt particles on the external surface of the pellets that were not
observed by microscopy but were accounted for by H2 chemisorption.
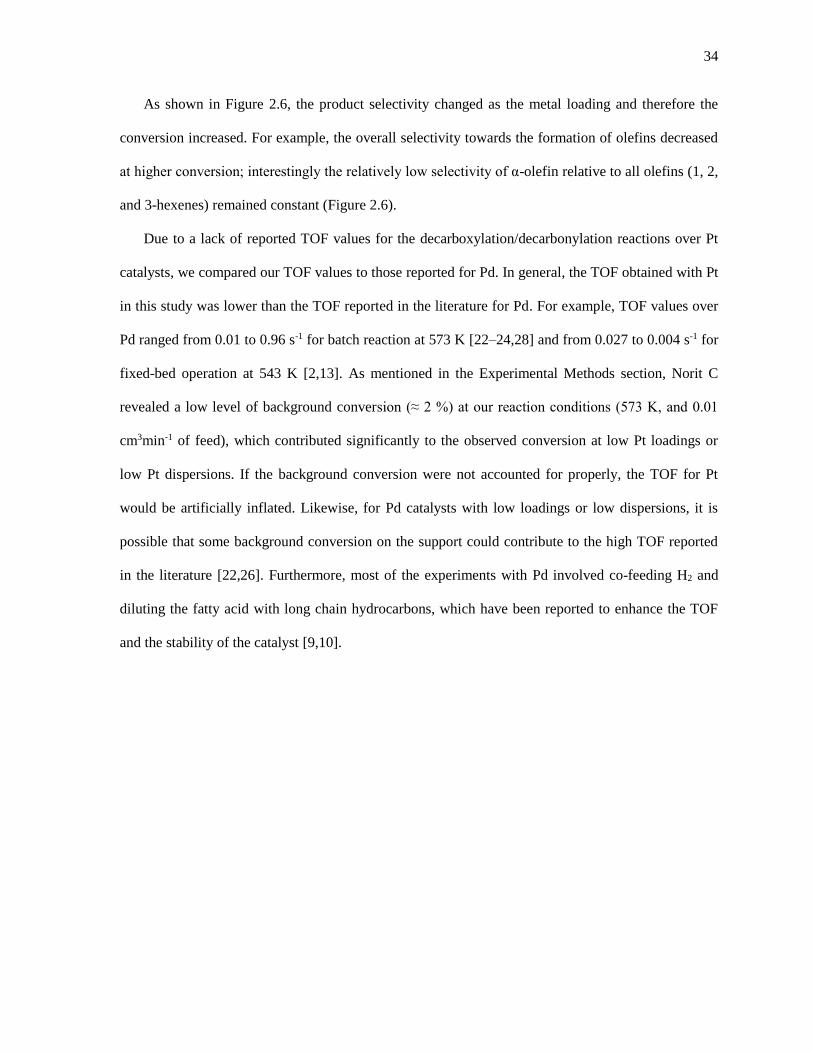
34
As shown in Figure 2.6, the product selectivity changed as the metal loading and therefore the
conversion increased. For example, the overall selectivity towards the formation of olefins decreased
at higher conversion; interestingly the relatively low selectivity of α-olefin relative to all olefins (1, 2,
and 3-hexenes) remained constant (Figure 2.6).
Due to a lack of reported TOF values for the decarboxylation/decarbonylation reactions over Pt
catalysts, we compared our TOF values to those reported for Pd. In general, the TOF obtained with Pt
in this study was lower than the TOF reported in the literature for Pd. For example, TOF values over
Pd ranged from 0.01 to 0.96 s-1 for batch reaction at 573 K [22–24,28] and from 0.027 to 0.004 s-1 for
fixed-bed operation at 543 K [2,13]. As mentioned in the Experimental Methods section, Norit C
revealed a low level of background conversion (≈ 2 %) at our reaction conditions (573 K, and 0.01
cm3min-1 of feed), which contributed significantly to the observed conversion at low Pt loadings or
low Pt dispersions. If the background conversion were not accounted for properly, the TOF for Pt
would be artificially inflated. Likewise, for Pd catalysts with low loadings or low dispersions, it is
possible that some background conversion on the support could contribute to the high TOF reported
in the literature [22,26]. Furthermore, most of the experiments with Pd involved co-feeding H2 and
diluting the fatty acid with long chain hydrocarbons, which have been reported to enhance the TOF
and the stability of the catalyst [9,10].

35
Figure 2.6. Effect of Pt weight loading supported on Norit C on product selectivity and
conversion at 573 K, 37 bar, and 0.01 cm3min-1 of feed composed of 95 wt% heptanoic acid and
5 wt% dodecane. The product selectivity (%) is represented with color bars and can be read on
the left axis. represents 1-hexene, represents 2 and 3-hexenes, represents hexane,
represents 7-tridecanone, and represents the unknown products. The black squares represent
conversion (%) and can be read on the right axis. These results were recorded after 20 h of
reaction.
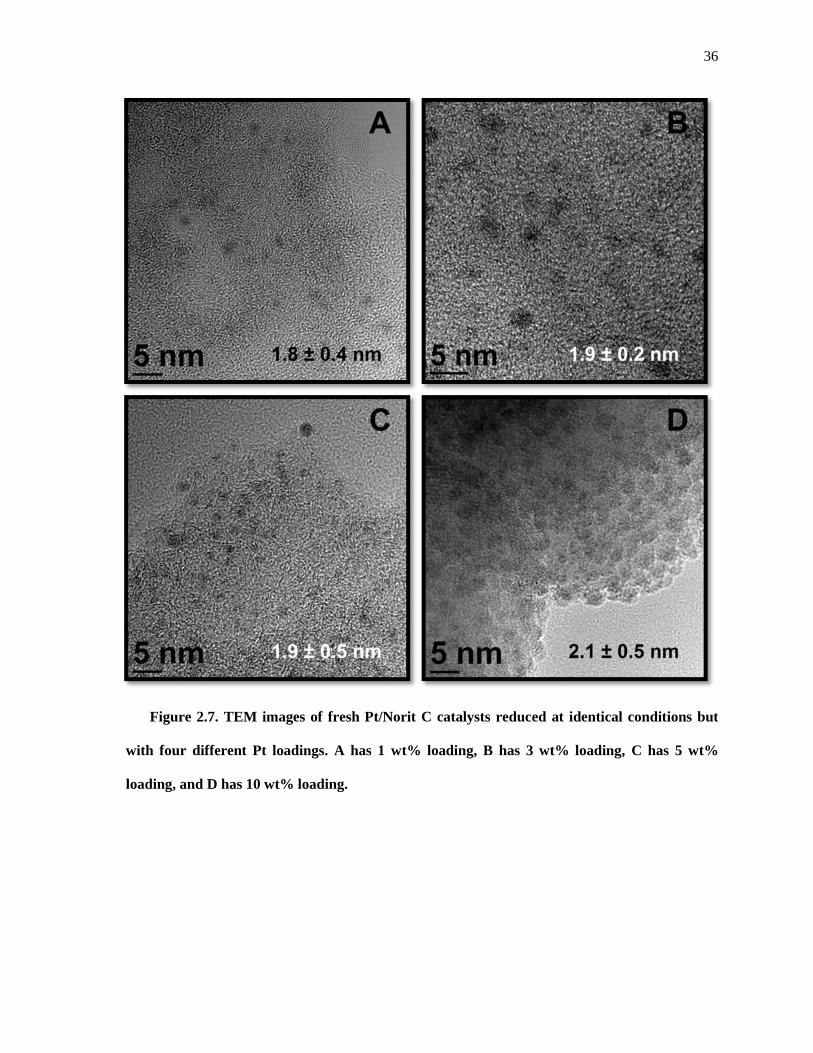
36
Figure 2.7. TEM images of fresh Pt/Norit C catalysts reduced at identical conditions but
with four different Pt loadings. A has 1 wt% loading, B has 3 wt% loading, C has 5 wt%
loading, and D has 10 wt% loading.
A B
C D
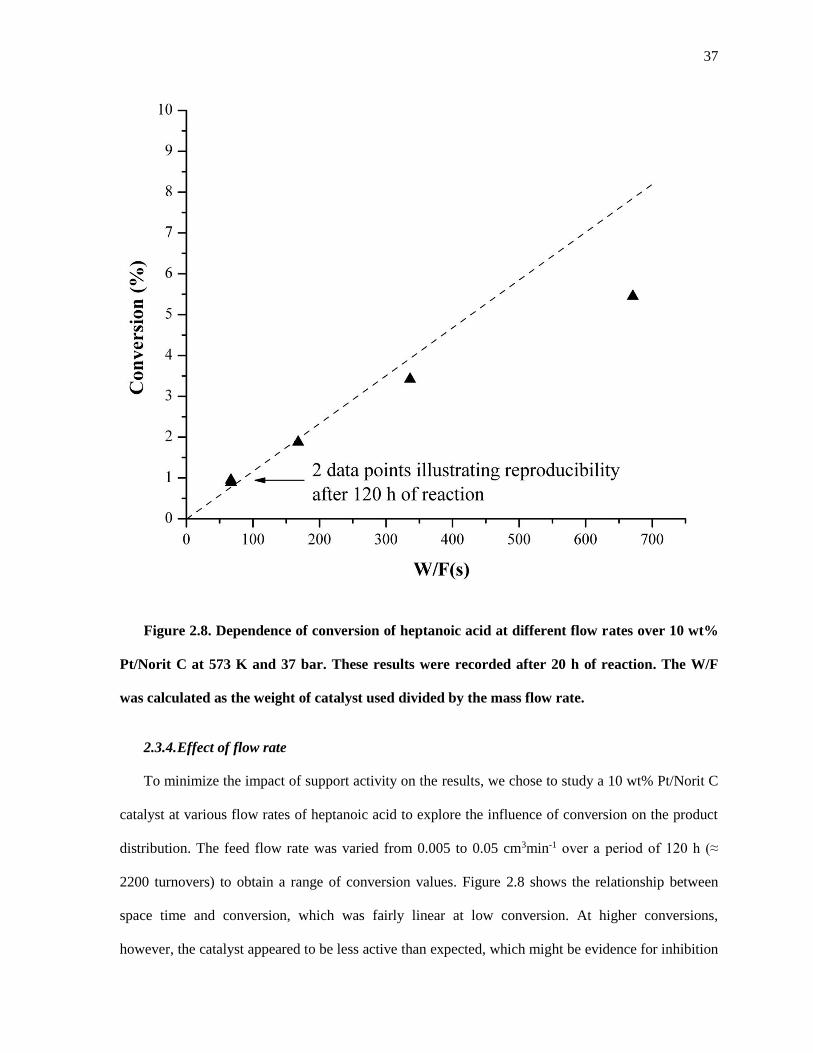
37
Figure 2.8. Dependence of conversion of heptanoic acid at different flow rates over 10 wt%
Pt/Norit C at 573 K and 37 bar. These results were recorded after 20 h of reaction. The W/F
was calculated as the weight of catalyst used divided by the mass flow rate.
2.3.4. Effect of flow rate
To minimize the impact of support activity on the results, we chose to study a 10 wt% Pt/Norit C
catalyst at various flow rates of heptanoic acid to explore the influence of conversion on the product
distribution. The feed flow rate was varied from 0.005 to 0.05 cm3min-1 over a period of 120 h (≈
2200 turnovers) to obtain a range of conversion values. Figure 2.8 shows the relationship between
space time and conversion, which was fairly linear at low conversion. At higher conversions,
however, the catalyst appeared to be less active than expected, which might be evidence for inhibition
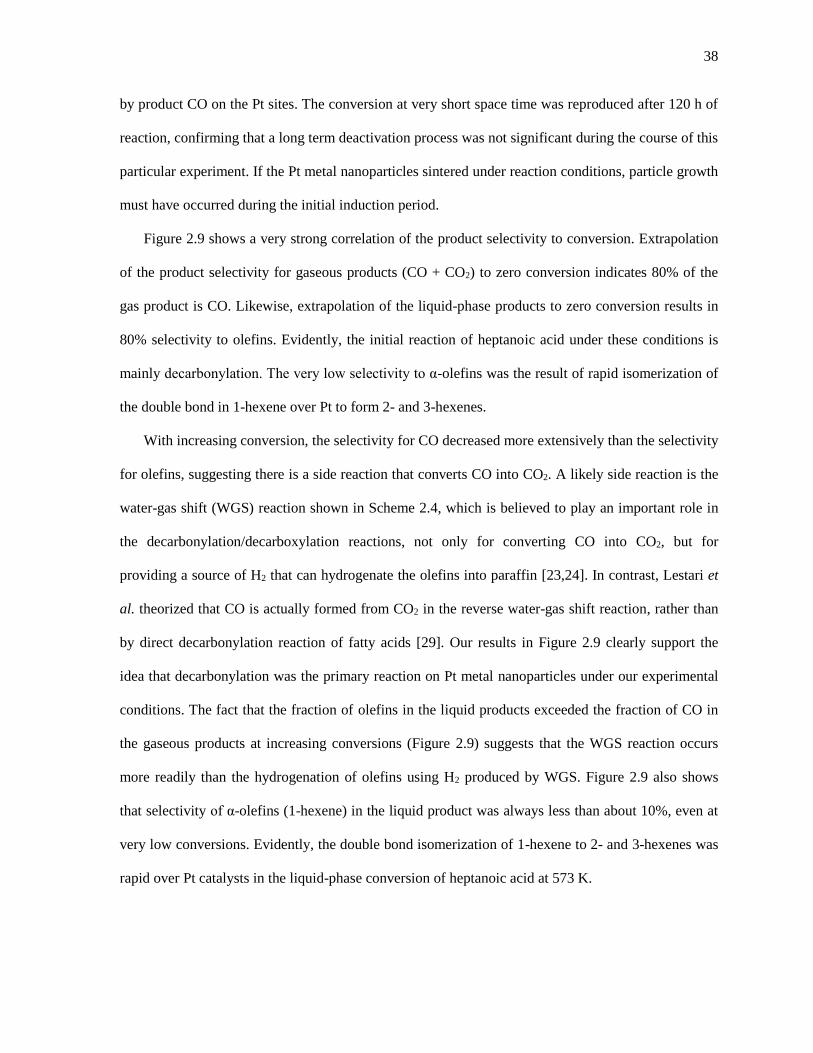
38
by product CO on the Pt sites. The conversion at very short space time was reproduced after 120 h of
reaction, confirming that a long term deactivation process was not significant during the course of this
particular experiment. If the Pt metal nanoparticles sintered under reaction conditions, particle growth
must have occurred during the initial induction period.
Figure 2.9 shows a very strong correlation of the product selectivity to conversion. Extrapolation
of the product selectivity for gaseous products (CO + CO2) to zero conversion indicates 80% of the
gas product is CO. Likewise, extrapolation of the liquid-phase products to zero conversion results in
80% selectivity to olefins. Evidently, the initial reaction of heptanoic acid under these conditions is
mainly decarbonylation. The very low selectivity to α-olefins was the result of rapid isomerization of
the double bond in 1-hexene over Pt to form 2- and 3-hexenes.
With increasing conversion, the selectivity for CO decreased more extensively than the selectivity
for olefins, suggesting there is a side reaction that converts CO into CO2. A likely side reaction is the
water-gas shift (WGS) reaction shown in Scheme 2.4, which is believed to play an important role in
the decarbonylation/decarboxylation reactions, not only for converting CO into CO2, but for
providing a source of H2 that can hydrogenate the olefins into paraffin [23,24]. In contrast, Lestari et
al. theorized that CO is actually formed from CO2 in the reverse water-gas shift reaction, rather than
by direct decarbonylation reaction of fatty acids [29]. Our results in Figure 2.9 clearly support the
idea that decarbonylation was the primary reaction on Pt metal nanoparticles under our experimental
conditions. The fact that the fraction of olefins in the liquid products exceeded the fraction of CO in
the gaseous products at increasing conversions (Figure 2.9) suggests that the WGS reaction occurs
more readily than the hydrogenation of olefins using H2 produced by WGS. Figure 2.9 also shows
that selectivity of α-olefins (1-hexene) in the liquid product was always less than about 10%, even at
very low conversions. Evidently, the double bond isomerization of 1-hexene to 2- and 3-hexenes was
rapid over Pt catalysts in the liquid-phase conversion of heptanoic acid at 573 K.
39
Scheme 2.4. Water-gas shift (WGS) reaction
Figure 2.9. Dependence of decarbonylation product selectivity on conversion over 10 wt%
Pt/Norit C at 573 K and 37 bar. represents the selectivity to decarbonylation products,
olefins, in the liquid product. represents the selectivity to decarbonylation product, CO, in the
gas product. represents the selectivity to α-olefins in the liquid product. These results were
recorded after 20 h of reaction.
40
2.3.5. Effect of pressure
Previous studies showed that the formation rate of alkene did not match that of CO [2,22]. Our
results clearly show that reactions of the primary products, α-olefin, CO (and presumably H2O),
proceed at rates that are quite rapid. The formation of CO2 and H2 via the water-gas shift reaction,
which is then followed by hydrogenation of olefin to paraffin, might account for the product
distribution at higher conversion. Although the conversion of heptanoic acid was not mass transfer
limited with respect to the acid, it is possible that rapid conversion of the primary products in the
catalyst pores might be limited by mass transfer rates out of the catalyst particles. To increase the
effective diffusivity and external mass transfer coefficient of the molecules, we performed exactly the
same reaction experiments at 1 bar pressure, which allows the major products and heptanoic acid to
remain in the gas-phase.
Figure 2.10 compares the performance of Pt/Norit C with different metal loadings and system
pressures. For operation with liquid-phase reactant (37 bar), the main products at high conversions (>
20%) were hexane and CO2. At lower conversions, mostly olefins were produced, although they were
mainly 2 and 3 hexenes formed from double bond isomerization of 1-hexene. When the reaction was
run at low pressure (1 bar) resulting in gas-phase conditions in the reactor, the selectivity towards the
formation of α-olefin was higher than that in the liquid-phase. Moreover, higher metal loadings in the
catalyst pores facilitated subsequent conversion of the α-olefin to the internal olefins, even at low
pressure. Figure 2.10 also shows that lowering the conversion by increasing the reactant flow rate
improved selectivity to α-olefin, which is expected when α-olefin is a primary product of
decarbonylation.
It should be noted that the conversion of heptanoic acid over the three different Pt catalysts did
not correlate with the surface Pt when operated in the gas-phase, which contrasts the direct relation
observed in the liquid-phase, as reported in Figure 2.10 and Table 2.5. We attribute the observed
behavior of Pt catalysts in gas phase operation to significant deactivation, which is discussed in the
next section.

41
Figure 2.10. Effect of reaction pressure and feed flow rate on catalyst activity and product
distribution over Pt/Norit C with different loadings of Pt during the conversion of heptanoic
acid at 573 K. The feed composition was 95 wt% heptanoic acid and 5 wt% dodecane. The color
bars can be read on the left axis and represents the product distribution. represents 1-
hexene, represents 2-3-hexenes, represents hexane, represents 7-tridecanone, and
represents the unknown products. The black squares represent conversion (%) and can be read
on the right axis. These results were recorded after 20 h of reaction. Figure A was run in liquid
phase (37 bar) conditions and flow rate of 0.01 cm3min-1. Figure B was run in gas phase (1 bar)
conditions and a flow rate of 0. 01 cm3min-1. Figure C was run in gas phase (1 bar) conditions
and a flow rate of 0.05 cm3min-1.
42
2.3.6. Catalyst deactivation
Catalyst deactivation during the deoxygenation of carboxylic acids has been widely reported in
the literature. Snåre et al. [10] and Mäki-Arvela et al. [13] suggested that deactivation originated from
poisoning of the metal by the reactants, products (especially CO), and coking. Furthermore, Simakova
et al. reported that deactivating aromatics are formed in reactions performed under H2-scarce
conditions [30]. The initial concentration of carboxylic acid is also proposed to influence catalyst
deactivation. Mäki-Arvela et al. observed that deactivation was more extensive with higher initial
concentration of carboxylic acid [13].
Ping et al. imaged Pd nanoparticles supported on silica with TEM before and after reaction [31].
The catalyst did not show a significant increase in metal particle size after reaction indicating
negligible metal sintering occurred. Since most of the catalyst activity was regained after hot
extraction with solvent and subsequent reduction in H2 at 573 K, the authors concluded that the
observed deactivation resulted from deposition of organic molecules onto the active sites [31].
Figure 2.11 summarized catalyst performance after several changes in reaction conditions to
study the deactivation phenomenon. Although our studies revealed stable operation of Pt/Norit C up
to 120 h of operation with the liquid-phase reactant, we observed significant deactivation during gas-
phase operation at 1 bar. For this series of experiments, the catalyst was assumed to be at steady state
after prolonged liquid-phase reaction. At this point, the pressure was lowered to 1 bar to begin
operation in the gas phase. Although the conversion decreased after the phase change, catalyst
deactivation continued to lower conversion with time. After 40 h of gas-phase operation, the catalyst
deactivated to half its activity at the time of the phase change. The pressure was then increased to
return to liquid-phase operation. After 20 h of steady state operation in liquid-phase conditions, the
catalyst activity remained low, indicating the liquid-phase flow was unable to recover the original
activity.
The deactivated catalyst was finally exposed to flowing heptanoic acid at 350 K at 1 bar for 24 h
to remove possible products from the surface. The reactor was then flushed with N2 and heated at 5 K
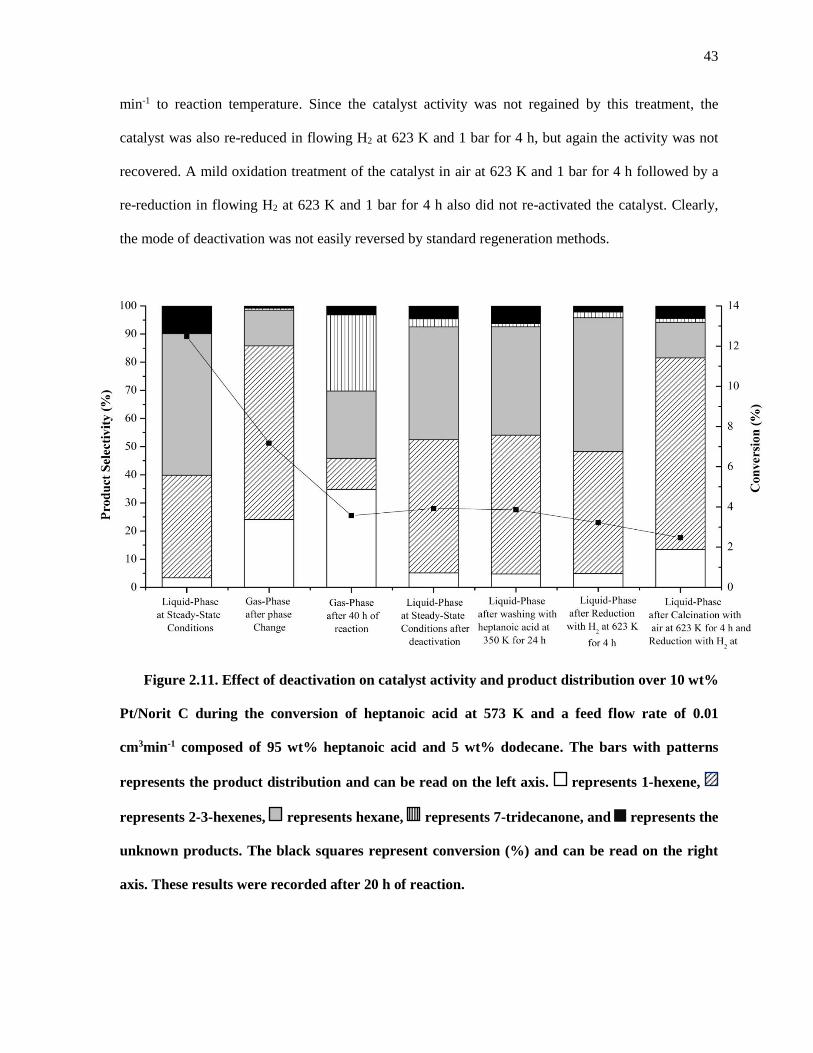
43
min-1 to reaction temperature. Since the catalyst activity was not regained by this treatment, the
catalyst was also re-reduced in flowing H2 at 623 K and 1 bar for 4 h, but again the activity was not
recovered. A mild oxidation treatment of the catalyst in air at 623 K and 1 bar for 4 h followed by a
re-reduction in flowing H2 at 623 K and 1 bar for 4 h also did not re-activated the catalyst. Clearly,
the mode of deactivation was not easily reversed by standard regeneration methods.
Figure 2.11. Effect of deactivation on catalyst activity and product distribution over 10 wt%
Pt/Norit C during the conversion of heptanoic acid at 573 K and a feed flow rate of 0.01
cm3min-1 composed of 95 wt% heptanoic acid and 5 wt% dodecane. The bars with patterns
represents the product distribution and can be read on the left axis. represents 1-hexene,
represents 2-3-hexenes, represents hexane, represents 7-tridecanone, and represents the
unknown products. The black squares represent conversion (%) and can be read on the right
axis. These results were recorded after 20 h of reaction.

44
Figure 2.12. TEM images of spent Pt/Norit C catalysts. The catalysts were prepared by IWI
and reduced with H2 at 623 K at a heating rate of 5 K min-1. A represents a spent sample of 1
wt% Pt, B represents a spent sample of 5 wt% Pt, and C represent a spent sample of 10 wt%
Pt. The spent samples were first run in liquid-phase operation until steady-state operation and
then they were run in gas-phase operation until deactivation. At that point in time, the spent
samples were recovered from the reactor and treated as described in the Experimental Methods
section. The spent catalysts were collected after a total of 80 h under reaction conditions.
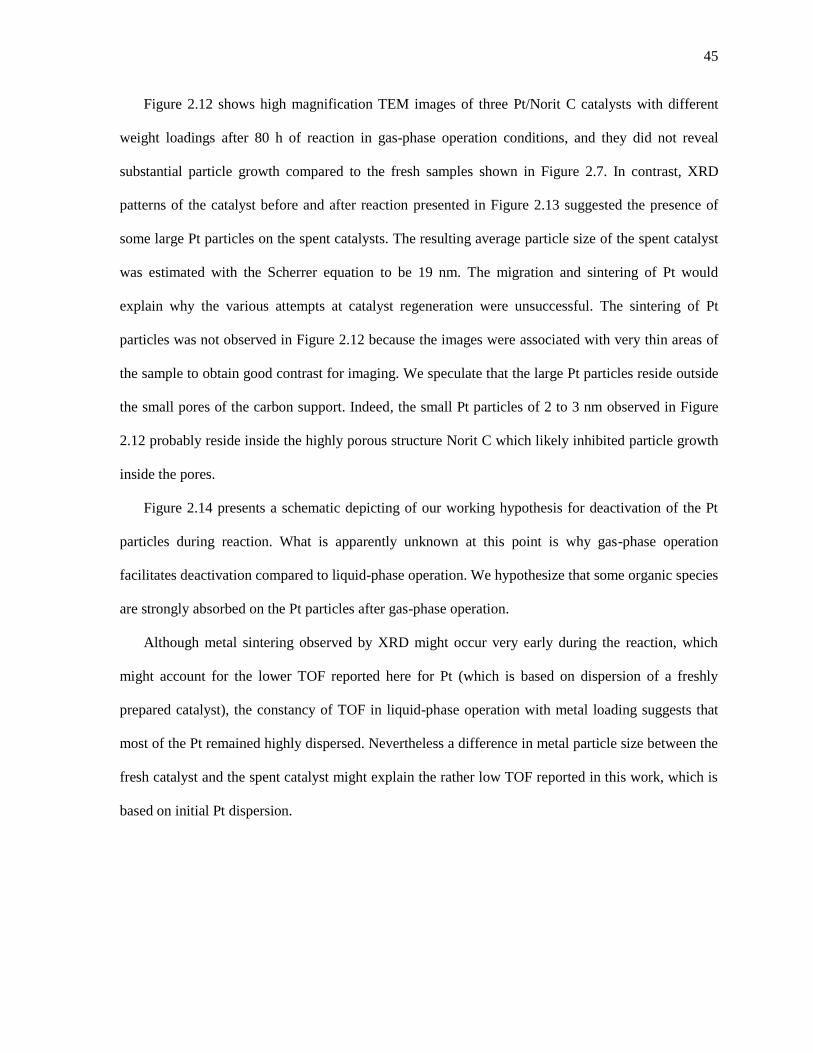
45
Figure 2.12 shows high magnification TEM images of three Pt/Norit C catalysts with different
weight loadings after 80 h of reaction in gas-phase operation conditions, and they did not reveal
substantial particle growth compared to the fresh samples shown in Figure 2.7. In contrast, XRD
patterns of the catalyst before and after reaction presented in Figure 2.13 suggested the presence of
some large Pt particles on the spent catalysts. The resulting average particle size of the spent catalyst
was estimated with the Scherrer equation to be 19 nm. The migration and sintering of Pt would
explain why the various attempts at catalyst regeneration were unsuccessful. The sintering of Pt
particles was not observed in Figure 2.12 because the images were associated with very thin areas of
the sample to obtain good contrast for imaging. We speculate that the large Pt particles reside outside
the small pores of the carbon support. Indeed, the small Pt particles of 2 to 3 nm observed in Figure
2.12 probably reside inside the highly porous structure Norit C which likely inhibited particle growth
inside the pores.
Figure 2.14 presents a schematic depicting of our working hypothesis for deactivation of the Pt
particles during reaction. What is apparently unknown at this point is why gas-phase operation
facilitates deactivation compared to liquid-phase operation. We hypothesize that some organic species
are strongly absorbed on the Pt particles after gas-phase operation.
Although metal sintering observed by XRD might occur very early during the reaction, which
might account for the lower TOF reported here for Pt (which is based on dispersion of a freshly
prepared catalyst), the constancy of TOF in liquid-phase operation with metal loading suggests that
most of the Pt remained highly dispersed. Nevertheless a difference in metal particle size between the
fresh catalyst and the spent catalyst might explain the rather low TOF reported in this work, which is
based on initial Pt dispersion.

46
Figure 2.13. Comparison of the XRD patterns of Norit C support, fresh 10 wt% Pt/Norit C
after reduction, and spent 10 wt% Pt/Norit C after reaction. The spent sample was first run in
liquid-phase operation until steady-state operation and then it was run in gas-phase operation
until deactivation. At that point, the spent sample was recovered from the reactor and treated
as described in the Experimental Methods section. The spent catalyst was collected after a total
of 80 h under reaction conditions. The patterns were offset for clarity.

47
Figure 2.14. Schematic depiction of working hypothesis for catalyst sintering.
2.4. Conclusions
Platinum nanoparticles were supported on Norit carbon, Vulcan carbon and silicon carbide,
characterized by chemisorption, X-ray diffraction and electron microscopy, and evaluated in the
conversion of heptanoic acid at 573 K. Results from characterization and reactivity confirmed that highly
dispersed Pt was formed in Norit carbon (dispersion ≈ 49%) after a mild reduction treatment at 623 K.
Similar treatment of Pt/Vulcan carbon and Pt/SiC resulted in the formation of much larger particles of Pt.
Variations of Pt dispersion, Pt loading and reactor space time were used to explore the influence of
conversion on product distribution during heptanoic acid conversion over Pt/Norit C. In summary,
decarbonylation of heptanoic acid was the primary reaction to produce olefin, CO and water. Rapid
conversion of α-olefin to internal olefin was observed in liquid-phase operation, even at low conversion.
Higher selectivity to α-olefin product was achieved by operation in the gas phase, presumable because of
the greater rate of mass transfer of product molecules out of the catalyst pores. Although various criteria
indicated the rate of heptanoic acid conversion was not limited by mass transfer, subsequent reactions of
the products could be. Higher conversion of heptanoic acid in liquid-phase operation also was
accompanied by sequential conversion of CO to CO2, presumably via water-gas shift reaction. In
addition, hydrogenation of olefin was observed at higher conversion as expected from H2 generated by the
WGS reaction. A summary of the reaction network observed here is provided in Figure 2.15.

48
Figure 2.15. Reaction network for the decarbonylation/decarboxylation of heptanoic acid over
supported Pt at low conversion levels.
2.5. Acknowledgement
This material is based upon work supported by the National Science Foundation (NSF) under Award
No. EEC-0813570. Any opinions, findings, and conclusions or recommendations expressed in this
material are those of the author(s) and do not necessarily reflect the views of the NSF. We acknowledge
discussions with Professor Matthew Neurock at the University of Virginia, Dr. Hien Pham and Professor
Abhaya Datye at the University of New Mexico. We also gratefully acknowledge the help of Mr. Richard
White and Mr. Matthew Schneider at the University of Virginia for their help with the TEM.
49
2.6. References
[1] Snåre, M., Kubicková, I., Mäki-Arvela, P., Eränen, K., and Murzin, D. Y., 2006, “Heterogeneous
Catalytic Deoxygenation of Stearic Acid for Production of Biodiesel,” Ind Eng Chem Res, 45(45),
pp. 5708–5715.
[2] Lestari, S., Mäki-Arvela, P., Bernas, H., Simakova, O., Sjoholm, R., Beltramini, J., Lu, G. Q. M.,
Myllyoja, J., Simakova, I., and Murzin, D. Y., 2009, “Catalytic Deoxygenation of Stearic Acid in
a Continuous Reactor over a Mesoporous Carbon-Supported Pd Catalyst,” Energ Fuel, 23(8), pp.
3842–3845.
[3] Miller, J. A., Nelson, J. A. J. A., and Byrne, M. P., 1993, “A Highly Catalytic and Selective
Conversion of Carboxylic Acids to 1-Alkenes of One Less Carbon Atom,” J Org Chem, 58(1), pp.
18–20.
[4] Maier, W. F., Roth, W., Thies, I., v. Rague Schleyer, P., Ragukschleyer, P., and Schleyer, R.,
1982, “Gas Phase Decarboxylation of Carboxylic Acids,” Chem Ber, 115, pp. 808–812.
[5] Morgan, T., Grubb, D., Santillan-Jimenez, E., Crocker, M., and Crocker, E. S. M., 2010,
“Conversion of Triglycerides to Hydrocarbons Over Supported Metal Catalysts,” Top Catal,
53(11-12), pp. 820–829.
[6] Santillan-Jimenez, E., Morgan, T., Lacny, J., Mohapatra, S., and Crocker, M., 2012, “Catalytic
deoxygenation of triglycerides and fatty acids to hydrocarbons over carbon-supported nickel,”
Fuel, 103(September), pp. 1010–1017.
[7] Renz, M., 2005, “Ketonization of Carboxylic Acids by Decarboxylation: Mechanism and Scope,”
Eur J Org Chem, 2005(6), pp. 979–988.
50
[8] Gaertner, C. A., Serrano-Ruiz, J. C., Braden, D. J., and Dumesic, J. A., 2009, “Catalytic coupling
of carboxylic acids by ketonization as a processing step in biomass conversion,” J Catal, 266(1),
pp. 71–78.
[9] Snåre, M., Kubicková, I., Mäki-Arvela, P., Eränen, K., Wärnå, J., and Murzin, D. Y., 2007,
“Production of diesel fuel from renewable feeds : Kinetics of ethyl stearate decarboxylation,”
Chem Eng J, 134, pp. 29–34.
[10] Snåre, M., Kubicková, I., Mäki-Arvela, P., Chichova, D., Eränen, K., and Murzin, D. Y., 2008,
“Catalytic deoxygenation of unsaturated renewable feedstocks for production of diesel fuel
hydrocarbons,” Fuel, 87(6), pp. 933–945.
[11] Patterson, A. L., 1939, “The Scherrer Formula for X-Ray Particle Size Determination,” Phys Rev,
56, pp. 978–982.
[12] Pham, H. N., Pagan-Torres, Y. J., Serrano-Ruiz, J. C., Wang, D., Dumesic, J. A., and Datye, A.
K., 2011, “Improved hydrothermal stability of niobia-supported Pd catalysts,” Appl Catal A-Gen,
397(1-2), pp. 153–162.
[13] Mäki-Arvela, P., Snåre, M., Eränen, K., Myllyoja, J., and Murzin, D. Y., 2008, “Continuous
decarboxylation of lauric acid over Pd/C catalyst,” Fuel, 87(17-18), pp. 3543–3549.
[14] Gaertner, C. A., Serrano-Ruiz, J. C., Braden, D. J., and Dumesic, J. A., 2010, “Ketonization
Reactions of Carboxylic Acids and Esters over Ceria−Zirconia as Biomass-Upgrading Processes,”
Ind Eng Chem Res, 49(13), pp. 6027–6033.
[15] Boudart, M., 1995, “Turnover Rates in Heterogeneous Catalysis,” Chem Rev, 95, pp. 661–666.

51
[16] Weisz, P. B., and Prater, C. D., 1954, “Interpretation of Measurements in Experimental Catalysis,”
Adv Catal, 6, pp. 143–196.
[17] Davis, M. E., and Davis, R. J., 2012, Fundamentals of Chemical Reaction Engineering, Dover
Publications, Mineola, New York.
[18] Cussler, E. L., 2009, Diffusion: Mass Transfer in Fluid Systems, Cambridge University Press,
New York.
[19] Simakova, I., Simakova, O., Mäki-Arvela, P., and Murzin, D. Y., 2010, “Decarboxylation of fatty
acids over Pd supported on mesoporous carbon,” Catal Today, 150(1-2), pp. 28–31.
[20] Lestari, S., Simakova, I., Tokarev, A., Mäki-Arvela, P., Eränen, K., and Murzin, D. Y., 2008,
“Synthesis of Biodiesel via Deoxygenation of Stearic Acid over Supported Pd / C Catalyst,” Catal
Lett, 122(3-4), pp. 247–251.
[21] Bernas, H., Eränen, K., Simakova, I., Leino, A.-R., Kordás, K., Myllyoja, J., Mäki-Arvela, P.,
Salmi, T., and Murzin, D. Y., 2010, “Deoxygenation of dodecanoic acid under inert atmosphere,”
Fuel, 89(8), pp. 2033–2039.
[22] Mäki-Arvela, P., Kubicková, I., Snåre, M., Eränen, K., and Murzin, D. Y., 2007, “Catalytic
Deoxygenation of Fatty Acids and Their Derivatives,” Energ Fuel, 21(1), pp. 30–41.
[23] Immer, J. G., Kelly, M. J., and Lamb, H. H., 2010, “Catalytic reaction pathways in liquid-phase
deoxygenation of C18 free fatty acids,” Appl Catal A-Gen, 375(1), pp. 134–139.
[24] Immer, J. G., and Lamb, H. H., 2010, “Fed-Batch Catalytic Deoxygenation of Free Fatty Acids,”
Energ Fuel, 130(10), pp. 5291–5299.
52
[25] Su, B., Wang, K., Cheng, T., and Tseng, C., 2012, “Preparation of PtSn / C electrocatalysts with
improved activity and durability toward oxygen reduction reaction by alcohol-reduction process,”
Mater Chem Phys, 135(2-3), pp. 395–400.
[26] Simakova, I., Simakova, O., Mäki-Arvela, P., Simakov, A., Estrada, M., and Murzin, D. Y., 2009,
“Deoxygenation of palmitic and stearic acid over supported Pd catalysts : Effect of metal
dispersion,” Appl Catal A-Gen, 355, pp. 100–108.
[27] Madon, R. J., and Boudart, M., 1982, “Experimental Criterion for the Absense of Artifacts in the
Measurements of Rates of Heterogeneous Catalytic Reactions,” Ind Eng Chem Fundam, (21), pp.
438–447.
[28] Kubicková, I., Snåre, M., Eränen, K., Mäki-Arvela, P., and Murzin, D., 2005, “Hydrocarbons for
diesel fuel via decarboxylation of vegetable oils,” Catal Today, 106(1-4), pp. 197–200.
[29] Lestari, S., Mäki-Arvela, P., Simakova, I., Beltramini, J., Lu, G. Q. M., and Murzin, D. Y., 2009,
“Catalytic Deoxygenation of Stearic Acid and Palmitic Acid in Semibatch Mode,” Catal Lett,
130(1-2), pp. 48–51.
[30] Simakova, I., Rozmysłowicz, B., Simakova, O. A., Mäki-Arvela, P., Simakov, A., and Murzin, D.
Y., 2011, “Catalytic Deoxygenation of C18 Fatty Acids Over Mesoporous Pd / C Catalyst for
Synthesis of Biofuels,” Top Catal, 54(8-9), pp. 460–466.
[31] Ping, E. W., Pierson, J., Wallace, R., Miller, J. T., Fuller, T. F., and Jones, C. W., 2011, “On the
nature of the deactivation of supported palladium nanoparticle catalysts in the decarboxylation of
fatty acids,” Appl Catal A-Gen, 396(1-2), pp. 85–90.

53
Chapter 3. Reactivity and Stability of Supported Pd Nanoparticles
during the Liquid-Phase and Gas-Phase Decarbonylation of
Heptanoic Acid
Abstract
The liquid-phase and gas-phase decarbonylation of heptanoic acid over carbon- and silica-
supported Pd nanoparticles was studied in a continuous flow fixed bed reactor at 573 K. The liquid-phase
turnover frequency (TOF) under steady state conditions (>20 h) was very low at ≈ 0.00070 s-1,
presumably because of deposition of carbonaceous species and in some cases sintering of the metal
particles, as revealed by H2 chemisorption, X-ray diffraction and electron microscopy. The steady-state
rate was independent of the support composition, synthesis method, Pd loading (1 to 20 wt%), and acid
concentration (0.1 to 6.6 M). Although the gas-phase reaction led to deactivation of the supported Pd
catalysts, extrapolation of the rate to initial time gave a TOF of ≈ 0.035 s-1 at 573 K. The liquid- and gas-
phase reactions at low conversion levels were selective towards the formation of decarbonylation
products such as CO and hexenes. Higher conversion levels resulted in the subsequent conversion of the
primary decarbonylation products. Postmortem analysis of the catalysts revealed that concentrated, liquid-
phase heptanoic acid at 573 K severely sintered the Pd nanoparticles supported on carbon but not those
supported on silica. The Pd nanoparticles were able to maintain the high dispersion on carbon when
exposed to low concentrations of liquid-phase heptanoic acid or gaseous heptanoic acid at 573 K.

54
3.1. Introduction
Biomass is an abundant, carbon-neutral alternative resource to fossil fuels for the production of
fuels and chemicals. Processing of biomass presents a chemical challenge because it often contains excess
oxygen that needs to be removed [1]. Dehydration, ketonization, decarbonylation and decarboxylation
comprise a set of transformations collectively regarded as deoxygenation reactions. Organic acids, such as
carboxylic acids, are biomass-derived molecules that can be readily converted to hydrocarbons by
deoxygenation reactions. As shown in Scheme 3.1, linear carboxylic acids can be converted into linear
olefins and paraffins by decarbonylation and decarboxylation, respectively. Ketonization is also an
important reaction for the production of fine chemicals and fuels [2,3] in which two carboxylic acid
molecules couple to form a symmetrical ketone, CO2, and H2O, as depicted in Scheme 3.2.
Scheme 3.1. Decarbonylation and decarboxylation of heptanoic acid

55
Scheme 3.2. Ketonization of heptanoic acid
In our previous work, we studied the decarbonylation of heptanoic acid over Pt nanoparticles and
reported low α-olefin selectivities because of olefin isomerization and sequential hydrogenation when the
reaction was run at modest conversions [4]. At low conversions, however, decarbonylation was the
primary reaction path [4]. Whereas Boda et al. [5] and Lugo-José et al. [6,7] also reported that
decarbonylation was the main deoxygenation reaction over Pd catalysts, much of the deoxygenation
literature [8–22] reports decarboxylation occurs when performing experiments in the presence of
dihydrogen and solvent to inhibit catalyst deactivation and maximize the selectivity towards the formation
of paraffins [17]. Discriminating between competing reaction paths based solely on the hydrocarbon
products that are formed is difficult because alkenes are readily hydrogenated in the presence of H2 and
Pd. Nevertheless, Maier et al. speculated the active site on a Pd catalyst to be a Pd/H complex [23].
Interestingly, quantum chemical studies by Lamb et al. explored a potential mechanistic path to
decarboxylate butanoic acid on a model Pd (111) surface [24], whereas Heyden and co-workers revealed
a path to decarbonlylate propanoic acid on Pd (111) [25,26].
Support composition and metal particle size have also been reported to affect the catalyst activity.
For example, Lugo-José et al. studied the gas-phase decarbonylation of propanoic acid and reported an
increase in TOF by a factor of ≈ 32 when Pd nanoparticles were supported on silica instead of carbon [6],
but Ford et al. reported a decrease in TOF of ≈ 3 fold when Pd nanoparticles were supported on silica
instead of carbon during the liquid-phase operation [22]. In a different study, Lugo-José et al. reported
during the gas-phase deoxygenation of propanoic acid at 473 K a constant TOF over Pd nanoparticles
with sizes between 3.0 to 12 nm, but the TOF decreased by a factor of 3 when Pd nanoparticles of 1.9 nm
were used instead [7]. In contrast, Simakova et al. reported an increase in TOF as the Pd nanoparticle size
56
decreased from 6.1 to 2.3 nm during the liquid-phase deoxygenation of palmitic and stearic acid at 573 K
[19].
Given the diversity of results reported for the conversion of carboxylic acids over supported Pd
catalysts, which seem to depend on both catalyst type and reaction conditions, we studied systematically
the decarbonylation and decarboxylation of heptanoic acid over a wide variety of supported Pd catalysts
in a continuous-flow fixed-bed reactor. The effects of support type, Pd impregnation method, Pd weight
loading, conversion, reaction phase, and acid concentration on the activity, product selectivity, and
catalyst stability were examined.
3.2. Experimental Methods
3.2.1. Catalyst synthesis
The catalysts were prepared by incipient wetness impregnation (IWI) using aqueous solutions of
tetraamminepalladium (II) nitrate, (NH3)4Pd(NO3)2 (Sigma Aldrich) to obtain 1, 5, 10, and 20 wt% Pd
loadings on Norit activated carbon (ROX 0.9), respectively. Prior to impregnation, Norit carbon
particles were crushed and sieved between 180 μm and 425 μm. After impregnation of the desired
metal precursor solution, the catalyst was dried in air at 393 K overnight. Palladium (II) acetate,
Pd(OCOCH3)2, was used to prepare catalysts by the alcohol reduction (AR) method, as described by
Benavidez et al. [27], to obtain a 5 wt% loading on Norit activated carbon, Vulcan carbon (XC-72),
and Davisil silica 636. Vulcan carbon and Davisil silica were used as received. The dried solids were
reduced with in H2 (GTS-Welco 99.999%) flowing at 100 cm3 min-1. The temperature of reduction
was increased at 1 K min-1 from room temperature to 623 K, and held isothermally for 3 h. The
catalysts were then cooled, exposed to air, and stored in a vial.
3.2.2. Dihydrogen chemisorption
The metal dispersion was measured by H2 chemisorption performed on a Micromeritics ASAP
2020 system. The catalyst was evacuated at 573 K for 10 h under vacuum followed by heating to 623

57
K at a rate of 1 K min-1 after which it was reduced with flowing H2 (GTS-Welco 99.999%) at 623 K
for 3 h. Following reduction, the catalyst sample was evacuated at 573 K and cooled in vacuum to
373 K to prevent β-phase hydride formation during chemisorption. The amount of metal on the
surface was evaluated by the total amount of H2 adsorbed extrapolated to zero pressure, assuming a
stoichiometric relationship between H2 to metal of 1:2 (i.e. H/Pd = 1).
3.2.3. Dinitrogen physisorption
The specific surface area and pore size were measured by N2 physisorption using a Micromeritics
ASAP 2020. The samples were evacuated for 180 min at 373 K prior to the N2 physisorption, after
which adsorption isotherms were measured at 77 K. The Brunauer-Emmett-Teller (BET) and the
Barrett-Joyner-Halenda (BJH) methods were used to determine the specific surface area and the pore
size, respectively.
3.2.4. X-ray diffraction
Powder X-ray diffraction (XRD) analysis from 2Ө = 20 to 90° was carried out on a X’Pert Pro
MPD with monochromatic Cu Kα-radiation (λ=1.54056 Å) using a step size of 1/4° and a time step of
1 s.
3.2.5. Electron microscopy
Transmission electron microscopy (TEM) was performed on a FEI Titan operated at 300 keV in
bright field mode and on a JEOL 2010F operated at 200 KeV in STEM high-angle annular dark-field
(HAADF) mode. Catalyst samples were deposited on a SPI holey-carbon coated Cu grid after being
dispersed in ethanol [28].
3.2.6. Catalytic conversion of heptanoic acid
The catalytic decarbonylation/decarboxylation of heptanoic acid (Sigma Aldrich ≥99.50%) was
performed in a fixed bed tubular reactor described previously [4]. The reactor was composed of a 2
58
µm pore size frit that immobilized 50 to 500 mg of catalyst pellets supported on a glass wool plug.
Fresh catalyst was used for each experiment due to the irreversible deactivation of the catalyst as
described in our previous work with Pt catalysts. After loading the reactor, the system was purged for
60 min with 200 cm3 min-1 of N2 (GTS-Welco 99.999%) at atmospheric pressure to remove dioxygen
from the system and the pressure was increased to 45 bar to perform a leak test and then
depressurized. The temperature was then increased at 1 K min-1 to the desired reduction temperature,
623 K, under 100 cm3 min-1 of H2 (GTS-Welco 99.999%) and held isothermally for 3 h at
atmospheric pressure. The reactor was finally cooled to the desired reaction temperature, 573 K, and
purged for 60 min in 200 cm3 min-1 of N2 (GTS-Welco 99.999%). Then, the pressure was increased to
the desired reaction condition, 40 bar, with 200 cm3 min-1 of N2 (GTS-Welco 99.999%).
For the “pure” acid experiments, the feed mixture was composed of 95 wt% heptanoic acid
(Sigma Aldrich ≥99.50%) and 5 wt% dodecane (Sigma Aldrich anhydrous 99.00%) as an internal
standard. Tetradecane (Sigma Aldrich anhydrous 99.90%) was used as a diluent to prepare feeds with
different heptanoic acid concentration (50, 25, 10, 7.5, 5, and 2.5 mol%). The feed was then pumped
in the reaction system using a syringe pump (ISCO 500D) operating at different liquid flow rates
(0.01 to 1.0 cm3 min-1). The acid feed mixtures passed through a heated zone before entering the
catalytic reactor. A more detailed explanation of reaction set up and schematic can be found in section
2.2.6 and Figure 2.1, respectively.
The outlet of the reactor was connected to an air cooled condenser maintained at room
temperature to remove the condensable products, such as hexane, 1-hexene, hexenes, 7-tridecanone,
dodecane, tetradecane, and unreacted heptanoic acid, from the product stream. The liquid-phase
sample was analyzed by a gas chromatograph (GC 7890 A) equipped with a ZB-FFAP column
(length 45 m x 0.538 mm) and a flame ionization detector (FID). The product gas was continuously
removed from the condenser using 5 cm3 min-1 N2 (GTS-Welco 99.999%) as a purge gas. The outlet
gas of the condenser was fed to an on-line gas chromatograph (HP 5890 Series II) equipped with a
packed column, ShinCarbon ST 80/100, and a thermal conductivity detector (TCD) for detection of

59
N2, CO, CO2 and any other light hydrocarbons (if any). Gas chromatography calibrations can be
found in Appendix B.
A series of control experiments was performed to determine the background conversion of the
system at our typical reaction conditions (573 K, 1 bar, 250 mg of catalyst, and 0.01 cm3 min-1 of
liquid feed composed of 95 wt% heptanoic acid and 5 wt% dodecane). In the absence of catalyst, no
conversion of heptanoic acid was observed. However, when Norit or Vulcan carbon support were
used, a background conversion was detected of ≈ 2 and 1 %, respectively. No conversion was
observed over the silica support.
3.2.7. Postmortem catalyst characterization
The spent samples were recovered from the reactor, washed with 25 mL of methanol and
sonicated in a methanol solution for 30 min to remove weakly adsorbed reactant and products from
the surface of the catalyst. After sonication, the solids were recovered by filtration and dried
overnight in air at 400 K. The spent samples were characterized by H2 chemisorption, N2
physisorption, XRD, and TEM to determine the effect of reaction conditions on the catalyst structure
and adsorption capacity.
3.2.8. Calculations of rates
As described in our previous work, the turnover frequency (TOF) was calculated as the rate of
formation of the products referred to the number of surface metal atoms evaluated on a freshly
prepared catalyst [4]. The main components in the gas-phase were CO and CO2, whereas 1-hexene, 2-
and 3-hexenes (i-hexenes), hexane, 7-tridecanone, and heptanoic acid were the main products in the
liquid-phase. Some minor amounts of heavier unknown products were also detected in the liquid-
phase products (which accounted for ≈ 0.4% of the total detected liquid product).
The liquid-phase TOF was calculated using the rate of formation of the products after 20 h of
reaction, after which the liquid-phase reaction was at a steady state, normalized to the number of

60
surface metal atoms evaluated on a fresh catalyst. The liquid-phase TOF was therefore calculated as
[(rate of production after 20 h of reaction (mol s-1) hexane + 1-hexene + i-hexenes + 2 x moles of 7-
tridecanone) / (mol of surface metal on a fresh catalyst counted by H2 chemisorption)].
During gas-phase operation, the catalyst deactivated exponentially with time during the first 3 h
of reaction. Thus, an initial TOF was calculated by extrapolating the log of the reaction rate to t = 0 h.
The initial TOF was calculated as [(rate of production (mol s-1) of hexane + 1-hexene + i-hexenes + 2
x moles of 7-tridecanone) / (mol of surface metal on a fresh catalyst counted by H2 chemisorption)].
The deoxygenation conversion is defined here as the formation rates of the major products
divided by the feed rate of reagent. Thus, the deoxygenation conversion was calculated as [(rate of
production (mol s-1) of hexane + 1-hexene + i-hexenes + 2 x moles of 7-tridecanone) / (moles of
heptanoic acid fed (mol s-1))].
The product selectivity was defined as the moles of a product formed divided by the total moles
of products present in the same phase (liquid or gas). Three different sets of product selectivity were
calculated, the selectivity to carbon oxides (CO and CO2), i.e. CO selectivity [(rate of CO) / (rate of
CO + rate of CO2)], the selectivity of α-olefin relative to all olefin produced for 1-hexene and
hexenes, i.e. relative α-olefin selectivity [(rate of 1-hexene) / ( rate of 1-hexene + i-hexenes)], and the
selectivity to deoxygenation products for mainly hexane, 1-hexene, i-hexenes, and 7-tridecanone, i.e.
selectivity of hexane [(rate of hexane) / (rate of hexane + 1-hexene + i-hexenes + 2 x moles of 7-
tridecanone )].
3.3. Results and Discussion
3.3.1. Effect of support and impregnation method during the liquid-phase operation
In our previous study [4], low metal dispersion was achieved with 5 wt% Pt synthesized by an
incipient wetness impregnation (IWI) method on low surface area supports such as Vulcan carbon
and silicon carbide. For this reason, we decided to use an alcohol reduction (AR) method to deposit
Pd nanoparticles on Vulcan carbon and silica. Since high dispersion of metal can be achieved with
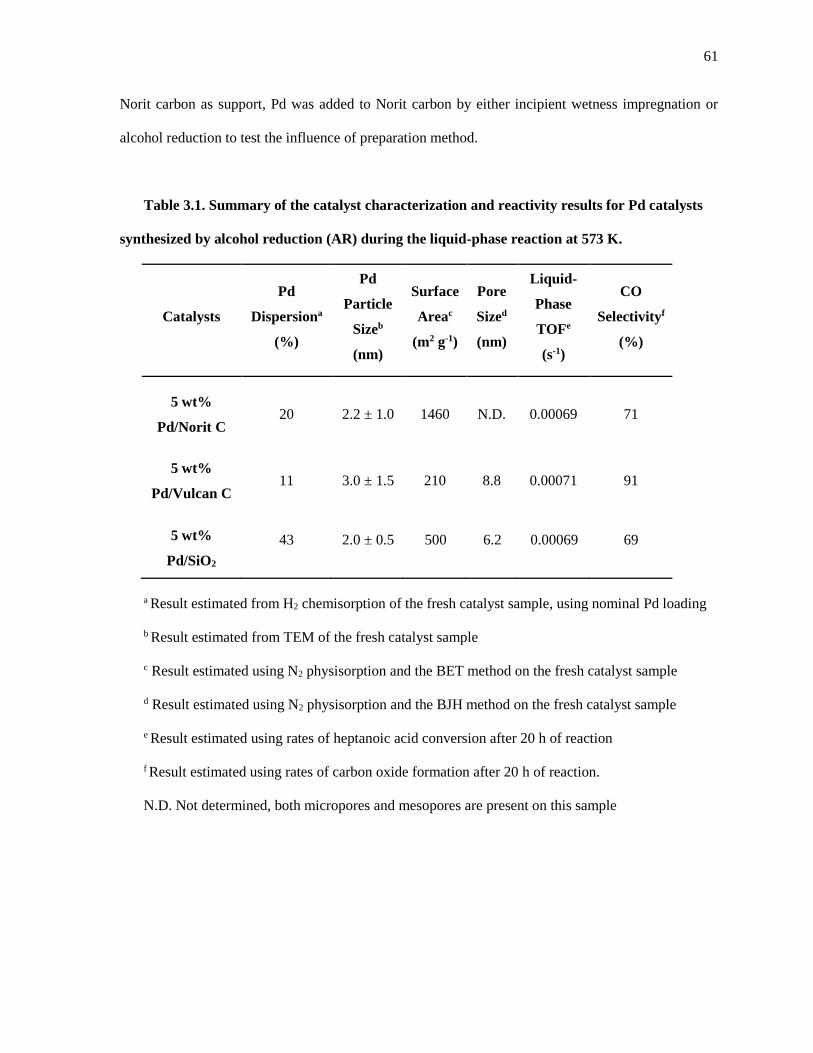
61
Norit carbon as support, Pd was added to Norit carbon by either incipient wetness impregnation or
alcohol reduction to test the influence of preparation method.
Table 3.1. Summary of the catalyst characterization and reactivity results for Pd catalysts
synthesized by alcohol reduction (AR) during the liquid-phase reaction at 573 K.
Catalysts
Pd
Dispersiona
(%)
Pd
Particle
Sizeb
(nm)
Surface
Areac
(m2 g-1)
Pore
Sized
(nm)
Liquid-
Phase
TOFe
(s-1)
CO
Selectivityf
(%)
5 wt%
Pd/Norit C 20 2.2 ± 1.0 1460 N.D. 0.00069 71
5 wt%
Pd/Vulcan C 11 3.0 ± 1.5 210 8.8 0.00071 91
5 wt%
Pd/SiO2
43 2.0 ± 0.5 500 6.2 0.00069 69
a Result estimated from H2 chemisorption of the fresh catalyst sample, using nominal Pd loading
b Result estimated from TEM of the fresh catalyst sample
c Result estimated using N2 physisorption and the BET method on the fresh catalyst sample
d Result estimated using N2 physisorption and the BJH method on the fresh catalyst sample
e Result estimated using rates of heptanoic acid conversion after 20 h of reaction
f Result estimated using rates of carbon oxide formation after 20 h of reaction.
N.D. Not determined, both micropores and mesopores are present on this sample

62
Table 3.2. Summary of catalysts characterization and reactivity results for Pd catalysts
synthesized by incipient wetness impregnation (IWI) during the liquid-phase reaction at 573 K.
Catalyst
Reaction
Temperature
(K)
Pd
Dispersiona
(%)
Pd Particle
Sizeb
(nm)
Surface
Areac
(m2 g-1)
Liquid-
Phase TOFd
(s-1)
CO
Selectivitye
(%)
1 wt%
Pd/Norit C
Fresh 25 1.9 ± 0.5 1460 - -
573 0 - 495 0.00071 70
5 wt%
Pd/Norit C
Fresh 25 2.0 ± 0.4 1450 - -
573 0 - 510 0.00069 67
10 wt%
Pd/Norit C
Fresh 25 2.4 ± 0.5 1400 - -
573 1.2 - 540 0.00069 60
20 wt%
Pd/Norit C
Fresh 24 2.5 ± 0.5 1460 - -
573 1.7 - 530 0.00068 54
a Result estimated from H2 chemisorption of the fresh catalyst sample, using nominal Pd loading
b Result estimated from electron microscopy
c Result estimated using N2 physisorption and the BET method on the fresh and spent catalyst samples
d Result estimated using rates of heptanoic acid conversion after 20 h of reaction
e Result estimated using rates of carbon oxide formation after 20 h of reaction
Catalysts composed of 5 wt% Pd loaded on the various supports were characterized by N2
physisorption, H2 chemisorption, XRD, and TEM, and the results are summarized in Tables 3.1 and
3.2 for the catalysts synthesized by AR and IWI, respectively. The Pd nanoparticle size on all the
catalysts was about 2 to 3 nm as evaluated by TEM. Although the dispersion of Pd on Pd/SiO2 (43%)
was consistent with the observed particle size evaluated by TEM (2.0 ± 0.5 nm) the dispersion of
Pd/Norit C samples (20 – 25%) and Pd/Vulcan C (11%) was lower than those expected from the
particle size observed by TEM. Therefore, the catalysts were examined by X-ray diffraction.

63
Figure 3.1. Comparison of the XRD patterns of 5 wt% Pd/Norit C, 5 wt% Pd/Vulcan C, and
5 wt% Pd/SiO2 prepared by alcohol reduction (AR) before (fresh) and after (spent) liquid-phase
reaction at 573 K. The patterns were offset for clarity. The spent samples were recovered from
the reactor and treated as described in the Experimental Methods section.
Figure 3.1 provides evidence for Pd crystallites on Vulcan C, even before reaction, which likely
accounts for the low dispersion of Pd measured by H2 chemisorption. Evidently, the particle size
evaluated by TEM did not account for the small number of larger metal crystallites. We assume the
discrepancy between the TEM particle size and metal dispersion of Pd on Norit C samples can be
explained in the same way. After liquid-phase reaction, both of the carbon catalysts had much intense
diffraction peaks associated with Pd most likely the result of metal sintering that occurred under the

64
liquid-phase reaction conditions, as reported for Pt catalysts [4]. Whereas TEM micrographs showed
highly dispersed Pd nanoparticles before reaction on all the supports, growth of Pd particles was
observed on all the carbon-based catalysts (Figure 3.2), more so for Pd/Vulcan C.
Figure 3.2. High-angle annular dark field STEM images of fresh (left) and spent (right)
catalysts during the liquid-phase decarbonylation of heptanoic acid at 573 K.
Fresh 5 wt% Pd/NoritC
Prepared by IWI
Fresh 5 wt% Pd/NoritC
Prepared by AR
Fresh 5 wt% Pd/VulcanC
Prepared by AR
Fresh 5 wt% Pd/SiO2
Prepared by AR
Spent 5 wt% Pd/NoritC
Prepared by IWI
Spent 5 wt% Pd/NoritC
Prepared by AR
Spent 5 wt% Pd/VulcanC
Prepared by AR
Spent 5 wt% Pd/SiO2
Prepared by AR

65
Interestingly, the silica-supported catalyst still showed highly dispersed Pd nanoparticles, as
depicted in Figure 3.2. This result suggests that silica might be a better support than carbon for
stabilizing metal particles under the harsh reaction conditions. Since all of the catalysts had very low
rate after 20 h of liquid-phase (TOF ≈ 0.00070 s-1), the large variation in final metal particle size does
not explain the deactivation.
Figures 3.3 and 3.4a shows the liquid-phase product selectivity after 20 h of reaction for the 5
wt% Pd catalyst synthesized by AR and IWI, respectively. The two 5 wt% Pd/Norit C catalysts
exhibited similar conversion level and product selectivity during reaction of heptanoic acid, with the
main liquid-phase products being hexane and hexenes. Evidently, the impregnation method and metal
precursor did not influence the catalytic performance or stability of the resulting Pd nanoparticles.
The variation of conversion with 5 wt% Pd sample in Figure 3.3 was likely the result of the different
initial dispersion of the catalysts, with Pd/Vulcan C having the lowest dispersion. Nevertheless, the
major liquid-phase product over all of the samples were hexenes and hexane.
Because silica is unstable at high temperatures in the presence of high concentration of water (a
product of the reaction) [29], and high dispersion of Pd was not successfully prepared on Vulcan C,
we focused additional efforts on the performance of Pd/Norit C.

66
Figure 3.3. Effect of support on product selectivity and conversion during the liquid-phase
decarbonylation of heptanoic acid at 573 K, and 0.01 cm3min-1 of liquid feed composed of 95
wt% heptanoic acid and 5 wt% dodecane. The product selectivity (%) is represented with color
bars and can be read on the left axis. represents 1-hexene, represents 2 and 3-hexenes,
represents hexane, represents 7-tridecanone, and represents the unknown products. The
black squares represent conversion (%) and can be read on the right axis. The background
conversion of the carbon supports was removed for clarity. These results were recorded after 20
h of reaction.
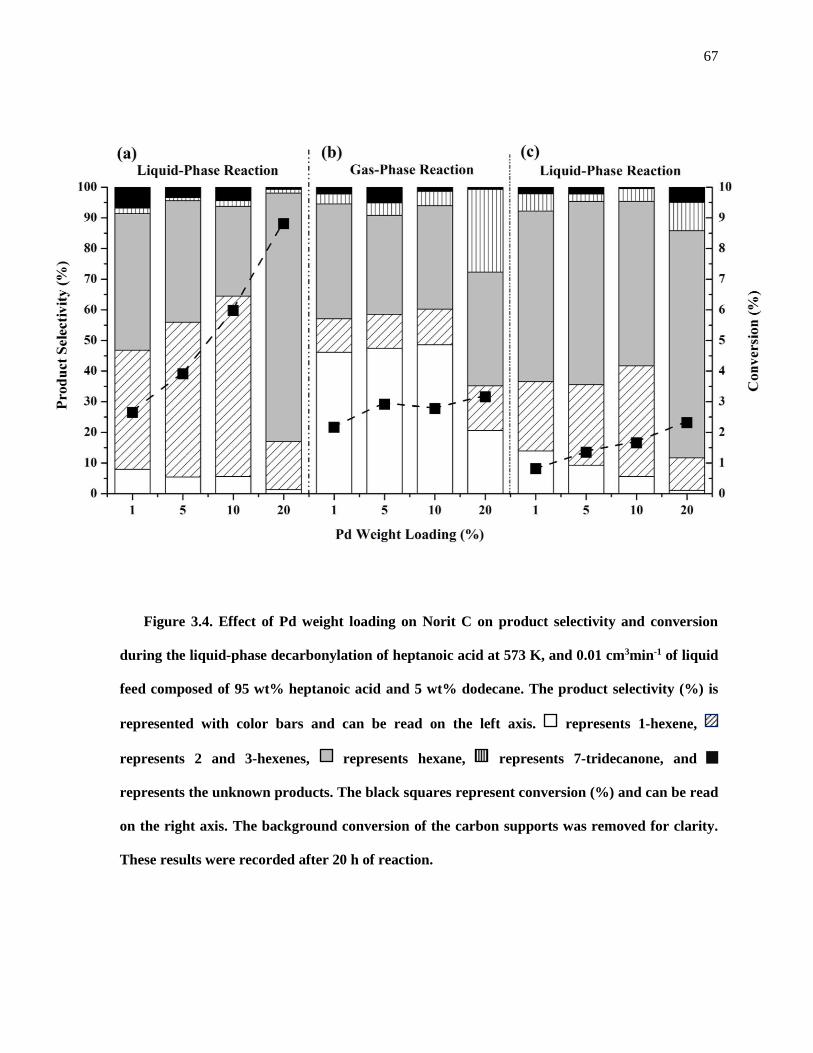
67
Figure 3.4. Effect of Pd weight loading on Norit C on product selectivity and conversion
during the liquid-phase decarbonylation of heptanoic acid at 573 K, and 0.01 cm3min-1 of liquid
feed composed of 95 wt% heptanoic acid and 5 wt% dodecane. The product selectivity (%) is
represented with color bars and can be read on the left axis. represents 1-hexene,
represents 2 and 3-hexenes, represents hexane, represents 7-tridecanone, and
represents the unknown products. The black squares represent conversion (%) and can be read
on the right axis. The background conversion of the carbon supports was removed for clarity.
These results were recorded after 20 h of reaction.
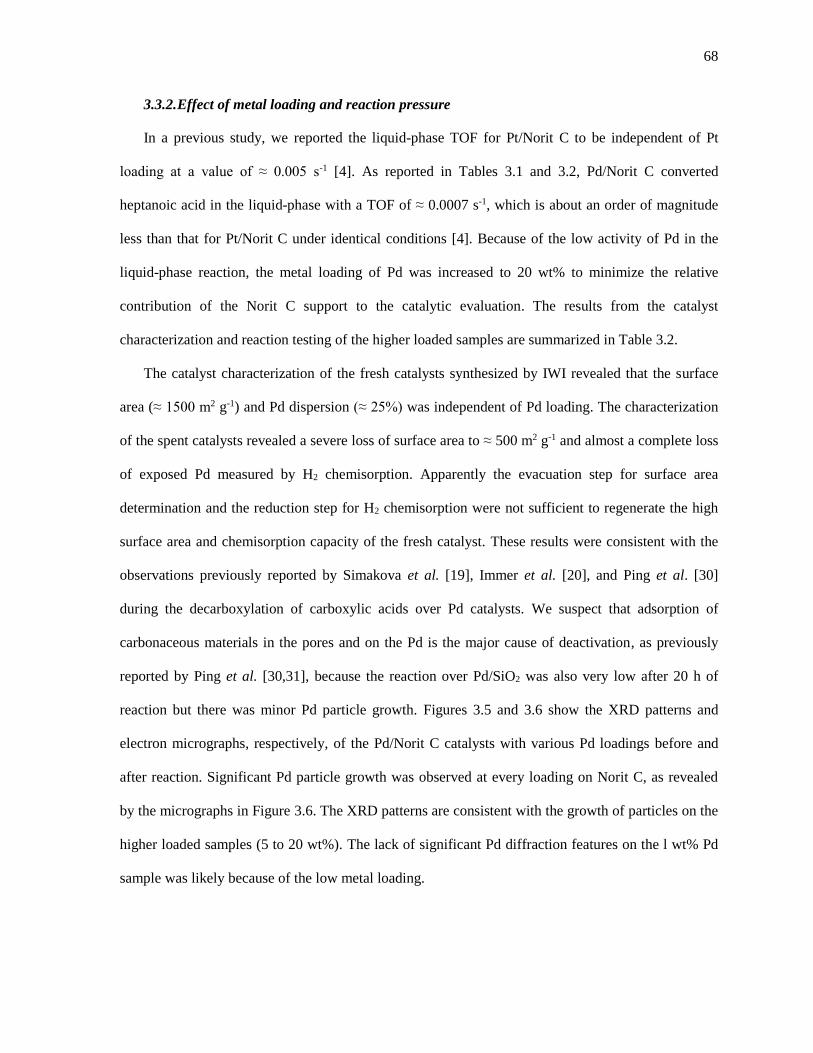
68
3.3.2. Effect of metal loading and reaction pressure
In a previous study, we reported the liquid-phase TOF for Pt/Norit C to be independent of Pt
loading at a value of ≈ 0.005 s-1 [4]. As reported in Tables 3.1 and 3.2, Pd/Norit C converted
heptanoic acid in the liquid-phase with a TOF of ≈ 0.0007 s-1, which is about an order of magnitude
less than that for Pt/Norit C under identical conditions [4]. Because of the low activity of Pd in the
liquid-phase reaction, the metal loading of Pd was increased to 20 wt% to minimize the relative
contribution of the Norit C support to the catalytic evaluation. The results from the catalyst
characterization and reaction testing of the higher loaded samples are summarized in Table 3.2.
The catalyst characterization of the fresh catalysts synthesized by IWI revealed that the surface
area (≈ 1500 m2 g-1) and Pd dispersion (≈ 25%) was independent of Pd loading. The characterization
of the spent catalysts revealed a severe loss of surface area to ≈ 500 m2 g-1 and almost a complete loss
of exposed Pd measured by H2 chemisorption. Apparently the evacuation step for surface area
determination and the reduction step for H2 chemisorption were not sufficient to regenerate the high
surface area and chemisorption capacity of the fresh catalyst. These results were consistent with the
observations previously reported by Simakova et al. [19], Immer et al. [20], and Ping et al. [30]
during the decarboxylation of carboxylic acids over Pd catalysts. We suspect that adsorption of
carbonaceous materials in the pores and on the Pd is the major cause of deactivation, as previously
reported by Ping et al. [30,31], because the reaction over Pd/SiO2 was also very low after 20 h of
reaction but there was minor Pd particle growth. Figures 3.5 and 3.6 show the XRD patterns and
electron micrographs, respectively, of the Pd/Norit C catalysts with various Pd loadings before and
after reaction. Significant Pd particle growth was observed at every loading on Norit C, as revealed
by the micrographs in Figure 3.6. The XRD patterns are consistent with the growth of particles on the
higher loaded samples (5 to 20 wt%). The lack of significant Pd diffraction features on the l wt% Pd
sample was likely because of the low metal loading.
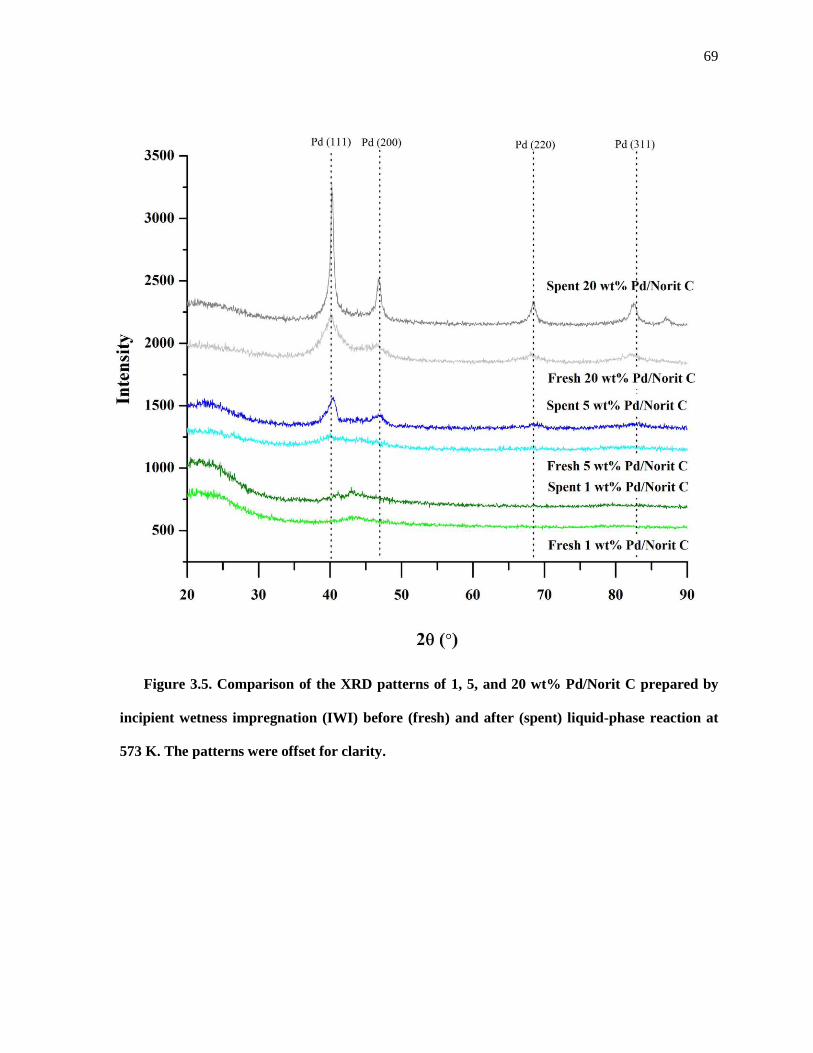
69
Figure 3.5. Comparison of the XRD patterns of 1, 5, and 20 wt% Pd/Norit C prepared by
incipient wetness impregnation (IWI) before (fresh) and after (spent) liquid-phase reaction at
573 K. The patterns were offset for clarity.

70
Figure 3.6. Bright field HRTEM images of fresh (left) and spent (right) Pd/Norit C samples
after the liquid-phase decarbonylation of heptanoic acid at 573 K.

71
The product distribution during the liquid-phase conversion of heptanoic acid over Pd catalysts
with low weight loading favored the formation of hexenes (1-, 2- and 3-hexenes) and CO, but was
difficult to distinguish from that attributed to the carbon support (Figure 3.4a). The catalyst with the
highest weight loading (20 wt% Pd) showed a different product distribution favoring the formation of
hexane and CO2. As the liquid-phase conversion increased because of the added Pd, the selectivity
towards the formation of 1-hexene decreased. This observation was consistent with our previous work
performed on Pt/Norit C, in which we found rapid bond isomerization of terminal olefins over the Pt
at our reaction conditions [4].
After 25 h of liquid-phase operation, the system was depressurized to allow for operation with
gas-phase heptanoic acid. During the gas-phase operation (Figure 3.4b), the selectivity towards the α-
olefin was higher than that observed during the liquid-phase experiments, but the catalyst deactivated,
as previously reported [4]. The deactivation was more severe with catalysts having higher Pd loading
(10 and 20 wt% Pd). After operating in gas-phase for 25 h, the system was re-pressurized to liquid-
phase reaction conditions (Figure 3.4c). The catalytic activity of the various Pd catalysts did not
recover to their initial steady state liquid-phase levels, indicating an irreversible change of the
catalysts during the gas-phase operation.
The reported values for turnover frequency (TOF) of carboxylic acid conversion over Pd
generally ranged 0.01 to 0.96 s-1 for batch reaction at 573 K [15,16,20,21] and from 0.027 to 0.004 s-1
for fixed-bed operation at 543 K [8,10]. Although these values are substantially greater than those
reported in this work, differences in reaction conditions such as not co-feeding H2 and feeding nearly
pure carboxylic acid might account for the differences in TOF. For example, Murzin and co-workers
[9,10,14–16,19] as well as Lamb and co-workers [20–22] studied the liquid-phase conversion of
carboxylic acids in the presence of H2 over Pd catalysts and reported TOFs from 0.01 to 0.1 s-1 at 573
K. Characterization of our spent catalysts revealed substantial loss in H2 chemisorption capacity,
suggesting our reaction conditions generally deactivated the catalyst.
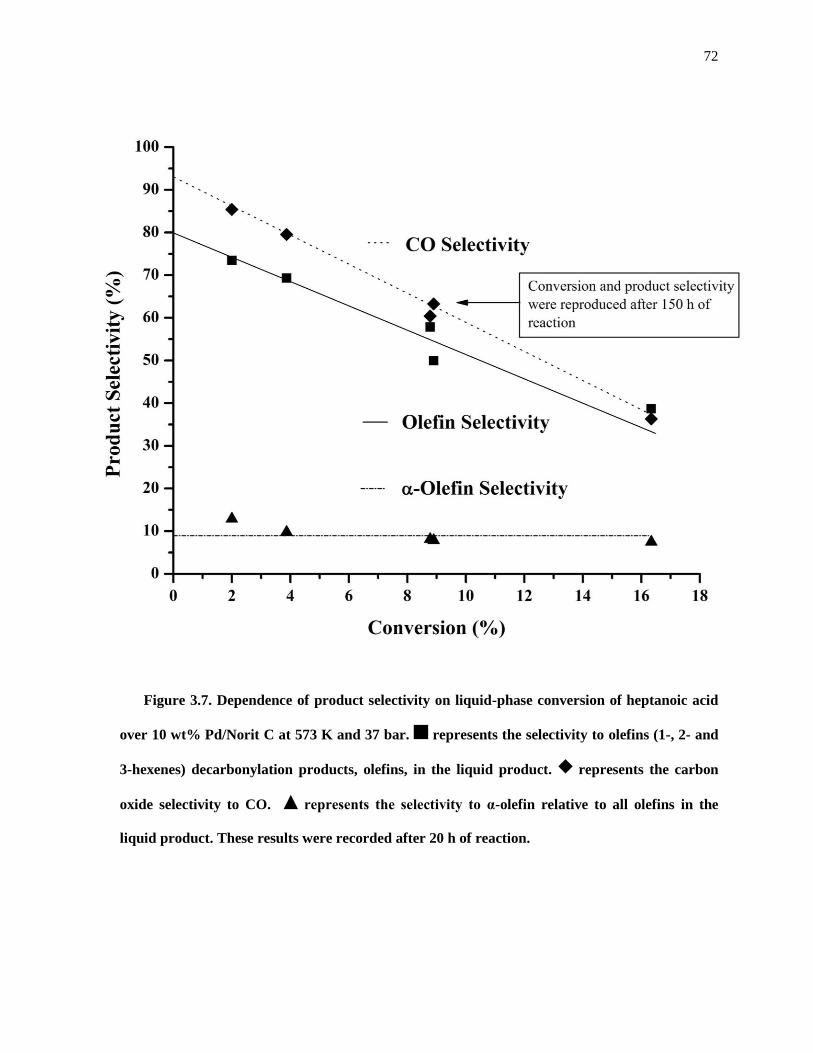
72
Figure 3.7. Dependence of product selectivity on liquid-phase conversion of heptanoic acid
over 10 wt% Pd/Norit C at 573 K and 37 bar. represents the selectivity to olefins (1-, 2- and
3-hexenes) decarbonylation products, olefins, in the liquid product. represents the carbon
oxide selectivity to CO. represents the selectivity to α-olefin relative to all olefins in the
liquid product. These results were recorded after 20 h of reaction.
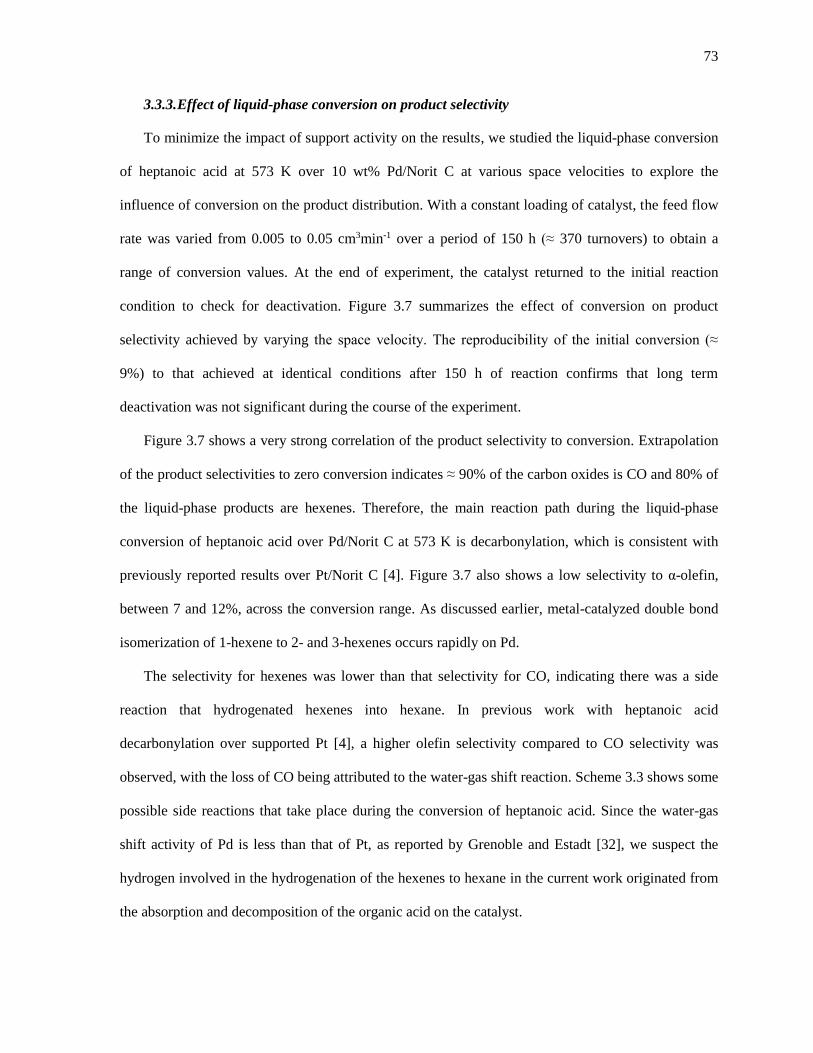
73
3.3.3. Effect of liquid-phase conversion on product selectivity
To minimize the impact of support activity on the results, we studied the liquid-phase conversion
of heptanoic acid at 573 K over 10 wt% Pd/Norit C at various space velocities to explore the
influence of conversion on the product distribution. With a constant loading of catalyst, the feed flow
rate was varied from 0.005 to 0.05 cm3min-1 over a period of 150 h (≈ 370 turnovers) to obtain a
range of conversion values. At the end of experiment, the catalyst returned to the initial reaction
condition to check for deactivation. Figure 3.7 summarizes the effect of conversion on product
selectivity achieved by varying the space velocity. The reproducibility of the initial conversion (≈
9%) to that achieved at identical conditions after 150 h of reaction confirms that long term
deactivation was not significant during the course of the experiment.
Figure 3.7 shows a very strong correlation of the product selectivity to conversion. Extrapolation
of the product selectivities to zero conversion indicates ≈ 90% of the carbon oxides is CO and 80% of
the liquid-phase products are hexenes. Therefore, the main reaction path during the liquid-phase
conversion of heptanoic acid over Pd/Norit C at 573 K is decarbonylation, which is consistent with
previously reported results over Pt/Norit C [4]. Figure 3.7 also shows a low selectivity to α-olefin,
between 7 and 12%, across the conversion range. As discussed earlier, metal-catalyzed double bond
isomerization of 1-hexene to 2- and 3-hexenes occurs rapidly on Pd.
The selectivity for hexenes was lower than that selectivity for CO, indicating there was a side
reaction that hydrogenated hexenes into hexane. In previous work with heptanoic acid
decarbonylation over supported Pt [4], a higher olefin selectivity compared to CO selectivity was
observed, with the loss of CO being attributed to the water-gas shift reaction. Scheme 3.3 shows some
possible side reactions that take place during the conversion of heptanoic acid. Since the water-gas
shift activity of Pd is less than that of Pt, as reported by Grenoble and Estadt [32], we suspect the
hydrogen involved in the hydrogenation of the hexenes to hexane in the current work originated from
the absorption and decomposition of the organic acid on the catalyst.

74
Scheme 3.3. Some possible side reactions during the conversion of heptanoic acid
Nevertheless, the results in Figure 3.7 clearly support the idea that decarbonylation is the primary
reaction of heptanoic acid on Pd under our experimental conditions. The fact that the fraction of CO
exceeds the fraction of hexenes at low conversions suggests that olefin hydrogenation occurs readily
on the catalysts and is independent of the water-gas shift reaction.
3.3.4. Gas-phase operation
Because liquid-phase heptanoic acid causes growth of Pd particles on the carbon support, we
decided to explore the gas-phase conversion over 10 wt% Pd/Norit C without exposing the catalyst to
liquid acid. The reactivity results summarized in Figure 3.8 reveal that the catalyst deactivated
severely during the first 2 h of reaction (Figure 3.8a), and that the deactivation was followed by
changes in product selectivity. Initially, we observed an acid conversion of 16.5%, with the CO
selectivity (Figure 8b) being similar to that of hexenes (Figure 3.8c). The 1-hexene selectivity was
very low, ≈ 5%, indicating rapid double bond isomerization.
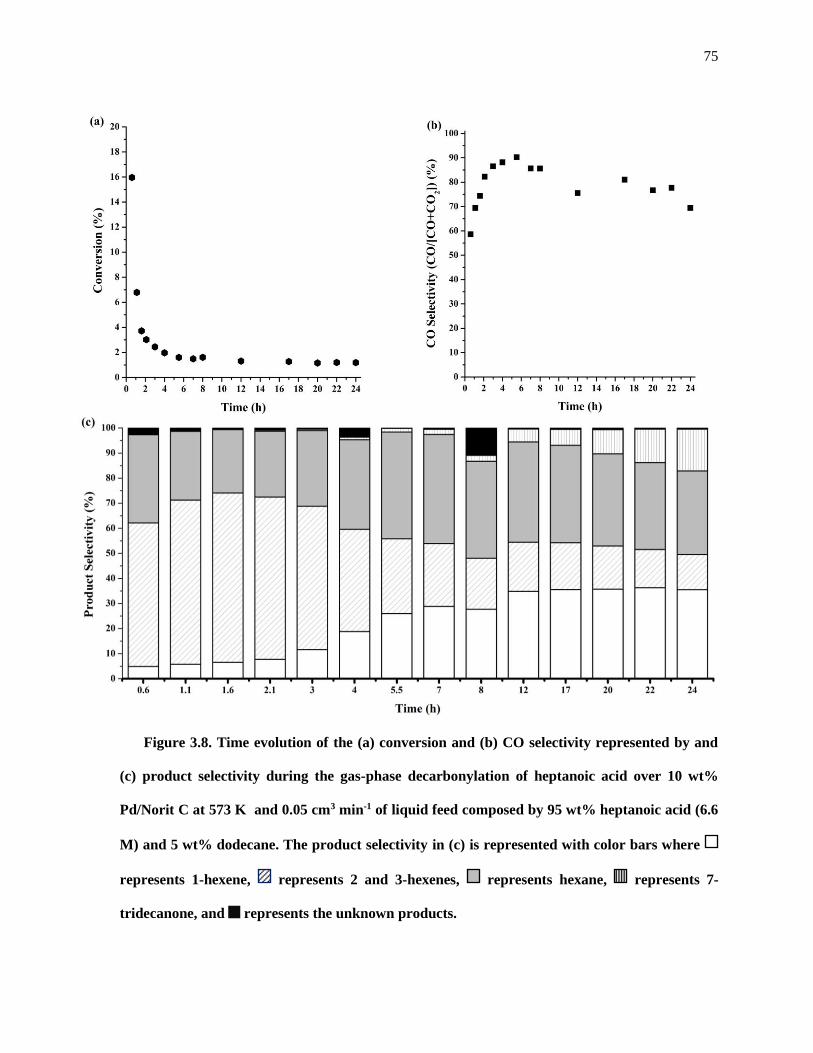
75
Figure 3.8. Time evolution of the (a) conversion and (b) CO selectivity represented by and
(c) product selectivity during the gas-phase decarbonylation of heptanoic acid over 10 wt%
Pd/Norit C at 573 K and 0.05 cm3 min-1 of liquid feed composed by 95 wt% heptanoic acid (6.6
M) and 5 wt% dodecane. The product selectivity in (c) is represented with color bars where
represents 1-hexene, represents 2 and 3-hexenes, represents hexane, represents 7-
tridecanone, and represents the unknown products.
76
As the catalyst deactivated, the CO selectivity increased to a maximum of 90% before decreasing
to 70% by the end of the experiment (Figure 3.8b). Similarly, the hexenes selectivity increased to
70% before decreasing to 50%. The decrease of CO selectivity at long times was most likely the
result of the ketonization reaction, which was observed after 4 h of reaction. Ketonization of
heptanoic acid produces CO2 and 7-tridecanone (Scheme 3.2). The hexane produced during the
reaction could not be produced entirely by direct decarboxylation because of the lack of CO2
produced relative to CO as provided in Figures 3.8b and 3.8c. Evidently, some hydrogenation of
hexenes to hexane occurred. Regarding the olefin selectivity, up to 35% terminal olefin was observed
after long times on stream (Figure 3.8c), which is consistent with decarbonylation followed by some
double bond isomerization.
Extrapolation of the conversion to t = 0 h allows for an estimation of the initial rate unaffected by
deactivation. Using this method, we obtained a gas-phase TOF = 0.035 s-1, which was ≈ 50 times
faster than that of the liquid-phase TOF and similar to the values reported by others. As speculated in
the previous section and suggested by the postmortem catalyst characterization with H2
chemisorption, the liquid-phase TOF reported here was very likely affected by severe catalyst
deactivation, which explains the order of magnitude difference between the liquid-phase TOF
reported here and the literature [9,10,14–16,19–22].
Lugo-José et al. reported a TOF of 0.00017 s-1 for the gas-phase decarbonylation of propanoic
acid over Pd/C at 473 K and an activation barrier of ≈ 72 kJ mol-1 [6]. The Arrhenius equation was
used to extrapolate their rate to 573 K and revealed a TOF of ≈ 0.0042 s-1. While this extrapolated
value is an order of magnitude lower than the initial gas-phase Pd TOF reported here, it is similar to
our final gas-phase Pd TOF of 0.0011 s-1. This may suggest that the catalysts of Lugo-José et al. [6]
suffered from some deactivation even though H2 (20 vol%) was fed during that study.
Figures 3.9 and 3.10 compare the X-ray diffraction patterns and electron micrographs,
respectively, of the spent catalysts from the gas-phase reaction. Even though the catalyst deactivated
severely during the first 2 h of reaction, XRD and TEM revealed that the Pd nanoparticles remained

77
well dispersed after the gas-phase reaction. Evidently, sintering of Pd on the carbon support occurs
only when operating in the liquid-phase acid. Severe deactivation occurred during gas-phase
operation, not because of sintering, but presumably because of strongly held side products or
carbonaceous species on the metal surface.
Figure 3.9. Comparison of the XRD patterns of 10 wt% Pd/Norit C run at 573 K after
different reaction conditions. The patterns were offset for clarity.
78
Figure 3.10. Bright field HRTEM images of 10 wt% Pd/Norit C fresh (left), spent during
liquid-phase operation, and spent during the gas-phase operation at 573 K.
Since gas-phase operation apparently prevented severe Pd particle growth, we decided to
investigate the stability of Pd particles in various concentrations of liquid heptanoic acid. Figures 3.11
and 3.12 present results from exposing 20 wt% Pd/Norit C to progressively lower liquid
concentrations of reacting acid at 573 K. After 20 h of reaction, the catalyst in dilute acid (.019 M)
appeared to be more dispersed than that in concentrated acid (1.1-6.6 M), confirming the hypothesis
that concentrated liquid acid is detrimental to Pd particles dispersion on carbon. Interestingly, the
liquid-phase steady state TOF at 573 K (≈ 0.0007 s-1) was independent of acid concentration from 0.1
to 6.6 M. The effect of acid concentration on the product selectivity can be found in Appendix C.
Fresh Liquid-Phase Spent Gas-Phase Spent

79
Figure 3.11. Comparison of the XRD patterns of 20 wt% Pd/Norit C after the liquid-phase
operation at 573 K and different acid concentrations. The patterns were offset for clarity.
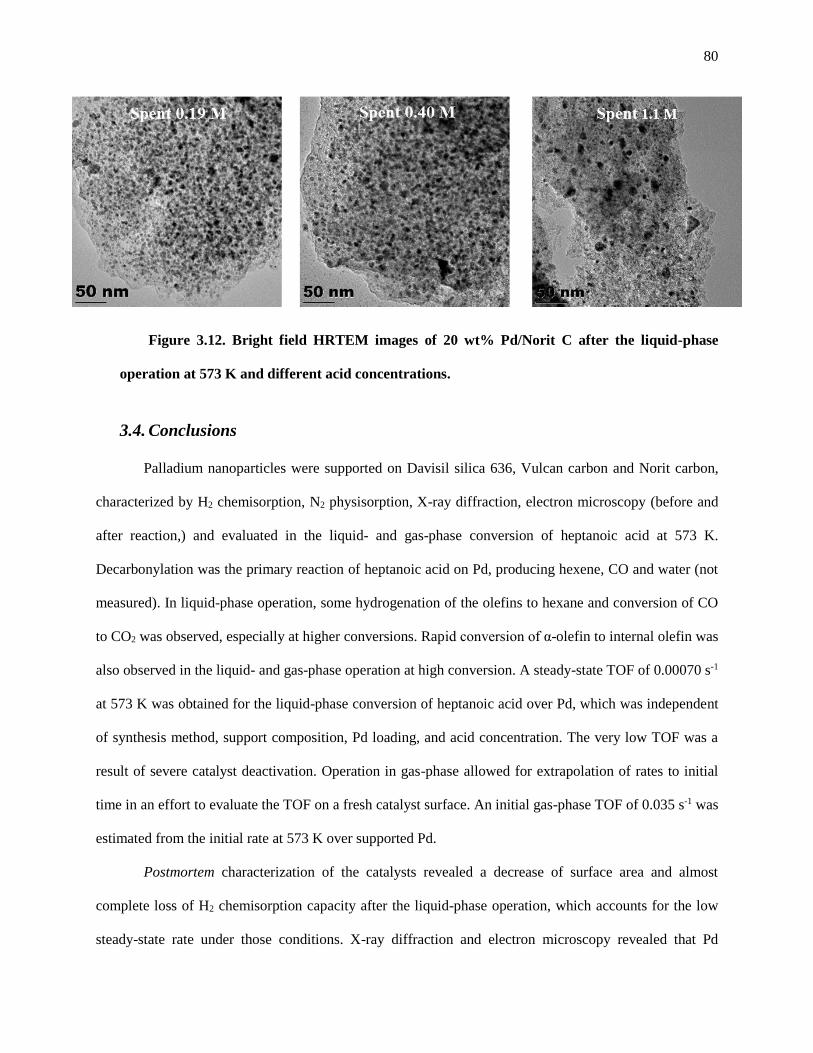
80
Figure 3.12. Bright field HRTEM images of 20 wt% Pd/Norit C after the liquid-phase
operation at 573 K and different acid concentrations.
3.4. Conclusions
Palladium nanoparticles were supported on Davisil silica 636, Vulcan carbon and Norit carbon,
characterized by H2 chemisorption, N2 physisorption, X-ray diffraction, electron microscopy (before and
after reaction,) and evaluated in the liquid- and gas-phase conversion of heptanoic acid at 573 K.
Decarbonylation was the primary reaction of heptanoic acid on Pd, producing hexene, CO and water (not
measured). In liquid-phase operation, some hydrogenation of the olefins to hexane and conversion of CO
to CO2 was observed, especially at higher conversions. Rapid conversion of α-olefin to internal olefin was
also observed in the liquid- and gas-phase operation at high conversion. A steady-state TOF of 0.00070 s-1
at 573 K was obtained for the liquid-phase conversion of heptanoic acid over Pd, which was independent
of synthesis method, support composition, Pd loading, and acid concentration. The very low TOF was a
result of severe catalyst deactivation. Operation in gas-phase allowed for extrapolation of rates to initial
time in an effort to evaluate the TOF on a fresh catalyst surface. An initial gas-phase TOF of 0.035 s-1 was
estimated from the initial rate at 573 K over supported Pd.
Postmortem characterization of the catalysts revealed a decrease of surface area and almost
complete loss of H2 chemisorption capacity after the liquid-phase operation, which accounts for the low
steady-state rate under those conditions. X-ray diffraction and electron microscopy revealed that Pd
81
nanoparticles supported on carbon sintered substantially during the liquid-phase operation in nearly pure
acid. In contrast, carbon-supported Pd nanoparticles were quite stable during gas-phase reaction.
Likewise, the sintering of carbon-supported Pd nanoparticles in the liquid-phase was less significant at
low acid concentrations. Silica-supported Pd nanoparticles maintained a high dispersion during the liquid-
phase operation at high acid concentrations.
3.5. Acknowledgement
This material is based upon work supported by the National Science Foundation (NSF) under Award
No. EEC-0813570. Any opinions, findings, and conclusions or recommendations expressed in this
material are those of the author(s) and do not necessarily reflect the views of the NSF. We acknowledge
discussions with Professor Matthew Neurock at the University of Virginia. We also gratefully
acknowledge Mr. Matthew Schneider at the University of Virginia for his help with the bright field TEM.
3.6. References
[1] Ragauskas, A. J., Williams, C. K., Davison, B. H., Britovsek, G., Cairney, J., Eckert, C. A.,
Frederick, W. J., Hallett, J. P., Leak, D. J., Liotta, C. L., Mielenz, J. R., Murphy, R., Templer, R.,
and Tschaplinski, T., 2006, “The path forward for biofuels and biomaterials.,” Science, 311(5760),
pp. 484–9.
[2] Renz, M., 2005, “Ketonization of Carboxylic Acids by Decarboxylation: Mechanism and Scope,”
Eur J Org Chem, 2005(6), pp. 979–988.
[3] Gaertner, C. A., Serrano-Ruiz, J. C., Braden, D. J., and Dumesic, J. A., 2009, “Catalytic coupling
of carboxylic acids by ketonization as a processing step in biomass conversion,” J Catal, 266(1),
pp. 71–78.

82
[4] Lopez-Ruiz, J. A., and Davis, R. J., 2014, “Decarbonylation of heptanoic acid over carbon-
supported platinum nanoparticles,” Green Chem, 16(2), pp. 683–694.
[5] Boda, L., Onyestyák, G., Solt, H., Lónyi, F., Valyon, J., and Thernesz, A., 2010, “Catalytic
hydroconversion of tricaprylin and caprylic acid as model reaction for biofuel production from
triglycerides,” Appl Catal A-Gen, 374(1-2), pp. 158–169.
[6] Lugo-José, Y. K., Monnier, J. R., and Williams, C. T., 2014, “Gas-Phase, Catalytic
Hydrodeoxygenation of Propanoic Acid, Over Supported Group VIII Noble Metals: Metal and
Support Effects,” Appl Catal A-Gen, 469, pp. 410–418.
[7] Lugo-José, Y. K., Monnier, J. R., Heyden, A., and Williams, C. T., 2014, “Hydrodeoxygenation of
propanoic acid over silica-supported palladium: effect of metal particle size,” Catal Sci Technol.
[8] Lestari, S., Maki-Arvela, P., Bernas, H., Simakova, O., Sjoholm, R., Beltramini, J., Lu, G. Q. M.,
Myllyoja, J., Simakova, I., and Murzin, D. Y., 2009, “Catalytic Deoxygenation of Stearic Acid in
a Continuous Reactor over a Mesoporous Carbon-Supported Pd Catalyst,” Energ Fuel, 23(8), pp.
3842–3845.
[9] Lestari, S., Simakova, I., Tokarev, A., Mäki-Arvela, P., Eränen, K., and Murzin, D. Y., 2008,
“Synthesis of Biodiesel via Deoxygenation of Stearic Acid over Supported Pd / C Catalyst,” Catal
Lett, 122(3-4), pp. 247–251.
[10] Maki-Arvela, P., Snåre, M., Eranen, K., Myllyoja, J., and Murzin, D. Y., 2008, “Continuous
decarboxylation of lauric acid over Pd/C catalyst,” Fuel, 87(17-18), pp. 3543–3549.
[11] Rozmysłowicz, B., Maki-Arvela, P., Lestari, S., Simakova, O. A., Eränen, K., Simakova, I. L.,
Murzin, D. Y., and Salmi, T. O., 2010, “Catalytic Deoxygenation of Tall Oil Fatty Acids Over a
83
Palladium-Mesoporous Carbon Catalyst : A New Source of Biofuels,” Top Catal, 53(15-18), pp.
1274–1277.
[12] Snåre, M., Kubicková, I., Maki-Arvela, P., Eranen, K., Warnå, J., and Murzin, D. Y., 2007,
“Production of diesel fuel from renewable feeds : Kinetics of ethyl stearate decarboxylation,”
Chem Eng J, 134, pp. 29–34.
[13] Snåre, M., Kubicková, I., Maki-Arvela, P., Eranen, K., and Murzin, D. Y., 2006, “Heterogeneous
Catalytic Deoxygenation of Stearic Acid for Production of Biodiesel,” Ind Eng Chem Res, 45(45),
pp. 5708–5715.
[14] Simakova, I., Rozmysłowicz, B., Simakova, O. A., Maki-Arvela, P., Simakov, A., and Murzin, D.
Y., 2011, “Catalytic Deoxygenation of C18 Fatty Acids Over Mesoporous Pd / C Catalyst for
Synthesis of Biofuels,” Top Catal, 54(8-9), pp. 460–466.
[15] Kubicková, I., Snåre, M., Eranen, K., Maki-Arvela, P., and Murzin, D., 2005, “Hydrocarbons for
diesel fuel via decarboxylation of vegetable oils,” Catal Today, 106(1-4), pp. 197–200.
[16] Maki-Arvela, P., Kubicková, I., Snåre, M., Eranen, K., and Murzin, D. Y., 2007, “Catalytic
Deoxygenation of Fatty Acids and Their Derivatives,” Energ Fuel, 21(1), pp. 30–41.
[17] Snåre, M., Kubicková, I., Maki-Arvela, P., Chichova, D., Eranen, K., and Murzin, D. Y., 2008,
“Catalytic deoxygenation of unsaturated renewable feedstocks for production of diesel fuel
hydrocarbons,” Fuel, 87(6), pp. 933–945.
[18] Lestari, S., Mäki-Arvela, P., Simakova, I., Beltramini, J., Lu, G. Q. M., and Murzin, D. Y., 2009,
“Catalytic Deoxygenation of Stearic Acid and Palmitic Acid in Semibatch Mode,” Catal Lett,
130(1-2), pp. 48–51.

84
[19] Simakova, I., Simakova, O., Mäki-Arvela, P., Simakov, A., Estrada, M., and Murzin, D. Y., 2009,
“Deoxygenation of palmitic and stearic acid over supported Pd catalysts : Effect of metal
dispersion,” Appl Catal A-Gen, 355, pp. 100–108.
[20] Immer, J. G., and Lamb, H. H., 2010, “Fed-Batch Catalytic Deoxygenation of Free Fatty Acids,”
Energ Fuel, 130(10), pp. 5291–5299.
[21] Immer, J. G., Kelly, M. J., and Lamb, H. H., 2010, “Catalytic reaction pathways in liquid-phase
deoxygenation of C18 free fatty acids,” Appl Catal A-Gen, 375(1), pp. 134–139.
[22] Ford, J. P., Immer, J. G., and Lamb, H. H., 2012, “Palladium Catalysts for Fatty Acid
Deoxygenation: Influence of the Support and Fatty Acid Chain Length on Decarboxylation
Kinetics,” Top Catal, 55(3-4), pp. 175–184.
[23] Maier, W. F., Roth, W., Thies, I., v. Rague Schleyer, P., Ragukschleyer, P., and Schleyer, R.,
1982, “Gas Phase Decarboxylation of Carboxylic Acids,” Chem Ber, 115, pp. 808–812.
[24] Lamb, H. H., Sremaniak, L., and Whitten, J. L., 2012, “Reaction pathways for butanoic acid
decarboxylation on the (111) surface of a Pd nanoparticle,” Surf Sci, 607(111), pp. 130–137.
[25] Lu, J., Behtash, S., and Heyden, A., 2012, “Theoretical Investigation of the Reaction Mechanism
of the Decarboxylation and Decarbonylation of Propanoic Acid on Pd ( 111 ) Model Surfaces,” J
Phys Chem C, 116(116), pp. 14328–14341.
[26] Lu, J., Behtash, S., Faheem, M., and Heyden, A., 2013, “Microkinetic modeling of the
decarboxylation and decarbonylation of propanoic acid over Pd(111) model surfaces based on
parameters obtained from first principles,” J Catal, 305, pp. 56–66.

85
[27] Benavidez, A. D., Burton, P. D., Nogales, J. L., Jenkins, A. R., Ivanov, S. A., Miller, J. T., Karim,
A. M., and Datye, A. K., 2014, “Improved selectivity of carbon-supported palladium catalysts for
the hydrogenation of acetylene in excess ethylene,” Appl Catal A-Gen, 482, pp. 108–115.
[28] Pham, H. N., Pagan-Torres, Y. J., Serrano-Ruiz, J. C., Wang, D., Dumesic, J. A., and Datye, A.
K., 2011, “Improved hydrothermal stability of niobia-supported Pd catalysts,” Appl Catal A-Gen,
397(1-2), pp. 153–162.
[29] Pham, H. N., Anderson, A. E., Johnson, R. L., Schmidt-Rohr, K., and Datye, A. K., 2012,
“Improved hydrothermal stability of mesoporous oxides for reactions in the aqueous phase.,”
Angew Chem Int Ed Engl, 51(52), pp. 13163–7.
[30] Ping, E. W., Pierson, J., Wallace, R., Miller, J. T., Fuller, T. F., and Jones, C. W., 2011, “On the
nature of the deactivation of supported palladium nanoparticle catalysts in the decarboxylation of
fatty acids,” Appl Catal A-Gen, 396(1-2), pp. 85–90.
[31] Ping, E. W., Wallace, R., Pierson, J., Fuller, T. F., and Jones, C. W., 2010, “Highly dispersed
palladium nanoparticles on ultra-porous silica mesocellular foam for the catalytic decarboxylation
of stearic acid,” Micropor Mesopor Mat, 132(1-2), pp. 174–180.
[32] Grenoble, D. C., and Estadt, M. M., 1981, “The chemistry and catalysis of the water gas shift
reaction: 1. The kinetics over supported metal catalysts,” J Catal, 67(1), pp. 90–102.
86
Chapter 4. Mechanistic Insights on the Decarbonylation and
Decarboxylation of Propanoic Acid over Palladium Catalysts
Abstract
The decarbonylation and decarboxylation of gaseous propanoic acid over Pd nanoparticles supported
on silica and carbon were studied in a continuous flow fixed bed reactor operated at 1 bar and
temperatures ranging from 533 to 573 K. Silica-supported Pt, and Rh nanoparticles were also studied for
comparison. The initial turnover frequency at 573 K was 0.043, 0.027, and 0.007 s-1 for silica-supported
Pd, Pt, and Rh nanoparticles, respectively, confirming the highest specific activity of Pd catalyst. The
observed apparent activation energy of propanoic acid conversation over Pd was approximately 130 kJ
mol-1 and was independent of support. At partial pressures of propanoic acid ranging from 0.1 to 1 bar,
the order of the reaction in acid was zero and the primary reaction was decarbonylation. At acid pressures
lower than 0.1 bar, the reaction order with respect to acid was negative and the primary reaction was
decarboxylation. Conversion of propanoic anhydride at low partial pressure proceeded by
decarbonylation, which suggests that propanoic anhydride may be a surface intermediate in the high
pressure decarbonylation of propanoic acid. All the metal catalysts deactivated very rapidly during the
first 3 h of reaction, which was accompanied by a change in product selectivity. Although X-ray
diffraction and electron microscopy revealed that the size of the metal nanoparticles was relatively
unchanged by the reaction conditions, results from N2 and H2 adsorption were consistent with deposition
of carbonaceous species on the metal surface and in the catalysts pores being responsible for deactivation.
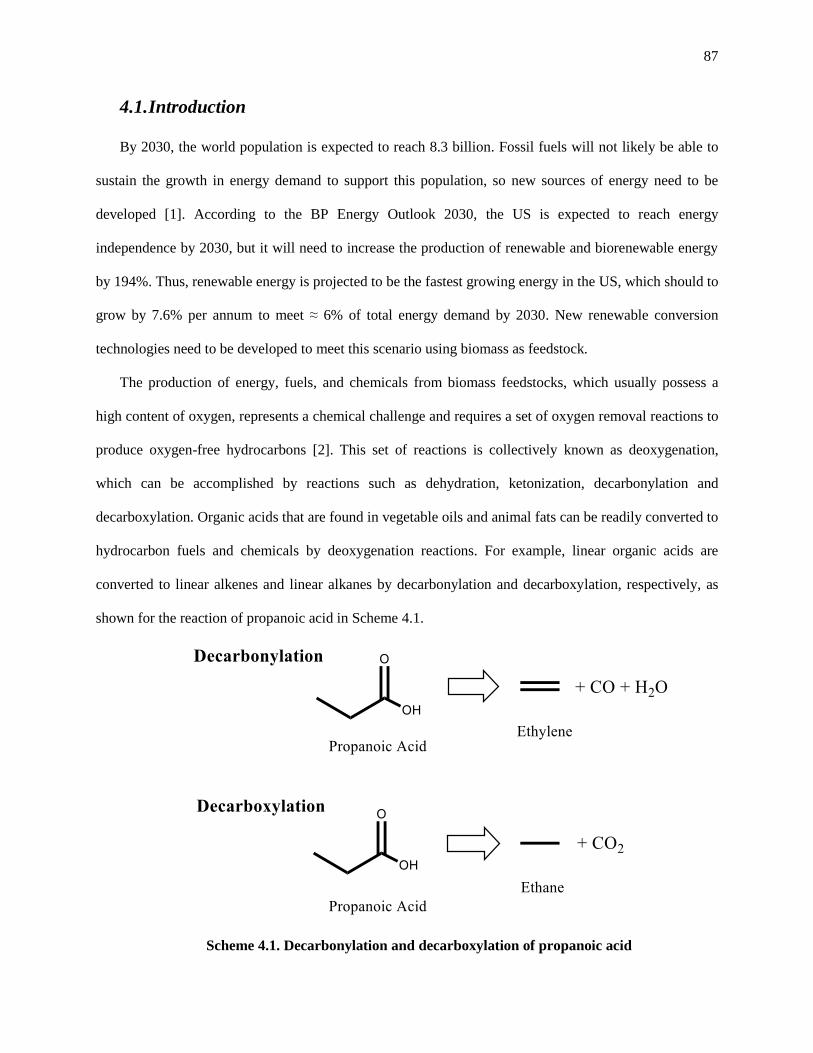
87
4.1. Introduction
By 2030, the world population is expected to reach 8.3 billion. Fossil fuels will not likely be able to
sustain the growth in energy demand to support this population, so new sources of energy need to be
developed [1]. According to the BP Energy Outlook 2030, the US is expected to reach energy
independence by 2030, but it will need to increase the production of renewable and biorenewable energy
by 194%. Thus, renewable energy is projected to be the fastest growing energy in the US, which should to
grow by 7.6% per annum to meet ≈ 6% of total energy demand by 2030. New renewable conversion
technologies need to be developed to meet this scenario using biomass as feedstock.
The production of energy, fuels, and chemicals from biomass feedstocks, which usually possess a
high content of oxygen, represents a chemical challenge and requires a set of oxygen removal reactions to
produce oxygen-free hydrocarbons [2]. This set of reactions is collectively known as deoxygenation,
which can be accomplished by reactions such as dehydration, ketonization, decarbonylation and
decarboxylation. Organic acids that are found in vegetable oils and animal fats can be readily converted to
hydrocarbon fuels and chemicals by deoxygenation reactions. For example, linear organic acids are
converted to linear alkenes and linear alkanes by decarbonylation and decarboxylation, respectively, as
shown for the reaction of propanoic acid in Scheme 4.1.
Scheme 4.1. Decarbonylation and decarboxylation of propanoic acid
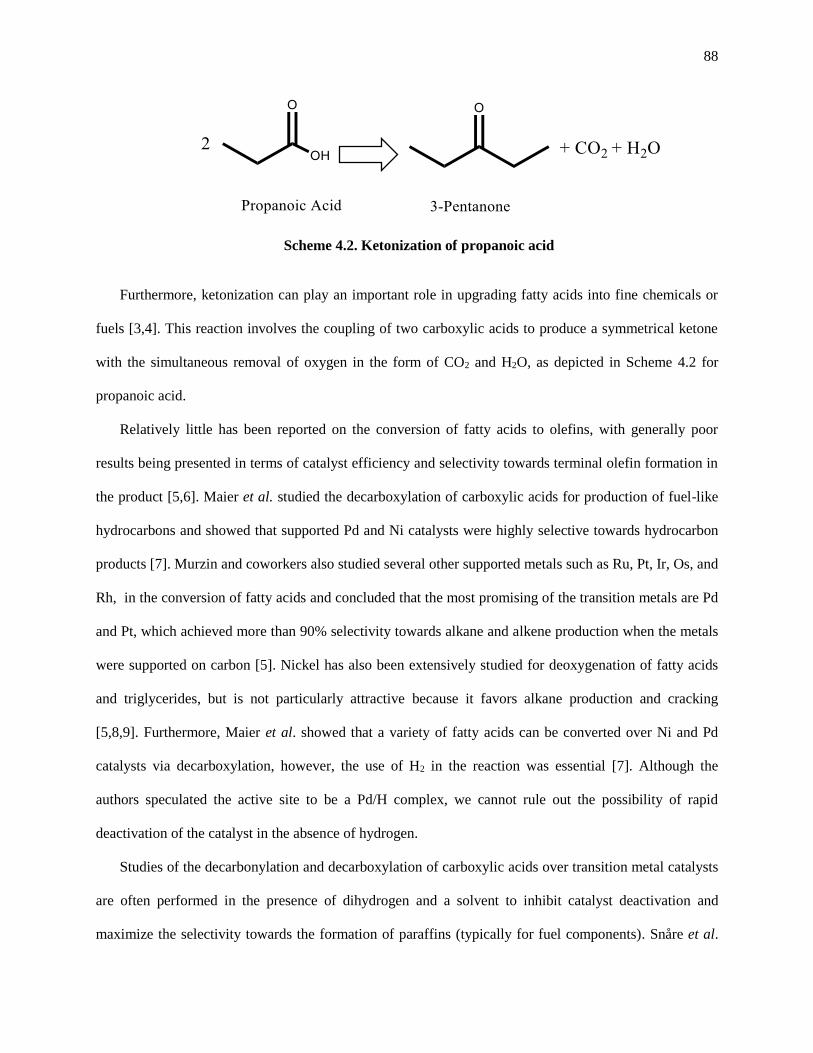
88
Scheme 4.2. Ketonization of propanoic acid
Furthermore, ketonization can play an important role in upgrading fatty acids into fine chemicals or
fuels [3,4]. This reaction involves the coupling of two carboxylic acids to produce a symmetrical ketone
with the simultaneous removal of oxygen in the form of CO2 and H2O, as depicted in Scheme 4.2 for
propanoic acid.
Relatively little has been reported on the conversion of fatty acids to olefins, with generally poor
results being presented in terms of catalyst efficiency and selectivity towards terminal olefin formation in
the product [5,6]. Maier et al. studied the decarboxylation of carboxylic acids for production of fuel-like
hydrocarbons and showed that supported Pd and Ni catalysts were highly selective towards hydrocarbon
products [7]. Murzin and coworkers also studied several other supported metals such as Ru, Pt, Ir, Os, and
Rh, in the conversion of fatty acids and concluded that the most promising of the transition metals are Pd
and Pt, which achieved more than 90% selectivity towards alkane and alkene production when the metals
were supported on carbon [5]. Nickel has also been extensively studied for deoxygenation of fatty acids
and triglycerides, but is not particularly attractive because it favors alkane production and cracking
[5,8,9]. Furthermore, Maier et al. showed that a variety of fatty acids can be converted over Ni and Pd
catalysts via decarboxylation, however, the use of H2 in the reaction was essential [7]. Although the
authors speculated the active site to be a Pd/H complex, we cannot rule out the possibility of rapid
deactivation of the catalyst in the absence of hydrogen.
Studies of the decarbonylation and decarboxylation of carboxylic acids over transition metal catalysts
are often performed in the presence of dihydrogen and a solvent to inhibit catalyst deactivation and
maximize the selectivity towards the formation of paraffins (typically for fuel components). Snåre et al.
89
showed catalyst deactivation was more severe under low H2 conditions, which favored coke formation
[10]. Also, Snåre et al. [10], Mäki-Arvela et al. [11] and Bartosz et al. [12] showed that when
deoxygenation reactions were run under solvent free or concentrated acid conditions, the catalyst
deactivation was more severe. Furthermore, the concentration of the organic acid has been reported to
influence the deoxygenation rate and the reaction mechanism. For example, Bartosz et al. showed that the
reaction rate increased when the concentration of acid decreased from 0.6 to 0.15 mol L-1 [12]. In
addition, Immer et al. showed that as the concentration of acid decreased, the decarboxylation rate
decayed rapidly whereas the decarbonylation rate increased [13]. In contrast, Mäki-Arvela et al. showed
that when the concentration of the fatty acid decreased from 0.44 to 0.22 mol L-1 the steady state reaction
rates and product selectivities did not change [11].
Because the presence of H2 and solvent favor the production of CO2 and alkanes [5,10–23],
researchers often conclude decarboxylation is the primary reaction in these systems. Recent studies that
test catalysts in the absence of dihydrogen and/or solvent revealed that the primary reaction path is
decarbonylation producing olefins and CO [24–27]. For example, Lopez-Ruiz and Davis showed that
during the dihydrogen-free liquid-phase decarbonylation of heptanoic acid over Pt/Norit carbon, the
formation of decarboxylation products (alkane and CO2) was caused by the sequential conversion of CO
to CO2 and hydrogenation of olefins, presumably via water–gas shift and alkene hydrogenation,
respectively, when the reaction was run at high conversions [25]. At low conversions, decarbonylation
was the main reaction path in both liquid- and gas-phase operation. To explore the importance of catalyst
composition and reaction conditions on the conversion of carboxylic acids, we studied systematically the
decarbonylation and decarboxylation of propanoic acid over a variety of silica-supported Pd, Pt, and Rh
and carbon-supported Pd catalysts in a continuous flow fixed bed reactor. In particular, the influences of
metal type, support composition, temperature, and acid concentration on the rate and selectivity were
explored. Density functional theoretical calculations were used to elucidate the most energetically
favorable reaction path and metal site requirements for decarbonylation and decarboxylation reactions.
90
4.2. Experimental Methods
4.2.1. Catalyst synthesis
The catalysts were prepared by an incipient wetness impregnation method using aqueous
solutions of tetraamminepalladium (II) nitrate, (NH3)4Pd(NO3)2 (Sigma Aldrich) to obtain 5 and 20
wt% Pd loadings on Davisil SiO2 636 and Norit activated carbon (ROX 0.9), respectively.
Tetraammineplatinum (II) nitrate, (NH3)4Pt(NO3)2 (Sigma Aldrich) and rhodium (III) nitrate,
Rh(NO3)3 (Sigma Aldrich) were used to obtain a 10 wt% Pt and a 5 wt% Rh on Davisil SiO2 636.
Prior to impregnation, Norit carbon particles were crushed and sieved between 180 μm and 425 μm,
whereas Davisil SiO2 was used as received. After impregnation of the desired metal precursor
solution, the catalyst was dried in air at 393 K overnight. The dried SiO2 solids were then calcined for
3 h at 623 K in air (GTS-Welco MED) flowing at 100 cm3 min-1 followed by reduction for 3 h at 623
K in H2 (GTS-Welco 99.999%) flowing at 100 cm3 min-1. The dried, metal impregnated, carbon solids
were directly reduced in H2 (GTS-Welco 99.999%) flowing at 100 cm3 min-1 without previous
calcination. The temperature ramp for the calcination and reduction step was 1 K min-1. After
reduction, the catalysts were cooled, exposed to air, and stored in a vial.
4.2.2. Dihydrogen chemisorption
The metal dispersion was measured by H2 chemisorption performed on a Micromeritics ASAP
2020 adsorption system. The catalyst was evacuated at 573 K for 10 h followed by a reduction with
flowing H2 (GTS-Welco 99.999%) at 573 K for 3 h. Then, the catalyst sample was evacuated at 573
K and cooled in vacuum to 308 K for the Pt and Rh catalysts, and to 373 K for the Pd catalysts (to
prevent β-phase hydride formation). The amount of metal on the surface was evaluated by the total
amount of H2 adsorbed extrapolated to zero pressure, assuming a stoichiometric relationship between
H2 to surface metal of 1:2 (i.e. H/Pt = 1) for the case of Pt and Pd. Hip et al. reported that Rh

91
nanoparticles can exhibit high values of H/Rh that range from 1.2 to 2 [28]. Therefore, we assumed a
stoichiometric relationship of H/Rh equal to 1.6.
4.2.3. Dinitrogen physisorption
The specific surface area was measured by N2 physisorption using a Micromeritics ASAP 2020.
The samples were first evacuated for 180 min at 373 K, after which N2 adsorption isotherms were
measured at 77 K. The Brunauer-Emmett-Teller (BET) method was used to determine the specific
surface area.
4.2.4. X-ray diffraction
Powder X-ray diffraction (XRD) analysis from 2Ө = 20 to 100° was carried out on a X’Pert Pro
with monochromatic Cu Kα-radiation (λ=1.54056 Å) using a step size of 1/4° and a time step of 1 s.
4.2.5. Electron microscopy
Transmission electron microscopy (TEM) was performed on a FEI Titan operated at 300 keV in
EFTEM mode. Energy dispersive X-ray spectroscopy (EDS) was used to obtain elemental analysis of
the nanoparticles. Catalyst samples were deposited on SPI lacey-carbon coated Cu grids after being
dispersed in ethanol [29].
4.2.6. Catalytic conversion of propanoic acid
As shown in our previous work [25], steady state decarbonylation of pure carboxylic acids in the
liquid-phase was characterized by low rates and double-bond isomerization of the product α-olefin.
Although the gas-phase reaction was more selective towards the formation of α-olefin, the catalyst
deactivated rapidly. To study the reaction path and compare results to those derived from theoretical
methods, we chose to evaluate the gas-phase conversion of propanoic acid as a probe reaction for
decarbonylation and decarboxylation. The major products CO, CO2, ethane, ethylene, and 3-pentano-

92
Cold Air,in
Hot Air,out
Gas-phase products:
• N2 (carrier gas)
• CO
• CO2
• CH4 (internal standard)
• CH2=CH2
• CH3-CH3
Liquid-phase products:
• Propanoic acid
• Hexane (solvent)
• Octane (internal standard)
• 3-Pentanone
• Others
GC2
Pack Bed Reactor
PC
TC
Condenser/ Phase separator
Pressure
Relief
Propanoic Acid (0.05 – 0.5 cm3 min-1)
Pre-Heating Chamber
GC1
PG
N2
Glass Beads
CH4
PG
CO2
H2
Figure 4.1. Schematic of the reactor system. TC refers to temperature controller, PG refers
to pressure gauge, PC refers to the back pressure regulator.
-ne were monitored by gas chromatography. Octane (5 wt%) was used as an internal standard for
analysis of the liquid-phase products.
The catalytic decarboxylation/decarbonylation of propanoic acid (Sigma Aldrich ≥99.50%) was
performed in a 1/4" OD x 8” length x 0.035” wall thickness titanium tubing fixed bed tubular reactor.
The reactor was composed of a 2 µm pore size frit that immobilized 50 to 500 mg of catalyst pellets
and 500 mg of glass beads (Sigma Aldrich 16-25 U.S. sieve) supported on a glass wool plug. Because
the catalyst deactivated significantly during a run, fresh catalyst was used for each experiment. After
loading the reactor, the system was purged for 60 min with 200 cm3 min-1 of N2 (GTS-Welco
93
99.999%) at atmospheric pressure to remove any dioxygen from the system and the pressure was
increased to 20 bar to perform a leak test. Then, the temperature was increased to the desired
reduction temperature, 573 K, under 100 cm3 min-1 of H2 (GTS-Welco 99.999%) at 1 K min-1 and
held isothermally for 3 h at atmospheric pressure. The reactor was finally cooled to the desired
reaction temperature, 533 - 573 K, and purged with 200 cm3 min-1 of N2 (GTS-Welco 99.999%) at
atmospheric pressure. For the pure acid experiments, the feed mixture was composed of 95 wt%
propanoic acid (Sigma Aldrich ≥99.50%) and 5 wt% octane (Sigma Aldrich anhydrous 99.00%).
Hexane (Sigma Aldrich anhydrous 99.90%) was used as a diluent to prepare feeds with different
propanoic acid concentrations (66, 35, 20, 10, 7.5, 5, and 2.5 mol%). Feed mixtures containing
hexane, propanoic anhydride, and/or 3-pentanone were dried over molecular sieves 3Å (Sigma
Aldrich) for 24 h prior to loading into the feed pump. The feed was then pumped to the reaction
system using a syringe pump (ISCO 500D) operating at specified liquid flow rates (0.05 to 0.50 cm3
min-1). The acid feed mixtures passed through a heated zone before entering the catalytic reactor.
Figure 4.1 shows a schematic of the reactor system.
The outlet of the reactor was connected to an air cooled condenser maintained at room
temperature to remove the condensable products, such as 3-pentanone, hexane, octane, and unreacted
reagent, from the product stream. Samples of the liquid- and gas-phase products were collected
approximately every 30 min. The liquid-phase sample was analyzed by a gas chromatograph (GC
7890 A) equipped with a ZB-FFAP column (length 45 m x 0.538 mm) and a flame ionization detector
(FID). The product gas was continuously removed from the condenser using 10 cm3 min-1 N2 (GTS-
Welco 99.999%) as a purge gas and 1 cm3 min-1 CH4 (GTS-Welco 99.999%) as internal standard. The
outlet gas of the condenser was analyzed an on-line gas chromatograph (HP 5890 Series II) equipped
with a packed column, ShinCarbon ST 80/100, and a thermal conductivity detector (TCD) for
detection of N2, CO, CO2, CH4, ethane, ethylene, and any other light hydrocarbons (if any).
A series of control experiments was performed to determine the background conversion of the
system at our typical reaction conditions (573 K, 1 bar, and 0.05 cm3 min-1 of liquid feed composed of
94
95 wt% propanoic acid and 5 wt% octane). In the absence of catalyst, no conversion of propanoic
acid was observed. However, when Norit carbon support was used, a background conversion of ≈
0.4% was found. We did not account for this small background conversion in our calculations of
turnover frequency because it decreased over time and a high metal loading of Pd was used with the
Norit carbon sample. No conversion of propanoic acid was observed over Davisil SiO2 at standard
conditions. Palladium nanoparticles supported on Norit carbon (20 wt%) and Davisil SiO2 (5 wt%)
were tested at our typical reaction conditions for the reverse water-gas shift by co-feeding the
reagents at a molar ratio of 1:1 (i.e. 1 mol of CO2 per 1 mol of H2). In addition, ethane
dehydrogenation (pure ethane or 1:1 ratio of ethane to CO2) was tested over Pd at our standard
conditions. None of these reactions occurred at our reaction conditions, indicating that the observed
ethylene and CO detected during reaction formed by the direct decarbonylation of propanoic acid.
4.2.7. Post-mortem catalyst characterization
The spent catalysts were recovered from the reactor, washed with 25 mL of methanol and
sonicated in a methanol solution for 30 min to remove reactant and products from the surface of the
catalyst. After sonication, the solids were recovered by filtration and dried overnight in air at 400 K.
The spent samples were characterized by H2 chemisorption, N2 physisorption, XRD, and TEM.
4.2.8. Calculation of rates
The turnover frequency (TOF) is defined as the number of revolutions of the catalytic cycle per
unit time [30]. In this work, the TOF was calculated as the rate of formation of the products referred
to the number of surface metal atoms evaluated on a freshly prepared catalyst. The main hydrocarbon
components in the gas-phase were ethane and ethylene, whereas 3-pentanone and propanoic acid
were the main components in the liquid-phase. Some minor amounts of heavier unknown products
were also detected in the liquid-phase products (which accounted for ≈ 0.4% of the total detected
liquid product), but were neglected in the analysis.

95
Because all the catalysts deactivated exponentially during the first 3 h of reaction, an initial TOF
was calculated by extrapolating the log of the reaction rate to t = 0 h. The initial TOF was therefore
calculated as [(rate of production (mol s-1) of ethane + ethylene + 2 x moles of 3-pentanone) / (mol of
surface metal on a fresh catalyst counted by H2 chemisorption)].
To probe the deactivation, final TOF was calculated using the rate of formation of the products
after 20 h of reaction and the number of surface metal atoms evaluated from H2 chemisorption on a
spent catalyst. The final TOF was therefore calculated as [(rate of production after 20 h of reaction
(mol s-1) of ethane + ethylene + 2 x moles of 3-pentanone) / (mol of surface metal on a spent catalyst
counted by H2 chemisorption)].
The deoxygenation conversion is defined here as the formation rates of the major products
divided by the feed rate of reagent. Thus, the deoxygenation conversion for propanoic acid was
calculated as [(rate of production (mol s-1) of ethane + ethylene + 2 x moles of 3-pentanone) / (moles
of propanoic acid fed (mol s-1))].
To appropriately compare the productivity of the catalysts, we reported the time evolution of the
site time yield (STY) [30] of individual products based on the number of surface sites counted by H2
chemisorption of the fresh catalyst.
Two different sets of product selectivities were calculated, the selectivity of carbon oxides for CO
and CO2, and the selectivity to deoxygenation products for mainly ethylene, ethane, and 3-pentanone.
The product selectivity was defined as the moles of a product formed divided by the total moles of all
identified products, i.e. selectivity of ethylene [(rate of ethylene) / (rate of ethylene + rate of ethane +
2 x moles of 3-pentanone + moles of unknowns)] and selectivity of CO [(rate of CO) / (rate of CO +
rate of CO2)].
96
4.3. Results and Discussion
4.3.1. Effect of metal
The decarbonylation and decarboxylation of propanoic acid over 5 wt% Rh, 10 wt% Pt, and 5 wt% Pd
supported on Davisil silica were performed at 573 K and 1 bar. Results from characterization of the
fresh catalyst and catalysts after reaction (spent) are summarized in Tables 4.1 and 4.2 along with the
calculated turnover frequencies of propanoic acid conversion. Figures 4.2 and 4.3 compare the X-ray
diffraction patterns and electron micrographs of the fresh and spent catalysts. Results from all the
characterization methods confirmed a high fraction of exposed metal (≥ 49%) on the fresh catalysts,
with negligible sintering of the metals during reaction. The lower hydrogen uptake on the spent
catalysts was likely the result of carbonaceous species deposited on the catalysts during the propanoic
acid reactions. Indeed, severe deactivation of the catalysts was observed over the first several hours of
reaction, as depicted in Figure 4.4 a.
The reactivity pattern of propanoic acid over Rh, Pt, and Pd, particles is summarized in Figure
4.4. Decarbonylation was the major reaction path observed initially since CO was the major carbon
oxide gas product (Figure 4.4b), as already reported in our previous study [25]. If decarbonylation
and decarboxylation were the only two reactions to occur, the CO selectivity (Figure 4.4b) would be
equal to the ethylene selectivity (Figures 4.4c-e) according to reaction stoichiometry (Scheme 4.1).
For the three catalyst tested, decarbonylation slowed dramatically as the catalyst deactivated whereas
low rates of ketonization, and perhaps, some decarboxylation were observed. The selectivity of
carbon oxides shifted from CO to CO2 after long time on stream mainly because of ketonization. As
shown in Figures 4.4c-e, the ethane produced could not be produced entirely by direct
decarboxylation. Evidently some hydrogenation of ethylene to ethane occurred, with the greatest
hydrogenation rate observed over Pd during the initial 2 h of reaction.
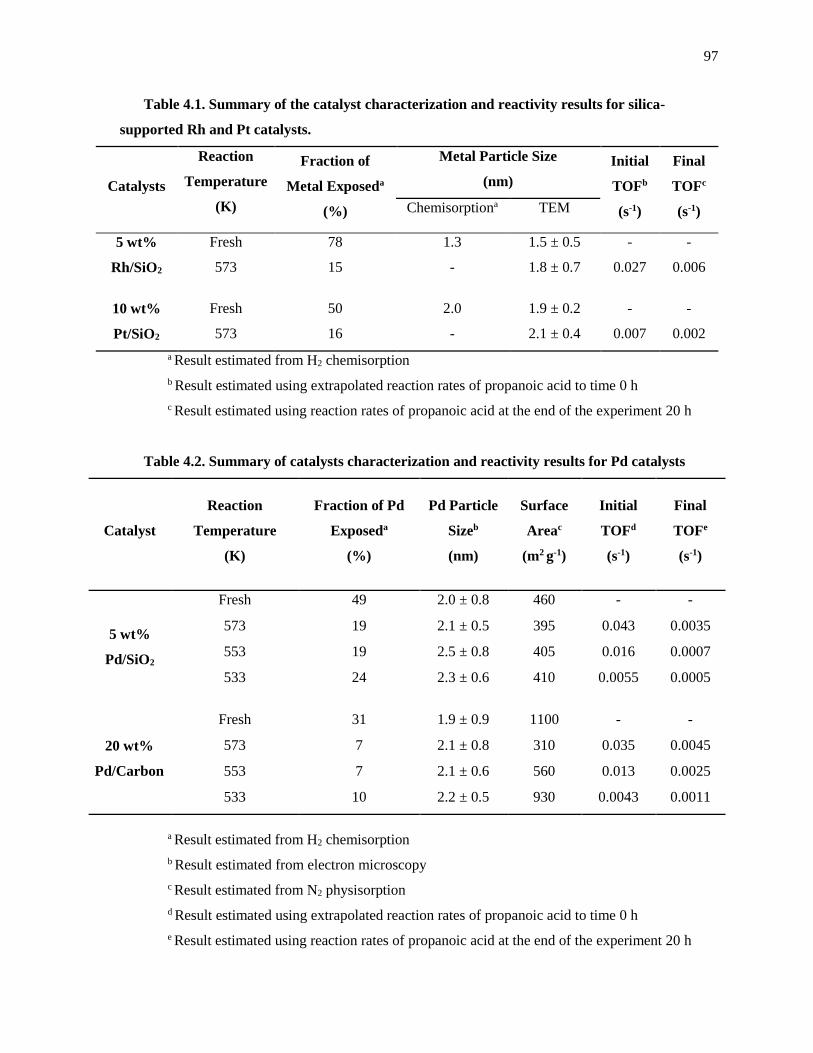
97
Table 4.1. Summary of the catalyst characterization and reactivity results for silica-
supported Rh and Pt catalysts.
Catalysts
Reaction
Temperature
(K)
Fraction of
Metal Exposeda
(%)
Metal Particle Size
(nm)
Initial
TOFb
(s-1)
Final
TOFc
(s-1) Chemisorptiona TEM
5 wt%
Rh/SiO2
Fresh 78 1.3 1.5 ± 0.5 - -
573 15 - 1.8 ± 0.7 0.027 0.006
10 wt%
Pt/SiO2
Fresh 50 2.0 1.9 ± 0.2 - -
573 16 - 2.1 ± 0.4 0.007 0.002
a Result estimated from H2 chemisorption
b Result estimated using extrapolated reaction rates of propanoic acid to time 0 h
c Result estimated using reaction rates of propanoic acid at the end of the experiment 20 h
Table 4.2. Summary of catalysts characterization and reactivity results for Pd catalysts
Catalyst
Reaction
Temperature
(K)
Fraction of Pd
Exposeda
(%)
Pd Particle
Sizeb
(nm)
Surface
Areac
(m2 g-1)
Initial
TOFd
(s-1)
Final
TOFe
(s-1)
5 wt%
Pd/SiO2
Fresh 49 2.0 ± 0.8 460 - -
573 19 2.1 ± 0.5 395 0.043 0.0035
553 19 2.5 ± 0.8 405 0.016 0.0007
533 24 2.3 ± 0.6 410 0.0055 0.0005
20 wt%
Pd/Carbon
Fresh 31 1.9 ± 0.9 1100 - -
573 7 2.1 ± 0.8 310 0.035 0.0045
553 7 2.1 ± 0.6 560 0.013 0.0025
533 10 2.2 ± 0.5 930 0.0043 0.0011
a Result estimated from H2 chemisorption
b Result estimated from electron microscopy
c Result estimated from N2 physisorption
d Result estimated using extrapolated reaction rates of propanoic acid to time 0 h
e Result estimated using reaction rates of propanoic acid at the end of the experiment 20 h

98
Figure 4.2. Comparison of the XRD patterns of 5 wt% Rh/SiO2, 10 wt% Pt/SiO2, 5 wt%
Pd/SiO2, and 20 wt% Pd/Carbon before (fresh) and after (spent) reaction at 573 K. The
patterns were offset for clarity. The spent samples were recovered from the reactor and treated
as described in the Experimental Methods section. The spent catalysts were collected after 25 h
under reaction conditions.
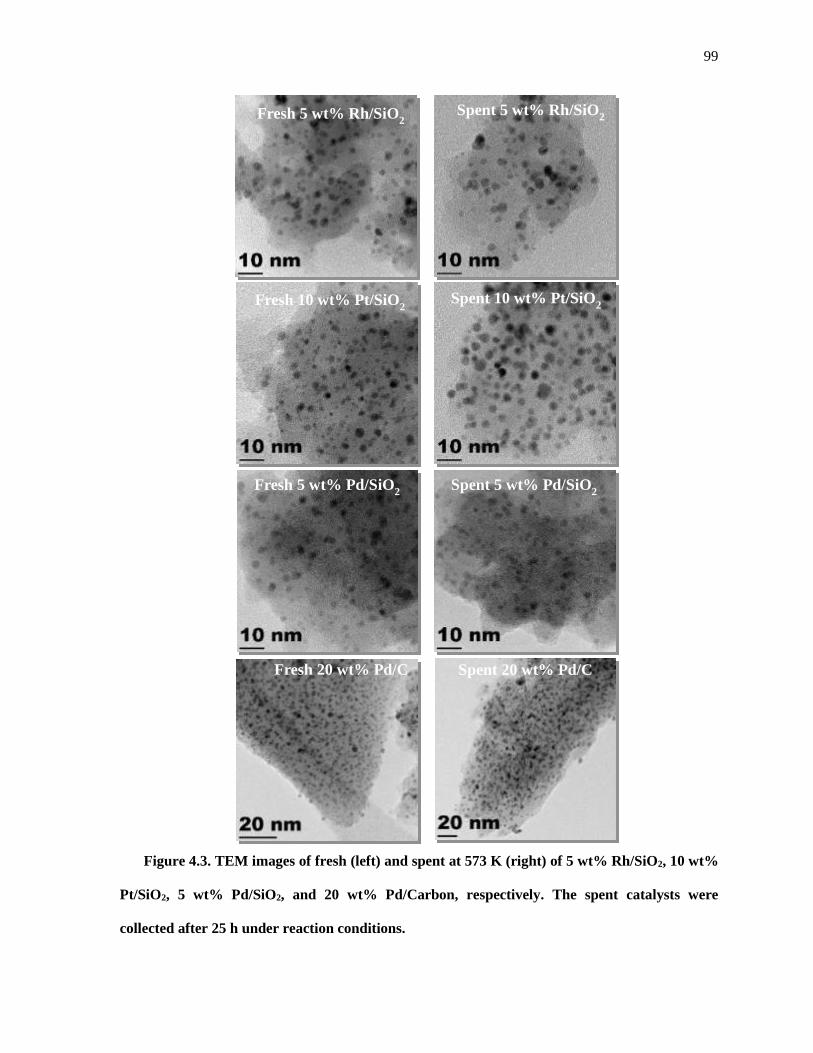
99
Figure 4.3. TEM images of fresh (left) and spent at 573 K (right) of 5 wt% Rh/SiO2, 10 wt%
Pt/SiO2, 5 wt% Pd/SiO2, and 20 wt% Pd/Carbon, respectively. The spent catalysts were
collected after 25 h under reaction conditions.
Fresh 10 wt% Pt/SiO2 Spent 10 wt% Pt/SiO
2
Spent 5 wt% Rh/SiO2
Spent 5 wt% Pd/SiO2
Fresh 5 wt% Rh/SiO2
Fresh 5 wt% Pd/SiO2
Spent 20 wt% Pd/C Fresh 20 wt% Pd/C
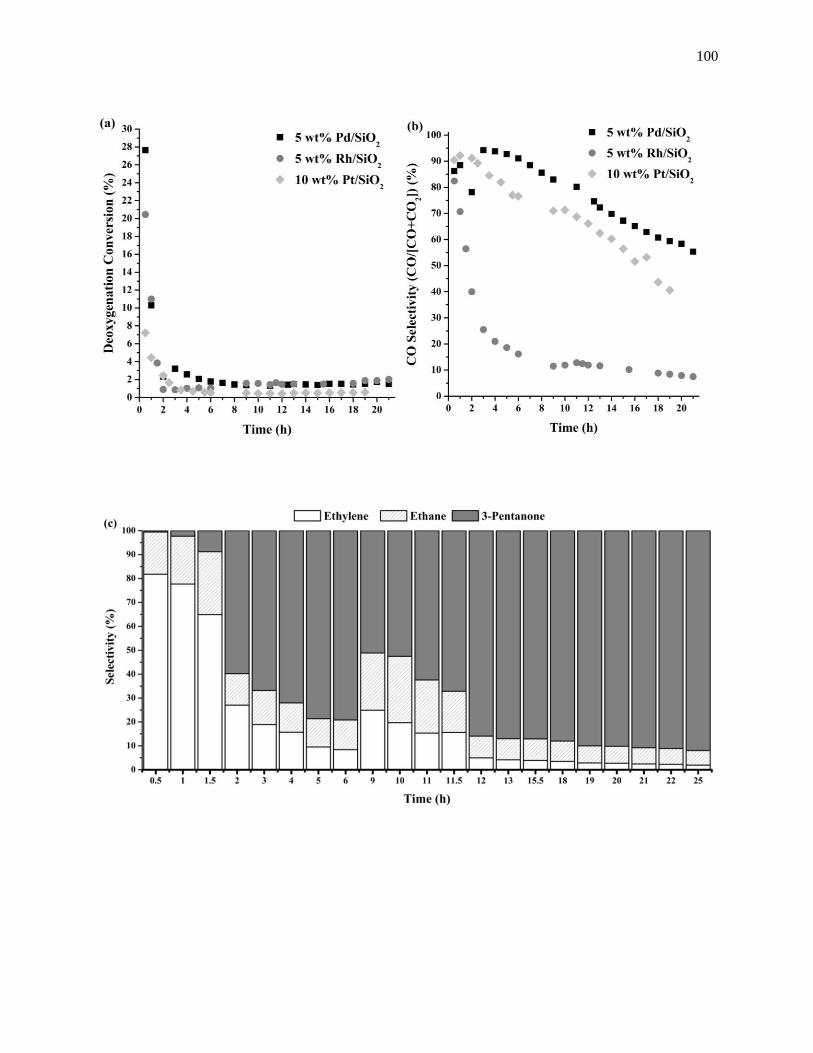
100
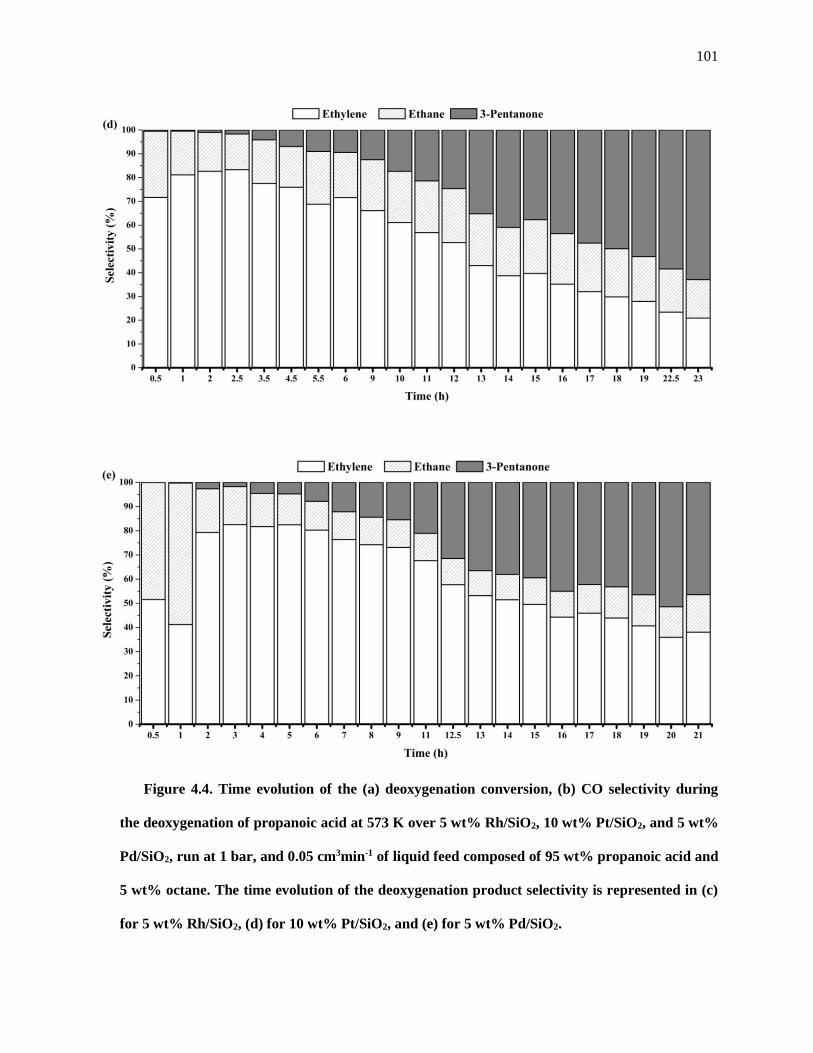
101
Figure 4.4. Time evolution of the (a) deoxygenation conversion, (b) CO selectivity during
the deoxygenation of propanoic acid at 573 K over 5 wt% Rh/SiO2, 10 wt% Pt/SiO2, and 5 wt%
Pd/SiO2, run at 1 bar, and 0.05 cm3min-1 of liquid feed composed of 95 wt% propanoic acid and
5 wt% octane. The time evolution of the deoxygenation product selectivity is represented in (c)
for 5 wt% Rh/SiO2, (d) for 10 wt% Pt/SiO2, and (e) for 5 wt% Pd/SiO2.

102
Figure 4.5 presents a semi-log plot of the measured rates at early time for the different catalysts.
Extrapolation of the rates to t = 0 h allows for an estimation of the initial rate unaffected by
deactivation. The initial TOF in Tables 4.1 and 4.2 calculated from extrapolated initial rates shows
that Pd was the most active metal with an initial TOF of 0.043 s-1. After long time on stream, the final
TOF over Rh was slightly higher than that over Pd, primarily because of the slightly higher
ketonization rate on the deactivated catalysts.
Murzin and co-workers [11,15,17–19,21] as well as Lamb and co-workers [13,22,23] studied the
liquid-phase conversion of carboxylic acids in the presence of H2 over Pd catalysts and reported TOFs
from 0.01 to 0.1 s-1, which are in the rage of the values reported here.
Figure 4.5. Determination of initial rates (mol h-1) by extrapolation to t = 0 h. represents
5 wt% Rh/SiO2, represents 10 wt% Pt/SiO2, and represents 5 wt% Pd/SiO2. The reactions
conditions were 573 K and 1 bar, and 0.05 cm3min-1 of liquid feed composed of 95 wt%
propanoic acid and 5 wt% octane.
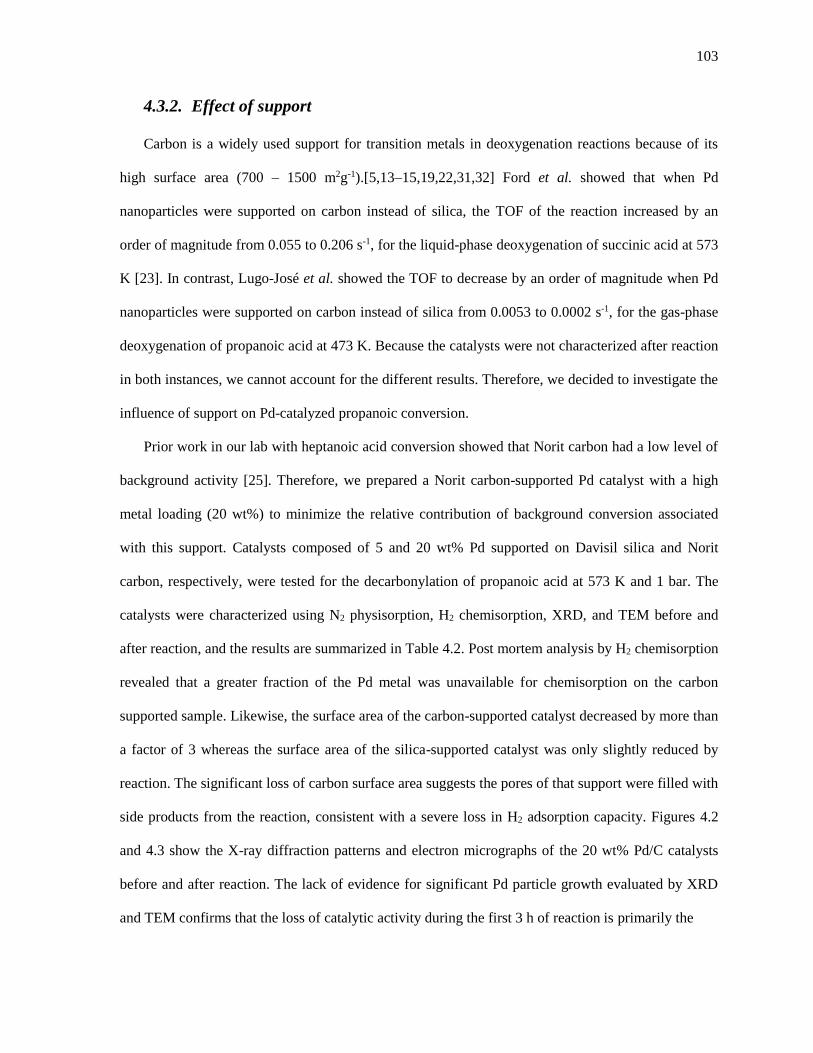
103
4.3.2. Effect of support
Carbon is a widely used support for transition metals in deoxygenation reactions because of its
high surface area (700 – 1500 m2g-1).[5,13–15,19,22,31,32] Ford et al. showed that when Pd
nanoparticles were supported on carbon instead of silica, the TOF of the reaction increased by an
order of magnitude from 0.055 to 0.206 s-1, for the liquid-phase deoxygenation of succinic acid at 573
K [23]. In contrast, Lugo-José et al. showed the TOF to decrease by an order of magnitude when Pd
nanoparticles were supported on carbon instead of silica from 0.0053 to 0.0002 s-1, for the gas-phase
deoxygenation of propanoic acid at 473 K. Because the catalysts were not characterized after reaction
in both instances, we cannot account for the different results. Therefore, we decided to investigate the
influence of support on Pd-catalyzed propanoic conversion.
Prior work in our lab with heptanoic acid conversion showed that Norit carbon had a low level of
background activity [25]. Therefore, we prepared a Norit carbon-supported Pd catalyst with a high
metal loading (20 wt%) to minimize the relative contribution of background conversion associated
with this support. Catalysts composed of 5 and 20 wt% Pd supported on Davisil silica and Norit
carbon, respectively, were tested for the decarbonylation of propanoic acid at 573 K and 1 bar. The
catalysts were characterized using N2 physisorption, H2 chemisorption, XRD, and TEM before and
after reaction, and the results are summarized in Table 4.2. Post mortem analysis by H2 chemisorption
revealed that a greater fraction of the Pd metal was unavailable for chemisorption on the carbon
supported sample. Likewise, the surface area of the carbon-supported catalyst decreased by more than
a factor of 3 whereas the surface area of the silica-supported catalyst was only slightly reduced by
reaction. The significant loss of carbon surface area suggests the pores of that support were filled with
side products from the reaction, consistent with a severe loss in H2 adsorption capacity. Figures 4.2
and 4.3 show the X-ray diffraction patterns and electron micrographs of the 20 wt% Pd/C catalysts
before and after reaction. The lack of evidence for significant Pd particle growth evaluated by XRD
and TEM confirms that the loss of catalytic activity during the first 3 h of reaction is primarily the

104
Figure 4.6. Time evolution of the (a) deoxygenation conversion, (b) CO selectivity, and (c)
deoxygenation product selectivity during the deoxygenation of propanoic acid at 573 K over 20
wt% Pd/Carbon run at 1 bar, and 0.05 cm3min-1 of liquid feed composed of 95 wt% propanoic
acid and 5 wt% octane.
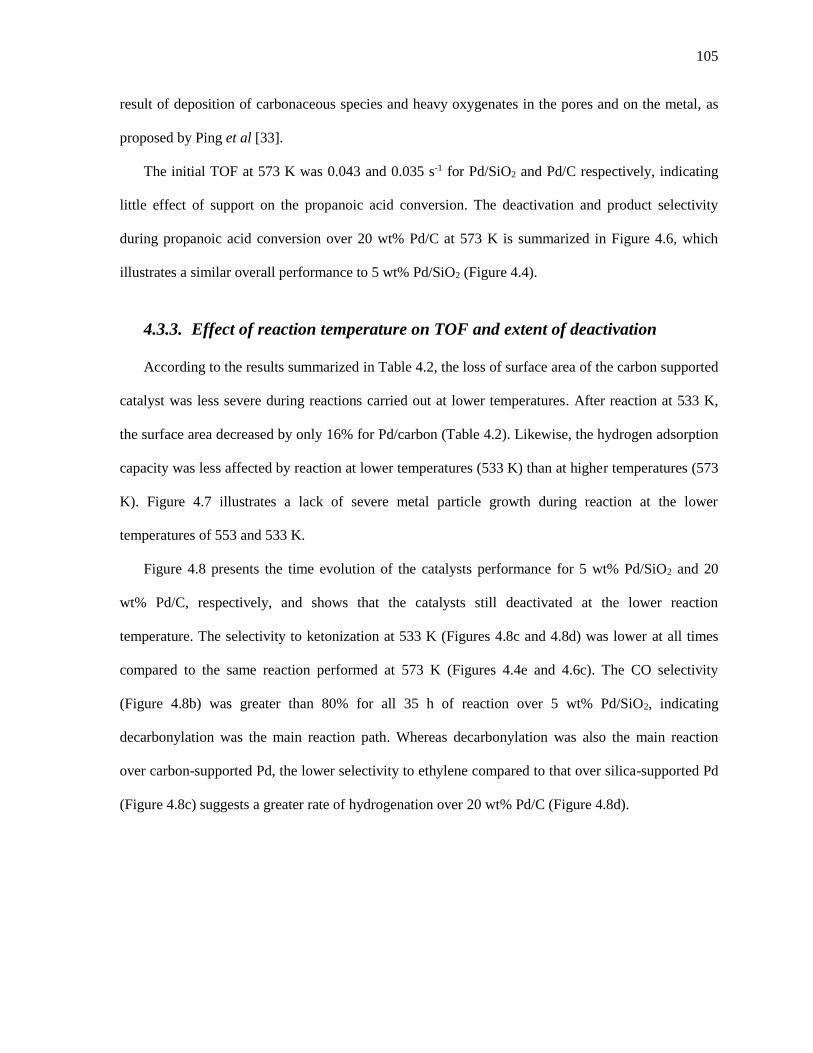
105
result of deposition of carbonaceous species and heavy oxygenates in the pores and on the metal, as
proposed by Ping et al [33].
The initial TOF at 573 K was 0.043 and 0.035 s-1 for Pd/SiO2 and Pd/C respectively, indicating
little effect of support on the propanoic acid conversion. The deactivation and product selectivity
during propanoic acid conversion over 20 wt% Pd/C at 573 K is summarized in Figure 4.6, which
illustrates a similar overall performance to 5 wt% Pd/SiO2 (Figure 4.4).
4.3.3. Effect of reaction temperature on TOF and extent of deactivation
According to the results summarized in Table 4.2, the loss of surface area of the carbon supported
catalyst was less severe during reactions carried out at lower temperatures. After reaction at 533 K,
the surface area decreased by only 16% for Pd/carbon (Table 4.2). Likewise, the hydrogen adsorption
capacity was less affected by reaction at lower temperatures (533 K) than at higher temperatures (573
K). Figure 4.7 illustrates a lack of severe metal particle growth during reaction at the lower
temperatures of 553 and 533 K.
Figure 4.8 presents the time evolution of the catalysts performance for 5 wt% Pd/SiO2 and 20
wt% Pd/C, respectively, and shows that the catalysts still deactivated at the lower reaction
temperature. The selectivity to ketonization at 533 K (Figures 4.8c and 4.8d) was lower at all times
compared to the same reaction performed at 573 K (Figures 4.4e and 4.6c). The CO selectivity
(Figure 4.8b) was greater than 80% for all 35 h of reaction over 5 wt% Pd/SiO2, indicating
decarbonylation was the main reaction path. Whereas decarbonylation was also the main reaction
over carbon-supported Pd, the lower selectivity to ethylene compared to that over silica-supported Pd
(Figure 4.8c) suggests a greater rate of hydrogenation over 20 wt% Pd/C (Figure 4.8d).
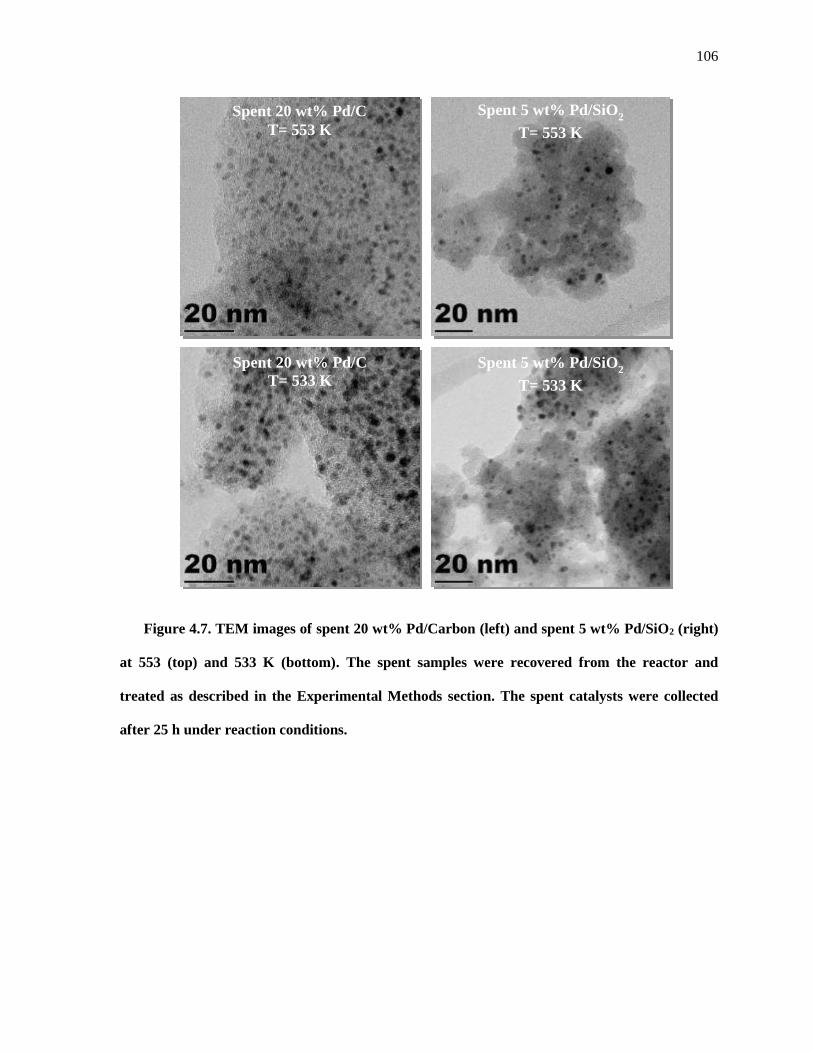
106
Figure 4.7. TEM images of spent 20 wt% Pd/Carbon (left) and spent 5 wt% Pd/SiO2 (right)
at 553 (top) and 533 K (bottom). The spent samples were recovered from the reactor and
treated as described in the Experimental Methods section. The spent catalysts were collected
after 25 h under reaction conditions.
Spent 20 wt% Pd/C
T= 553 K
Spent 20 wt% Pd/C
T= 533 K
Spent 5 wt% Pd/SiO2
T= 553 K
Spent 5 wt% Pd/SiO2
T= 533 K
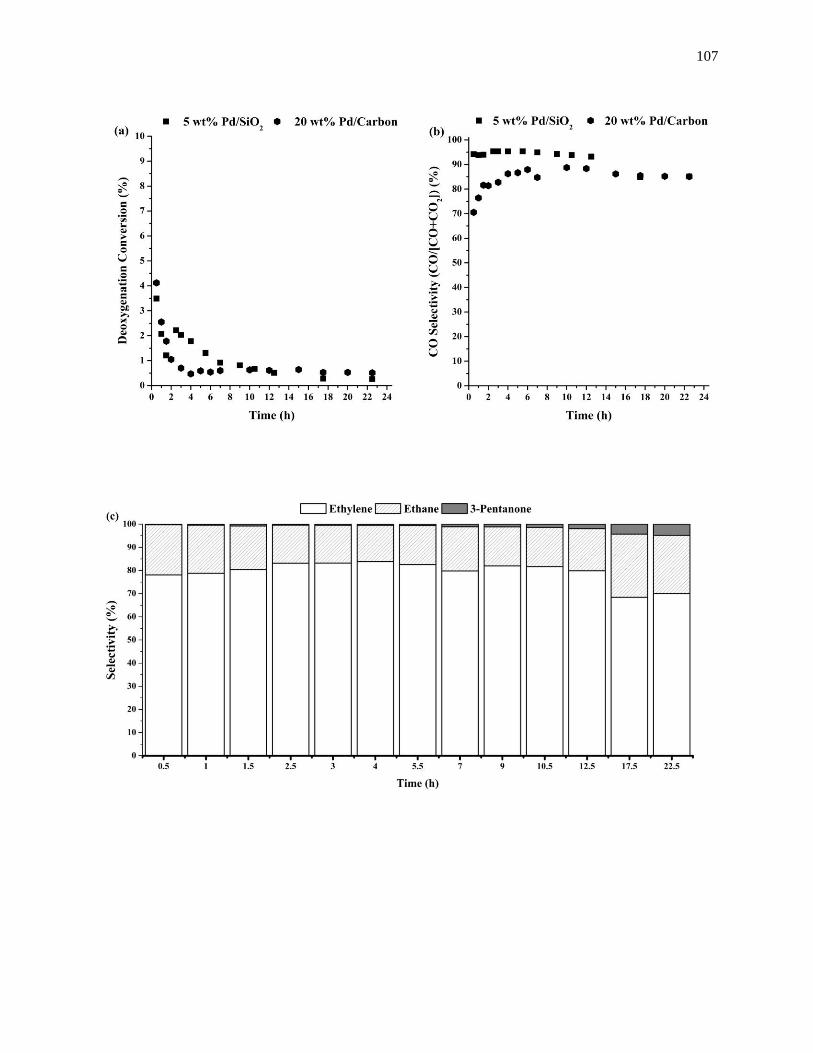
107
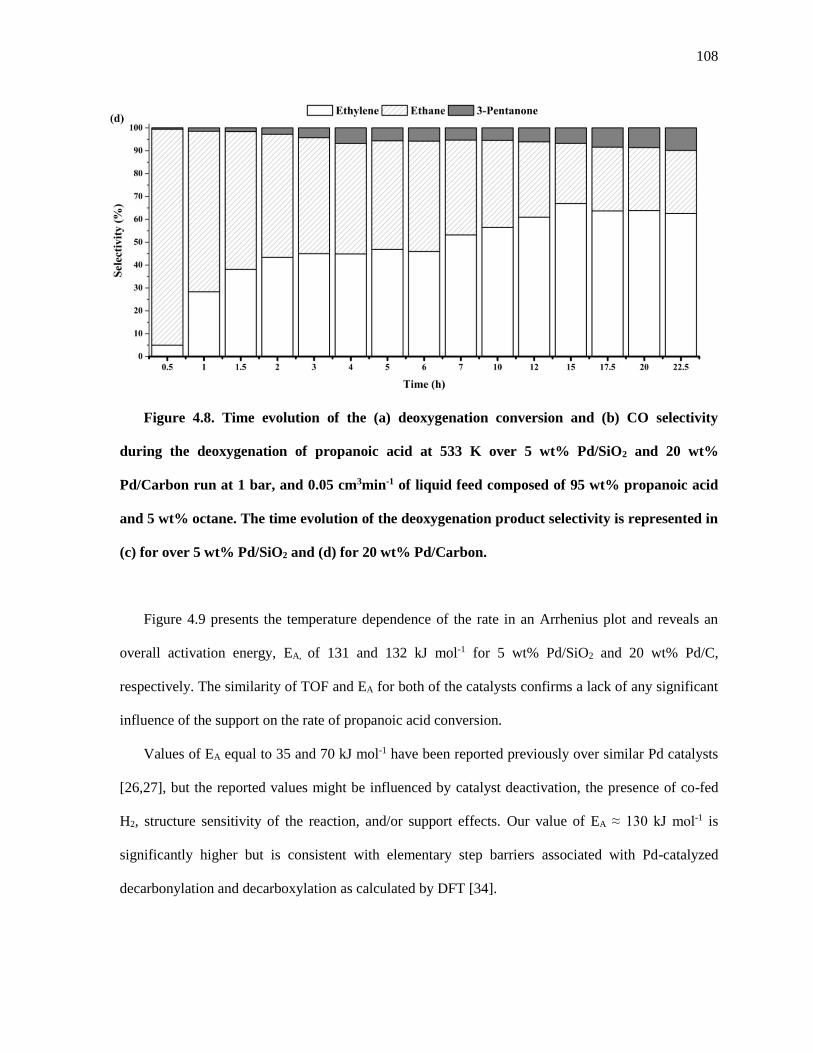
108
Figure 4.8. Time evolution of the (a) deoxygenation conversion and (b) CO selectivity
during the deoxygenation of propanoic acid at 533 K over 5 wt% Pd/SiO2 and 20 wt%
Pd/Carbon run at 1 bar, and 0.05 cm3min-1 of liquid feed composed of 95 wt% propanoic acid
and 5 wt% octane. The time evolution of the deoxygenation product selectivity is represented in
(c) for over 5 wt% Pd/SiO2 and (d) for 20 wt% Pd/Carbon.
Figure 4.9 presents the temperature dependence of the rate in an Arrhenius plot and reveals an
overall activation energy, EA, of 131 and 132 kJ mol-1 for 5 wt% Pd/SiO2 and 20 wt% Pd/C,
respectively. The similarity of TOF and EA for both of the catalysts confirms a lack of any significant
influence of the support on the rate of propanoic acid conversion.
Values of EA equal to 35 and 70 kJ mol-1 have been reported previously over similar Pd catalysts
[26,27], but the reported values might be influenced by catalyst deactivation, the presence of co-fed
H2, structure sensitivity of the reaction, and/or support effects. Our value of EA ≈ 130 kJ mol-1 is
significantly higher but is consistent with elementary step barriers associated with Pd-catalyzed
decarbonylation and decarboxylation as calculated by DFT [34].

109
Figure 4.9. Arrhenius-type plots of the initial rates for propanoic acid conversion over (a) 5
wt% Pd/SiO2 and (b) 20 wt% Pd/Carbon.
Lugo-José et al.[26] and Alotaibi et al. [27] reported a TOF of 0.0053 s-1 at 473 K and 0.0094 at
523 K, respectively, for the gas-phase decarbonylation of propanoic acid over Pd/SiO2. As shown in
Table 4.2, these values were higher compared to our reported values at 533 K, 0.0055 and 0.0043 s-1
for Pd supported on silica and carbon, respectively. Lugo-José et al. [26] and Alotaibi et al. [27] co-
fed H2 during reaction, 20 and 98 vol% respectively, which might have inhibited the catalyst
deactivation. These results are consistent with our post mortem catalyst characterization. Whereas we
reported a 62% loss of exposed Pd after reaction at 573 K over Pd/SiO2 (Table 4.2), Alotaibi et al.
reported only a 21% loss of fraction of exposed Pd after reaction at 573 K over Pd/SiO2.
The catalyst was successfully regenerated after a mild H2 treatment at 623 K. The catalyst
regeneration was monitored by thermogravimetric analysis and electron microscopy and is further
discussed in Appenedix E.

110
4.3.4. Effect of propanoic acid concentration
As mentioned in the Introduction, the influence of acid concentration on the rate and product
selectivity during reactions over supported Pd catalysts is not straight forward. Some researchers
claim a switchover in product selectivity from paraffins and CO2 to olefins and CO as the
deoxygenation rate decreased [13]. Decreasing the concentration of fatty acid also decreased the
decarbonylation rate and possibly caused a switchover to favor decarboxylation [13]. More recently,
Lugo-José et al. showed that during gas-phase reaction of propanoic acid at 1 bar and 473 K over
supported Pd, the reaction order was a function of the propanoic acid partial pressure, being zero at
high partial pressures and 0.5 at low partial pressures [26].
Figure 4.10. Effect of partial pressure of propanoic acid (PPAc) on initial TOF over 20 wt%
Pd/C at 1 bar of total pressure and 533 K. The average PPA was determined from the initial and
final PPA. The dotted lines are not linear fits, they are meant to guide the reader.
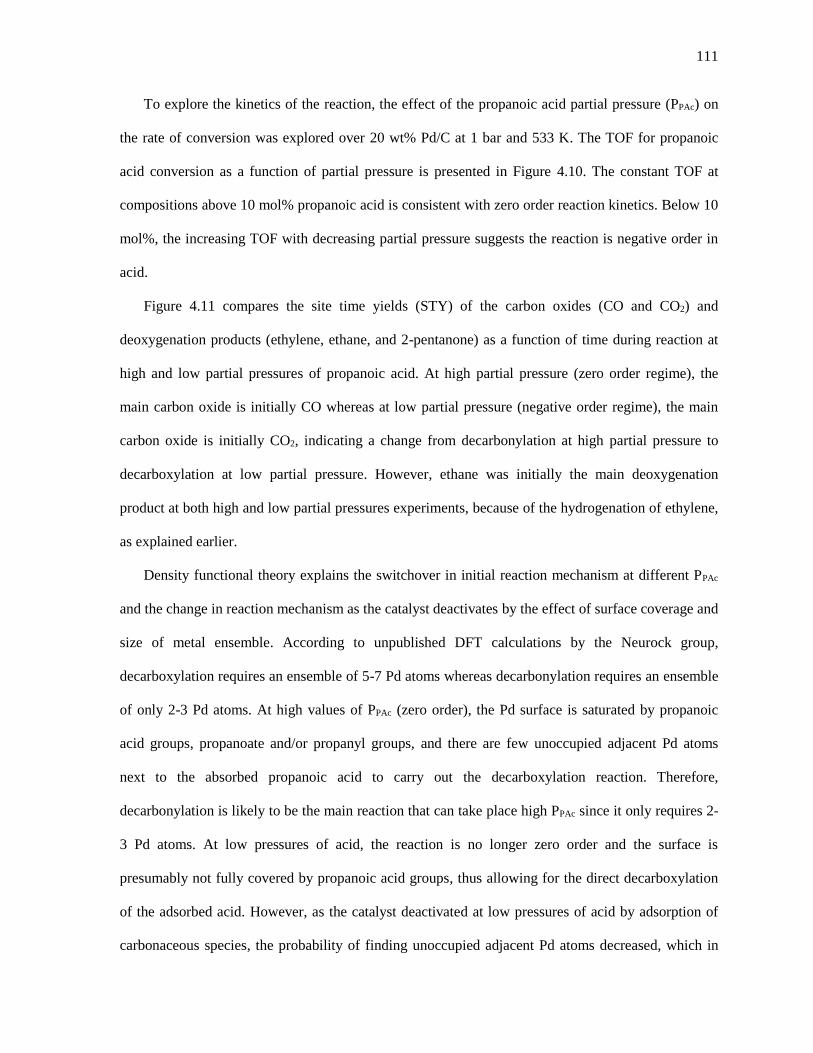
111
To explore the kinetics of the reaction, the effect of the propanoic acid partial pressure (PPAc) on
the rate of conversion was explored over 20 wt% Pd/C at 1 bar and 533 K. The TOF for propanoic
acid conversion as a function of partial pressure is presented in Figure 4.10. The constant TOF at
compositions above 10 mol% propanoic acid is consistent with zero order reaction kinetics. Below 10
mol%, the increasing TOF with decreasing partial pressure suggests the reaction is negative order in
acid.
Figure 4.11 compares the site time yields (STY) of the carbon oxides (CO and CO2) and
deoxygenation products (ethylene, ethane, and 2-pentanone) as a function of time during reaction at
high and low partial pressures of propanoic acid. At high partial pressure (zero order regime), the
main carbon oxide is initially CO whereas at low partial pressure (negative order regime), the main
carbon oxide is initially CO2, indicating a change from decarbonylation at high partial pressure to
decarboxylation at low partial pressure. However, ethane was initially the main deoxygenation
product at both high and low partial pressures experiments, because of the hydrogenation of ethylene,
as explained earlier.
Density functional theory explains the switchover in initial reaction mechanism at different PPAc
and the change in reaction mechanism as the catalyst deactivates by the effect of surface coverage and
size of metal ensemble. According to unpublished DFT calculations by the Neurock group,
decarboxylation requires an ensemble of 5-7 Pd atoms whereas decarbonylation requires an ensemble
of only 2-3 Pd atoms. At high values of PPAc (zero order), the Pd surface is saturated by propanoic
acid groups, propanoate and/or propanyl groups, and there are few unoccupied adjacent Pd atoms
next to the absorbed propanoic acid to carry out the decarboxylation reaction. Therefore,
decarbonylation is likely to be the main reaction that can take place high PPAc since it only requires 2-
3 Pd atoms. At low pressures of acid, the reaction is no longer zero order and the surface is
presumably not fully covered by propanoic acid groups, thus allowing for the direct decarboxylation
of the adsorbed acid. However, as the catalyst deactivated at low pressures of acid by adsorption of
carbonaceous species, the probability of finding unoccupied adjacent Pd atoms decreased, which in
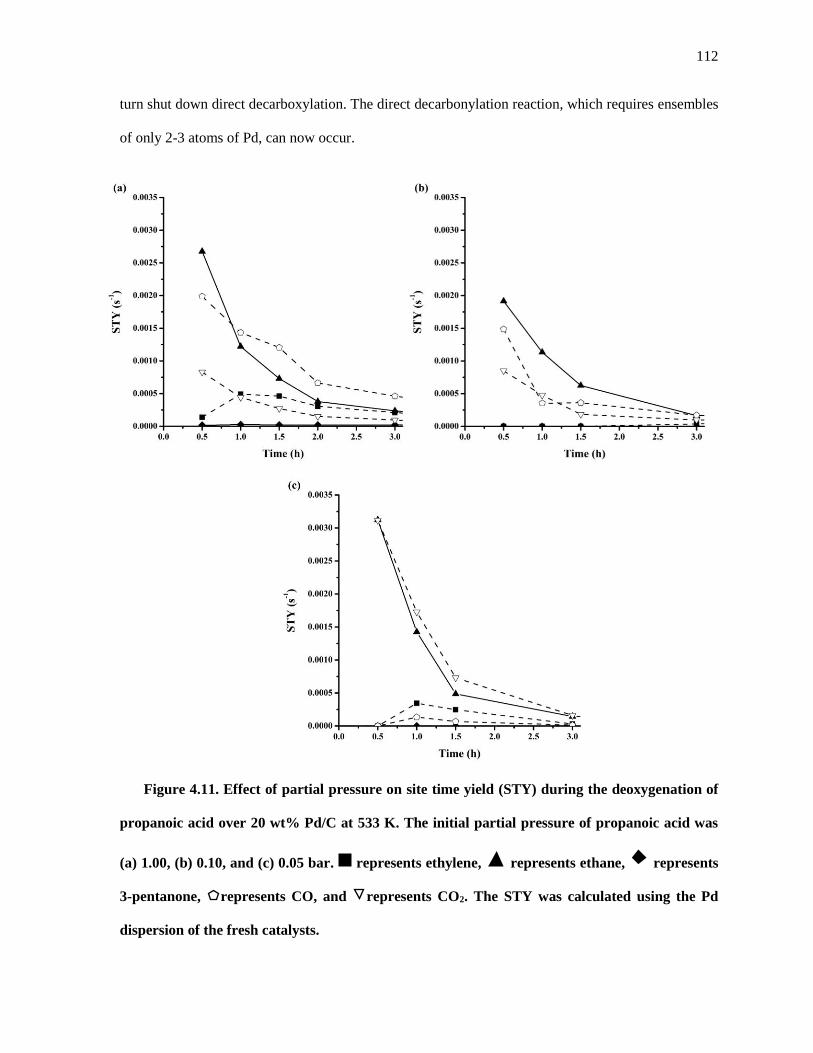
112
turn shut down direct decarboxylation. The direct decarbonylation reaction, which requires ensembles
of only 2-3 atoms of Pd, can now occur.
Figure 4.11. Effect of partial pressure on site time yield (STY) during the deoxygenation of
propanoic acid over 20 wt% Pd/C at 533 K. The initial partial pressure of propanoic acid was
(a) 1.00, (b) 0.10, and (c) 0.05 bar. represents ethylene, represents ethane, represents
3-pentanone, represents CO, and represents CO2. The STY was calculated using the Pd
dispersion of the fresh catalysts.

113
Scheme 4.3. Propanoic anhydride as a reaction intermediate for the decarbonylation of
propanoic acid.
4.3.5. Propanoic anhydride as potential reaction intermediate
The reactivity of propanoic anhydride (PAn) was compared to that of propanoic acid (PAc) over
20 wt% Pd/C at 533 K and two different partial pressures. The formation of an anhydride
intermediate could provide the route for water formation observed during the decarbonylation of a
carboxylic acid as shown in Scheme 4.3. In this study the site time yield (STY) was monitored during
the initial 3 h of reaction to explore the kinetics on the catalysts prior to severe deactivation and the
results are summarized in Figure 4.12.
At high initial partial pressure both PAc and PAn convert on 20 wt% Pd/C at 533 K with similar
initial TOF, 0.0042 and 0.0040 s-1 respectively. The catalyst deactivated during the first 2 h under
both high and low anhydride partial pressures, but the product distribution was slightly different. As
shown in Figure 4.12a, at high partial pressure, the conversion of PAn initially yielded about equal
parts of PAc and deoxygenation products. Under these conditions, the catalytic conversion of both
PAn and PAc proceeded mainly by decarbonylation. Whereas ethylene was initially the main product
during the catalytic conversion of PAn, ethane was initially the main deoxygenation product during
the catalytic conversion of PAc. The differences in production of ethylene observed at high PPAc and
PPAn are most likely a result of the difference in formation of H2O during reaction. As shown in
114
Figure 4.12. Deoxygenation of propanoic anhydride at (a) 1.00 bar for the high initial
partial pressure experiment and (b) 0.025 bar for the low initial partial pressure experiment
over 20 wt% Pd/Carbon at 533 K and 1 bar. represents ethylene, represents ethane,
represents 3-pentanone, represents propanoic acid, represents CO, and represents CO2.
The STY was calculated using the Pd dispersion of the fresh catalysts.
Scheme 4.3, H2O is generated during the initial coupling of two PAc's to form PAn, but H2O was
never formed when PAn was directly fed in the reactor. In the case of PAc, H2O is constantly formed
by the decarbonylation reaction, which might contribute hydrogen for the hydrogenation of ethylene
to ethane.
At low partial pressure, the initial STY values increased for the conversion of PAc and PAn as
shown in Figures 4.11c and 4.12b, respectively. As already discussed in the previous section, we
observed an increase in the initial TOF and a change in mechanism, from decarbonylation to
decarboxylation, when the PPAc was below 10 mol%. However, when partial pressure of propanoic
anhydride (PPAn) was below 10 mol%, we did not observe a switchover in product distribution. The
main products were still CO and ethylene, similar to those observed a high partial pressure. This
115
result suggests that PAn might be a surface reaction intermediate for decarbonylation only at high
PPAc. Furthermore, the observation that ethylene was the major product when PAn was fed together
with 97.5 mol% hexane indicates little hydrogen transfer from hexane to ethylene occurs on Pd at our
reaction conditions.
The very low reactivity of 3-pentanone at high and low partial pressures, 1.0 and 0.025 bar
respectively, at 533 K suggests that this molecule is not a reaction intermediate in the decarbonylation
or decarboxylation of propanoic acid. These results are further discusses in Appendix D.
4.4. Conclusions
Platinum, rhodium, and palladium nanoparticles were supported on Davisil SiO2 636 and Norit
carbon, characterized by chemisorption, physisorption, X-ray diffraction, electron microscopy, and
evaluated in the conversion of propanoic acid at temperatures ranging from 533 to 573 K. Results from
characterization and reactivity testing confirmed that highly dispersed nanoparticles were formed on silica
(dispersion ≈ 49 - 79%) after a mild calcination and reduction treatment at 623 K. Reduction of Pd onto
carbon resulted in a dispersion of ≈ 31%. All catalysts severely deactivated during the initial 3 h of
reaction over the temperature range of investigation. Palladium was found the most active metal with an
initial TOF at 573 K of 0.043 s-1, followed by Rh (0.027 s-1), and Pt (0.007 s-1). The metal nanoparticles
were stable under reaction conditions as shown by XRD and TEM. However, chemisorption and
physisorption showed a loss of adsorption capacity after reaction. Combined results from characterization
suggest that the catalyst deactivation was not due to metal sintering but absorption of carbonaceous
species.
Because Pd was the most active catalyst, the kinetics of the reaction as well as the effect of support
were explored. The observed EA over silica-supported and carbon-supported Pd nanoparticles was
approximately 130 kJ mol-1.
At 533K, the conversion of propanoic acid was zero order over the range of partial pressures from 0.1
to 1 bar. At lower partial pressures, the rate was negative order in acid. In the zero order regime, the main
116
reaction path was decarbonylation, whereas decarboxylation was the main reaction path in the negative
order regime.
4.5. Acknowledgement
This material is based upon work supported by the National Science Foundation (NSF) under Award
No. EEC-0813570 and by BP. Any opinions, findings, and conclusions or recommendations expressed in
this material are those of the author(s) and do not necessarily reflect the views of the NSF. We
acknowledge discussions with Dr. Glenn Sunley at BP, and Dr. Hien Pham and Professor Abhaya Datye
at the University of New Mexico. We also gratefully acknowledge the help Mr. Matthew Schneider at the
University of Virginia for his help with the TEM.
4.6. References
[1] 2013, BP Energy Outlook 203, London, UK.
[2] Ragauskas, A. J., Williams, C. K., Davison, B. H., Britovsek, G., Cairney, J., Eckert, C. A.,
Frederick, W. J., Hallett, J. P., Leak, D. J., Liotta, C. L., Mielenz, J. R., Murphy, R., Templer, R.,
and Tschaplinski, T., 2006, “The path forward for biofuels and biomaterials.,” Science, 311(5760),
pp. 484–9.
[3] Renz, M., 2005, “Ketonization of Carboxylic Acids by Decarboxylation: Mechanism and Scope,”
Eur J Org Chem, 2005(6), pp. 979–988.
[4] Gaertner, C. A., Serrano-Ruiz, J. C., Braden, D. J., and Dumesic, J. A., 2009, “Catalytic coupling
of carboxylic acids by ketonization as a processing step in biomass conversion,” J Catal, 266(1),
pp. 71–78.

117
[5] Snåre, M., Kubicková, I., Mäki-Arvela, P., Eränen, K., and Murzin, D. Y., 2006, “Heterogeneous
Catalytic Deoxygenation of Stearic Acid for Production of Biodiesel,” Ind Eng Chem Res, 45(45),
pp. 5708–5715.
[6] Miller, J. A., Nelson, J. A. J. A., and Byrne, M. P., 1993, “A Highly Catalytic and Selective
Conversion of Carboxylic Acids to 1-Alkenes of One Less Carbon Atom,” J Org Chem, 58(1), pp.
18–20.
[7] Maier, W. F., Roth, W., Thies, I., v. Rague Schleyer, P., Ragukschleyer, P., and Schleyer, R.,
1982, “Gas Phase Decarboxylation of Carboxylic Acids,” Chem Ber, 115, pp. 808–812.
[8] Morgan, T., Grubb, D., Santillan-Jimenez, E., Crocker, M., and Crocker, E. S. M., 2010,
“Conversion of Triglycerides to Hydrocarbons Over Supported Metal Catalysts,” Top Catal,
53(11-12), pp. 820–829.
[9] Santillan-Jimenez, E., Morgan, T., Lacny, J., Mohapatra, S., and Crocker, M., 2012, “Catalytic
deoxygenation of triglycerides and fatty acids to hydrocarbons over carbon-supported nickel,”
Fuel, 103(September), pp. 1010–1017.
[10] Snåre, M., Kubicková, I., Mäki-Arvela, P., Chichova, D., Eränen, K., and Murzin, D. Y., 2008,
“Catalytic deoxygenation of unsaturated renewable feedstocks for production of diesel fuel
hydrocarbons,” Fuel, 87(6), pp. 933–945.
[11] Mäki-Arvela, P., Snåre, M., Eränen, K., Myllyoja, J., and Murzin, D. Y., 2008, “Continuous
decarboxylation of lauric acid over Pd/C catalyst,” Fuel, 87(17-18), pp. 3543–3549.
[12] Rozmysłowicz, B., Mäki-Arvela, P., Lestari, S., Simakova, O. A., Eränen, K., Simakova, I. L.,
Murzin, D. Y., and Salmi, T. O., 2010, “Catalytic Deoxygenation of Tall Oil Fatty Acids Over a

118
Palladium-Mesoporous Carbon Catalyst : A New Source of Biofuels,” Top Catal, 53(15-18), pp.
1274–1277.
[13] Immer, J. G., Kelly, M. J., and Lamb, H. H., 2010, “Catalytic reaction pathways in liquid-phase
deoxygenation of C18 free fatty acids,” Appl Catal A-Gen, 375(1), pp. 134–139.
[14] Lestari, S., Mäki-Arvela, P., Bernas, H., Simakova, O., Sjoholm, R., Beltramini, J., Lu, G. Q. M.,
Myllyoja, J., Simakova, I., and Murzin, D. Y., 2009, “Catalytic Deoxygenation of Stearic Acid in
a Continuous Reactor over a Mesoporous Carbon-Supported Pd Catalyst,” Energ Fuel, 23(8), pp.
3842–3845.
[15] Lestari, S., Simakova, I., Tokarev, A., Mäki-Arvela, P., Eränen, K., and Murzin, D. Y., 2008,
“Synthesis of Biodiesel via Deoxygenation of Stearic Acid over Supported Pd / C Catalyst,” Catal
Lett, 122(3-4), pp. 247–251.
[16] Snåre, M., Kubicková, I., Mäki-Arvela, P., Eränen, K., Wärnå, J., and Murzin, D. Y., 2007,
“Production of diesel fuel from renewable feeds : Kinetics of ethyl stearate decarboxylation,”
Chem Eng J, 134, pp. 29–34.
[17] Simakova, I., Rozmysłowicz, B., Simakova, O. A., Mäki-Arvela, P., Simakov, A., and Murzin, D.
Y., 2011, “Catalytic Deoxygenation of C18 Fatty Acids Over Mesoporous Pd / C Catalyst for
Synthesis of Biofuels,” Top Catal, 54(8-9), pp. 460–466.
[18] Kubicková, I., Snåre, M., Eränen, K., Mäki-Arvela, P., and Murzin, D., 2005, “Hydrocarbons for
diesel fuel via decarboxylation of vegetable oils,” Catal Today, 106(1-4), pp. 197–200.
[19] Mäki-Arvela, P., Kubicková, I., Snåre, M., Eränen, K., and Murzin, D. Y., 2007, “Catalytic
Deoxygenation of Fatty Acids and Their Derivatives,” Energ Fuel, 21(1), pp. 30–41.

119
[20] Lestari, S., Mäki-Arvela, P., Simakova, I., Beltramini, J., Lu, G. Q. M., and Murzin, D. Y., 2009,
“Catalytic Deoxygenation of Stearic Acid and Palmitic Acid in Semibatch Mode,” Catal Lett,
130(1-2), pp. 48–51.
[21] Simakova, I., Simakova, O., Mäki-Arvela, P., Simakov, A., Estrada, M., and Murzin, D. Y., 2009,
“Deoxygenation of palmitic and stearic acid over supported Pd catalysts : Effect of metal
dispersion,” Appl Catal A-Gen, 355, pp. 100–108.
[22] Immer, J. G., and Lamb, H. H., 2010, “Fed-Batch Catalytic Deoxygenation of Free Fatty Acids,”
Energ Fuel, 130(10), pp. 5291–5299.
[23] Ford, J. P., Immer, J. G., and Lamb, H. H., 2012, “Palladium Catalysts for Fatty Acid
Deoxygenation: Influence of the Support and Fatty Acid Chain Length on Decarboxylation
Kinetics,” Top Catal, 55(3-4), pp. 175–184.
[24] Boda, L., Onyestyák, G., Solt, H., Lónyi, F., Valyon, J., and Thernesz, A., 2010, “Catalytic
hydroconversion of tricaprylin and caprylic acid as model reaction for biofuel production from
triglycerides,” Appl Catal A-Gen, 374(1-2), pp. 158–169.
[25] Lopez-Ruiz, J. A., and Davis, R. J., 2014, “Decarbonylation of heptanoic acid over carbon-
supported platinum nanoparticles,” Green Chem, 16(2), pp. 683–694.
[26] Lugo-José, Y. K., Monnier, J. R., and Williams, C. T., 2014, “Gas-Phase, Catalytic
Hydrodeoxygenation of Propanoic Acid, Over Supported Group VIII Noble Metals: Metal and
Support Effects,” Appl Catal A-Gen, 469, pp. 410–418.
[27] Alotaibi, M. A., Kozhevnikova, E. F., and Kozhevnikov, I. V., 2012, “Deoxygenation of propionic
acid on heteropoly acid and bifunctional metal-loaded heteropoly acid catalysts: Reaction
pathways and turnover rates,” Appl Catal A-Gen, 447-448, pp. 32–40.

120
[28] Hip, B. J., Duivenvoorden, F. B. M., Koningsberger, D. C., and Prins, R., 1987, “Determination of
Metal Particle Size of Highly Dispersed Rh , Ir , and Pt Catalysts by Hydrogen Chemisorption and
EXAFS,” J Catal, 105, pp. 26–38.
[29] Pham, H. N., Pagan-Torres, Y. J., Serrano-Ruiz, J. C., Wang, D., Dumesic, J. A., and Datye, A.
K., 2011, “Improved hydrothermal stability of niobia-supported Pd catalysts,” Appl Catal A-Gen,
397(1-2), pp. 153–162.
[30] Boudart, M., 1995, “Turnover Rates in Heterogeneous Catalysis,” Chem Rev, 95, pp. 661–666.
[31] Simakova, I., Simakova, O., Mäki-Arvela, P., and Murzin, D. Y., 2010, “Decarboxylation of fatty
acids over Pd supported on mesoporous carbon,” Catal Today, 150(1-2), pp. 28–31.
[32] Bernas, H., Eränen, K., Simakova, I., Leino, A.-R., Kordás, K., Myllyoja, J., Mäki-Arvela, P.,
Salmi, T., and Murzin, D. Y., 2010, “Deoxygenation of dodecanoic acid under inert atmosphere,”
Fuel, 89(8), pp. 2033–2039.
[33] Ping, E. W., Pierson, J., Wallace, R., Miller, J. T., Fuller, T. F., and Jones, C. W., 2011, “On the
nature of the deactivation of supported palladium nanoparticle catalysts in the decarboxylation of
fatty acids,” Appl Catal A-Gen, 396(1-2), pp. 85–90.
[34] Lopez-Ruiz, J. A., Buda, C., Horlor, B. T., Shabaker, J., Braden, D., Neurock, M., and Davis, R.
J., 2014, “Mechanistic Insights on the Decarbonylation and Decarboxylation of Propanoic Acid
over Palladium Catalysts,” Submiss.
121
Chapter 5. Conclusions and Future Work
Portions of this Introduction Chapter are based on the content of Chapters 2, 3, and 4.
5.1. Conclusions
Platinum nanoparticles were supported on Norit carbon, Vulcan carbon and silicon carbide, whereas
palladium, and rhodium nanoparticles were supported on Norit carbon, Vulcan carbon, and silica. The
catalysts were characterized by N2 physisorption, H2 chemisorption, X-ray diffraction and electron
microscopy before and after reaction to evaluate the effect of reaction conditions on catalyst stability. The
catalysts were studied during the liquid- and gas-phase conversion of heptanoic acid, and the gas-phase
conversion of propanoic acid at temperatures ranging from 533 to 573 K. In particular, variations of metal
type, metal dispersion, metal loading, support composition, synthesis method, acid concentration, space
time velocities, and reaction phase were used to explore the influence of conversion on product
distribution, and reaction mechanism.
In liquid-phase operation, decarbonylation was the primary reaction of heptanoic acid on Pt and Pd,
producing hexene, CO and water (not measured). Some hydrogenation of the olefins to hexane and
conversion of CO to CO2 was observed, especially at higher conversions. Rapid conversion of α-olefin to
internal olefin was also observed in the liquid- and gas-phase operation at high conversion. A steady-state
liquid-phase TOF of 0.00070 and 0.005 s-1 at 573 K was obtained for the liquid-phase conversion of
heptanoic acid over Pd and Pt, respectively, which was independent of synthesis method, support
composition, metal dispersion, metal loading, and acid concentration.
Operation in gas-phase allowed for extrapolation of rates to initial time in an effort to evaluate the
TOF on a fresh catalyst surface. All catalysts severely deactivated during the initial 3 h of reaction over
the temperature range of investigation. During the gas-phase conversion of propanoic acid over silica-
122
based catalysts, Pd was found the most active metal with an initial TOF at 573 K of 0.043 s-1, followed by
Rh (0.027 s-1), and Pt (0.007 s-1). Palladium nanoparticles supported on Norit carbon gave an initial TOF
of ≈ 0.035 s-1 for the gas-phase conversion of propanoic and heptanoic acid.
Because Pd was the most active catalyst, the kinetics of the reaction were explored during the gas-
phase conversion of propanoic acid. The observed EA over silica-supported and carbon-supported Pd
nanoparticles was approximately 130 kJ mol-1. At 533K, the conversion of propanoic acid was zero order
over the range of partial pressures from 0.1 to 1 bar. At lower partial pressures, the rate was negative
order in acid. In the zero order regime, the main reaction path was decarbonylation, whereas
decarboxylation was the main reaction path in the negative order regime.
Propanoic anhydride was tested as a potential reaction intermediate for the decarbonylation of
propanoic acid. At high and low acid partial pressure, the conversion of propanoic anhydride proceeded
by decarbonylation, which suggests that propanoic anhydride may be a surface intermediate in the high
pressure decarbonylation of propanoic acid.
Postmortem characterization of the catalysts revealed a decrease of surface area and almost complete
loss of H2 chemisorption capacity after the liquid-phase operation, which accounts for the low steady-
state rate under liquid-phase conditions. X-ray diffraction and electron microscopy revealed that Pd
nanoparticles supported on carbon sintered substantially during the liquid-phase in nearly pure acid. In
contrast, carbon-supported Pd nanoparticles were quite stable during gas-phase reaction. The sintering of
carbon-supported Pd nanoparticles in the liquid-phase was less significant at low acid concentrations.
Interestingly, silica-supported Pd nanoparticles were able to maintain a high dispersion during the liquid-
phase operation at high acid concentrations.
After gas-phase operation, x-ray diffraction and electron microscopy revealed that the metal
nanoparticles were stable regardless of the metal, support composition, and acid concentration. However,
chemisorption and physisorption showed a loss of adsorption capacity after reaction. Combined results

123
from characterization suggest that the catalyst deactivation was not due to metal sintering but absorption
of carbonaceous species.
Catalyst regeneration studies were performed over spent catalyst. Whereas mild air calcination and H2
reduction at 623 K failed to regenerate the spent catalyst after the gas-phase conversion of heptanoic acid,
H2 reduction at 623 K regenerated the spent catalyst after the gas-phase conversion of propanoic acid.
5.2. Future work and recommendations
5.2.1. Auto-sampling
In the current reaction system, gas-phase samples can only be taken manually every 30 minutes.
As a result of the severe catalyst deactivation observed during the first 1 to 2 h of reaction, only 3
samples are taken are used to extrapolate reaction rates to time zero. If these gas-phase samples are
not taken properly, this extrapolation can be very misleading and give inconsistent results. Recent
work in our lab involving steady-state isotopic transient kinetic analysis (SSITKA) have successfully
used a Valco 34-port auto-sampling valve to collect up to 16 gas-phase samples during short amount
of times [1]. I recommend to use a similar set-up and automate the gas-phase sampling system to
collect multiple samples during the initial 3 h of reaction and get a better resolution of the catalyst
deactivation.
5.2.2. Co-feeding dihydrogen
Much of the deoxygenation literature has shown that the use of hydrogen is essential to sustain
catalytic activity during liquid- and gas-phase reactions [2–16]. During the gas-phase experiments
discussed in Chapters 3 and 4, we reported severe catalyst deactivation during the initial 2 hours of
reaction that, in theory, could have been avoided if H2 was co-fed during reaction. For example,
Lugo-José et al. reported no deactivation when co-feeding 20 vol% H2 during the gas-phase
decarbonylation of propanoic acid over Pd catalysts and obtained decarbonylation and
124
decarboxylation products [17]. However, Alotaibi et al. co-fed 98 vol% H2 during the gas-phase
reaction and obtained alcohols and aldehydes as the main reaction products [18]. These reported
results suggest that the amount of H2 co-fed during reaction needs to be optimized to minimize
catalyst deactivation and avoid a change in reaction mechanism from
decarbonylation/decarboxylation to hydrodeoxygenation. I recommend the use and optimization of H2
during the liquid- and gas-phase reaction to obtain constant steady-state reaction rates and make
easier to quantification of turnover frequencies and estimation of observed activation energies.
5.2.3. Bimetallic catalysts
The use of bimetallic nanoparticles as catalysts for the decarbonylation of carboxylic acids is also
a potential solution to the demonstrated problems of selectivity and stability with monometallic
precious metal catalysts discussed in this work. The literature has shown that the overall activity of a
catalyst can increase by adding a second metal. This effect can be due to many reasons such as
electron donation from a metal to another, limiting the over-oxidation of the active metals, and by
aiding or inhibiting side reactions, among others.
In this work I have shown that the low selectivity to decarbonylation products, α-olefins and CO,
at higher conversions is the result of side reactions such as double-bond isomerization, olefin
hydrogenation and water-gas shift. I recommend to try bimetallic catalysts in an effort to obtain high
conversion to α-olefins by inhibiting side reactions. For example, Chiappero et al. [19] and Lira et al.
[20] inhibited olefin hydrogenation by adding Sn and Cu to Pt, respectively. Furthermore, Chiappero
et al. showed that the addition of K decreased the isomerization of the olefins [19].
Carbon monoxide is well known to strongly adsorb onto transition metals, which could be
limiting the reaction rate. Therefore, I would also recommend to test the effect of adding a metal that
enhances the tolerance of CO by lowering the binding energy of CO [21]. For example, Gustavo et al.
reported that the addition of Fe to Pt increased the CO tolerance of Pt [22].
125
Recently our collaborators at the University of New Mexico in Professor Abhaya Datye’s lab
have reported enhanced catalyst stability and activity of bimetallic catalysts for the furfural
hydrogenation to furfuryl alcohol compared to monometallic catalysts, when Pd was alloyed with Zn.
Assuming this proposed work is successful at identifying promising new catalysts, the
characterization techniques used in this thesis will not be sufficient to characterize the active sites of a
bimetallic catalysts. I recommend to use X-ray photoelectron spectroscopy (XPS) to identify the
oxidation state of the metals after catalyst synthesis and reaction. I also recommend the use of
electron energy loss spectroscopy (EELS) to characterize individual bimetallic particles and obtain
metal composition. Furthermore, bimetallic catalysts change when exposed to reaction conditions.
For example, Porosoff et al. reported that Pt-Ni undergoes structural changes when exposed to
reaction conditions [23]. Therefore the catalyst produced here will need to be characterized under in
situ reaction conditions. Previously in our lab, X-ray absorption near-edge spectroscopy (XANES)
was used to characterize bimetallic catalysts surfaces in situ. I recommend to use XANES to
characterize the most reactive bimetallic catalysts and correlate structural changes to catalyst activity
and selectivity.
5.2.4. Reactive Distillation
As shown in this work, low conversions of heptanoic acid during the gas-phase operation favors
the selectivity towards the formation of α-olefin. Since working at low conversions would require a
large separation cost downstream from the reactor, I propose to work with a reactive distillation
process as an alternative. The reactive distillation process integrates reaction and distillation in a
single multifunctional process unit [24]. The most beneficial advantage of the reactive distillation is
that the reaction products leave the reactive zone once made and, as a result, the system always works
at nearly 0% conversion. This would be very beneficial since side reactions, such as double-bond

126
isomerization, hydrogenation and water-gas shift, would be minimized as discussed in Chapters 2 and
3.
5.3. References
[1] Shou, H., and Davis, R. J., 2013, “Multi-Product Steady-State Isotopic Transient Kinetic Analysis
of CO Hydrogenation over Supported Molybdenum Carbide,” J Catal, 306, pp. 91–99.
[2] Lestari, S., Maki-Arvela, P., Bernas, H., Simakova, O., Sjoholm, R., Beltramini, J., Lu, G. Q. M.,
Myllyoja, J., Simakova, I., and Murzin, D. Y., 2009, “Catalytic Deoxygenation of Stearic Acid in
a Continuous Reactor over a Mesoporous Carbon-Supported Pd Catalyst,” Energ Fuel, 23(8), pp.
3842–3845.
[3] Lestari, S., Simakova, I., Tokarev, A., Mäki-Arvela, P., Eränen, K., and Murzin, D. Y., 2008,
“Synthesis of Biodiesel via Deoxygenation of Stearic Acid over Supported Pd / C Catalyst,” Catal
Lett, 122(3-4), pp. 247–251.
[4] Maki-Arvela, P., Snåre, M., Eranen, K., Myllyoja, J., and Murzin, D. Y., 2008, “Continuous
decarboxylation of lauric acid over Pd/C catalyst,” Fuel, 87(17-18), pp. 3543–3549.
[5] Rozmysłowicz, B., Maki-Arvela, P., Lestari, S., Simakova, O. A., Eränen, K., Simakova, I. L.,
Murzin, D. Y., and Salmi, T. O., 2010, “Catalytic Deoxygenation of Tall Oil Fatty Acids Over a
Palladium-Mesoporous Carbon Catalyst : A New Source of Biofuels,” Top Catal, 53(15-18), pp.
1274–1277.

127
[6] Snåre, M., Kubicková, I., Maki-Arvela, P., Eranen, K., Warnå, J., and Murzin, D. Y., 2007,
“Production of diesel fuel from renewable feeds : Kinetics of ethyl stearate decarboxylation,”
Chem Eng J, 134, pp. 29–34.
[7] Snåre, M., Kubicková, I., Maki-Arvela, P., Eranen, K., and Murzin, D. Y., 2006, “Heterogeneous
Catalytic Deoxygenation of Stearic Acid for Production of Biodiesel,” Ind Eng Chem Res, 45(45),
pp. 5708–5715.
[8] Simakova, I., Rozmysłowicz, B., Simakova, O. A., Maki-Arvela, P., Simakov, A., and Murzin, D.
Y., 2011, “Catalytic Deoxygenation of C18 Fatty Acids Over Mesoporous Pd / C Catalyst for
Synthesis of Biofuels,” Top Catal, 54(8-9), pp. 460–466.
[9] Kubicková, I., Snåre, M., Eranen, K., Maki-Arvela, P., and Murzin, D., 2005, “Hydrocarbons for
diesel fuel via decarboxylation of vegetable oils,” Catal Today, 106(1-4), pp. 197–200.
[10] Maki-Arvela, P., Kubicková, I., Snåre, M., Eranen, K., and Murzin, D. Y., 2007, “Catalytic
Deoxygenation of Fatty Acids and Their Derivatives,” Energ Fuel, 21(1), pp. 30–41.
[11] Snåre, M., Kubicková, I., Maki-Arvela, P., Chichova, D., Eranen, K., and Murzin, D. Y., 2008,
“Catalytic deoxygenation of unsaturated renewable feedstocks for production of diesel fuel
hydrocarbons,” Fuel, 87(6), pp. 933–945.
[12] Lestari, S., Mäki-Arvela, P., Simakova, I., Beltramini, J., Lu, G. Q. M., and Murzin, D. Y., 2009,
“Catalytic Deoxygenation of Stearic Acid and Palmitic Acid in Semibatch Mode,” Catal Lett,
130(1-2), pp. 48–51.
128
[13] Simakova, I., Simakova, O., Mäki-Arvela, P., Simakov, A., Estrada, M., and Murzin, D. Y., 2009,
“Deoxygenation of palmitic and stearic acid over supported Pd catalysts : Effect of metal
dispersion,” Appl Catal A-Gen, 355, pp. 100–108.
[14] Immer, J. G., and Lamb, H. H., 2010, “Fed-Batch Catalytic Deoxygenation of Free Fatty Acids,”
Energ Fuel, 130(10), pp. 5291–5299.
[15] Immer, J. G., Kelly, M. J., and Lamb, H. H., 2010, “Catalytic reaction pathways in liquid-phase
deoxygenation of C18 free fatty acids,” Appl Catal A-Gen, 375(1), pp. 134–139.
[16] Ford, J. P., Immer, J. G., and Lamb, H. H., 2012, “Palladium Catalysts for Fatty Acid
Deoxygenation: Influence of the Support and Fatty Acid Chain Length on Decarboxylation
Kinetics,” Top Catal, 55(3-4), pp. 175–184.
[17] Lugo-José, Y. K., Monnier, J. R., and Williams, C. T., 2014, “Gas-Phase, Catalytic
Hydrodeoxygenation of Propanoic Acid, Over Supported Group VIII Noble Metals: Metal and
Support Effects,” Appl Catal A-Gen, 469, pp. 410–418.
[18] Alotaibi, M. A., Kozhevnikova, E. F., and Kozhevnikov, I. V., 2012, “Deoxygenation of propionic
acid on heteropoly acid and bifunctional metal-loaded heteropoly acid catalysts: Reaction
pathways and turnover rates,” Appl Catal A-Gen, 447-448, pp. 32–40.
[19] Chiappero, M., Thi, P., Do, M., Crossley, S., Lobban, L. L., and Resasco, D. E., 2011, “Direct
conversion of triglycerides to olefins and paraffins over noble metal supported catalysts,” Fuel,
90(3), pp. 1155–1165.

129
[20] Lira, A., and Galiasso, R., 2012, “Dehydrogenation of C 12 – C 14 paraffins on PtCu / meso-
structured Al 2 O 3 catalyst for LAB production : Process simulation,” Fuel, (February).
[21] Simonetti, D., Kunkes, E., and Dumesic, J., 2007, “Gas-phase conversion of glycerol to synthesis
gas over carbon-supported platinum and platinum–rhenium catalysts,” J. Catal., 247(2), pp. 298–
306.
[22] Pereira, L. G. S., Paganin, V. a., and Ticianelli, E. a., 2009, “Investigation of the CO tolerance
mechanism at several Pt-based bimetallic anode electrocatalysts in a PEM fuel cell,” Electrochim.
Acta, 54(7), pp. 1992–1998.
[23] Porosoff, M. D., Yu, W., and Chen, J. G., 2013, “Challenges and opportunities in correlating
bimetallic model surfaces and supported catalysts,” J Catal, 308, pp. 2–10.
[24] Sundmacher, K., and Kienle, A., eds., 2006, Reactive Distillation: Status and Future Directions,
John Wiley & Sons.

130
Appendix A. Sample calculation of Weisz-Prater Criterion
It is important to check whether mass transfer limitations are present and may be masking some of the
kinetic measurement. As discussed in section 1.6, the Weisz-Prater criteria [1] was used to evaluate the
possibility of internal (ΦI) and external (ΦE) mass transfer limitations for liquid and gas phase reaction,
Equation A. 1.
15.0r
1r obs
2
obs
ABA
pp
E
ASEA
pp
ICk
R
CD
R Equation A. 1
where robs is the observed rate, RP is the radius of the particle, ρp is the density of the catalyst pellet, DEA is
the effective diffusivity coefficient, kA is the external mass transfer coefficient, CAS is the surface
concentration, and CAB is the bulk concentration [1,2].
To evaluate the mass transport phenomena, it was used the catalyst that showed the maximum
performance, which was 10 wt% Pt/Norit C, and robs was 1.03x10⁻³ and 4.25x10⁻⁴ molh-1 in liquid a gas-
phase reaction respectively. The radius of the particle was 425 μm/2 and 180 μm/2, and ρp was 0.4 gcm-3.
The effective diffusivity coefficient (DEA) was calculated using a porosity (εP) of 0.5 and a tortuosity (τ) of
3 as recommended in Davis and Davis [2], as seen in Equation 6 and 7 for liquid and gas respectively.
Equation A. 2
Equation A. 3
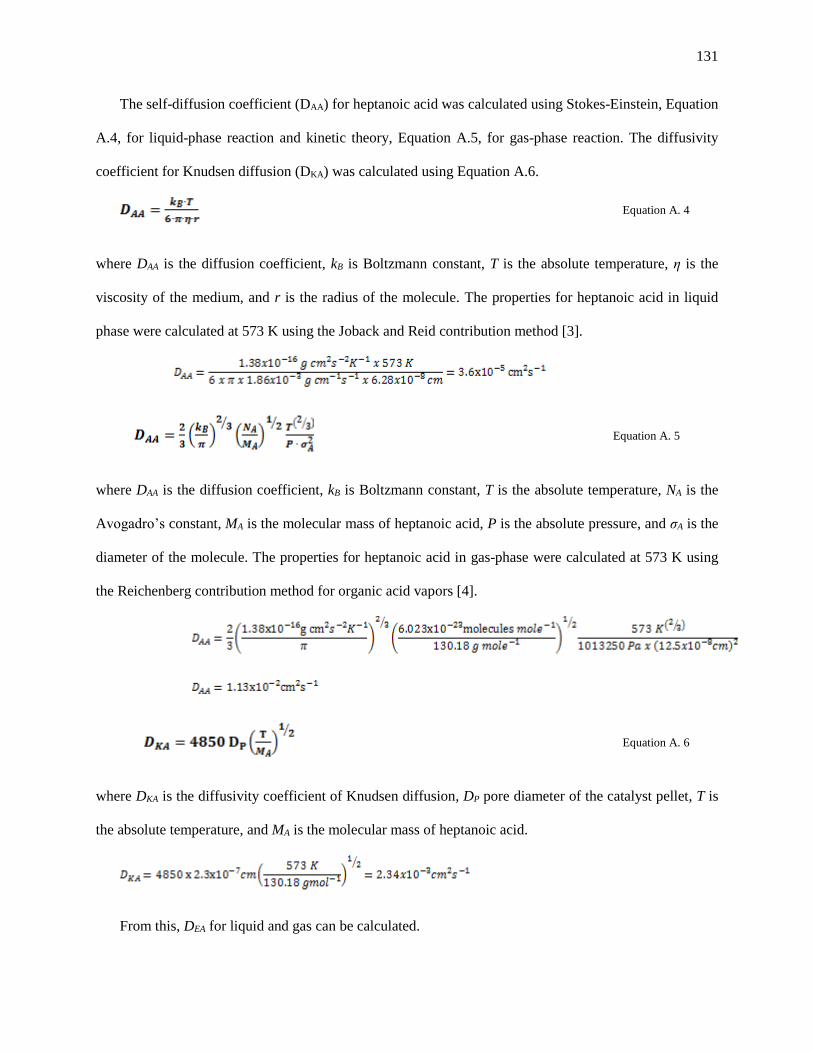
131
The self-diffusion coefficient (DAA) for heptanoic acid was calculated using Stokes-Einstein, Equation
A.4, for liquid-phase reaction and kinetic theory, Equation A.5, for gas-phase reaction. The diffusivity
coefficient for Knudsen diffusion (DKA) was calculated using Equation A.6.
Equation A. 4
where DAA is the diffusion coefficient, kB is Boltzmann constant, T is the absolute temperature, η is the
viscosity of the medium, and r is the radius of the molecule. The properties for heptanoic acid in liquid
phase were calculated at 573 K using the Joback and Reid contribution method [3].
Equation A. 5
where DAA is the diffusion coefficient, kB is Boltzmann constant, T is the absolute temperature, NA is the
Avogadro’s constant, MA is the molecular mass of heptanoic acid, P is the absolute pressure, and σA is the
diameter of the molecule. The properties for heptanoic acid in gas-phase were calculated at 573 K using
the Reichenberg contribution method for organic acid vapors [4].
Equation A. 6
where DKA is the diffusivity coefficient of Knudsen diffusion, DP pore diameter of the catalyst pellet, T is
the absolute temperature, and MA is the molecular mass of heptanoic acid.
From this, DEA for liquid and gas can be calculated.

132
The concentration at the surface of the catalyst (CAS) was calculated using a mole balance at the
interface between the boundary layer and the surface of the catalyst pellet in which the flux of heptanoic
acid (NA) is equal to the observed reaction rate (robs) per gram of catalyst (Equation A.7).
Equation A. 7
where CAS is the surface concentration, CAB is the bulk concentration, robs is the observed rate, kA is the
external mass transfer coefficient, and SP external catalyst particle surface area per unit reactor volume.
The external mass transfer coefficient (kA) was obtained using a mass transfer correlation, Equation
A.8, for fluid-solid interface for packed bed reactors obtained from Cussler [5].
Equation A. 8
where kA is the mass transfer coefficient, DAA is the self-diffusion coefficient of A, υ0 is the superficial
velocity which would exist without packing, ρ is the density of the fluid, dP is the catalyst particle
diameter, and ν is the kinematic viscosity of fluid.
The superficial velocities for liquid and gas phase reaction were calculated using 0.01 cm3min-1 as the
feed flow rate. The densities of heptanoic were calculated at 573 K. The density of the liquid-phase acid
was calculated using the Joback group contribution method and it was found to be 894 kgm-3. The density
of heptanoic acid in gas-phase was calculated using the ideal gas law and it was found to be 2.83 kgm-3.
The superficial velocity for liquid and gas phase were 1.02x10⁻³ cm3s-1 and 0.33 cm3s-1 respectively.

133
The external catalyst particle surface area per unit reactor volume, SP, was calculated for both particle
sizes, 180 and 425 μm, using Equation 13.
Equation A. 9
where r is the radius of the particle and ρ is the density of the catalyst particle
Using Equation 11, CAS for liquid (CAS,L) and gas (CAS,G) phase reaction were calculated. The value of
kA depends on the catalyst particle size and reaction phase. The observed reaction rate, robs, and CAB
depends on reaction phase, and SP depends on the catalyst particle size.
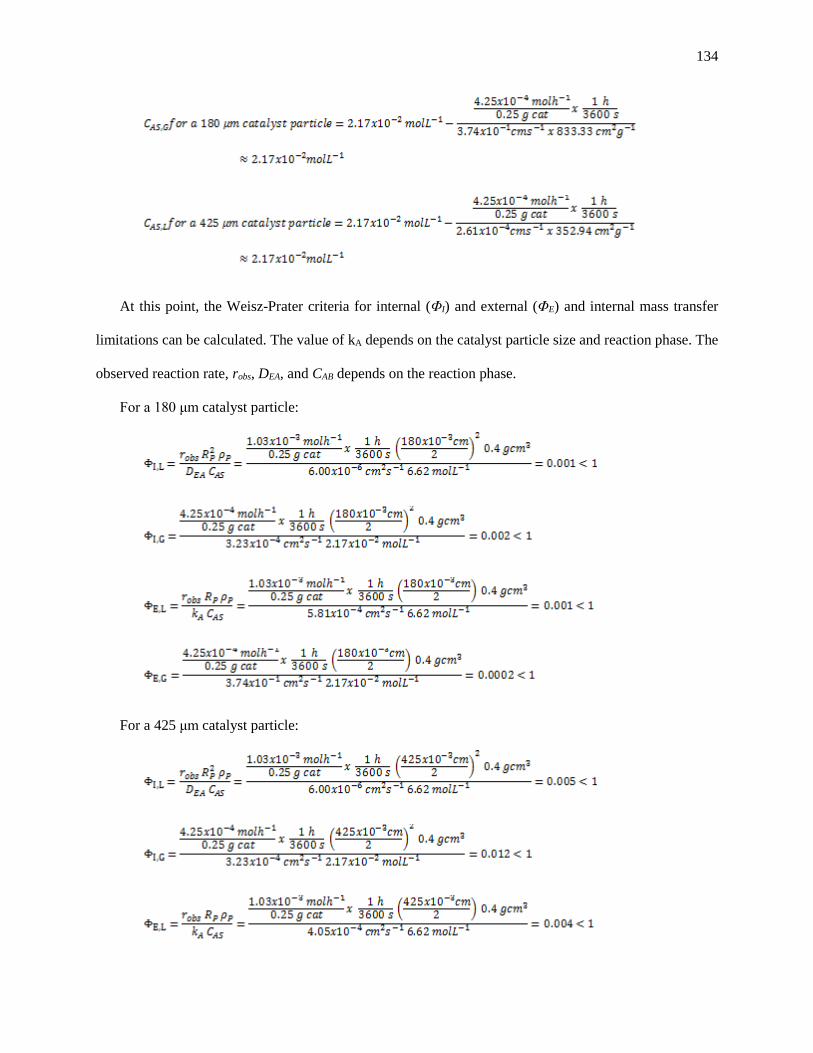
134
At this point, the Weisz-Prater criteria for internal (ΦI) and external (ΦE) and internal mass transfer
limitations can be calculated. The value of kA depends on the catalyst particle size and reaction phase. The
observed reaction rate, robs, DEA, and CAB depends on the reaction phase.
For a 180 μm catalyst particle:
For a 425 μm catalyst particle:
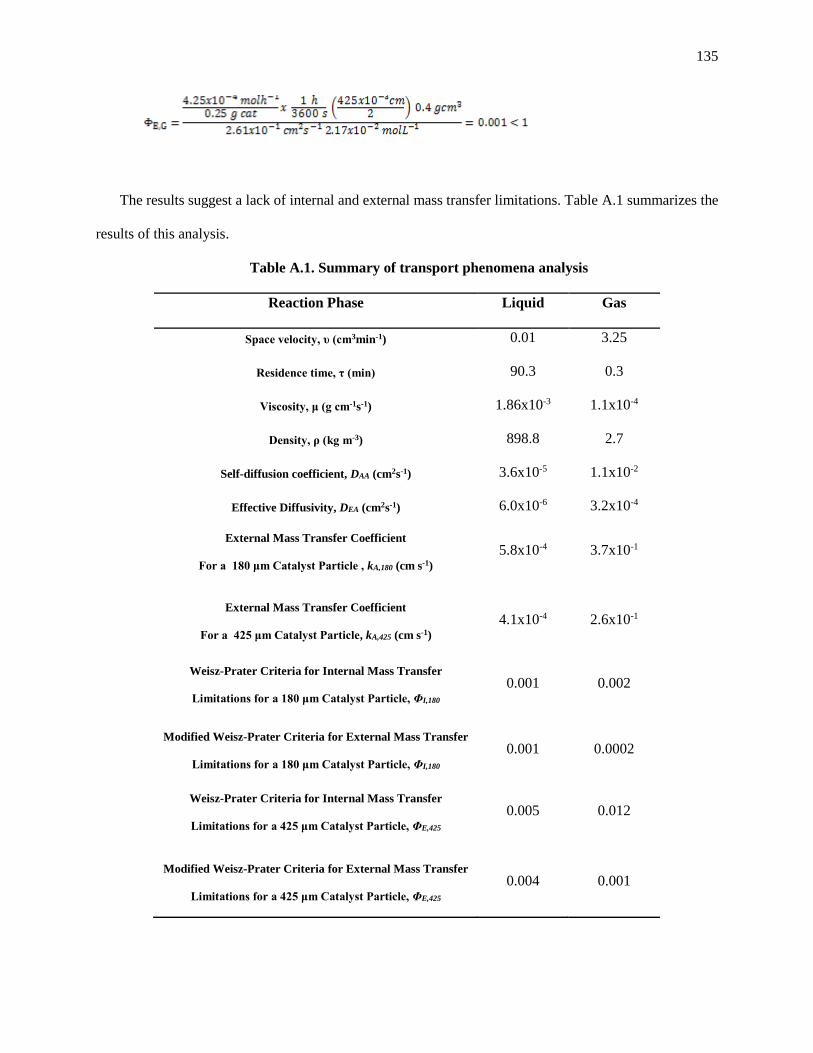
135
The results suggest a lack of internal and external mass transfer limitations. Table A.1 summarizes the
results of this analysis.
Table A.1. Summary of transport phenomena analysis
Reaction Phase Liquid Gas
Space velocity, υ (cm3min-1) 0.01 3.25
Residence time, τ (min) 90.3 0.3
Viscosity, μ (g cm-1s-1) 1.86x10⁻³ 1.1x10⁻⁴
Density, ρ (kg m-3) 898.8 2.7
Self-diffusion coefficient, DAA (cm2s-1) 3.6x10⁻⁵ 1.1x10⁻²
Effective Diffusivity, DEA (cm2s-1) 6.0x10⁻⁶ 3.2x10⁻⁴
External Mass Transfer Coefficient
For a 180 μm Catalyst Particle , kA,180 (cm s-1)
5.8x10⁻⁴ 3.7x10⁻¹
External Mass Transfer Coefficient
For a 425 μm Catalyst Particle, kA,425 (cm s-1)
4.1x10⁻⁴ 2.6x10⁻¹
Weisz-Prater Criteria for Internal Mass Transfer
Limitations for a 180 μm Catalyst Particle, ΦI,180
0.001 0.002
Modified Weisz-Prater Criteria for External Mass Transfer
Limitations for a 180 μm Catalyst Particle, ΦI,180
0.001 0.0002
Weisz-Prater Criteria for Internal Mass Transfer
Limitations for a 425 μm Catalyst Particle, ΦE,425
0.005 0.012
Modified Weisz-Prater Criteria for External Mass Transfer
Limitations for a 425 μm Catalyst Particle, ΦE,425
0.004 0.001

136
Appendix B. Gas chromatography calibrations
Figure B.1. Calibration curve for 1-hexene
Figure B.2. Calibration curve for hexane
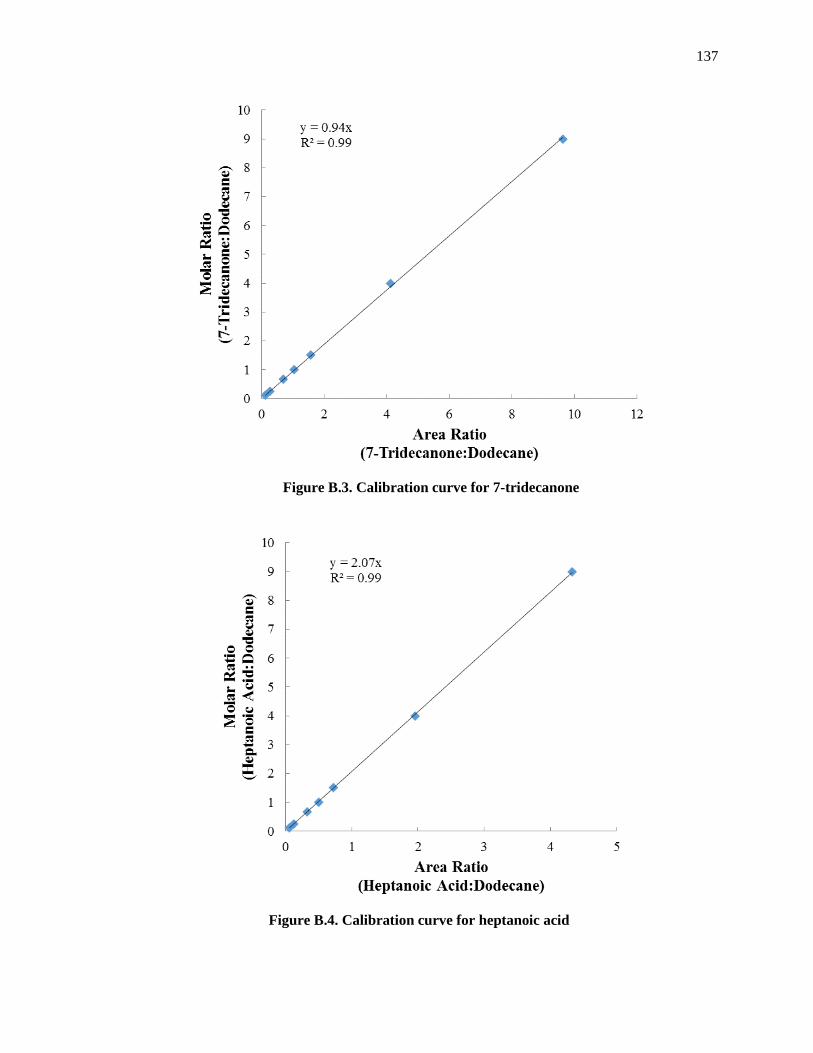
137
Figure B.3. Calibration curve for 7-tridecanone
Figure B.4. Calibration curve for heptanoic acid

138
Figure B.5. Calibration curve for CO2
Figure B.6. Calibration curve for CO
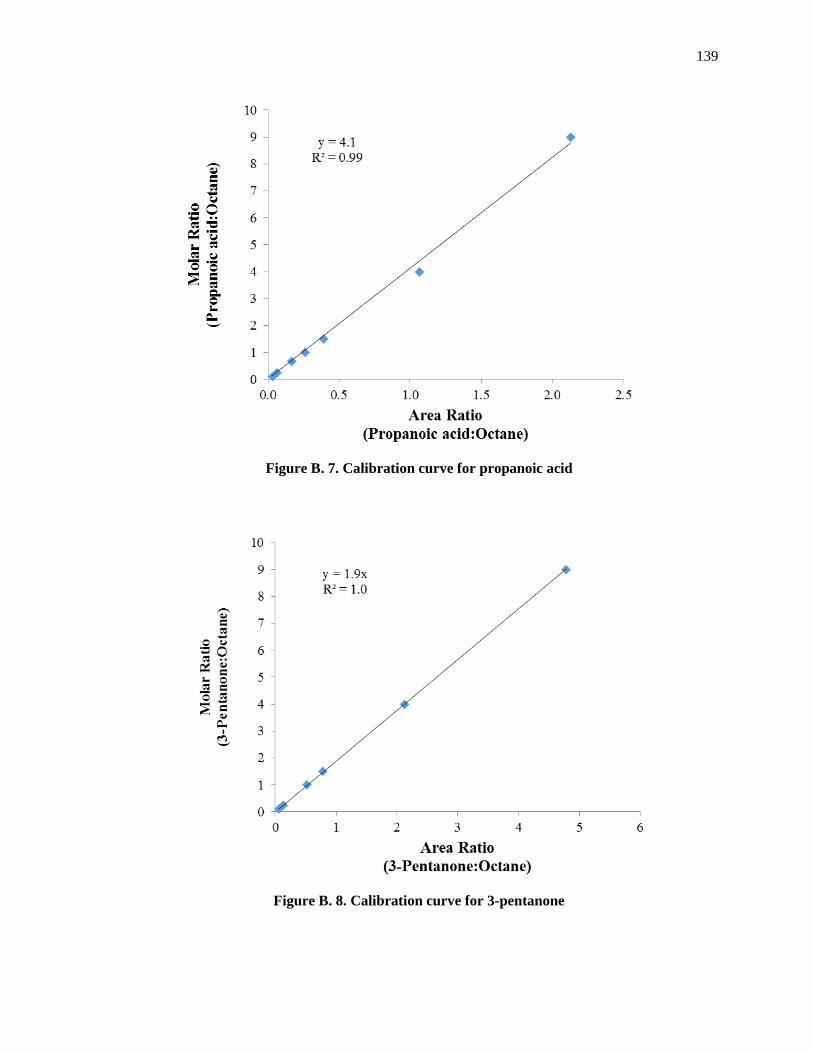
139
Figure B. 7. Calibration curve for propanoic acid
Figure B. 8. Calibration curve for 3-pentanone

140
Figure B. 9. Calibration curve for ethane
Figure B. 10. Calibration curve for ethylene
141
Appendix C. Effect of heptanoic acid concentration
In this section we tested the effect of acid on the TOF and product selectivity concentration during the
liquid-phase conversion of heptanoic acid over 20 wt% Pd/Norit C at 40 bar and 573 K. Because of the
linear relationship between conversion and product selectivity, weight of catalyst and flow rate were
adjusted to have similar conversion level at different acid concentrations. Due to the catalyst deactivation
observed in the previous sections, fresh catalyst was used for each acid concentration experiment. Table
3.3 shows that the liquid-phase TOF was constant at ≈ 0.00070 s-1 independent of the heptanoic
concentration. This indicated that the system was operating at zero order regime and in agreement with
the observations reported by Mäki-Arvela et al. [6]. Furthermore, Lugo-José et al. also reported a zero
order reaction regime during the gas-phase conversion of propanoic acid over a Pd catalyst [7]. In their
work, they also reported 0.5 reaction order regime at very low concentrations of acid, however, we could
not lower any further the acid concentration in our system without losing resolution because the diluent
and reaction products were both in the liquid-phase.
As shown in Table C.1, whereas the selectivity to olefins (α-olefin and hexenes) decreased as the
concentration of acid decreased, the CO selectivity remained ≈ 60%, and relatively constant, most likely
because the conversion level was similar for all the experiment. Although we detected a shift in product
selectivity from hexenes to hexane as reported by Immer et al. [8], the constancy of the CO selectivity
indicated that the higher paraffin selectivity most likely due to hydrogen transfer from tetradecane to the
olefins. This could explain why some studies showed that the formation rate of alkenes did not match that
of CO [9,10].
The catalysts were characterized after reaction by XRD and TEM, Figures 3.12 and 3.13 respectively,
and revealed that the Pd nanoparticles were stable at low concentrations of heptanoic acid. As the
concentration of the acid increased above 0.4 M, Pd sintering was detected. This result suggested that
high concentration of acid was responsible for the Pd sintering observed during the liquid-phase
operation.

142
Table C.2. Summary of reactivity results for 20 wt% Pd/NoritC operated at different acid
concentrations at 573 K and liquid-phase conditions.
[Heptanoic Acid]a
(mol L-1)
Liquid-Phase
TOFb
(s-1)
Conversionb
(%)
CO Selectivityc
(%)
Hexenes
Selectivityd
(%)
6.6 0.00068 8.8 54 17
2.4 0.00073 8.7 68 14
1.1 0.00072 8.7 67 5.2
0.40 0.00076 6.8 68 0.41
0.19 0.00068 9.7 63 0.0
0.10 0.00070 10 64 0.0
a Tetradecane was used as diluent
b Result estimated using rates of heptanoic acid after 20 h of reaction and
c Result estimated using rates of carbon oxides after 20 h of reaction
d Result estimated using rates of 1-hexene, i-hexenes, and hexane after 20 h of reaction
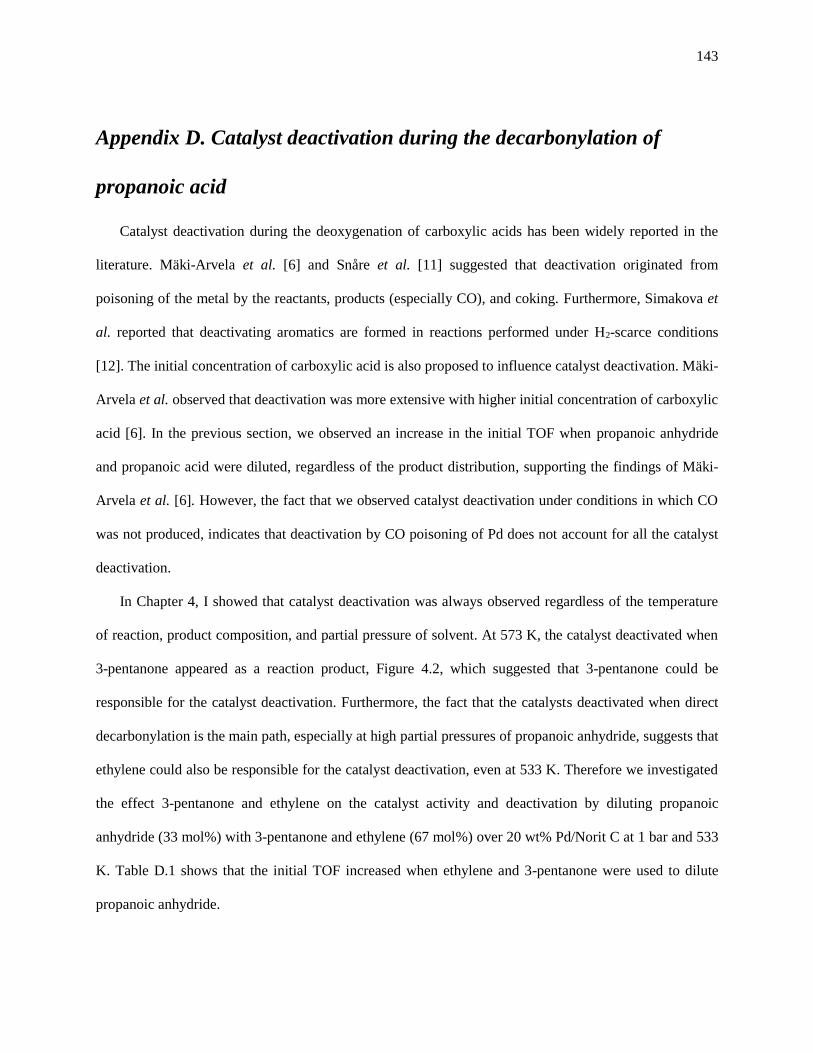
143
Appendix D. Catalyst deactivation during the decarbonylation of
propanoic acid
Catalyst deactivation during the deoxygenation of carboxylic acids has been widely reported in the
literature. Mäki-Arvela et al. [6] and Snåre et al. [11] suggested that deactivation originated from
poisoning of the metal by the reactants, products (especially CO), and coking. Furthermore, Simakova et
al. reported that deactivating aromatics are formed in reactions performed under H2-scarce conditions
[12]. The initial concentration of carboxylic acid is also proposed to influence catalyst deactivation. Mäki-
Arvela et al. observed that deactivation was more extensive with higher initial concentration of carboxylic
acid [6]. In the previous section, we observed an increase in the initial TOF when propanoic anhydride
and propanoic acid were diluted, regardless of the product distribution, supporting the findings of Mäki-
Arvela et al. [6]. However, the fact that we observed catalyst deactivation under conditions in which CO
was not produced, indicates that deactivation by CO poisoning of Pd does not account for all the catalyst
deactivation.
In Chapter 4, I showed that catalyst deactivation was always observed regardless of the temperature
of reaction, product composition, and partial pressure of solvent. At 573 K, the catalyst deactivated when
3-pentanone appeared as a reaction product, Figure 4.2, which suggested that 3-pentanone could be
responsible for the catalyst deactivation. Furthermore, the fact that the catalysts deactivated when direct
decarbonylation is the main path, especially at high partial pressures of propanoic anhydride, suggests that
ethylene could also be responsible for the catalyst deactivation, even at 533 K. Therefore we investigated
the effect 3-pentanone and ethylene on the catalyst activity and deactivation by diluting propanoic
anhydride (33 mol%) with 3-pentanone and ethylene (67 mol%) over 20 wt% Pd/Norit C at 1 bar and 533
K. Table D.1 shows that the initial TOF increased when ethylene and 3-pentanone were used to dilute
propanoic anhydride.
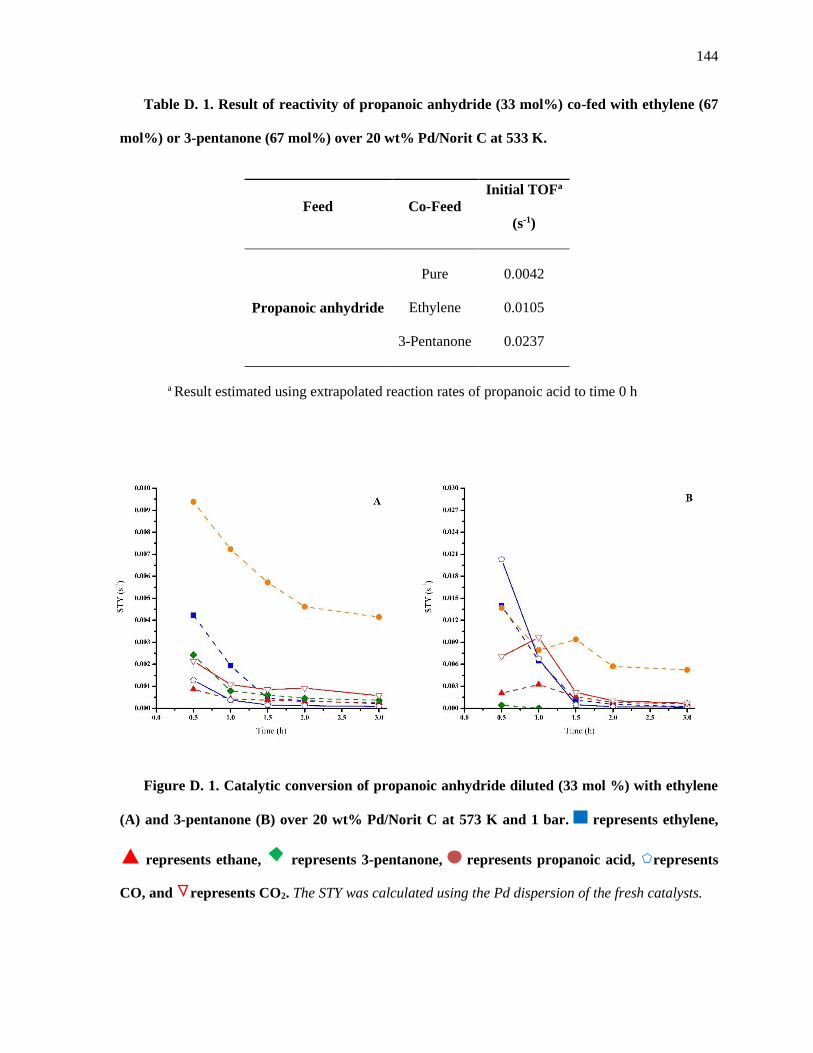
144
Table D. 1. Result of reactivity of propanoic anhydride (33 mol%) co-fed with ethylene (67
mol%) or 3-pentanone (67 mol%) over 20 wt% Pd/Norit C at 533 K.
Feed Co-Feed
Initial TOFa
(s-1)
Propanoic anhydride
Pure 0.0042
Ethylene
3-Pentanone
0.0105
0.0237
a Result estimated using extrapolated reaction rates of propanoic acid to time 0 h
Figure D. 1. Catalytic conversion of propanoic anhydride diluted (33 mol %) with ethylene
(A) and 3-pentanone (B) over 20 wt% Pd/Norit C at 573 K and 1 bar. represents ethylene,
represents ethane, represents 3-pentanone, represents propanoic acid, represents
CO, and represents CO2. The STY was calculated using the Pd dispersion of the fresh catalysts.

145
Scheme D. 1. Formation of 3-pentanone through a coupling reaction of propanyl and ethylene.
Figure D.1 reveals that the catalyst still showed severe deactivation during the initial 3 h of reactions.
If 3-pentanone or ethylene were responsible for catalyst deactivation, we would have observed a low
activity from the very beginning of the experiment. This suggests that products such as 3-pentanone and
ethylene are not responsible for the initial catalyst deactivation. Furthermore, we observed an increase in
production of 3-pentanone when ethylene was co-fed. This supports the idea that 3-pentanone is formed
by a coupling reaction of a propanyl intermediate absorbed on the surface, as suggested by DFT, and
ethylene (Scheme D.1).
When 3-pentanone was co-fed with PAn, the production of propanoic acid and ethane increased with
respect feeding pure PAn. As shown in Scheme D.2, propanoic acid could be formed as a result of the
dimerization of 3-pentanone followed by thermal cracking. The ethane could be a result of the further
cracking of the dimer.
Scheme D. 2. Formation of propanoic acid through the dimerization of 3-pentanone. R’
represents CH2-CH3 and R’’ represents CH3.
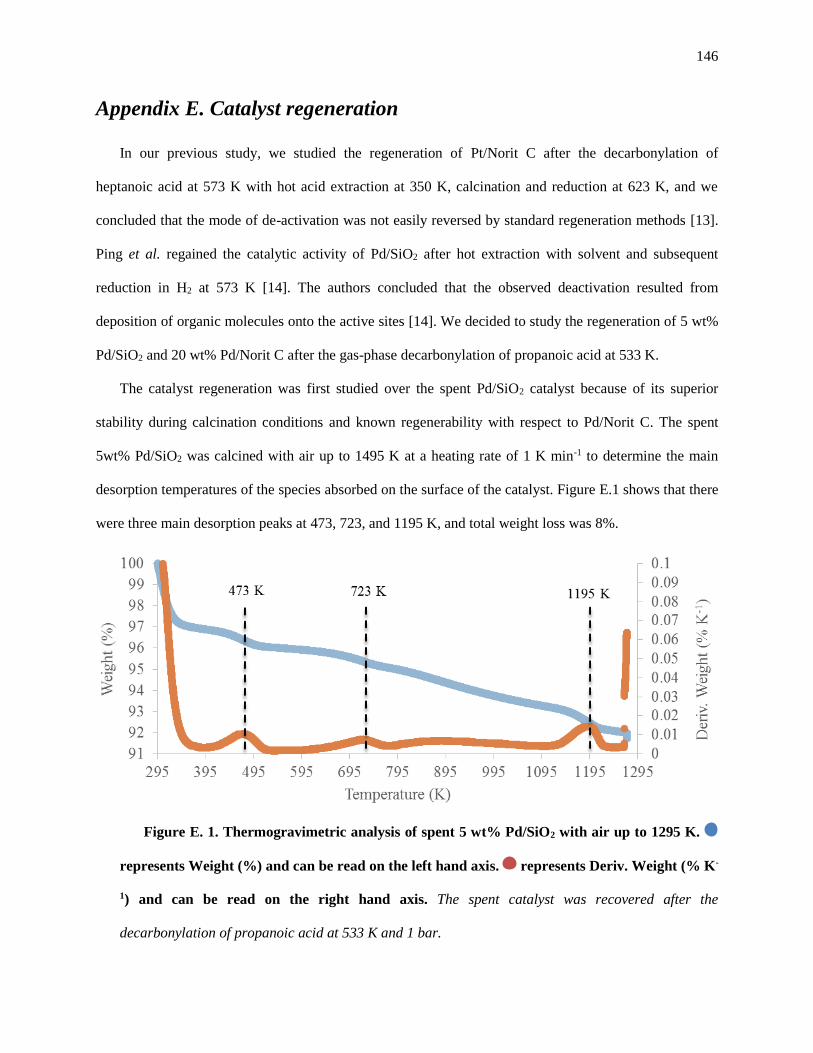
146
Appendix E. Catalyst regeneration
In our previous study, we studied the regeneration of Pt/Norit C after the decarbonylation of
heptanoic acid at 573 K with hot acid extraction at 350 K, calcination and reduction at 623 K, and we
concluded that the mode of de-activation was not easily reversed by standard regeneration methods [13].
Ping et al. regained the catalytic activity of Pd/SiO2 after hot extraction with solvent and subsequent
reduction in H2 at 573 K [14]. The authors concluded that the observed deactivation resulted from
deposition of organic molecules onto the active sites [14]. We decided to study the regeneration of 5 wt%
Pd/SiO2 and 20 wt% Pd/Norit C after the gas-phase decarbonylation of propanoic acid at 533 K.
The catalyst regeneration was first studied over the spent Pd/SiO2 catalyst because of its superior
stability during calcination conditions and known regenerability with respect to Pd/Norit C. The spent
5wt% Pd/SiO2 was calcined with air up to 1495 K at a heating rate of 1 K min-1 to determine the main
desorption temperatures of the species absorbed on the surface of the catalyst. Figure E.1 shows that there
were three main desorption peaks at 473, 723, and 1195 K, and total weight loss was 8%.
Figure E. 1. Thermogravimetric analysis of spent 5 wt% Pd/SiO2 with air up to 1295 K.
represents Weight (%) and can be read on the left hand axis. represents Deriv. Weight (% K-
1) and can be read on the right hand axis. The spent catalyst was recovered after the
decarbonylation of propanoic acid at 533 K and 1 bar.
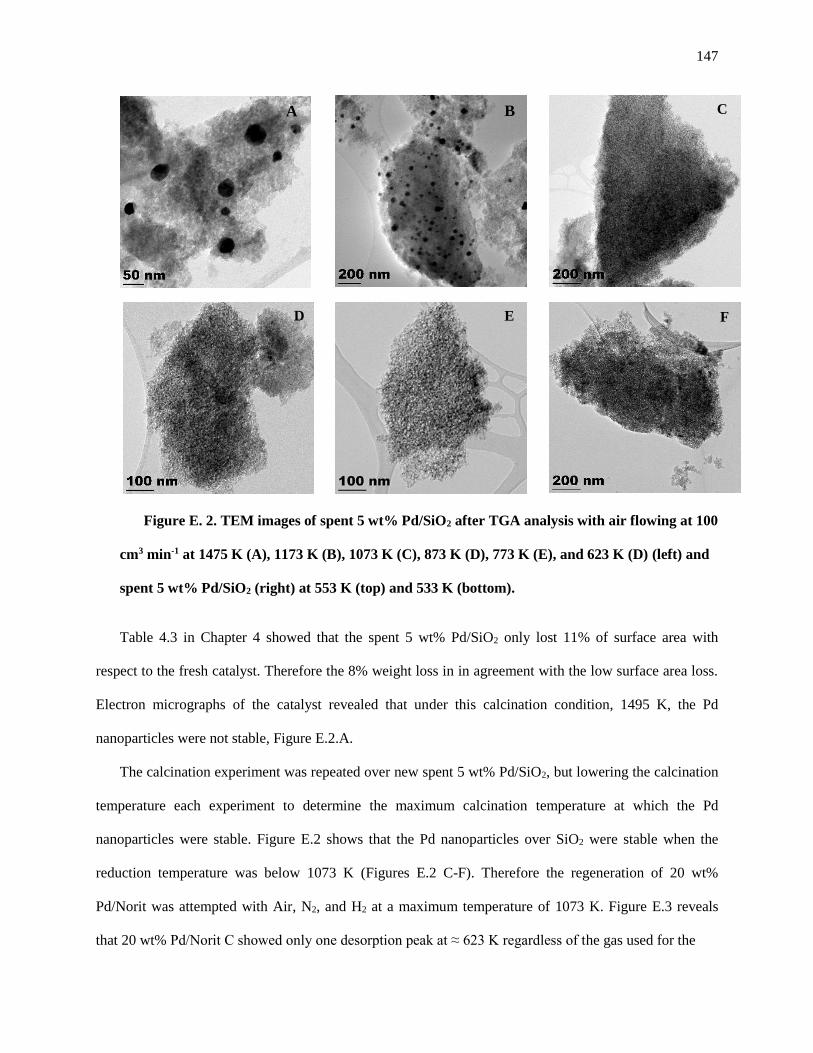
147
Figure E. 2. TEM images of spent 5 wt% Pd/SiO2 after TGA analysis with air flowing at 100
cm3 min-1 at 1475 K (A), 1173 K (B), 1073 K (C), 873 K (D), 773 K (E), and 623 K (D) (left) and
spent 5 wt% Pd/SiO2 (right) at 553 K (top) and 533 K (bottom).
Table 4.3 in Chapter 4 showed that the spent 5 wt% Pd/SiO2 only lost 11% of surface area with
respect to the fresh catalyst. Therefore the 8% weight loss in in agreement with the low surface area loss.
Electron micrographs of the catalyst revealed that under this calcination condition, 1495 K, the Pd
nanoparticles were not stable, Figure E.2.A.
The calcination experiment was repeated over new spent 5 wt% Pd/SiO2, but lowering the calcination
temperature each experiment to determine the maximum calcination temperature at which the Pd
nanoparticles were stable. Figure E.2 shows that the Pd nanoparticles over SiO2 were stable when the
reduction temperature was below 1073 K (Figures E.2 C-F). Therefore the regeneration of 20 wt%
Pd/Norit was attempted with Air, N2, and H2 at a maximum temperature of 1073 K. Figure E.3 reveals
that 20 wt% Pd/Norit C showed only one desorption peak at ≈ 623 K regardless of the gas used for the
A B C
D E F
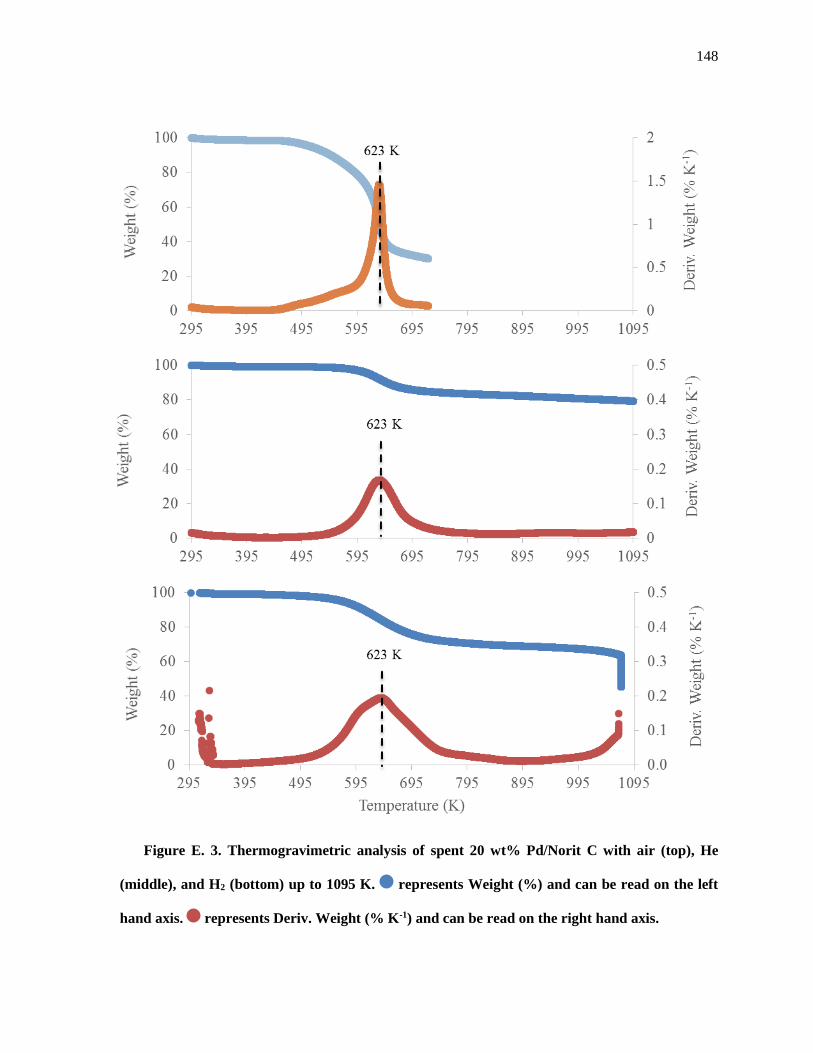
148
Figure E. 3. Thermogravimetric analysis of spent 20 wt% Pd/Norit C with air (top), He
(middle), and H2 (bottom) up to 1095 K. represents Weight (%) and can be read on the left
hand axis. represents Deriv. Weight (% K-1) and can be read on the right hand axis.

149
regeneration treatment, however, the weight loss strongly depended on the gas used. When Air was used,
the weight loss of 20 wt% Pd/Norit was ≈ 60%. However, when N2 or H2 were used, the weight loss was
20 and 30%, respectively. Table 4.3 in Chapter 4 showed that the spent 20 wt% Pd/Norit C only lost ≈
15% of surface area with respect to the fresh catalyst. Therefore the ≈ 60% weight loss suggests that Air
treatment could be oxidizing the carbon support as well as the organic molecules absorbed on the surface
of the catalyst. However, the 15% surface area loss is more in agreement with the weight loss observed
with the N2 and H2 treatment. Figure E.4 shows that Pd nanoparticles were stable after both treatments at
623 K.
The catalyst was then in situ regenerated, as described in the Experimental Methods section, at 623 K
after the conversion of PAn at 533 K and 1 bar over 20 wt% Pd/Norit C using two different treatments.
One treatment used N2 during the reactor heating step, and H2 during the reduction step, whereas the other
method used H2 during the heating and reduction steps. The results are summarized in Table E.1 and
shows that both regeneration methods successfully recovered the catalytic performance of 20 wt%
Pd/Norit C. This suggests that the main cause for catalyst deactivation was deposition of organic
molecules onto the active sites just like reported by Ping et al. [15].
Figure E. 4. TEM images of 20 wt% Pd/Norit C after regeneration at 623 K with and N2
plus H2 treatment (A) and H2 treatment (B).
A B
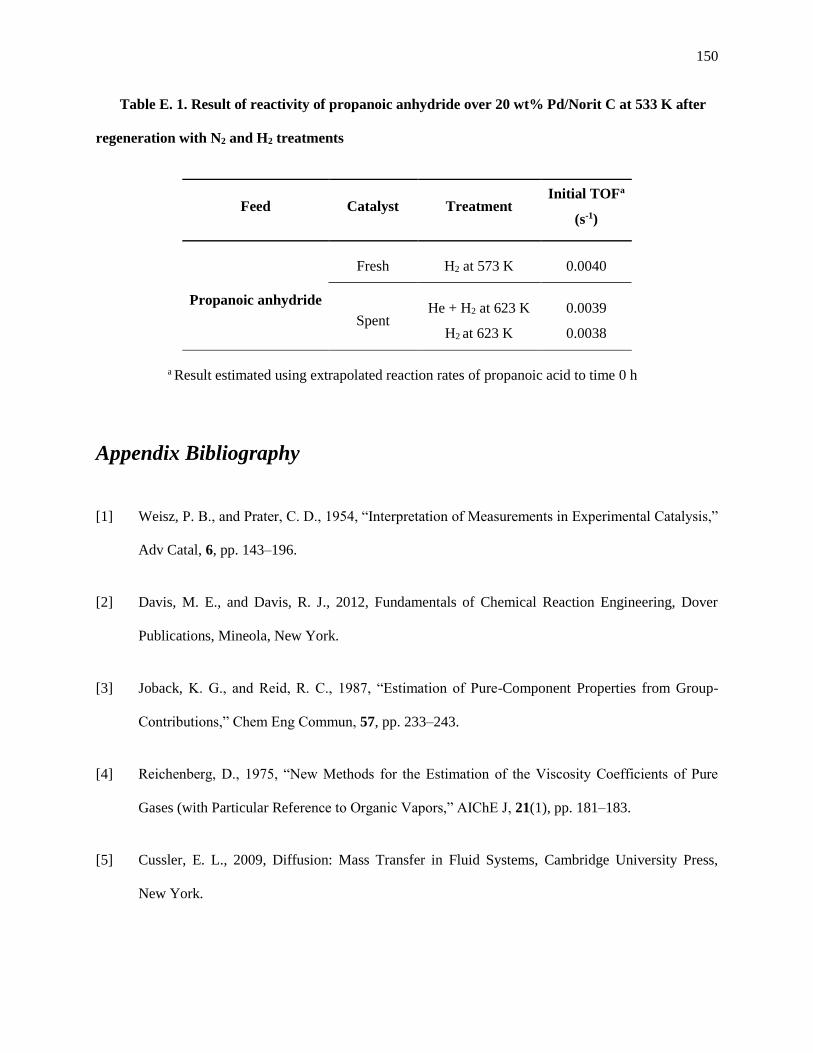
150
Table E. 1. Result of reactivity of propanoic anhydride over 20 wt% Pd/Norit C at 533 K after
regeneration with N2 and H2 treatments
Feed Catalyst Treatment Initial TOFa
(s-1)
Propanoic anhydride
Fresh H2 at 573 K 0.0040
Spent He + H2 at 623 K 0.0039
H2 at 623 K 0.0038
a Result estimated using extrapolated reaction rates of propanoic acid to time 0 h
Appendix Bibliography
[1] Weisz, P. B., and Prater, C. D., 1954, “Interpretation of Measurements in Experimental Catalysis,”
Adv Catal, 6, pp. 143–196.
[2] Davis, M. E., and Davis, R. J., 2012, Fundamentals of Chemical Reaction Engineering, Dover
Publications, Mineola, New York.
[3] Joback, K. G., and Reid, R. C., 1987, “Estimation of Pure-Component Properties from Group-
Contributions,” Chem Eng Commun, 57, pp. 233–243.
[4] Reichenberg, D., 1975, “New Methods for the Estimation of the Viscosity Coefficients of Pure
Gases (with Particular Reference to Organic Vapors,” AIChE J, 21(1), pp. 181–183.
[5] Cussler, E. L., 2009, Diffusion: Mass Transfer in Fluid Systems, Cambridge University Press,
New York.
151
[6] Maki-Arvela, P., Snåre, M., Eranen, K., Myllyoja, J., and Murzin, D. Y., 2008, “Continuous
decarboxylation of lauric acid over Pd/C catalyst,” Fuel, 87(17-18), pp. 3543–3549.
[7] Lugo-José, Y. K., Monnier, J. R., and Williams, C. T., 2014, “Gas-Phase, Catalytic
Hydrodeoxygenation of Propanoic Acid, Over Supported Group VIII Noble Metals: Metal and
Support Effects,” Appl Catal A-Gen, 469, pp. 410–418.
[8] Immer, J. G., Kelly, M. J., and Lamb, H. H., 2010, “Catalytic reaction pathways in liquid-phase
deoxygenation of C18 free fatty acids,” Appl Catal A-Gen, 375(1), pp. 134–139.
[9] Lestari, S., Maki-Arvela, P., Bernas, H., Simakova, O., Sjoholm, R., Beltramini, J., Lu, G. Q. M.,
Myllyoja, J., Simakova, I., and Murzin, D. Y., 2009, “Catalytic Deoxygenation of Stearic Acid in
a Continuous Reactor over a Mesoporous Carbon-Supported Pd Catalyst,” Energ Fuel, 23(8), pp.
3842–3845.
[10] Maki-Arvela, P., Kubicková, I., Snåre, M., Eranen, K., and Murzin, D. Y., 2007, “Catalytic
Deoxygenation of Fatty Acids and Their Derivatives,” Energ Fuel, 21(1), pp. 30–41.
[11] Snåre, M., Kubicková, I., Maki-Arvela, P., Chichova, D., Eranen, K., and Murzin, D. Y., 2008,
“Catalytic deoxygenation of unsaturated renewable feedstocks for production of diesel fuel
hydrocarbons,” Fuel, 87(6), pp. 933–945.
[12] Simakova, I., Rozmysłowicz, B., Simakova, O. A., Maki-Arvela, P., Simakov, A., and Murzin, D.
Y., 2011, “Catalytic Deoxygenation of C18 Fatty Acids Over Mesoporous Pd / C Catalyst for
Synthesis of Biofuels,” Top Catal, 54(8-9), pp. 460–466.
[13] Lopez-Ruiz, J. A., and Davis, R. J., 2014, “Decarbonylation of heptanoic acid over carbon-
supported platinum nanoparticles,” Green Chem, 16(2), pp. 683–694.
152
[14] Ping, E. W., Pierson, J., Wallace, R., Miller, J. T., Fuller, T. F., and Jones, C. W., 2011, “On the
nature of the deactivation of supported palladium nanoparticle catalysts in the decarboxylation of
fatty acids,” Appl Catal A-Gen, 396(1-2), pp. 85–90.
[15] Ping, E. W., Wallace, R., Pierson, J., Fuller, T. F., and Jones, C. W., 2010, “Highly dispersed
palladium nanoparticles on ultra-porous silica mesocellular foam for the catalytic decarboxylation
of stearic acid,” Micropor Mesopor Mat, 132(1-2), pp. 174–180.