Embed Size (px)
Citation preview

Homesof todayfor tomorrowDecarbonising Welsh Housing between 2020 and 2050
STAGE 2: Exploring the potential of the Welsh housing stock to meet 2050 decarbonisation targets
Ed Green, Simon Lannon, Jo Patterson, Heledd Iorwerth
Welsh School of Architecture, Cardiff University
Issue: 18.07.2019

1
Homes of Today for Tomorrow STAGE 2:
Exploring the potential of the Welsh housing stock to meet 2050 decarbonisation targets
1. executive summary
This piece of work was the second ‘stage’ of research in support of Welsh Government’s Housing Decarbonisation programme. For the Stage 1 scoping review see hyperlink: http://orca.cf.ac.uk/115442/
The primary aim of this study was to understand the degree to which the nature of the existing Welsh housing stock could inform the development of a pathway to decarbonisation, while also giving due consideration to energy costs and affordable warmth.
Fourteen recurrent dwelling ‘types’ were used to explore the effect of key retrofit actions upon the Welsh housing stock, by modelling each dwelling type in 1990, in 2018 and in 2050. The impact of key retrofit actions is explained in terms of capital cost, carbon emissions, ongoing energy costs and overheating. Capital costs are also compared with likely ongoing maintenance costs. Consideration was also given to changes in the energy supply network, because of the current uncertainty around decarbonisation of energy supply, and the impact this could have on decision making.
If targets for decarbonisation are to go beyond 80%, in line with the CCC's recent directive that Wales should target a 95% reduction in carbon emissions by 2050 relative to 1990 levels, this reinforces the importance of aspiring to net zero carbon throughout the existing housing stock. Key recommendations are that:
UK Government must be lobbied to ensure that energy supplied by the national grid exceeds 60% clean energy by 2050.
This will inevitably increase the cost of energy. Action must be taken to protect vulnerable households, to ensure that a further consequence is not an increase in fuel poverty.
There should be no distinction between performance standards for retrofit and newbuild. Similarly, there should be no distinction between standards based on tenure or housing type.
Some houses have constraints around retrofit, mostly related to character and historic features. However the justification for ‘acceptable fails’ must be carefully defined so as not to jeopardise decarbonisation targets.
All other housing must be retrofitted beyond SAP90, to achieve an EPC A rating. Retrofit must overcome the performance gap (ie. the results should be measured as
delivered, not as predicted). Retrofit standards are easier to enforce for social housing and the PRS sectors. Work
must be undertaken exploring how to initiate this level of retrofit in the owner occupied sector.
A flexible approach that pushes all housing to achieve appropriate performance standards by 2050 is the only way to anticipate achieving 90%+ decarbonisation under assumed energy supply scenarios.

2
Homes of Today for Tomorrow STAGE 2:
Exploring the potential of the Welsh housing stock to meet 2050 decarbonisation targets
2. contents
page
1. executive summary 1
2. contents 2
3. introduction 3
4. methodology 4
5. findings 8
6. recommendations 14
appendix A: datasheets
appendix B: WFGA mapping
appendix C: assumptions
This work was funded by Welsh Government’s Homes and Places division. The full Stage 1 report can be downloaded at http://orca.cf.ac.uk/115442/
To cite the report: Green, E. Lannon , S. Patterson, J. and Iorwerth, H. (2019). Homes of Today for Tomorrow STAGE 2: Exploring the potential of the Welsh housing stock to meet 2050 decarbonisation targets. Cardiff: Cardiff University.

3
Homes of Today for Tomorrow STAGE 2:
Exploring the potential of the Welsh housing stock to meet 2050 decarbonisation targets
3. introduction
This piece of work was conceived as the second ‘stage’ of research in support of Welsh Government’s Housing Decarbonisation programme. It built on the learning collected within the previously completed Stage 1 scoping review (ref. Green, Lannon, Patterson and Variale: Homes of Today for Tomorrow - stage 1 report, 2018 hyperlink: http://orca.cf.ac.uk/115442/).
The primary aim of this study was to understand the degree to which the nature* of the existing Welsh housing stock could / should inform the development of a pathway to decarbonisation, while also giving due consideration to energy costs and affordable warmth.
A representative taxonomy of recurring dwelling ‘types’ was developed for the Welsh housing stock, using multiple data sources. These types were then used to explore the effect of key retrofit actions upon the Welsh housing stock, drawn from the Stage 1 work, by modelling each dwelling type in 1990, in 2018 and in 2050. The impact of these retrofit actions is explained in terms of capital cost, carbon emissions, ongoing energy costs and overheating. Capital costs are also compared with likely ongoing maintenance costs. Consideration was also given to changes in the energy supply network, because of the current uncertainty around further decarbonisation of energy supply, and the impact this could have on decision making.
Findings are observed in relation to the degree to which different levels of retrofit could deliver decarbonisation across the Welsh housing stock as a whole. Findings establish the degree to which key metrics such as dwelling type and physical characteristics influence both the retrofit strategy adopted and its effectiveness, and highlight other influential factors – notably tenure, character and primary energy source.
Recommendations are made in terms of the level of retrofit likely to be needed, to meet targets for decarbonisation by 2050 while also giving due consideration to affordable warmth. Links are established between the nature* of the existing housing stock and reasonable targets for retrofit. These recommendations are intended to inform decision making around an appropriate pathway for decarbonisation of the Welsh housing stock.
*The nature of the existing housing stock is deemed to include dwelling type, tenure, physical characteristics, age and condition (including pre-existing retrofit actions).

4
Homes of Today for Tomorrow STAGE 2:
Exploring the potential of the Welsh housing stock to meet 2050 decarbonisation targets
4. Methodology
The Stage 2 work consisted of the following interlinked exercises:
4.1 Developing a taxonomy of ‘types’ to represent the Welsh housing stock.
4.2 Modelling how each dwelling type performs.
4.3 Comparing the modelling results to identify trends and inconsistencies.
4.4 Exploring the impact of cleaner energy supply on decarbonisation.
4.5 Making recommendations regarding pathways to decarbonisation.
4.1 Developing a taxonomy of ‘types’ to represent the Welsh housing stock
This represented a considerable challenge for the project team. The taxonomy of types needed to be broad enough to provide confidence in findings, but sufficiently constrained that results are legible. Individual dwelling ‘types’ needed to be sufficiently detailed to allow modelling using SAP, but sufficiently simplified that they capture a range of dwellings rather than a specific single dwelling. Two data sets were used to create the taxonomy of dwelling types. A large, low level detail dataset from the Valuation Office Agency (VOA) was combined with a smaller, high detail dataset from the Welsh Housing Condition Survey (WHCS), related to circa 2,500 dwellings within the Welsh housing stock (collected 2016-2018). From this work, a taxonomy of the existing housing stock was produced, composed of representative dwelling ‘types’, supported by an understanding of the relative proportion of each type as outlined below:
HOUSEEnd terrace
HOUSEMid terrace
HOUSESemi-
HOUSEDetached
FLAT (Purpose blt) Total
pre 1919 type 1, 3% type 2, 9% type 3, 4% type 4, 7% 23%
1919- 1944 type 5, 5% 5%
1945- 1964 type 6, 10% 10%
1965 - 1990 type 7, 4% type 8, 6% type 9, 10% type 10, 9% type 11, 4% 33%
Post 1990 type 12, 5% type 13, 7% type 14, 1% 13%
Total 7% 15% 34% 23% 5% 84%

5
In addition to the physical characteristics underpinning each ‘type’ (which are considered to be constant over time), further information was needed to model the condition of each dwelling ‘type’ at three points in time – in 1990, in 2018 and in 2050. The data needed to develop these three distinct models came from three sources:
Historic data for the 1990 ‘baseline’ condition came from the Housing Fact File database. Data for the current condition (2016) came from the EPC data for Wales (2016), which represents circa 60% of the total Welsh housing stock (collected over a 9 year period). See Appendix B for details of assumptions made for 1990 and 2018 models.
To develop a model for 2050, four retrofit narratives were developed. Each narrative was designed to represent a viable approach for part, or all, of the Welsh housing stock, and includes a specification detailing the level of retrofit.
The four retrofit narratives can be described as follows:
good practice Within this narrative, actions are driven by best value – in terms of affordability, cost effectiveness, and availability of the necessary skills and resources in the current marketplace. Indicative SAP rating of 88.
best practice This narrative assumes an aspirational client or owner occupier, likely to be more concerned with long term quality than short term cost. Environmental impact is a priority. Indicative SAP rating of 90.
heritage Under this narrative, actions are constrained, e.g. as a result of listed building status or within a conservation area. Impact on exterior appearance is assumed to be problematic. Indicative SAP rating of 71.
rural For this narrative, geographic location is assumed to dictate off-grid energy solutions. As a result the focus is on energy conservation and use of locally viable renewables. Indicative SAP rating of 90.
A taxonomy of 14 dwelling types
VOA stock profile
WHCS 2018
Housing fact file data+EPC database 2016 2018
model
+2050 retrofit narratives 2050
model
+
1990 model
2018 model
2050 model

6
4.2 Modelling the retrofit of each dwelling type
The digital models developed for each dwelling ‘type’ (see 4.1) were used to explore how the performance of the dwellings might change over time: from 1990 to 2018 and on to 2050.
To translate retrofit actions explored within the Stage 1 scoping report into the 2050 models, a retrofit specification was developed for each narrative. See Appendix C for details. The fourteen dwelling models were then used to evaluate the impact of the retrofit described by each narrative, by comparing the performance of each dwelling as it was in 1990, as it currently performs, and as it might perform in 2050, based on the retrofit actions contained within each of the four narratives.
The retrofit of each of the fourteen dwelling types was explored in terms of capital costs, and its impact on energy demand, fuel costs, and carbon emissions. Overheating was also investigated.
The capital cost data associated with each retrofit action were provided by cost consultant Lee Wakemans. Predicted costs are based on current cost data and recent, relevant case studies. Some costs are assumed to vary with dwelling size, and others are assumed to be static. These cost assumptions are outlined in appendix C.
The modelling techniques used in this report are based on the Government’s Standard Assessment Procedure for Energy Rating of Dwellings (SAP). The models predict the energy required for space heating, water heating, lighting and contributions from renewable technologies. This energy requirement is then used to predict the fuel (primary energy) cost and associated carbon emissions. A Microsoft Excel spreadsheet model of the SAP 2012 9.92 worksheet has been developed by the WSA and tested against approved software (Stroma FSAP 2012). This version of the SAP model allows for different fuel costs and emissions rates, which is critical to understanding the differences between the 1990, 2020 and 2050 narratives, and the three energy supply scenarios. The energy cost and emissions rate assumptions are also listed in appendix C.
4.3 Exploring the impact of cleaner energy supply
To date, emissions from the housing sector are estimated to have reduced by more than 40% from baseline 1990 levels. Three quarters of this improvement comes from cleaner primary energy supply (from changes to the mains gas and mains electricity grid) rather than changes to the housing stock itself.
The degree to which energy supply continues to decarbonise will significantly affect decarbonisation of the housing stock, and could influence the selection and effectiveness of dwelling-based retrofit actions. For this reason, it was deemed necessary to consider decarbonisation of energy supply within this piece of work.
Three distinct energy supply scenarios were allowed to influence the models, to explore the impact of potential future changes to energy supply on decarbonisation of the existing housing stock, as follows:
Scenario 1 – minor future improvements to the national grid (40% clean energy supply)
Scenario 2 – significant future improvements to the national grid (60% clean energy supply)
Scenario 3 – transformational change to the national grid (80% clean energy supply).

7
4.4 Understanding decarbonisation of the housing stock as a whole
By combining the results arising from each individual dwelling type in their representative proportions, it was possible to illustrate the degree to which potential modifications to the Welsh housing stock could achieve carbon emission reductions, along with associated impacts on energy use and capital cost.
In order to recombine the results of the fourteen dwelling models into a single Welsh housing stock model, it was necessary to make assumptions around the standard of retrofit that would be undertaken. These assumptions draw from the results of the individual dwelling models, and are explained in section 5: Findings.
The results of this work enabled a discussion around realistic limits to the level of decarbonisation we can anticipate achieving. This discussion also explored the significance of each of the three energy supply scenarios in informing the development of a route map towards decarbonisation, in the context of uncertainty around future changes to clean energy supply.
4.5 Making recommendations regarding pathways to decarbonisation
Two summary sheets record the results of the modelling and associated cost calculations for each dwelling type – one for energy supply scenario 1 and another for energy supply scenario 2. These sheets are contained in Appendix A. Energy supply scenario 3 was not modelled in detail because this level of improvement in clean energy supply would obviate the need for physical retrofit to decarbonise the housing stock.
Results were then compared across the fourteen housing types, to identify trends and inconsistencies. Key findings are discussed in Section 5.
The understanding that was gained around the size and shape of the housing stock, combined with the findings that came from the modelling process, enabled us to make recommendations regarding possible pathways to decarbonisation. In particular, key identifying characteristics of the housing stock – character, tenure and location – were used to establish reasonable limits to decarbonisation, in the context of anticipated changes to clean energy supply. These recommendations are described in Section 6.

8
Homes of Today for Tomorrow STAGE 2:
Exploring the potential of the Welsh housing stock to meet 2050 decarbonisation targets
5. Findings
5.1 Energy supply
The three energy supply scenarios deliver very different results in terms of the overall impact of retrofit actions on carbon emissions for each dwelling type. However, the results are generally consistent across the fourteen different dwelling types, as follows:
Under scenario 1 (minor further improvements in clean energy supply) ‘best practice’ and ‘rural’ narratives deliver in excess of 80% carbon savings, whereas the ‘good practice’ narrative typically delivers around 70% carbon reduction and the ‘heritage’ narrative often delivers only 60% carbon reduction.
Under scenario 2 (significant further improvements in clean energy supply) ‘best practice’ and ‘rural’ narratives consistently deliver in excess of 80% carbon savings. ‘Good practice’ and ‘heritage’ narratives deliver around 80% carbon reduction. These approaches are therefore viable only if the entire occupied housing stock is improved to the same standard, and leave no tolerance for poorly performing or harder-to-reach stock.
Under Scenario 3 (transformational change) more than 80% carbon savings result from changes to energy supply alone. This leaves limited scope for discussion of further impact of dwelling-based retrofit actions. However, such changes to energy supply are not under the control of WG and go beyond the expectations of some experts, certainly in the short to medium term. For these reasons, scenario 3 is not explored at the level of individual dwelling types.
These results are combined in the diagrams overleaf, to assess the impact of these different clean energy supply scenarios on decarbonisation of the housing stock as a whole. As can be seen, the impact of changes to energy supply on the decarbonisation of the housing stock is considerable:
Under scenario 1 (minor further improvements in clean energy supply) it is not currently tenable for the existing housing stock to achieve greater than 90% decarbonisation using established retrofit good practice.
Under scenario 2 (significant further improvements in clean energy supply) 90% decarbonisation is only achieved when the existing housing stock is retrofitted beyond current Building Regulations, with a transition to electricity as a source of heat.
UK Government must therefore be lobbied to ensure that energy supplied by the national grid exceeds 60% clean energy by 2050.
Under Scenario 3 (transformational change) decarbonisation is achieved through improvements in energy supply and services alone. In this context, the significance of retrofit of the existing housing stock relates less to decarbonisation targets and more to the need to avoid increases in fuel bills for occupants, and a consequent increase in fuel poverty.

9
Figure 5.1 and 5.2: The impact of three energy supply scenarios on decarbonisation
Blue scenario – transformative further improvement (80% clean energy from grid) Yellow scenario – significant further improvement (60% clean energy from grid) Red scenario – minor further improvement (40% clean energy from grid)
Figure 5.1: 10% of the housing stock is assumed to have limited retrofit. Social housing and PRS sectors are retrofitted beyond current Building Reg.s and transition to heat from electricity (not gas), along with 10% in fuel poverty. The remaining 30% (owner occupied) are retrofitted to current Building Reg.s only, and remain on mains gas.
Figure 5.2: 10% of the housing stock is assumed to have limited retrofit. The remaining 90% is all retrofitted beyond current Building Regulations, and transitions to heat from electricity (not gas).

10
5.2 Retrofit actions and individual dwellings
Building on the work conducted for the Stage 1 scoping review, there is considerable scope to develop appropriate retrofit strategies for the housing stock by employing actions that are well understood, and skills and products that are widely available.
Retrofit actions affecting dwelling fabric are best understood, as the effectiveness of renewables and systems-based actions is more influenced by innovation and emerging technologies. People represent the least understood aspect of retrofit, and introduce the greatest levels of uncertainty around effectiveness, making future work around lifestyle choices and behaviour change particularly important.
The physical size and shape of a dwelling are not necessarily factors that change the approach taken to retrofit, apart from purpose built flats which are prone to overheating (see 5.4) and require a different approach. However, the physical size and shape of a dwelling do have considerable impact on capital cost and energy costs (see 5.6 – 5.8).
The selection of ‘appropriate’ retrofit actions is most likely to be informed by the current condition and character of the dwelling (and surrounding neighbourhood), by any retrofit actions that have previously been undertaken, and to a certain extent by the personal choice of the occupant / owner.
5.3 Retrofit narratives and the housing stock
The more effective retrofit narratives demand actions that will be difficult or prohibitively expensive to deliver in some dwellings. However, there is scope to establish targets that allow for differences within the housing stock, while prescribing an overall standard of retrofit that achieves the level of decarbonisation deemed necessary, subject to improvements in energy supplied by the national grid. These standards were explored using the retrofit narratives:
Rural Narrative: 15% of the housing stock are currently thought to be off-gas, most of which are in isolated locations. This narrative demands improvement of dwelling fabric beyond current (new-build) Building Regulations, and a focus on heat from renewable, off grid energy (electricity) – achieving a notional SAP rating of 90.
Heritage Narrative: based on a minimum standard for dwellings built before 1919. This might be applicable to 20% of the housing stock, based on 60% of the 32% of dwellings built pre-1919. While the resulting reduction in carbon emissions would not meet decarbonisation targets, carbon reduction can still be achieved without impacting unduly on historic character and such work would help to reduce increased fuel costs and consequently fuel poverty. Dwellings built before 1919 whose exterior appearance does not contribute to a locally distinctive character should be taken beyond this standard, which achieves a SAP rating of 71.
‘Good practice’ narrative: based on Building Regulations compliance, with continued reliance on mains gas wet central heating, this might be seen as a softer option for the housing sector, particularly for reluctant owner occupiers. Achieves a SAP rating of 88.
‘Best practice’ narrative: based on best practice retrofit this establishes a tenable but challenging limit for much of the housing stock. Fabric is upgraded beyond current Building Regulations, and the primary energy source transitions from mains gas to mains electricity. Achieves a SAP rating of 90.

11
To model the housing stock as a whole in 2050, it was assumed that 15% of homes must be retrofitted to the ‘heritage’ standard, and 10% of homes must be retrofitted to the ‘rural’ narrative. It was assumed that the social housing and private rented sectors (30% of the housing stock, with clear mechanisms for implementing retrofit) are retrofitted to ‘best practice’. It was assumed that a further 15% of the housing stock, deemed to be in fuel poverty and outside of the other groupings, are also targeted for retrofit to this standard, to mitigate against the real risk that decarbonisation can increase fuel poverty.
The remaining 30% of the housing stock is likely to be made up of owner occupied homes. They will need to be improved to a standard between ‘good practice’ and ‘best practice’, depending on the level of improvement made in clean energy supply and the level of decarbonisation needed.
5.4 Decarbonisation
As identified in section 5.1 (energy supply), it is critical that that energy supplied by the national grid exceeds 60% clean energy by 2050. In our modelling, this context is represented by Scenario 2.
Within scenario 2, the narratives that exceed Building Regulations and transition from mains gas energy to electrical sources of heat (i.e. the best practice and rural narratives) consistently deliver 90% - 95% carbon savings. This equates to exceeding a SAP rating of 90, or achieving an EPC A rating.
Within scenario 2, ‘good practice’ and ‘heritage’ narratives deliver around 80% carbon savings, constraining the level of decarbonisation that can realistically be achieved.
In the context of 60% clean energy supply, 95% decarbonisation of the housing stock is tenable, but requires retrofit that goes beyond current building regulations (SAP90) throughout the housing stock. This is best represented by achieving an EPC A rating.
It will be necessary for some of the housing stock to achieve net zero carbon, to offset the (typically historic) stock that cannot be retrofitted to meet these standards.
5.4 Overheating
Following implementation of the four retrofit narratives, the majority of the housing stock (circa 86%) experience an acceptable risk of overheating (a slight to medium risk, during peak summer months only).
7% of the housing stock (mid terraced dwellings built 1965-1990) experience an elevated risk of overheating for best practice and rural narratives. This risk would need to be ameliorated, for example through improved ventilation or cooling.
7% of the housing stock (representing flats built post 1965) experience untenable levels of overheating (severe risk throughout peak summer months). This overheating would need to be dealt with through adoption of an appropriate retrofit strategy, such as electric heating / cooling via a heat pump or air conditioning package.

12
5.5 Capital costs
Capital costs are reasonably stable for most of the actions included in the four retrofit narratives. However, the detailed specification of individual retrofit actions can have a considerable impact on cost – particularly decisions around the use of materials or products that are ethically sourced, environmentally sustainable or have related health benefits.
Capital costs are consistently lowest for older mid terraced properties and approximately doubled for older detached dwellings – the difference being a product of overall size and proportion of external envelope. Costs for the four narratives fall within the following ranges:
Good practice narrative £17k to £32k
Best practice narrative £33.5k to £63.3k
Heritage narrative £10.8k to £25.5k
Rural narrative £39.4k to £66.8k
Anticipated maintenance and repairs across 30 years fall in the range £11.1k to £19.8k.
Capital costs in the models assume retrofits are coordinated by the homeowner. Involvement of a contractor is likely to add circa 15% to costs. However, by delivering retrofit in packages of around 50 dwellings or more, these costs could be offset by economies of scale.
5.6 Payback periods
Payback period can be a useful outcome to consider the feasibility of the pathways. The payback when considering the capital costs as additional costs to the home owner the pay back periods for scenario 1 are:
Good practice narrative average of 33 years (26 to 42 years)
Best practice narrative average of 62 years (43 to 91 years)
Heritage narrative average of 56 years (31 to 76 years)
Rural narrative average of 39 years (17 to 69 years)
If the expected maintenance that will occur during the next thirty years is considered, the payback becomes more reasonable
Good practice narrative average of 13 years (8 to 16 years)
Best practice narrative average of 42 years (27 to 61 years)
Heritage narrative average of 6 years (0 to 13 years)
Rural narrative average of 28 years (12 to 47 years)
The payback periods for Scenario 2 (which assumes an increase of 50% in energy tariff) are slightly higher for all narratives apart from heritage which cannot payback as the costs for the energy used are mostly higher than those at current levels.

13
5.7 Energy costs
The rural narrative tends to predict very high current energy costs, around double that of the other three narratives, when heating systems are assumed to be Economy 7 electric storage heaters.
For the ‘good practice’, ‘best practice’ and ‘heritage’ narratives, energy costs are predicted to rise by between 30% and 50% when only systems-based retrofits are employed. The increase in energy costs for the best practice narrative are as follows:
Scenario 1 (assumes no increase in energy tariff) average increase 47% (26% to 59%)
Scenario 2 (assumes a 50% increase in energy tariff) average increase 120% (89 to 138%)
It is therefore reasonable to suppose that strategies focussing on cleaner energy supply and systems retrofit alone will impact negatively on domestic energy bills in the short to medium term.
When the holistic retrofit strategy is implemented, the percentage reduction of energy cost compared to the current costs for Scenario 1 are as follows:
Good practice narrative average of 33% (14 to 49%)
Best practice narrative average of 29% (20 to 42%)
Heritage narrative average of 71% (58 to 78%)
Rural narrative average of 11% (1 to 28%)
The reduction for Scenario 2 (which assumes an increase of 50% in energy tariff) are slightly higher for all narratives apart from heritage where the costs for the energy used are mostly higher than those at current levels.
In the likely event that the costs associated with cleaner energy supply are passed on to households, there could be considerable increases in householder energy costs, and corresponding increases in fuel poverty.
In this event, the rural narrative would deliver greatest robustness against increases in energy tariffs. For ‘good practice’ and ‘best practice’ narratives, energy costs vary by around 10-20% over a 50% increase in energy tariff. For the heritage narrative, energy costs vary by around 40%-50%. This suggests that a low level of fabric retrofit leaves occupants highly vulnerable to changes in energy tariffs.

14
Homes of Today for Tomorrow STAGE 2:
Exploring the potential of the Welsh housing stock to meet 2050 decarbonisation targets
6. Recommendations
If targets for decarbonisation are to go beyond 80%, in line with the CCC's recent directive that Wales should target a 95% reduction in carbon emissions by 2050 relative to 1990 levels, this reinforces the importance of aspiring to net zero carbon throughout the existing housing stock.
In line with this aspiration, our key recommendations are as follows:
Cleaner primary energy supply from the national grid is an essential part of any decarbonisation route map, and cannot be ignored. UK Government must be lobbied to ensure that energy supplied by the national grid exceeds 60% clean energy by 2050. Smaller scale generation of clean energy at a local or regional level must also be encouraged.
Cleaner primary energy supply will inevitably increase energy tariffs. Action must be taken to reduce household primary energy use, to protect vulnerable households and monitor future trends in fuel poverty, to ensure that a consequence of cleaner primary energy supply is not an acute increase in fuel poverty.
Retrofit strategies that upgrade services must also uplift dwelling fabric to an acceptable standard, to diminish increases in energy costs and fuel poverty
There should be no distinction between performance standards for retrofit and newbuild, which are confusing and divisive. Similarly, there should be no distinction between performance standards based on tenure or housing type.
Some housing stock has constraints around retrofit, notably pre-1919 housing with an established character or identity that would be diminished by extensive retrofit. However the justification for ‘acceptable fails’ must be carefully defined so as not to jeopardise decarbonisation targets
All other housing must be retrofitted beyond SAP90, which equates to current Building Regulations performance standards. The most straightforward way to achieve this is to insist that all housing targets an EPC A rating.
Phased targets for retrofit of the entire housing stock (in line with carbon budgets) may appear to offer stepping stones for decarbonisation. However, for many of the fabric-based actions, retrofit will be more cost effective if only undertaken once. Other options, such as boiler replacement, are likely to be undertaken more than once before 2050. There is a real risk that phased targets will diminish, or obviate, the benefit of work carried out in early phases. In any case, actions that avoid lock-in should be utilised, and economies of scale should be explored.
A more prescriptive performance target risks diminishing opportunities for sensitive retrofit and reducing effectiveness.
To meet stringent decarbonisation targets, retrofit actions must overcome the performance gap (ie. the results should be measured as delivered, not as predicted). A skilled, trained supply chain is needed to ensure that retrofit is appropriately conceived and properly implemented.

15
Retrofit standards are easier to enforce for social housing and the PRS sectors. Work must be undertaken exploring how to initiate this level of retrofit in the owner occupied sector. Point of sale represents a clear opportunity to drive new performance standards.
It is difficult to forecast how the cost of innovation will change over time. (As an example, the cost of an installed photovoltaic system has reduced by 50% over the past 10 years, as a result of improvements in technology, manufacturing and increased sales.) Cost models should include a 5% annual reduction in capital costs for a maximum of 10 years.
With continued innovation in technology, current sustainable renewable energy solutions will be replaced by new ones. Again, the impact on cost is difficult to assess, but we advise that future technologies are costed at current rates for similar solutions and then on the same reducing cost of 5% per annum for 10 years, after which the cycle is assumed to repeat.
The impact of people on retrofit remains the least understood part of the process, and the one most likely to impact (positively or negatively) on the effectiveness of any retrofit strategies. It is essential that users participate in the retrofit process and understand the actions being undertaken, if the anticipated carbon savings are to be realised.
A flexible approach that pushes all housing to achieve appropriate performance standards by 2050 is the only way to anticipate achieving 90%+ decarbonisation under assumed energy supply scenarios.

16
Homes of Today for Tomorrow STAGE 2:
Exploring the potential of the Welsh housing stock to meet 2050 decarbonisation targets
appendix A: datasheets fourteen dwelling types, two scenarios

Dwelling type 1: End terrace pre 1919Scenario 1
No Slight Med High
2018GoodBest
HeritageRural
Jun Jul Aug
Good Practice
Best Practice
Heritage
Rural
£14,600
Overheating Risk
Pre 2018 ← → Post 2018
0%
10%
20%
30%
40%
50%
60%
70%
80%
90%
100%
Redu
ctio
n in
CO
2pr
oduc
tion
agai
nst 1
990
leve
ls
Impact on carbon emissions of four distinct retrofit narratives, each with costed actions
Impact on annual energy cost of four distinct retrofit narratives
Pre 2018 ← → Post 2018
-£41
0 -£11
0
-£36
0
-£20
-£30
-£22
0 -£30
-£30
-£41
0
£540
-£55
0
-£30
-£13
0
-£37
0
-£28
0 -£50
-£40
-£41
0 -£11
0 -£20
-£30
-£24
0 -£10
-£30
£90
£370
-£79
0
-£30
-£70
-£36
0
-£28
0 -£40
-£40
-£2,000
-£1,000
£0
£1,000
£2,000
£3,000
Annu
al E
nerg
y co
st
HistoricalImprovements
CleanerEnergy
CleanerEnenrgy
UpdgradeServices
Addiotion ofRenewables Roof Airtightness Walls Floor WIndows People
DwellingHistoric
SupplyHistoric
SupplyPost 2018
A4Services
A3Renwables
A2Fabric
A5People
DwellingHistoric
SupplyHistoric
SupplyPost 2018
A4Services
A3Renwables
A2Fabric
A5People
HistoricalImprovements
CleanerEnergy
CleanerEnenrgy
UpdgradeServices
Addiotion ofRenewables Roof Airtightness Walls Floor WIndows People
-£800
-£920
-£450
-£1,240
Total reduction in annual energy cost by narrative
Scenario 1 assumesno change in energy costs
£20,700
£39,700
£13,700
£45,400
Total capital cost by narrative
predicted maintenance, repair and improvement costs over a 30 year period
A ra
ted
gas b
oile
r, £5
,100
PV 2
.6kW
p, £
5,00
0
Max
. ins
., £2
,000
Q50
-10
, £1,
000
100m
m e
xt.,
£3,1
00
,
Stan
dard
UPV
C, £
3,40
0
Ther
mos
tat,
£1,1
00Heat
pum
p +U
nder
floor
+ M
VHR,
£15
,500
PV 4
kWp,
£7,
000
Max
. ins
., £2
,000
Q50
-5,
£1,
000
250m
m e
xt.,
£4,2
00
150m
m E
PS, £
2,20
0
Trip
le ti
mbe
r, £6
,700
Smar
t The
rmos
tat,
£1,1
00
A ra
ted
gas b
oile
r, £5
,100
,
Max
. ins
., £2
,000
Q50
-10
, £1,
000
85m
m in
t., £
2,30
0
,
Seco
ndar
y, £
2,20
0
Ther
mos
tat,
£1,1
00Heat
pum
p +U
nder
floor
+ M
VHR,
£15
,500
PV 4
kWp
+ 2m
2 so
l.th
+ 2b
at.,
£16,
000
Max
. ins
., £2
,000
Q50
-10
, £1,
000
250m
m e
xt.,
£4,2
00
150m
m E
PS, £
2,20
0
Stan
dard
UPV
C, £
3,40
0
Ther
mos
tat,
£1,1
00

Dwelling type 1: End terrace pre 1919Scenario 2
No Slight Med High
2018GoodBest
HeritageRural
Jun Jul Aug
Good Practice
Best Practice
Heritage
Rural
£14,600
Overheating Risk
Impact on annual energy cost of four distinct retrofit narratives
Pre 2018 ← → Post 2018
-£41
0
£540
-£16
0
-£54
0
-£30
-£50
-£33
0 -£40
-£50
-£41
0
£540
£850
-£83
0
-£50
-£20
0
-£55
0
-£42
0
-£80
-£60
-£41
0
£540
-£16
0 -£30
-£50
-£36
0
-£20
-£50
£90
£50
£118
0
-£11
80
-£50
-£10
0
-£54
0
-£42
0
-£60
-£60
-£2,000
-£1,000
£0
£1,000
£2,000
£3,000
£4,000
Annu
al E
nerg
y co
st
Pre 2018 ← → Post 2018
0%
10%
20%
30%
40%
50%
60%
70%
80%
90%
100%
Redu
ctio
n in
CO
2pr
oduc
tion
agai
nst 1
990
leve
ls
Impact on carbon emissions of four distinct retrofit narratives, each with costed actions
A ra
ted
gas b
oile
r, £5
,100
PV 2
.6kW
p, £
5,00
0
Max
. ins
., £2
,000
Q50
-10
, £1,
000
100m
m e
xt.,
£3,1
00
,
Stan
dard
UPV
C, £
3,40
0
Ther
mos
tat,
£1,1
00Heat
pum
p +U
nder
floor
+ M
VHR,
£15
,500
PV 4
kWp,
£7,
000
Max
. ins
., £2
,000
Q50
-5,
£1,
000
250m
m e
xt.,
£4,2
00
150m
m E
PS, £
2,20
0
Trip
le ti
mbe
r, £6
,700
Smar
t The
rmos
tat,
£1,1
00
A ra
ted
gas b
oile
r, £5
,100
,
Max
. ins
., £2
,000
Q50
-10
, £1,
000
85m
m in
t., £
2,30
0
,
Seco
ndar
y, £
2,20
0
Ther
mos
tat,
£1,1
00Heat
pum
p +U
nder
floor
+ M
VHR,
£15
,500
PV 4
kWp
+ 2m
2 so
l.th
+ 2b
at.,
£16,
000
Max
. ins
., £2
,000
Q50
-10
, £1,
000
250m
m e
xt.,
£4,2
00
150m
m E
PS, £
2,20
0
Stan
dard
UPV
C, £
3,40
0
Ther
mos
tat,
£1,1
00
HistoricalImprovements
CleanerEnergy
CleanerEnenrgy
UpdgradeServices
Addiotion ofRenewables Roof Airtightness Walls Floor WIndows People
DwellingHistoric
SupplyHistoric
SupplyPost 2018
A4Services
A3Renwables
A2Fabric
A5People
DwellingHistoric
SupplyHistoric
SupplyPost 2018
A4Services
A3Renwables
A2Fabric
A5People
HistoricalImprovements
CleanerEnergy
CleanerEnenrgy
UpdgradeServices
Addiotion ofRenewables Roof Airtightness Walls Floor WIndows People
-£650
-£790
-£130
-£1,180
Total reduction in annual energy cost by narrative
Scenario 2 assumes50% increase in energy costs
£20,700
£39,700
£13,700
£45,400
Total capital cost by narrative
predicted maintenance, repair and improvement costs over a 30 year period

Dwelling type 2: Mid terrace pre 1919Scenario 1
No Slight Med High
2018GoodBest
HeritageRural
Jun Jul Aug
Good Practice
Best Practice
Heritage
Rural
£11,100
Overheating Risk
Pre 2018 ← → Post 2018
0%
10%
20%
30%
40%
50%
60%
70%
80%
90%
100%
Redu
ctio
n in
CO
2pr
oduc
tion
agai
nst 1
990
leve
ls
Impact on carbon emissions of four distinct retrofit narratives, each with costed actions
Impact on annual energy cost of four distinct retrofit narratives
Pre 2018 ← → Post 2018
-£32
0 -£80
-£36
0
-£20
-£30
-£90 -£
20
-£30
-£32
0
£440
-£55
0
-£30
-£13
0
-£13
0
-£24
0 -£50
-£40
-£32
0 -£80 -£
20
-£30
-£10
0 -£10
-£30
-£25
0
-£10
20 -£79
0
-£30
-£60
-£12
0
-£25
0 -£40
-£30
-£2,000
-£1,000
£0
£1,000
£2,000
£3,000
Annu
al E
nerg
y co
st
HistoricalImprovements
CleanerEnergy
CleanerEnenrgy
UpdgradeServices
Addiotion ofRenewables Roof Airtightness Walls Floor WIndows People
DwellingHistoric
SupplyHistoric
SupplyPost 2018
A4Services
A3Renwables
A2Fabric
A5People
DwellingHistoric
SupplyHistoric
SupplyPost 2018
A4Services
A3Renwables
A2Fabric
A5People
HistoricalImprovements
CleanerEnergy
CleanerEnenrgy
UpdgradeServices
Addiotion ofRenewables Roof Airtightness Walls Floor WIndows People
-£630
-£720
-£270
-£2,340
Total reduction in annual energy cost by narrative
Scenario 1 assumesno change in energy costs
£17,100
£33,500
£10,800
£39,400
Total capital cost by narrative
predicted maintenance, repair and improvement costs over a 30 year period
A ra
ted
gas b
oile
r, £4
,400
PV 2
.6kW
p, £
5,00
0
Max
. ins
., £1
,700
Q50
-10
, £80
0
100m
m e
xt.,
£1,2
00
,
Stan
dard
UPV
C, £
3,00
0
Ther
mos
tat,
£1,0
00
Heat
pum
p +U
nder
floor
+ M
VHR,
£13
,400
PV 4
kWp,
£7,
000
Max
. ins
., £1
,700
Q50
-5,
£80
0
250m
m e
xt.,
£1,6
00
150m
m E
PS, £
1,90
0
Trip
le ti
mbe
r, £6
,100
Smar
t The
rmos
tat,
£1,0
00
A ra
ted
gas b
oile
r, £4
,400
,
Max
. ins
., £1
,700
Q50
-10
, £80
0
85m
m in
t., £
900
,
Seco
ndar
y, £
2,00
0
Ther
mos
tat,
£1,0
00
Heat
pum
p +U
nder
floor
+ M
VHR,
£13
,400
PV 4
kWp
+ 2m
2 so
l.th
+ 2b
at.,
£16,
000
Max
. ins
., £1
,700
Q50
-10
, £80
0
250m
m e
xt.,
£1,6
00
150m
m E
PS, £
1,90
0
Stan
dard
UPV
C, £
3,00
0
Ther
mos
tat,
£1,0
00

Dwelling type 2: Mid terrace pre 1919Scenario 2
No Slight Med High
2018GoodBest
HeritageRural
Jun Jul Aug
Good Practice
Best Practice
Heritage
Rural
£11,100
Overheating Risk
Impact on annual energy cost of four distinct retrofit narratives
Pre 2018 ← → Post 2018
-£32
0
£400
-£12
0
-£54
0
-£30
-£50
-£13
0
-£40
-£40
-£32
0
£400
£710
-£83
0
-£40
-£19
0
-£19
0
-£36
0 -£70
-£50
-£32
0
£400
-£12
0
-£30
-£50
-£15
0 -£20
-£40
-£25
0
£118
0
-£15
30 -£11
80
-£40
-£90
-£18
0
-£37
0
-£50
-£50
-£2,000
-£1,000
£0
£1,000
£2,000
£3,000
£4,000
Annu
al E
nerg
y co
st
Pre 2018 ← → Post 2018
0%
10%
20%
30%
40%
50%
60%
70%
80%
90%
100%
Redu
ctio
n in
CO
2pr
oduc
tion
agai
nst 1
990
leve
ls
Impact on carbon emissions of four distinct retrofit narratives, each with costed actions
A ra
ted
gas b
oile
r, £4
,400
PV 2
.6kW
p, £
5,00
0
Max
. ins
., £1
,700
Q50
-10
, £80
0
100m
m e
xt.,
£1,2
00
,
Stan
dard
UPV
C, £
3,00
0
Ther
mos
tat,
£1,0
00
Heat
pum
p +U
nder
floor
+ M
VHR,
£13
,400
PV 4
kWp,
£7,
000
Max
. ins
., £1
,700
Q50
-5,
£80
0
250m
m e
xt.,
£1,6
00
150m
m E
PS, £
1,90
0
Trip
le ti
mbe
r, £6
,100
Smar
t The
rmos
tat,
£1,0
00
A ra
ted
gas b
oile
r, £4
,400
,
Max
. ins
., £1
,700
Q50
-10
, £80
0
85m
m in
t., £
900
,
Seco
ndar
y, £
2,00
0
Ther
mos
tat,
£1,0
00
Heat
pum
p +U
nder
floor
+ M
VHR,
£13
,400
PV 4
kWp
+ 2m
2 so
l.th
+ 2b
at.,
£16,
000
Max
. ins
., £1
,700
Q50
-10
, £80
0
250m
m e
xt.,
£1,6
00
150m
m E
PS, £
1,90
0
Stan
dard
UPV
C, £
3,00
0
Ther
mos
tat,
£1,0
00
HistoricalImprovements
CleanerEnergy
CleanerEnenrgy
UpdgradeServices
Addiotion ofRenewables Roof Airtightness Walls Floor WIndows People
DwellingHistoric
SupplyHistoric
SupplyPost 2018
A4Services
A3Renwables
A2Fabric
A5People
DwellingHistoric
SupplyHistoric
SupplyPost 2018
A4Services
A3Renwables
A2Fabric
A5People
HistoricalImprovements
CleanerEnergy
CleanerEnenrgy
UpdgradeServices
Addiotion ofRenewables Roof Airtightness Walls Floor WIndows People
-£540
-£630
-£10
-£2,330
Total reduction in annual energy cost by narrative
Scenario 2 assumes50% increase in energy costs
£17,100
£33,500
£10,800
£39,400
Total capital cost by narrative
predicted maintenance, repair and improvement costs over a 30 year period

Dwelling type 3: Semi-detached pre 1919Scenario 1
No Slight Med High
2018GoodBest
HeritageRural
Jun Jul Aug
Good Practice
Best Practice
Heritage
Rural
£14,000
Overheating Risk
Pre 2018 ← → Post 2018
0%
10%
20%
30%
40%
50%
60%
70%
80%
90%
100%
Redu
ctio
n in
CO
2pr
oduc
tion
agai
nst 1
990
leve
ls
Impact on carbon emissions of four distinct retrofit narratives, each with costed actions
Impact on annual energy cost of four distinct retrofit narratives
Pre 2018 ← → Post 2018
-£50
0
-£13
0
-£36
0
-£30
-£40
-£25
0 -£30
-£40
-£50
0
£600
-£55
0
-£40
-£17
0
-£42
0
-£37
0
-£70 -£40
-£50
0
-£13
0 -£30
-£40
-£29
0
-£20
-£40
£100
£370
-£79
0
-£40
-£80
-£41
0
-£36
0
-£50
-£40
-£2,000
-£1,000
£0
£1,000
£2,000
£3,000
Annu
al E
nerg
y co
st
HistoricalImprovements
CleanerEnergy
CleanerEnenrgy
UpdgradeServices
Addiotion ofRenewables Roof Airtightness Walls Floor WIndows People
DwellingHistoric
SupplyHistoric
SupplyPost 2018
A4Services
A3Renwables
A2Fabric
A5People
DwellingHistoric
SupplyHistoric
SupplyPost 2018
A4Services
A3Renwables
A2Fabric
A5People
HistoricalImprovements
CleanerEnergy
CleanerEnenrgy
UpdgradeServices
Addiotion ofRenewables Roof Airtightness Walls Floor WIndows People
-£880
-£1,070
-£540
-£1,410
Total reduction in annual energy cost by narrative
Scenario 1 assumesno change in energy costs
£24,300
£47,600
£18,300
£52,400
Total capital cost by narrative
predicted maintenance, repair and improvement costs over a 30 year period
A ra
ted
gas b
oile
r, £6
,200
PV 2
.6kW
p, £
5,00
0
Max
. ins
., £2
,600
Q50
-10
, £1,
300
100m
m e
xt.,
£3,5
00
Stan
dard
UPV
C, £
4,30
0
Ther
mos
tat,
£1,4
00
Heat
pum
p +U
nder
floor
+ M
VHR,
£19
,100
PV 4
kWp,
£7,
000
Max
. ins
., £2
,600
Q50
-5,
£1,
300
250m
m e
xt.,
£4,8
00
150m
m E
PS, £
2,90
0
Trip
le ti
mbe
r, £8
,500
Smar
t The
rmos
tat,
£1,4
00
A ra
ted
gas b
oile
r, £6
,200
,
Max
. ins
., £2
,600
Q50
-10
, £1,
300
85m
m in
t., £
2,60
0
Seco
ndar
y, £
2,80
0
Ther
mos
tat,
£1,4
00
Heat
pum
p +U
nder
floor
+ M
VHR,
£19
,100
PV 4
kWp
+ 2m
2 so
l.th
+ 2b
at.,
£16,
000
Max
. ins
., £2
,600
Q50
-10
, £1,
300
250m
m e
xt.,
£4,8
00
150m
m E
PS, £
2,90
0
Stan
dard
UPV
C, £
4,30
0
Ther
mos
tat,
£1,4
00

Dwelling type 3: Semi-detached pre 1919Scenario 2
No Slight Med High
2018GoodBest
HeritageRural
Jun Jul Aug
Good Practice
Best Practice
Heritage
Rural
£14,000
Overheating Risk
Impact on annual energy cost of four distinct retrofit narratives
Pre 2018 ← → Post 2018
-£50
0
£650
-£19
0
-£54
0
-£40
-£60
-£37
0
-£50
-£50
-£50
0
£650
£940
-£83
0
-£70
-£25
0
-£63
0
-£55
0
-£10
0
-£70
-£50
0
£650
-£19
0 -£40
-£60
-£43
0
-£20
-£50
£100
£60
£131
0
-£11
80
-£70
-£13
0
-£62
0
-£54
0
-£80
-£60
-£2,000
-£1,000
£0
£1,000
£2,000
£3,000
£4,000
Annu
al E
nerg
y co
st
Pre 2018 ← → Post 2018
0%
10%
20%
30%
40%
50%
60%
70%
80%
90%
100%
Redu
ctio
n in
CO
2pr
oduc
tion
agai
nst 1
990
leve
ls
Impact on carbon emissions of four distinct retrofit narratives, each with costed actions
A ra
ted
gas b
oile
r, £6
,200
PV 2
.6kW
p, £
5,00
0
Max
. ins
., £2
,600
Q50
-10
, £1,
300
100m
m e
xt.,
£3,5
00
Stan
dard
UPV
C, £
4,30
0
Ther
mos
tat,
£1,4
00
Heat
pum
p +U
nder
floor
+ M
VHR,
£19
,100
PV 4
kWp,
£7,
000
Max
. ins
., £2
,600
Q50
-5,
£1,
300
250m
m e
xt.,
£4,8
00
150m
m E
PS, £
2,90
0
Trip
le ti
mbe
r, £8
,500
Smar
t The
rmos
tat,
£1,4
00
A ra
ted
gas b
oile
r, £6
,200
,
Max
. ins
., £2
,600
Q50
-10
, £1,
300
85m
m in
t., £
2,60
0
Seco
ndar
y, £
2,80
0
Ther
mos
tat,
£1,4
00
Heat
pum
p +U
nder
floor
+ M
VHR,
£19
,100
PV 4
kWp
+ 2m
2 so
l.th
+ 2b
at.,
£16,
000
Max
. ins
., £2
,600
Q50
-10
, £1,
300
250m
m e
xt.,
£4,8
00
150m
m E
PS, £
2,90
0
Stan
dard
UPV
C, £
4,30
0
Ther
mos
tat,
£1,4
00
HistoricalImprovements
CleanerEnergy
CleanerEnenrgy
UpdgradeServices
Addiotion ofRenewables Roof Airtightness Walls Floor WIndows People
DwellingHistoric
SupplyHistoric
SupplyPost 2018
A4Services
A3Renwables
A2Fabric
A5People
DwellingHistoric
SupplyHistoric
SupplyPost 2018
A4Services
A3Renwables
A2Fabric
A5People
HistoricalImprovements
CleanerEnergy
CleanerEnenrgy
UpdgradeServices
Addiotion ofRenewables Roof Airtightness Walls Floor WIndows People
-£660
-£900
-£150
-£1,310
Total reduction in annual energy cost by narrative
Scenario 2 assumes50% increase in energy costs
£24,300
£47,600
£18,300
£52,400
Total capital cost by narrative
predicted maintenance, repair and improvement costs over a 30 year period

Dwelling type 4: Detached pre 1919Scenario 1
No Slight Med High
2018GoodBest
HeritageRural
Jun Jul Aug
Good Practice
Best Practice
Heritage
Rural
£19,800
Overheating Risk
Pre 2018 ← → Post 2018
0%
10%
20%
30%
40%
50%
60%
70%
80%
90%
100%
Redu
ctio
n in
CO
2pr
oduc
tion
agai
nst 1
990
leve
ls
Impact on carbon emissions of four distinct retrofit narratives, each with costed actions
Impact on annual energy cost of four distinct retrofit narratives
Pre 2018 ← → Post 2018
-£70
0
-£18
0
-£36
0
-£40
-£50
-£42
0
-£40
-£40
-£70
0
£510
-£55
0
-£50
-£19
0
-£52
0
-£55
0
-£70
-£50
-£70
0
-£18
0 -£40
-£50
-£49
0
-£20
-£40
£160
£140
-£79
0
-£50
-£90
-£49
0
-£54
0
-£60
-£50
-£2,000
-£1,000
£0
£1,000
£2,000
£3,000
Annu
al E
nerg
y co
st
HistoricalImprovements
CleanerEnergy
CleanerEnenrgy
UpdgradeServices
Addiotion ofRenewables Roof Airtightness Walls Floor WIndows People
DwellingHistoric
SupplyHistoric
SupplyPost 2018
A4Services
A3Renwables
A2Fabric
A5People
DwellingHistoric
SupplyHistoric
SupplyPost 2018
A4Services
A3Renwables
A2Fabric
A5People
HistoricalImprovements
CleanerEnergy
CleanerEnenrgy
UpdgradeServices
Addiotion ofRenewables Roof Airtightness Walls Floor WIndows People
-£1,140
-£1,460
-£820
-£1,950
Total reduction in annual energy cost by narrative
Scenario 1 assumesno change in energy costs
£32,000
£63,300
£25,500
£66,800
Total capital cost by narrative
predicted maintenance, repair and improvement costs over a 30 year period
A ra
ted
gas b
oile
r, £8
,400
PV 2
.6kW
p, £
5,00
0
Max
. ins
., £3
,600
Q50
-10
, £1,
800
100m
m e
xt.,
£6,0
00
Stan
dard
UPV
C, £
5,40
0
Ther
mos
tat,
£1,8
00Heat
pum
p +U
nder
floor
+ M
VHR,
£25
,800
PV 4
kWp,
£7,
000
Max
. ins
., £3
,600
Q50
-5,
£1,
800
250m
m e
xt.,
£8,3
00
150m
m E
PS, £
4,10
0
Trip
le ti
mbe
r, £1
0,90
0
Smar
t The
rmos
tat,
£1,8
00
A ra
ted
gas b
oile
r, £8
,400
,
Max
. ins
., £3
,600
Q50
-10
, £1,
800
85m
m in
t., £
4,50
0
Seco
ndar
y, £
3,60
0
Ther
mos
tat,
£1,8
00Heat
pum
p +U
nder
floor
+ M
VHR,
£25
,800
PV 4
kWp
+ 2m
2 so
l.th
+ 2b
at.,
£16,
000
Max
. ins
., £3
,600
Q50
-10
, £1,
800
250m
m e
xt.,
£8,3
00
150m
m E
PS, £
4,10
0
Stan
dard
UPV
C, £
5,40
0
Ther
mos
tat,
£1,8
00

Dwelling type 4: Detached pre 1919Scenario 2
No Slight Med High
2018GoodBest
HeritageRural
Jun Jul Aug
Good Practice
Best Practice
Heritage
Rural
£19,800
Overheating Risk
Impact on annual energy cost of four distinct retrofit narratives
Pre 2018 ← → Post 2018
-£70
0
£940
-£28
0
-£54
0
-£60
-£70
-£64
0
-£60
-£60
-£70
0
£940
£820
-£83
0
-£80
-£28
0
-£77
0
-£82
0
-£11
0
-£80
-£70
0
£940
-£28
0 -£60
-£70
-£73
0
-£30
-£70
£160
£70
£131
0
-£11
80
-£80
-£14
0
-£74
0
-£81
0
-£10
0
-£80
-£2,000
-£1,000
£0
£1,000
£2,000
£3,000
£4,000
Annu
al E
nerg
y co
st
Pre 2018 ← → Post 2018
0%
10%
20%
30%
40%
50%
60%
70%
80%
90%
100%
Redu
ctio
n in
CO
2pr
oduc
tion
agai
nst 1
990
leve
ls
Impact on carbon emissions of four distinct retrofit narratives, each with costed actions
A ra
ted
gas b
oile
r, £8
,400
PV 2
.6kW
p, £
5,00
0
Max
. ins
., £3
,600
Q50
-10
, £1,
800
100m
m e
xt.,
£6,0
00
Stan
dard
UPV
C, £
5,40
0
Ther
mos
tat,
£1,8
00Heat
pum
p +U
nder
floor
+ M
VHR,
£25
,800
PV 4
kWp,
£7,
000
Max
. ins
., £3
,600
Q50
-5,
£1,
800
250m
m e
xt.,
£8,3
00
150m
m E
PS, £
4,10
0
Trip
le ti
mbe
r, £1
0,90
0
Smar
t The
rmos
tat,
£1,8
00
A ra
ted
gas b
oile
r, £8
,400
,
Max
. ins
., £3
,600
Q50
-10
, £1,
800
85m
m in
t., £
4,50
0
Seco
ndar
y, £
3,60
0
Ther
mos
tat,
£1,8
00Heat
pum
p +U
nder
floor
+ M
VHR,
£25
,800
PV 4
kWp
+ 2m
2 so
l.th
+ 2b
at.,
£16,
000
Max
. ins
., £3
,600
Q50
-10
, £1,
800
250m
m e
xt.,
£8,3
00
150m
m E
PS, £
4,10
0
Stan
dard
UPV
C, £
5,40
0
Ther
mos
tat,
£1,8
00
HistoricalImprovements
CleanerEnergy
CleanerEnenrgy
UpdgradeServices
Addiotion ofRenewables Roof Airtightness Walls Floor WIndows People
DwellingHistoric
SupplyHistoric
SupplyPost 2018
A4Services
A3Renwables
A2Fabric
A5People
DwellingHistoric
SupplyHistoric
SupplyPost 2018
A4Services
A3Renwables
A2Fabric
A5People
HistoricalImprovements
CleanerEnergy
CleanerEnenrgy
UpdgradeServices
Addiotion ofRenewables Roof Airtightness Walls Floor WIndows People
-£770
-£1,210
-£300
-£1,740
Total reduction in annual energy cost by narrative
Scenario 2 assumes50% increase in energy costs
£32,000
£63,300
£25,500
£66,800
Total capital cost by narrative
predicted maintenance, repair and improvement costs over a 30 year period

Dwelling type 5: Semi-detached 1919-1944Scenario 1
No Slight Med High
2018GoodBest
HeritageRural
Jun Jul Aug
Good Practice
Best Practice
Heritage
Rural
£12,400
Overheating Risk
Pre 2018 ← → Post 2018
0%
10%
20%
30%
40%
50%
60%
70%
80%
90%
100%
Redu
ctio
n in
CO
2pr
oduc
tion
agai
nst 1
990
leve
ls
Impact on carbon emissions of four distinct retrofit narratives, each with costed actions
Impact on annual energy cost of four distinct retrofit narratives
Pre 2018 ← → Post 2018
-£54
0
-£90
-£36
0
-£10
-£30
-£50
-£30
-£30
-£54
0
£460
-£55
0
-£20
-£13
0
-£70
-£27
0 -£60
-£40
-£54
0
-£90 -£
10
-£30
-£50 -£20
-£30
-£12
0
£360
-£79
0
-£20
-£70
-£70
-£27
0 -£50
-£40
-£2,000
-£1,000
£0
£1,000
£2,000
£3,000
Annu
al E
nerg
y co
st
HistoricalImprovements
CleanerEnergy
CleanerEnenrgy
UpdgradeServices
Addiotion ofRenewables Roof Airtightness Walls Floor WIndows People
DwellingHistoric
SupplyHistoric
SupplyPost 2018
A4Services
A3Renwables
A2Fabric
A5People
DwellingHistoric
SupplyHistoric
SupplyPost 2018
A4Services
A3Renwables
A2Fabric
A5People
HistoricalImprovements
CleanerEnergy
CleanerEnenrgy
UpdgradeServices
Addiotion ofRenewables Roof Airtightness Walls Floor WIndows People
-£600
-£680
-£230
-£940
Total reduction in annual energy cost by narrative
Scenario 1 assumesno change in energy costs
£20,800
£41,400
£14,900
£46,200
Total capital cost by narrative
predicted maintenance, repair and improvement costs over a 30 year period
A ra
ted
gas b
oile
r, £5
,300
PV 2
.6kW
p, £
5,00
0
Max
. ins
., £1
,100
Q50
-10
, £1,
100
100m
m e
xt.,
£3,0
00
Stan
dard
UPV
C, £
4,10
0
Ther
mos
tat,
£1,2
00Heat
pum
p +U
nder
floor
+ M
VHR,
£16
,300
PV 4
kWp,
£7,
000
Max
. ins
., £1
,100
Q50
-5,
£1,
100
100m
m e
xt.,
£3,0
00
120m
m P
IR, £
3,40
0
Trip
le ti
mbe
r, £8
,300
Smar
t The
rmos
tat,
£1,2
00
A ra
ted
gas b
oile
r, £5
,300
, Max
. ins
., £1
,100
Q50
-10
, £1,
100
85m
m in
t., £
2,20
0
Seco
ndar
y, £
2,80
0
Ther
mos
tat,
£1,2
00Heat
pum
p +U
nder
floor
+ M
VHR,
£16
,300
PV 4
kWp
+ 2m
2 so
l.th
+ 2b
at.,
£16,
000
Max
. ins
., £1
,100
Q50
-10
, £1,
100
100m
m e
xt.,
£3,0
00
120m
m P
IR, £
3,40
0
Stan
dard
UPV
C, £
4,10
0
Ther
mos
tat,
£1,2
00

Dwelling type 5: Semi-detached 1919-1944Scenario 2
No Slight Med High
2018GoodBest
HeritageRural
Jun Jul Aug
Good Practice
Best Practice
Heritage
Rural
£12,400
Overheating Risk
Impact on annual energy cost of four distinct retrofit narratives
Pre 2018 ← → Post 2018
-£54
0
£430
-£13
0
-£54
0
-£20
-£50
-£70 -£40
-£50
-£54
0
£430
£740
-£83
0
-£30
-£20
0
-£10
0
-£41
0
-£80
-£60
-£54
0
£430
-£13
0 -£20
-£50
-£70 -£20
-£50
-£12
0
£50
£102
0
-£11
80
-£30
-£10
0
-£10
0
-£40
0
-£70
-£60
-£2,000
-£1,000
£0
£1,000
£2,000
£3,000
£4,000
Annu
al E
nerg
y co
st
Pre 2018 ← → Post 2018
0%
10%
20%
30%
40%
50%
60%
70%
80%
90%
100%
Redu
ctio
n in
CO
2pr
oduc
tion
agai
nst 1
990
leve
ls
Impact on carbon emissions of four distinct retrofit narratives, each with costed actions
A ra
ted
gas b
oile
r, £5
,300
PV 2
.6kW
p, £
5,00
0
Max
. ins
., £1
,100
Q50
-10
, £1,
100
100m
m e
xt.,
£3,0
00
Stan
dard
UPV
C, £
4,10
0
Ther
mos
tat,
£1,2
00Heat
pum
p +U
nder
floor
+ M
VHR,
£16
,300
PV 4
kWp,
£7,
000
Max
. ins
., £1
,100
Q50
-5,
£1,
100
100m
m e
xt.,
£3,0
00
120m
m P
IR, £
3,40
0
Trip
le ti
mbe
r, £8
,300
Smar
t The
rmos
tat,
£1,2
00
A ra
ted
gas b
oile
r, £5
,300
, Max
. ins
., £1
,100
Q50
-10
, £1,
100
85m
m in
t., £
2,20
0
Seco
ndar
y, £
2,80
0
Ther
mos
tat,
£1,2
00Heat
pum
p +U
nder
floor
+ M
VHR,
£16
,300
PV 4
kWp
+ 2m
2 so
l.th
+ 2b
at.,
£16,
000
Max
. ins
., £1
,100
Q50
-10
, £1,
100
100m
m e
xt.,
£3,0
00
120m
m P
IR, £
3,40
0
Stan
dard
UPV
C, £
4,10
0
Ther
mos
tat,
£1,2
00
HistoricalImprovements
CleanerEnergy
CleanerEnenrgy
UpdgradeServices
Addiotion ofRenewables Roof Airtightness Walls Floor WIndows People
DwellingHistoric
SupplyHistoric
SupplyPost 2018
A4Services
A3Renwables
A2Fabric
A5People
DwellingHistoric
SupplyHistoric
SupplyPost 2018
A4Services
A3Renwables
A2Fabric
A5People
HistoricalImprovements
CleanerEnergy
CleanerEnenrgy
UpdgradeServices
Addiotion ofRenewables Roof Airtightness Walls Floor WIndows People
-£470
-£540
-£870
Total reduction in annual energy cost by narrative
Scenario 2 assumes50% increase in energy costs
£20,800
£41,400
£14,900
£46,200
Total capital cost by narrative
predicted maintenance, repair and improvement costs over a 30 year period

Dwelling type 6: Semi-detached 1945-1964Scenario 1
No Slight Med High
2018GoodBest
HeritageRural
Jun Jul Aug
Good Practice
Best Practice
Heritage
Rural
£11,900
Overheating Risk
Pre 2018 ← → Post 2018
0%
10%
20%
30%
40%
50%
60%
70%
80%
90%
100%
Redu
ctio
n in
CO
2pr
oduc
tion
agai
nst 1
990
leve
ls
Impact on carbon emissions of four distinct retrofit narratives, each with costed actions
Impact on annual energy cost of four distinct retrofit narratives
Pre 2018 ← → Post 2018
-£52
0
-£80
-£36
0
-£10
-£30
-£50
-£30
-£30
-£52
0
£450
-£55
0
-£20
-£12
0
-£70
-£26
0 -£60
-£40
-£52
0
-£80 -£
10
-£30
-£50 -£10
-£30
-£12
0
£350
-£79
0
-£20
-£60
-£70
-£25
0 -£40
-£40
-£2,000
-£1,000
£0
£1,000
£2,000
£3,000
Annu
al E
nerg
y co
st
HistoricalImprovements
CleanerEnergy
CleanerEnenrgy
UpdgradeServices
Addiotion ofRenewables Roof Airtightness Walls Floor WIndows People
DwellingHistoric
SupplyHistoric
SupplyPost 2018
A4Services
A3Renwables
A2Fabric
A5People
DwellingHistoric
SupplyHistoric
SupplyPost 2018
A4Services
A3Renwables
A2Fabric
A5People
HistoricalImprovements
CleanerEnergy
CleanerEnenrgy
UpdgradeServices
Addiotion ofRenewables Roof Airtightness Walls Floor WIndows People
-£590
-£670
-£220
-£920
Total reduction in annual energy cost by narrative
Scenario 1 assumesno change in energy costs
£20,000
£39,700
£14,100
£44,900
Total capital cost by narrative
predicted maintenance, repair and improvement costs over a 30 year period
A ra
ted
gas b
oile
r, £5
,100
PV 2
.6kW
p, £
5,00
0
Max
. ins
., £1
,000
Q50
-10
, £1,
000
100m
m e
xt.,
£2,9
00
Stan
dard
UPV
C, £
3,90
0
Ther
mos
tat,
£1,1
00Heat
pum
p +U
nder
floor
+ M
VHR,
£15
,700
PV 4
kWp,
£7,
000
Max
. ins
., £1
,000
Q50
-5,
£1,
000
100m
m e
xt.,
£2,9
00
120m
m P
IR, £
3,30
0
Trip
le ti
mbe
r, £7
,700
Smar
t The
rmos
tat,
£1,1
00
A ra
ted
gas b
oile
r, £5
,100
, Max
. ins
., £1
,000
Q50
-10
, £1,
000
85m
m in
t., £
2,20
0
Seco
ndar
y, £
2,60
0
Ther
mos
tat,
£1,1
00Heat
pum
p +U
nder
floor
+ M
VHR,
£15
,700
PV 4
kWp
+ 2m
2 so
l.th
+ 2b
at.,
£16,
000
Max
. ins
., £1
,000
Q50
-10
, £1,
000
100m
m e
xt.,
£2,9
00
120m
m P
IR, £
3,30
0
Stan
dard
UPV
C, £
3,90
0
Ther
mos
tat,
£1,1
00

Dwelling type 6: Semi-detached 1945-1964Scenario 2
No Slight Med High
2018GoodBest
HeritageRural
Jun Jul Aug
Good Practice
Best Practice
Heritage
Rural
£11,900
Overheating Risk
Impact on annual energy cost of four distinct retrofit narratives
Pre 2018 ← → Post 2018
-£52
0
£420
-£12
0
-£54
0
-£20
-£50
-£70 -£40
-£50
-£52
0
£420
£720
-£83
0
-£30
-£19
0
-£10
0
-£38
0
-£80
-£60
-£52
0
£420
-£12
0
-£20
-£50
-£70 -£20
-£50
-£12
0
£50
£990
-£11
80
-£30
-£90
-£10
0
-£38
0
-£60
-£60
-£2,000
-£1,000
£0
£1,000
£2,000
£3,000
£4,000
Annu
al E
nerg
y co
st
Pre 2018 ← → Post 2018
0%
10%
20%
30%
40%
50%
60%
70%
80%
90%
100%
Redu
ctio
n in
CO
2pr
oduc
tion
agai
nst 1
990
leve
ls
Impact on carbon emissions of four distinct retrofit narratives, each with costed actions
A ra
ted
gas b
oile
r, £5
,100
PV 2
.6kW
p, £
5,00
0
Max
. ins
., £1
,000
Q50
-10
, £1,
000
100m
m e
xt.,
£2,9
00
Stan
dard
UPV
C, £
3,90
0
Ther
mos
tat,
£1,1
00Heat
pum
p +U
nder
floor
+ M
VHR,
£15
,700
PV 4
kWp,
£7,
000
Max
. ins
., £1
,000
Q50
-5,
£1,
000
100m
m e
xt.,
£2,9
00
120m
m P
IR, £
3,30
0
Trip
le ti
mbe
r, £7
,700
Smar
t The
rmos
tat,
£1,1
00
A ra
ted
gas b
oile
r, £5
,100
, Max
. ins
., £1
,000
Q50
-10
, £1,
000
85m
m in
t., £
2,20
0
Seco
ndar
y, £
2,60
0
Ther
mos
tat,
£1,1
00Heat
pum
p +U
nder
floor
+ M
VHR,
£15
,700
PV 4
kWp
+ 2m
2 so
l.th
+ 2b
at.,
£16,
000
Max
. ins
., £1
,000
Q50
-10
, £1,
000
100m
m e
xt.,
£2,9
00
120m
m P
IR, £
3,30
0
Stan
dard
UPV
C, £
3,90
0
Ther
mos
tat,
£1,1
00
HistoricalImprovements
CleanerEnergy
CleanerEnenrgy
UpdgradeServices
Addiotion ofRenewables Roof Airtightness Walls Floor WIndows People
DwellingHistoric
SupplyHistoric
SupplyPost 2018
A4Services
A3Renwables
A2Fabric
A5People
DwellingHistoric
SupplyHistoric
SupplyPost 2018
A4Services
A3Renwables
A2Fabric
A5People
HistoricalImprovements
CleanerEnergy
CleanerEnenrgy
UpdgradeServices
Addiotion ofRenewables Roof Airtightness Walls Floor WIndows People
-£470
-£540
-£870
Total reduction in annual energy cost by narrative
Scenario 2 assumes50% increase in energy costs
£20,000
£39,700
£14,100
£44,900
Total capital cost by narrative
predicted maintenance, repair and improvement costs over a 30 year period

Dwelling type 7: End terrace 1965 - 1990Scenario 1
No Slight Med High
2018GoodBest
HeritageRural
Jun Jul Aug
Good Practice
Best Practice
Heritage
Rural
£10,600
Overheating Risk
Pre 2018 ← → Post 2018
0%
10%
20%
30%
40%
50%
60%
70%
80%
90%
100%
Redu
ctio
n in
CO
2pr
oduc
tion
agai
nst 1
990
leve
ls
Impact on carbon emissions of four distinct retrofit narratives, each with costed actions
Impact on annual energy cost of four distinct retrofit narratives
Pre 2018 ← → Post 2018
-£36
0
-£80
-£36
0
-£10
-£30
-£40
-£20
-£30
-£36
0
£420
-£55
0
-£20
-£11
0
-£50
-£26
0 -£40
-£40
-£36
0
-£80 -£
10
-£30
-£40 -£10
-£30
-£41
0
-£10
20 -£79
0
-£20
-£50
-£60
-£24
0 -£30
-£40
-£2,000
-£1,000
£0
£1,000
£2,000
£3,000
Annu
al E
nerg
y co
st
HistoricalImprovements
CleanerEnergy
CleanerEnenrgy
UpdgradeServices
Addiotion ofRenewables Roof Airtightness Walls Floor WIndows People
DwellingHistoric
SupplyHistoric
SupplyPost 2018
A4Services
A3Renwables
A2Fabric
A5People
DwellingHistoric
SupplyHistoric
SupplyPost 2018
A4Services
A3Renwables
A2Fabric
A5People
HistoricalImprovements
CleanerEnergy
CleanerEnenrgy
UpdgradeServices
Addiotion ofRenewables Roof Airtightness Walls Floor WIndows People
-£570
-£640
-£200
-£2,250
Total reduction in annual energy cost by narrative
Scenario 1 assumesno change in energy costs
£18,400
£36,400
£12,800
£42,300
Total capital cost by narrative
predicted maintenance, repair and improvement costs over a 30 year period
A ra
ted
gas b
oile
r, £4
,800
PV 2
.6kW
p, £
5,00
0
Max
. ins
., £9
00
Q50
-10
, £90
0
100m
m e
xt.,
£2,7
00
Stan
dard
UPV
C, £
3,10
0
Ther
mos
tat,
£1,0
00
Heat
pum
p +U
nder
floor
+ M
VHR,
£14
,700
PV 4
kWp,
£7,
000
Max
. ins
., £9
00
Q50
-5,
£90
0
100m
m e
xt.,
£2,7
00
120m
m P
IR, £
3,00
0
Trip
le ti
mbe
r, £6
,200
Smar
t The
rmos
tat,
£1,0
00
A ra
ted
gas b
oile
r, £4
,800
, Max
. ins
., £9
00
Q50
-10
, £90
0
85m
m in
t., £
2,10
0
Seco
ndar
y, £
2,10
0
Ther
mos
tat,
£1,0
00
Heat
pum
p +U
nder
floor
+ M
VHR,
£14
,700
PV 4
kWp
+ 2m
2 so
l.th
+ 2b
at.,
£16,
000
Max
. ins
., £9
00
Q50
-10
, £90
0
100m
m e
xt.,
£2,7
00
120m
m P
IR, £
3,00
0
Stan
dard
UPV
C, £
3,10
0
Ther
mos
tat,
£1,0
00

Dwelling type 7: End terrace 1965 - 1990Scenario 2
No Slight Med High
2018GoodBest
HeritageRural
Jun Jul Aug
Good Practice
Best Practice
Heritage
Rural
£10,600
Overheating Risk
Impact on annual energy cost of four distinct retrofit narratives
Pre 2018 ← → Post 2018
-£36
0
£390
-£11
0
-£54
0
-£20
-£40
-£70 -£30
-£50
-£36
0
£390
£680
-£83
0
-£30
-£16
0
-£70
-£39
0
-£60
-£60
-£36
0
£390
-£11
0
-£20
-£40
-£70 -£20
-£50
-£41
0
£116
0
-£15
30 -£11
80
-£30
-£80
-£90
-£36
0
-£40
-£60
-£2,000
-£1,000
£0
£1,000
£2,000
£3,000
£4,000
Annu
al E
nerg
y co
st
Pre 2018 ← → Post 2018
0%
10%
20%
30%
40%
50%
60%
70%
80%
90%
100%
Redu
ctio
n in
CO
2pr
oduc
tion
agai
nst 1
990
leve
ls
Impact on carbon emissions of four distinct retrofit narratives, each with costed actions
A ra
ted
gas b
oile
r, £4
,800
PV 2
.6kW
p, £
5,00
0
Max
. ins
., £9
00
Q50
-10
, £90
0
100m
m e
xt.,
£2,7
00
Stan
dard
UPV
C, £
3,10
0
Ther
mos
tat,
£1,0
00Heat
pum
p +U
nder
floor
+ M
VHR,
£14
,700
PV 4
kWp,
£7,
000
Max
. ins
., £9
00
Q50
-5,
£90
0
100m
m e
xt.,
£2,7
00
120m
m P
IR, £
3,00
0
Trip
le ti
mbe
r, £6
,200
Smar
t The
rmos
tat,
£1,0
00
A ra
ted
gas b
oile
r, £4
,800
, Max
. ins
., £9
00
Q50
-10
, £90
0
85m
m in
t., £
2,10
0
Seco
ndar
y, £
2,10
0
Ther
mos
tat,
£1,0
00Heat
pum
p +U
nder
floor
+ M
VHR,
£14
,700
PV 4
kWp
+ 2m
2 so
l.th
+ 2b
at.,
£16,
000
Max
. ins
., £9
00
Q50
-10
, £90
0
100m
m e
xt.,
£2,7
00
120m
m P
IR, £
3,00
0
Stan
dard
UPV
C, £
3,10
0
Ther
mos
tat,
£1,0
00
HistoricalImprovements
CleanerEnergy
CleanerEnenrgy
UpdgradeServices
Addiotion ofRenewables Roof Airtightness Walls Floor WIndows People
DwellingHistoric
SupplyHistoric
SupplyPost 2018
A4Services
A3Renwables
A2Fabric
A5People
DwellingHistoric
SupplyHistoric
SupplyPost 2018
A4Services
A3Renwables
A2Fabric
A5People
HistoricalImprovements
CleanerEnergy
CleanerEnenrgy
UpdgradeServices
Addiotion ofRenewables Roof Airtightness Walls Floor WIndows People
-£470
-£520
-£2,210
Total reduction in annual energy cost by narrative
Scenario 2 assumes50% increase in energy costs
£18,400
£36,400
£12,800
£42,300
Total capital cost by narrative
predicted maintenance, repair and improvement costs over a 30 year period

Dwelling type 8: Mid terrace 1965 - 1990Scenario 1
No Slight Med High
2018GoodBest
HeritageRural
Jun Jul Aug
Good Practice
Best Practice
Heritage
Rural
£9,300
Overheating Risk
Pre 2018 ← → Post 2018
0%
10%
20%
30%
40%
50%
60%
70%
80%
90%
100%
Redu
ctio
n in
CO
2pr
oduc
tion
agai
nst 1
990
leve
ls
Impact on carbon emissions of four distinct retrofit narratives, each with costed actions
Impact on annual energy cost of four distinct retrofit narratives
Pre 2018 ← → Post 2018
-£30
0 -£70
-£36
0
-£10
-£30
-£20
-£20
-£30
-£30
0
£420
-£55
0
-£20
-£10
0
-£30
-£25
0 -£40
-£40
-£30
0 -£70 -£
10
-£30
-£20
-£10
-£30
-£25
0
-£93
0
-£79
0
-£20
-£60 -£30
-£23
0 -£40
-£40
-£2,000
-£1,000
£0
£1,000
£2,000
£3,000
Annu
al E
nerg
y co
st
HistoricalImprovements
CleanerEnergy
CleanerEnenrgy
UpdgradeServices
Addiotion ofRenewables Roof Airtightness Walls Floor WIndows People
DwellingHistoric
SupplyHistoric
SupplyPost 2018
A4Services
A3Renwables
A2Fabric
A5People
DwellingHistoric
SupplyHistoric
SupplyPost 2018
A4Services
A3Renwables
A2Fabric
A5People
HistoricalImprovements
CleanerEnergy
CleanerEnenrgy
UpdgradeServices
Addiotion ofRenewables Roof Airtightness Walls Floor WIndows People
-£550
-£620
-£180
-£2,130
Total reduction in annual energy cost by narrative
Scenario 1 assumesno change in energy costs
£17,100
£35,200
£11,700
£40,900
Total capital cost by narrative
predicted maintenance, repair and improvement costs over a 30 year period
A ra
ted
gas b
oile
r, £4
,700
PV 2
.6kW
p, £
5,00
0
Max
. ins
., £9
00
Q50
-10
, £90
0
100m
m e
xt.,
£1,4
00
Stan
dard
UPV
C, £
3,20
0
Ther
mos
tat,
£1,0
00
Heat
pum
p +U
nder
floor
+ M
VHR,
£14
,500
PV 4
kWp,
£7,
000
Max
. ins
., £9
00
Q50
-5,
£90
0
100m
m e
xt.,
£1,4
00
120m
m P
IR, £
3,00
0
Trip
le ti
mbe
r, £6
,500
Smar
t The
rmos
tat,
£1,0
00
A ra
ted
gas b
oile
r, £4
,700
, Max
. ins
., £9
00
Q50
-10
, £90
0
85m
m in
t., £
1,00
0
Seco
ndar
y, £
2,20
0
Ther
mos
tat,
£1,0
00
Heat
pum
p +U
nder
floor
+ M
VHR,
£14
,500
PV 4
kWp
+ 2m
2 so
l.th
+ 2b
at.,
£16,
000
Max
. ins
., £9
00
Q50
-10
, £90
0
100m
m e
xt.,
£1,4
00
120m
m P
IR, £
3,00
0
Stan
dard
UPV
C, £
3,20
0
Ther
mos
tat,
£1,0
00
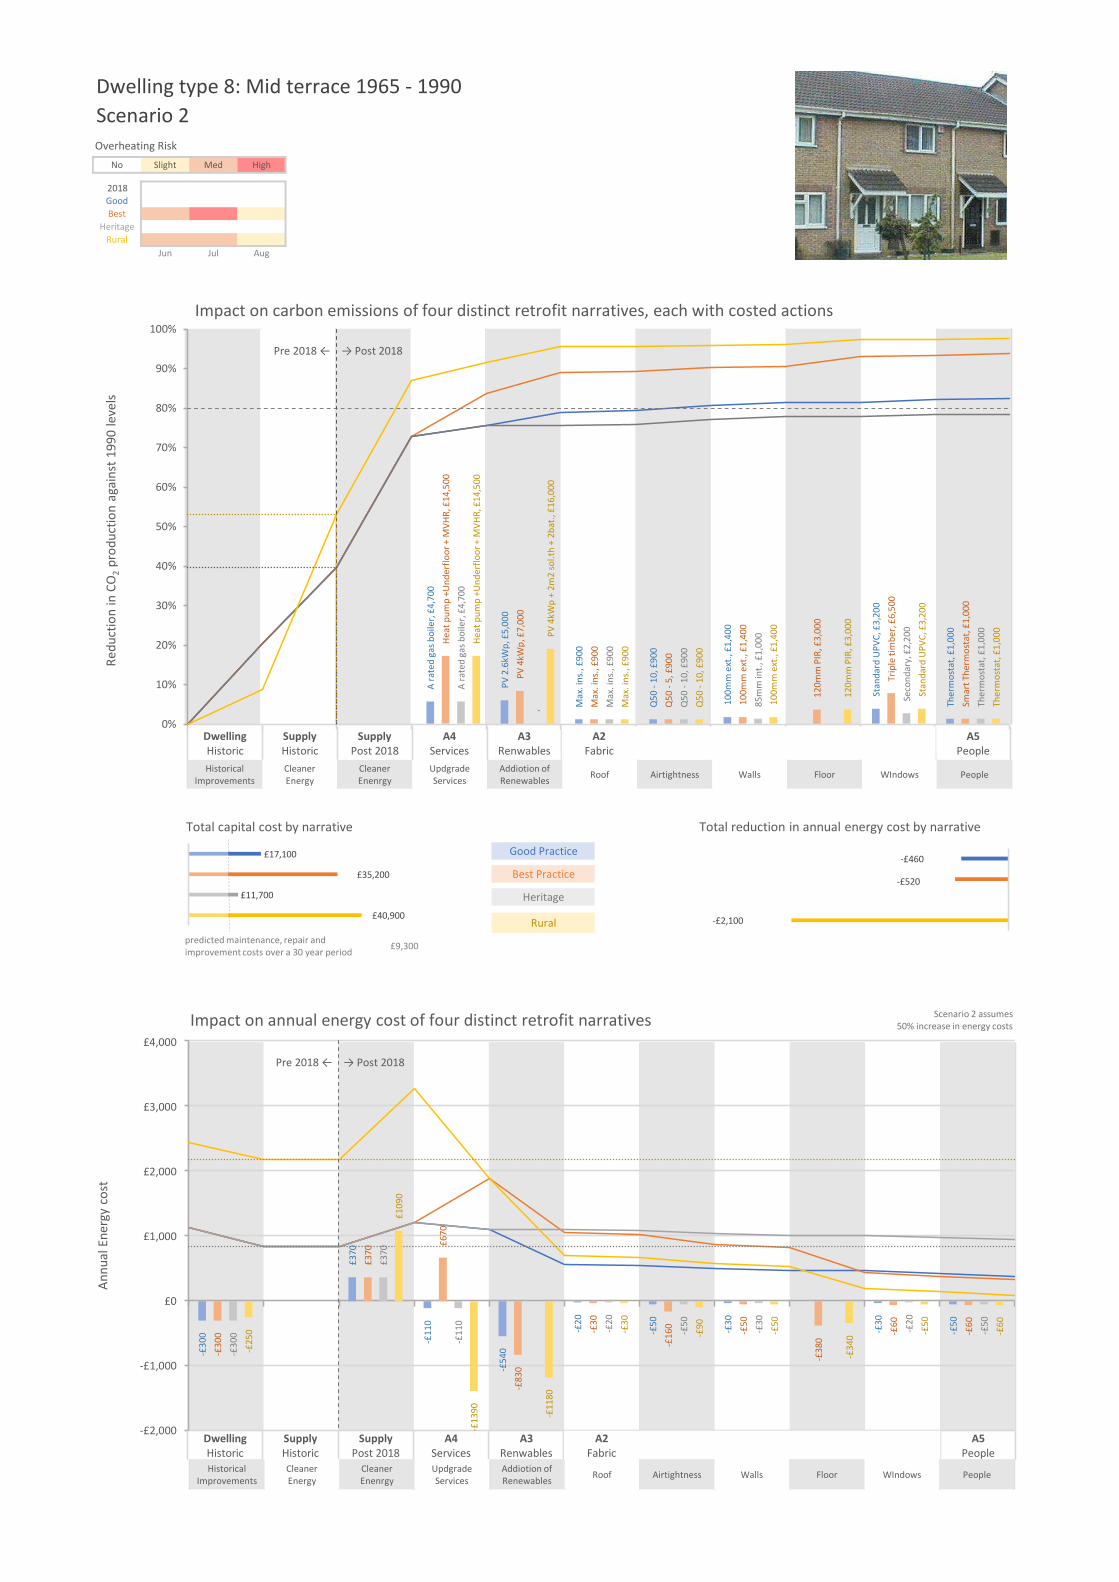
Dwelling type 8: Mid terrace 1965 - 1990Scenario 2
No Slight Med High
2018GoodBest
HeritageRural
Jun Jul Aug
Good Practice
Best Practice
Heritage
Rural
£9,300
Overheating Risk
Impact on annual energy cost of four distinct retrofit narratives
Pre 2018 ← → Post 2018
-£30
0
£370
-£11
0
-£54
0
-£20
-£50
-£30
-£30
-£50
-£30
0
£370
£670
-£83
0
-£30
-£16
0 -£50
-£38
0
-£60
-£60
-£30
0
£370
-£11
0
-£20
-£50
-£30
-£20
-£50
-£25
0
£109
0
-£13
90 -£11
80
-£30
-£90 -£50
-£34
0 -£50
-£60
-£2,000
-£1,000
£0
£1,000
£2,000
£3,000
£4,000
Annu
al E
nerg
y co
st
Pre 2018 ← → Post 2018
0%
10%
20%
30%
40%
50%
60%
70%
80%
90%
100%
Redu
ctio
n in
CO
2pr
oduc
tion
agai
nst 1
990
leve
ls
Impact on carbon emissions of four distinct retrofit narratives, each with costed actions
A ra
ted
gas b
oile
r, £4
,700
PV 2
.6kW
p, £
5,00
0
Max
. ins
., £9
00
Q50
-10
, £90
0
100m
m e
xt.,
£1,4
00
Stan
dard
UPV
C, £
3,20
0
Ther
mos
tat,
£1,0
00
Heat
pum
p +U
nder
floor
+ M
VHR,
£14
,500
PV 4
kWp,
£7,
000
Max
. ins
., £9
00
Q50
-5,
£90
0
100m
m e
xt.,
£1,4
00
120m
m P
IR, £
3,00
0
Trip
le ti
mbe
r, £6
,500
Smar
t The
rmos
tat,
£1,0
00
A ra
ted
gas b
oile
r, £4
,700
, Max
. ins
., £9
00
Q50
-10
, £90
0
85m
m in
t., £
1,00
0
Seco
ndar
y, £
2,20
0
Ther
mos
tat,
£1,0
00
Heat
pum
p +U
nder
floor
+ M
VHR,
£14
,500
PV 4
kWp
+ 2m
2 so
l.th
+ 2b
at.,
£16,
000
Max
. ins
., £9
00
Q50
-10
, £90
0
100m
m e
xt.,
£1,4
00
120m
m P
IR, £
3,00
0
Stan
dard
UPV
C, £
3,20
0
Ther
mos
tat,
£1,0
00
HistoricalImprovements
CleanerEnergy
CleanerEnenrgy
UpdgradeServices
Addiotion ofRenewables Roof Airtightness Walls Floor WIndows People
DwellingHistoric
SupplyHistoric
SupplyPost 2018
A4Services
A3Renwables
A2Fabric
A5People
DwellingHistoric
SupplyHistoric
SupplyPost 2018
A4Services
A3Renwables
A2Fabric
A5People
HistoricalImprovements
CleanerEnergy
CleanerEnenrgy
UpdgradeServices
Addiotion ofRenewables Roof Airtightness Walls Floor WIndows People
-£460
-£520
-£2,100
Total reduction in annual energy cost by narrative
Scenario 2 assumes50% increase in energy costs
£17,100
£35,200
£11,700
£40,900
Total capital cost by narrative
predicted maintenance, repair and improvement costs over a 30 year period

Dwelling type 9: Semi-detached 1965 - 1990Scenario 1
No Slight Med High
2018GoodBest
HeritageRural
Jun Jul Aug
Good Practice
Best Practice
Heritage
Rural
£12,200
Overheating Risk
Pre 2018 ← → Post 2018
0%
10%
20%
30%
40%
50%
60%
70%
80%
90%
100%
Redu
ctio
n in
CO
2pr
oduc
tion
agai
nst 1
990
leve
ls
Impact on carbon emissions of four distinct retrofit narratives, each with costed actions
Impact on annual energy cost of four distinct retrofit narratives
Pre 2018 ← → Post 2018
-£40
0
-£90
-£36
0
-£10
-£30
-£50
-£30
-£30
-£40
0
£460
-£55
0
-£20
-£13
0
-£70
-£28
0 -£50
-£40
-£40
0
-£90 -£
10
-£30
-£50 -£10
-£30
£10
£350
-£79
0
-£20
-£70
-£70
-£27
0 -£40
-£40
-£2,000
-£1,000
£0
£1,000
£2,000
£3,000
Annu
al E
nerg
y co
st
HistoricalImprovements
CleanerEnergy
CleanerEnenrgy
UpdgradeServices
Addiotion ofRenewables Roof Airtightness Walls Floor WIndows People
DwellingHistoric
SupplyHistoric
SupplyPost 2018
A4Services
A3Renwables
A2Fabric
A5People
DwellingHistoric
SupplyHistoric
SupplyPost 2018
A4Services
A3Renwables
A2Fabric
A5People
HistoricalImprovements
CleanerEnergy
CleanerEnenrgy
UpdgradeServices
Addiotion ofRenewables Roof Airtightness Walls Floor WIndows People
-£600
-£690
-£230
-£950
Total reduction in annual energy cost by narrative
Scenario 1 assumesno change in energy costs
£20,600
£41,200
£14,800
£46,300
Total capital cost by narrative
predicted maintenance, repair and improvement costs over a 30 year period
A ra
ted
gas b
oile
r, £5
,400
PV 2
.6kW
p, £
5,00
0
Max
. ins
., £1
,100
Q50
-10
, £1,
100
100m
m e
xt.,
£2,9
00
Stan
dard
UPV
C, £
3,90
0
Ther
mos
tat,
£1,2
00Heat
pum
p +U
nder
floor
+ M
VHR,
£16
,600
PV 4
kWp,
£7,
000
Max
. ins
., £1
,100
Q50
-5,
£1,
100
100m
m e
xt.,
£2,9
00
120m
m P
IR, £
3,50
0
Trip
le ti
mbe
r, £7
,800
Smar
t The
rmos
tat,
£1,2
00
A ra
ted
gas b
oile
r, £5
,400
, Max
. ins
., £1
,100
Q50
-10
, £1,
100
85m
m in
t., £
2,20
0
Seco
ndar
y, £
2,60
0
Ther
mos
tat,
£1,2
00Heat
pum
p +U
nder
floor
+ M
VHR,
£16
,600
PV 4
kWp
+ 2m
2 so
l.th
+ 2b
at.,
£16,
000
Max
. ins
., £1
,100
Q50
-10
, £1,
100
100m
m e
xt.,
£2,9
00
120m
m P
IR, £
3,50
0
Stan
dard
UPV
C, £
3,90
0
Ther
mos
tat,
£1,2
00
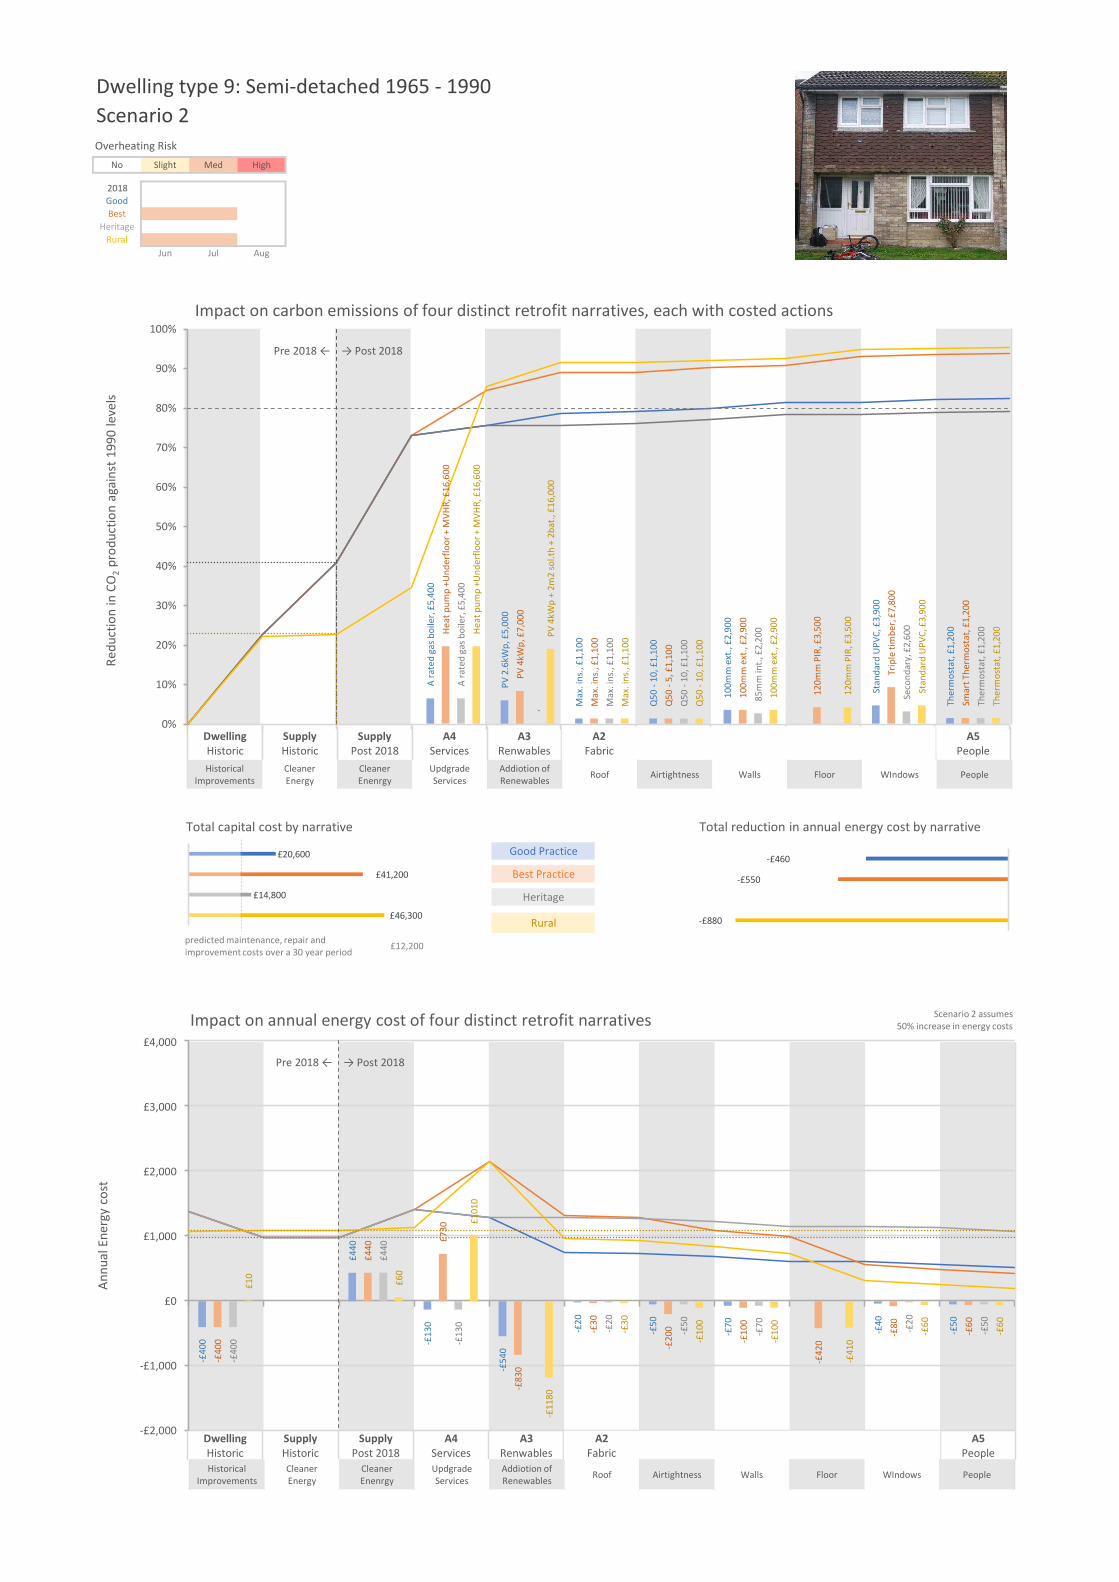
Dwelling type 9: Semi-detached 1965 - 1990Scenario 2
No Slight Med High
2018GoodBest
HeritageRural
Jun Jul Aug
Good Practice
Best Practice
Heritage
Rural
£12,200
Overheating Risk
Impact on annual energy cost of four distinct retrofit narratives
Pre 2018 ← → Post 2018
-£40
0
£440
-£13
0
-£54
0
-£20
-£50
-£70 -£40
-£50
-£40
0
£440
£730
-£83
0
-£30
-£20
0
-£10
0
-£42
0
-£80
-£60
-£40
0
£440
-£13
0 -£20
-£50
-£70 -£20
-£50
£10
£60
£101
0
-£11
80
-£30
-£10
0
-£10
0
-£41
0
-£60
-£60
-£2,000
-£1,000
£0
£1,000
£2,000
£3,000
£4,000
Annu
al E
nerg
y co
st
Pre 2018 ← → Post 2018
0%
10%
20%
30%
40%
50%
60%
70%
80%
90%
100%
Redu
ctio
n in
CO
2pr
oduc
tion
agai
nst 1
990
leve
ls
Impact on carbon emissions of four distinct retrofit narratives, each with costed actions
A ra
ted
gas b
oile
r, £5
,400
PV 2
.6kW
p, £
5,00
0
Max
. ins
., £1
,100
Q50
-10
, £1,
100
100m
m e
xt.,
£2,9
00
Stan
dard
UPV
C, £
3,90
0
Ther
mos
tat,
£1,2
00Heat
pum
p +U
nder
floor
+ M
VHR,
£16
,600
PV 4
kWp,
£7,
000
Max
. ins
., £1
,100
Q50
-5,
£1,
100
100m
m e
xt.,
£2,9
00
120m
m P
IR, £
3,50
0
Trip
le ti
mbe
r, £7
,800
Smar
t The
rmos
tat,
£1,2
00
A ra
ted
gas b
oile
r, £5
,400
, Max
. ins
., £1
,100
Q50
-10
, £1,
100
85m
m in
t., £
2,20
0
Seco
ndar
y, £
2,60
0
Ther
mos
tat,
£1,2
00Heat
pum
p +U
nder
floor
+ M
VHR,
£16
,600
PV 4
kWp
+ 2m
2 so
l.th
+ 2b
at.,
£16,
000
Max
. ins
., £1
,100
Q50
-10
, £1,
100
100m
m e
xt.,
£2,9
00
120m
m P
IR, £
3,50
0
Stan
dard
UPV
C, £
3,90
0
Ther
mos
tat,
£1,2
00
HistoricalImprovements
CleanerEnergy
CleanerEnenrgy
UpdgradeServices
Addiotion ofRenewables Roof Airtightness Walls Floor WIndows People
DwellingHistoric
SupplyHistoric
SupplyPost 2018
A4Services
A3Renwables
A2Fabric
A5People
DwellingHistoric
SupplyHistoric
SupplyPost 2018
A4Services
A3Renwables
A2Fabric
A5People
HistoricalImprovements
CleanerEnergy
CleanerEnenrgy
UpdgradeServices
Addiotion ofRenewables Roof Airtightness Walls Floor WIndows People
-£460
-£550
-£880
Total reduction in annual energy cost by narrative
Scenario 2 assumes50% increase in energy costs
£20,600
£41,200
£14,800
£46,300
Total capital cost by narrative
predicted maintenance, repair and improvement costs over a 30 year period

Dwelling type 10: Detached 1965 - 1990Scenario 1
No Slight Med High
2018GoodBest
HeritageRural
Jun Jul Aug
Good Practice
Best Practice
Heritage
Rural
£19,700
Overheating Risk
Pre 2018 ← → Post 2018
0%
10%
20%
30%
40%
50%
60%
70%
80%
90%
100%
Redu
ctio
n in
CO
2pr
oduc
tion
agai
nst 1
990
leve
ls
Impact on carbon emissions of four distinct retrofit narratives, each with costed actions
Impact on annual energy cost of four distinct retrofit narratives
Pre 2018 ← → Post 2018
-£65
0
-£13
0
-£36
0
-£20
-£40
-£90 -£40
-£40
-£65
0
£580
-£55
0
-£30
-£20
0
-£13
0
-£48
0
-£90 -£50
-£65
0
-£13
0 -£20
-£40
-£90 -£
20
-£40
-£20
£350
-£79
0
-£30
-£10
0
-£13
0
-£48
0
-£60
-£50
-£2,000
-£1,000
£0
£1,000
£2,000
£3,000
Annu
al E
nerg
y co
st
HistoricalImprovements
CleanerEnergy
CleanerEnenrgy
UpdgradeServices
Addiotion ofRenewables Roof Airtightness Walls Floor WIndows People
DwellingHistoric
SupplyHistoric
SupplyPost 2018
A4Services
A3Renwables
A2Fabric
A5People
DwellingHistoric
SupplyHistoric
SupplyPost 2018
A4Services
A3Renwables
A2Fabric
A5People
HistoricalImprovements
CleanerEnergy
CleanerEnenrgy
UpdgradeServices
Addiotion ofRenewables Roof Airtightness Walls Floor WIndows People
-£730
-£950
-£350
-£1,300
Total reduction in annual energy cost by narrative
Scenario 1 assumesno change in energy costs
£30,100
£61,100
£23,600
£64,300
Total capital cost by narrative
predicted maintenance, repair and improvement costs over a 30 year period
A ra
ted
gas b
oile
r, £8
,300
PV 2
.6kW
p, £
5,00
0
Max
. ins
., £1
,800
Q50
-10
, £1,
800
100m
m e
xt.,
£5,6
00
Stan
dard
UPV
C, £
5,80
0
Ther
mos
tat,
£1,8
00Heat
pum
p +U
nder
floor
+ M
VHR,
£25
,600
PV 4
kWp,
£7,
000
Max
. ins
., £1
,800
Q50
-5,
£1,
800
100m
m e
xt.,
£5,6
00
120m
m P
IR, £
5,90
0
Trip
le ti
mbe
r, £1
1,60
0
Smar
t The
rmos
tat,
£1,8
00
A ra
ted
gas b
oile
r, £8
,300
, Max
. ins
., £1
,800
Q50
-10
, £1,
800
85m
m in
t., £
4,20
0
Seco
ndar
y, £
3,90
0
Ther
mos
tat,
£1,8
00Heat
pum
p +U
nder
floor
+ M
VHR,
£25
,600
PV 4
kWp
+ 2m
2 so
l.th
+ 2b
at.,
£16,
000
Max
. ins
., £1
,800
Q50
-10
, £1,
800
100m
m e
xt.,
£5,6
00
120m
m P
IR, £
5,90
0
Stan
dard
UPV
C, £
5,80
0
Ther
mos
tat,
£1,8
00
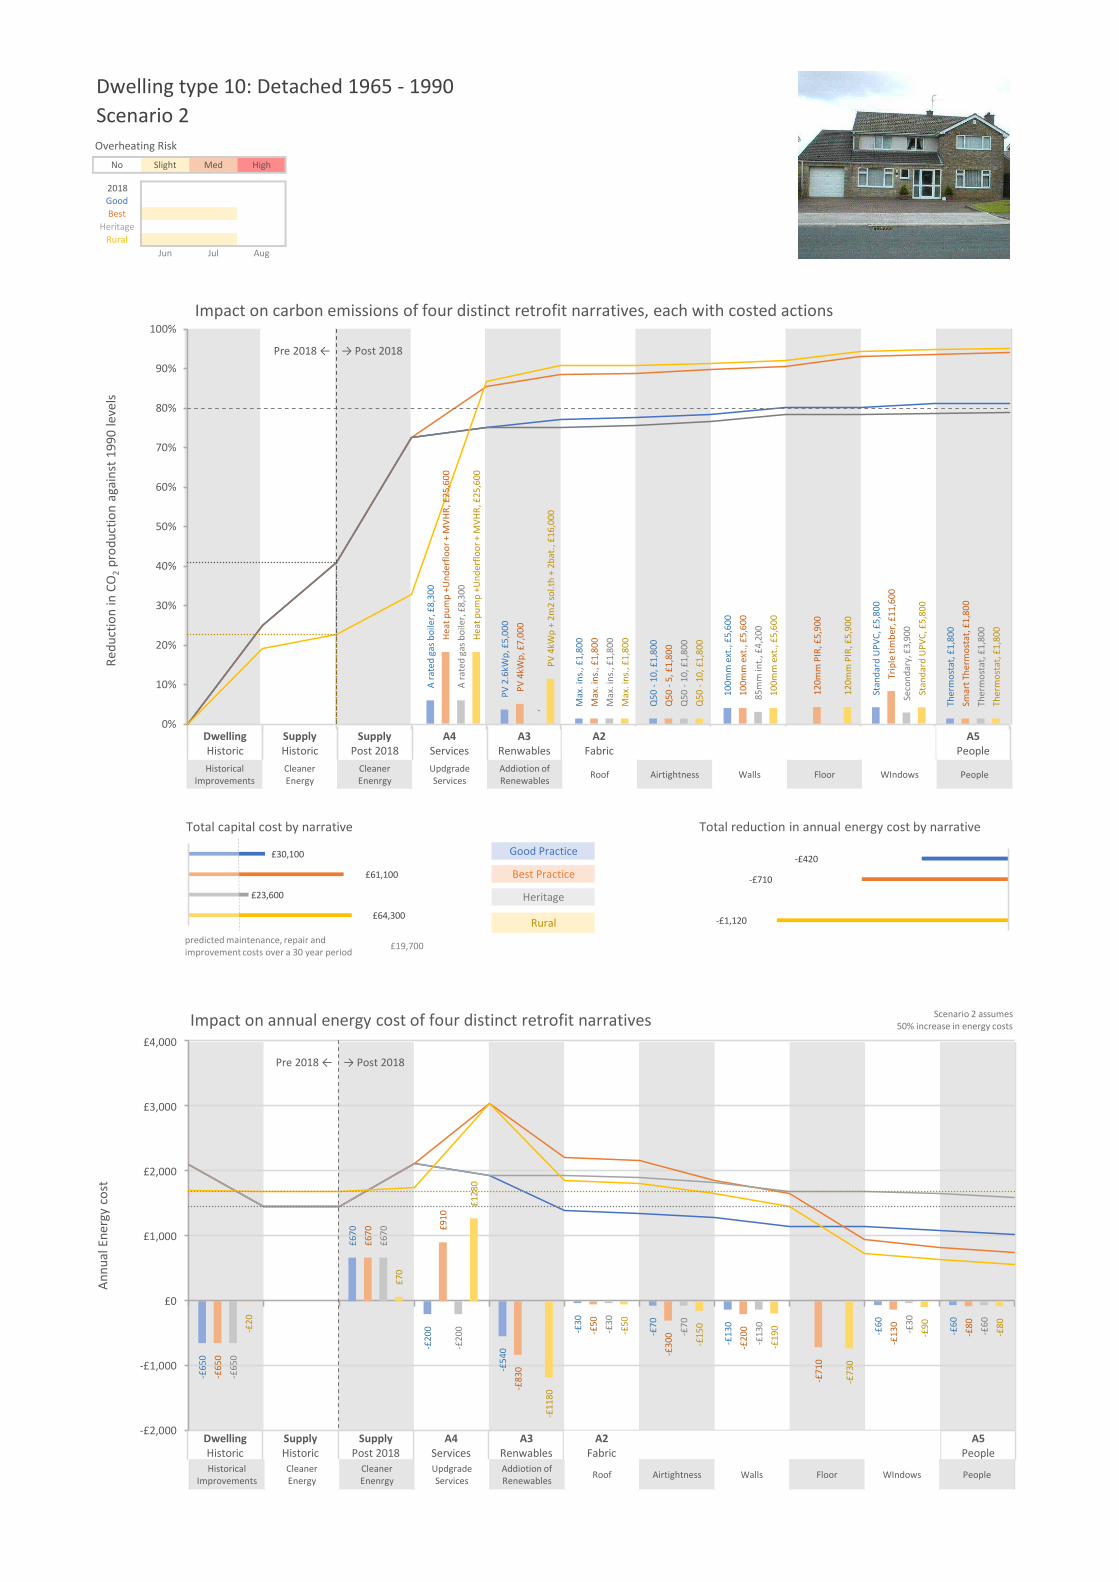
Dwelling type 10: Detached 1965 - 1990Scenario 2
No Slight Med High
2018GoodBest
HeritageRural
Jun Jul Aug
Good Practice
Best Practice
Heritage
Rural
£19,700
Overheating Risk
Impact on annual energy cost of four distinct retrofit narratives
Pre 2018 ← → Post 2018
-£65
0
£670
-£20
0
-£54
0
-£30
-£70
-£13
0
-£60
-£60
-£65
0
£670 £9
10
-£83
0
-£50
-£30
0
-£20
0
-£71
0
-£13
0
-£80
-£65
0
£670
-£20
0 -£30
-£70
-£13
0
-£30
-£60-£20
£70
£128
0
-£11
80
-£50
-£15
0
-£19
0
-£73
0
-£90
-£80
-£2,000
-£1,000
£0
£1,000
£2,000
£3,000
£4,000
Annu
al E
nerg
y co
st
Pre 2018 ← → Post 2018
0%
10%
20%
30%
40%
50%
60%
70%
80%
90%
100%
Redu
ctio
n in
CO
2pr
oduc
tion
agai
nst 1
990
leve
ls
Impact on carbon emissions of four distinct retrofit narratives, each with costed actions
A ra
ted
gas b
oile
r, £8
,300
PV 2
.6kW
p, £
5,00
0
Max
. ins
., £1
,800
Q50
-10
, £1,
800
100m
m e
xt.,
£5,6
00
Stan
dard
UPV
C, £
5,80
0
Ther
mos
tat,
£1,8
00Heat
pum
p +U
nder
floor
+ M
VHR,
£25
,600
PV 4
kWp,
£7,
000
Max
. ins
., £1
,800
Q50
-5,
£1,
800
100m
m e
xt.,
£5,6
00
120m
m P
IR, £
5,90
0
Trip
le ti
mbe
r, £1
1,60
0
Smar
t The
rmos
tat,
£1,8
00
A ra
ted
gas b
oile
r, £8
,300
, Max
. ins
., £1
,800
Q50
-10
, £1,
800
85m
m in
t., £
4,20
0
Seco
ndar
y, £
3,90
0
Ther
mos
tat,
£1,8
00Heat
pum
p +U
nder
floor
+ M
VHR,
£25
,600
PV 4
kWp
+ 2m
2 so
l.th
+ 2b
at.,
£16,
000
Max
. ins
., £1
,800
Q50
-10
, £1,
800
100m
m e
xt.,
£5,6
00
120m
m P
IR, £
5,90
0
Stan
dard
UPV
C, £
5,80
0
Ther
mos
tat,
£1,8
00
HistoricalImprovements
CleanerEnergy
CleanerEnenrgy
UpdgradeServices
Addiotion ofRenewables Roof Airtightness Walls Floor WIndows People
DwellingHistoric
SupplyHistoric
SupplyPost 2018
A4Services
A3Renwables
A2Fabric
A5People
DwellingHistoric
SupplyHistoric
SupplyPost 2018
A4Services
A3Renwables
A2Fabric
A5People
HistoricalImprovements
CleanerEnergy
CleanerEnenrgy
UpdgradeServices
Addiotion ofRenewables Roof Airtightness Walls Floor WIndows People
-£420
-£710
-£1,120
Total reduction in annual energy cost by narrative
Scenario 2 assumes50% increase in energy costs
£30,100
£61,100
£23,600
£64,300
Total capital cost by narrative
predicted maintenance, repair and improvement costs over a 30 year period

Dwelling type 11: Flat 1965 - 1990Scenario 1
No Slight Med High
2018GoodBest
HeritageRural
Jun Jul Aug
Good Practice
Best Practice
Heritage
Rural
£16,500
Overheating Risk
Pre 2018 ← → Post 2018
0%
10%
20%
30%
40%
50%
60%
70%
80%
90%
100%
Redu
ctio
n in
CO
2pr
oduc
tion
agai
nst 1
990
leve
ls
Impact on carbon emissions of four distinct retrofit narratives, each with costed actions
Impact on annual energy cost of four distinct retrofit narratives
Pre 2018 ← → Post 2018
-£32
0
-£60
-£36
0
-£60
-£50
-£60 -£30
-£32
0
£410
-£55
0
-£17
0 -£70
-£90 -£40
-£32
0
-£60
-£60
-£50
-£30
-£30
-£38
0
-£63
0
-£79
0
-£80
-£70
-£80 -£40
-£2,000
-£1,000
£0
£1,000
£2,000
£3,000
Annu
al E
nerg
y co
st
HistoricalImprovements
CleanerEnergy
CleanerEnenrgy
UpdgradeServices
Addiotion ofRenewables Roof Airtightness Walls Floor WIndows People
DwellingHistoric
SupplyHistoric
SupplyPost 2018
A4Services
A3Renwables
A2Fabric
A5People
DwellingHistoric
SupplyHistoric
SupplyPost 2018
A4Services
A3Renwables
A2Fabric
A5People
HistoricalImprovements
CleanerEnergy
CleanerEnenrgy
UpdgradeServices
Addiotion ofRenewables Roof Airtightness Walls Floor WIndows People
-£620
-£520
-£240
-£1,690
Total reduction in annual energy cost by narrative
Scenario 1 assumesno change in energy costs
£26,400
£46,000
£18,000
£47,500
Total capital cost by narrative
predicted maintenance, repair and improvement costs over a 30 year period
A ra
ted
gas b
oile
r, £5
,900
PV 2
.6kW
p, £
5,00
0
Max
. ins
., £2
,400
Q50
-10
, £1,
200
100m
m e
xt.,
£3,0
00
Stan
dard
UPV
C, £
7,60
0
Ther
mos
tat,
£1,3
00Heat
pum
p +U
nder
floor
+ M
VHR,
£16
,000
PV 4
kWp,
£7,
000
Max
. ins
., £2
,400
Q50
-5,
£1,
200
100m
m e
xt.,
£3,0
00
,
Trip
le ti
mbe
r, £1
5,10
0
Smar
t The
rmos
tat,
£1,3
00
A ra
ted
gas b
oile
r, £5
,900
,
Max
. ins
., £2
,400
Q50
-10
, £1,
200
85m
m in
t., £
2,20
0
Seco
ndar
y, £
5,00
0
Ther
mos
tat,
£1,3
00Heat
pum
p +U
nder
floor
+ M
VHR,
£16
,000
PV 4
kWp
+ 2m
2 so
l.th
+ 2b
at.,
£16,
000
Max
. ins
., £2
,400
Q50
-10
, £1,
200
100m
m e
xt.,
£3,0
00
,
Stan
dard
UPV
C, £
7,60
0
Ther
mos
tat,
£1,3
00
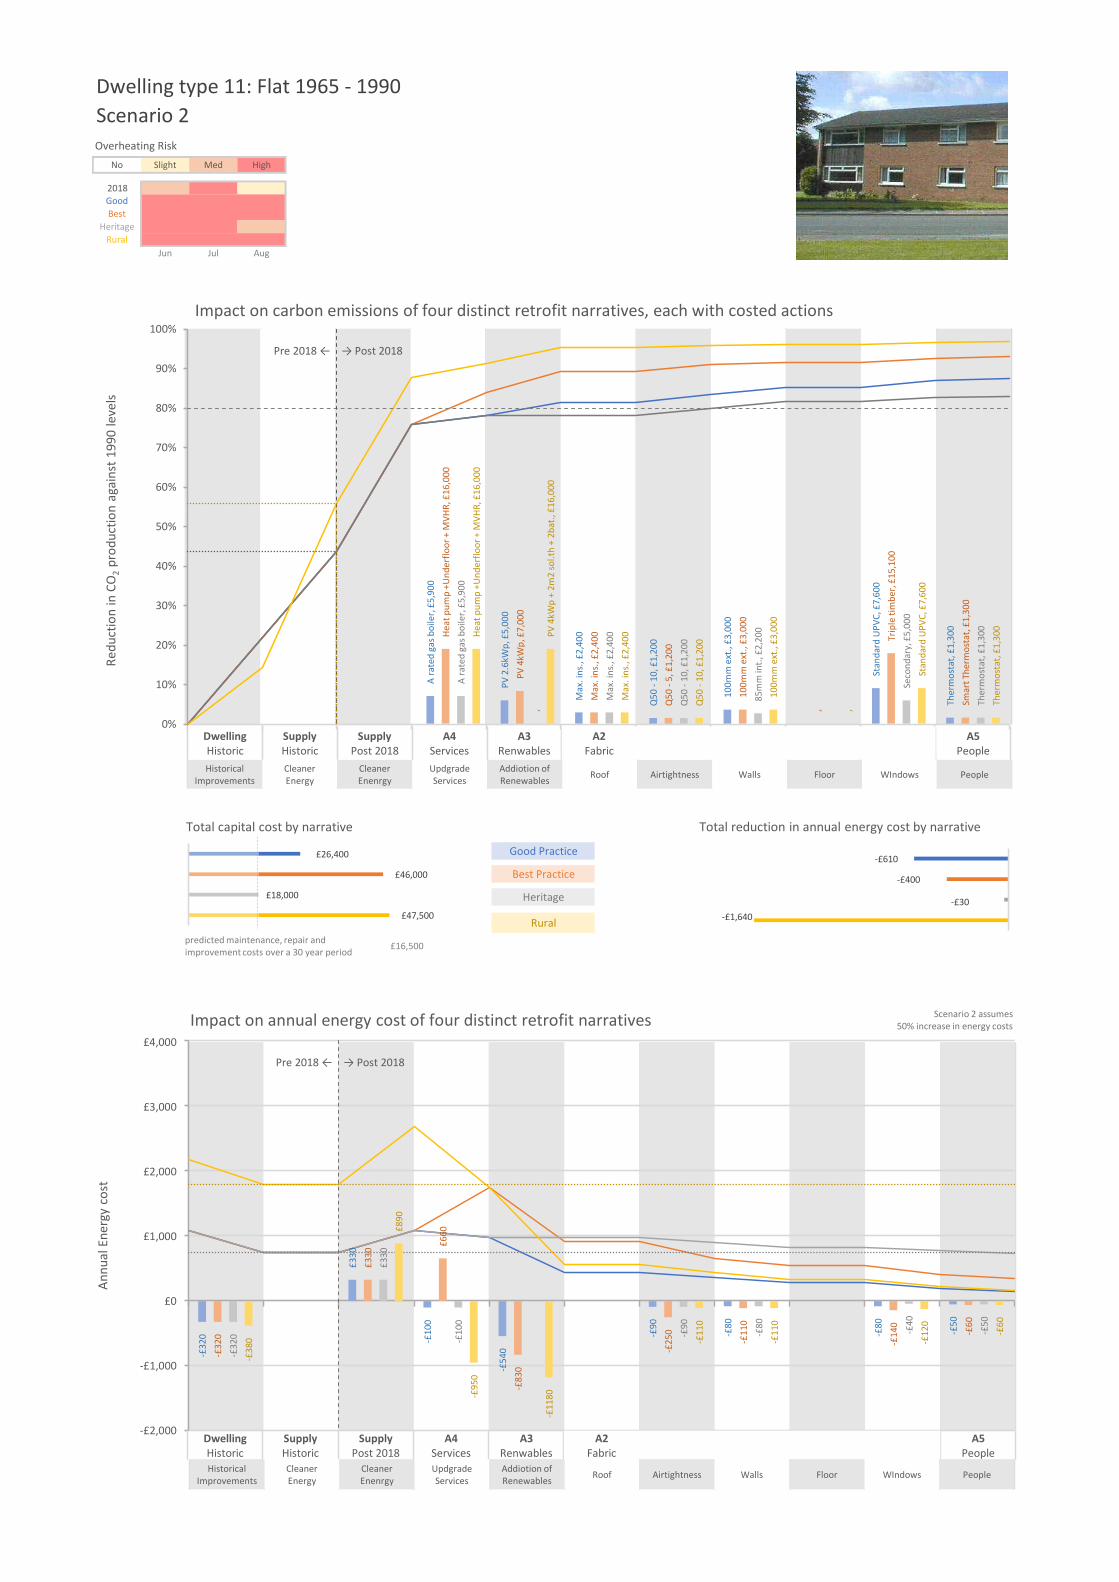
Dwelling type 11: Flat 1965 - 1990Scenario 2
No Slight Med High
2018GoodBest
HeritageRural
Jun Jul Aug
Good Practice
Best Practice
Heritage
Rural
£16,500
Overheating Risk
Impact on annual energy cost of four distinct retrofit narratives
Pre 2018 ← → Post 2018
-£32
0
£330
-£10
0
-£54
0
-£90
-£80
-£80 -£50
-£32
0
£330
£660
-£83
0
-£25
0
-£11
0
-£14
0
-£60
-£32
0
£330
-£10
0
-£90
-£80 -£40
-£50
-£38
0
£890
-£95
0
-£11
80
-£11
0
-£11
0
-£12
0
-£60
-£2,000
-£1,000
£0
£1,000
£2,000
£3,000
£4,000
Annu
al E
nerg
y co
st
Pre 2018 ← → Post 2018
0%
10%
20%
30%
40%
50%
60%
70%
80%
90%
100%
Redu
ctio
n in
CO
2pr
oduc
tion
agai
nst 1
990
leve
ls
Impact on carbon emissions of four distinct retrofit narratives, each with costed actions
A ra
ted
gas b
oile
r, £5
,900
PV 2
.6kW
p, £
5,00
0
Max
. ins
., £2
,400
Q50
-10
, £1,
200
100m
m e
xt.,
£3,0
00
Stan
dard
UPV
C, £
7,60
0
Ther
mos
tat,
£1,3
00Heat
pum
p +U
nder
floor
+ M
VHR,
£16
,000
PV 4
kWp,
£7,
000
Max
. ins
., £2
,400
Q50
-5,
£1,
200
100m
m e
xt.,
£3,0
00
,
Trip
le ti
mbe
r, £1
5,10
0
Smar
t The
rmos
tat,
£1,3
00
A ra
ted
gas b
oile
r, £5
,900
,
Max
. ins
., £2
,400
Q50
-10
, £1,
200
85m
m in
t., £
2,20
0
Seco
ndar
y, £
5,00
0
Ther
mos
tat,
£1,3
00Heat
pum
p +U
nder
floor
+ M
VHR,
£16
,000
PV 4
kWp
+ 2m
2 so
l.th
+ 2b
at.,
£16,
000
Max
. ins
., £2
,400
Q50
-10
, £1,
200
100m
m e
xt.,
£3,0
00
,
Stan
dard
UPV
C, £
7,60
0
Ther
mos
tat,
£1,3
00
HistoricalImprovements
CleanerEnergy
CleanerEnenrgy
UpdgradeServices
Addiotion ofRenewables Roof Airtightness Walls Floor WIndows People
DwellingHistoric
SupplyHistoric
SupplyPost 2018
A4Services
A3Renwables
A2Fabric
A5People
DwellingHistoric
SupplyHistoric
SupplyPost 2018
A4Services
A3Renwables
A2Fabric
A5People
HistoricalImprovements
CleanerEnergy
CleanerEnenrgy
UpdgradeServices
Addiotion ofRenewables Roof Airtightness Walls Floor WIndows People
-£610
-£400
-£30-£1,640
Total reduction in annual energy cost by narrative
Scenario 2 assumes50% increase in energy costs
£26,400
£46,000
£18,000
£47,500
Total capital cost by narrative
predicted maintenance, repair and improvement costs over a 30 year period

Dwelling type 12: Semi-detached post 1990Scenario 1
No Slight Med High
2018GoodBest
HeritageRural
Jun Jul Aug
Good Practice
Best Practice
Heritage
Rural
£11,800
Overheating Risk
Pre 2018 ← → Post 2018
0%
10%
20%
30%
40%
50%
60%
70%
80%
90%
100%
Redu
ctio
n in
CO
2pr
oduc
tion
agai
nst 1
990
leve
ls
Impact on carbon emissions of four distinct retrofit narratives, each with costed actions
Impact on annual energy cost of four distinct retrofit narratives
Pre 2018 ← → Post 2018
-£23
0 -£70
-£36
0
-£30
-£50
-£30
-£30
-£23
0
£400
-£55
0
-£12
0
-£70
-£70
-£50
-£40
-£23
0 -£70 -£30
-£50 -£10
-£30
£60
£360
-£79
0
-£50
-£70
-£70 -£40
-£40
-£2,000
-£1,000
£0
£1,000
£2,000
£3,000
Annu
al E
nerg
y co
st
HistoricalImprovements
CleanerEnergy
CleanerEnenrgy
UpdgradeServices
Addiotion ofRenewables Roof Airtightness Walls Floor WIndows People
DwellingHistoric
SupplyHistoric
SupplyPost 2018
A4Services
A3Renwables
A2Fabric
A5People
DwellingHistoric
SupplyHistoric
SupplyPost 2018
A4Services
A3Renwables
A2Fabric
A5People
HistoricalImprovements
CleanerEnergy
CleanerEnenrgy
UpdgradeServices
Addiotion ofRenewables Roof Airtightness Walls Floor WIndows People
-£570
-£510
-£200
-£700
Total reduction in annual energy cost by narrative
Scenario 1 assumesno change in energy costs
£18,900
£38,700
£12,000
£44,100
Total capital cost by narrative
predicted maintenance, repair and improvement costs over a 30 year period
A ra
ted
gas b
oile
r, £5
,300
PV 2
.6kW
p, £
5,00
0
, Q50
-10
, £1,
000
100m
m e
xt.,
£2,9
00
Stan
dard
UPV
C, £
3,60
0
Ther
mos
tat,
£1,1
00Heat
pum
p +U
nder
floor
+ M
VHR,
£16
,100
PV 4
kWp,
£7,
000
, Q50
-5,
£1,
000
100m
m e
xt.,
£2,9
00
120m
m P
IR, £
3,40
0
Trip
le ti
mbe
r, £7
,200
Smar
t The
rmos
tat,
£1,1
00
A ra
ted
gas b
oile
r, £5
,300
, , Q50
-10
, £1,
000
85m
m in
t., £
2,20
0
Seco
ndar
y, £
2,40
0
Ther
mos
tat,
£1,1
00Heat
pum
p +U
nder
floor
+ M
VHR,
£16
,100
PV 4
kWp
+ 2m
2 so
l.th
+ 2b
at.,
£16,
000
, Q50
-10
, £1,
000
100m
m e
xt.,
£2,9
00
120m
m P
IR, £
3,40
0
Stan
dard
UPV
C, £
3,60
0
Ther
mos
tat,
£1,1
00

Dwelling type 12: Semi-detached post 1990Scenario 2
No Slight Med High
2018GoodBest
HeritageRural
Jun Jul Aug
Good Practice
Best Practice
Heritage
Rural
£11,800
Overheating Risk
Impact on annual energy cost of four distinct retrofit narratives
Pre 2018 ← → Post 2018
-£23
0
£340
-£10
0
-£54
0
-£50
-£80 -£40
-£50
-£23
0
£340
£650
-£83
0
-£18
0
-£11
0
-£10
0
-£80
-£60
-£23
0
£340
-£10
0
-£50
-£80 -£20
-£50
£60
£60
£890
-£11
80
-£70
-£11
0
-£11
0
-£60
-£60
-£2,000
-£1,000
£0
£1,000
£2,000
£3,000
£4,000
Annu
al E
nerg
y co
st
Pre 2018 ← → Post 2018
0%
10%
20%
30%
40%
50%
60%
70%
80%
90%
100%
Redu
ctio
n in
CO
2pr
oduc
tion
agai
nst 1
990
leve
ls
Impact on carbon emissions of four distinct retrofit narratives, each with costed actions
A ra
ted
gas b
oile
r, £5
,300
PV 2
.6kW
p, £
5,00
0
, Q50
-10
, £1,
000
100m
m e
xt.,
£2,9
00
Stan
dard
UPV
C, £
3,60
0
Ther
mos
tat,
£1,1
00Heat
pum
p +U
nder
floor
+ M
VHR,
£16
,100
PV 4
kWp,
£7,
000
, Q50
-5,
£1,
000
100m
m e
xt.,
£2,9
00
120m
m P
IR, £
3,40
0
Trip
le ti
mbe
r, £7
,200
Smar
t The
rmos
tat,
£1,1
00
A ra
ted
gas b
oile
r, £5
,300
, , Q50
-10
, £1,
000
85m
m in
t., £
2,20
0
Seco
ndar
y, £
2,40
0
Ther
mos
tat,
£1,1
00Heat
pum
p +U
nder
floor
+ M
VHR,
£16
,100
PV 4
kWp
+ 2m
2 so
l.th
+ 2b
at.,
£16,
000
, Q50
-10
, £1,
000
100m
m e
xt.,
£2,9
00
120m
m P
IR, £
3,40
0
Stan
dard
UPV
C, £
3,60
0
Ther
mos
tat,
£1,1
00
HistoricalImprovements
CleanerEnergy
CleanerEnenrgy
UpdgradeServices
Addiotion ofRenewables Roof Airtightness Walls Floor WIndows People
DwellingHistoric
SupplyHistoric
SupplyPost 2018
A4Services
A3Renwables
A2Fabric
A5People
DwellingHistoric
SupplyHistoric
SupplyPost 2018
A4Services
A3Renwables
A2Fabric
A5People
HistoricalImprovements
CleanerEnergy
CleanerEnenrgy
UpdgradeServices
Addiotion ofRenewables Roof Airtightness Walls Floor WIndows People
-£520
-£370
-£650
Total reduction in annual energy cost by narrative
Scenario 2 assumes50% increase in energy costs
£18,900
£38,700
£12,000
£44,100
Total capital cost by narrative
predicted maintenance, repair and improvement costs over a 30 year period

Dwelling type 13: Detached post 1990Scenario 1
No Slight Med High
2018GoodBest
HeritageRural
Jun Jul Aug
Good Practice
Best Practice
Heritage
Rural
£19,400
Overheating Risk
Pre 2018 ← → Post 2018
0%
10%
20%
30%
40%
50%
60%
70%
80%
90%
100%
Redu
ctio
n in
CO
2pr
oduc
tion
agai
nst 1
990
leve
ls
Impact on carbon emissions of four distinct retrofit narratives, each with costed actions
Impact on annual energy cost of four distinct retrofit narratives
Pre 2018 ← → Post 2018
-£35
0 -£10
0
-£36
0
-£50
-£10
0
-£50
-£40
-£35
0
£490
-£55
0
-£20
0
-£13
0
-£10
0
-£90 -£50
-£35
0 -£10
0
-£50
-£10
0
-£30
-£40
£90
£360
-£79
0
-£10
0
-£13
0
-£11
0
-£70
-£50
-£2,000
-£1,000
£0
£1,000
£2,000
£3,000
Annu
al E
nerg
y co
st
HistoricalImprovements
CleanerEnergy
CleanerEnenrgy
UpdgradeServices
Addiotion ofRenewables Roof Airtightness Walls Floor WIndows People
DwellingHistoric
SupplyHistoric
SupplyPost 2018
A4Services
A3Renwables
A2Fabric
A5People
DwellingHistoric
SupplyHistoric
SupplyPost 2018
A4Services
A3Renwables
A2Fabric
A5People
HistoricalImprovements
CleanerEnergy
CleanerEnenrgy
UpdgradeServices
Addiotion ofRenewables Roof Airtightness Walls Floor WIndows People
-£690
-£640
-£310
-£890
Total reduction in annual energy cost by narrative
Scenario 1 assumesno change in energy costs
£27,900
£58,100
£19,600
£61,100
Total capital cost by narrative
predicted maintenance, repair and improvement costs over a 30 year period
A ra
ted
gas b
oile
r, £8
,000
PV 2
.6kW
p, £
5,00
0
, Q50
-10
, £1,
700
100m
m e
xt.,
£5,4
00
Stan
dard
UPV
C, £
6,00
0
Ther
mos
tat,
£1,8
00
Heat
pum
p +U
nder
floor
+ M
VHR,
£24
,600
PV 4
kWp,
£7,
000
, Q50
-5,
£1,
700
100m
m e
xt.,
£5,4
00
120m
m P
IR, £
5,60
0
Trip
le ti
mbe
r, £1
2,00
0
Smar
t The
rmos
tat,
£1,8
00
A ra
ted
gas b
oile
r, £8
,000
, , Q50
-10
, £1,
700
85m
m in
t., £
4,10
0
Seco
ndar
y, £
4,00
0
Ther
mos
tat,
£1,8
00
Heat
pum
p +U
nder
floor
+ M
VHR,
£24
,600
PV 4
kWp
+ 2m
2 so
l.th
+ 2b
at.,
£16,
000
, Q50
-10
, £1,
700
100m
m e
xt.,
£5,4
00
120m
m P
IR, £
5,60
0
Stan
dard
UPV
C, £
6,00
0
Ther
mos
tat,
£1,8
00

Dwelling type 13: Detached post 1990Scenario 2
No Slight Med High
2018GoodBest
HeritageRural
Jun Jul Aug
Good Practice
Best Practice
Heritage
Rural
£19,400
Overheating Risk
Impact on annual energy cost of four distinct retrofit narratives
Pre 2018 ← → Post 2018
-£35
0
£510
-£14
0
-£54
0
-£70
-£15
0
-£70
-£60
-£35
0
£510
£780
-£83
0
-£30
0
-£20
0
-£15
0
-£14
0
-£70
-£35
0
£510
-£14
0
-£70
-£15
0 -£40
-£60
£90
£70
£109
0
-£11
80
-£15
0
-£20
0
-£17
0
-£10
0
-£70
-£2,000
-£1,000
£0
£1,000
£2,000
£3,000
£4,000
Annu
al E
nerg
y co
st
Pre 2018 ← → Post 2018
0%
10%
20%
30%
40%
50%
60%
70%
80%
90%
100%
Redu
ctio
n in
CO
2pr
oduc
tion
agai
nst 1
990
leve
ls
Impact on carbon emissions of four distinct retrofit narratives, each with costed actions
A ra
ted
gas b
oile
r, £8
,000
PV 2
.6kW
p, £
5,00
0
, Q50
-10
, £1,
700
100m
m e
xt.,
£5,4
00
Stan
dard
UPV
C, £
6,00
0
Ther
mos
tat,
£1,8
00Heat
pum
p +U
nder
floor
+ M
VHR,
£24
,600
PV 4
kWp,
£7,
000
, Q50
-5,
£1,
700
100m
m e
xt.,
£5,4
00
120m
m P
IR, £
5,60
0
Trip
le ti
mbe
r, £1
2,00
0
Smar
t The
rmos
tat,
£1,8
00
A ra
ted
gas b
oile
r, £8
,000
, , Q50
-10
, £1,
700
85m
m in
t., £
4,10
0
Seco
ndar
y, £
4,00
0
Ther
mos
tat,
£1,8
00Heat
pum
p +U
nder
floor
+ M
VHR,
£24
,600
PV 4
kWp
+ 2m
2 so
l.th
+ 2b
at.,
£16,
000
, Q50
-10
, £1,
700
100m
m e
xt.,
£5,4
00
120m
m P
IR, £
5,60
0
Stan
dard
UPV
C, £
6,00
0
Ther
mos
tat,
£1,8
00
HistoricalImprovements
CleanerEnergy
CleanerEnenrgy
UpdgradeServices
Addiotion ofRenewables Roof Airtightness Walls Floor WIndows People
DwellingHistoric
SupplyHistoric
SupplyPost 2018
A4Services
A3Renwables
A2Fabric
A5People
DwellingHistoric
SupplyHistoric
SupplyPost 2018
A4Services
A3Renwables
A2Fabric
A5People
HistoricalImprovements
CleanerEnergy
CleanerEnenrgy
UpdgradeServices
Addiotion ofRenewables Roof Airtightness Walls Floor WIndows People
-£530
-£410
-£720
Total reduction in annual energy cost by narrative
Scenario 2 assumes50% increase in energy costs
£27,900
£58,100
£19,600
£61,100
Total capital cost by narrative
predicted maintenance, repair and improvement costs over a 30 year period

Dwelling type 14: Flat post 1990Scenario 1
No Slight Med High
2018GoodBest
HeritageRural
Jun Jul Aug
Good Practice
Best Practice
Heritage
Rural
£14,000
Overheating Risk
Pre 2018 ← → Post 2018
0%
10%
20%
30%
40%
50%
60%
70%
80%
90%
100%
Redu
ctio
n in
CO
2pr
oduc
tion
agai
nst 1
990
leve
ls
Impact on carbon emissions of four distinct retrofit narratives, each with costed actions
Impact on annual energy cost of four distinct retrofit narratives
Pre 2018 ← → Post 2018
-£18
0 -£60
-£36
0
-£50
-£50
-£40
-£30
-£18
0
£400
-£55
0
-£17
0 -£60
-£70 -£40
-£18
0 -£60
-£50
-£50 -£20
-£30
-£30
-£51
0
-£79
0
-£80
-£70
-£60
-£40
-£2,000
-£1,000
£0
£1,000
£2,000
£3,000
Annu
al E
nerg
y co
st
HistoricalImprovements
CleanerEnergy
CleanerEnenrgy
UpdgradeServices
Addiotion ofRenewables Roof Airtightness Walls Floor WIndows People
DwellingHistoric
SupplyHistoric
SupplyPost 2018
A4Services
A3Renwables
A2Fabric
A5People
DwellingHistoric
SupplyHistoric
SupplyPost 2018
A4Services
A3Renwables
A2Fabric
A5People
HistoricalImprovements
CleanerEnergy
CleanerEnenrgy
UpdgradeServices
Addiotion ofRenewables Roof Airtightness Walls Floor WIndows People
-£590
-£490
-£210
-£1,550
Total reduction in annual energy cost by narrative
Scenario 1 assumesno change in energy costs
£21,100
£37,800
£13,500
£41,000
Total capital cost by narrative
predicted maintenance, repair and improvement costs over a 30 year period
A ra
ted
gas b
oile
r, £5
,300
PV 2
.6kW
p, £
5,00
0
, Q50
-10
, £1,
000
100m
m e
xt.,
£2,9
00
Stan
dard
UPV
C, £
5,80
0
Ther
mos
tat,
£1,1
00
Heat
pum
p +U
nder
floor
+ M
VHR,
£14
,200
PV 4
kWp,
£7,
000
, Q50
-5,
£1,
000
100m
m e
xt.,
£2,9
00
,
Trip
le ti
mbe
r, £1
1,60
0
Smar
t The
rmos
tat,
£1,1
00
A ra
ted
gas b
oile
r, £5
,300
, , Q50
-10
, £1,
000
85m
m in
t., £
2,20
0
Seco
ndar
y, £
3,90
0
Ther
mos
tat,
£1,1
00
Heat
pum
p +U
nder
floor
+ M
VHR,
£14
,200
PV 4
kWp
+ 2m
2 so
l.th
+ 2b
at.,
£16,
000
, Q50
-10
, £1,
000
100m
m e
xt.,
£2,9
00
,
Stan
dard
UPV
C, £
5,80
0
Ther
mos
tat,
£1,1
00

Dwelling type 14: Flat post 1990Scenario 2
No Slight Med High
2018GoodBest
HeritageRural
Jun Jul Aug
Good Practice
Best Practice
Heritage
Rural
£14,000
Overheating Risk
Impact on annual energy cost of four distinct retrofit narratives
Pre 2018 ← → Post 2018
-£18
0
£300
-£90
-£54
0
-£80
-£70
-£60
-£50
-£18
0
£300
£650
-£83
0
-£25
0
-£10
0
-£11
0
-£60
-£18
0
£300
-£90
-£80
-£70 -£30
-£50
-£30
£800
-£77
0
-£11
80
-£12
0
-£11
0
-£80
-£60
-£2,000
-£1,000
£0
£1,000
£2,000
£3,000
£4,000
Annu
al E
nerg
y co
st
Pre 2018 ← → Post 2018
0%
10%
20%
30%
40%
50%
60%
70%
80%
90%
100%
Redu
ctio
n in
CO
2pr
oduc
tion
agai
nst 1
990
leve
ls
Impact on carbon emissions of four distinct retrofit narratives, each with costed actions
A ra
ted
gas b
oile
r, £5
,300
PV 2
.6kW
p, £
5,00
0
, Q50
-10
, £1,
000
100m
m e
xt.,
£2,9
00
Stan
dard
UPV
C, £
5,80
0
Ther
mos
tat,
£1,1
00
Heat
pum
p +U
nder
floor
+ M
VHR,
£14
,200
PV 4
kWp,
£7,
000
, Q50
-5,
£1,
000
100m
m e
xt.,
£2,9
00
,
Trip
le ti
mbe
r, £1
1,60
0
Smar
t The
rmos
tat,
£1,1
00
A ra
ted
gas b
oile
r, £5
,300
, , Q50
-10
, £1,
000
85m
m in
t., £
2,20
0
Seco
ndar
y, £
3,90
0
Ther
mos
tat,
£1,1
00
Heat
pum
p +U
nder
floor
+ M
VHR,
£14
,200
PV 4
kWp
+ 2m
2 so
l.th
+ 2b
at.,
£16,
000
, Q50
-10
, £1,
000
100m
m e
xt.,
£2,9
00
,
Stan
dard
UPV
C, £
5,80
0
Ther
mos
tat,
£1,1
00
HistoricalImprovements
CleanerEnergy
CleanerEnenrgy
UpdgradeServices
Addiotion ofRenewables Roof Airtightness Walls Floor WIndows People
DwellingHistoric
SupplyHistoric
SupplyPost 2018
A4Services
A3Renwables
A2Fabric
A5People
DwellingHistoric
SupplyHistoric
SupplyPost 2018
A4Services
A3Renwables
A2Fabric
A5People
HistoricalImprovements
CleanerEnergy
CleanerEnenrgy
UpdgradeServices
Addiotion ofRenewables Roof Airtightness Walls Floor WIndows People
-£590
-£390
-£20
-£1,520
Total reduction in annual energy cost by narrative
Scenario 2 assumes50% increase in energy costs
£21,100
£37,800
£13,500
£41,000
Total capital cost by narrative
predicted maintenance, repair and improvement costs over a 30 year period

17
Homes of Today for Tomorrow STAGE 2:
Exploring the potential of the Welsh housing stock to meet 2050 decarbonisation targets
appendix B: mapping WFGA goals
“National and international legislation require that greenhouse gas emissions, specifically
carbon dioxide, produced across Wales be reduced by at least 80% of 1990 levels, by 2050.
Decarbonisation at this scale represents a huge national challenge, but also provides
opportunities, particularly in the context of the Wellbeing of Future Generations (Wales) Act.
The housing sector produces around a fifth of all carbon emissions, and has a key part to
play in achieving decarbonisation.” Stage 1 report: Homes of Today for Tomorrow
The Well-being of Future Generations (Wales) Act 2015 (WFGA) demands a focus on long
term gains over short term expedience. The seven goals of the Act go further, establishing
an imperative for housing that is sustainable, resilient, healthy, equitable, cohesive, culturally
aware and responsible:
A globally responsible Wales
Setting higher standards –reducing carbon emissions.
A prosperous Wales An integrated Welsh supply chain –using local resources, creating sustainable economies.
A resilient Wales Future proofing with long term flexibility –adaptability, resilience against climate change.
A healthier Wales Healthier homes promoting physical and mental wellbeing –reducing pressure on the health service.
A more equal Wales Eliminating household poverty –affordable warmth for all.
A Wales of cohesive communities
Improved neighbourhoods –cohesive communities where people want to live.
A Wales of thriving culture and language
Maintaining sense of place and identity –through Wales’ unique heritage and landscape
“Responsible government is not just about delivery in the here and now, vital though it is. It’s
also about looking towards the end of the decade and beyond, with a vision of the Wales we
want for the future.” Rt Hon Carwyn Jones AM, First Minister of Wales

18
The table below maps out the potential benefits associated with each of the seven WFGA goals in more detail, by expressing them as short term aims that might be achieved during construction, as medium term aims that would impact on the dwelling during occupation and as longer term aims that might benefit the wider community or deliver benefits at a regional or even a national scale.
Short term aim(during retrofit)
Medium term aim(the occupied dwelling)
Long term aim(the wider community)
>80% carbon reduction
Low embodied CO2Locking in carbon Reduced CO2 emissions Decarbonising Wales
meeting international trgts
Welsh supply chain
Delivering good valueUsing local resources
More affordable housingWelsh supply chain
Stronger local economiesSkills / community building
Climate resilience
Lower maintenanceAdaptable by the user
Mitigating overheatingResilient to climate change
Reduced pressure on local infrastructure
Healthier homes
Natural resource useBreathable construction
Healthy internal environmentReduced env, impact
Healthier communitiesLess pressure on NHS
Affordable warmth
More efficient systemsLower embodied energy
Reducing heating billsReducing fuel poverty
Affordable warmth for allEnergy positive communities
Community led change
More flexible layoutsChanges by community
More vibrant communitiesDifferent procurement paths
Meeting housing needFlexible high quality homes
Maintaining identity
Preserving heritageSensitivity to context
Maintaining and enhancing local character
Supporting people, comm-unities and distinctive places
“The WFGA requires that commissioners of housing cease thinking purely in terms of capital costs, and encourage the industry to replace construction that drains resources with buildings that generate them – that are energy positive and carbon negative. This perspective shift requires a fundamental step change in Welsh housing standards and existing / established patterns of housing procurement.”
More | Better, Green with Forster (2017) http://orca.cf.ac.uk/id/eprint/98055

19
Homes of Today for Tomorrow STAGE 2:
Exploring the potential of the Welsh housing stock to meet 2050 decarbonisation targets
appendix C: assumptions
Appendix C details the assumptions that have been made in order to model the housing stock condition at three different points in time (1990, 2018 and 2050) in terms of dwelling fabric and heating systems, and for three distinct future narratives (good practice, best practice, heritage and rural narratives). It also details the assumptions that have been made around energy costs and carbon emissions factors, to model three distinct energy supply scenarios, and finally around the capital costs associated with different retrofit actions.
Dwelling fabric
Three data sources were used to make assumptions about the fabric of dwellings types. SAP 2012 document data was used to determine the ‘as built’ parameters for fabric elements.
For the base (1990) models, these ‘as built’ values were updated with data from the housing fact file which allowed an approximation to be made on the likelihood of improvements to fabric up to this date, based on whole UK housing stock statistics.
For the current (2018) models, EPC data was used in a similar manner, to approximate the improvements likely to have been made up to the current date. The EPCs were processed and broken down into 3 age groups and 5 typologies. Statistics on fabric characteristics were used to approximate the current condition of fabric elements for the 14 dwelling types, based on their age and dwelling type.
Fabric EPC data (Wales)
1.7 0.45 1.6 1 0.45 0.35 0.6 1.2 2 2 2.2 3 3.1 0.12 0.16 0.4 0.6 1 1.5 2 None
F pre 1919 84% 16% 0% 0% 0% 3% 0% 0% 96% 0% 4% 33% 48% 14% 4% 7% 3% 2% 1% 20% 49%
F 1919-1983 0% 0% 25% 6% 69% 0% 0% 0% 100% 1% 8% 40% 47% 23% 5% 7% 3% 2% 1% 5% 55%
F post 1983 0% 0% 0% 1% 99% 63% 1% 36% 0% 0% 10% 62% 28% 14% 1% 2% 0% 0% 0% 0% 83%
D pre 1919 89% 11% 0% 0% 0% 7% 0% 1% 92% 0% 5% 31% 54% 41% 8% 13% 6% 4% 2% 25% 0%
D 1919-1983 0% 0% 29% 8% 63% 0% 0% 1% 98% 0% 6% 35% 57% 47% 11% 18% 7% 5% 2% 9% 0%
D post 1983 0% 0% 1% 2% 97% 50% 2% 48% 0% 1% 12% 55% 31% 75% 15% 7% 0% 1% 0% 0% 0%
ET pre 1919 94% 6% 0% 0% 0% 2% 0% 0% 97% 1% 7% 30% 58% 35% 9% 15% 5% 6% 2% 27% 1%
ET 1919-1983 0% 1% 29% 7% 63% 0% 0% 0% 100% 1% 10% 34% 52% 49% 11% 17% 6% 6% 2% 9% 0%
ET post 1983 0% 0% 0% 1% 98% 52% 1% 46% 0% 1% 11% 56% 32% 72% 16% 9% 1% 1% 0% 0% 1%
MT pre 1919 96% 3% 0% 0% 0% 1% 0% 0% 99% 1% 7% 29% 58% 33% 9% 15% 5% 7% 2% 28% 0%
MT 1919-1983 0% 1% 37% 7% 56% 0% 0% 0% 100% 1% 8% 33% 54% 45% 11% 17% 7% 6% 2% 12% 0%
MT post 1983 0% 0% 0% 1% 99% 51% 1% 48% 0% 1% 10% 57% 33% 69% 17% 11% 0% 1% 0% 0% 1%
SD pre 1919 91% 9% 0% 0% 0% 4% 0% 1% 96% 0% 5% 32% 56% 38% 9% 15% 6% 5% 2% 25% 0%
SD 1919-1983 0% 1% 38% 4% 57% 0% 0% 0% 100% 1% 8% 33% 56% 46% 11% 16% 7% 6% 3% 11% 0%
SD post 1983 0% 0% 0% 2% 97% 43% 2% 55% 0% 1% 10% 50% 39% 69% 18% 10% 1% 1% 0% 0% 1%
AgeRoof U value W/m 2/KFloor U value W/m 2/K Window U value W/m 2/KWall U value W/m2/K
Type

20
For the 2050 models, the four retrofit narratives (good practice, best practice, heritage and rural) were each developed into a dwelling fabric specification that anticipates a particular retrofit strategy, as detailed below:
Narrative: good practice best practice heritage rural
Application:In line with current Building Reg.s, heat from gas
Exceeds currentBuilding Reg.s, electric heat
Retrofit limited by historic character, heat from gas
Exceeds currentBuilding Reg.s, off grid electric
A2
fabr
ic
insu
latio
n
Roof 0.16 W/m2°C 0.16 W/m2°C 0.16 W/m2°C 0.16 W/m2°C
Wall internal 0.25 W/m2°C
Wall external 0.30 W/m2°C 0.12 W/m2°C 0.12 W/m2°C
floor - solid 0.16 W/m2°C 0.16 W/m2°C
floor - suspended 0.16 W/m2°C 0.16 W/m2°C
win
dow
s New 1.80 W/m2°C 1.40 W/m2°C 1.80 W/m2°C
Secondary 2.40 W/m2°C
Shading
Airtightness (Q50) 10 5 10 10
A3
rene
wab
les
low
er c
arbo
n so
urce
s
Air source heat pump
CHP
PV 2.6kwp 4kwp 4kwp
Electric battery battery storage
Wind
Solar thermal 2 sqm
Transpired solar Collector
A4
serv
ices
heat
ing
Gas central heating A-rated boiler A-rated boiler
Underfloor Heat pump Heat pump
Storage
Warm air
Hot water combi boiler heat pump combi boiler solar hot water
ventilation natural MVHR Natural MVHR
Simple controls Thermostat Thermostat Thermostat
Smart meters and homes Smart thermostat
Indicative SAP rating 88 90 71 90

21
Heating systems
The following section explains the assumptions that were made in order to model dwelling systems for the 1990 and 2018 models. Each dwelling type has a mains gas connected and a non-connected heating system specification. The mains gas system is the basis for the ‘good practice’, ‘best practice’ and ‘heritage’ narratives whilst off-gas heating is the basis for the ‘rural’ narrative.
For approximating the likely heating system types within dwellings currently and in 1990, EPC data was used to determine the most common heating system within age and typology groups giving an approximation of current heating systems within dwelling types. The Housing Fact file was used to approximate the most likely systems in 1990 based on the changes from 1990 statistics to more recent statistics on heating systems.
Mains gas systems
For the mains gas connected narratives, it was assumed that each dwelling type had regular gas boilers in 1990 and a combi gas boiler of 80% efficiency in 2018 as:
The mode (most common) system for mains gas EPCs was boiler of 80% efficiency
In 2011, 47% of dwellings had combi gas or oil boilers and 38% had condensing gas or oil boilers (86%) (HFF UK)
In 1990, 60% of dwellings had gas central heating and 13% had non centrally heated gas heating
In 1990, only 10.5% of gas or oil boilers were condensing or combi boilers
Mains gas EPC data (Wales)
Type Agemains gas Boiler
(73% eff.)mains gas Boiler
(80% eff.)mains gas Boiler
(85% eff.)F pre 1919 4.4% 88.0% 7.6%F 1919-1983 8.4% 82.3% 9.3%F post 1983 0.9% 81.0% 18.1%D pre 1919 7.2% 86.9% 5.9%D 1919-1983 8.6% 86.1% 5.2%D post 1983 0.7% 90.1% 9.2%ET pre 1919 6.1% 89.9% 4.0%ET 1919-1983 9.0% 85.7% 5.3%ET post 1983 0.7% 85.3% 13.9%MT pre 1919 6.4% 89.8% 3.7%MT 1919-1983 9.8% 85.2% 5.1%MT post 1983 1.2% 84.4% 14.4%SD pre 1919 7.1% 88.4% 4.5%SD 1919-1983 8.0% 87.7% 4.3%SD post 1983 1.2% 89.0% 9.8%
OVERALL 7.2% 87.1% 5.7%

22
Off gas systems
For the off gas (rural) narrative, the most common heating system for 2018 models was assumed to be oil-based combi boilers. Due to the higher proportion of solid fuel use in 1990, these dwelling types were assumed to use the most common solid fuel heating system in 1990 – solid fuel central heating.
Due to the constant presence of electric storage heaters in dwellings between 1990 and 2011, dwelling types identified as using electric storage heaters in 2018 were assumed to have had the same heating in 1990:
The most common system for non mains gas EPCs is either electric storage heaters or oil boilers with efficiency of 77% - see boxed entries in the table above.
In 2011, 47% of dwellings had combi gas or oil boilers and 38% had condensing gas or oil boilers (86%) (HFF UK)
In 1990, 5.8% of all dwellings had solid fuel central heating and 2.4% used non centrally heated solid fuel heating. 2011, 0.7% of all dwellings had solid fuel central heating and 0.1% used non centrally heated solid fuel heating.
In 1990, 2.5% of all dwellings had oil-based central heating and oil-based non central heating was negligible.
In 2011, 3.9% had oil-based central heating and oil-based non central heating was negligible
The % of dwellings with electric heating dropped from 12.3% in 1990 to 9.3% in 2011. Electric storage heaters were the most common type of electric heating in 1990 (7.4% of properties) and in 2011 (7.0% of dwellings)
EPC data: non mains gas (specific to Wales)
Type
Age
elec
tric
_Air
sour
ce h
eat
pum
p_1.
7el
ectr
ic_B
oile
r_0.
85
elec
tric
_Boi
ler_
1
elec
tric
_Gro
und
sour
ce h
eat
pum
p_1.
7el
ectr
ic_G
roun
d so
urce
hea
t pu
mp_
2.3
elec
tric
_Sto
rage
hea
ters
_0
elec
tric
_Sto
rage
hea
ters
_1
LPG
_Boi
ler_
0
LPG
_Boi
ler_
0.64
LPG
_Boi
ler_
0.73
LPG
_Boi
ler_
0.8
LPG
_Boi
ler_
0.85
LPG
_Com
mun
ity_0
.8
oil_
Boile
r_0.
73
oil_
Boile
r_0.
77
oil_
Boile
r_0.
8
oil_
Boile
r_0.
85
biom
ass_
Com
mun
ity_0
.8
no sy
stem
_No
syst
em_1
solid
_Boi
ler_
0.64
woo
d_Bo
iler_
0.52
woo
d_Bo
iler_
0.64
woo
d_Bo
iler_
0.73
mai
ns g
as_B
oile
r_0
mai
ns g
as_C
omm
unity
_0.8
biom
ass_
Com
mun
ity_0
solid
_Boi
ler_
0.52
woo
d_Bo
iler_
0
(bla
nk)_
Boile
r_0
elec
tric
_Gro
und
sour
ce h
eat
pum
p_0
oil_
Boile
r_0
solid
_Boi
ler_
0
0_Bo
iler_
0.64
bioe
than
ol_B
oile
r_0.
52
F pre 1919 0% 5% 1% 0% 0% 0% 67% 0% 1% 3% 0% 0% 0% 0% 4% 1% 0% 10% 8% 0% 0% 0% 0% 0% 0% 0% 0% 0% 0% 0% 0% 0% 0% 0%
F 1919-1983 0% 1% 0% 0% 0% 0% 62% 0% 0% 1% 0% 0% 0% 0% 1% 0% 0% 29% 2% 1% 0% 0% 0% 0% 1% 0% 0% 0% 0% 0% 0% 0% 0% 0%
F post 1983 2% 4% 1% 0% 0% 0% 75% 0% 0% 2% 0% 0% 0% 0% 1% 0% 0% 13% 1% 0% 0% 0% 0% 0% 0% 0% 0% 0% 0% 0% 0% 0% 0% 0%
D pre 1919 1% 0% 0% 0% 1% 0% 8% 0% 3% 9% 0% 0% 0% 7% 48% 10% 0% 0% 1% 3% 0% 6% 0% 0% 0% 0% 0% 0% 0% 0% 0% 0% 0% 0%
D 1919-1983 1% 0% 0% 0% 0% 0% 14% 0% 3% 10% 0% 0% 0% 6% 49% 10% 0% 0% 1% 2% 0% 2% 0% 0% 0% 0% 0% 0% 0% 0% 0% 0% 0% 0%
D post 1983 4% 1% 0% 1% 3% 0% 4% 0% 2% 11% 0% 0% 0% 1% 56% 13% 0% 0% 0% 0% 0% 2% 0% 0% 0% 0% 0% 0% 0% 0% 0% 0% 0% 0%
ET pre 1919 1% 1% 0% 0% 0% 0% 25% 0% 5% 10% 0% 0% 0% 2% 29% 6% 0% 0% 7% 7% 0% 6% 0% 0% 0% 0% 0% 0% 0% 0% 0% 0% 0% 0%
ET 1919-1983 2% 1% 0% 0% 0% 0% 44% 0% 3% 8% 0% 0% 0% 1% 22% 4% 0% 2% 3% 7% 0% 2% 0% 0% 0% 0% 0% 0% 0% 0% 0% 0% 0% 0%
ET post 1983 2% 5% 1% 0% 1% 0% 33% 0% 2% 17% 0% 0% 0% 0% 25% 4% 0% 7% 1% 0% 0% 1% 0% 0% 0% 0% 0% 0% 0% 0% 0% 0% 0% 0%
MT pre 1919 1% 2% 0% 0% 0% 0% 35% 0% 3% 7% 0% 0% 0% 1% 19% 3% 0% 1% 10% 10% 0% 6% 0% 0% 0% 0% 0% 0% 0% 0% 0% 0% 0% 0%
MT 1919-1983 1% 1% 0% 0% 0% 0% 41% 0% 3% 6% 0% 0% 0% 1% 17% 3% 0% 14% 4% 7% 0% 2% 0% 0% 0% 0% 0% 0% 0% 0% 0% 0% 0% 0%
MT post 1983 2% 5% 1% 0% 0% 0% 42% 0% 2% 15% 1% 0% 0% 0% 22% 6% 0% 2% 1% 1% 0% 0% 0% 0% 0% 0% 0% 0% 0% 0% 0% 0% 0% 0%
SD pre 1919 1% 1% 0% 0% 0% 0% 16% 0% 4% 10% 0% 0% 0% 4% 41% 9% 0% 1% 3% 6% 0% 5% 0% 0% 0% 0% 0% 0% 0% 0% 0% 0% 0% 0%
SD 1919-1983 3% 0% 0% 0% 0% 0% 24% 0% 3% 7% 0% 0% 0% 3% 35% 7% 0% 1% 3% 11% 0% 3% 0% 0% 0% 0% 0% 0% 0% 0% 0% 0% 0% 0%
SD post 1983 3% 3% 0% 1% 1% 0% 23% 0% 3% 15% 0% 0% 0% 1% 36% 10% 0% 1% 1% 1% 0% 1% 0% 0% 0% 0% 0% 0% 0% 0% 0% 0% 0% 0%
OVERALL 1% 1% 0% 0% 0% 0% 28% 0% 2% 7% 0% 0% 0% 3% 32% 7% 0% 6% 3% 4% 0% 3% 0% 0% 0% 0% 0% 0% 0% 0% 0% 0% 0% 0%

23
Example Assumptions for 1990 and 2018 models
(dwelling type 1: Pre 1919 End Terrace)
WELSH HOUSING STOCK Dwelling type 1Building Type End terraceConstruction Age pre 1919Stock representation 3.23%
DIMENSIONSAverage of Storeys 1.99Average of Width 6.52Average of Depth 7.66Average of Gnd floor height 2.42Average of first floor height 2.52Average of Front Glazing Ratio 25.8%Average of Back Glazing Ratio 18.2%Ground floor area 49.9First floor area 49.9Number of exposed sides 3External wall area front (net) 19.90External wall area back (net) 19.40External wall area sides (net) 37.80Solid door area front 4Front Glazing area (East) 6.90Back Glazing area (East) 4.30
SERVICES (+ HOT WATER, CONTROLS, VENT.) 1990 (gas connected) 2018 (gas connected) 1990 (off gas) 2018 (off gas)Fuel Gas Gas Solid OilSAP main heating Gas oil boiler Gas oil boiler Solid fuel boiler Gas oil boiler
Main heating descriptionMains gas regular boiler Mains gas combi boiler solid fuel independent boiler oil combi boiler
Efficiency 65% 80.3% 77.7% 78.3%Manufactured date up to 1990 2002 to current 1984 to current 1996 to currentIndex 98 9549 700029 2035
Heat emittersystems with radiators systems with radiators systems with radiators systems with radiators
Hot water description From main heating system From main heating system From main heating system From main heating systemHot water storage (litres) 300 0 300 0Ventilation description natural ventilation natural ventilation natural ventilation natural ventilationVentilation index
Heating controlNo time or thermostatic control of room temperature Programmer, TRVs and bypass
No time or thermostatic control of room temperature Programmer, TRVs and bypass
RENEWABLES 1990 2018PV (kWp)Solar Thermal (m2)Electric Battery
FABRIC 1990 2018
Wall DescriptionSolid Uninsulated Solid Uninsulated
Wall U value 1.7 1.7Wall thermal mass 450 450
Floor descriptionsuspended timber no insulation
suspended timber no insulation
Floor U value 2 2
Roof description50mm insulation 100mm insulation
Roof U value 0.68 0.4
Glazing descriptionSingle glazing Double glazing pre 2002
Glazing U value 4.8 3.1Infiltration (Q50) 15 15
PEOPLE 1990 2018Lights 0% 50%Internal temperature setpoint 18 20Controls (see services)Target water no no
OVERHEATING 1990 2018n - effective air change rate 1 1z (blinds) 0.7 0.7z (overhangs) 0.8 0.8

24
The Excel version of the SAP model adopted for the modelling process allows for different energy costs and emissions factors. This is critical to understand the outcomes for the dwelling models at different points in time (1990, 2018 and 2050) and for the three distinct energy supply scenarios.
Assumptions regarding energy costs and emissions factors are as follows:
EMISSION FACTORS (kg CO2 per kWh) Gas Oil Solid Electricity1990 (based on SAP 2012 data) 0.216 0.298 0.298 0.772
2018 (based on SAP 2012 data) 0.208 0.298 0.298 0.398
Scenario 1 minor further improvements in clean energy supply
0.21 0.298 0.298 0.233
Scenario 2 significant further improvements in clean energy supply
0.11 0.298 0.298 0.11
Scenario 3 transformational change in energy supply
0.001 0.298 0.298 0.001
ENERGY COSTS (p per kWh) Gas Oil Solid Electricity1990 2018 energy costs (SAP
2012)4.32 5.06 4.42 15.32
2018 2018 energy costs (SAP 2012)
4.32 5.06 4.42 15.32
Scenario 1 Assumes no change in energy costs
4.32 5.06 4.42 15.32
Scenario 2 Assumes 50% increase in energy costs
6.48 7.59 6.63 22.98
Scenario 3 Assumes 100% increase in energy costs
8.64 10.12 10.12 30.64

25
Capital costs
Assumptions made by Lee Wakeman cost consultants are as detailed below:
Application:Smaller:GFA 31sqm TFA 62sqm
Larger:GFA 50sqm TFA 100sqm
Notes:
A2
fabr
ic
insu
latio
n
Roof £620 £1,000 Rate of £20/sqm ground floor area (GFA)
Wall internal £1,230 £1,230 Rate of £30/sqm external wall
Wall external – B Regs £1,640 £1,640 Rate of £40/sqm external wall
Wall external – B regs+ £2,255 £2,255 Rate of £55/sqm external wall
floor - solid £1,550 £2,500 Rate of £50/sqm GFA
floor - suspended £1,395 £2,250 Rate of £45/sqm GFA
win
dow
s
New - UPVC £4,500 £4,500 provisional sum of £300/m2 glazing
New - timber £6,750 £6,750 provisional sum of £450/m2 glazing
New – triple, composite £9,000 £9,000 provisional sum of £600/m2 glazing
Secondary £3,000 £3,000 provisional sum of £200/m2 glazing
Shading £1,125 £1,125 provisional sum of £75/m2 glazing
Airtightness (Q50) £620 £1,000 allowance of £10/sqm total floor area (TFA)
A3
rene
wab
les
low
er c
arbo
n so
urce
s
Air source heat pump
£8,180 £11,600 cost at 62sqm dwelling: 5KW ASHP and HWC & immediate controls: £4,650, 7 radiators & valves: £700, Pipes, fittings & all other materials: £650, Labour: £1,400, Electrical works £550
PV – 2.6 kWp £5,000 £5,000 £3,500 PV panels and £1,500 builder's work
PV – 4 kWp £7,000 £7,000 Pro rata as above
Electric battery £5,000 £5,000 Provisional sum
Solar thermal £3,000 £3,000 £2,000 for the system, £1,000 for builder's work
Transpired solar Collect. £8,000 £8,000 5sqm prototype system - better data in due course.
A4
serv
ices
heat
ing
Gas central heating £3,580 £5,100 provisional sum: £3,000 boiler + £500 builder's work
Oil central heating £4,090 £5,800 £3,500 for the boiler and £500 for builder's work
Biomass £7,670 £10,900 £5,000 for the boiler and £2,500 for builder's work
Underfloor £1,085 £1,085 pipes in insulated GF floor or in screed over slab
Storage £1,535 £2,200 £1,000 for the storage and £500 for builder's work
Warm air £7,670 £10,900 £5,000 for the system and £2,500 for builder's work
Hot water £1,025 £1,500 £2,000 for the system and £1,000 for builder's work
MVHR £1,535 £2,200 Base of £1,000 for the MVHR units and ducting and £500 builder's work, pro rata for size of dwelling.
A5
peop
le
Occupants remain in situ £3,080 £4,600
Simple controls £768 £1,110 £750 for controls and builder's work, pro rata for size
Smart meters and homes £768 £1,110 Pro rata as above

Summary of Potential Capital Costs (exlcuding VAT)
V2 - 28 June 2019V2 to increase the 14 house types totalling 85% of the housing stock, up to 100%
Report used for information: 2019 06 06 DECARB stage 2 report SL EG FINAL V2Wales Housing Stock 1,400,000
Type 1End Terrace Pre 1919Percentage of Housing Type: 3.00%
WSA narrative Assumed % to meet 95%
Total number of homes
Estimate of Capital Costs
Minus average Predicted Maintenance, repair and improvement costs over a 30yr period.
Projected costs Total costs Cost per year for 30
years
Rural 15% 6,300 45,400£ 14,600£ 30,800£ 194,040,000£ 6,468,000£ Heritage 20% 8,400 13,700£ 14,600£ 900-£ 7,560,000-£ 252,000-£ Best 65% 27,300 39,700£ 14,600£ 25,100£ 685,230,000£ 22,841,000£
42,000 871,710,000£ 29,057,000£
Type 2Mid Terrace Pre 1919Percentage of Housing Type: 9.00%
WSA narrative Assumed % to meet 95%
Total number of homes
Estimate of Capital Costs
Minus average Predicted Maintenance, repair and improvement costs over a 30yr period.
Projected costs Total costs Cost per year for 30
years
Rural 15% 18,900 39,400£ 11,100£ 28,300£ 534,870,000£ 17,829,000£ Heritage 20% 25,200 10,800£ 11,100£ 300-£ 7,560,000-£ 252,000-£ Best 65% 81,900 33,500£ 11,100£ 22,400£ 1,834,560,000£ 61,152,000£
126,000 2,361,870,000£ 78,729,000£
Type 3Semi-detached Pre 1919Percentage of Housing Type: 4.00%
WSA narrative Assumed % to meet 95%
Total number of homes
Estimate of Capital Costs
Minus average Predicted Maintenance, repair and improvement costs over a 30yr period.
Projected costs Total costs Cost per year for 30
years
Rural 15% 8,400 52,400£ 14,000£ 38,400£ 322,560,000£ 10,752,000£ Heritage 20% 11,200 18,300£ 14,000£ 4,300£ 48,160,000£ 1,605,333£ Best 65% 36,400 47,600£ 14,000£ 33,600£ 1,223,040,000£ 40,768,000£
56,000 1,593,760,000£ 53,125,333£
Type 4Detached Pre 1919Percentage of Housing Type: 7.00%
WSA narrative Assumed % to meet 95%
Total number of homes
Estimate of Capital Costs
Minus average Predicted Maintenance, repair and improvement costs over a 30yr period.
Projected costs Total costs Cost per year for 30
years
Rural 15% 14,700 66,800£ 19,800£ 47,000£ 690,900,000£ 23,030,000£ Heritage 20% 19,600 25,500£ 19,800£ 5,700£ 111,720,000£ 3,724,000£ Best 65% 63,700 63,300£ 19,800£ 43,500£ 2,770,950,000£ 92,365,000£
98,000 3,573,570,000£ 119,119,000£

Type 5Semi-detached 1919-1944Percentage of Housing Type: 5.00%
WSA narrative Assumed % to meet 95%
Total number of homes
Estimate of Capital Costs
Minus average Predicted Maintenance, repair and improvement costs over a 30yr period.
Projected costs Total costs Cost per year for 30
years
Rural 15% 10,500 46,200£ 12,400£ 33,800£ 354,900,000£ 11,830,000£ Heritage 20% 14,000 14,900£ 12,400£ 2,500£ 35,000,000£ 1,166,667£ Best 65% 45,500 41,400£ 12,400£ 29,000£ 1,319,500,000£ 43,983,333£
70,000 1,709,400,000£ 56,980,000£
Type 6Semi-detached 1945-1964Percentage of Housing Type: 10.00%
WSA narrative Assumed % to meet 95%
Total number of homes
Estimate of Capital Costs
Minus average Predicted Maintenance, repair and improvement costs over a 30yr period.
Projected costs Total costs Cost per year for 30
years
Rural 15% 21,000 44,900£ 11,900£ 33,000£ 693,000,000£ 23,100,000£ Heritage 20% 28,000 14,100£ 11,900£ 2,200£ 61,600,000£ 2,053,333£ Best 65% 91,000 39,700£ 11,900£ 27,800£ 2,529,800,000£ 84,326,667£
140,000 3,284,400,000£ 109,480,000£
Type 7End Terrace 1965-1990Percentage of Housing Type: 4.00%
WSA narrative Assumed % to meet 95%
Total number of homes
Estimate of Capital Costs
Minus average Predicted Maintenance, repair and improvement costs over a 30yr period.
Projected costs Total costs Cost per year for 30
years
Rural 15% 8,400 42,300£ 10,600£ 31,700£ 266,280,000£ 8,876,000£ Heritage 20% 11,200 12,800£ 10,600£ 2,200£ 24,640,000£ 821,333£ Best 65% 36,400 36,400£ 10,600£ 25,800£ 939,120,000£ 31,304,000£
56,000 1,230,040,000£ 41,001,333£
Type 8Mid Terrace Pre 1965-1990Percentage of Housing Type: 6.00%
WSA narrative Assumed % to meet 95%
Total number of homes
Estimate of Capital Costs
Minus average Predicted Maintenance, repair and improvement costs over a 30yr period.
Projected costs Total costs Cost per year for 30
years
Rural 15% 12,600 40,900£ 9,300£ 31,600£ 398,160,000£ 13,272,000£ Heritage 20% 16,800 11,700£ 9,300£ 2,400£ 40,320,000£ 1,344,000£ Best 65% 54,600 35,200£ 9,300£ 25,900£ 1,414,140,000£ 47,138,000£
84,000 1,852,620,000£ 61,754,000£
Type 9Semi-detached 1965-1990Percentage of Housing Type: 10.00%
WSA narrative Assumed % to meet 95%
Total number of homes
Estimate of Capital Costs
Minus average Predicted Maintenance, repair and improvement costs over a 30yr period.
Projected costs Total costs Cost per year for 30
years
Rural 15% 21,000 46,300£ 12,200£ 34,100£ 716,100,000£ 23,870,000£ Heritage 20% 28,000 14,800£ 12,200£ 2,600£ 72,800,000£ 2,426,667£ Best 65% 91,000 41,200£ 12,200£ 29,000£ 2,639,000,000£ 87,966,667£
140,000 3,427,900,000£ 114,263,333£

Type 10Detached 1965-1990Percentage of Housing Type: 9.00%
WSA narrative Assumed % to meet 95%
Total number of homes
Estimate of Capital Costs
Minus average Predicted Maintenance, repair and improvement costs over a 30yr period.
Projected costs Total costs Cost per year for 30
years
Rural 15% 18,900 64,300£ 19,700£ 44,600£ 842,940,000£ 28,098,000£ Heritage 20% 25,200 23,600£ 19,700£ 3,900£ 98,280,000£ 3,276,000£ Best 65% 81,900 61,100£ 19,700£ 41,400£ 3,390,660,000£ 113,022,000£
126,000 4,331,880,000£ 144,396,000£
Type 11Flat 1965-1990Percentage of Housing Type: 4.00%
WSA narrative Assumed % to meet 95%
Total number of homes
Estimate of Capital Costs
Minus average Predicted Maintenance, repair and improvement costs over a 30yr period.
Projected costs Total costs Cost per year for 30
years
Rural 15% 8,400 47,500£ 16,500£ 31,000£ 260,400,000£ 8,680,000£ Heritage 20% 11,200 18,000£ 16,500£ 1,500£ 16,800,000£ 560,000£ Best 65% 36,400 46,000£ 16,500£ 29,500£ 1,073,800,000£ 35,793,333£
56,000 1,351,000,000£ 45,033,333£
Type 12Semi-detatched post 1990Percentage of Housing Type: 5.00%
WSA narrative Assumed % to meet 95%
Total number of homes
Estimate of Capital Costs
Minus average Predicted Maintenance, repair and improvement costs over a 30yr period.
Projected costs Total costs Cost per year for 30
years
Rural 15% 10,500 44,100£ 11,800£ 32,300£ 339,150,000£ 11,305,000£ Heritage 20% 14,000 12,000£ 11,800£ 200£ 2,800,000£ 93,333£ Best 65% 45,500 38,700£ 11,800£ 26,900£ 1,223,950,000£ 40,798,333£
70,000 1,565,900,000£ 52,196,667£
Type 13Detatched post 1990Percentage of Housing Type: 7.00%
WSA narrative Assumed % to meet 95%
Total number of homes
Estimate of Capital Costs
Minus average Predicted Maintenance, repair and improvement costs over a 30yr period.
Projected costs Total costs Cost per year for 30
years
Rural 15% 14,700 61,100£ 19,400£ 41,700£ 612,990,000£ 20,433,000£ Heritage 20% 19,600 19,600£ 19,400£ 200£ 3,920,000£ 130,667£ Best 65% 63,700 58,100£ 19,400£ 38,700£ 2,465,190,000£ 82,173,000£
98,000 3,082,100,000£ 102,736,667£
Type 14Flat post 1990Percentage of Housing Type: 1.00%
WSA narrative Assumed % to meet 95%
Total number of homes
Estimate of Capital Costs
Minus average Predicted Maintenance, repair and improvement costs over a 30yr period.
Projected costs Total costs Cost per year for 30
years
Rural 15% 2,100 41,000£ 14,000£ 27,000£ 56,700,000£ 1,890,000£ Heritage 20% 2,800 13,500£ 14,000£ 500-£ 1,400,000-£ 46,667-£ Best 65% 9,100 37,800£ 14,000£ 23,800£ 216,580,000£ 7,219,333£
14,000 271,880,000£ 9,062,667£

Remining 16% of unallocated housing stock Assumed to be in same proportion as House Tyes 1 to 14Percentage of Housing Type: 16.00%
WSA narrative Assumed % to meet 95%
Total number of homes
Estimate of Capital Costs
Minus average Predicted Maintenance, repair and improvement costs over a 30yr period.
Projected costs Total costs Cost per year for 30
years
Rural 15% 33,600 48,757£ 14,000£ 34,757£ 1,167,840,000£ 38,928,000£ Heritage 20% 44,800 15,950£ 14,000£ 1,950£ 87,360,000£ 2,912,000£ Best 65% 145,600 44,264£ 14,000£ 30,264£ 4,406,480,000£ 146,882,667£
224,000 5,661,680,000£ 188,722,667£
Percentage 100.00%
Number 1,400,000 Total costs Cost per year for 30 years
36,169,710,000£ 1,205,657,000£
Totals of Housing Stock


![[BLT] patentKO.com v2.0](https://img.pdfslide.us/doc/110x75/54152e158d7f72356c8b458a/blt-patentkocom-v20.jpg)


![[Blt] 2014년 정부지원사업8월](https://img.pdfslide.us/doc/110x75/54152d5d8d7f72356c8b4589/blt-2014-8.jpg)