Embed Size (px)
Citation preview

1 | P a g e
PICK OF THE WEEK Dec 18, 2017
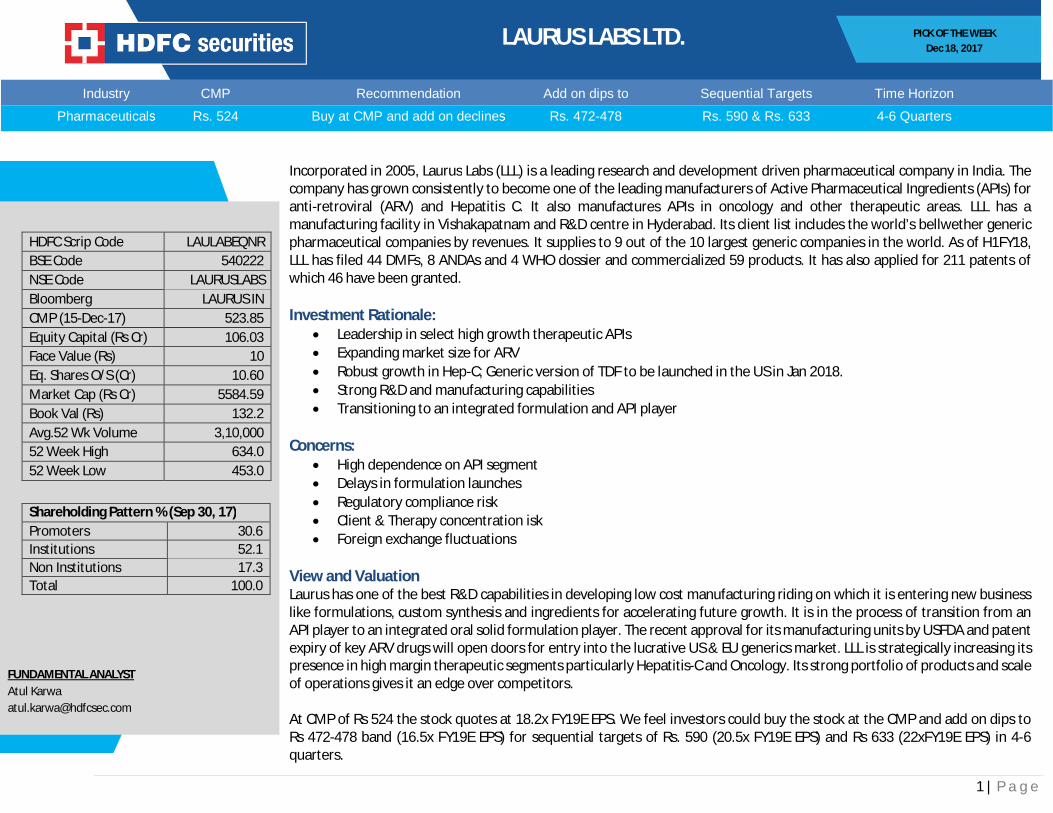
LAURUS LABS LTD.
Recommendation
Buy at CMP and add on declines
Add on dips to
Rs. 472-478
Sequential Targets
Rs. 590 & Rs. 633
Time Horizon
4-6 Quarters
Industry
Pharmaceuticals
CMP
Rs. 524
FUNDAMENTAL ANALYST Atul Karwa [email protected]
HDFC Scrip Code LAULABEQNR BSE Code 540222 NSE Code LAURUSLABS Bloomberg LAURUS IN CMP (15-Dec-17) 523.85 Equity Capital (Rs Cr) 106.03 Face Value (Rs) 10 Eq. Shares O/S (Cr) 10.60 Market Cap (Rs Cr) 5584.59 Book Val (Rs) 132.2 Avg.52 Wk Volume 3,10,000 52 Week High 634.0 52 Week Low 453.0
Shareholding Pattern % (Sep 30, 17) Promoters 30.6 Institutions 52.1 Non Institutions 17.3 Total 100.0
Incorporated in 2005, Laurus Labs (LLL) is a leading research and development driven pharmaceutical company in India. The company has grown consistently to become one of the leading manufacturers of Active Pharmaceutical Ingredients (APIs) for anti-retroviral (ARV) and Hepatitis C. It also manufactures APIs in oncology and other therapeutic areas. LLL has a manufacturing facility in Vishakapatnam and R&D centre in Hyderabad. Its client list includes the world’s bellwether generic pharmaceutical companies by revenues. It supplies to 9 out of the 10 largest generic companies in the world. As of H1FY18, LLL has filed 44 DMFs, 8 ANDAs and 4 WHO dossier and commercialized 59 products. It has also applied for 211 patents of which 46 have been granted. Investment Rationale:
Leadership in select high growth therapeutic APIs Expanding market size for ARV Robust growth in Hep-C; Generic version of TDF to be launched in the US in Jan 2018. Strong R&D and manufacturing capabilities Transitioning to an integrated formulation and API player
Concerns:
High dependence on API segment Delays in formulation launches Regulatory compliance risk Client & Therapy concentration isk Foreign exchange fluctuations
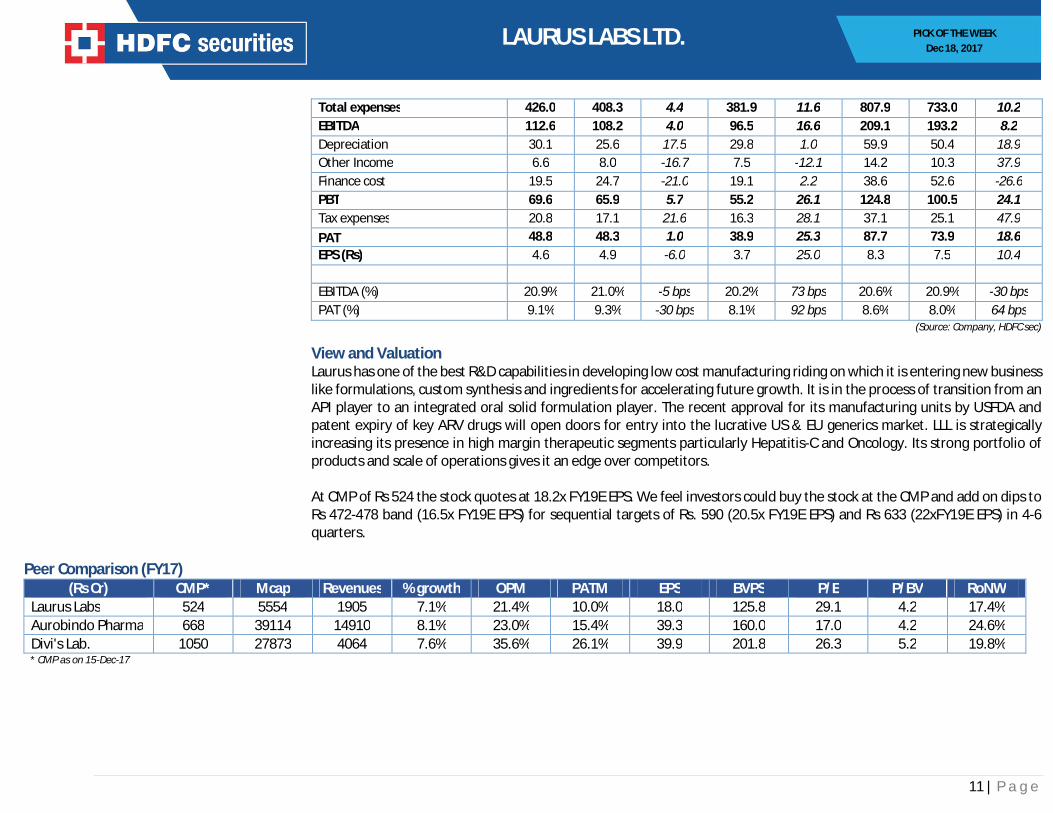
View and Valuation Laurus has one of the best R&D capabilities in developing low cost manufacturing riding on which it is entering new business like formulations, custom synthesis and ingredients for accelerating future growth. It is in the process of transition from an API player to an integrated oral solid formulation player. The recent approval for its manufacturing units by USFDA and patent expiry of key ARV drugs will open doors for entry into the lucrative US & EU generics market. LLL is strategically increasing its presence in high margin therapeutic segments particularly Hepatitis-C and Oncology. Its strong portfolio of products and scale of operations gives it an edge over competitors. At CMP of Rs 524 the stock quotes at 18.2x FY19E EPS. We feel investors could buy the stock at the CMP and add on dips to Rs 472-478 band (16.5x FY19E EPS) for sequential targets of Rs. 590 (20.5x FY19E EPS) and Rs 633 (22xFY19E EPS) in 4-6 quarters.
2 | P a g e
PICK OF THE WEEK Dec 18, 2017
LAURUS LABS LTD.
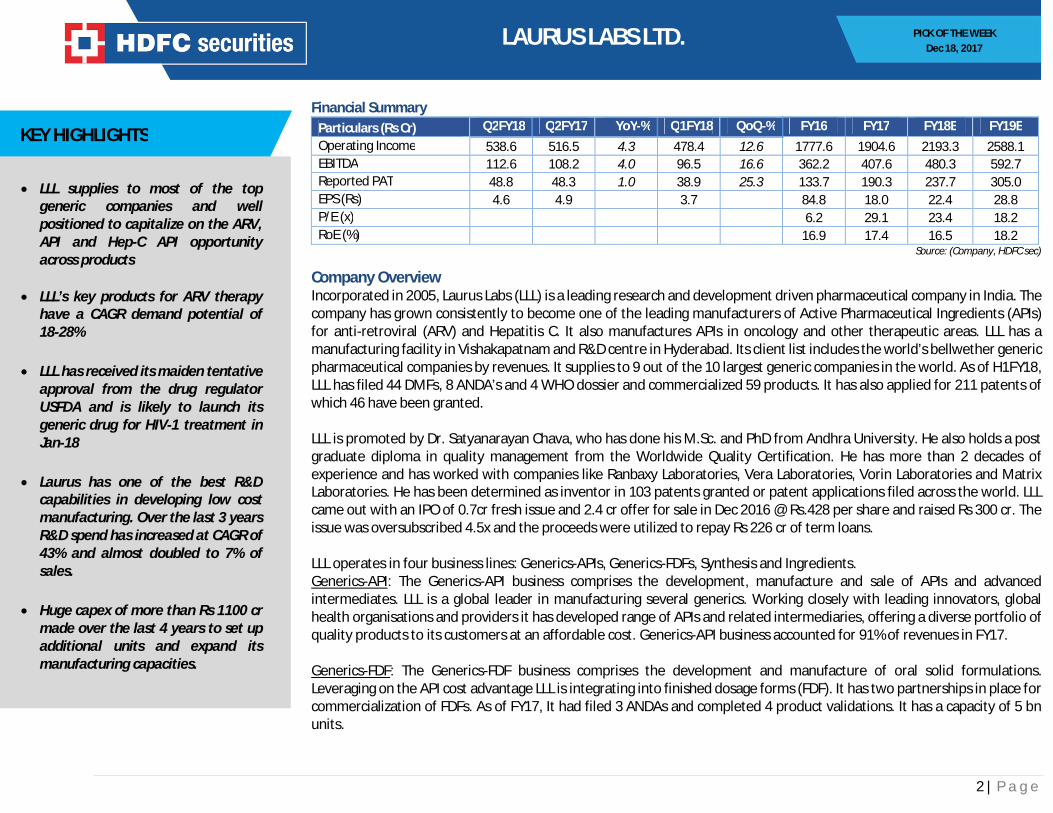
Financial Summary Particulars (Rs Cr) Q2FY18 Q2FY17 YoY-% Q1FY18 QoQ-% FY16 FY17 FY18E FY19E Operating Income 538.6 516.5 4.3 478.4 12.6 1777.6 1904.6 2193.3 2588.1 EBITDA 112.6 108.2 4.0 96.5 16.6 362.2 407.6 480.3 592.7 Reported PAT 48.8 48.3 1.0 38.9 25.3 133.7 190.3 237.7 305.0 EPS (Rs) 4.6 4.9 3.7 84.8 18.0 22.4 28.8 P/E (x) 6.2 29.1 23.4 18.2 RoE (%) 16.9 17.4 16.5 18.2
Source: (Company, HDFC sec)
Company Overview Incorporated in 2005, Laurus Labs (LLL) is a leading research and development driven pharmaceutical company in India. The company has grown consistently to become one of the leading manufacturers of Active Pharmaceutical Ingredients (APIs) for anti-retroviral (ARV) and Hepatitis C. It also manufactures APIs in oncology and other therapeutic areas. LLL has a manufacturing facility in Vishakapatnam and R&D centre in Hyderabad. Its client list includes the world’s bellwether generic pharmaceutical companies by revenues. It supplies to 9 out of the 10 largest generic companies in the world. As of H1FY18, LLL has filed 44 DMFs, 8 ANDA’s and 4 WHO dossier and commercialized 59 products. It has also applied for 211 patents of which 46 have been granted. LLL is promoted by Dr. Satyanarayan Chava, who has done his M.Sc. and PhD from Andhra University. He also holds a post graduate diploma in quality management from the Worldwide Quality Certification. He has more than 2 decades of experience and has worked with companies like Ranbaxy Laboratories, Vera Laboratories, Vorin Laboratories and Matrix Laboratories. He has been determined as inventor in 103 patents granted or patent applications filed across the world. LLL came out with an IPO of 0.7cr fresh issue and 2.4 cr offer for sale in Dec 2016 @ Rs.428 per share and raised Rs 300 cr. The issue was oversubscribed 4.5x and the proceeds were utilized to repay Rs 226 cr of term loans. LLL operates in four business lines: Generics-APIs, Generics-FDFs, Synthesis and Ingredients. Generics-API: The Generics-API business comprises the development, manufacture and sale of APIs and advanced intermediates. LLL is a global leader in manufacturing several generics. Working closely with leading innovators, global health organisations and providers it has developed range of APIs and related intermediaries, offering a diverse portfolio of quality products to its customers at an affordable cost. Generics-API business accounted for 91% of revenues in FY17. Generics-FDF: The Generics-FDF business comprises the development and manufacture of oral solid formulations. Leveraging on the API cost advantage LLL is integrating into finished dosage forms (FDF). It has two partnerships in place for commercialization of FDFs. As of FY17, It had filed 3 ANDAs and completed 4 product validations. It has a capacity of 5 bn units.
KEY HIGHLIGHTS
LLL supplies to most of the top generic companies and well positioned to capitalize on the ARV, API and Hep-C API opportunity across products
LLL’s key products for ARV therapy have a CAGR demand potential of 18-28%
LLL has received its maiden tentative
approval from the drug regulator USFDA and is likely to launch its generic drug for HIV-1 treatment in Jan-18
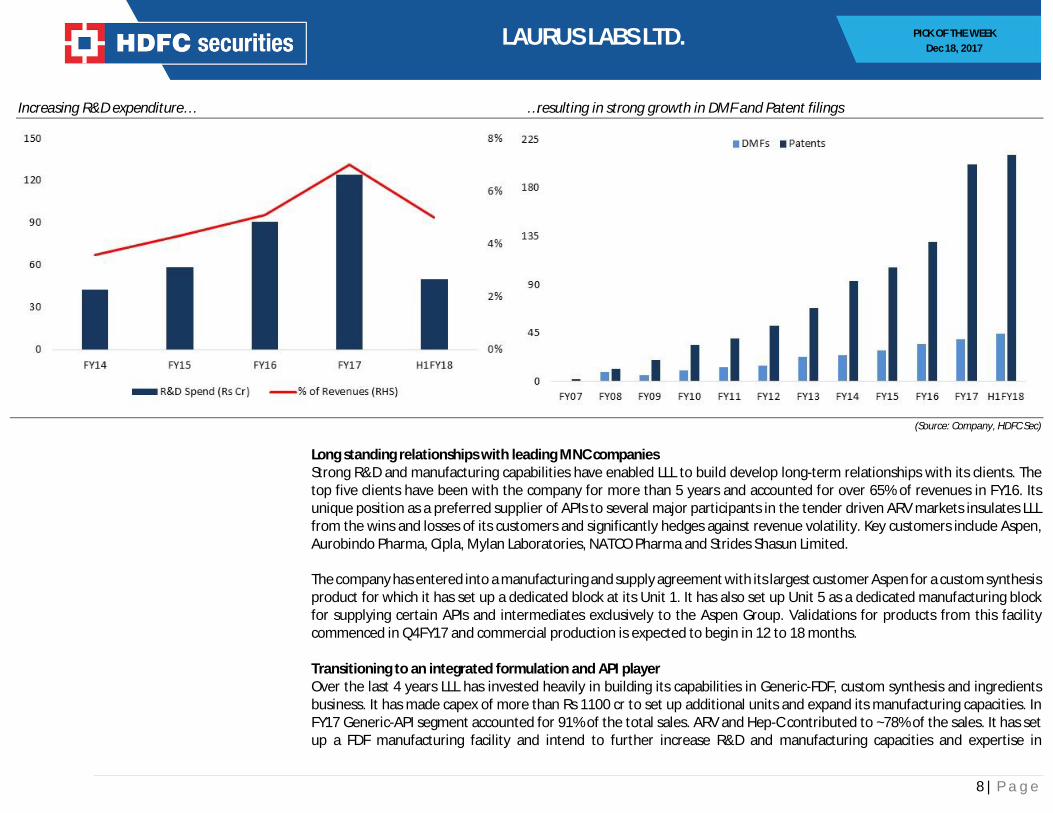
Laurus has one of the best R&D
capabilities in developing low cost manufacturing. Over the last 3 years R&D spend has increased at CAGR of 43% and almost doubled to 7% of sales.
Huge capex of more than Rs 1100 cr
made over the last 4 years to set up additional units and expand its manufacturing capacities.
3 | P a g e
PICK OF THE WEEK Dec 18, 2017
LAURUS LABS LTD.
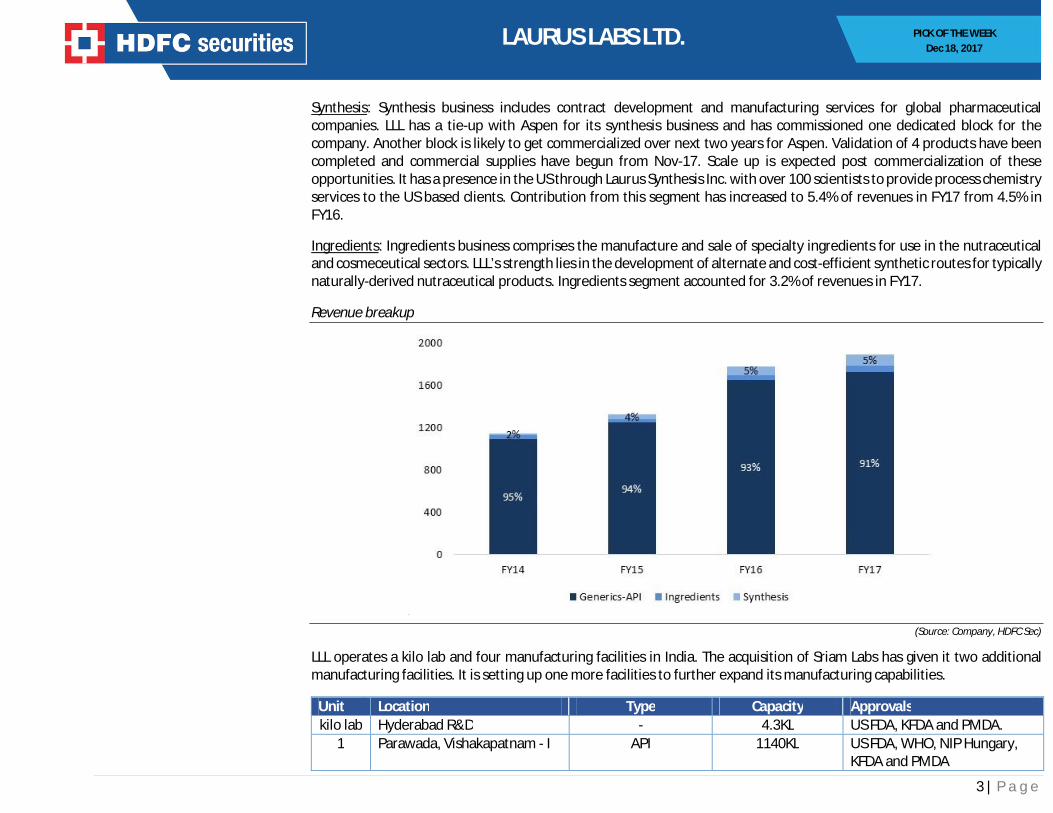
Synthesis: Synthesis business includes contract development and manufacturing services for global pharmaceutical companies. LLL has a tie-up with Aspen for its synthesis business and has commissioned one dedicated block for the company. Another block is likely to get commercialized over next two years for Aspen. Validation of 4 products have been completed and commercial supplies have begun from Nov-17. Scale up is expected post commercialization of these opportunities. It has a presence in the US through Laurus Synthesis Inc. with over 100 scientists to provide process chemistry services to the US based clients. Contribution from this segment has increased to 5.4% of revenues in FY17 from 4.5% in FY16.
Ingredients: Ingredients business comprises the manufacture and sale of specialty ingredients for use in the nutraceutical and cosmeceutical sectors. LLL’s strength lies in the development of alternate and cost-efficient synthetic routes for typically naturally-derived nutraceutical products. Ingredients segment accounted for 3.2% of revenues in FY17.
Revenue breakup
`
(Source: Company, HDFC Sec)
LLL operates a kilo lab and four manufacturing facilities in India. The acquisition of Sriam Labs has given it two additional manufacturing facilities. It is setting up one more facilities to further expand its manufacturing capabilities.
Unit Location Type Capacity Approvals kilo lab Hyderabad R&D - 4.3KL US FDA, KFDA and PMDA.
1 Parawada, Vishakapatnam - I API 1140KL US FDA, WHO, NIP Hungary, KFDA and PMDA
4 | P a g e
PICK OF THE WEEK Dec 18, 2017
LAURUS LABS LTD.
2 Achutapuram, Vishakapatnam FDF & API FDF (5 bn tab/yr) + API (84KL)
US FDA, BfArM – Germany
3 Parawada, Vishakapatnam - II API 605KL US FDA,WHO, and EU 5 Parawada, Vishakapatnam
(dedicated for Aspen) API 126KL Operations commenced in
December 2016 Facilities under construction
Unit Location Type Capacity Status 4 Achutapuram, Vishakapatnam API + Nutraceuticals 1834 KL Construction commenced and
will be operational in 2017-18 Manufacturing facilities of Sriam Labs
Unit Location Type Capacity Approvals 1 Bibinagar, Telangana API 82 KL CGMP, Telangana Govt. 2 Achutapuram, Vishakapatnam API 244 KL -
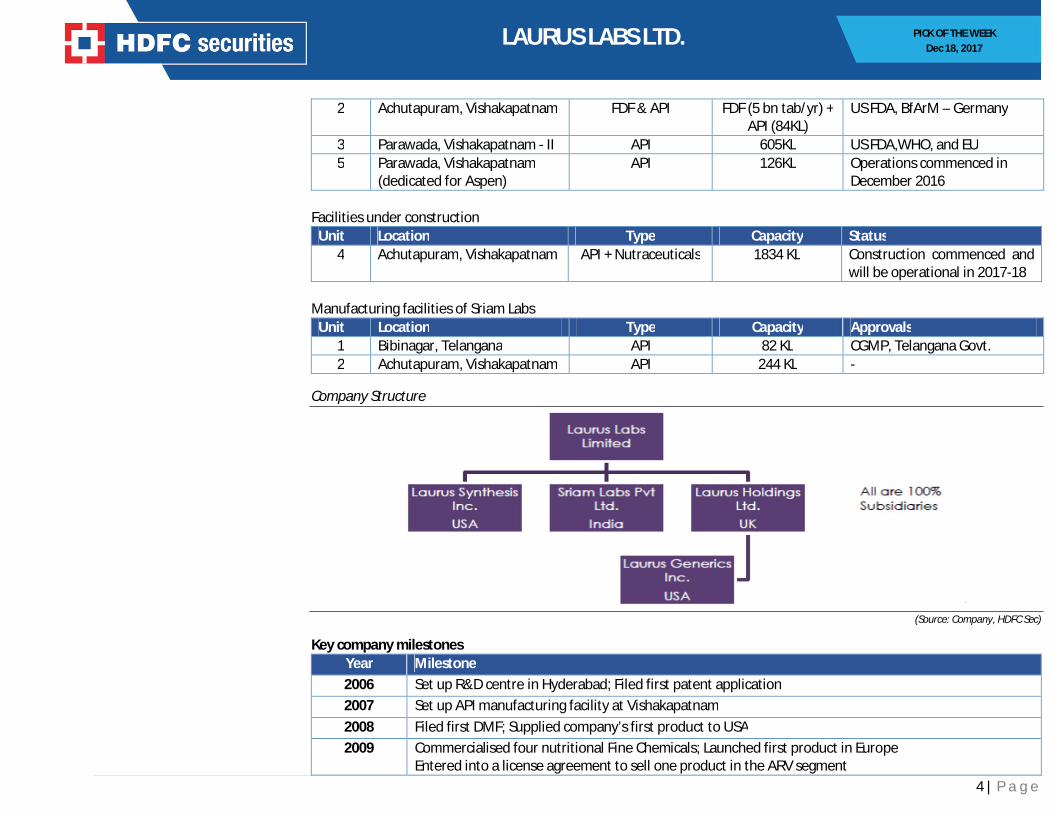
Company Structure
`
(Source: Company, HDFC Sec)
Key company milestones Year Milestone 2006 Set up R&D centre in Hyderabad; Filed first patent application 2007 Set up API manufacturing facility at Vishakapatnam 2008 Filed first DMF; Supplied company’s first product to USA 2009 Commercialised four nutritional Fine Chemicals; Launched first product in Europe
Entered into a license agreement to sell one product in the ARV segment
5 | P a g e
PICK OF THE WEEK Dec 18, 2017
LAURUS LABS LTD.
2010 Received US FDA certification, TGA and UK MHRA certification for the Unit 1, Vishakhapatnam 2011 Received USFDA certification for the R&D Center, Hyderabad 2013 Received WHO approval for Unit-I at Visakhapatnam; Crossed Rs 1000 cr of revenues 2014 Incorporated Laurus Inc. at Delaware as a wholly owned subsidiary; 2015 Successful inspection by WHO, NIP Hungary and US FDA for Unit 1 and Unit 3 manufacturing sites 2016 Filed first ANDA with the US FDA and first dossier with the WHO 2017 Incorporated European & US subsidiary; Received EIR from USFDA for Unit 2; Started validation batches
from Unit 5 for Aspen Investment Rationale Leadership in select high growth therapeutic APIs LLL is a leading developer and manufacturer of generic APIs in select, high-growth therapeutic areas of ARV and Hepatitis C. It also manufactures APIs in oncology and other therapeutic areas of cardio vascular, diabetic, anti-asthmatic, gastroenterology and ophthalmic therapeutics. Laurus supplies to most of the top generic companies and well positioned to capitalize on the ARV, API and Hep-C API opportunity with a market share of 20-60% across products. Its strong portfolio of products and scale of operations give it an edge over competitors. The company is also likely to positively benefit from the near term patent expiry of ARV drugs in the regulated markets of US and Europe. Expanding market size for ARV Acquired immunodeficiency syndrome (AIDS) is a medical condition caused by the human immunodeficiency virus (“HIV”). The vast majority of this number lives in low and middle income countries (LMICs), particularly in Sub-Saharan Africa, with South Africa having the largest HIV positive population. Currently there is no cure for the HIV infection. However, effective ARV drugs can control the virus and help prevent transmission so that people with HIV, and those at substantial risk, can enjoy healthy and productive lives. At the end of 2015, approximately 17 million people living with HIV were receiving antiretroviral therapy (ART) globally (46.3% of the patient population). It is estimated that by expanding ART to all people living with HIV and by increasing awareness and expanding prevention choices, 21 million AIDS-related deaths and 28 million new infections by 2030, can be averted. The changes in the WHO guidelines, released in September 2015, are expected to contribute to the increase of the overall ARV market size. The world is pursuing the UNAIDS 90–90–90 treatment target by 2020 90% of all people living with HIV will know their HIV status 90% of all people diagnosed with HIV infection will receive sustained ART and 90% of all people receiving ARV therapy will have viral suppression. Given the continuing increase in the number of people on ART, the production of all APIs for ARVs, also for those ARVs with decreasing market share, will need to increase. LLL’s key products for ARV therapy include Efavirenz (EFV), Tenofovir
6 | P a g e
PICK OF THE WEEK Dec 18, 2017
LAURUS LABS LTD.
Disoproxil Fumarate (TDF), Lamivudine (3TC)/Emtricitabine (FTC) which have a CAGR demand potential of 17.6%, 19.8% and 28% respectively over FY15-FY18. LLL’s market share in key ARV products
(MT) FY14 FY15 FY16 Global Vol. FY16 Share (%) Efavirenz (EFV) 848.4 933.2 1183.0 1787.0 66.2 Tenofovir Disoproxil Fumarate (TDF) 175.0 272.1 328.4 997.0 32.9 Emtricitabine (FTC) 52.8 56.2 68.8 183.0 37.6
(Source: Company, HDFC Sec) The position of Laurus Labs as a preferred supplier of APIs to several major pharmaceutical company participants of the tender driven ARV market insulates it from the wins and losses of its customers and significantly hedges it against revenue volatility. In the ARV therapeutic area, Laurus supplies APIs to all major global producers of FDFs, including those having their own API manufacturing capabilities. LLL has received its maiden tentative approval from the drug regulator USFDA on November 30, 2017 for Tenofovir Disoproxil Fumarate (TDF) tablets 300mg used for treatment of HIV-1 infection in adults and paediatric patients. Unit 1 and 3 were inspected in Aug-17 and got two observations which were of procedural in nature. With 1.1 million people infected with HIV in the US, and many of them living longer thanks to treatment, HIV drugs have become an $18.8 billion business for the pharmaceutical industry there, according to data provider IQVIA. The patent expiries are starting from Dec-17 when Bristol-Myers Squibb Co.’s Sustiva loses protection. Gilead Sciences Inc.’s Viread follows next month. LLL is likely to launch its generic drug by Jan-18. Robust growth in Hep-C API According to the WHO, it has been estimated that there are around 170 to 185 million people in the world chronically infected with Hepatitis C and between two and four million new cases of Hepatitis C are added every year. The latest direct acting anti-viral drugs (DAAs), such as Sofosbuvir, Daclatasvir and the combination of Ledipasvir and Sofosbuvir (Harvoni) have brought about a significant change in the treatment and cure of Hepatitis C. LLL has entered into a long-term license agreement with Gilead Sciences Ireland UC to manufacture and sell Sofosbuvir, Ledipasvir and Velpatasvir within specified jurisdictions. It has also entered into a tripartite sublicense and technology transfer agreement with Bristol-Myers Squibb and the Medicines Patent Pool Foundation for the manufacture and sale of Daclatasvir for ultimate use in specified jurisdictions. In the domestic market LLL has partnered with NATCO to manufacture and sell Hep-C APIs. Natco commands a 38.5% share of the Indian Hepatitis C market, and positions LLL well to capture growth from higher patient volumes. An analysis of the global pipeline of Hepatitis C drugs indicates that Gilead has an edge over the competition in terms of bringing new therapies to the market. An analysis of the WHO 2016 guidelines for Hepatitis C treatment also indicates the necessity of Sofosbuvir being at the core of every therapy, irrespective of genotype or the cirrhotic status of the patients.
7 | P a g e
PICK OF THE WEEK Dec 18, 2017
LAURUS LABS LTD.
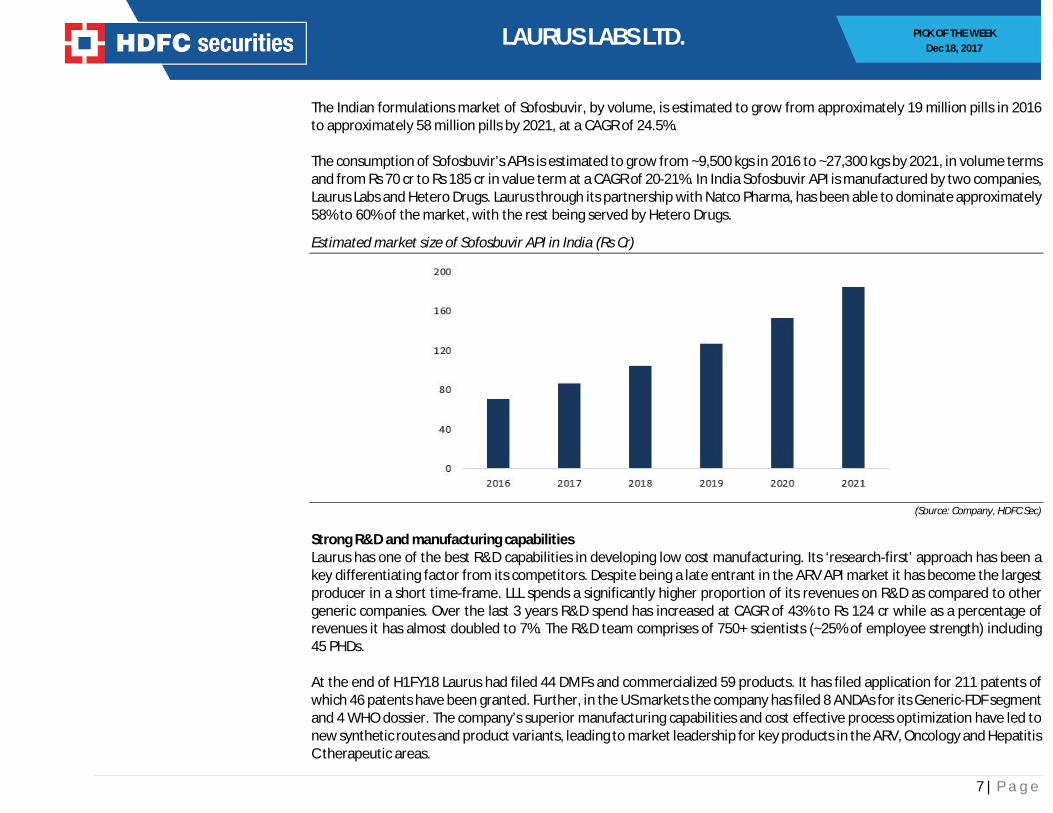
The Indian formulations market of Sofosbuvir, by volume, is estimated to grow from approximately 19 million pills in 2016 to approximately 58 million pills by 2021, at a CAGR of 24.5%. The consumption of Sofosbuvir’s APIs is estimated to grow from ~9,500 kgs in 2016 to ~27,300 kgs by 2021, in volume terms and from Rs 70 cr to Rs 185 cr in value term at a CAGR of 20-21%. In India Sofosbuvir API is manufactured by two companies, Laurus Labs and Hetero Drugs. Laurus through its partnership with Natco Pharma, has been able to dominate approximately 58% to 60% of the market, with the rest being served by Hetero Drugs.
Estimated market size of Sofosbuvir API in India (Rs Cr)
(Source: Company, HDFC Sec)
Strong R&D and manufacturing capabilities Laurus has one of the best R&D capabilities in developing low cost manufacturing. Its ‘research-first’ approach has been a key differentiating factor from its competitors. Despite being a late entrant in the ARV API market it has become the largest producer in a short time-frame. LLL spends a significantly higher proportion of its revenues on R&D as compared to other generic companies. Over the last 3 years R&D spend has increased at CAGR of 43% to Rs 124 cr while as a percentage of revenues it has almost doubled to 7%. The R&D team comprises of 750+ scientists (~25% of employee strength) including 45 PHDs. At the end of H1FY18 Laurus had filed 44 DMFs and commercialized 59 products. It has filed application for 211 patents of which 46 patents have been granted. Further, in the US markets the company has filed 8 ANDAs for its Generic-FDF segment and 4 WHO dossier. The company’s superior manufacturing capabilities and cost effective process optimization have led to new synthetic routes and product variants, leading to market leadership for key products in the ARV, Oncology and Hepatitis C therapeutic areas.
8 | P a g e
PICK OF THE WEEK Dec 18, 2017
LAURUS LABS LTD.
Increasing R&D expenditure… …resulting in strong growth in DMF and Patent filings
(Source: Company, HDFC Sec)
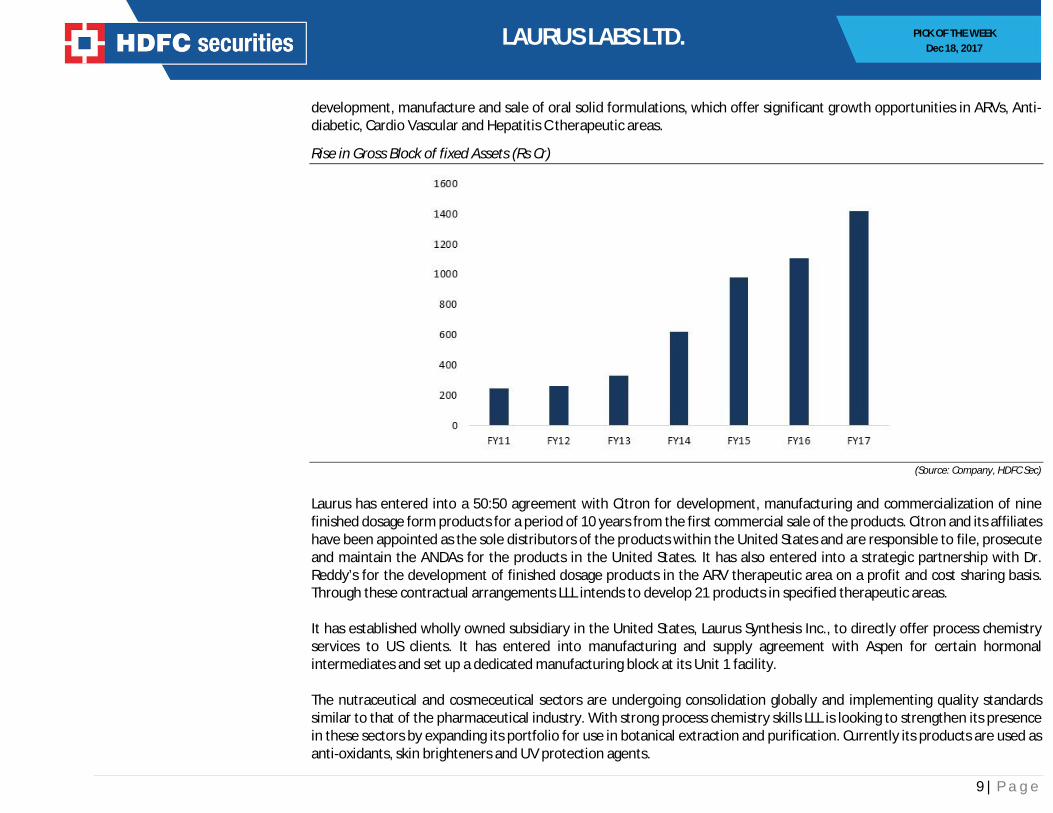
Long standing relationships with leading MNC companies Strong R&D and manufacturing capabilities have enabled LLL to build develop long-term relationships with its clients. The top five clients have been with the company for more than 5 years and accounted for over 65% of revenues in FY16. Its unique position as a preferred supplier of APIs to several major participants in the tender driven ARV markets insulates LLL from the wins and losses of its customers and significantly hedges against revenue volatility. Key customers include Aspen, Aurobindo Pharma, Cipla, Mylan Laboratories, NATCO Pharma and Strides Shasun Limited. The company has entered into a manufacturing and supply agreement with its largest customer Aspen for a custom synthesis product for which it has set up a dedicated block at its Unit 1. It has also set up Unit 5 as a dedicated manufacturing block for supplying certain APIs and intermediates exclusively to the Aspen Group. Validations for products from this facility commenced in Q4FY17 and commercial production is expected to begin in 12 to 18 months. Transitioning to an integrated formulation and API player Over the last 4 years LLL has invested heavily in building its capabilities in Generic-FDF, custom synthesis and ingredients business. It has made capex of more than Rs 1100 cr to set up additional units and expand its manufacturing capacities. In FY17 Generic-API segment accounted for 91% of the total sales. ARV and Hep-C contributed to ~78% of the sales. It has set up a FDF manufacturing facility and intend to further increase R&D and manufacturing capacities and expertise in
9 | P a g e
PICK OF THE WEEK Dec 18, 2017
LAURUS LABS LTD.
development, manufacture and sale of oral solid formulations, which offer significant growth opportunities in ARVs, Anti-diabetic, Cardio Vascular and Hepatitis C therapeutic areas.
Rise in Gross Block of fixed Assets (Rs Cr)
(Source: Company, HDFC Sec)
Laurus has entered into a 50:50 agreement with Citron for development, manufacturing and commercialization of nine finished dosage form products for a period of 10 years from the first commercial sale of the products. Citron and its affiliates have been appointed as the sole distributors of the products within the United States and are responsible to file, prosecute and maintain the ANDAs for the products in the United States. It has also entered into a strategic partnership with Dr. Reddy’s for the development of finished dosage products in the ARV therapeutic area on a profit and cost sharing basis. Through these contractual arrangements LLL intends to develop 21 products in specified therapeutic areas. It has established wholly owned subsidiary in the United States, Laurus Synthesis Inc., to directly offer process chemistry services to US clients. It has entered into manufacturing and supply agreement with Aspen for certain hormonal intermediates and set up a dedicated manufacturing block at its Unit 1 facility. The nutraceutical and cosmeceutical sectors are undergoing consolidation globally and implementing quality standards similar to that of the pharmaceutical industry. With strong process chemistry skills LLL is looking to strengthen its presence in these sectors by expanding its portfolio for use in botanical extraction and purification. Currently its products are used as anti-oxidants, skin brighteners and UV protection agents.
10 | P a g e
PICK OF THE WEEK Dec 18, 2017
LAURUS LABS LTD.
Concerns Regulatory compliance risk The pharmaceutical industry is highly regulated in many countries and requires various approvals, licenses, registrations and permissions for business activities. Regulatory compliance risk, especially pertaining to the US FDA, has been a key overhang on the sector in recent years. With LLL set to enter the US markets it would be subject to regular inspections and would have to adhere to strict regulations. In India, the government also controls the prices of pharmaceutical products through the drug price control order (DPCO) under price control mechanism which could erode profitability.
High dependence on API segment Nearly 90% of the revenues comes from the API segment and in that ~80% comes from APIs for ARV and Hep-C. Disruption in any of its key products could result in significant loss of revenues.
Delays in formulation launches The company has incurred capex for venturing into formulations. Formulations is a new segment and dependant on USFDA approvals. Delays in approvals and launches could significantly impact growth in top and bottomline of the company.
Concentration Risk – Clients and therapy The top five clients account for 68% of its revenues in FY16. Therapy wise ARV accounted for ~60% of revenues in H1FY18. Loss of any client or disruption in any of the ARV markets could have a substantial impact on revenue growth. Managing client relations Laurus is entering into formulation business and would be directly competing with its clients. Managing its relations with client in the face of competition would be a challenge for the company.
Foreign exchange fluctuations LLL derives ~35-40% of its revenues from exports. Change in the exchange rate of rupee could impact its financials. Q2FY18 Results Review Net sales in Q2FY18 grew by 4.3% yoy to Rs 539 cr. Although ARV sales witnessed strong growth of 23% yoy Hep-C contribution declined significantly due to pricing pressure and GST impact pulling down the overall growth momentum. Synthesis business continues to report robust growth in clinical-phase supplies and rising share of Aspen business. EBITDA grew by 4% yoy to Rs 113 cr while margins remained flat at 20.9%. PAT grew marginally while PAT margin contracted 30 bps yoy to 9.1% on account of higher depreciation expenses softened to some extent by lower finance costs.
Particulars (Rs Cr) Q2FY18 Q2FY17 YoY (%) Q1FY18 QoQ (%) H1FY18 H1FY17 YoY (%) Operating Income 538.6 516.5 4.3 478.4 12.6 1017.0 926.3 9.8 Material consumed 281.3 282.7 -0.5 245.7 14.5 527.0 495.4 6.4 Employee expenses 63.4 53.5 18.4 62.7 1.0 126.1 106.7 18.2 Other expenses 81.3 72.0 12.9 73.5 10.7 154.8 131.0 18.2
11 | P a g e
PICK OF THE WEEK Dec 18, 2017
LAURUS LABS LTD.
Total expenses 426.0 408.3 4.4 381.9 11.6 807.9 733.0 10.2 EBITDA 112.6 108.2 4.0 96.5 16.6 209.1 193.2 8.2 Depreciation 30.1 25.6 17.5 29.8 1.0 59.9 50.4 18.9 Other Income 6.6 8.0 -16.7 7.5 -12.1 14.2 10.3 37.9 Finance cost 19.5 24.7 -21.0 19.1 2.2 38.6 52.6 -26.6 PBT 69.6 65.9 5.7 55.2 26.1 124.8 100.5 24.1 Tax expenses 20.8 17.1 21.6 16.3 28.1 37.1 25.1 47.9 PAT 48.8 48.3 1.0 38.9 25.3 87.7 73.9 18.6 EPS (Rs) 4.6 4.9 -6.0 3.7 25.0 8.3 7.5 10.4 EBITDA (%) 20.9% 21.0% -5 bps 20.2% 73 bps 20.6% 20.9% -30 bps PAT (%) 9.1% 9.3% -30 bps 8.1% 92 bps 8.6% 8.0% 64 bps
(Source: Company, HDFC sec)
View and Valuation Laurus has one of the best R&D capabilities in developing low cost manufacturing riding on which it is entering new business like formulations, custom synthesis and ingredients for accelerating future growth. It is in the process of transition from an API player to an integrated oral solid formulation player. The recent approval for its manufacturing units by USFDA and patent expiry of key ARV drugs will open doors for entry into the lucrative US & EU generics market. LLL is strategically increasing its presence in high margin therapeutic segments particularly Hepatitis-C and Oncology. Its strong portfolio of products and scale of operations gives it an edge over competitors. At CMP of Rs 524 the stock quotes at 18.2x FY19E EPS. We feel investors could buy the stock at the CMP and add on dips to Rs 472-478 band (16.5x FY19E EPS) for sequential targets of Rs. 590 (20.5x FY19E EPS) and Rs 633 (22xFY19E EPS) in 4-6 quarters.
Peer Comparison (FY17) (Rs Cr) CMP* Mcap Revenues % growth OPM PATM EPS BVPS P/E P/BV RoNW
Laurus Labs 524 5554 1905 7.1% 21.4% 10.0% 18.0 125.8 29.1 4.2 17.4% Aurobindo Pharma 668 39114 14910 8.1% 23.0% 15.4% 39.3 160.0 17.0 4.2 24.6% Divi's Lab. 1050 27873 4064 7.6% 35.6% 26.1% 39.9 201.8 26.3 5.2 19.8% * CMP as on 15-Dec-17
12 | P a g e
PICK OF THE WEEK Dec 18, 2017
LAURUS LABS LTD.
Consolidated Financial Statements
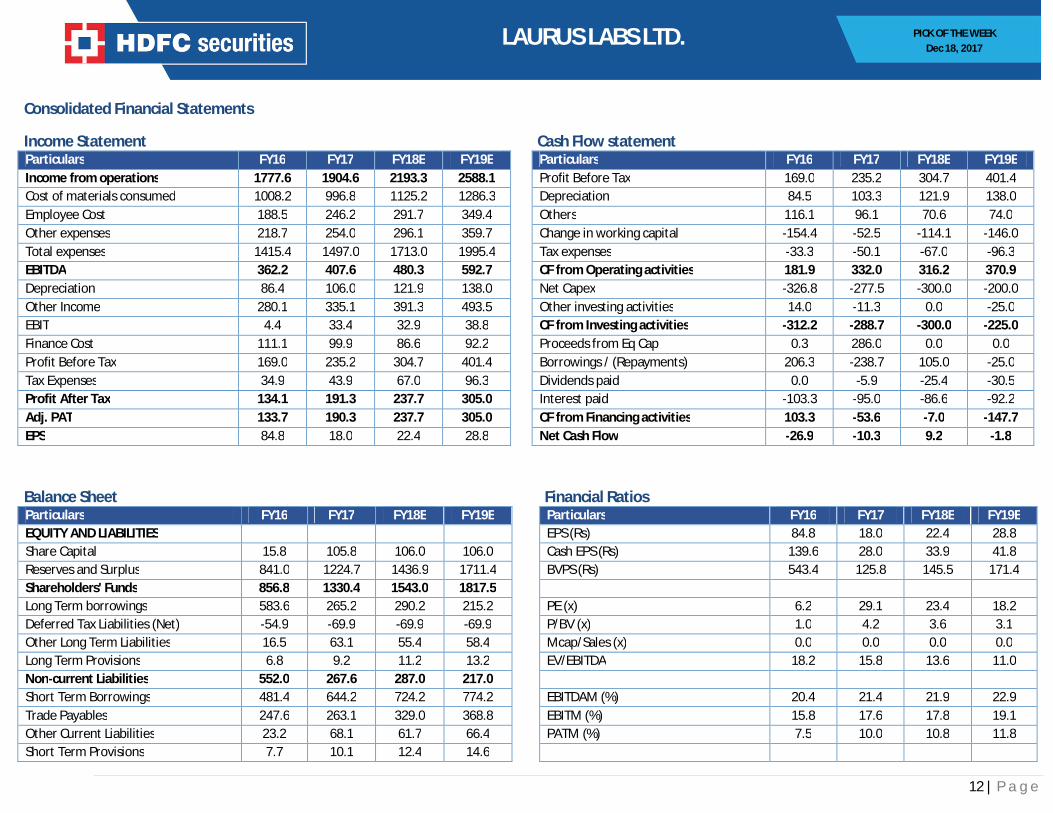
Income Statement Cash Flow statement Particulars FY16 FY17 FY18E FY19E Particulars FY16 FY17 FY18E FY19E Income from operations 1777.6 1904.6 2193.3 2588.1 Profit Before Tax 169.0 235.2 304.7 401.4 Cost of materials consumed 1008.2 996.8 1125.2 1286.3 Depreciation 84.5 103.3 121.9 138.0 Employee Cost 188.5 246.2 291.7 349.4 Others 116.1 96.1 70.6 74.0 Other expenses 218.7 254.0 296.1 359.7 Change in working capital -154.4 -52.5 -114.1 -146.0 Total expenses 1415.4 1497.0 1713.0 1995.4 Tax expenses -33.3 -50.1 -67.0 -96.3 EBITDA 362.2 407.6 480.3 592.7 CF from Operating activities 181.9 332.0 316.2 370.9 Depreciation 86.4 106.0 121.9 138.0 Net Capex -326.8 -277.5 -300.0 -200.0 Other Income 280.1 335.1 391.3 493.5 Other investing activities 14.0 -11.3 0.0 -25.0 EBIT 4.4 33.4 32.9 38.8 CF from Investing activities -312.2 -288.7 -300.0 -225.0 Finance Cost 111.1 99.9 86.6 92.2 Proceeds from Eq Cap 0.3 286.0 0.0 0.0 Profit Before Tax 169.0 235.2 304.7 401.4 Borrowings / (Repayments) 206.3 -238.7 105.0 -25.0 Tax Expenses 34.9 43.9 67.0 96.3 Dividends paid 0.0 -5.9 -25.4 -30.5 Profit After Tax 134.1 191.3 237.7 305.0 Interest paid -103.3 -95.0 -86.6 -92.2 Adj. PAT 133.7 190.3 237.7 305.0 CF from Financing activities 103.3 -53.6 -7.0 -147.7 EPS 84.8 18.0 22.4 28.8 Net Cash Flow -26.9 -10.3 9.2 -1.8
Balance Sheet Financial Ratios Particulars FY16 FY17 FY18E FY19E Particulars FY16 FY17 FY18E FY19E EQUITY AND LIABILITIES EPS (Rs) 84.8 18.0 22.4 28.8 Share Capital 15.8 105.8 106.0 106.0 Cash EPS (Rs) 139.6 28.0 33.9 41.8 Reserves and Surplus 841.0 1224.7 1436.9 1711.4 BVPS (Rs) 543.4 125.8 145.5 171.4 Shareholders' Funds 856.8 1330.4 1543.0 1817.5 Long Term borrowings 583.6 265.2 290.2 215.2 PE (x) 6.2 29.1 23.4 18.2 Deferred Tax Liabilities (Net) -54.9 -69.9 -69.9 -69.9 P/BV (x) 1.0 4.2 3.6 3.1 Other Long Term Liabilities 16.5 63.1 55.4 58.4 Mcap/Sales (x) 0.0 0.0 0.0 0.0 Long Term Provisions 6.8 9.2 11.2 13.2 EV/EBITDA 18.2 15.8 13.6 11.0 Non-current Liabilities 552.0 267.6 287.0 217.0 Short Term Borrowings 481.4 644.2 724.2 774.2 EBITDAM (%) 20.4 21.4 21.9 22.9 Trade Payables 247.6 263.1 329.0 368.8 EBITM (%) 15.8 17.6 17.8 19.1 Other Current Liabilities 23.2 68.1 61.7 66.4 PATM (%) 7.5 10.0 10.8 11.8 Short Term Provisions 7.7 10.1 12.4 14.6
13 | P a g e
PICK OF THE WEEK Dec 18, 2017
LAURUS LABS LTD.
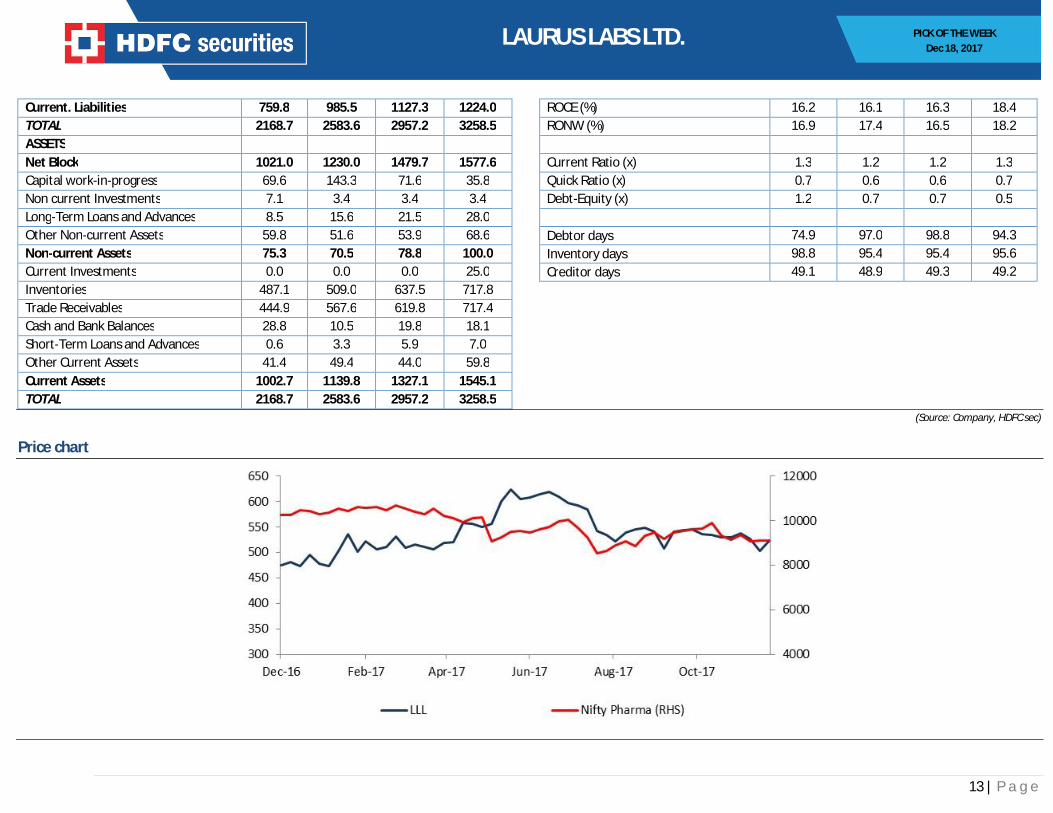
Current. Liabilities 759.8 985.5 1127.3 1224.0 ROCE (%) 16.2 16.1 16.3 18.4 TOTAL 2168.7 2583.6 2957.2 3258.5 RONW (%) 16.9 17.4 16.5 18.2 ASSETS Net Block 1021.0 1230.0 1479.7 1577.6 Current Ratio (x) 1.3 1.2 1.2 1.3 Capital work-in-progress 69.6 143.3 71.6 35.8 Quick Ratio (x) 0.7 0.6 0.6 0.7 Non current Investments 7.1 3.4 3.4 3.4 Debt-Equity (x) 1.2 0.7 0.7 0.5 Long-Term Loans and Advances 8.5 15.6 21.5 28.0 Other Non-current Assets 59.8 51.6 53.9 68.6 Debtor days 74.9 97.0 98.8 94.3 Non-current Assets 75.3 70.5 78.8 100.0 Inventory days 98.8 95.4 95.4 95.6 Current Investments 0.0 0.0 0.0 25.0 Creditor days 49.1 48.9 49.3 49.2 Inventories 487.1 509.0 637.5 717.8 Trade Receivables 444.9 567.6 619.8 717.4 Cash and Bank Balances 28.8 10.5 19.8 18.1 Short-Term Loans and Advances 0.6 3.3 5.9 7.0 Other Current Assets 41.4 49.4 44.0 59.8 Current Assets 1002.7 1139.8 1327.1 1545.1 TOTAL 2168.7 2583.6 2957.2 3258.5
(Source: Company, HDFC sec)
Price chart
14 | P a g e
PICK OF THE WEEK Dec 18, 2017
LAURUS LABS LTD.
Fundamental Research Analyst: Atul Karwa ([email protected]) HDFC securities Limited, I Think Techno Campus, Building - B, "Alpha", Office Floor 8, Near Kanjurmarg Station, Opp. Crompton Greaves, Kanjurmarg (East), Mumbai 400 042 Phone: (022) 3075 3400 Fax: (022) 2496 5066 Website: www.hdfcsec.com Email: [email protected]. Compliance Officer: Binkle R. Oza Email: [email protected] Phone: (022) 3045 3600 __________________________________________________________________________________________________________________________________________________________________________________________________ Disclosure: I, (Atul Karwa, MMS), authors and the names subscribed to this report, hereby certify that all of the views expressed in this research report accurately reflect our views about the subject issuer(s) or securities. HSL has no material adverse disciplinary history as on the date of publication of this report. We also certify that no part of our compensation was, is, or will be directly or indirectly related to the specific recommendation(s) or view(s) in this report. Research Analyst or his/her relative or HDFC Securities Ltd. does not have any financial interest in the subject company. Also Research Analyst or his relative or HDFC Securities Ltd. or its Associate does not have beneficial ownership of 1% or more in the subject company at the end of the month immediately preceding the date of publication of the Research Report. Further Research Analyst or his relative or HDFC Securities Ltd. or its associate does not have any material conflict of interest. Any holding in stock – No HDFC Securities Limited (HSL) is a SEBI Registered Research Analyst having registration no. INH000002475. Disclaimer: This report has been prepared by HDFC Securities Ltd and is meant for sole use by the recipient and not for circulation. The information and opinions contained herein have been compiled or arrived at, based upon information obtained in good faith from sources believed to be reliable. Such information has not been independently verified and no guaranty, representation of warranty, express or implied, is made as to its accuracy, completeness or correctness. All such information and opinions are subject to change without notice. This document is for information purposes only. Descriptions of any company or companies or their securities mentioned herein are not intended to be complete and this document is not, and should not be construed as an offer or solicitation of an offer, to buy or sell any securities or other financial instruments. This report is not directed to, or intended for display, downloading, printing, reproducing or for distribution to or use by, any person or entity who is a citizen or resident or located in any locality, state, country or other jurisdiction where such distribution, publication, reproduction, availability or use would be contrary to law or regulation or what would subject HSL or its affiliates to any registration or licensing requirement within such jurisdiction. If this report is inadvertently send or has reached any individual in such country, especially, USA, the same may be ignored and brought to the attention of the sender. This document may not be reproduced, distributed or published for any purposes without prior written approval of HSL. Foreign currencies denominated securities, wherever mentioned, are subject to exchange rate fluctuations, which could have an adverse effect on their value or price, or the income derived from them. In addition, investors in securities such as ADRs, the values of which are influenced by foreign currencies effectively assume currency risk. It should not be considered to be taken as an offer to sell or a solicitation to buy any security. HSL may from time to time solicit from, or perform broking, or other services for, any company mentioned in this mail and/or its attachments. HSL and its affiliated company(ies), their directors and employees may; (a) from time to time, have a long or short position in, and buy or sell the securities of the company(ies) mentioned herein or (b) be engaged in any other transaction involving such securities and earn brokerage or other compensation or act as a market maker in the financial instruments of the company(ies) discussed herein or act as an advisor or lender/borrower to such company(ies) or may have any other potential conflict of interests with respect to any recommendation and other related information and opinions. HSL, its directors, analysts or employees do not take any responsibility, financial or otherwise, of the losses or the damages sustained due to the investments made or any action taken on basis of this report, including but not restricted to, fluctuation in the prices of shares and bonds, changes in the currency rates, diminution in the NAVs, reduction in the dividend or income, etc. HSL and other group companies, its directors, associates, employees may have various positions in any of the stocks, securities and financial instruments dealt in the report, or may make sell or purchase or other deals in these securities from time to time or may deal in other securities of the companies / organizations described in this report.
HSL or its associates might have managed or co-managed public offering of securities for the subject company or might have been mandated by the subject company for any other assignment in the past twelve months. HSL or its associates might have received any compensation from the companies mentioned in the report during the period preceding twelve months from t date of this report for services in respect of managing or co-managing public offerings, corporate finance, investment banking or merchant banking, brokerage services or other advisory service in a merger or specific transaction in the normal course of business. HSL or its analysts did not receive any compensation or other benefits from the companies mentioned in the report or third party in connection with preparation of the research report. Accordingly, neither HSL nor Research Analysts have any material conflict of interest at the time of publication of this report. Compensation of our Research Analysts is not based on any specific merchant banking, investment banking or brokerage service transactions. HSL may have issued other reports that are inconsistent with and reach different conclusion from the information presented in this report. Research entity has not been engaged in market making activity for the subject company. Research analyst has not served as an officer, director or employee of the subject company. We have not received any compensation/benefits from the subject company or third party in connection with the Research Report.
This report is intended for non-Institutional Clients only. The views and opinions expressed in this report may at times be contrary to or not in consonance with those of Institutional Research or PCG Research teams of HDFC Securities Ltd. and/or may have different time horizons
HDFC Securities Limited, SEBI Reg. No.: NSE-INB/F/E 231109431, BSE-INB/F 011109437, AMFI Reg. No. ARN: 13549, PFRDA Reg. No. POP: 04102015, IRDA Corporate Agent License No.: HDF 2806925/HDF C000222657, SEBI Research Analyst Reg. No.: INH000002475, CIN - U67120MH2000PLC152193