Embed Size (px)
Citation preview
October 5, 2016
Debut of the 2016–2017 HR Systems Survey Results
19th Annual Edition
2

Sierra-Cedar 2016–2017 HR Systems Survey Over 19 years of continuous data gathering
The most comprehensive survey in the industry: ● Strategy, Process, and Structure ● Administrative and Service Delivery Applications ● Workforce Management Applications ● Talent Management Applications ● BI/Analytics/Workforce Planning Applications ● Integration and Implementation ● Emerging Technologies and Innovations ● Vendor Landscape ● Workforce and HR Expenditures ● Workforce Usage and Perception
Participate in the 20th Annual Survey Download the 19th Annual White Paper
3

Welcome Our Panel Guests
4
Global HR Business Architecture & Technology
Dell
Karen Caveney Dana Christian
Director Workforce Technology and Data
Governance
Ingersoll Rand

High Tech Health Manu- facturing
Sierra-Cedar 2016–2017 HR Systems Survey Demographics: All Respondents
5
Trans./Comm. Utilities
Higher Ed Finance Retail Ag. Mining. Const.
16% 15% 14% 14% 11% 9% 8% 7% 7%
Other
20.6 Million Employees/Contingents
Avg. number of Employees = 13,551 1,528
Organizations
Industries
56%
21%
23%

Organization Sizes and Types
6
Data-Driven Talent-Driven Top Performers Aggregate
Small <2,500
Medium 2,500–10,000
Large 10,000+

Backlog, Pipeline, Customer Satisfaction
General Ledger, Purchasing, Budgeting, T&E Vendor Management
Project Costing, Contracts, Grants Projects
FIN
CRM
VMS
Talent Management Excellence
Service Delivery Excellence Administrative Excellence
Workforce Management Excellence
Workforce Optimization Excellence
SOA, API, ETL
Enterprise Content Enterprise Workflow
Network Security
Enterprise Social
Mobile Access Integration Platform
Workforce Optimization Workforce Planning, Workforce Analytics,
Predictive Analytics
Service Delivery HR Help Desk, Portal
Self Service/Direct Access Employee Self Service Manager Self Service
Workforce Management Time & Labor, Absence & Leave Management, Labor
Scheduling, Labor Budgeting, WFM Analytics,
Talent Management Recruiting, Performance, Learning, Compensation,
Succession, Career, Talent Profile, Onboarding, TM Analytics
Business Intelligence Foundation Reporting/Visualization and BI tools
Administrative Apps Core HRMS, Roles/Competencies (Profile Mgt.), Payroll,
Benefit Admin, Embedded HR Analytics,
Sierra-Cedar HCM Application Blueprint
66% Adoption
90% Adoption
60% Adoption
51% Adoption
39% Adoption
PaaS
Enterprise Data Privacy

8
About Ingersoll Rand: • Diversified Industrial • 45,000 Employees • 8% Contingent Workforce • Workforce in 60 countries
My Role:
Director, Workforce Technology & Data Governance

9
Overview of HR System Environment:
HR Practice Category Solution in Use Today Core HCM PeopleSoft 9.0 Payroll (U.S., Mexico, Chile) PeopleSoft 9.0 Time and Labor Management Kronos Talent Management SuccessFactors Talent Acquisition Taleo Career Management Fuel 50 Learning Oracle iLearning Compensation Planning PeopleFluent Workforce Analytics Visier

To Create Technologies That Drive Human Progress
OUR PURPOSE
OUR PEOPLE
140,000 team members
60,000 contingent workforce
40,000+ sales professionals
30,000+ customer service and support professionals
OUR PLACES
180 countries
25 manufacturing locations
40+ finished good distribution/configuration centers
17 global research and development centers

Dell’s HCM Ecosystem
12 custom apps
HR Helpdesk
Legacy-Dell Legacy-EMC
15 custom apps

Culture Strategy Technology
Key Themes for 2016–2017 Survey Results
Relationships
HR Technology Strategy
SMB Opportunity
Enterprise Cloud
EE Trust & Transparency
Pathways Forward
Intelligent Systems
Outcome-Focused HR
12
Constant Change

5%
10%
7%
53%
44%
41%
42%
47%
52%
2015–2016
2016–2017 HR Tech Spending Trends Outlook Continued decline in spending except for mid-market
n = 1,506
5%
4%
8%
45%
44%
35%
51%
51%
58%
2014–2015
4%
5%
11%
55%
49%
40%
41%
46%
49%
2013–2014
Increase Decrease Stay the Same
6%
10%
8%
57%
39%
47%
38%
51%
45%
2016–2017

Service Delivery
Core HR
Payroll
Recruiting
Onboarding
Performance
Learning & Skills
Succession
HR Analytics
Business Process Improvement Initiatives Where do Organizations Plan to Spend Their Time?
14
7%
8%
17%
8%
20%
17%
11%
11%
10%
6%
5% are working on all HR
processes at once
16% are working on non-HR processes (operational)
Compensation, Benefits, Rewards Administrative Apps
Talent Management
Workforce Optimization
Service Delivery Self Service/Direct
Access

Top Initiatives by Size Noticing What Makes Them Different
n=1,528
27% 27% 22% 22% 20%
HR AppsIntegration
Mergers &Acquisitions
MobileEnablement
Global HRMSExpansion
All SystemIntegration
20% 19% 18% 15% 13%
SocialEnablement
WorkforcePlanning
HR AppIntegrations
All SystemIntegrations
ReplacingHRMS
20% 17% 16% 16% 15%
HR AppsIntegration
Replacing anHRMS
Mergers &Acquisition
WorkforcePlanning
WoforceManagement
Apps
Everyone’s Top 5: • BPI • Strategy • TM • SS • BI
Remaining Top 10s change
dramatically
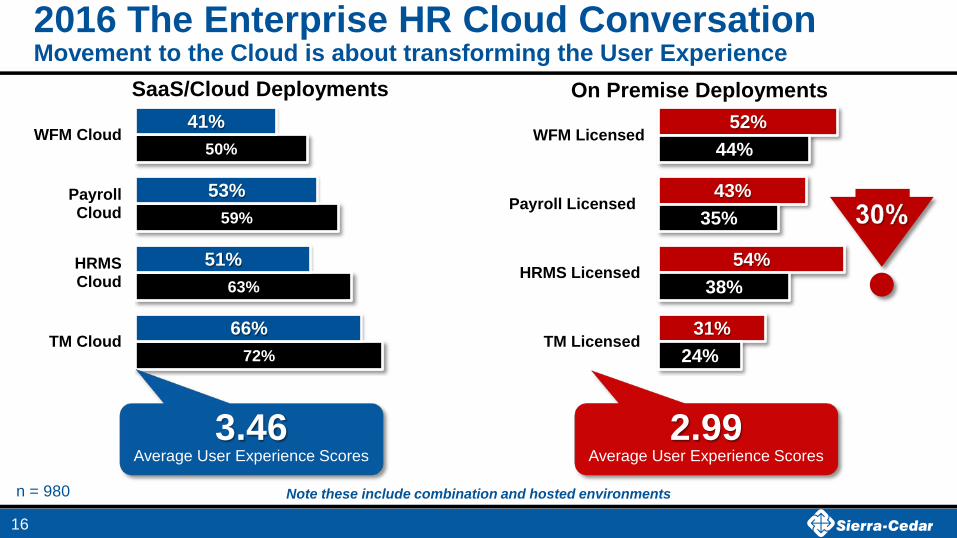
52%
43%
54%
31%
44%
35%
38%
24%
WFM Licensed
Payroll Licensed
HRMS Licensed
TM Licensed
On Premise Deployments
2016 The Enterprise HR Cloud Conversation Movement to the Cloud is about transforming the User Experience
n = 980
72%
63%
59%
50%
66%
51%
53%
41%
TM Cloud
HRMSCloud
PayrollCloud
WFM Cloud
SaaS/Cloud Deployments
16
3.46 Average User Experience Scores
2.99 Average User Experience Scores
Note these include combination and hosted environments

Hybrids Move ONLY TM or WFM apps to Cloud
Rip & Replace Move everything all at once to the Cloud
Parallel/Patchwork Combination Licensed and Cloud Solutions
Hosting/Outsource Single Tenant, or BPO
Multiple Pathways to an HR Tech Transformation Todays State of Replacing HR Technology
17
Reactive Focused
High R
isk Low
Risk
Current State

Multiple Pathways to an HR Tech Transformation Future State of Replacing HR Technology
Future Plans
Reactive Focused
High R
isk Low
Risk
Hybrids Move ONLY TM or WFM apps to Cloud
Rip & Replace Move everything all at once to the Cloud
Patchwork Replace as License Ends
Hosting/ Outsource Single Tenant, or BPO
Parallel Combo Licensed and Cloud Solutions

24%
60%
9%
7% 0%
14%
57%
16%
12% 1%
15%
56%
15%
11% 3%
13%
52% 20% 12%
3%
Payroll Meets Our Needs… HRMS Meets Our Needs… WFM Meets Our Needs… TMS Meets Our Needs…
Does the Technology Meet Your Current Needs?
19
Always Most Times
½ Time Sometimes Never

Higher Cloud Adoption = More Needs Met?
20
31% 24% 20% 21% 17%
8% 9% 8%
Payroll HRMS WFM TMS
Our HR Systems Always Meets Our Needs
High Cloud Low Cloud
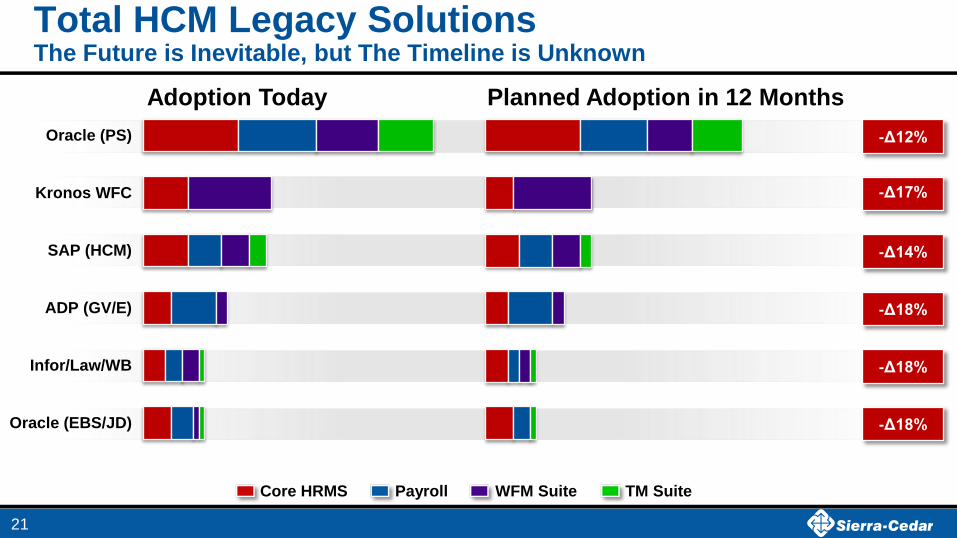
Total HCM Legacy Solutions The Future is Inevitable, but The Timeline is Unknown
21
Oracle (EBS/JD)
Infor/Law/WB
ADP (GV/E)
SAP (HCM)
Kronos WFC
Oracle (PS)
Adoption Today Planned Adoption in 12 Months
-Δ14%
-Δ18%
-Δ18%
-Δ18%
-Δ12%
-Δ17%
TM Suite WFM Suite Core HRMS Payroll

Total HCM Cloud Solutions Growth Across All New Platforms
22
Kronos WFR
ADP Vantage
Ceridian Dayforce
SuccessFactors (EC)
Oracle (HCM Cloud)
Paycor
UltiPro
ADP (WN)*
Workday
Δ23%
Δ42%
Δ5%
Δ0%
Δ43%
Δ29%
Δ17%
Adoption Today Planned Adoption in 12 Months
*ADP Workforce Now has a large population below 50 employees, which we do not track in our research at this time
Δ53%
Δ11%
TM Suite WFM Suite Core HRMS Payroll

Vend
or S
atis
fact
ion
User Experience
Good Enough Zone
We Expect More! Zone
23
Workday
Ceridian DF
UltiPro
SF (EC)
Oracle (HCM C)
SilkRoad
Kronos WFC
Oracle PS
ADP (WN)
Infor/Lawson
SAP (HCM)
Oracle EBS ADP (V)
ADP GV/E
Paycor
Kronos WFR
SumTotal SS
Administrative
Good Excellent
Dis
satis
fied
Very
Sat
isfie
d
Poor
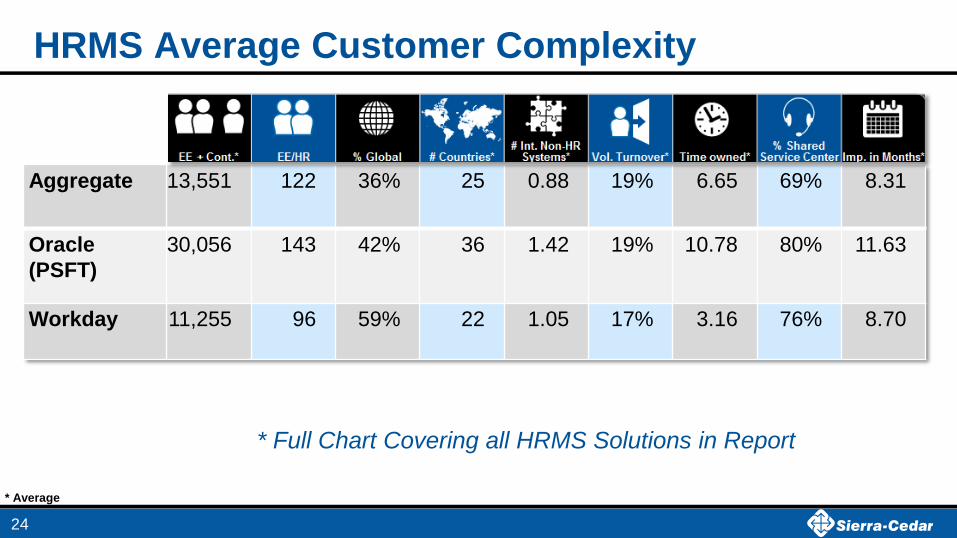
HRMS Average Customer Complexity
24
Aggregate 13,551 122 36% 25 0.88 19% 6.65 69% 8.31
Oracle (PSFT)
30,056 143 42% 36 1.42 19% 10.78 80% 11.63
Workday 11,255 96 59% 22 1.05 17% 3.16 76% 8.70
* Average
* Full Chart Covering all HRMS Solutions in Report

25
Vend
or S
atis
fact
ion
User Experience
Workday
UltiPro
SF (EC) Oracle Cloud
SilkRoad
Oracle PS
SAP (HCM)
Ceridian DF
ADP (V/WN)
SumTotal
PeopleFluent
CSOD
Kenexa/IBM
Saba
Halogen Paycor
Kronos WFR
Talent Management
Good Excellent
Very
Sat
isfie
d
Poor
Dis
satis
fied
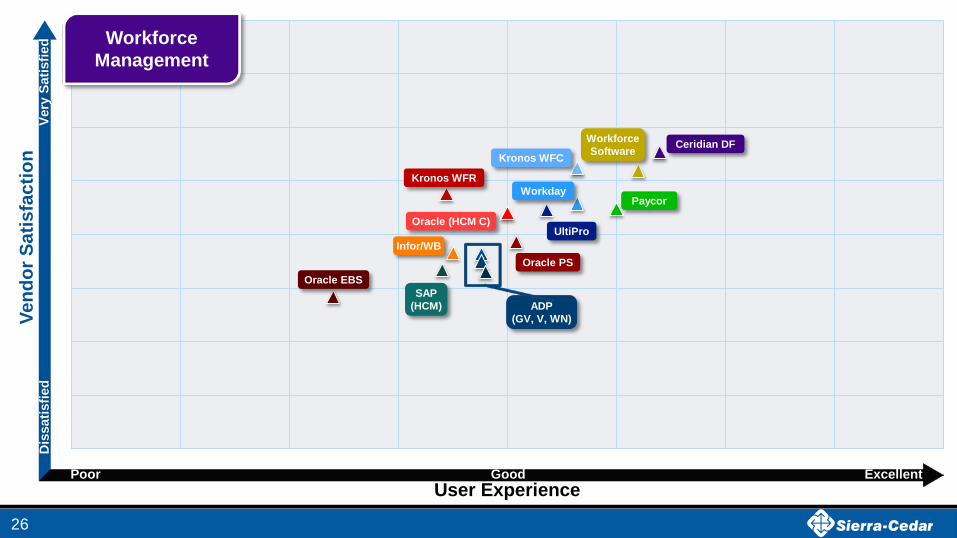
26
Vend
or S
atis
fact
ion
User Experience
Workday
Ceridian DF
UltiPro Oracle (HCM C)
Kronos WFC
Oracle PS Infor/WB
SAP (HCM)
Oracle EBS
ADP (GV, V, WN)
Paycor
Kronos WFR
Workforce Software
Very
Sat
isfie
d Workforce Management
Dis
satis
fied
Good Excellent Poor
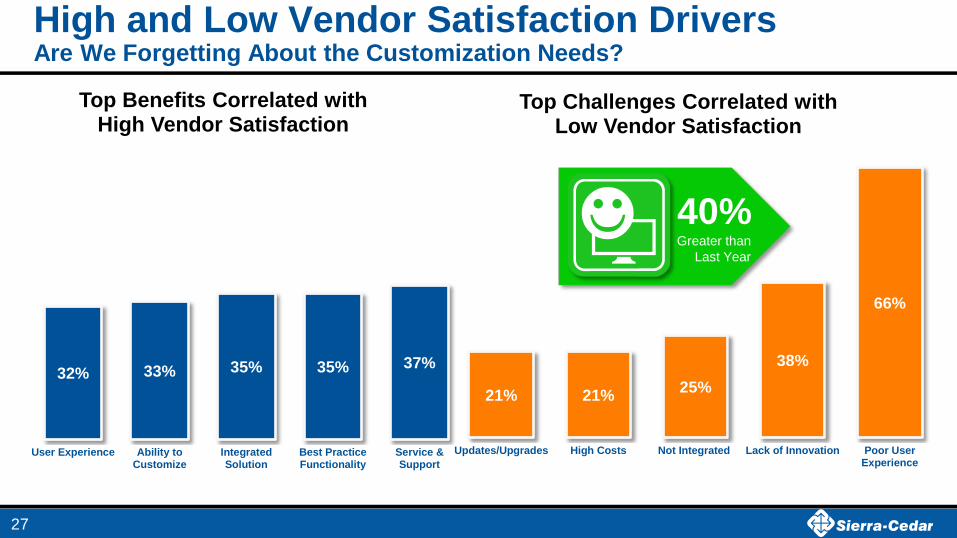
High and Low Vendor Satisfaction Drivers Are We Forgetting About the Customization Needs?
27
32% 33% 35% 35% 37%
User Experience Ability toCustomize
IntegratedSolution
Best PracticeFunctionality
Service &Support
Top Benefits Correlated with High Vendor Satisfaction
21% 21% 25% 38%
66%
Updates/Upgrades High Costs Not Integrated Lack of Innovation Poor UserExperience
Top Challenges Correlated with Low Vendor Satisfaction
40% Greater than
Last Year

Modern HR Changes Everything Rethink Implementations, Change Management, and Cost Assumptions
28
Traditional OnPremise World Modern Cloud World
=/< 25% implementation done by SIs takes 25% longer and costs more
=/> 60% implementation done by SIs
is 20% faster & within budget
Licensed 2X more likely to conduct BPI efforts before Implementation Work vs SaaS
8% lower UE and VS scores 10% lower Business Outcome averages
4X more likely to be viewed as contributing strategic value to their organizations
SI’s Extra Hands & Extra Work SI’s Strategic Partners
Negotiate Lowest Cost Negotiate Better Relationships
Project-Based Change Management Continuous Change Management
Cloud Tech, 1½X more likely to Always Meet Needs
IT = 8%, Ops = 9%, HR = 15%
% Expenditures & Budgets Allocated % Expenditures & Budgets Allocated
IT = 7%, Ops = 5%, HR = 24%


10% 7%
10% 7% 6% 5% 7% 8% 4% 3% 5%
14% 15% 12% 16% 16%
21% 23% 23% 29%
33% 37%
Payroll HRManagement
HR Generalist HR BusinessPartner
Benefits WorkforceManagement
HR ITInfrastructure
HR SystemSupport
TalentManagement
HR DataAnalytics
Learning &Development
n = 1,304 Increase Decrease
Tomorrow’s HR is More Focused and Analytical What HR roles does your organization plan to increase or decrease this year?
30

Business Intelligence/HR Analytics HRMS Embedded HR Analytics solutions Reach Tipping Point
10%
25% 21% 24% 34%
55% 40%
98%
Dedicated HR/BISolutions
BI VisualizationTools
Statistical Tools Emb TMAnalytics
Emb WFMAnalytics
Emb HRMSAnalytics
Platform BISolution
Microsoft Excel
39% of Organizations are doing
some form of BI/HR Analytics with one of these tools
38% increase in Adoption
from last year
n = 681
31

Workforce Planning Realities Rip & Replace Orgs More Likely to Conduct Enterprise Workforce Planning
30% 23% 21% 19% 18%
Rip &Replace
Hosting Parallel Hybrid Patchwork
Enterprise Workforce Planning
32
66% More Likely
22% of all organizations are conducting
Enterprise Workforce Planning
Workforce Planning Approaches

Social Responsibility Initiatives & Regulations
33
29% 47% 52%
58%
54% 55%
64% 69%
62% 66%
73% 74%
27% 23%
33% 23%
27% 27%
22% 21%
22% 27%
19% 20%
17% 16%
13% 15%
15% 13% 12%
4%
9% 6% 6% 5%
Outplacement
Tuition Assistance
Employee Engagement
Community/Volunteer
Retirement Planning
Wellness
Flex Schedules
Employee Assistance
Paid Family Leave
Comp/Pay Equity
Diveristy & Inclusion
Healthcare
Excellent/Good Average Poor/Terrible
High Regulation
Some Regulation
Not Regulated

Contingent Workforces Managed Poorly
34
7% 22% 37% 17% 4% ContingentWorkforce
Excellent Good Average Poor Terrible

Average Generational Compositions No Major Differences by Organizational Size
35
6.0%
7.4%
5.6%
27.6%
27.4%
26.1%
35.4%
36.0%
36.3%
27.7%
26.0%
26.1%
2.9%
2.7%
3.1%
Greatest Gen 1930–1945
Baby Boomer 1946–1964
Gen X 1965–1980
Millennials 1981–2000
Gen Z 2001–2010

71% 64% 65%
55% 48%
42% 35%
11% 5%
Older Workforce Equal Generations Younger Workforce
Strategic Social Technology Use by Generations One of the Only Areas Where Differences Show Up in Technology Adoption
36

Emerging Technologies On the Edge of Intelligent Systems – Preparing for Tomorrow
Workforce Using Today 12 Months Evaluating No Plans Benchmarking Databases 17% 4.0% 18% 61%
Wearable Technology 8% 1% 8% 86%
Machine Learning 6% 1.5% 10% 83%
Sentiment Analysis 4% 1.5% 10% 84%
37

2016 Business Systems: On the Move to Cloud 25% Increase in Organizations Evaluating Cloud Solutions from Last Year
32%
17%
17%
17%
15%
5%
5%
3%
6%
6%
2%
2%
2%
4%
2%
15%
17%
15%
21%
19%
48%
59%
63%
52%
58%
Sales/CRM
Operations Systems
Marketing Systems
Financial Systems
Vendor Management
Non-HR Systems in the Cloud Today?
38
Cloud in 12 Evaluating Cloud in 24 Cloud today No Plans

Thank you!
39

Visit Sierra-Cedar Website Get Full Survey Details and Sign Up To Participate Next Year!
40
www.Sierra-Cedar.com/annual-survey

41
https://www.linkedin.com/in/staceyharris
Stacey Harris, VP Research & Analytics
https://www.linkedin.com/in/erin-spencer-3887346
Erin Spencer, Research Consultant

Metrics tell such a great story and are fabulous for supporting proposed initiatives. The data provided underscored what we have been hearing and seeing as trends in HR—especially as they relate to social media. Leslie Krug HRIT
Why Organizations Participate? ● To obtain a personalized benchmarking snapshot filtered by size, region,
or industry ● They like conducting a review of their own enterprise HR system
environment annually ● They need data to build their own HR Technology strategy or business
case for change ● They believe it is important to support the broader HR technology
community
42