Embed Size (px)
Citation preview
Pakistan Market Strategy 2016
Debunking the myth of the cheap KSE
2
TABLE OF CONTENTS
SLIDE OVERVIEW 3
STRATEGY 7
SECTOR-WISE ANALYSIS AND RECOMMENDATION 20
BANKS 27
E&P 32
CEMENTS 35
STEEL 37
AUTOS 38
OMC 39
FERTILIZER 42
POWER 43

3
OVERVIEW
4
KSE VALUATIONS- FLATTERING TO DECEIVE
With PERs significantly below most emerging/frontier market peers, an upgrade to MSCI EM is seen as the key catalyst
for KSE’s rerating. However, consider the following:
1. The KSE-100’s 5 year total return CAGR of 23.9% (US$) is the highest amongst peers, and in sharp contrast
to the peer group avg. of -0.4%.
2. A 5 year earnings CAGR of 21.1% (US$) versus peer group avg. of -2.4%.
3. Net profit margins that are 60% above the average of the last 5 years, where peer group margins are 10.7%
below their 5 year average.
4. Best in class ROEs of 19.2%, versus peer group avg. of 10.2%.
5. The PKR has been the best performing currency in the last two years in its peer group, up 0.6% against the
USD, whereas peers have on average declined by 16.7% in the period.
Our analysis, in contrast to consensus, finds the KSE not as cheaply valued as it seems based on simple PER, for three
reasons.
1. Profit margins/ROEs are at or nearing record levels in many industries such as Autos, Cement, Steel, Consumer,
and Pharma. Thus, although the trailing PER is low, the KSE-100’s (ex-oil and ex-banks) Cyclically Adjusted
Price to Earnings (CAPE) is high at 16.2x.
2. In sharp contrast to the last five years, there is a significant corporate earnings slowdown ahead (for Next
Universe, we expect a 3 year earnings CAGR of a mere 5%, with risks tilted further to the downside).
3. On the basis of REER, the Pak Rupee seems overvalued by 15%-20%.
5
CAN SUCH HIGH PROFIT MARGINS SUSTAIN?
“Profit margins are probably the most mean-reverting series in finance.” Jeremy Grantham- GMO
Over the last 5 years, margins in Pakistan have been aided by a lack of local and international competition, due to a weak
economic outlook. As a result, incumbents have benefited from the lack of competition. However, this is now likely to change
as Pakistan’s economic outlook is improving considerably, and both local and foreign investment will be more forthcoming.
Competitive pressures are likely to rise across industries.
The PKR’s strength has considerably helped profitability in sectors such as Pharma and Autos. Sooner or later, policy-
makers will need to reduce the extent of overvaluation of the PKR.
Import duty has also been a key driver for margin sustainability in certain manufacturing sectors. However, with China now having
significant surplus capacity in key industries, such as Steel, Cement, and Fertilizer, it is only a matter of time before
Pakistani manufacturers feel the heat in terms of pricing power.
China has now got a stated “Go Abroad” strategy for its manufacturing firms. With Chinese investment already initiated in the
power sector, it is possible that Chinese Steel, Cement and Auto manufacturers directly set-up plants in Pakistan. There is
precedent of this in Africa and Central Asia.
CPEC, the development of the Western Chinese province of Xinjiang, and removal of Iranian sanctions will also be a key
factor in keeping profit margins of Pakistani companies in check. Previously, as China’s western province was not developed,
and Iran was closed for trade, Pak manufacturing sector was relatively insulated from import pressures. These will be felt more
keenly, going forward, in our view.
6
RECOMMENDATION- BUY VALUE RATHER THAN CHASE THE TREND
In this context, we find no gaping under-valuation for the KSE as a whole, and advise a strict bottom-up approach to identify
value.
We recommend a high conviction Overweight stance on the Pak Banking sector, which we believe will see significant foreign
interest in case of an MSCI upgrade. It is also an ideal play on Pakistan’s improving economic prospects, with valuations at very
attractive levels. In the back-drop of improving economic growth, Pak banks are likely to catch up in the next 3-5 years to emerging
market peers in terms of pvt. sector credit growth.
Conglomerates like ENGRO and LUCK will also be key beneficiaries of a potential upgrade to MSCI EM, being foreign
investor favorites, and likely included in the MSCI Pak.
Selected plays in E&Ps (OGDC), OMCs (PSO), Fertilizers (EFERT) and Power (PKGP and LPL) offer significant value as well.
These stocks all hold up well in the case of oil remaining “lower for longer.”
However, in sectors like Autos and Cements, the extent of current high margins will likely limit rerating upside. Whilst these
sectors may look very attractive on trailing PER, on CAPE basis they seem more fairly valued. CHCC remains our top pick in the
Cement sector.
• Sectors such as Consumer and Pharma already seem “priced to perfection”, with margins above historical averages, and very
high PE multiples.

7
STRATEGY
8
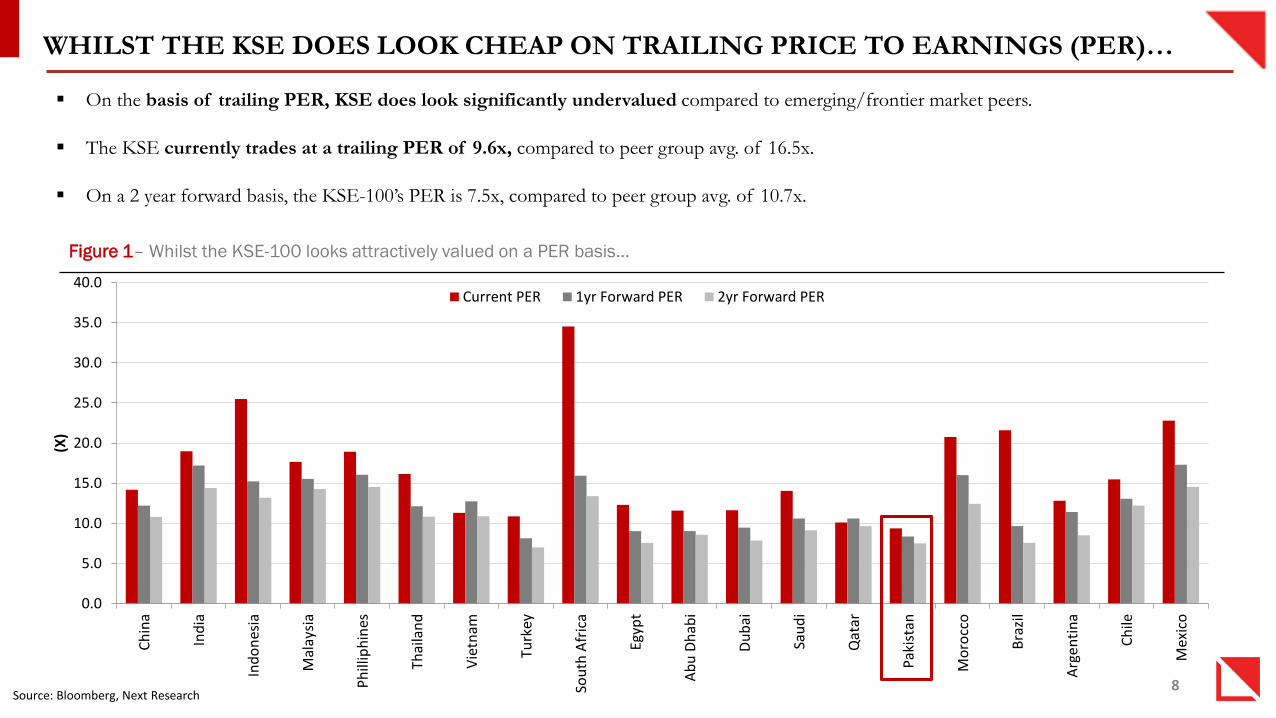
WHILST THE KSE DOES LOOK CHEAP ON TRAILING PRICE TO EARNINGS (PER)…
Source: Bloomberg, Next Research
Figure 1– Whilst the KSE-100 looks attractively valued on a PER basis…
On the basis of trailing PER, KSE does look significantly undervalued compared to emerging/frontier market peers.
The KSE currently trades at a trailing PER of 9.6x, compared to peer group avg. of 16.5x.
On a 2 year forward basis, the KSE-100’s PER is 7.5x, compared to peer group avg. of 10.7x.
0.0
5.0
10.0
15.0
20.0
25.0
30.0
35.0
40.0
Ch
ina
Ind
ia
Ind
on
esia
Mal
aysi
a
Ph
illip
hin
es
Thai
lan
d
Vie
tnam
Turk
ey
Sou
th A
fric
a
Egyp
t
Ab
u D
hab
i
Du
bai
Sau
di
Qat
ar
Pak
ista
n
Mo
rocc
o
Bra
zil
Arg
enti
na
Ch
ile
Mex
ico
(X)
Current PER 1yr Forward PER 2yr Forward PER
9
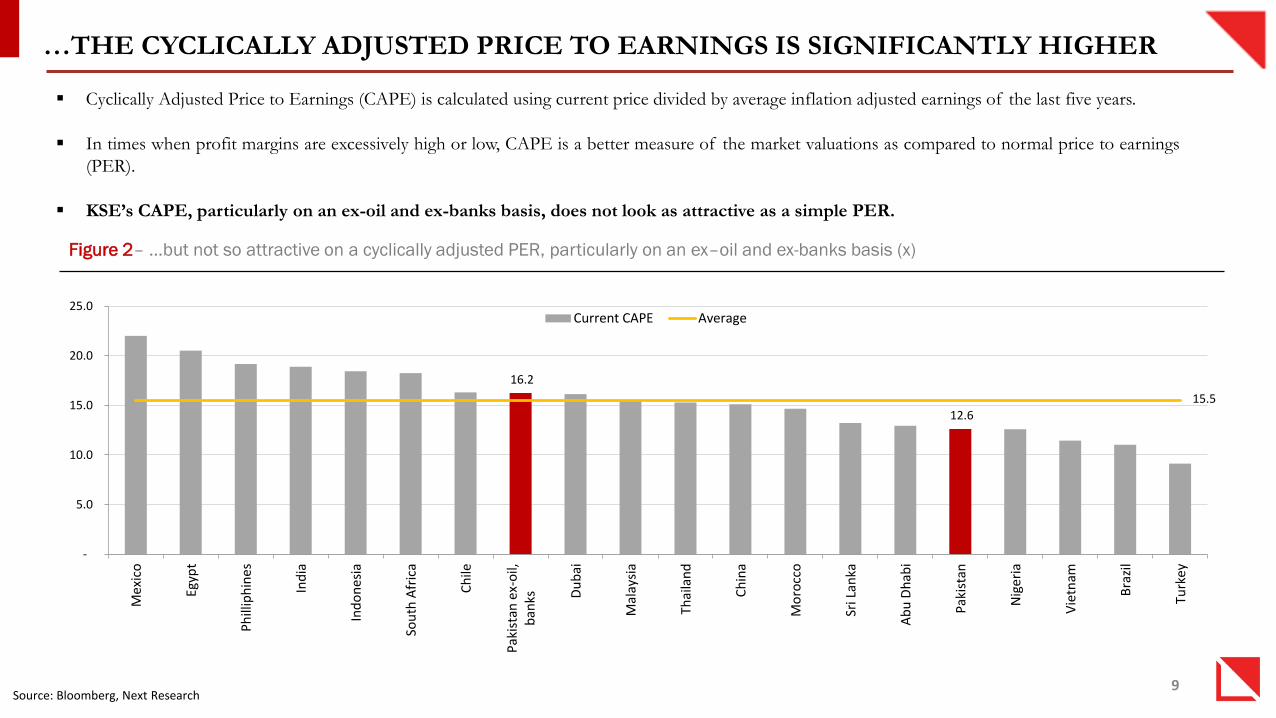
…THE CYCLICALLY ADJUSTED PRICE TO EARNINGS IS SIGNIFICANTLY HIGHER
Source: Bloomberg, Next Research
Figure 2– …but not so attractive on a cyclically adjusted PER, particularly on an ex–oil and ex-banks basis (x)
Cyclically Adjusted Price to Earnings (CAPE) is calculated using current price divided by average inflation adjusted earnings of the last five years.
In times when profit margins are excessively high or low, CAPE is a better measure of the market valuations as compared to normal price to earnings
(PER).
KSE’s CAPE, particularly on an ex-oil and ex-banks basis, does not look as attractive as a simple PER.
16.2
12.6
15.5
-
5.0
10.0
15.0
20.0
25.0
Mex
ico
Egyp
t
Ph
illip
hin
es
Ind
ia
Ind
on
esia
Sou
th A
fric
a
Ch
ile
Pak
ista
n e
x-o
il,b
anks D
ub
ai
Mal
aysi
a
Thai
lan
d
Ch
ina
Mo
rocc
o
Sri L
anka
Ab
u D
hab
i
Pak
ista
n
Nig
eria
Vie
tnam
Bra
zil
Turk
ey
Current CAPE Average
10
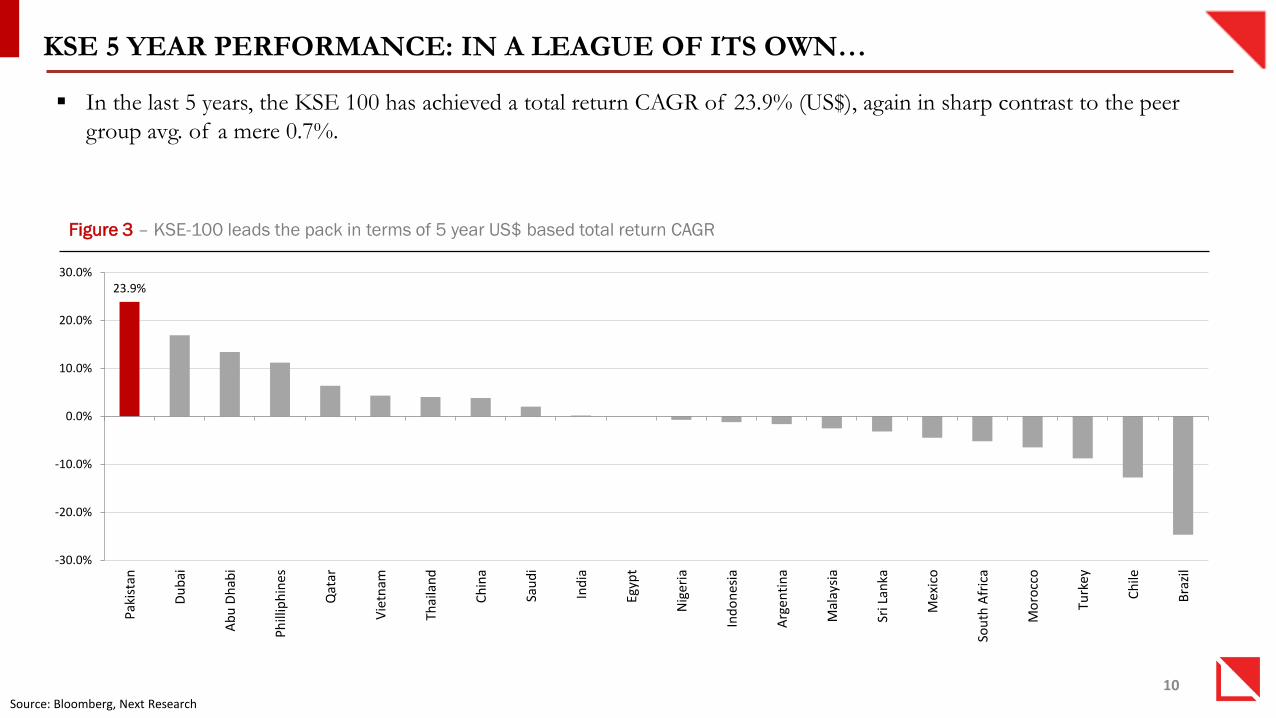
KSE 5 YEAR PERFORMANCE: IN A LEAGUE OF ITS OWN…
Source: Bloomberg, Next Research
In the last 5 years, the KSE 100 has achieved a total return CAGR of 23.9% (US$), again in sharp contrast to the peer
group avg. of a mere 0.7%.
Figure 3 – KSE-100 leads the pack in terms of 5 year US$ based total return CAGR
23.9%
-30.0%
-20.0%
-10.0%
0.0%
10.0%
20.0%
30.0%
Pak
ista
n
Du
bai
Ab
u D
hab
i
Ph
illip
hin
es
Qat
ar
Vie
tnam
Thai
lan
d
Ch
ina
Sau
di
Ind
ia
Egyp
t
Nig
eria
Ind
on
esia
Arg
enti
na
Mal
aysi
a
Sri L
anka
Mex
ico
Sou
th A
fric
a
Mo
rocc
o
Turk
ey
Ch
ile
Bra
zil
11
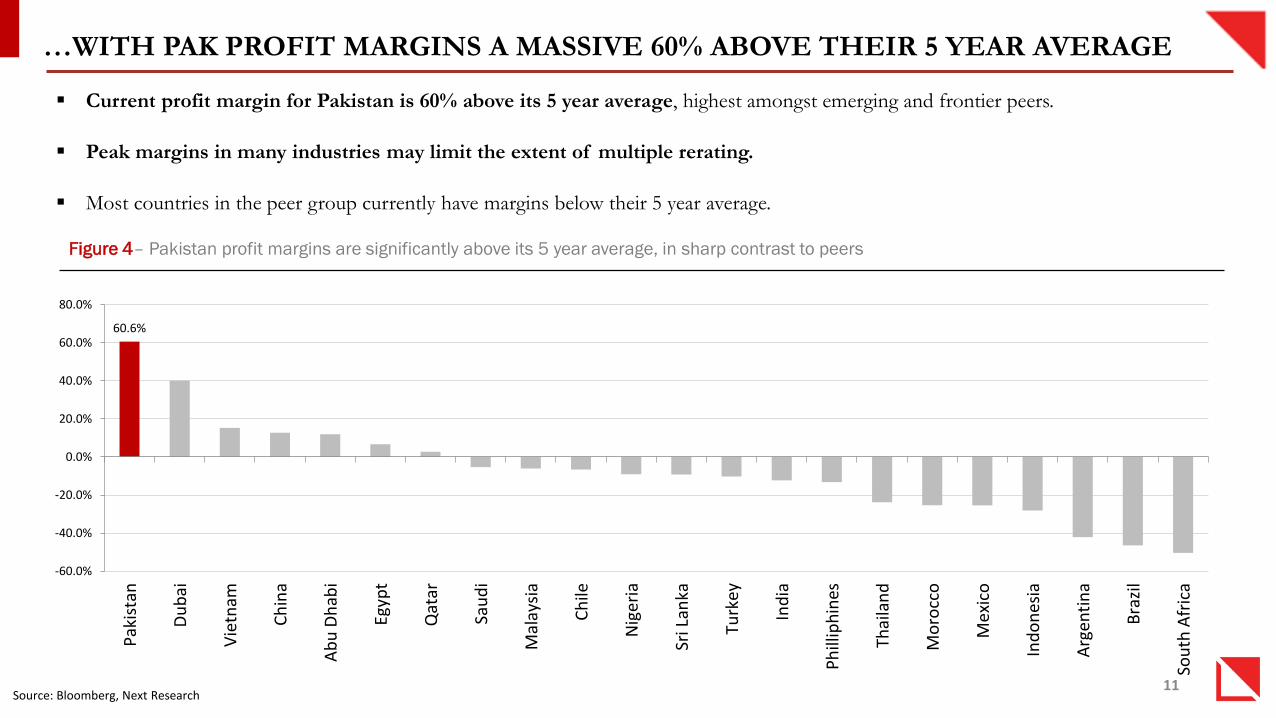
…WITH PAK PROFIT MARGINS A MASSIVE 60% ABOVE THEIR 5 YEAR AVERAGE
Source: Bloomberg, Next Research
Figure 4– Pakistan profit margins are significantly above its 5 year average, in sharp contrast to peers
Current profit margin for Pakistan is 60% above its 5 year average, highest amongst emerging and frontier peers.
Peak margins in many industries may limit the extent of multiple rerating.
Most countries in the peer group currently have margins below their 5 year average.
60.6%
-60.0%
-40.0%
-20.0%
0.0%
20.0%
40.0%
60.0%
80.0%
Pak
ista
n
Du
bai
Vie
tnam
Ch
ina
Ab
u D
hab
i
Egyp
t
Qat
ar
Sau
di
Mal
aysi
a
Ch
ile
Nig
eria
Sri L
anka
Turk
ey
Ind
ia
Ph
illip
hin
es
Thai
lan
d
Mo
rocc
o
Mex
ico
Ind
on
esia
Arg
enti
na
Bra
zil
Sou
th A
fric
a
12
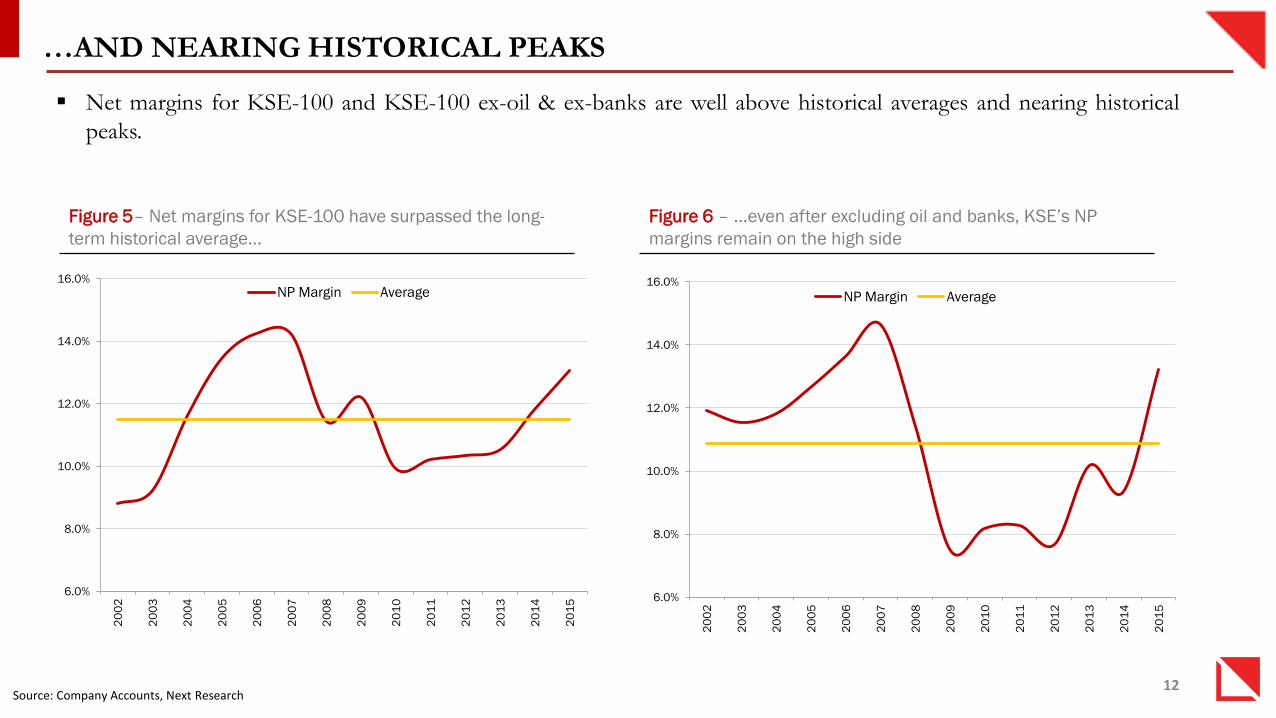
…AND NEARING HISTORICAL PEAKS
Source: Company Accounts, Next Research
Figure 5– Net margins for KSE-100 have surpassed the long-
term historical average…
Net margins for KSE-100 and KSE-100 ex-oil & ex-banks are well above historical averages and nearing historical
peaks.
6.0%
8.0%
10.0%
12.0%
14.0%
16.0%
20
02
20
03
20
04
20
05
20
06
20
07
20
08
20
09
20
10
20
11
20
12
20
13
20
14
20
15
NP Margin Average
6.0%
8.0%
10.0%
12.0%
14.0%
16.0%
20
02
20
03
20
04
20
05
20
06
20
07
20
08
20
09
20
10
20
11
20
12
20
13
20
14
20
15
NP Margin Average
Figure 6 – …even after excluding oil and banks, KSE’s NP
margins remain on the high side

13
PAK ROE HIGHEST AMONGST EMERGING & FRONTIER PEERS…
Source: Bloomberg, Company Accounts, Next Research
Figure 7– Pakistan ROEs are best in class
KSE-100’s ROE at 19.2% is the highest amongst emerging and frontier market peer group, helped by a combination
of lower commodity prices, lack of internal competition, import duty protection, and a strong exchange rate.
As competition rises both locally and internationally, sustaining ROEs at these elevated levels will be difficult.
19.2%
0.0%
5.0%
10.0%
15.0%
20.0%
25.0%
Pa
kis
tan
Vie
tna
m
Qa
tar
Ch
ina
Ph
illip
hin
es
Tu
rke
y
Nig
eri
a
Ind
ia
Ab
u D
ha
bi
Sri
La
nk
a
Sa
ud
i
Ma
lays
ia
Mo
rocco
Ind
on
esia
Du
ba
i
Me
xico
Ch
ile
Th
aila
nd
Arg
en
tin
a
Egyp
t
So
uth
Afr
ica
Bra
zil
Current 5 yr avg.
14
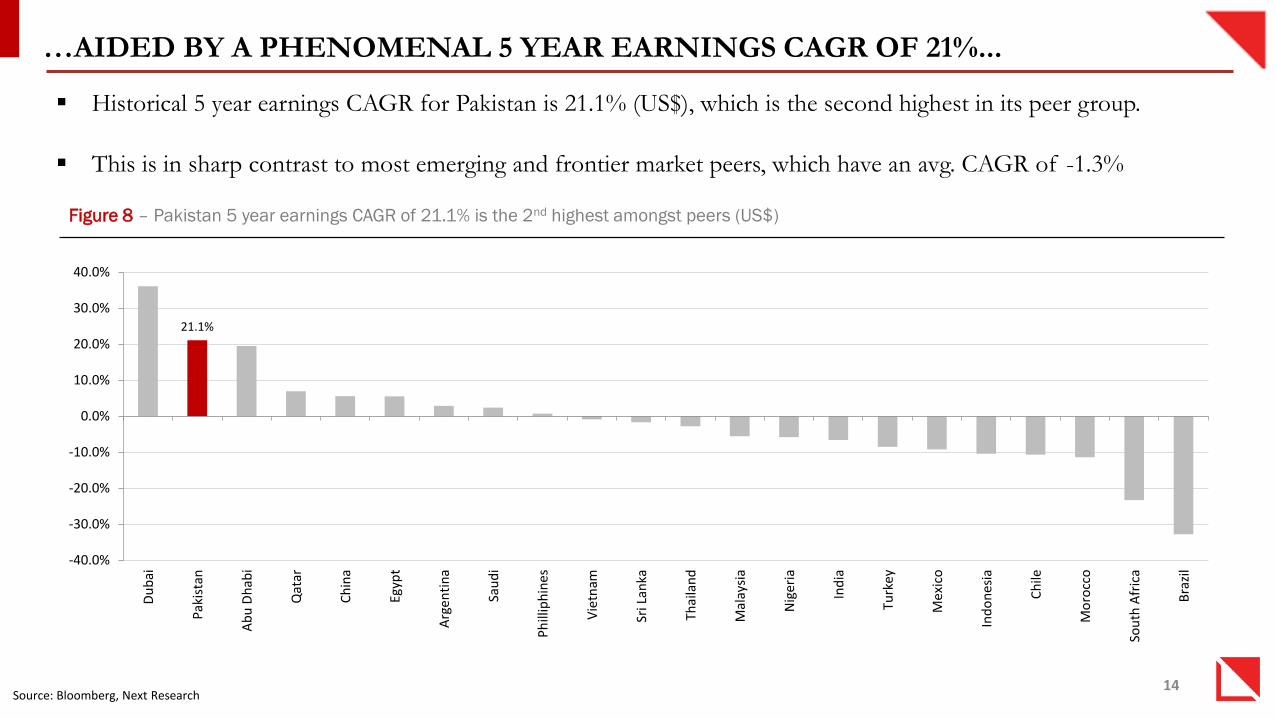
…AIDED BY A PHENOMENAL 5 YEAR EARNINGS CAGR OF 21%...
Source: Bloomberg, Next Research
Figure 8 – Pakistan 5 year earnings CAGR of 21.1% is the 2nd highest amongst peers (US$)
Historical 5 year earnings CAGR for Pakistan is 21.1% (US$), which is the second highest in its peer group.
This is in sharp contrast to most emerging and frontier market peers, which have an avg. CAGR of -1.3%
21.1%
-40.0%
-30.0%
-20.0%
-10.0%
0.0%
10.0%
20.0%
30.0%
40.0%
Du
bai
Pak
ista
n
Ab
u D
hab
i
Qat
ar
Ch
ina
Egyp
t
Arg
enti
na
Sau
di
Ph
illip
hin
es
Vie
tnam
Sri L
anka
Thai
lan
d
Mal
aysi
a
Nig
eria
Ind
ia
Turk
ey
Mex
ico
Ind
on
esia
Ch
ile
Mo
rocc
o
Sou
th A
fric
a
Bra
zil
15
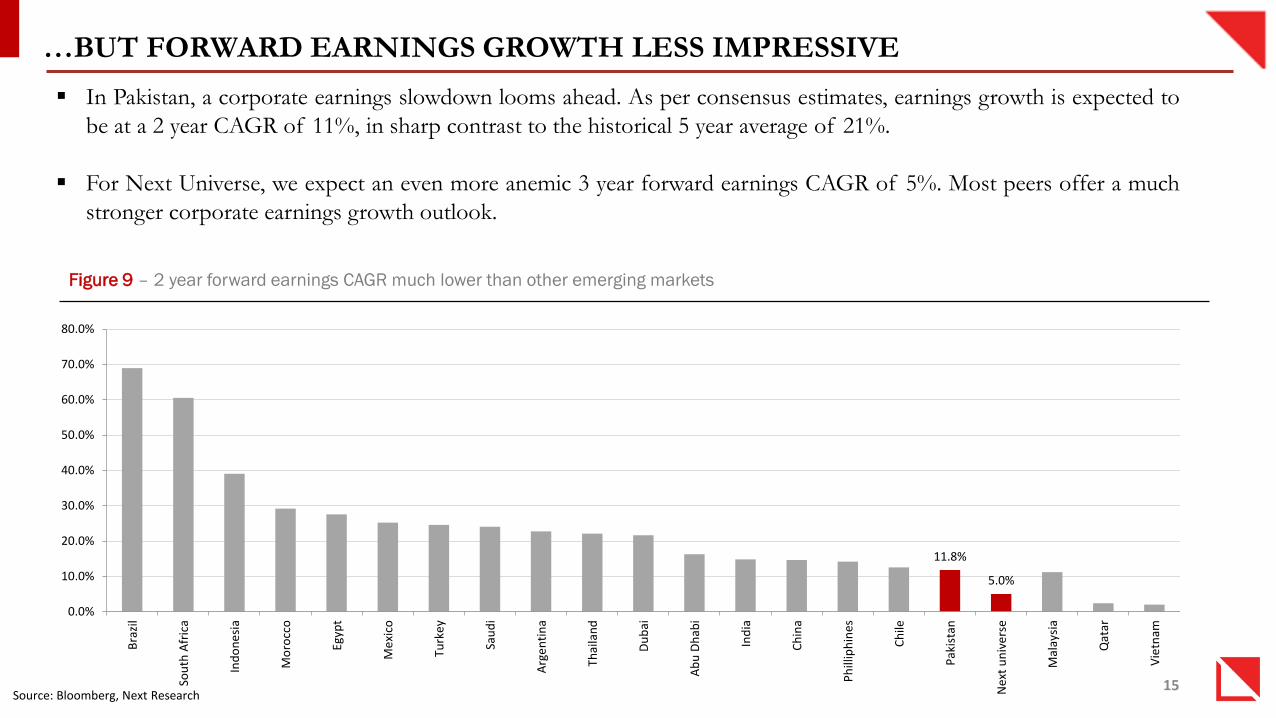
…BUT FORWARD EARNINGS GROWTH LESS IMPRESSIVE
Source: Bloomberg, Next Research
In Pakistan, a corporate earnings slowdown looms ahead. As per consensus estimates, earnings growth is expected to
be at a 2 year CAGR of 11%, in sharp contrast to the historical 5 year average of 21%.
For Next Universe, we expect an even more anemic 3 year forward earnings CAGR of 5%. Most peers offer a much
stronger corporate earnings growth outlook.
Figure 9 – 2 year forward earnings CAGR much lower than other emerging markets
11.8%
5.0%
0.0%
10.0%
20.0%
30.0%
40.0%
50.0%
60.0%
70.0%
80.0%
Bra
zil
Sou
th A
fric
a
Ind
on
esi
a
Mo
rocc
o
Egyp
t
Me
xico
Turk
ey
Sau
di
Arg
en
tin
a
Thai
lan
d
Du
bai
Ab
u D
hab
i
Ind
ia
Ch
ina
Ph
illip
hin
es
Ch
ile
Pak
ista
n
Nex
t u
niv
ers
e
Mal
aysi
a
Qat
ar
Vie
tnam
16
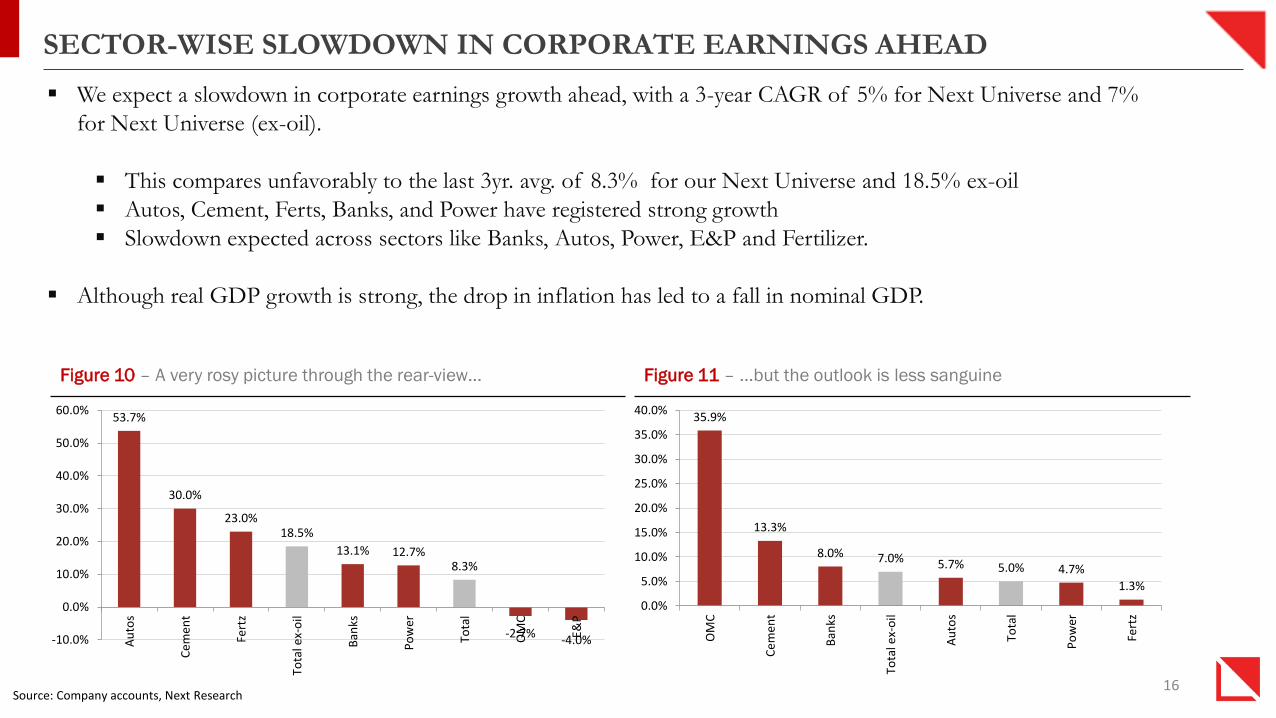
SECTOR-WISE SLOWDOWN IN CORPORATE EARNINGS AHEAD
We expect a slowdown in corporate earnings growth ahead, with a 3-year CAGR of 5% for Next Universe and 7%
for Next Universe (ex-oil).
This compares unfavorably to the last 3yr. avg. of 8.3% for our Next Universe and 18.5% ex-oil
Autos, Cement, Ferts, Banks, and Power have registered strong growth
Slowdown expected across sectors like Banks, Autos, Power, E&P and Fertilizer.
Although real GDP growth is strong, the drop in inflation has led to a fall in nominal GDP.
53.7%
30.0%
23.0%18.5%
13.1% 12.7%8.3%
-2.7%-4.0%-10.0%
0.0%
10.0%
20.0%
30.0%
40.0%
50.0%
60.0%
Au
tos
Ce
me
nt
Fert
z
Tota
l ex-
oil
Ban
ks
Po
wer
Tota
l
OM
C
E&P
35.9%
13.3%
8.0% 7.0% 5.7% 5.0% 4.7%
1.3%
0.0%
5.0%
10.0%
15.0%
20.0%
25.0%
30.0%
35.0%
40.0%
OM
C
Ce
me
nt
Ban
ks
Tota
l ex-
oil
Au
tos
Tota
l
Po
wer
Fert
z
Figure 11 – …but the outlook is less sanguineFigure 10 – A very rosy picture through the rear-view…
Source: Company accounts, Next Research
17
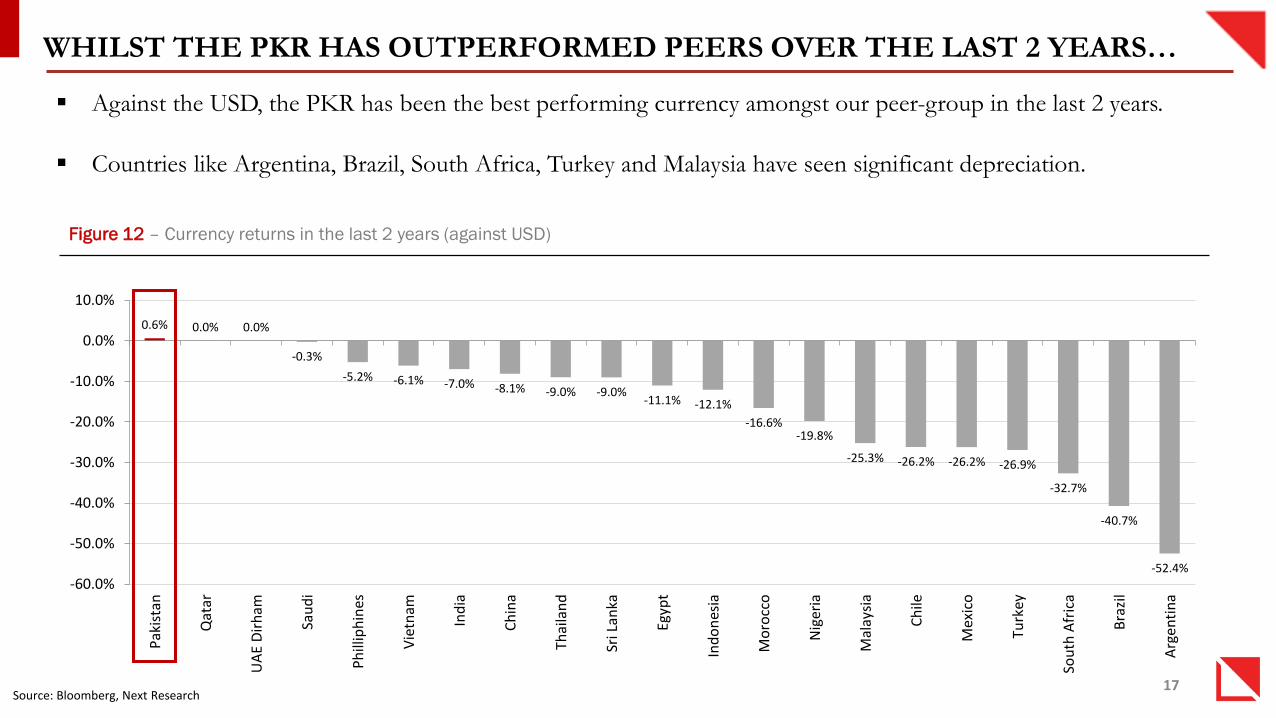
WHILST THE PKR HAS OUTPERFORMED PEERS OVER THE LAST 2 YEARS…
Source: Bloomberg, Next Research
Against the USD, the PKR has been the best performing currency amongst our peer-group in the last 2 years.
Countries like Argentina, Brazil, South Africa, Turkey and Malaysia have seen significant depreciation.
Figure 12 – Currency returns in the last 2 years (against USD)
0.6% 0.0% 0.0%
-0.3%
-5.2% -6.1% -7.0% -8.1% -9.0% -9.0%-11.1% -12.1%
-16.6%-19.8%
-25.3% -26.2% -26.2% -26.9%
-32.7%
-40.7%
-52.4%
-60.0%
-50.0%
-40.0%
-30.0%
-20.0%
-10.0%
0.0%
10.0%
Pak
ista
n
Qat
ar
UA
E D
irh
am
Sau
di
Ph
illip
hin
es
Vie
tnam
Ind
ia
Ch
ina
Thai
lan
d
Sri L
anka
Egyp
t
Ind
on
esia
Mo
rocc
o
Nig
eria
Mal
aysi
a
Ch
ile
Mex
ico
Turk
ey
Sou
th A
fric
a
Bra
zil
Arg
enti
na

18
…IT NOW LOOKS STEEPLY OVERVALUED ON A REER BASIS
Source: Bloomberg, SBP, Next Research
The PKR is now amongst the most overvalued currencies in the world, on the basis of its Real Effective Exchange Rate
(REER).
REER measures a currency versus its trading partners; a level of 100 is neutral, and above 100 indicates overvaluation. The
PKR is currently at a level of 121.2.
In contrast, many emerging market currencies look decidedly undervalued after their recent sharp depreciation.
Figure 13 – PKR is overvalued by 21%, which can dampen market return in US$
21.0
(40.0)
(30.0)
(20.0)
(10.0)
-
10.0
20.0
30.0
40.0
Ch
ina
Sa
ud
i
Pa
kis
tan
Ph
illip
hin
es
UA
E
Ind
ia
Th
aila
nd
Arg
en
tin
a
Ind
on
esia
Me
xico
Ch
ile
Ma
lays
ia
Tu
rke
y
So
uth
Afr
ica
Bra
zil
Ove
rva
luta
tio
n/(U
nd
erv
alu
ati
on
)

19
10-15% DEVALUATION NEEDED TO REVIVE EXPORTS
Source: SBP, Next Research
The PKR’s REER is in uncharted territory, seen in a historical context.
Average REER in the last 13 years has been 101.4.
During the 2004-2007 period of relative FX stability, REER was consistently below the neutral level of 100.
Without a 10-15% depreciation in PKR versus trading partners, exports cannot be revived.
Figure 14 – PKR REER extremely overvalued, even seen in a historical context
80
85
90
95
100
105
110
115
120
125
Jun
e'0
2
Jun
e'0
3
Jun
e'0
4
Jun
e'0
5
Jun
e'0
6
Jun
e'0
7
Jun
e'0
8
Jun
e'0
9
Jun
e'1
0
Jun
e'1
1
Jun
e'1
2
Jun
e'1
3
Jun
e'1
4
Jun
e'1
5
No
v'1
5

20
SECTOR-WISE ANALYSIS & RECOMMENDATIONS
21
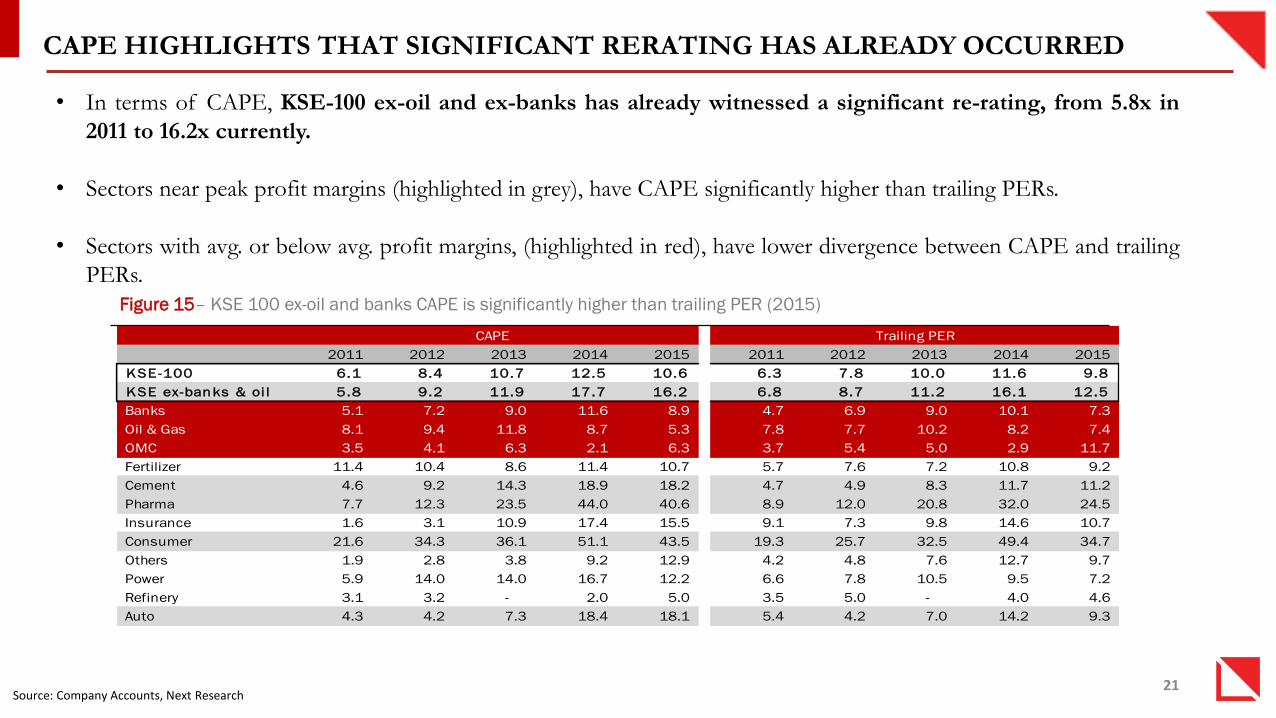
CAPE HIGHLIGHTS THAT SIGNIFICANT RERATING HAS ALREADY OCCURRED
Source: Company Accounts, Next Research
Figure 15– KSE 100 ex-oil and banks CAPE is significantly higher than trailing PER (2015)
• In terms of CAPE, KSE-100 ex-oil and ex-banks has already witnessed a significant re-rating, from 5.8x in
2011 to 16.2x currently.
• Sectors near peak profit margins (highlighted in grey), have CAPE significantly higher than trailing PERs.
• Sectors with avg. or below avg. profit margins, (highlighted in red), have lower divergence between CAPE and trailing
PERs.
2011 2012 2013 2014 2015 2011 2012 2013 2014 2015
KSE-100 6.1 8.4 10.7 12.5 10.6 6.3 7.8 10.0 11.6 9.8
KSE ex-banks & oi l 5.8 9.2 11.9 17.7 16.2 6.8 8.7 11.2 16.1 12.5
Banks 5.1 7.2 9.0 11.6 8.9 4.7 6.9 9.0 10.1 7.3
Oil & Gas 8.1 9.4 11.8 8.7 5.3 7.8 7.7 10.2 8.2 7.4
OMC 3.5 4.1 6.3 2.1 6.3 3.7 5.4 5.0 2.9 11.7
Fertilizer 11.4 10.4 8.6 11.4 10.7 5.7 7.6 7.2 10.8 9.2
Cement 4.6 9.2 14.3 18.9 18.2 4.7 4.9 8.3 11.7 11.2
Pharma 7.7 12.3 23.5 44.0 40.6 8.9 12.0 20.8 32.0 24.5
Insurance 1.6 3.1 10.9 17.4 15.5 9.1 7.3 9.8 14.6 10.7
Consumer 21.6 34.3 36.1 51.1 43.5 19.3 25.7 32.5 49.4 34.7
Others 1.9 2.8 3.8 9.2 12.9 4.2 4.8 7.6 12.7 9.7
Power 5.9 14.0 14.0 16.7 12.2 6.6 7.8 10.5 9.5 7.2
Refinery 3.1 3.2 - 2.0 5.0 3.5 5.0 - 4.0 4.6
Auto 4.3 4.2 7.3 18.4 18.1 5.4 4.2 7.0 14.2 9.3
CAPE Trailing PER
22
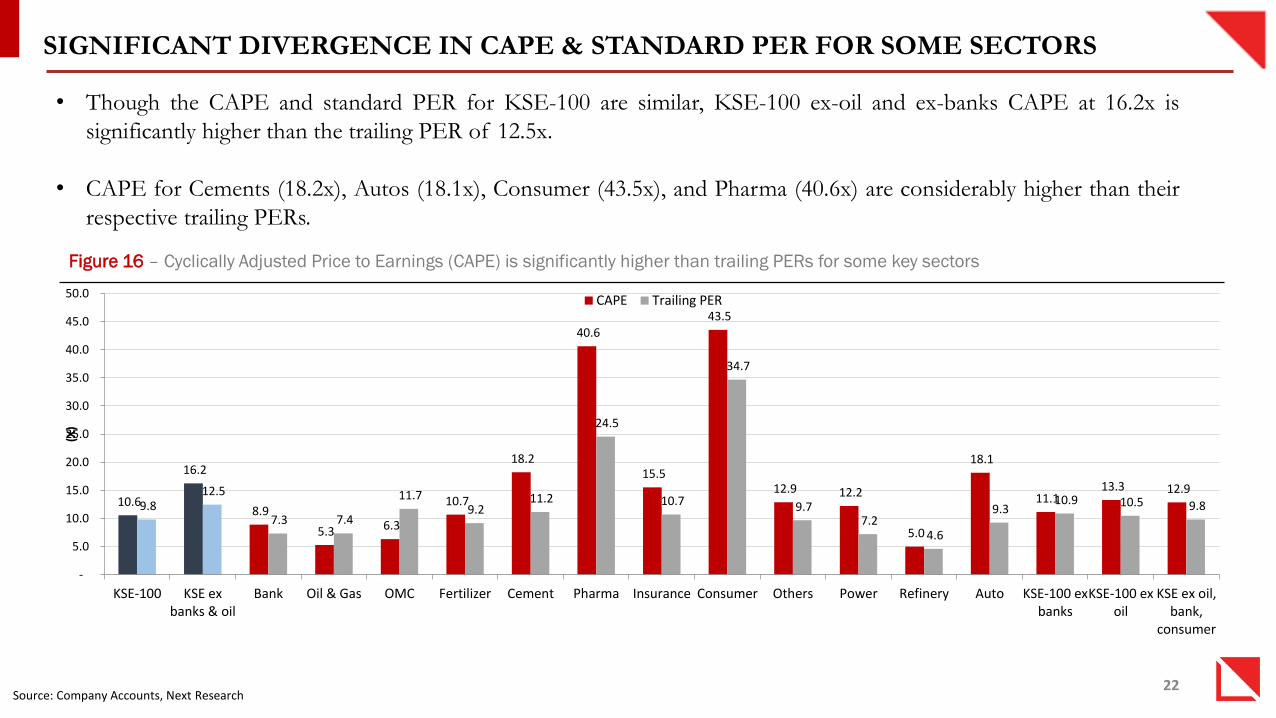
SIGNIFICANT DIVERGENCE IN CAPE & STANDARD PER FOR SOME SECTORS
Source: Company Accounts, Next Research
Figure 16 – Cyclically Adjusted Price to Earnings (CAPE) is significantly higher than trailing PERs for some key sectors
• Though the CAPE and standard PER for KSE-100 are similar, KSE-100 ex-oil and ex-banks CAPE at 16.2x is
significantly higher than the trailing PER of 12.5x.
• CAPE for Cements (18.2x), Autos (18.1x), Consumer (43.5x), and Pharma (40.6x) are considerably higher than their
respective trailing PERs.
10.6
16.2
8.9
5.3 6.3
10.7
18.2
40.6
15.5
43.5
12.9 12.2
5.0
18.1
11.1 13.3 12.9
9.8 12.5
7.3 7.4
11.7 9.2
11.2
24.5
10.7
34.7
9.7 7.2
4.6
9.3 10.9 10.5 9.8
-
5.0
10.0
15.0
20.0
25.0
30.0
35.0
40.0
45.0
50.0
KSE-100 KSE exbanks & oil
Bank Oil & Gas OMC Fertilizer Cement Pharma Insurance Consumer Others Power Refinery Auto KSE-100 exbanks
KSE-100 exoil
KSE ex oil,bank,
consumer
(X)
CAPE Trailing PER

23
PEAK MARGINS RESULT IN HIGH CAPE FOR AUTOS & CEMENTS …
Source: Company Accounts, Next Research
Figure 17 – Auto margins at their highest level…
0.0%
2.0%
4.0%
6.0%
8.0%
10.0%
20
02
20
03
20
04
20
05
20
06
20
07
20
08
20
09
20
10
20
11
20
12
20
13
20
14
20
15
NP Margin Average
Figure 18 – …leading to a wide gap between CAPE & PER
Figure 19 – Cement margins also nearing historic highs … Figure 20 – …with CAPE valuations reflecting the trend
18.1
9.3
-
5.0
10.0
15.0
20.0
25.0
2011 2012 2013 2014 2015
(X)
CAPE Trailing PER
0.0%
5.0%
10.0%
15.0%
20.0%
25.0%
30.0%
20
02
20
03
20
04
20
05
20
06
20
07
20
08
20
09
20
10
20
11
20
12
20
13
20
14
20
15
NP Margin Average
18.2
11.2
-
5.0
10.0
15.0
20.0
25.0
2011 2012 2013 2014 2015(X
)
CAPE Trailing PER
24
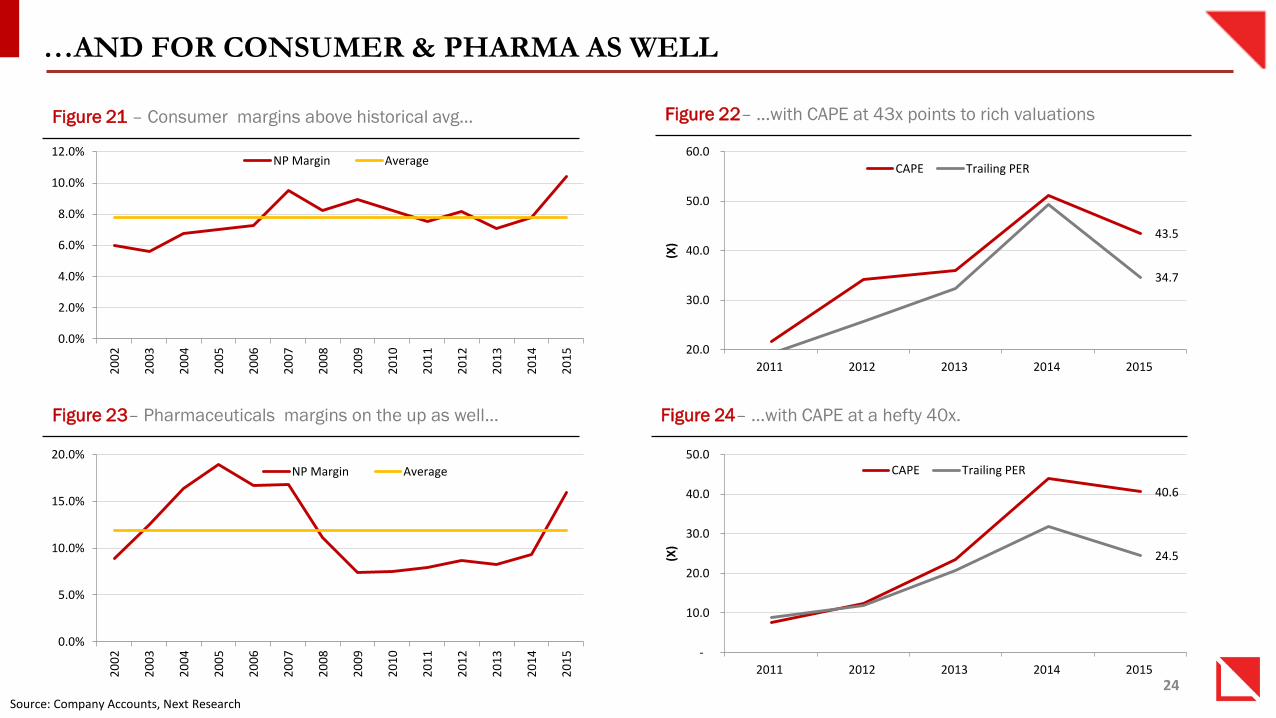
…AND FOR CONSUMER & PHARMA AS WELL
Source: Company Accounts, Next Research
Figure 21 – Consumer margins above historical avg... Figure 22– …with CAPE at 43x points to rich valuations
Figure 23– Pharmaceuticals margins on the up as well… Figure 24– …with CAPE at a hefty 40x.
0.0%
2.0%
4.0%
6.0%
8.0%
10.0%
12.0%
20
02
20
03
20
04
20
05
20
06
20
07
20
08
20
09
20
10
20
11
20
12
20
13
20
14
20
15
NP Margin Average
0.0%
5.0%
10.0%
15.0%
20.0%
20
02
20
03
20
04
20
05
20
06
20
07
20
08
20
09
20
10
20
11
20
12
20
13
20
14
20
15
NP Margin Average
43.5
34.7
20.0
30.0
40.0
50.0
60.0
2011 2012 2013 2014 2015
(X)
CAPE Trailing PER
40.6
24.5
-
10.0
20.0
30.0
40.0
50.0
2011 2012 2013 2014 2015(X
)
CAPE Trailing PER

25
HOWEVER, BANKS & E&P WITH AVG. MARGINS OFFER BETTER VALUE…
Source: Company Accounts, Next Research
Figure 25– Banks’ margins near historical avg… Figure 26– …with CAPE also in a reasonable range…
Figure 27– …and a similar trend in E&Ps… Figure 28– …with CAPE currently below trailing PER
0.0%
10.0%
20.0%
30.0%
40.0%
50.0%
20
02
20
03
20
04
20
05
20
06
20
07
20
08
20
09
20
10
20
11
20
12
20
13
20
14
20
15
NP Margin Average
8.9
7.3
-
2.0
4.0
6.0
8.0
10.0
12.0
14.0
2011 2012 2013 2014 2015
(X)
CAPE Trailing PER
0.0%
10.0%
20.0%
30.0%
40.0%
50.0%
20
02
20
03
20
04
20
05
20
06
20
07
20
08
20
09
20
10
20
11
20
12
20
13
20
14
20
15
NP Margin Average
5.3
7.4
-
2.0
4.0
6.0
8.0
10.0
12.0
14.0
2011 2012 2013 2014 2015
(X)
CAPE Trailing PER
26
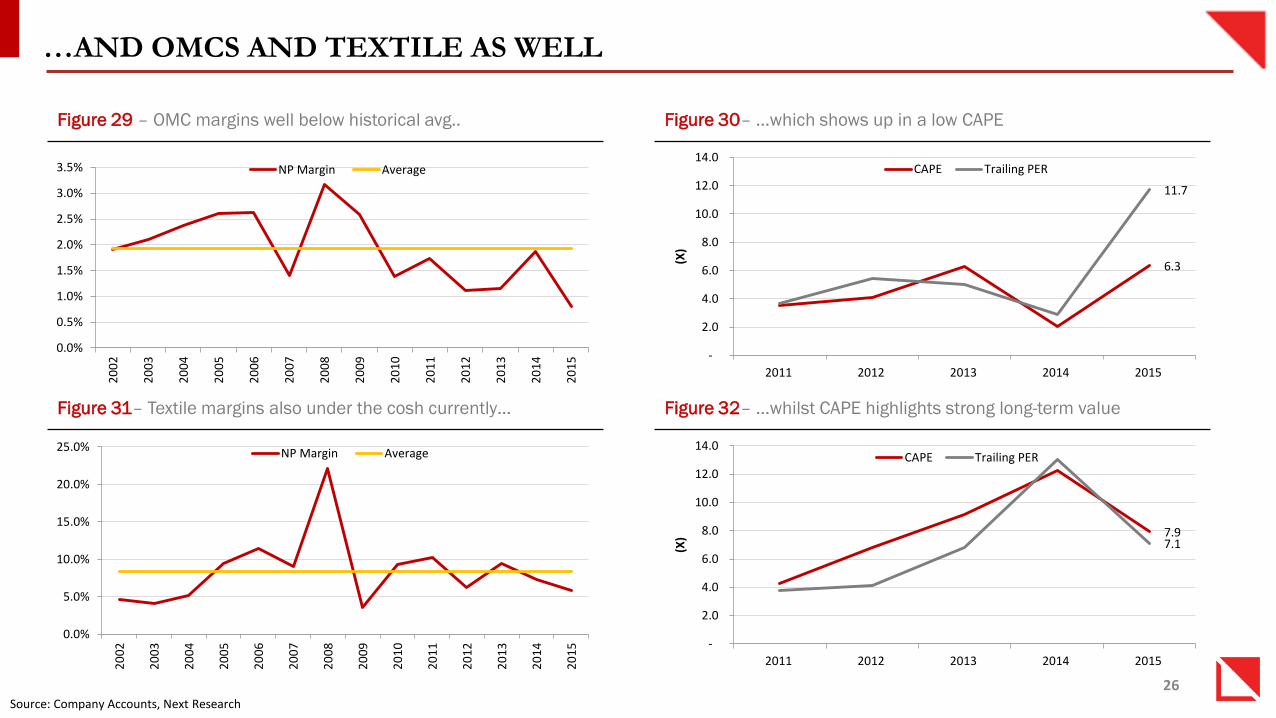
…AND OMCS AND TEXTILE AS WELL
Source: Company Accounts, Next Research
Figure 29 – OMC margins well below historical avg.. Figure 30– …which shows up in a low CAPE
Figure 31– Textile margins also under the cosh currently… Figure 32– …whilst CAPE highlights strong long-term value
0.0%
5.0%
10.0%
15.0%
20.0%
25.0%
20
02
20
03
20
04
20
05
20
06
20
07
20
08
20
09
20
10
20
11
20
12
20
13
20
14
20
15
NP Margin Average
0.0%
0.5%
1.0%
1.5%
2.0%
2.5%
3.0%
3.5%
20
02
20
03
20
04
20
05
20
06
20
07
20
08
20
09
20
10
20
11
20
12
20
13
20
14
20
15
NP Margin Average
6.3
11.7
-
2.0
4.0
6.0
8.0
10.0
12.0
14.0
2011 2012 2013 2014 2015
(X)
CAPE Trailing PER
7.9 7.1
-
2.0
4.0
6.0
8.0
10.0
12.0
14.0
2011 2012 2013 2014 2015
(X)
CAPE Trailing PER
27
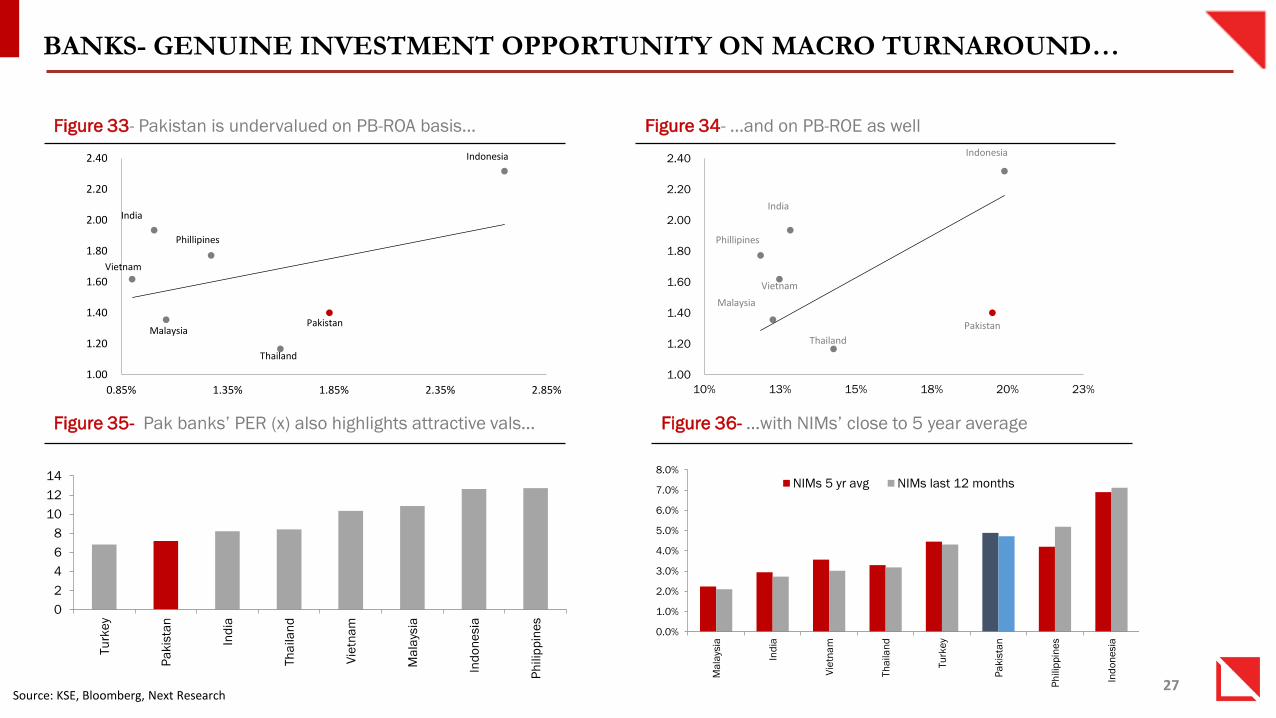
BANKS- GENUINE INVESTMENT OPPORTUNITY ON MACRO TURNAROUND…
Source: KSE, Bloomberg, Next Research
Figure 33- Pakistan is undervalued on PB-ROA basis… Figure 34- …and on PB-ROE as well
1.00
1.20
1.40
1.60
1.80
2.00
2.20
2.40
0.85% 1.35% 1.85% 2.35% 2.85%
Indonesia
Malaysia
Vietnam
Phillipines
India
Thailand
Pakistan
1.00
1.20
1.40
1.60
1.80
2.00
2.20
2.40
10% 13% 15% 18% 20% 23%
Pakistan
India
Indonesia
Malaysia
Phillipines
Thailand
Vietnam
0
2
4
6
8
10
12
14
Tu
rke
y
Pa
kis
tan
Ind
ia
Th
aila
nd
Vie
tna
m
Ma
lays
ia
Ind
on
esia
Ph
ilip
pin
es
Figure 35- Pak banks’ PER (x) also highlights attractive vals… Figure 36- …with NIMs’ close to 5 year average
0.0%
1.0%
2.0%
3.0%
4.0%
5.0%
6.0%
7.0%
8.0%
Ma
lays
ia
Ind
ia
Vie
tna
m
Th
aila
nd
Tu
rke
y
Pa
kis
tan
Ph
ilip
pin
es
Ind
on
esia
NIMs 5 yr avg NIMs last 12 months

28
VALUATIONS ATTRACTIVE IN A HISTORICAL CONTEXT
• Next banking universe trades at the 25th percentile of its 5 year P/B range, with UBL, MCB, ABL and BAHL trading
near their 5 year lows.
• On a PER basis, UBL, MCB, and ABL look attractively valued. On avg, Pak banks currently trade at 43rd percentile of
its 5 year PE average.
Source: KSE, Bloomberg, Next Research
Figure 38- Pakistan Banks trade at 43 percentile in PERFigure 37- Pak Banks trade at 25 percentile P/B of its 5yr range
25%
15%
57%
0%
8%
29%
18%
44%
0%
20%
40%
60%
80%
100%
Industry UBL PA HBL PA MCB PA ABL PA BAFL PA BAHL PA HMB PA
43%
26%
60%
8%
26%
52% 55%
13%
0%
20%
40%
60%
80%
100%
Industry UBL PA HBL PA MCB PA ABL PA BAFL PA BAHL PA HMB PA

29
PAK ECONOMIC TURNAROUND NOT YET PRICED INTO BANKING STOCKS
Source: KSE, Bloomberg, Next Research
-
20.0
40.0
60.0
80.0
100.0
120.0
140.0
160.0
180.0
2004 2005 2006 2007 2008 2009 2010 2011 2012 2013 2014
Pakistan
Philippines Indonesia
Turkey
India
Vietnam
Malaysia
Thailand
Figure 40- …has resulted in Pakistan missing the train of private sector credit
growth (as % of GDP)
2.5%
3.0%
3.5%
4.0%
4.5%
5.0%
5.5%
6.0%
6.5%
7.0%
7.5%
Pa
kis
tan
Th
aila
nd
Tu
rke
y
Ma
lays
ia
Ind
on
esia
Ph
ilip
pin
es
Ind
ia
5yr Real GDP CAGR
Pakistan’s sluggish real GDP growth avg. of 3.2% in the last 5 years explains the disappointing growth in private sector credit
during the period of 2008-2014.
During the last decade, Pakistan’s pvt. sector credit as a % of GDP has declined to 15.4% from 28% in 2004, whereas peers like
Turkey, Philippines, Indonesia and India have witnessed steep increases.
Turkey in particular, has seen astonishing growth, which was below Pakistan at 17% in 2004, and currently stands at 74%.
With Pakistan’s GDP growth trajectory now on the up, Pakistan is well positioned to catch up significantly to peers in the years
ahead.
Figure 39- Historically sluggish 5year real GDP CAGR of 3.2%,
the lowest in our APAC sample…
30
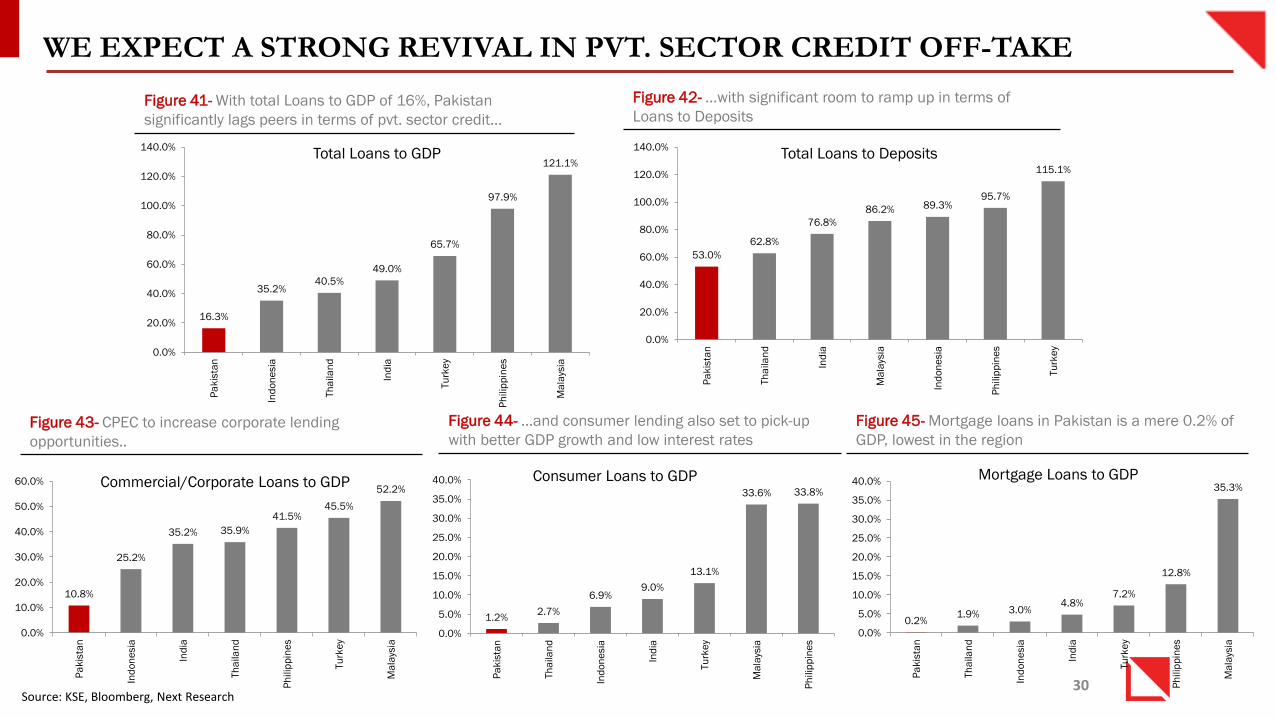
WE EXPECT A STRONG REVIVAL IN PVT. SECTOR CREDIT OFF-TAKE
Source: KSE, Bloomberg, Next Research
16.3%
35.2%40.5%
49.0%
65.7%
97.9%
121.1%
0.0%
20.0%
40.0%
60.0%
80.0%
100.0%
120.0%
140.0%
Pa
kis
tan
Ind
on
esia
Th
aila
nd
Ind
ia
Tu
rke
y
Ph
ilip
pin
es
Ma
lays
ia
53.0%
62.8%
76.8%
86.2% 89.3%95.7%
115.1%
0.0%
20.0%
40.0%
60.0%
80.0%
100.0%
120.0%
140.0%
Pa
kis
tan
Th
aila
nd
Ind
ia
Ma
lays
ia
Ind
on
esia
Ph
ilip
pin
es
Tu
rke
y
Figure 41- With total Loans to GDP of 16%, Pakistan
significantly lags peers in terms of pvt. sector credit…
Figure 42- …with significant room to ramp up in terms of
Loans to Deposits
1.2%2.7%
6.9%9.0%
13.1%
33.6% 33.8%
0.0%
5.0%
10.0%
15.0%
20.0%
25.0%
30.0%
35.0%
40.0%
Pa
kis
tan
Th
aila
nd
Ind
on
esia
Ind
ia
Tu
rke
y
Ma
lays
ia
Ph
ilip
pin
es
0.2%1.9% 3.0%
4.8%7.2%
12.8%
35.3%
0.0%
5.0%
10.0%
15.0%
20.0%
25.0%
30.0%
35.0%
40.0%
Pa
kis
tan
Th
aila
nd
Ind
on
esia
Ind
ia
Tu
rke
y
Ph
ilip
pin
es
Ma
lays
ia
10.8%
25.2%
35.2% 35.9%
41.5%45.5%
52.2%
0.0%
10.0%
20.0%
30.0%
40.0%
50.0%
60.0%
Pa
kis
tan
Ind
on
esia
Ind
ia
Th
aila
nd
Ph
ilip
pin
es
Tu
rke
y
Ma
lays
ia
Figure 43- CPEC to increase corporate lending
opportunities..
Figure 44- …and consumer lending also set to pick-up
with better GDP growth and low interest rates
Figure 45- Mortgage loans in Pakistan is a mere 0.2% of
GDP, lowest in the region
Total Loans to GDP Total Loans to Deposits
Mortgage Loans to GDPConsumer Loans to GDPCommercial/Corporate Loans to GDP
31
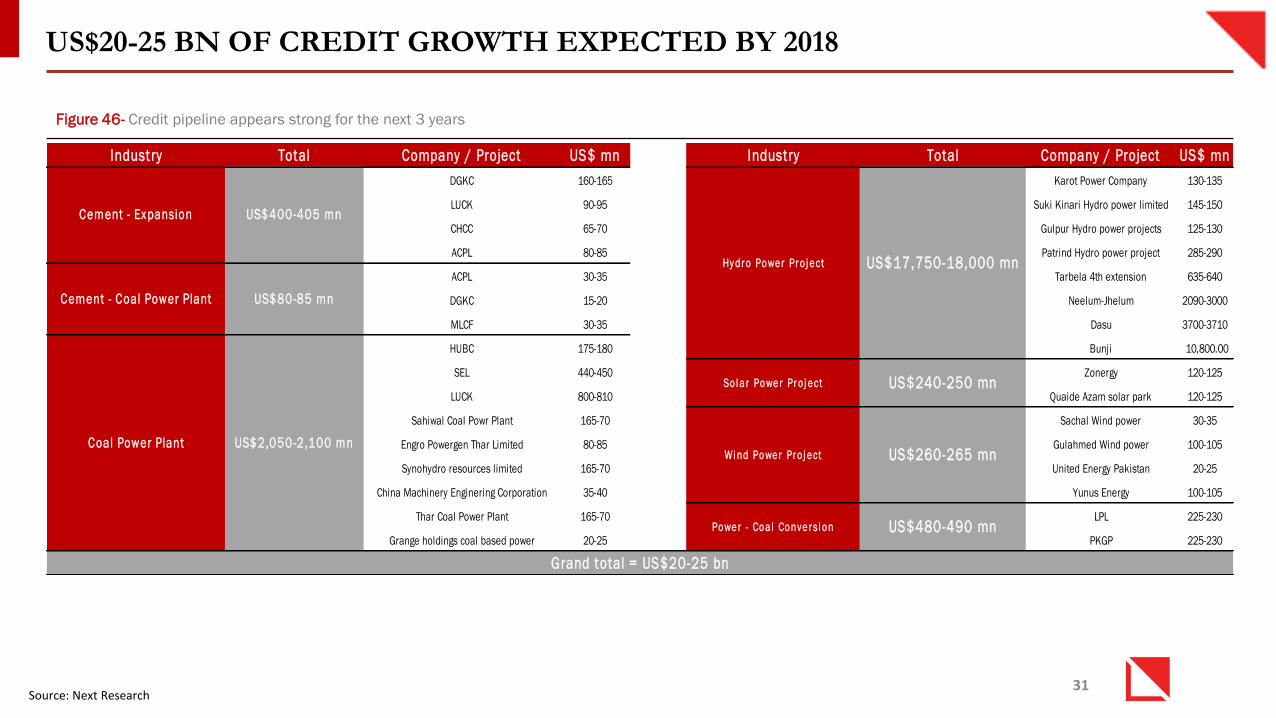
US$20-25 BN OF CREDIT GROWTH EXPECTED BY 2018
Source: Next Research
Industry Total Company / Project US$ mn Industry Total Company / Project US$ mn
DGKC 160-165 Karot Power Company 130-135
LUCK 90-95 Suki Kinari Hydro power limited 145-150
CHCC 65-70 Gulpur Hydro power projects 125-130
ACPL 80-85 Patrind Hydro power project 285-290
ACPL 30-35 Tarbela 4th extension 635-640
DGKC 15-20 Neelum-Jhelum 2090-3000
MLCF 30-35 Dasu 3700-3710
HUBC 175-180 Bunji 10,800.00
SEL 440-450 Zonergy 120-125
LUCK 800-810 Quaide Azam solar park 120-125
Sahiwal Coal Powr Plant 165-70 Sachal Wind power 30-35
Engro Powergen Thar Limited 80-85 Gulahmed Wind power 100-105
Synohydro resources limited 165-70 United Energy Pakistan 20-25
China Machinery Enginering Corporation 35-40 Yunus Energy 100-105
Thar Coal Power Plant 165-70 LPL 225-230
Grange holdings coal based power 20-25 PKGP 225-230
Grand total = US$20-25 bn
Power - Coal Conversi on US$480-490 mn
Cement - Expansion US$400-405 mn
Sol ar Power Pro j ect US$240-250 mn
Wi nd Power Pro j ect US$260-265 mn
Cement - Coal Power Plant US$80-85 mn
Coal Power Plant US$2,050-2,100 mn
US$17,750-18,000 mnHy dro Power Pro j ect
Figure 46- Credit pipeline appears strong for the next 3 years

32
E&P – OGDC RESILIENT IN A LOW CRUDE PRICE ENVIRONMENT
• Pak E&Ps will likely draw attention in 2016 as the valuation
discount appears favorable. Where we eye strong domestic activity,
we flag that the sector may not attract much foreign interest; thus,
lowering the rerating potential.
• We assert that OGDC’s investment case is largely intact owing to
larger chunk of capped pricing for gas fields, and attractive
valuation.
• Although PPL offers a decent upside, uncertainty on the extension
of Sui Mining Lease compels us to remain cautious in the stock.
Source: PPIS, Next Research
FY17E EPS (PKR) PE (x) TP (PKR/sh)
US$/BBL PPL POL OGDC PPL POL OGDC PPL POL OGDC
60 19.1 37.1 23.2 6.0x 6.8x 4.7x 230 380 178
50 16.3 31.9 21.4 7.1x 7.9x 5.1x 211 343 168
40 13.4 26.6 19.2 8.6x 9.5x 5.7x 190 305 157
30 10.2 20.6 16.8 11.3x 12.2x 6.5x 168 263 145
20 6.2 13.6 13.7 18.6x 18.5x 8.0x 140 216 129
Figure 47: OGDC earnings more resilient in a low crude price
6.3% 4.3%
63.6%
0.0%
0.0%
20.0%
40.0%
60.0%
80.0%
100.0%
120.0%
Regional avg PPL POL OGDC
Figure 48: OGDC looks attractive on forward PER… Figure 49: …and on P/B as well, trading at a 5 year low
39.7%
52.3%
32.4%
5.2%
0.0%
20.0%
40.0%
60.0%
80.0%
100.0%
120.0%
Regional avg PPL POL OGDC
33
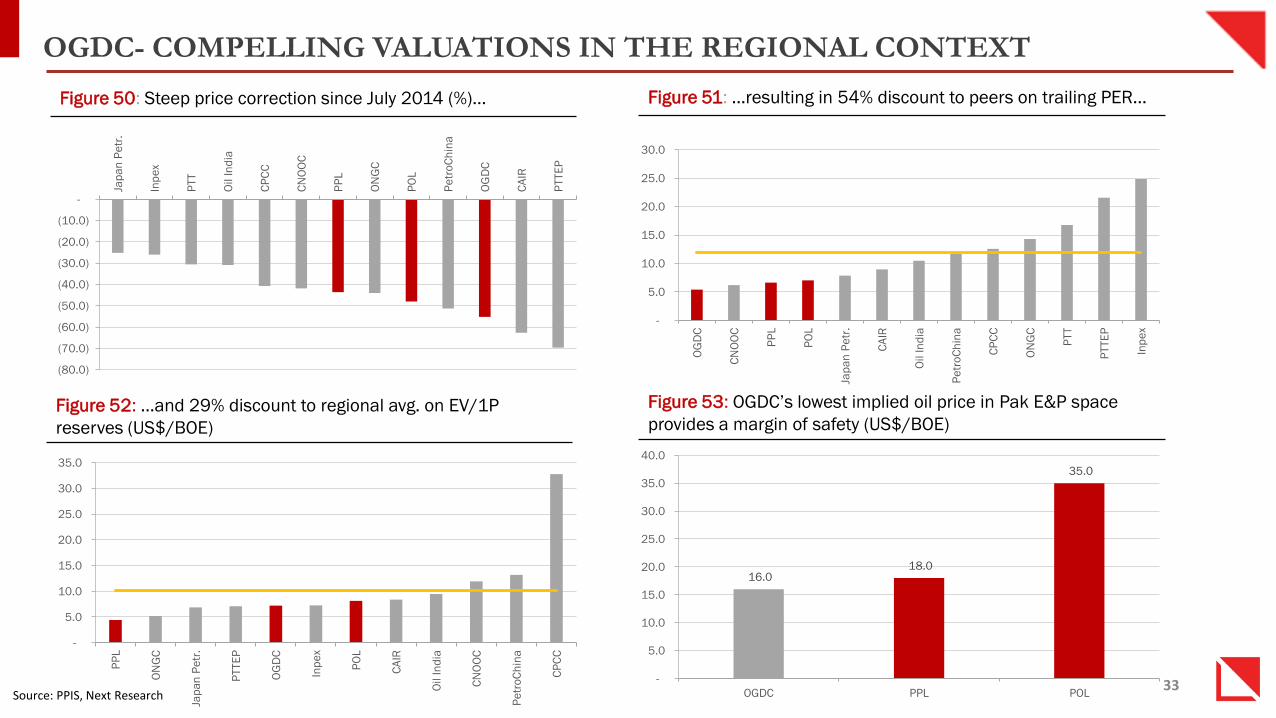
OGDC- COMPELLING VALUATIONS IN THE REGIONAL CONTEXT
Source: PPIS, Next Research
Figure 50: Steep price correction since July 2014 (%)… Figure 51: …resulting in 54% discount to peers on trailing PER…
Figure 52: …and 29% discount to regional avg. on EV/1P
reserves (US$/BOE)
Figure 53: OGDC’s lowest implied oil price in Pak E&P space
provides a margin of safety (US$/BOE)
(80.0)
(70.0)
(60.0)
(50.0)
(40.0)
(30.0)
(20.0)
(10.0)
-
Jap
an
Pe
tr.
Inp
ex
PTT
Oil In
dia
CP
CC
CN
OO
C
PP
L
ON
GC
PO
L
Pe
tro
Ch
ina
OG
DC
CA
IR
PTTE
P
-
5.0
10.0
15.0
20.0
25.0
30.0
OG
DC
CN
OO
C
PP
L
PO
L
Jap
an
Pe
tr.
CA
IR
Oil In
dia
Pe
tro
Ch
ina
CP
CC
ON
GC
PTT
PTTE
P
Inp
ex
-
5.0
10.0
15.0
20.0
25.0
30.0
35.0
PP
L
ON
GC
Jap
an
Pe
tr.
PTTE
P
OG
DC
Inp
ex
PO
L
CA
IR
Oil In
dia
CN
OO
C
Pe
tro
Ch
ina
CP
CC
16.0 18.0
35.0
-
5.0
10.0
15.0
20.0
25.0
30.0
35.0
40.0
OGDC PPL POL
34
STRONG FUNDAMENTALS FOR PAK E&P COMPARED TO REGIONAL PEERS
Source: PPIS, Next Research
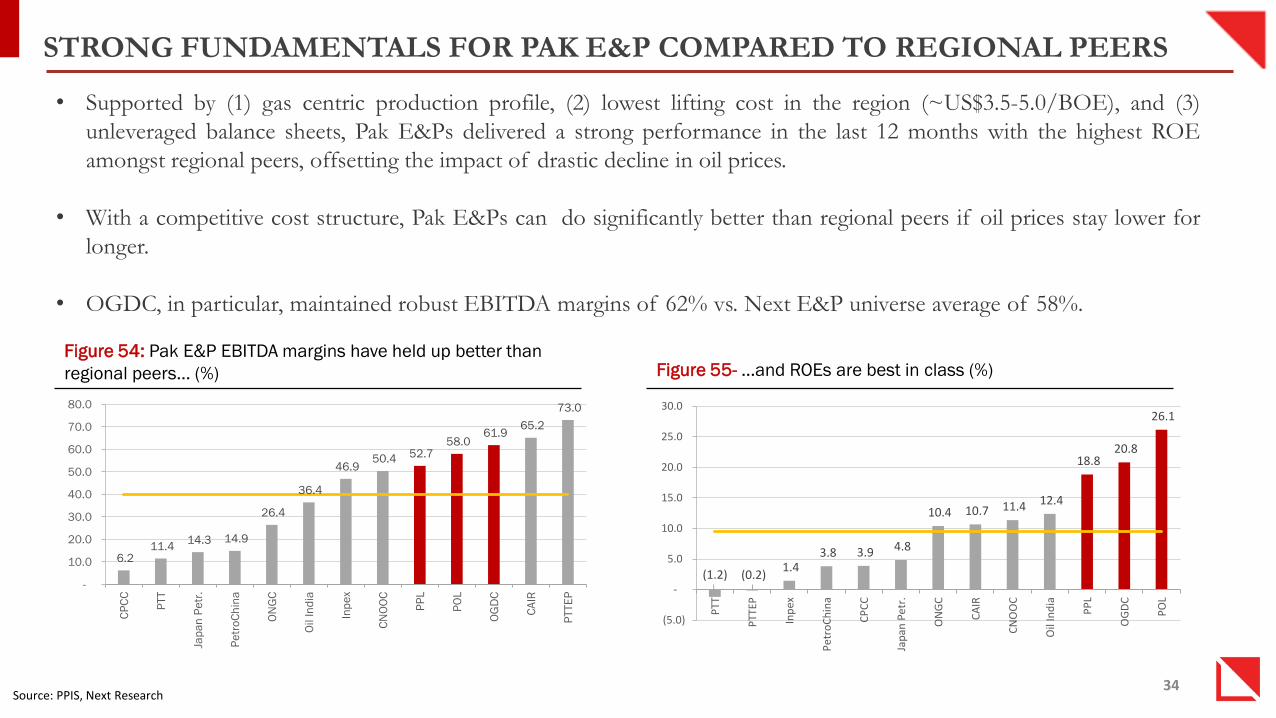
• Supported by (1) gas centric production profile, (2) lowest lifting cost in the region (~US$3.5-5.0/BOE), and (3)
unleveraged balance sheets, Pak E&Ps delivered a strong performance in the last 12 months with the highest ROE
amongst regional peers, offsetting the impact of drastic decline in oil prices.
• With a competitive cost structure, Pak E&Ps can do significantly better than regional peers if oil prices stay lower for
longer.
• OGDC, in particular, maintained robust EBITDA margins of 62% vs. Next E&P universe average of 58%.
(1.2) (0.2)1.4
3.8 3.9 4.8
10.4 10.7 11.4 12.4
18.8 20.8
26.1
(5.0)
-
5.0
10.0
15.0
20.0
25.0
30.0
PTT
PTT
EP
Inp
ex
Pet
roC
hin
a
CP
CC
Jap
an P
etr
.
ON
GC
CA
IR
CN
OO
C
Oil
Ind
ia
PP
L
OG
DC
PO
L
Figure 54: Pak E&P EBITDA margins have held up better than
regional peers… (%) Figure 55- …and ROEs are best in class (%)
6.2 11.4
14.3 14.9
26.4
36.4
46.9 50.4 52.7
58.0 61.9
65.2
73.0
-
10.0
20.0
30.0
40.0
50.0
60.0
70.0
80.0
CP
CC
PTT
Jap
an
Pe
tr.
Pe
tro
Ch
ina
ON
GC
Oil In
dia
Inp
ex
CN
OO
C
PP
L
PO
L
OG
DC
CA
IR
PTTE
P

35
CEMENTS – A CASE OF TWO VALUATIONS
Source: Bloomberg, Next Research
86
130 138 142 147
187
215
-
50
100
150
200
250
China Pakistan Malaysia Indonesia India Thailand Phillipines
0x
5x
10x
15x
20x
25x
30x
Pakistan China Thailand Phillipines Indonesia Malaysia India
2016E P/E 5 year avg. P/E
Figure 56- Pakistan appears cheap on forward P/E basis… Figure 57- …but similar to regional peers on EV/ton basis (US$)
• Pakistan is the cheapest amongst our peer group on PER basis. However, on an EV/ton basis, which is a more relevant
metric for cross regional comparison, Pakistan is largely similar to the peer group average, suggesting limited room for
rerating.
• Our top pick in the sector is Cherat Cement, which is best suited to capture volume growth and market share as its
capacity is expected to more than double by Dec-16. .
• Lucky Cement also remains an attractive proposition due to superior capital allocation relative to peers & potential
inclusion in MSCI Pak. Given the preference of foreign investors for Lucky Cement, an upgrade to MSCI EM would be
a significant boast for LUCK’s stock price.
36
MARGINS NEAR HISTORIC HIGH; WELL AHEAD OF REGIONAL PEERS
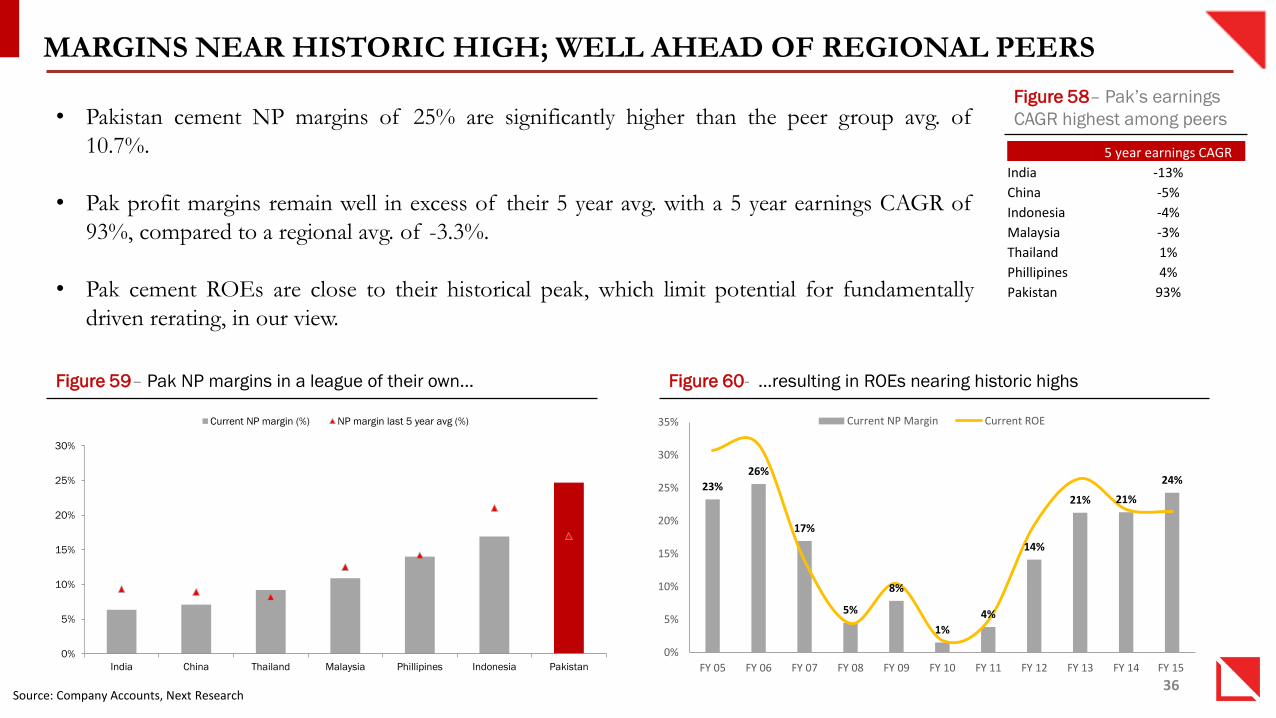
• Pakistan cement NP margins of 25% are significantly higher than the peer group avg. of
10.7%.
• Pak profit margins remain well in excess of their 5 year avg. with a 5 year earnings CAGR of
93%, compared to a regional avg. of -3.3%.
• Pak cement ROEs are close to their historical peak, which limit potential for fundamentally
driven rerating, in our view.
Source: Company Accounts, Next Research
Figure 59– Pak NP margins in a league of their own… Figure 60- …resulting in ROEs nearing historic highs
Figure 58– Pak’s earnings
CAGR highest among peers
5 year earnings CAGR
India -13%
China -5%
Indonesia -4%
Malaysia -3%
Thailand 1%
Phillipines 4%
Pakistan 93%
0%
5%
10%
15%
20%
25%
30%
India China Thailand Malaysia Phillipines Indonesia Pakistan
Current NP margin (%) NP margin last 5 year avg (%)
23%
26%
17%
5%
8%
1%
4%
14%
21% 21%
24%
0%
5%
10%
15%
20%
25%
30%
35%
FY 05 FY 06 FY 07 FY 08 FY 09 FY 10 FY 11 FY 12 FY 13 FY 14 FY 15
Current NP Margin Current ROE
37
STEEL – PAK PLAYERS GOOD FORTUNES IN STARK CONTRAST TO THE REGION
Source: Bloomberg, Next Research
Figure 62–…reflected in its punchy P/B
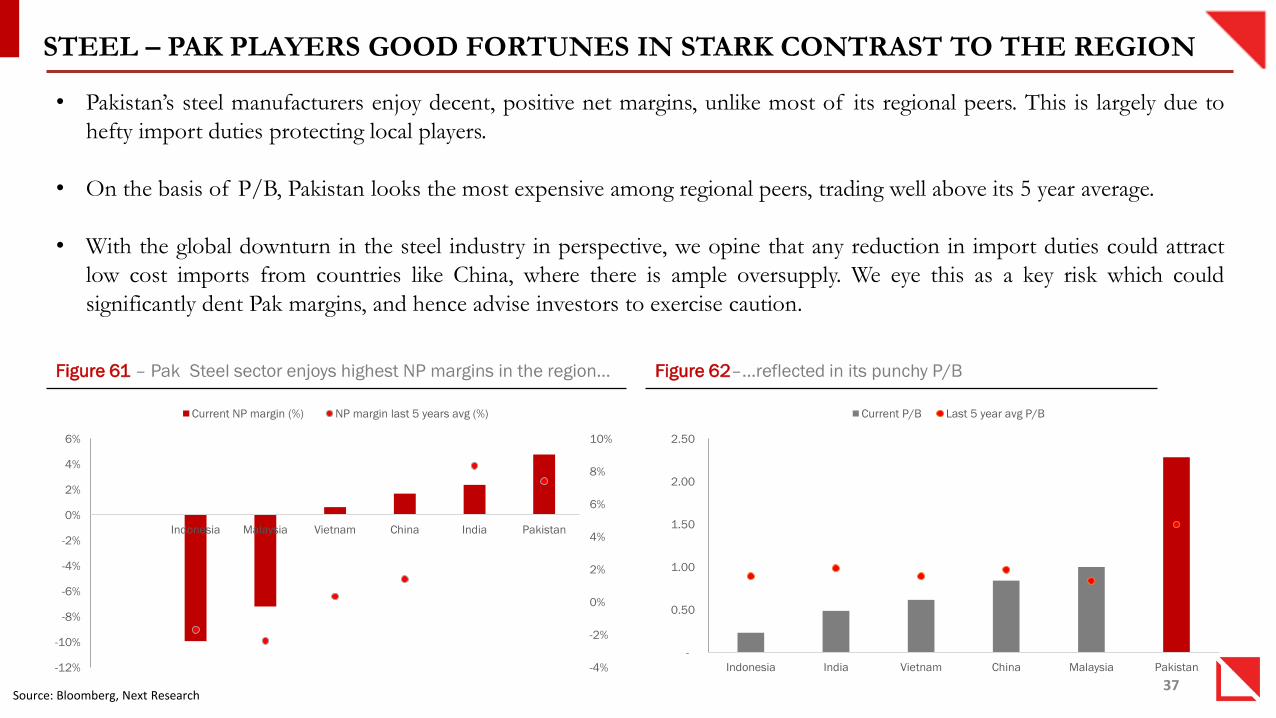
• Pakistan’s steel manufacturers enjoy decent, positive net margins, unlike most of its regional peers. This is largely due to
hefty import duties protecting local players.
• On the basis of P/B, Pakistan looks the most expensive among regional peers, trading well above its 5 year average.
• With the global downturn in the steel industry in perspective, we opine that any reduction in import duties could attract
low cost imports from countries like China, where there is ample oversupply. We eye this as a key risk which could
significantly dent Pak margins, and hence advise investors to exercise caution.
-
0.50
1.00
1.50
2.00
2.50
Indonesia India Vietnam China Malaysia Pakistan
Current P/B Last 5 year avg P/B
-4%
-2%
0%
2%
4%
6%
8%
10%
-12%
-10%
-8%
-6%
-4%
-2%
0%
2%
4%
6%
Indonesia Malaysia Vietnam China India Pakistan
Current NP margin (%) NP margin last 5 years avg (%)
Figure 61 – Pak Steel sector enjoys highest NP margins in the region…
38
AUTOS – PEAK MARGINS TO LIMIT RERATING, DESPITE STRONG VOLUME GROWTH
Source: Bloomberg, Company Reports, Next Research
0.0x
5.0x
10.0x
15.0x
20.0x
25.0x
Pa
kis
tan
Ch
ina
Ind
on
esia
Th
aila
nd
Ma
lays
ia
Ind
ia
Forward P/E 5 year avg P/E
Figure 63- Although Pakistan Autos trade at a
discount to regional peers on PER…
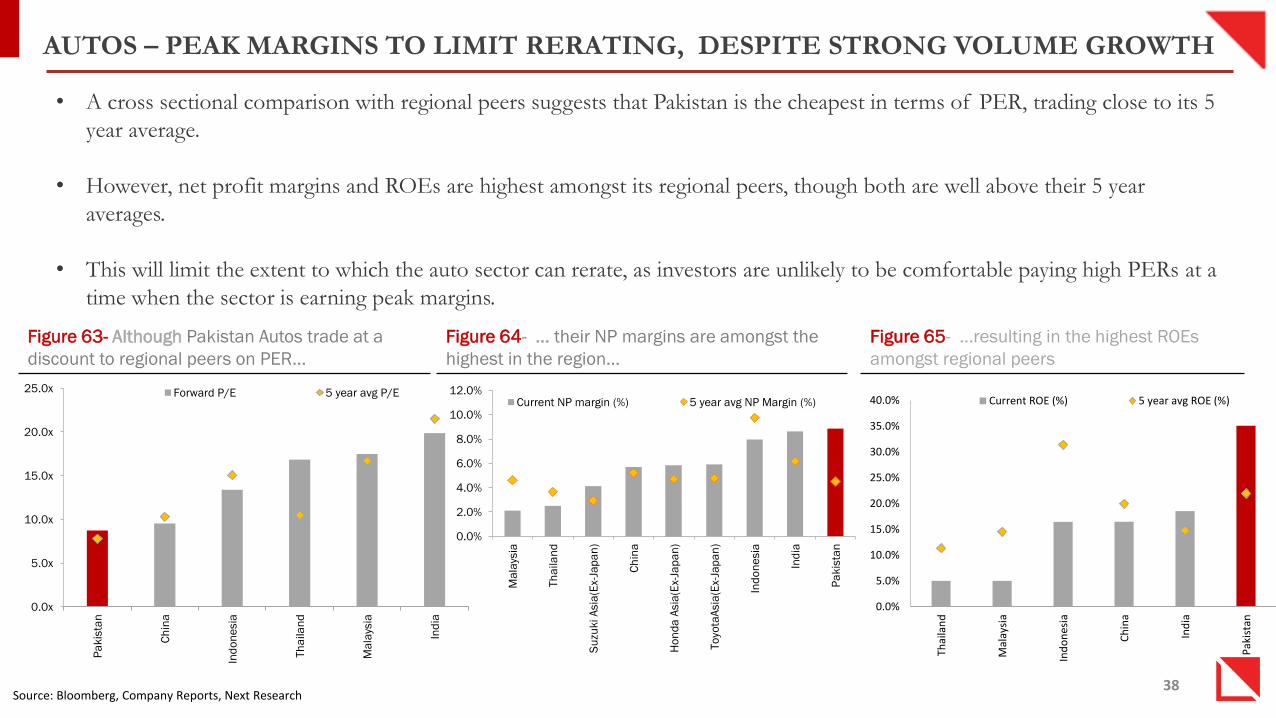
• A cross sectional comparison with regional peers suggests that Pakistan is the cheapest in terms of PER, trading close to its 5
year average.
• However, net profit margins and ROEs are highest amongst its regional peers, though both are well above their 5 year
averages.
• This will limit the extent to which the auto sector can rerate, as investors are unlikely to be comfortable paying high PERs at a
time when the sector is earning peak margins.
0.0%
2.0%
4.0%
6.0%
8.0%
10.0%
12.0%
Ma
lays
ia
Th
aila
nd
Su
zuki A
sia
(Ex-
Jap
an
)
Ch
ina
Ho
nd
a A
sia
(Ex-
Jap
an
)
To
yota
Asia
(Ex-
Jap
an
)
Ind
on
esia
Ind
ia
Pa
kis
tan
Current NP margin (%) 5 year avg NP Margin (%)
Figure 64- … their NP margins are amongst the
highest in the region…
0.0%
5.0%
10.0%
15.0%
20.0%
25.0%
30.0%
35.0%
40.0%
Thai
lan
d
Mal
aysi
a
Ind
on
esia
Ch
ina
Ind
ia
Pak
ista
n
Current ROE (%) 5 year avg ROE (%)
Figure 65- …resulting in the highest ROEs
amongst regional peers
39
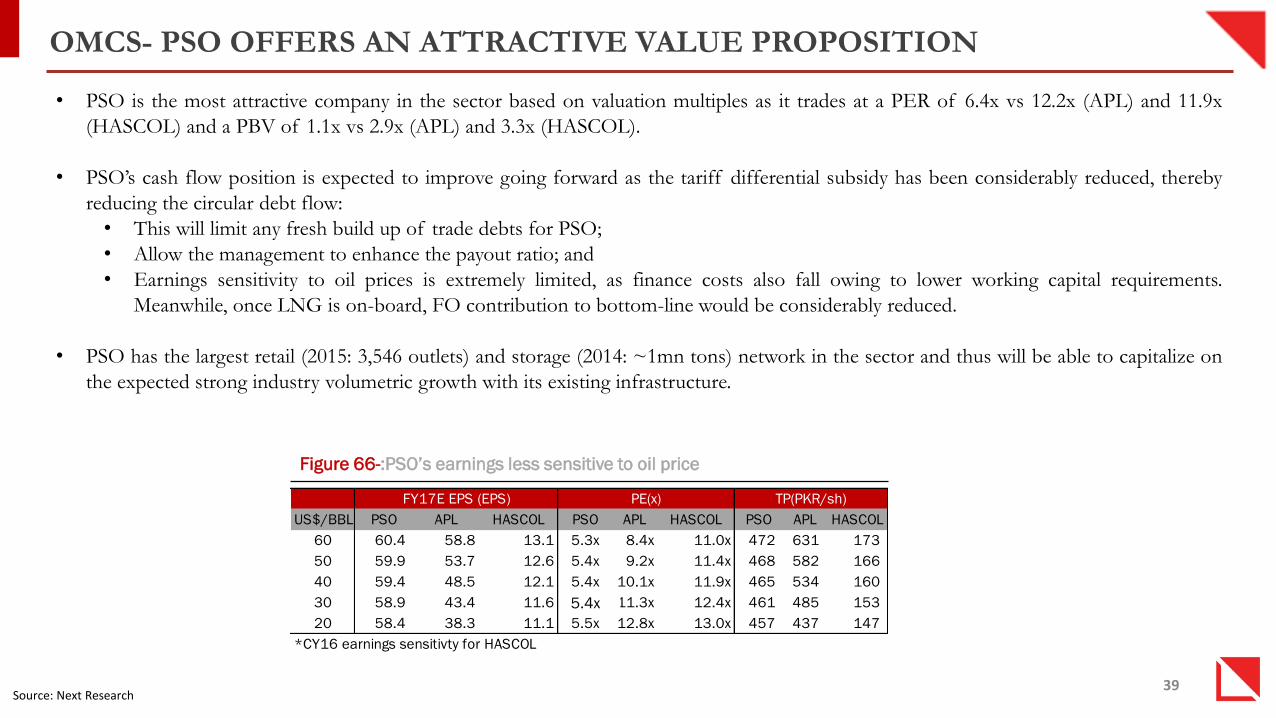
• PSO is the most attractive company in the sector based on valuation multiples as it trades at a PER of 6.4x vs 12.2x (APL) and 11.9x
(HASCOL) and a PBV of 1.1x vs 2.9x (APL) and 3.3x (HASCOL).
• PSO’s cash flow position is expected to improve going forward as the tariff differential subsidy has been considerably reduced, thereby
reducing the circular debt flow:
• This will limit any fresh build up of trade debts for PSO;
• Allow the management to enhance the payout ratio; and
• Earnings sensitivity to oil prices is extremely limited, as finance costs also fall owing to lower working capital requirements.
Meanwhile, once LNG is on-board, FO contribution to bottom-line would be considerably reduced.
• PSO has the largest retail (2015: 3,546 outlets) and storage (2014: ~1mn tons) network in the sector and thus will be able to capitalize on
the expected strong industry volumetric growth with its existing infrastructure.
OMCS- PSO OFFERS AN ATTRACTIVE VALUE PROPOSITION
US$/BBL PSO APL HASCOL PSO APL HASCOL PSO APL HASCOL
60 60.4 58.8 13.1 5.3x 8.4x 11.0x 472 631 173
50 59.9 53.7 12.6 5.4x 9.2x 11.4x 468 582 166
40 59.4 48.5 12.1 5.4x 10.1x 11.9x 465 534 160
30 58.9 43.4 11.6 5.6x 11.3x 12.4x 461 485 153
20 58.4 38.3 11.1 5.5x 12.8x 13.0x 457 437 147
*CY16 earnings sensitivty for HASCOL
FY17E EPS (EPS) PE(x) TP(PKR/sh)
Figure 66-:PSO’s earnings less sensitive to oil price
Source: Next Research
5.4x
40
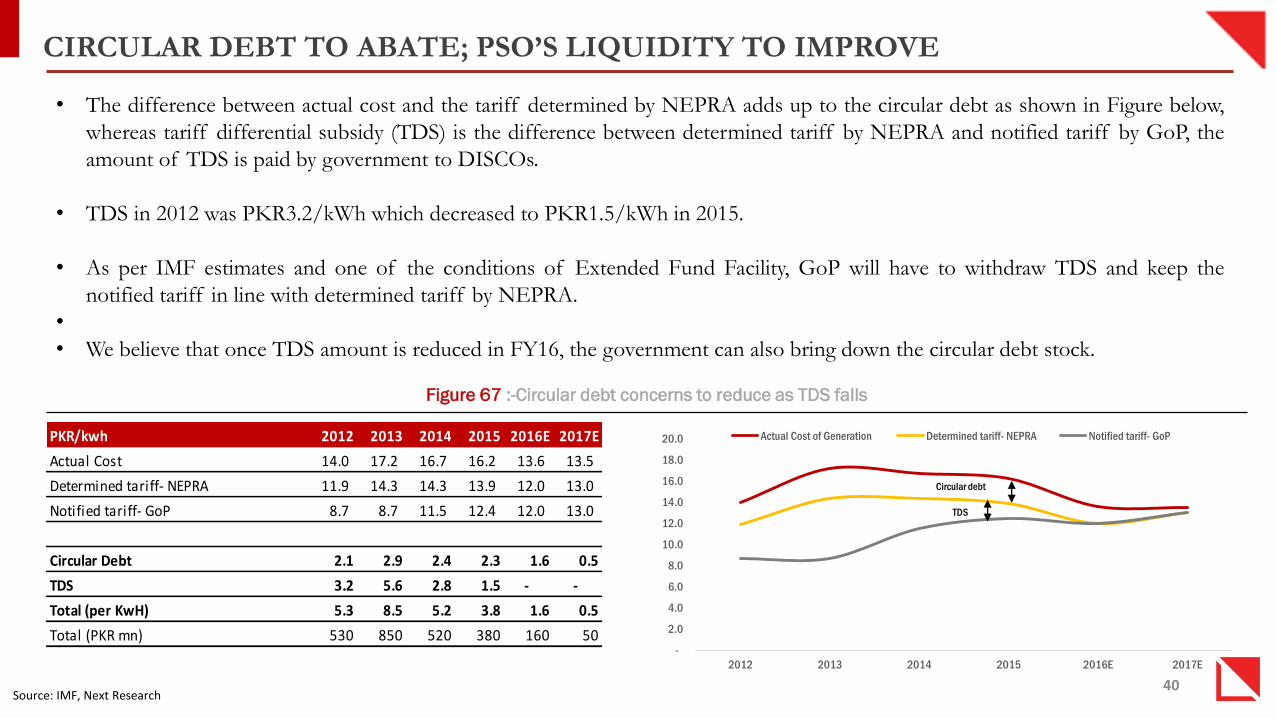
CIRCULAR DEBT TO ABATE; PSO’S LIQUIDITY TO IMPROVE
Source: IMF, Next Research
-
2.0
4.0
6.0
8.0
10.0
12.0
14.0
16.0
18.0
20.0
2012 2013 2014 2015 2016E 2017E
Actual Cost of Generation Determined tariff- NEPRA Notified tariff- GoP
Circular debt
TDS
PKR/kwh 2012 2013 2014 2015 2016E 2017E
Actual Cost 14.0 17.2 16.7 16.2 13.6 13.5
Determined tariff- NEPRA 11.9 14.3 14.3 13.9 12.0 13.0
Notified tariff- GoP 8.7 8.7 11.5 12.4 12.0 13.0
Circular Debt 2.1 2.9 2.4 2.3 1.6 0.5
TDS 3.2 5.6 2.8 1.5 - -
Total (per KwH) 5.3 8.5 5.2 3.8 1.6 0.5
Total (PKR mn) 530 850 520 380 160 50
• The difference between actual cost and the tariff determined by NEPRA adds up to the circular debt as shown in Figure below,
whereas tariff differential subsidy (TDS) is the difference between determined tariff by NEPRA and notified tariff by GoP, the
amount of TDS is paid by government to DISCOs.
• TDS in 2012 was PKR3.2/kWh which decreased to PKR1.5/kWh in 2015.
• As per IMF estimates and one of the conditions of Extended Fund Facility, GoP will have to withdraw TDS and keep the
notified tariff in line with determined tariff by NEPRA.
•
• We believe that once TDS amount is reduced in FY16, the government can also bring down the circular debt stock.
Figure 67 :-Circular debt concerns to reduce as TDS falls
41
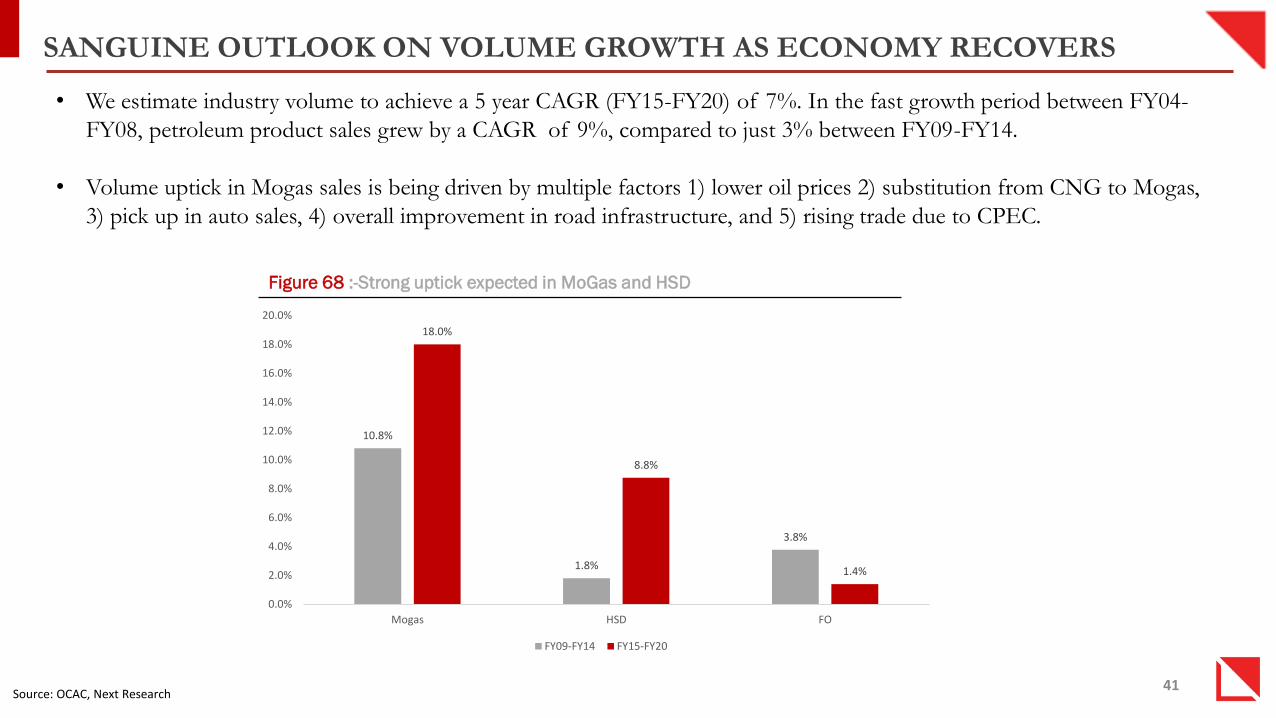
SANGUINE OUTLOOK ON VOLUME GROWTH AS ECONOMY RECOVERS
• We estimate industry volume to achieve a 5 year CAGR (FY15-FY20) of 7%. In the fast growth period between FY04-
FY08, petroleum product sales grew by a CAGR of 9%, compared to just 3% between FY09-FY14.
• Volume uptick in Mogas sales is being driven by multiple factors 1) lower oil prices 2) substitution from CNG to Mogas,
3) pick up in auto sales, 4) overall improvement in road infrastructure, and 5) rising trade due to CPEC.
Source: OCAC, Next Research
10.8%
1.8%
3.8%
18.0%
8.8%
1.4%
0.0%
2.0%
4.0%
6.0%
8.0%
10.0%
12.0%
14.0%
16.0%
18.0%
20.0%
Mogas HSD FO
FY09-FY14 FY15-FY20
Figure 68 :-Strong uptick expected in MoGas and HSD
FERTILIZER- CHALLENGES ON MULTIPLE FRONTS
-22%
1%8%
15%
25%
33% 34%
45%
58%
-30%
-20%
-10%
0%
10%
20%
30%
40%
50%
60%
70%
Ukra
ine
Ch
ina
Eu
rop
e
Ind
ia
SE
Asia
Pa
kis
tan
No
rth
Am
eri
ca
Ru
ssia
ME
NA
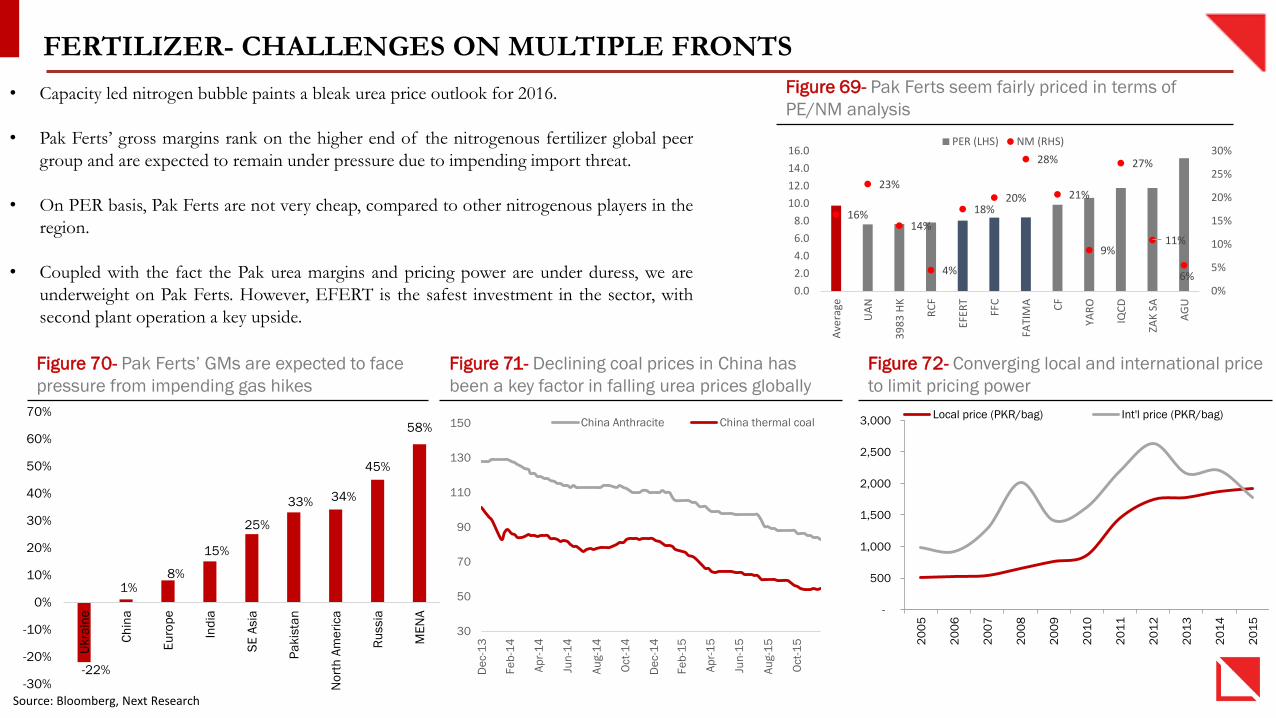
• Capacity led nitrogen bubble paints a bleak urea price outlook for 2016.
• Pak Ferts’ gross margins rank on the higher end of the nitrogenous fertilizer global peer
group and are expected to remain under pressure due to impending import threat.
• On PER basis, Pak Ferts are not very cheap, compared to other nitrogenous players in the
region.
• Coupled with the fact the Pak urea margins and pricing power are under duress, we are
underweight on Pak Ferts. However, EFERT is the safest investment in the sector, with
second plant operation a key upside.
Figure 70- Pak Ferts’ GMs are expected to face
pressure from impending gas hikes
Figure 71- Declining coal prices in China has
been a key factor in falling urea prices globally
Figure 72- Converging local and international price
to limit pricing power
-
500
1,000
1,500
2,000
2,500
3,000
20
05
20
06
20
07
20
08
20
09
20
10
20
11
20
12
20
13
20
14
20
15
Local price (PKR/bag) Int'l price (PKR/bag)
30
50
70
90
110
130
150
De
c-1
3
Fe
b-1
4
Ap
r-1
4
Jun
-14
Au
g-1
4
Oct-
14
De
c-1
4
Fe
b-1
5
Ap
r-1
5
Jun
-15
Au
g-1
5
Oct-
15
China Anthracite China thermal coal
16%
23%
14%
4%
18%20%
28%
21%
9%
27%
11%
6%0%
5%
10%
15%
20%
25%
30%
0.0
2.0
4.0
6.0
8.0
10.0
12.0
14.0
16.0
Ave
rage
UA
N
39
83
HK
RC
F
EFER
T
FFC
FATI
MA CF
YAR
O
IQC
D
ZAK
SA
AG
U
PER (LHS) NM (RHS)
Figure 69- Pak Ferts seem fairly priced in terms of
PE/NM analysis
Source: Bloomberg, Next Research
43
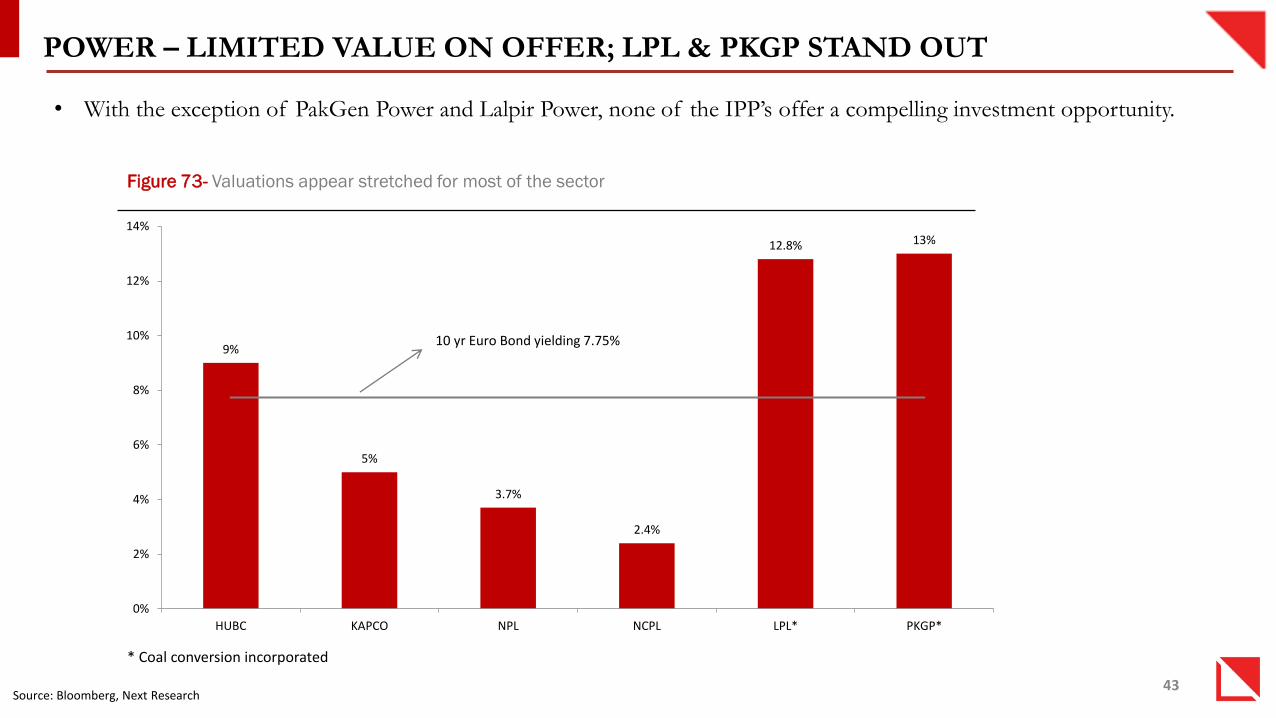
POWER – LIMITED VALUE ON OFFER; LPL & PKGP STAND OUT
Source: Bloomberg, Next Research
* Coal conversion incorporated
• With the exception of PakGen Power and Lalpir Power, none of the IPP’s offer a compelling investment opportunity.
9%
5%
3.7%
2.4%
12.8% 13%
0%
2%
4%
6%
8%
10%
12%
14%
HUBC KAPCO NPL NCPL LPL* PKGP*
10 yr Euro Bond yielding 7.75%
Figure 73- Valuations appear stretched for most of the sector
NEXT CAPITAL RESEARCH AND SALES TEAM
44
Research Team Sectors Contact Email
Farrukh Karim Khan, CFA Strategy +92-21-35295650 [email protected]
Ameet Doulat Fertilizer & Banks +92-21-35169519 [email protected]
Muhammad Ali Cement & Power +92-21-35169515 [email protected]
Sonia Agarwal E&Ps +92-111-639-825 Ext 109 [email protected]
Naseer uddin Khalid Fertilizer, Power & Steel +92-111-639-825 Ext 109 [email protected]
Nayhan Mohajir Automobile & OMC +92-21-35169518 [email protected]
Sohaib Subzwari Consumer & Textile +92-111-639-825 Ext 109 [email protected]
Owais Shahid Manager Database +92-21-35169516 [email protected]
Sales Team Contact Email
Karachi
Shoib Memon +92-21-35292640-41 [email protected]
Saad Iqbal +92-21-35292642 [email protected]
Syed Faheem Raza +92-21-35292644 [email protected]
Muhammad Shakeel +92-21-35293637 [email protected]
Saad Rafi +92-21-35169512 [email protected]
Abdul Basit +92-21-35169517 [email protected]
KSE Office
Muhammad Zubair Ellahi +92-21-32468865-66 [email protected]
Lahore
Zulqarnain Khan +92-321-4252200 [email protected]
Muhammad Yaqoob +92-301-4604045 [email protected]
Asim Aslam +92-322-4306868 [email protected]
Email: [email protected]
DISCLAIMER (1/2)
45
Analyst Certification: All of the views expressed in this report accurately reflect the personal views of the responsible analyst(s) about any and all of the subject securities or
issuers. No part of the compensation of the responsible analyst(s) named herein is, or will be, directly or indirectly, related to the specific recommendations or views expressed
by the responsible analyst(s) in this report.
Disclaimer
This information and opinion contained in this report have been complied by our research department from sources believed by it to be reliable and in good faith, but no
representation or warranty, express or implied, is made as to their accuracy, completeness or correctness. All opinions and estimates contained in the document constitute the
department’s judgment as of the date of this document and are subject to change without notice and are provided in good faith but without legal responsibility.
This report is not, and should not be construed as, an offer to sell or a solicitation of an offer to buy any securities. Next Capital Limited (the company) or persons connected
with it may from time to time have an investment banking or other relationship, including but not limited to, the participation or investment in commercial banking
transactions (including loans) with some or all of the issuers mentioned therein, either for their own account or the ac- count of their customers. Persons connected with the
company may provide or have provided corporate finance and other services to the issuer of the securities mentioned herein, including the issuance of options on securities
mentioned herein or any related investment and may make a purchase and/or sale, or offer to make a purchase and/or sale of the securities or any related investment from
time to time in the open market or otherwise, in each case either as principal or agent.
This report may contain forward looking statements which are often but not always identified by the use of words such as “anticipate”, “believe”, “estimate”, “intend”, “plan”,
“expect”, “forecast”, “predict” and “project” and statements that an event or result “may”, “will”, “can”, “should”, “could” or “might” occur or be achieved and other
similar expressions. Such forward looking statements are based on assumptions made and information currently available to us and are subject to certain risks and uncertainties
that could cause the actual results to differ materially from those expressed in any forward looking statements. Readers are cautioned not to place undue relevance on these
forward looking statements. NCEL expressly disclaims any obligation to update or revise any such forward looking statements to reflect new information, events or
circumstances after the date of this publication or to reflect the occurrence of unanticipated events.
Exchange rate fluctuations may affect the return to investors. Neither the company or any of its affiliates, nor any other person, accepts any liability whatsoever for any direct
or consequential loss arising from any use of this report or the information contained therein.
Next Capital Limited, its respective affiliate companies, associates, directors and/or employees may have investments in securities or derivatives of securities of companies
mentioned in this report, and may make investment decisions that are inconsistent with the views expressed in this report.

DISCLAIMER (2/2)
46
Rating System
Next Capital Limited employs a three tier rating system depending upon sector’s proposed weight in the portfolio as compared to sectors weight in KSE-100 index, as follows:
Ratings are updated regularly based on the latest developments in the economy/sector/company, changes in stock prices, and changes in analyst’s assumptions.
Next Capital Limited employs a three tier rating system, depending upon expected total return (R) of the stock, as follows:
Where;
•R = Expected Dividend Yield + Expected Capital Gain
•‘R’ is before tax
•Investment horizon is between six months to twelve months
Ratings are updated regularly based on the latest developments in the economy/sector/company, changes in stock prices, and changes in analyst’s assumptions.
Valuation Methodology
The Research Analyst(s) has used DDM methodology to arrive at Target Price for Power Companies, Justified P/B methodology to arrive at Target Price for Banks and DCF
methodology to arrive at Target Price for all other sectors.
Key Risks
Currency devaluation. Commodity price fluctuation. Interest rate fluctuations. Increase in gas prices. Delay in projects (new/expansions/efficiency)
Unfavorable outcome on GIDC imposition on fertilizer plants having fixed price contracts
Slower than expected private sector credit growth.
Deteriorating receivable position (Circular debt). Unfavorable law & order situation. Heavy dependence on few fields.
Decline in cement prices, greater than expected increase in coal prices, delay in expected projects (expansion, efficiency projects)
Increase in scrap prices, increase in oil prices, reduction in import duty leading to cheaper imports, greater than expected increase in electricity tariff.
WAPDA’s inability to pay dues, oil price reversal to take away efficiency gains for inefficient IPP’s (LPL and PKGP).
GoP’s inability to implement IMF polices of arrears reduction plan in the power sector. Decline in auto sales
New auto policy. Increase in imported cars
Rating Sector’s proposed weight in the portfolio
Over Weight > Weight in KSE 100 index
Market Weight = Weight in KSE 100 Index
Under Weight < Weight in KSE 100 Index
Rating Expected Total Return
Buy R ≥ 15%
Neutral 0% ≥ R < 15%
Sell R < 0%