Embed Size (px)
Citation preview

ARTICLE IN PRESS
1071-5819/$ - se
doi:10.1016/j.ijh
�CorrespondE-mail addr
Int. J. Human-Computer Studies 65 (2007) 992–1009
www.elsevier.com/locate/ijhcs
Debugging strategies and tactics in a multi-representationsoftware environment
Pablo Romero�, Benedict du Boulay, Richard Cox, Rudi Lutz, Sallyann Bryant
Department of Informatics, Sussex University, UK
Received 28 November 2005; received in revised form 25 January 2007; accepted 19 July 2007
Communicated by J. Domingue
Available online 6 August 2007
Abstract
This paper investigates the interplay between high level debugging strategies and low level tactics in the context of a multi-
representation software development environment (SDE). It investigates three questions. 1. How do programmers integrate debugging
strategies and tactics when working with SDEs? 2. What is the relationship between verbal ability, level of graphical literacy and
debugging (task) performance. 3. How do modality and perspective influence debugging strategy and deployment of tactics? The paper
extends the work of Katz and Anderson [1988. Debugging: an analysis of bug location strategies. Human-Computer Interaction 3,
359–399] and others in terms of identifying high level debugging strategies, in this case when working with SDEs. It also describes how
programmers of different backgrounds and degrees of experience make differential use of the multiple sources of information typically
available in a software debugging environment. Individual difference measures considered among the participants were their
programming experience and their knowledge of external representation formalisms. The debugging environment enabled the
participants, computer science students, to view the execution of a program in steps and provided them with concurrently displayed,
adjacent, multiple and linked programming representations. These representations comprised the program code, two visualisations of the
program and its output. The two visualisations of the program were available, in either a largely textual format or a largely graphical
format so as to track interactions between experience and low level mode-specific tactics, for example.
The results suggest that (i) additionally to deploying debugging strategies similar to those reported in the literature, participants also
employed a strategy specific to SDEs, following execution, (ii) verbal ability was not correlated with debugging performance,
(iii) knowledge of external representation formalisms was as important as programming experience to succeed in the debugging task, and
(iv) participants with greater experience of both programming and external representation formalisms, unlike the less experienced, were
able to modify their debugging strategies and tactics effectively when working under different format conditions (i.e. when working with
either largely graphical or largely textual visualisations) in order to maintain their high debugging accuracy level.
r 2007 Elsevier Ltd. All rights reserved.
Keywords: Multiple external representations; Graphical reasoning; Program debugging
1. Introduction
Much computer programming is performed via the useof software development environments (SDEs) whichprovide a variety of external representations and othersophisticated functionality. These representations andfunctionality enable programmers to treat programs notjust as code text, but also as a range of abstract entities
e front matter r 2007 Elsevier Ltd. All rights reserved.
cs.2007.07.005
ing author.
ess: [email protected] (P. Romero).
which can be visualised according to different criteria orexecuted under a variety of conditions.This means that the kinds of high level debugging
strategy identified by Katz and Anderson (1988) will nowbe interwoven with low level tactics associated withchoosing which representations and functionality to exploitas well as being extended at the high level by possibilitiesopened up by the new functionality.These representations help the programmer to visualise the
program through different perspectives or information types.For example, some perspectives highlight the transformations

ARTICLE IN PRESSP. Romero et al. / Int. J. Human-Computer Studies 65 (2007) 992–1009 993
which data elements undergo as they are processed, whileothers show the sequence of actions that will occur whenthe program is executed. Visualisations can be presented informats that range from mostly textual to mostly graphical(Romero et al., 2003). Very frequently a number of thesevisualisations contain links to one another and are displayedconcurrently and side by side.
In terms of debugging strategies and tactics, the stepfacility is one of the most helpful pieces of functionality ofsuch environments. This facility allows programmers toexecute and pause the program at different points. At thesepoints they can inspect the visualisations provided to obtaininformation about various aspects of the execution state.
Such program visualisation and debugging facilitiesshould, in principle, be especially helpful for noviceprogrammers because they have the potential to enablethem see the program not as a black box but as an abstractmachine containing a set of elements that moves betweenstates. However, their effective use requires strategic knowl-edge about how to generate and test debugging hypothesesfrom the evidence in the program’s output and visualisa-tions, knowledge about how to decode and coordinate theavailable representations as well as skill in operating theSDE itself. It is often assumed that novices possess thisknowledge and these skills. Thus, novice programmers canface a double challenge. As well as trying to learn abstractconcepts about programming, they have to master thedecoding, representation coordination and step-and-traceskills required to use debugging environments.
This paper characterises the debugging strategies andtactics of Java programmers in terms of step-and-tracechoices and representation usage in a multi-representationdebugging environment, relating these aspects of theirbehaviour to debugging accuracy, experience and knowl-edge of external representation (KER) formalisms.Section 2 explores research on programming strategyfocusing on the way programmers manipulate the toolsand representations available. Section 3 describes theexperimental design and method. Section 4 presents theresults of this experiment and Section 5 discusses theseresults. Finally, Section 6 presents conclusions anddescribes further work.
2. External representation usage in programming
Good performance in programming tasks is as muchdependent on the strategies and tactics chosen to accom-plish programming tasks as it is on the programmers’knowledge about the syntax and semantics of theprogramming language (Gilmore, 1990). In programdebugging, strategy is usually related to the high level,systematic plan to identify program errors while tacticshave to do with lower-level actions performed to, forexample, coordinate and integrate multiple sources ofinformation when using an SDE. According to Katz andAnderson (1988), bug finding strategies can be classifiedbroadly into forward reasoning and backward reasoning.
The first category comprises those strategies in whichprogrammers start searching for bugs from the programcode, while the second involves starting from the incorrectbehaviour of the program (typically its output) andreasoning backwards to the origin of the problem in thecode. Examples of forward reasoning include comprehen-
sion, where bugs are found while the programmer isbuilding a mental representation of the program and hand
simulation, where programmers evaluate the code as if theywere the computer. Backward reasoning includes strategiessuch as simple mapping and causal reasoning. In simplemapping the program’s output points directly to theincorrect line of code, while in causal reasoning the searchstarts from the incorrect output going backwards towardsthe code segment that caused the bug.Related but lower-level tactics have to do with the
coordination of the available representations and theoperation the SDE itself (mainly of its step-and-tracefacility). These tactical aspects are particularly importantfor novice programmers. An inability to cope with thesedemands, frequently due to cognitive overload (vanBruggen et al., 2002), means that multiple sources ofinformation, instead of improving performance and learn-ing, can sometimes impede them (Bodemer et al., 2004).The step-and-trace facility of the SDE is particularly
important as it can transform a continuous animation ofthe program behaviour into a sequence of discrete steps.Animations are ephemeral and sometimes too quick to beaccurately perceived; however, judicious use of interactivitycan help to avoid these difficulties (Tversky and Morrison,2002).When working with SDEs, high level debugging
strategies need to be supported by the low level tacticsused to coordinate the available representations and tooperate the SDE itself. Although there have been studiesthat have looked at debugging strategies (Katz andAnderson, 1988; Mulholland, 1997; Prabhakararao et al.,2003; Chintakovid et al., 2006; Grigoreanu et al., 2006) andtactics (Romero et al., 2002a, b; Bednarik and Tukiainen,2004), it is not clear how programmers integrate them.
2.1. Factors affecting strategy and tactics
When using a SDE to debug a program, there are anumber of factors that can influence the quality of thestrategy and tactics deployed. Some of these are program-ming experience (PE), the form and nature of thevisualisations employed and individual differences asso-ciated with representational format.Research on code generation has highlighted the reliance
of experienced programmers upon external aids and thestrategic knowledge required to make use of them. Davies(1993a), for example, has shown that experienced pro-grammers, unlike novices, are strongly affected by restric-tions in their normal working environment because theyare forced to use their working memory to hold informa-tion that otherwise would be stored and accessed through
ARTICLE IN PRESSP. Romero et al. / Int. J. Human-Computer Studies 65 (2007) 992–1009994
the environment. Generally speaking, some forms ofstrategy can be explained in terms of the properties of theknowledge that programmers develop through experience,and this experience and associated strategies are related toimproved performance (Davies, 1993b).
The form of the available visualisations can be animportant factor in multi-representational environments.Here a common distinction is between propositional anddiagrammatic representations. Research in this area hasfocused on the advantages and disadvantages of mixingmodalities in multi-representational environments. Accord-ing to Ainsworth et al. (1996), in general, the more differentthe degree of graphicality external representations exhibit,the more difficult it is for students to coordinate them. Onthe other hand, it might be that graphical representations,by constraining the interpretation of textual ones becauseof their weak expressiveness (Stenning and Oberlander,1995), could promote improved understanding. Addition-ally, it is not clear how modality influences task strategy.
While modality is concerned with form, perspective isconcerned with content. Perspective refers to the program-ming information types that a representation highlights.Computer programs are information structures thatcomprise different types of information (Pennington,1987), and programming notations usually highlight someof these aspects at the cost of obscuring others (thematch–mismatch hypothesis Gilmore and Green, 1984).Some of these different information types are: function,data structure, operations, data-flow and control-flow.Program visualisations usually highlight some of theseinformation types and knowing, for example, whichvisualisation to use for which kind of error is part of theprogrammer’s strategic knowledge.
In the context of debugging with SDEs, individualdifferences associated with representational format prefer-ence are potentially important. People differ in terms of theirpreferences for particular forms of representation, their skillat decoding them, and educational background among otherfactors. As mentioned above, a typical distinction inrepresentational format is usually between propositionaland diagrammatic representations and a number of studieshave focused on comparing verbal and diagrammatic ability.Individual differences in external representation use havebeen studied extensively in various domains: logic reasoning(Oberlander et al., 1999), mechanical systems (Kriz andHegarty, 2004) and HCI (Campagnoni and Ehrlich, 1989),among others. Recently, the amount of background knowl-edge that people have of external representation formalisms,or ‘graphical literacy’, has been proposed as an importanttype of individual difference (Cox, 1996), and one that mighthave particular relevance for computer programming(Cox et al., 2004). Although there seem to be advantagesin having a high level of graphical literacy (Cox, 1999), it isnot clear how this relates to task performance.
Although there has been some research into thestrategies employed to understand and debug programswhen working with computerised environments, this
research has focused mainly on debugging performance(Mulholland, 1997; Patel et al., 1997) or has relied onindirect accounts of the behaviour exhibited, for examplethrough questionnaires and post hoc interviews (Storeyet al., 2000). There is a need for studies that present a moredirect account of how people go about debugging usingcomputerised environments. Some important questions toaddress with such studies are:
1.
How do programmers integrate debugging strategiesand tactics when working with SDEs?2.
What is the relationship between verbal ability, level ofgraphical literacy and debugging (task) performance.3.
How do modality and perspective influence debuggingstrategy and deployment of tactics (an important aspectof which is visual attention allocation in the SDE)?The following sections describe an empirical study thataddresses these questions.
3. Method
3.1. Aims
This study had three main aims, each aligned with one ofthe questions detailed above.Regarding question 1, we aimed to investigate the
relationship between the debugging strategies employedand the programmers’ tactical use of the representationsand facilities made available in the SDE. This was adetailed, qualitative analysis of the fine-grained events thattook place in the recorded debugging sessions. We expectedthe deployed tactics to support programmer’s debuggingstrategies and these tactics and strategies to be similar tothose reported in the literature (Katz and Anderson, 1988;Mulholland, 1997; Romero et al., 2002b; Prabhakararaoet al., 2003; Bednarik and Tukiainen, 2004).Relating to question 2, our aim was to identify the key
relationships between graphical literacy, verbal ability anddebugging performance. This was a quantitative analysisthat looked for correlations between these individualdifference measures. Based on related previous studies(Grawemeyer and Cox, 2003, 2004), we expected graphicalliteracy and debugging accuracy to be positively correlated.Finally, with reference to question 3, we aimed to
investigate the relationship between experience, modality,perspective and debugging strategy and tactics. This was aquantitative analysis on the data logged during the debug-ging sessions. According to previous studies (Romero et al.,2002a, b) we expected the choice of strategy and the tacticsdeployed to be associated with PE, KERs and modality.
3.2. Design
The study was divided into three aspects, each related tothe questions detailed at the end of Section 2. A description
ARTICLE IN PRESSP. Romero et al. / Int. J. Human-Computer Studies 65 (2007) 992–1009 995
of the design of each of the three aspects of the studyfollows.
In order to address question 1, a detailed qualitativeanalysis of the events in the debugging sessions wasperformed. The events considered were participants verba-lisations, the focus of their visual attention and theirinteraction with the SDE.
In order to address question 2, the study investigated therelationship between debugging accuracy and severalindividual difference measures: Object-Oriented and pro-cedural programming experience (PPE), verbal ability andKERs. The analysis of this part of the study computed thecorrelations between these performance and individualdifference measures.
Regarding question 3, the investigation into the relation-ship between experience, modality, perspective and debug-ging strategy and tactics, considered four independentvariables (two between subjects and two within subjects)and five dependent variables. The independent betweensubjects variables were PPE and KER formalisms. Theindependent within subjects variables were type of error(data structure or control-flow) and modality (graphical ortextual visualisations). The five dependent variables weredebugging accuracy, inspection time for the availablerepresentations, switching frequency between these, inspec-tion time at the different points of the program execution(breakpoints) and switching frequency between these.Inspection time for the available representations refers tothe time participants spent focusing on each window of theSDE. Switching frequency between the available represen-tations refers to the number of changes of focus betweenthe SDE windows. Inspection time at the different break-points refers to the time participants spent focusing on eachone of the breakpoints at which they chose to view theexecution of the program. Finally, switching frequencybetween these breakpoints is the number of timesparticipants changed from one breakpoint to another.
3.3. The experimental debugging environment
The SDE enabled participants to view the pre-computedexecution of a Java program and presented, in addition tothe code, its output and two visualisations of its execution.Participants were able to view the execution of the programby stepping between predefined breakpoints for a specificsample input. The SDE did not provide students with toolsto edit, compile or re-execute the program with differentinput values or to reset breakpoints to other places in thecode. The motivation to limit the functionality of the toolin this way was to ensure, as much as possible, that allparticipants saw the same information and to reduce thecomplexity of operating the debugging environment.
Participants were able to see the program code, itsoutput for a sample execution, and two visualisations ofthis execution. A screen shot of the system is shown inFig. 1. Participants were able to see the program class filesin the code window, one at a time, through the use of the
side-tabs. The objects and call sequence windows presentedvisualisations of the program’s execution similar to thosefound in Object-Oriented SDEs (Romero et al., 2003). Theobjects window (top right) presented data structure aspectswhile the call sequence window (bottom middle) showedcontrol-flow information.The SDE is a modified version of the restricted focus
viewer (RFV), a visual attention tracking softwareenvironment (Blackwell et al., 2000). The SDE presentsimage stimuli in a blurred form. When the user clicks on animage, a section of it around the mouse pointer becomesfocused. In this way, the program restricts how much of astimulus can be seen clearly and thus indirectly allowsvisual attention to be tracked as the user moves anunblurred area around the screen. Use of the SDE enabledmoment-by-moment representation switching betweendifferent program breakpoints and between concurrentlydisplayed, adjacent representations to be captured for lateranalysis. The system was also able to digitally record audioand to replay sessions, showing what participants did aswell as what they said. In this way, the SDE can allow bothquantitative and qualitative analyses of the recorded data.The user-computer interaction data (window and break-point fixation time and switching) can be analysed in aquantitative way (for example, writing programs to processthe logged data) to compare switching and fixationbehaviour among the different experimental conditions.Observing replays of experimental sessions, on the otherhand, can be used to interpret intentions and behaviours ofparticipants. The main difference between this environmentand the one employed in our previous studies (Romero etal., 2002a, b) is its capability to show the execution of theprogram in steps. A previous version of the environmentpresented users with visualisations comprising several staticscreen snapshots of the program execution. Employing anenvironment with dynamic visualisations enabled us tostudy not only representation usage but also howparticipants employed the step-and-trace facilities pro-vided. More details about the system and methodologyemployed can be found in Romero et al. (2007).Previous studies (Romero et al., 2002a, b) suggested that
the restricted focus technology works best for programcomprehension and debugging purposes if the unblurredarea is of a size appropriate to cover entire representationunits. In the case of the code, for example, these units canbe equated to methods. The objects window represents anextreme case because the representation unit is the mainobject and therefore the unblurred spot covers the wholewindow.Studies that have validated the use of this technology
have found that it does not modify task performancesignificantly (Romero et al., 2002a; Jansen et al., 2003).Studies that have compared visual attention behaviourusing this technology and employing eye-tracking equip-ment have, however, found differences in these twoconditions (Bednarik and Tukiainen, 2004). The centralissue concerns the validity of eye-tracking as unequivocal

ARTICLE IN PRESS
Fig. 1. The debugging environment used by participants.
P. Romero et al. / Int. J. Human-Computer Studies 65 (2007) 992–1009996
measure of visual attention. One issue is that the twotechniques work at different degrees of granularity, witheye-tracking capturing many more fleeting changes of gazedirection. Researchers have tended to interpret measure-ment differences between the two techniques as reflectingthe superiority of eye tracking methods. However, recentevidence from the visual attention, change blindness andattention design literatures (Wood et al., 2006) raises somequestions in relation to this assumption.
3.4. Participants and procedure
The experimental participants were 42 computer scienceundergraduate students from the School of Cognitive andComputing Sciences at Sussex University, UK. All hadtaken a three month introductory course in Java. Some ofthem had previous PE, in most cases a few extra months ofacademic PE.
Participants performed a verbal ability test, an externalrepresentation (‘graphical literacy’) decision task (Coxet al., 2004), a program modification exercise, a programcomprehension activity and six debugging sessions. Theexperiment was divided into two sessions of about 1 h eachwhich took place on different days. The verbal ability testwas based on items from a commercial book of GREpractice examples (Brownstein et al., 1990; Cox et al.,1995). The items have a multiple-choice response formatand are designed to measure the respondent’s ability to, for
example, compare several passages in terms of thesimilarity of their arguments, make valid inferences fromnarratively presented information passages, assess therelative strengths of arguments, judge whether alternativepassages strengthen or weaken particular arguments andidentify the assumptions underlying arguments.The external representation decision task was a visual
recognition activity requiring decisions as to whether adiagram was real or fake. A sequence of well-formed (real)and chimeric (fake) diagrams was presented to participantsand they had to decide whether each one of these was realor fake (Cox et al., 2004). Some of these diagrams areshown in Figs. 2 and 3.The program modification and comprehension tasks
were intended to familiarise participants with the programthey were going to debug and with the program visualisa-tions that were going to be presented to them in the objectsand call sequence windows. In the program modificationtask participants had to perform a simple modification tothe program while in the program comprehension exerciseparticipants had to answer a series of true/false questionsabout this same program and its associated visualisations.Following the familiarisation tasks participants pro-
ceeded to the debugging part of the experiment.
3.4.1. The debugging part of the experiment
In the six debugging sessions participants worked withbuggy versions of the same program. Each version was

ARTICLE IN PRESS
Fig. 2. Examples of fake diagrams.
Fig. 3. Examples of real diagrams.
P. Romero et al. / Int. J. Human-Computer Studies 65 (2007) 992–1009 997
seeded with one error and was also modified at a superficiallevel (variable and method names changed) to control forspotting errors by relying on memory alone.
The first debugging session was a warm-up exercise. Thefive main debugging sessions followed. One of these fivesessions was used as a control and showed empty windowsfor the objects and call sequence visualisations in order toinvestigate how far the visualisations that would otherwisehave been present in these windows were helpful toparticipants. The order of presentation of the fourexperimental sessions with ‘normal’ SDE as well as thesingle ‘empty visualisations’ control condition was rando-mised, as well as the choice of which buggy programversion to use in the warm-up session.
Each debugging session consisted of two phases. In thefirst phase participants were presented with samples ofprogram output, both desired and actual. When partici-pants were clear about the difference between these twosample outputs they moved on to the second phase of thesession.In the second phase participants worked with the SDE.
They were allowed up to 10min to debug each program.Following Ericsson and Simon (1984)’s recommendations,participants were instructed to think aloud throughout thesession.The target program simulated the behaviour of a drink
dispensing machine and was of medium size and complex-ity. This program loads the drink machine with cans of
ARTICLE IN PRESS
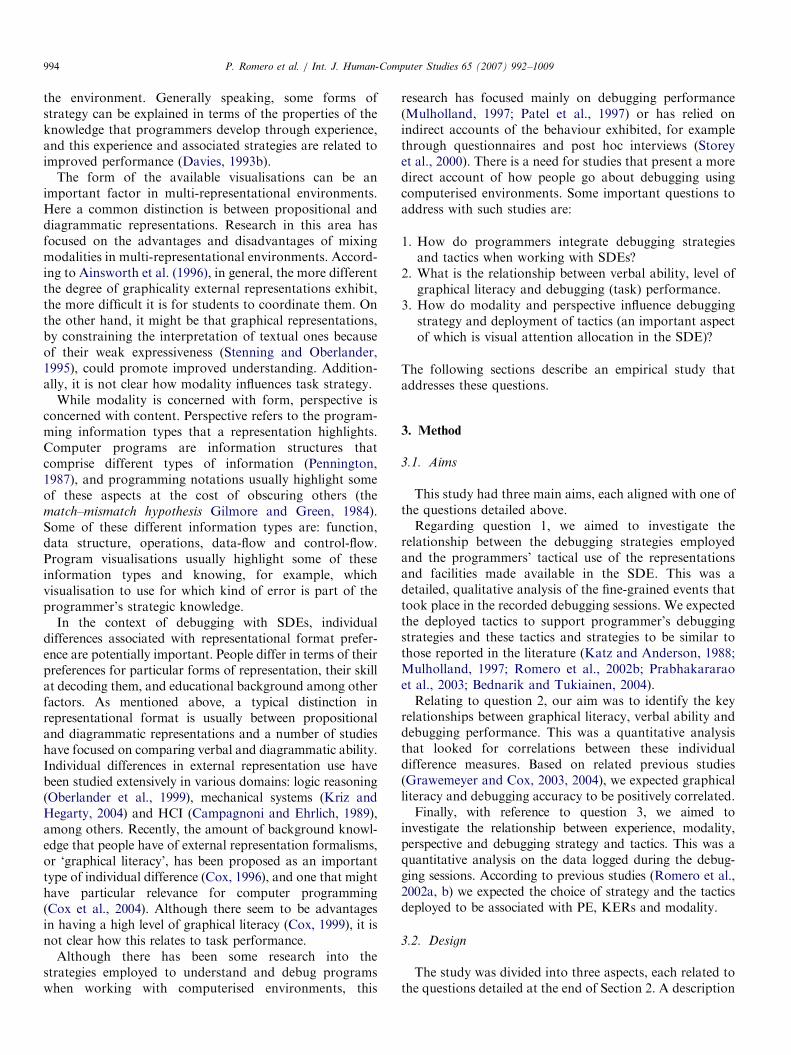
Fig. 4. Segment of the program code for the Fridge class.
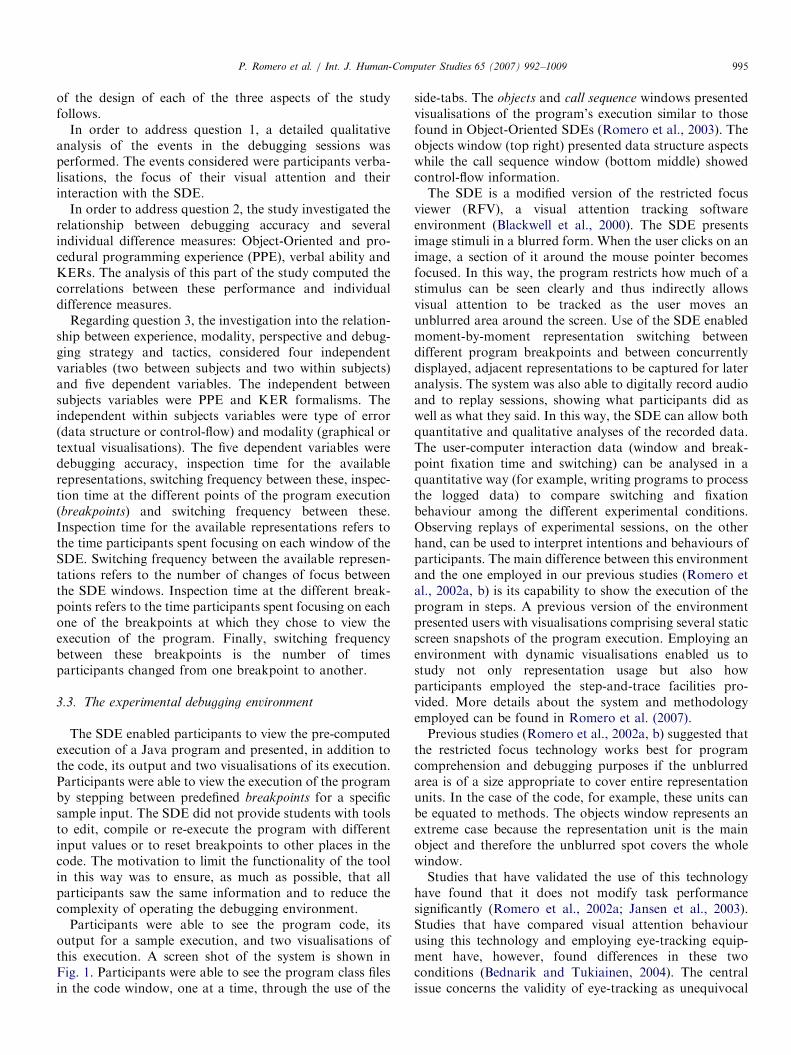
Fig. 5. Output from a sample execution session of the DrinkMachine
program.
P. Romero et al. / Int. J. Human-Computer Studies 65 (2007) 992–1009998
different drink types and also dispenses drinks afterallowing the user to enter strings representing coins. Theprogram is 201 lines long and comprises six classes linkedby inheritance and composition relations. A typicalexecution of this program would create about 12 differentobjects, some of which are array data structures.
Some of the code, output for a sample execution sessionand objects visualisations for textual and graphicalconditions for one of the buggy versions are shown inFigs. 4–7, respectively.
Each version of the program was seeded with one error.This error was either data structure or control-flow related.The data structure errors were most easily seen in theobjects view window, while the control-flow ones weremost salient in the call sequence visualisation.
There were four predefined breakpoint lines in the codeand different execution paths of the program generateddifferent numbers of debugging steps or pauses. Theaverage number of debugging steps for all the programversions was 5.5 (they ranged from 4 to 7). Thesepredefined breakpoints were chosen because they werepoints in the execution where the arrays of the DrinkMa-
chine object (the main data structure of the program) wereupdated.The audio recordings of the debugging sessions were
transcribed and analysed to score debugging accuracy. Thescore for each error was calculated on the basis of whetherstudents reported the location, description and proposedfix of the error correctly. A score of one was assigned foreach one of these aspects if it was correctly reported andzero otherwise, thus giving each session a score betweenzero and three for debugging accuracy.
4. Results
This section describes the experimental results and isdivided into sub-sections: (i) debugging accuracy and itsrelation to individual difference measures; (ii) the resultsrelated to debugging tactics (debugging behaviour in termsof representation usage and controlling the execution of theprogram) and (iii) a detailed analysis (combining qualita-tive and quantitative methods) of debugging strategydeployment and its relationship to tactics.

ARTICLE IN PRESS
Fig. 6. Textual objects view of the DrinkMachine program.
piles[0]
type: coken_elements: 7
piles[3]
type: 50pn_elements: 1value: 0.5
piles[2]
type: 20pn_elements: 2value: 0.2
piles[1]
type: 10pn_elements: 1value: 0.1
piles[0]
type: 5pn_elements: 2value: 0.05
My DrinkMachine
fridge
n_piles: 1
piles:
till
n_piles: 4
piles:
Fig. 7. Graphical objects view of the DrinkMachine program.
P. Romero et al. / Int. J. Human-Computer Studies 65 (2007) 992–1009 999
4.1. Debugging accuracy and individual difference measures
This section reports on the results of three analyses, thefirst relating individual difference measures to debuggingaccuracy, the second comparing the normal and emptyvisualisations conditions and the third relating accuracy tothe experimental factors considered. The second andthird analyses were performed separately as some ofthe experimental factors (representation modality, forexample) were not relevant in the empty visualisationscondition.
4.1.1. Individual differences
Table 1 presents a summary of the results that relateindividual difference measures to debugging accuracy.Debugging accuracy was positively correlated with bothexperience in procedural programming languages(C, Pascal, Basic, etc.) (s ¼ :36, po:05) and with theexternal representation decision test score (s ¼ :32, po:05).There were no significant correlations between these pre-test scores and any of the other individual differencemeasures.The results of this analysis suggest that improved
debugging performance was associated with PE in proce-dural languages and with knowledge about externalrepresentation formalisms but not with Object-OrientedPE and verbal ability. The lack of association betweendebugging performance and Object-Oriented PE mightseem counter-intuitive at first. However, if we consider thatparticipants were novice Java programmers, with some ofthem having additional academic PE, mostly in proceduralprogramming languages, then it makes sense that this extraPPE could have made the difference when solving adebugging problem. The analyses reported in the followingsections consider these two factors, PPE and KERformalisms as independent, between subject variables.The 42 participants were divided (post hoc) by a mediansplit on the basis of their scores for these two factors intohigh and low groups. There were 21 participants in eachone of these groups and 10 or 11 in their intersection (10 inlow PPE–low KER, 11 in low PPE–high KER, 11 in highPPE–low KER and 10 in high PPE–high KER).
4.1.2. Normal and empty visualisations conditions
comparison
The results of the experiment comparing debuggingperformance for the normal and empty visualisationsconditions are illustrated in Fig. 8. A repeated measuresANOVA with two between subjects variables (PPE andKER), one within subjects (visualisation) and one depen-dent variable (accuracy performance) was run. There weremain effects for the visualisation condition ðF ð1; 38Þ ¼18:4; po:01Þ only and no interaction effects. This resultsuggests that the visualisations were indeed helpful tostudents, they obtained better debugging scores with themregardless of their PE and their KERs. The rest of theanalyses will consider sessions in the normal condition only

ARTICLE IN PRESS
Table 1
Correlations between pre-tests scores and debugging performance
OO Progr. exp. Proc. progr. exp. Verbal ability ER knowledge Deb. accuracy
OO programming experience Pearson correlation 1 �.035 .224 �.131 �.112
Sig. (2-tailed) . .824 .154 .407 .481
Procedural programming experience Pearson correlation – 1 �.049 .068 .358*
Sig. (2-tailed) – . .760 .670 .020
Verbal ability Pearson correlation – – 1 .248 .167
Sig. (2-tailed) – – . .113 .290
ER knowledge Pearson correlation – – – 1 .321*
Sig. (2-tailed) – – – . .038
Debugging accuracy Pearson correlation – – – – 1
* indicates significance at the .05 level.
Fig. 8. Debugging performance for normal and empty visualisations
conditions.
Fig. 9. Debugging performance by PPE and KER.
P. Romero et al. / Int. J. Human-Computer Studies 65 (2007) 992–10091000
(those in which students had available visualisations in thedebugging environment).
4.1.3. Debugging performance and the experimental factors
The results of the experiment relating debuggingperformance to the experimental factors considered areillustrated in Fig. 9. A repeated measures ANOVA withtwo between subjects variables (PPE and KER), two withinsubjects (representation modality and error type) and onedependent variable (accuracy performance) was run. Therewere no significant main effects but a significant interactioneffect for PPE and KER ðF ð1; 38Þ ¼ 5:25; po:05Þ. Posthoc comparisons revealed a significant effect whencomparing the group of high PPE and high KER withthe rest of the participants ðtð40Þ ¼ �2:8; po:01Þ. Thisresult suggests that superior debugging performance was
associated with a high level of both PE and externalrepresentations knowledge. These two factors makeseparate contributions to debugging performance as theydo not correlate to each other (see Table 1).This part of the analysis revealed that visualisations were
helpful and that debugging accuracy was positivelycorrelated to individual difference measures such as PEand graphical literacy. It makes sense that if visualisationscan indeed be helpful, knowledge about representationformalisms is key to take advantage of them.
4.2. Debugging tactics
This part of the analysis focuses on debugging behaviourin terms of representation usage and the way participantscontrolled the view of the program execution. Thefollowing subsections describe these two analyses.
4.2.1. Representation usage
The experimental variables considered in this analysisrelate to the way visual attention was allocated during thedebugging process. In particular, this analysis takes intoaccount switches of visual attention between the differentSDE windows and time spent inspecting each one of thesewindows. Thus, this part of the analysis relates switching

ARTICLE IN PRESS
Fig. 10. Window switching frequency by type of switch.
Fig. 11. Window switching frequency by KER.
Fig. 12. Window switching frequency by PPE and KER.
Fig. 13. Window switching frequency by type of error and switch.
P. Romero et al. / Int. J. Human-Computer Studies 65 (2007) 992–1009 1001
frequency, accumulated fixation time and average fixationtime for the available representations to the experimentalfactors (visualisation modality, type of error, PPE andKER). Three separate ANOVAs were computed; one forswitching frequency between the available representations(the code, the objects, the call sequence and the outputwindows), another for accumulated fixation time within the
available representations and the third for average fixationtime within the available representations.The results for window switching frequency are illu-
strated in Figs. 10–13. There were main effects for type ofswitch (F ð5; 34Þ ¼ 36:41, po:01) and interaction effects fortype of error by type of switch (F ð5; 34Þ ¼ 6:31, po:01), formodality and KER group (see Fig. 11) (F ð1; 38Þ ¼ 9:28,po:01) and for modality, PPE and KER groups(F ð1; 38Þ ¼ 4:34, po:05).Planned comparisons revealed a significant effect when
comparing the frequency of switching involving the codewindow against those between the other windows ðtð41Þ ¼12:54; po:01Þ (see Fig. 10). In the case of the interactioneffect between modality, PPE and KER, planned contrastcomparisons revealed a significant contrast when compar-ing the group of high knowledge in both PPE and KERwith the rest of the participants ðF ð1; 40Þ ¼ 16:98; po:01Þ(see Fig. 12). Finally, in the case of the interaction effectbetween type of error and type of switch, a planned test ofwithin subject contrasts for the type of error by type ofswitch effect revealed a significant contrast when compar-ing switches including the objects window (switchingbetween the objects and either the code or output windows)to switches including the call sequence window (switchingbetween the call sequence and either the code or the outputwindows) ðF ð1; 38Þ ¼ 30:65; po:01Þ (see Fig. 13). Theseresults suggest that switches involving the code windowwere more frequent than those involving any of the otherwindows, that differences in KER are associated withdifferences in the amount of switching in different modalityconditions, that these differences are magnified whenconsidering the group of high KER and high PPE, andthat unsurprisingly, the frequency of switches involving theobjects and call sequence visualisations varies according tothe type of error at hand.Regarding accumulated inspection time, there were main
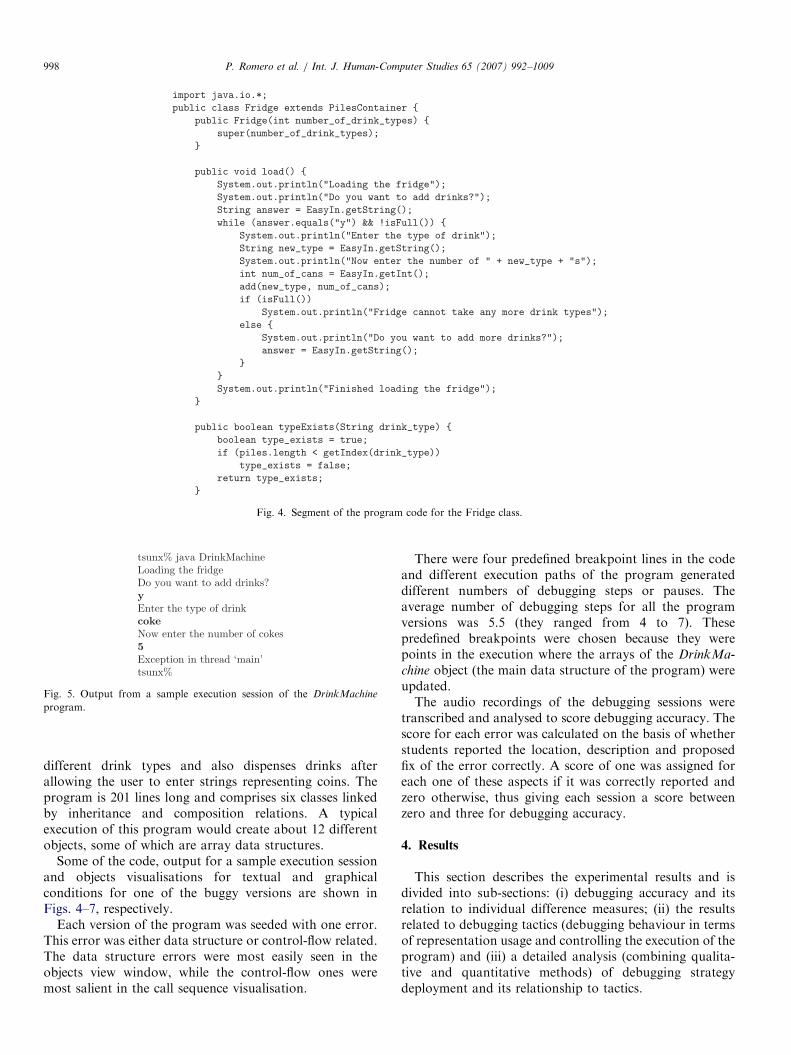
effects for window ðF ð3; 36Þ ¼ 179:68; po:01Þ (see Fig. 14)and interaction effects for modality and KER groupðF ð1; 38Þ ¼ 5:35; po:05Þ and window, modality and KERgroup ðF ð3; 36Þ ¼ 5:06; po:01Þ (see Figs. 15 and 16,
ARTICLE IN PRESSP. Romero et al. / Int. J. Human-Computer Studies 65 (2007) 992–10091002
respectively). For the interaction effect between window,modality and KER group, tests of within subjects contrastsrevealed significant effects when comparing the differences
Fig. 14. Accumulated inspection time for each window.
Fig. 15. Accumulated inspection time by KER and SDE mode.
Fig. 16. Accumulated inspection time
between the KER groups in their the total fixation timesfor graphical and textual conditions, for the code windowand the other windows (the difference in fixation timesbetween the graphical and textual SDE modes of the KERgroups for the code window was significantly different tothose of the other windows) ðF ð1; 38Þ ¼ 8:65; po:01Þ.These results suggest that participants looked at the codemuch more than any other window (for about 80% of thetime) and that while those participants in the high KERgroup inspected the code for a longer time when working inthe SDE graphical mode the opposite was true for those inthe low KER group (they looked at the code window for alonger time when working in the SDE textual mode). Thisdifference seems to be responsible for the correspondingglobal difference in SDE mode for these two groups (seeFig. 15).The results for average fixation time per visit to the
window are illustrated in Fig. 17. There were main effectsfor window ðF ð3; 36Þ ¼ 22:43; po:01Þ only and no inter-action effects. Participants made average fixations of about1min for the code window and of less than 10 s for theother windows. This result suggests that participants’average fixations were considerably longer for the codewindow but there were no significant differences for any ofthe other factors considered.The results for representation usage therefore suggest
that participants with both high KER and PPE had a highwindow switching frequency when working with textualvisualisations and that there were dissimilar patterns forthe amount of time participants inspected the code windowfor low and high KER groups under different SDE modeconditions. The low KER group looked at the codewindow longer when working under the SDE textualcondition while the high KER group looked at the codewindow longer when working under the SDE graphicalmode (see Fig. 16). Regarding average fixation times,
by KER, window and SDE mode.

ARTICLE IN PRESS
Fig. 17. Average fixation time for each window.
Fig. 18. Breakpoint switching by types of switch (end/reset and
intermediate switches) and error (data-flow and control-flow errors).
Fig. 19. Breakpoint switching by PPE and KER.
P. Romero et al. / Int. J. Human-Computer Studies 65 (2007) 992–1009 1003
participants performed longer fixations when looking atthe code window. There were, however, no other significantdifferences for this aspect either for KER, PPE, modality,perspective or their interactions.
One way to explain the reason for participants with bothhigh KER and PPE switching more in the textual SDEcondition would be to say that they made shorter fixationsin this condition; however, average fixation times weresimilar for different KER and PPE groups and for thedifferent modality and perspective conditions (according tothe results for average fixation times). Therefore ifparticipants with both high KER and PPE were doingmore switching it was not because they made shorterfixations but may be because of differences in totalinspection times (differences in total time on task). Thedissimilar patterns observed for total inspection times forlow and high KER groups working under different SDEmodes could be considered as evidence; however, this resultdid not involve PPE groups so we cannot be conclusive.
4.2.2. Breakpoint usage
This part of the analysis relates accumulated fixationtime and switching frequency for the program breakpointsto the experimental factors (visualisation modality, type oferror, PPE and KER). Two separate ANOVAs werecomputed; one for switching frequency between theprogram breakpoints and another for fixation time withinthe different program breakpoints.
The analysis for breakpoint switching frequency com-pared switches between the beginning of the programexecution and the last breakpoint (end/reset switches) withswitches between intermediate breakpoints (intermediateswitches). This was to compare two typical debuggingtactics: following the program execution step by step oranalysing it ‘post-mortem’ by jumping from the beginningof the program execution to the last breakpoint.
The results for breakpoint switching frequency areillustrated in Figs. 18 and 19. There were main effects forswitch ðF ð1; 38Þ ¼ 52:58; po:01Þ and type of errorðF ð1; 38Þ ¼ 6:23; po:05Þ and interaction effects for the
combination of these two factors ðF ð1; 38Þ ¼ 6:99; po:05Þ(see Fig. 18), and type of error, PPE and KER ðF ð1; 38Þ ¼4:35; po:05Þ (see Fig. 19). Planned contrast comparisonsfailed to reveal significance for specific contrasts for thelatter interaction effect. These results suggest that inter-mediate switches were more frequent than switchesbetween the first and last breakpoints, that data structureerrors promoted more switching than control-flow errors,but also for intermediate breakpoints, participantsswitched more for data structure than for control flowerrors. Additionally, breakpoint switching frequency variesaccording to the type of error and differences in PPE andKER.The analysis for breakpoint fixation time compared the
relative time participants spent in the first, last andintermediate breakpoints. The results for breakpointfixation are illustrated in Figs. 20 and 21. There were maineffects for breakpoint ðF ð2; 37Þ ¼ 3:7; po:05Þ (see Fig. 20)and interaction effects for breakpoint and error typesðF ð2; 37Þ ¼ 14:56; po:01Þ. Planned contrast comparisonsrevealed a significant contrast in this interaction when

ARTICLE IN PRESS
Fig. 20. Fixation time by breakpoint type.
Fig. 21. Fixation time by breakpoint and error types.
1This detailed analysis was an extremely time consuming process which
took about 240 coder hours. It was not possible to involve multiple coders
but we tried to maximise the quality of the coding process with a thorough
training of the coder. First, the coder was briefed about the coding
scheme. Then, the authors as well as the coder coded one debugging
session. Codings were compared and discrepancies were resolved. This
process was repeated until there was a high level of agreement in the
codings. After this the coder coded the rest of the debugging sessions on
his own.
P. Romero et al. / Int. J. Human-Computer Studies 65 (2007) 992–10091004
comparing intermediate and last breakpoints ðF ð1; 38Þ ¼29:54; po:01Þ (see Fig. 21). These results suggest thatparticipants spent the most time on the last breakpoint andthe least on the first in general but that this was alsodependent on error type (this was not the case for datastructure errors).
The global results for breakpoint usage suggest thatdifferences in the control of the program execution viewingwere related mainly to the type of error at hand. For datastructure errors, participants spent longer in intermediatebreakpoints, switching frequently between them. Forcontrol-flow errors participants spent longer in the lastbreakpoint (the end of the program execution).
4.3. Debugging strategy
This section analyses the debugging strategies deployedby participants both in qualitative and quantitative ways.These debugging strategies were identified by interpretingdetailed accounts of the behaviour of participants. These
detailed accounts were obtained by watching replays of thedebugging sessions and breaking them down into asequence of discrete debugging events by interpreting threetypes of experimental data simultaneously. The three typesof data considered were trace of focus of attention, controlof the presentation of the program’s execution andparticipants’ verbalisations. A new event was defined by achange in the focus of attention, a command related to thepresentation of the program’s execution, participants’verbalisations or a mixture of these. Therefore events werebounded by pauses or changes of topic in programmers’verbalisations (utterances), inter-window switches of visualattention focus or breakpoint switches. A detailed descrip-tion of this methodology can be found in Romero et al.(2007).This part of the analysis took into account only a subset
of the experimental data. The debugging sessions for onlyone of the six target program versions were taken intoaccount.1 The program version chosen was not signifi-cantly different to the other versions in terms of the use ofrepresentations (code and visualisations) that participantsdisplayed and was the one that showed the widest spread ofdebugging accuracy scores.The following sections present qualitative and quantita-
tive analyses of these debugging events and associatedstrategies.
4.3.1. Qualitative analysis
A detailed qualitative analysis of the debugging eventsidentified specific debugging strategies by categorising eachone of these events as the deployment of a specific strategy.The debugging strategies identified are shown in Table 2.Most of these debugging strategies correspond to thosedescribed in Katz and Anderson (1988). The only differentstrategy is following execution. There are not manyreferences to similar strategies in the debugging literature,perhaps because only a few debugging studies have takeninto account the programmer’s interaction with compu-terised debugging environments and in particular with thevisualisations provided by them. Following execution sharessimilarities with forward reasoning strategies as theprogrammer starts the search by trying to understandwhat the program does, however, unlike forward reason-ing, the comprehension process integrates visualisation andcode information.
Following execution is related to mapping (Mulholland,1997), cross-referencing information between visualisationand code. In following execution there are frequent visual
ARTICLE IN PRESS
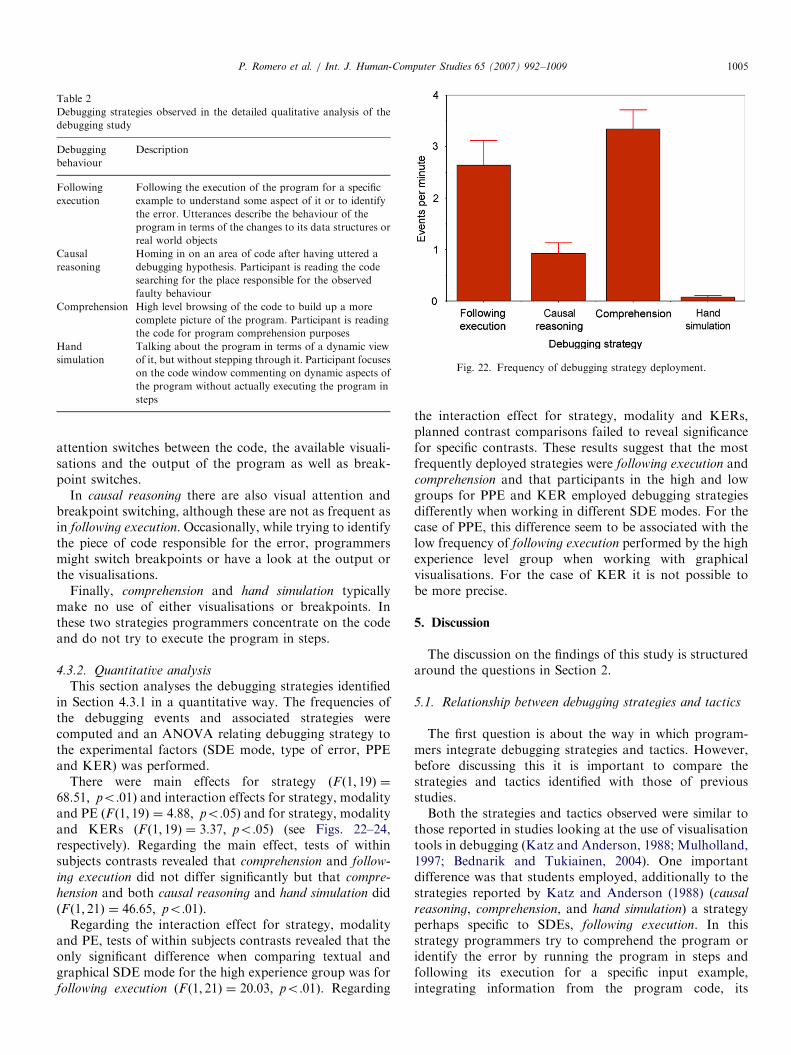
Fig. 22. Frequency of debugging strategy deployment.
Table 2
Debugging strategies observed in the detailed qualitative analysis of the
debugging study
Debugging
behaviour
Description
Following
execution
Following the execution of the program for a specific
example to understand some aspect of it or to identify
the error. Utterances describe the behaviour of the
program in terms of the changes to its data structures or
real world objects
Causal
reasoning
Homing in on an area of code after having uttered a
debugging hypothesis. Participant is reading the code
searching for the place responsible for the observed
faulty behaviour
Comprehension High level browsing of the code to build up a more
complete picture of the program. Participant is reading
the code for program comprehension purposes
Hand
simulation
Talking about the program in terms of a dynamic view
of it, but without stepping through it. Participant focuses
on the code window commenting on dynamic aspects of
the program without actually executing the program in
steps
P. Romero et al. / Int. J. Human-Computer Studies 65 (2007) 992–1009 1005
attention switches between the code, the available visuali-sations and the output of the program as well as break-point switches.
In causal reasoning there are also visual attention andbreakpoint switching, although these are not as frequent asin following execution. Occasionally, while trying to identifythe piece of code responsible for the error, programmersmight switch breakpoints or have a look at the output orthe visualisations.
Finally, comprehension and hand simulation typicallymake no use of either visualisations or breakpoints. Inthese two strategies programmers concentrate on the codeand do not try to execute the program in steps.
4.3.2. Quantitative analysis
This section analyses the debugging strategies identifiedin Section 4.3.1 in a quantitative way. The frequencies ofthe debugging events and associated strategies werecomputed and an ANOVA relating debugging strategy tothe experimental factors (SDE mode, type of error, PPEand KER) was performed.
There were main effects for strategy ðF ð1; 19Þ ¼68:51; po:01Þ and interaction effects for strategy, modalityand PE ðF ð1; 19Þ ¼ 4:88; po:05Þ and for strategy, modalityand KERs ðF ð1; 19Þ ¼ 3:37; po:05Þ (see Figs. 22–24,respectively). Regarding the main effect, tests of withinsubjects contrasts revealed that comprehension and follow-
ing execution did not differ significantly but that compre-
hension and both causal reasoning and hand simulation didðF ð1; 21Þ ¼ 46:65; po:01Þ.
Regarding the interaction effect for strategy, modalityand PE, tests of within subjects contrasts revealed that theonly significant difference when comparing textual andgraphical SDE mode for the high experience group was forfollowing execution ðF ð1; 21Þ ¼ 20:03; po:01Þ. Regarding
the interaction effect for strategy, modality and KERs,planned contrast comparisons failed to reveal significancefor specific contrasts. These results suggest that the mostfrequently deployed strategies were following execution andcomprehension and that participants in the high and lowgroups for PPE and KER employed debugging strategiesdifferently when working in different SDE modes. For thecase of PPE, this difference seem to be associated with thelow frequency of following execution performed by the highexperience level group when working with graphicalvisualisations. For the case of KER it is not possible tobe more precise.
5. Discussion
The discussion on the findings of this study is structuredaround the questions in Section 2.
5.1. Relationship between debugging strategies and tactics
The first question is about the way in which program-mers integrate debugging strategies and tactics. However,before discussing this it is important to compare thestrategies and tactics identified with those of previousstudies.Both the strategies and tactics observed were similar to
those reported in studies looking at the use of visualisationtools in debugging (Katz and Anderson, 1988; Mulholland,1997; Bednarik and Tukiainen, 2004). One importantdifference was that students employed, additionally to thestrategies reported by Katz and Anderson (1988) (causal
reasoning, comprehension, and hand simulation) a strategyperhaps specific to SDEs, following execution. In thisstrategy programmers try to comprehend the program oridentify the error by running the program in steps andfollowing its execution for a specific input example,integrating information from the program code, its

ARTICLE IN PRESS
Fig. 23. Frequency of debugging strategy deployment by programming experience and SDE mode.
Fig. 24. Frequency of debugging strategy deployment by knowledge of ERs and SDE mode.
P. Romero et al. / Int. J. Human-Computer Studies 65 (2007) 992–10091006
visualisations and output. It can be categorised as aforward reasoning strategy, however, unlike other strate-gies in this category (such as comprehension or hand
simulation), the search for the error takes into accountinformation from sources other than the program code.
Tactics related to coordinating the available representa-tions and operating the SDE step-and-trace facilities wereparticularly important for the following execution strategy.They were also employed, although to a lesser extent, incausal reasoning.
When deploying a following execution strategy, partici-pants viewed the execution of the program in steps andmade frequent visual attention switches between the code,the available visualisations and the output of the program.
Frequently, once they had identified the program error inthis way, they would switch to a causal reasoning strategy,concentrating on the program code but also makingoccasional references to other representations.The strategies more frequently deployed were compre-
hension and following execution while hand simulation wasonly infrequently deployed. This suggests that studentsmade good use of the environment affordances andspecifically of the facilities for browsing through the codetext and of those for viewing the execution of the programin steps.The other two debugging strategies observed, compre-
hension and hand simulation consisted almost entirely ofreading the program code, switching between the different
ARTICLE IN PRESSP. Romero et al. / Int. J. Human-Computer Studies 65 (2007) 992–1009 1007
class files but making practically no reference to the otherrepresentations or to dynamic aspects of the programexecution.
5.2. Relationship between graphical literacy and debugging
performance
The second question refers to the relationship betweenverbal ability, level of graphical literacy and debuggingperformance.
The visualisations employed were helpful for students,debugging without visualisations decreased performance.However, in order to take advantage of the information inthe visualisations both relevant PE and a good knowledgeof representation formalisms is needed.
It seems counter-intuitive that relevant PE in this contextmeans experience in procedural programming languages.However, if we consider that the participants’ Object-Oriented PE was fairly homogeneous (mainly the under-graduate courses they had taken), what might havemade the difference was the PPE they had accumulatedelsewhere.
Verbal ability was not correlated with debuggingperformance. This result is in agreement with other studiesthat have found no significant correlation between verbalability and programming performance (Mayer et al., 1986;Tukiainen and Monkkonen, 2002). It may be that verbalability as measured by the pre-tests applied is differentfrom the skill required to read and interpret information inpropositional form about computer programs.
5.3. Relationship between experience, modality and
debugging behaviour
The last question refers to the way experience, modalityand perspective influence debugging strategy and tacticsdeployment. An important finding here relates to the wayin which experienced participants were able to modify theirstrategy and tactics according to changes in the format ofthe visualisations without altering their performance.Additionally, results also confirm the importance of thetype of error in the debugging task.
Regarding the first finding, experienced participants(those who had both a high level of PPE and a high levelof KER) displayed a debugging behaviour different fromthe rest of the participants when dealing with different SDEmodes. When working in a textual mode (with visualisa-tions displayed in a textual format), experienced partici-pants tended to switch their visual attention between thewindows of the environment more than when working in agraphical mode. This difference implies that the reducedmemorability of textual as opposed to graphical represen-tations of data structures and flow of control wascompensated for by more frequent visual cross-checksbetween the code and those representations. This differenceseems related to corresponding differences in the debuggingstrategies employed in these two conditions. The following
paragraphs elaborate on this point and offer a possibleexplanation for the reduced memorability of textualrepresentations.At least for participants with a high level of KER, there
is a corresponding difference in the amount of following
execution, a debugging strategy related to executing theprogram in steps and following its execution for a specificinput example, integrating information from the programcode, its visualisations and output. Participants working intextual mode tended to employ this debugging strategymore than in graphical mode. One possible explanation forthese differences is that the textual condition imposed anadditional burden which required cross-referencing theinformation in the different representations frequently,therefore requiring participants to spend longer on debug-ging strategies which rely on representation switching (suchas following execution).A comparison between Figs. 6 and 7 illustrates the
difference between graphical and textual representations.Both figures encode the same information. However, bygrouping certain elements in boxes, Fig. 7 helps to identifymeaningful structures in the visualisation (in this case theobjects of the program execution). Participants working inthe textual condition, on the other hand, had to performthis grouping and then keep a mental reference to thesemeaningful structures in working memory. These proces-sing overheads can be crucial when dealing with dynamicrepresentations, as participants also had to detect patternsof change through time in the visualisations. These resultsseem to confirm the view that diagrams, unlike proposi-tional representations, exploit perceptual processes bygrouping relevant information together and therefore makethe search and recognition of information easier (Larkinand Simon, 1987).Several studies have identified this grouping of relevant
information into meaningful structures (chunking) as acrucial part of problem solving (Chase and Simon, 1973a,b) and in particular of the programming skill (McKeithenet al., 1981; Brooks, 1983). This study seems to exemplifythe way in which representation format can supportchunking for a population that is presumably developingthis programming skill. A graphical reference to theprogram’s relevant structures gives better support as itenables a more direct identification of these structures.The additional cognitive effort required to interpret the
textual condition can be considered as an example ofextraneous cognitive load. According to van Bruggen et al.(2002), extraneous cognitive load is the cognitive effortproduced by the characteristics of the learning environ-ment. This contrasts with germane cognitive load, which isthe cognitive effort associated with storage and retrieval ofschemata in long term memory. According to CognitiveLoad Theory (van Bruggen et al., 2002), learning environ-ments should attempt to decrease extraneous cognitiveload and increase germane cognitive load. It seems that thegraphical condition is closer than the textual condition tothis aim.

ARTICLE IN PRESSP. Romero et al. / Int. J. Human-Computer Studies 65 (2007) 992–10091008
Other studies have also highlighted differences inrepresentation switching patterns between participantswith different levels of skill. Cox (1997) and Cox and Brna(1995) reported that poor performers switched morefrequently than successful ones in analytical reasoningtasks. However, there are several differences between thosestudies and the one reported here. Although analyticalreasoning as a cognitive task might be remarkably similarto program comprehension, the analytical reasoningstudies encouraged participants to build their own repre-sentations. Therefore, switching representations repre-sented ‘a strategic decision by the subject to abandon thecurrent external representation and construct a new one’(Cox and Brna, 1995). In the present study, representationswere complementary (and pre-constructed) rather thanalternative, therefore, switching did not necessarily repre-sent discarding one representation for another, but morelikely complementing the information of one with another.The reason for switching in the present study had more todo with an inefficient use of the visualisations or withineffective representations, rather than with giving up onspecific representations.
The main results of this study suggest that, at least forthe experimental conditions considered, graphical repre-sentations enabled a more direct understanding of therelevant structures in the problem space. However, thisdoes not mean that diagrams are superior to textualrepresentations for every situation, or that they willprovide a good level of support in all cases. One of themain issues to consider is scalability. Programs, even forsmall academic projects, very often involve dozens ofobjects. Presenting all of them on the screen can createlayout difficulties for the designer of such a tool andprobably cognitive overload problems for its users. Morestudies are needed to find out whether there are potentialproblems in using diagrammatic representations in thiscontext and what their possible solutions might be.
6. Conclusions
This study has characterised the strategies and tacticsdeployed by novice programmers working in multi-representational software debugging environments. Addi-tionally, it has investigated how factors such as program-ming experience, knowledge of external representationformalisms and the form and content of the representationsemployed in the software debugging environment influenceboth the choice of strategy and debugging performance.Although there have been studies that have looked atdebugging strategies (Katz and Anderson, 1988; Mulhol-land, 1997; Prabhakararao et al., 2003) and tactics(Romero et al., 2002a, b; Bednarik and Tukiainen, 2004),the value of the present study resides in the fact that itoffers an account of how programmers integrate them andabout how different factors interact to influence the choiceof these strategies and tactics and the accuracy of thedebugging effort.
This study suggests that, at least for novice programmersworking in multi-representational software debuggingenvironments, knowledge of external representation form-alisms is as important as programming experience tosucceed in the debugging task. Visualisations of theprogram execution are helpful but only when studentshave enough programming knowledge to make sense of theinformation in them and enough knowledge aboutrepresentation formalisms to decode this information.Students with these characteristics are able to modify theirdebugging strategies and tactics when working underdifferent format conditions in order to retain a highaccuracy level. Propositional representations are not ashelpful as graphical ones in grouping meaningful elementsof the representations and as a result these group ofstudents had to perform frequent information cross-referencing between the available representations whenworking in the textual mode.The results of this study raise several questions and more
experimentation is needed, perhaps focusing on representa-tional format and for students with a high level of bothprogramming experience and knowledge of externalrepresentation formalisms.
Acknowledgements
This work was supported by the EPSRC Grant GR/N64199 and the Nuffield Foundation Grant URB/01703/G. The support for Richard Cox of the LeverhulmeFoundation (Leverhulme Trust Fellowship G/2/RFG/2001/0117) and the British Academy is gratefully acknowl-edged. The authors wish to thank Stephen Grant forrefining the coding categories of the detailed analysis ofrepresentation usage and for coding them. Finally, theauthors would like to thank the referees for their helpfulcomments and thorough review of earlier versions of thepaper.
References
Ainsworth, S., Wood, D., Bibby, P., 1996. Co-ordinating multiple
representations in computer based learning environments. In: Brna,
P., Paiva, A., Self, J., Proceedings of the 1996 European Conference on
Artificial Intelligence on Education, Lisbon, Portugal, pp. 336–342.
Bednarik, R., Tukiainen, M., 2004. Visual attention and representation
switching in Java program debugging: a study using eye-movement
tracking. In: Dunican, E., Green, T. (Eds.), Proceedings of the 16th
Annual Workshop of the Psychology of Programming Interest Group,
pp. 159–169.
Blackwell, A., Jansen, A., Marriott, K., 2000. Restricted focus viewer: a
tool for tracking visual attention. In: Anderson, M., Cheng, P.,
Haarslev, V. (Eds.), Theory and Application of Diagrams. Lecture
Notes in Artificial Intelligence, vol. 1889. Springer, Berlin,
pp. 162–177.
Bodemer, D., Ploetzner, R., Feuerlein, I., Spada, H., 2004. The active
integration of information during learning with dynamic interactive
visualizations. Learning and Instruction 14, 325–341.
Brooks, R., 1983. Towards a theory of the comprehension of computer
programs. International Journal of Man-Machine Studies 18, 543–554.
ARTICLE IN PRESSP. Romero et al. / Int. J. Human-Computer Studies 65 (2007) 992–1009 1009
Brownstein, S., Weiner, M., Weiner-Green, S., 1990. How to Prepare for
the GRE. Barron’s Educational Series, New York.
Campagnoni, F.R., Ehrlich, K., 1989. Information retrieval using a
hypertext-based help system. ACM Transactions on Information
Systems 7, 271–291.
Chase, W., Simon, H., 1973a. Perception in chess. Cognitive Psychology 4,
55–81.
Chase, W.G., Simon, H.A., 1973b. The mind’s eye in chess. In: Chase, W.G.
(Ed.), Visual Information Processing. Academic Press, New York.
Chintakovid, T., Wiedenbeck, S., Burnett, M., Grigoreanu, V., 2006. Pair
collaboration in end-user debugging. In: Grundy, J., Howse, J. (Eds.),
2006 IEEE Symposium on Visual Languages and Human-Centric
Computing. IEEE Press, Brighton, UK, pp. 3–10.
Cox, R., 1996. Analytical reasoning with multiple external representations.
Ph.D. Thesis, University of Edinburgh, Edinburgh, Scotland, UK.
Cox, R., 1997. Representation interpretation versus representation
construction: a controlled study using switchERII. In: du Boulay, B.,
Mizoguchi, R. (Eds.), Artificial Intelligence in Education: Knowledge
and Media in Learning Systems, Proceedings of the Eighth World
Conference of the Artificial Intelligence in Education Society. IOS
Press, Amsterdam, pp. 434–444.
Cox, R., 1999. Representation construction, externalised cognition and
individual differences. Learning and Instruction 9, 343–363.
Cox, R., Brna, P., 1995. Supporting the use of external representations in
problem solving: the need for flexible learning environments. Journal
of Artificial Intelligence in Education 6 (2/3), 239–302.
Cox, R., Stenning, K., Oberlander, J., 1995. The effect of graphical and
sentential logic teaching on spontaneous external representation.
Cognitive Studies: Bulletin of the Japanese Cognitive Science Society
2 (4), 56–75.
Cox, R., Romero, P., du Boulay, B., Lutz, R., 2004. A cognitive
processing perspective on student programmers’ ‘graphicacy’. In:
Blackwell, A., Marriott, K., Shimojima, A. (Eds.), Diagrammatic
Representation and Inference. Lecture Notes in Computer Science,
vol. 2980. Springer, Berlin, pp. 344–346.
Davies, S.P., 1993a. Expertise and display-based strategies in computer
programming. In: Lalty, J.L., Diaper, D., Guest, D. (Eds.), Proceed-
ings of the Eighth Conference of the British Computer Society Human
Computer Interaction Specialist Group—People and Computers VIII,
Loughborough, UK, pp. 411–423.
Davies, S.P., 1993b. Models and theories of programming strategy.
International Journal of Man-Machine Studies 39, 237–267.
Ericsson, K.A., Simon, H.A., 1984. Protocol Analysis: Verbal Reports as
Data. MIT Press, Cambridge, MA.
Gilmore, D.J., 1990. Expert programming knowledge: a strategic
approach. In: Hoc, J., Green, T.R.G., Samurc-ay, R., Gilmore, D.J.
(Eds.), Psychology of Programming. Academic Press, London, UK,
pp. 223–234.
Gilmore, D.J., Green, T.R.G., 1984. Comprehension and recall of
miniature programs. International Journal of Man-Machine Studies
21 (1), 31–48.
Grawemeyer, B., Cox, R., 2003. The effects of knowledge of external
representations and display selection upon database query perfor-
mance. In: Second International Workshop on Interactive Graphical
Communication (IGC2003).
Grawemeyer, B., Cox, R., 2004. The effect of knowledge-of-external-
representations upon performance and representational choice in a
database query task. In: Blackwell, A., Marriott, K., Shimojima, A.
(Eds.), Diagrammatic Representation and Inference, Third Interna-
tional Conference, Diagrams 2004, pp. 351–354.
Grigoreanu, V., Beckwith, L., Fern, X., Yang, S., Komireddy, C.,
Narayanan, V., Cook, C., Burnett, M., 2006. Gender differences in
end-user debugging, revisited: What the miners found. In: Grundy, J.,
Howse, J. (Eds.), 2006 IEEE Symposium on Visual Languages and
Human-Centric Computing. IEEE Press, Brighton, UK, pp. 19–26.
Jansen, A.R., Blackwell, A.F., Marriott, K., 2003. A tool for tracking
visual attention: the restricted focus viewer. Behavior Research
Methods, Instruments & Computers 35 (4), 57–69.
Katz, I., Anderson, J.R., 1988. Debugging: an analysis of bug location
strategies. Human-Computer Interaction 3, 359–399.
Kriz, S., Hegarty, M., 2004. Constructing and revising mental models of a
mechanical system: the role of domain knowledge in understanding
external visualizations. In: Forbus, K., Gentner, D., Regier, T. (Eds.),
Proceedings of the 26th Annual Conference of the Cognitive Science
Society. Lawrence Erlbaum Associates, Mahwah, NJ, pp. 439–449.
Larkin, J.H., Simon, H.A., 1987. Why a diagram is (sometimes) worth ten
thousand words. Cognitive Science 11, 65–100.
Mayer, R.E., Dyck, J.L., Vilberg, W., 1986. Learning to program and
learning to think: What’s the connection? Communications of the
ACM 29 (7), 605–610.
McKeithen, K.B., Reitman, J.S., Rueter, H.H., Hirtle, S.C., 1981.
Knowledge organization and skill differences in computer program-
mers. Canadian Journal of Psychology 13, 307–325.
Mulholland, P., 1997. Using a fine-grained comparative evaluation
technique to understand and design software visualization tools. In:
Wiedenbeck, S., Scholtz, J. (Eds.), Empirical Studies of Programmers,
Seventh Workshop. ACM Press, New York, pp. 91–108.
Oberlander, J., Stenning, K., Cox, R., 1999. Hyperproof: abstraction,
visual preference and modality. In: Moss, L.S., Ginzburg, J., deRijke,
M. (Eds.), Logic, Language, and Computation, vol. II. CSLI
Publications, pp. 222–236.
Patel, M.J., du Boulay, B., Taylor, C., 1997. Comparison of contrasting
Prolog trace output formats. International Journal of Human
Computer Studies 47, 289–322.
Pennington, N., 1987. Stimulus structures and mental representations in
expert comprehension of computer programs. Cognitive Psychology
19, 295–341.
Prabhakararao, S., Cook, C.R., Ruthruff, J.R., Creswick, E., Main, M.,
Durham, M., 2003. Strategies and behaviors of end-user programmers
with interactive fault localization. In: HCC. IEEE Computer Society,
Silver Spring, MD, pp. 15–22.
Romero, P., Cox, R., du Boulay, B., Lutz, R., 2002a. Visual attention and
representation switching during java program debugging: a study using
the restricted focus viewer. In: Hegarty, M., Meyer, B., Narayanan,
N.H. (Eds.), Diagrammatic Representation and Inference. Second
International Conference, Diagrams 2002. Lecture Notes in Artificial
Intelligence, vol. 2317, pp. 221–235.
Romero, P., Lutz, R., Cox, R., du Boulay, B., 2002b. Co-ordination of
multiple external representations during Java program debugging. In:
Wiedenbeck, S., Petre, M. (Eds.), 2002 IEEE Symposia on Human
Centric Computing Languages and Environments. IEEE Press, Air-
lington, VA, USA, pp. 207–214.
Romero, P., Cox, R., du Boulay, B., Lutz, R., 2003. A survey of
representations employed in object-oriented programming environ-
ments. Journal of Visual Languages and Computing 14 (5),
387–419.
Romero, P., Cox, R., du Boulay, B., Lutz, R., Bryant, S., 2007. A method
for the capture and analysis of hybrid data: a case study of program
debugging. Behavior Research Methods 39 (2), 309–317.
Stenning, K., Oberlander, J., 1995. A cognitive theory of graphical and
linguistic reasoning: logic and implementation. Cognitive Science 19
(1), 97–140.
Storey, A.D., Wong, K., Muller, H.A., 2000. How do program
understanding tools affect how programmers understand programs?
Science of Computer Programming 36, 183–207.
Tukiainen, M., Monkkonen, E., 2002. Programming aptitude testing as a
prediction of learning to program. In: Kuljis, J., Baldwin, L., Scoble,
R. (Eds.), Psychology of Programming Interest Group 14th Work-
shop. Springer, Berlin, pp. 45–57.
Tversky, B., Morrison, J.B., 2002. Animation: Can it facilitate? Interna-
tional Journal of Human-Computer Studies 57, 247–262.
van Bruggen, J.M., Kirschner, P.A., Jochems, W., 2002. External
representation of argumentation in CSCL and the management of
cognitive load. Learning and Instruction 12, 121–138.
Wood, S., Cox, R., Cheng, P., 2006. Attention design: eight issues to
consider. Computers in Human Behavior 22 (1), 588–602.

![Debugging with gdb · Debugging Data Race Conditions: Section 12.2 [Data Race Detection], page 171. Debugging OpenMP*: Section 12.4 [OpenMP* Debugging], page 177. Extended recording](https://img.pdfslide.us/doc/110x75/5f0b5c707e708231d4302334/debugging-with-gdb-debugging-data-race-conditions-section-122-data-race-detection.jpg)