Embed Size (px)
Citation preview
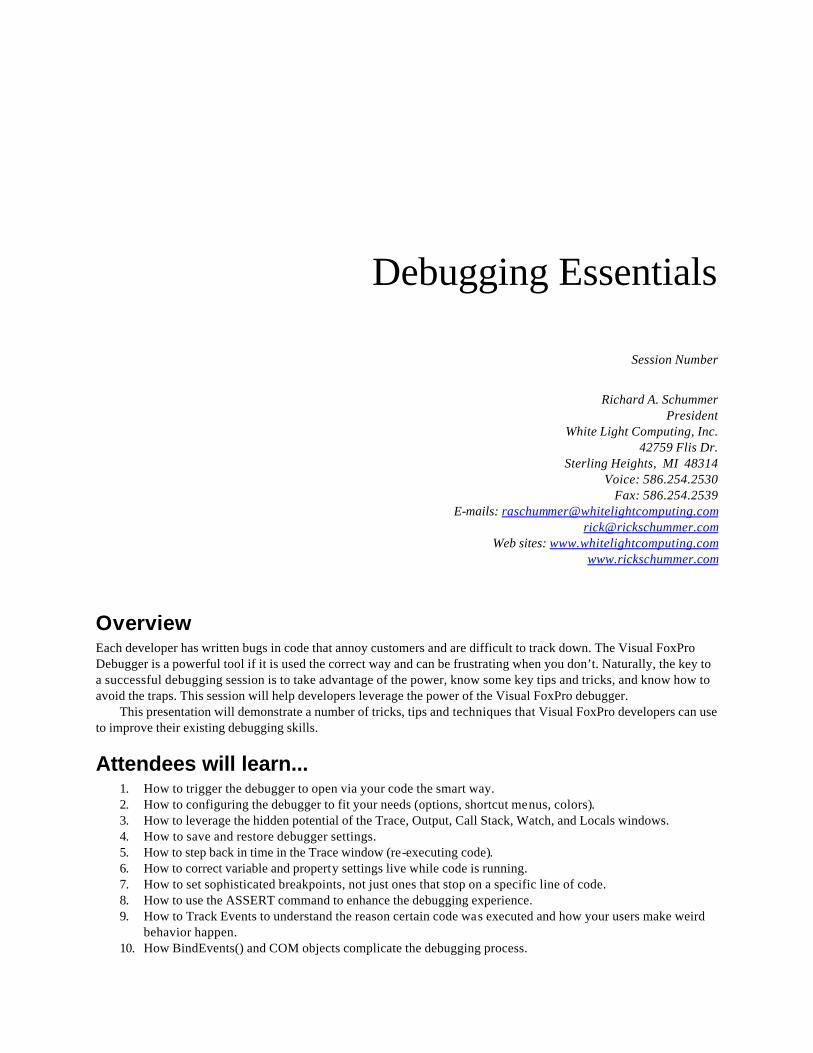
Debugging Essentials
Session Number
Richard A. Schummer President
White Light Computing, Inc. 42759 Flis Dr.
Sterling Heights, MI 48314 Voice: 586.254.2530
Fax: 586.254.2539 E-mails: [email protected]
[email protected] Web sites: www.whitelightcomputing.com
www.rickschummer.com
Overview Each developer has written bugs in code that annoy customers and are difficult to track down. The Visual FoxPro Debugger is a powerful tool if it is used the correct way and can be frustrating when you don’t. Naturally, the key to a successful debugging session is to take advantage of the power, know some key tips and tricks, and know how to avoid the traps. This session will help developers leverage the power of the Visual FoxPro debugger.
This presentation will demonstrate a number of tricks, tips and techniques that Visual FoxPro developers can use to improve their existing debugging skills.
Attendees will learn... 1. How to trigger the debugger to open via your code the smart way. 2. How to configuring the debugger to fit your needs (options, shortcut menus, colors). 3. How to leverage the hidden potential of the Trace, Output, Call Stack, Watch, and Locals windows. 4. How to save and restore debugger settings. 5. How to step back in time in the Trace window (re-executing code). 6. How to correct variable and property settings live while code is running. 7. How to set sophisticated breakpoints, not just ones that stop on a specific line of code. 8. How to use the ASSERT command to enhance the debugging experience. 9. How to Track Events to understand the reason certain code was executed and how your users make weird
behavior happen. 10. How BindEvents() and COM objects complicate the debugging process.
11. How to determine which variables in your code are accidentally scoped PRIVATE. 12. How to extend the Coverage Profiler to be even better at finding the slow parts of your application. 13. What’s new in Europa.
Skill Level/Prerequisites Introductory to Advanced. There are no prerequisites for this session.
Table of Contents Overview............................................................................................................................................................................................ 1
Attendees will learn... ...................................................................................................................................................................... 1
Skill Level/Prerequisites .................................................................................................................................................................. 2
Table of Contents............................................................................................................................................................................. 2
The Scientific Method..................................................................................................................................................................... 5
Make an Observation............................................................................................................................................................ 5
Formulate Questions............................................................................................................................................................. 5
Create Hypothesis/Prediction.............................................................................................................................................. 5
Fix and Test............................................................................................................................................................................ 5
Evaluate Results .................................................................................................................................................................... 6
Decision .................................................................................................................................................................................. 6
Testing vs. Debugging.................................................................................................................................................................... 6
The FoxPro 2.6 “debugger” ............................................................................................................................................................ 7
Debugger Basics .............................................................................................................................................................................. 7
How to configuring the debugger to fit your needs (options, shortcut menus, colors) ............................................ 7
Shortcut keys ......................................................................................................................................................................... 8
Drag and Drop........................................................................................................................................................................ 8
Changing Expressions .......................................................................................................................................................... 8
How to change values of memory variables and properties in the debugger.............................................................. 8
How to get quick access to the property values of a specific object ............................................................................ 9
How to set the debugger configuration to factory settings (Example: CLEARDEBUGGERSETTINGS.PRG) ........... 9
How to trigger the debugger to open via your code the smart way (Example: DEBUGMODE.PRG)................................ 11
How to leverage the hidden potential of the Trace, Output, Call Stack, Watch, and Locals windows ....................... 12
Trace Window...................................................................................................................................................................... 12
Output Window................................................................................................................................................................... 12
Call Stack Window.............................................................................................................................................................. 12
Watch Window.................................................................................................................................................................... 12
Locals Window.................................................................................................................................................................... 12
How to save and restore debugger configuration settings (Example: DEBUGGERCONFIGSAVED.DBG)....................... 13
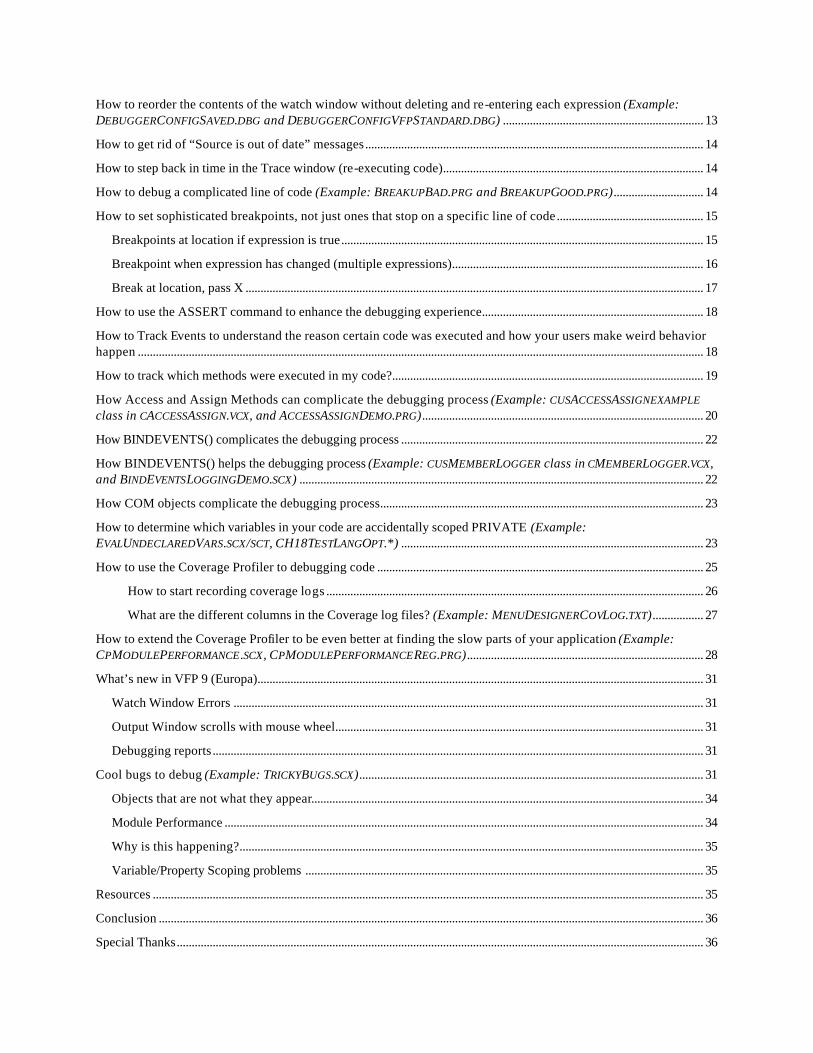
How to reorder the contents of the watch window without deleting and re-entering each expression (Example: DEBUGGERCONFIGSAVED.DBG and DEBUGGERCONFIGVFPSTANDARD.DBG) ................................................................... 13
How to get rid of “Source is out of date” messages................................................................................................................. 14
How to step back in time in the Trace window (re-executing code)....................................................................................... 14
How to debug a complicated line of code (Example: BREAKUPBAD.PRG and BREAKUPGOOD.PRG).............................. 14
How to set sophisticated breakpoints, not just ones that stop on a specific line of code................................................. 15
Breakpoints at location if expression is true......................................................................................................................... 15
Breakpoint when expression has changed (multiple expressions).................................................................................... 16
Break at location, pass X ......................................................................................................................................................... 17
How to use the ASSERT command to enhance the debugging experience.......................................................................... 18
How to Track Events to understand the reason certain code was executed and how your users make weird behavior happen ............................................................................................................................................................................................. 18
How to track which methods were executed in my code?........................................................................................................ 19
How Access and Assign Methods can complicate the debugging process (Example: CUSACCESSASSIGNEXAMPLE class in CACCESSASSIGN.VCX, and ACCESSASSIGNDEMO.PRG).............................................................................................. 20
How BINDEVENTS() complicates the debugging process ..................................................................................................... 22
How BINDEVENTS() helps the debugging process (Example: CUSMEMBERLOGGER class in CMEMBERLOGGER.VCX, and BINDEVENTSLOGGINGDEMO.SCX) ....................................................................................................................................... 22
How COM objects complicate the debugging process............................................................................................................ 23
How to determine which variables in your code are accidentally scoped PRIVATE (Example: EVALUNDECLAREDVARS.SCX/SCT, CH18TESTLANGOPT.*) ..................................................................................................... 23
How to use the Coverage Profiler to debugging code ............................................................................................................. 25
How to start recording coverage logs .............................................................................................................................. 26
What are the different columns in the Coverage log files? (Example: MENUDESIGNERCOVLOG.TXT)................. 27
How to extend the Coverage Profiler to be even better at finding the slow parts of your application (Example: CPMODULEPERFORMANCE .SCX, CPMODULEPERFORMANCEREG.PRG)............................................................................... 28
What’s new in VFP 9 (Europa)..................................................................................................................................................... 31
Watch Window Errors ............................................................................................................................................................. 31
Output Window scrolls with mouse wheel........................................................................................................................... 31
Debugging reports.................................................................................................................................................................... 31
Cool bugs to debug (Example: TRICKYBUGS.SCX)................................................................................................................... 31
Objects that are not what they appear................................................................................................................................... 34
Module Performance ................................................................................................................................................................ 34
Why is this happening?........................................................................................................................................................... 35
Variable/Property Scoping problems ..................................................................................................................................... 35
Resources ........................................................................................................................................................................................ 35
Conclusion ...................................................................................................................................................................................... 36
Special Thanks................................................................................................................................................................................ 36

Copyright......................................................................................................................................................................................... 36
Author Profile ................................................................................................................................................................................. 36
The Scientific Method The scientific method is the process by which scientists, collectively and over time, endeavor to construct an accurate (that is, reliable, consistent and non-arbitrary) representation of the world. This same process can be applied by a computer scientist as they endeavor to understand the representation of a requirement and how it is incorrectly constructed in code. The process is broken down into six steps.
Make an Observation The first step to using the scientific method is to have some basis for conducting your research and debugging. This is the step that identifies the problem. The scientific method to debugging and testing software is founded upon direct observation of the code being run. A developer must look critically and attempt to avoid all sources of bias in this observation. But more than looking, a developer must measure and quantify the observation; which helps in avoiding bias when looking at the problem
So as you are testing our application (at the sub component, component, or system level) you recognize and observe a problem or defect. We will use the example of an error “Property <property name> is not found. Unbinding object <object name>” as a form is instantiated. You observe a couple of items. The first observation is the error message that is displayed. The second is that the object is no longer bound to data.
Formulate Questions The second step in the scientific method is to formulate a question. Software developers have to be curious and ask questions! There is one truly foolish question - the one you never ask and never get answered! By asking questions we are elaborating the problem. At this point we should be asking what happened, what was unexpected, and what did not meet the requirements during the test.
You can ask several questions following our example where the object threw the error message, and did not bind the object. Which object failed to instantiate and threw the error? Is the object bound to a property or cursor column? Did the cursor structure change recently? Did you change any properties on the object that failed to instantiate correctly? Specifically, did you correctly set or incorrectly change the ControlSource property of the object that failed?
Create Hypothesis/Prediction The next step of the scientific method is to form a hypothesis, and listing possible solutions. This is merely an educated guess as to the answer for the question. You gather as much book knowledge and practical experience as you can on the subject to begin to arrive at an answer to your question. This tentative answer, this best educated guess, is your hypothesis.
Please notice that hypotheses do not always have to be correct. In fact most of science is spent trying to determine the validity of a hypothesis, yet this effort is not likely to give a single perfect answer. So, in formulating your hypothesis, you should not worry too much that you have come up with the best or the only possible hypothesis. The rest of the scientific method will test your hypothesis. What will be important is your decision at the end of the method.
One aspect of your hypothesis is important; it must be able to be rejected. There must be a way to test the possible answer to try to make it fail. If you design an untestable hypothesis, then science cannot be used to help you decide if it is right or not.
Following our example we can create a hypothesis that states that the ControlSource was initially set to a column that existed at the time, but no longer is part of the cursor structure. If the object was bound to a property we can state that the ControlSource is misspelled or that the property does not exist. We can predict the reason for each question that we stated in the previous step. You will find that as you gain experience in testing and debugging, that you will recognize patterns and find that your hypotheses become more refined.
Fix and Test The prediction is a formal way to put a hypothesis to a test. If you have carefully designed your hypothesis to be sure it can be proven wrong, then you know precisely what to predict. Here you carry out your changes to the code or data structures and compare the results with the expectations. You need to select one of the hypotheses to test. It
is important to construct a test so that it only tests a single hypothesis. Changing more than one constant at a time can make it difficult to prove that the one change was indeed the correct fix to the problem.
Following our example again, based on our experience developing the component, we decide to test the structure change hypothesis. Why did we pick this? Because we overheard at the water cooler 10 minutes earlier that one of our teammates was changing views related to this troubled form. This is where our experience and our observations come into play. We want to test the most obvious and practical solutions first. So we look at the ControlSource, and check the view to see if the column exists. We make the appropriate change (either add the column back in, or remove the object from the form). We run the form to see if the results are different or the same.
Evaluate Results How do you evaluate the results? You know what was wrong, and you understand what is expected and correct. As good developers you will try to repeat (replicate) the test several times to avoid the chance of another error occurring. At this point we need to make sure the testing produces the expected results. The testing must meet the requirements. You may also test other test cases involved with the object, component, module, etc.
Following our example, you want to make sure that you observe that the error message is not displayed and that the object is indeed bound to the correct column of data in the cursor. Further tests should also prove that this data changes, and is saved correctly to prove it is bound properly.
Decision Now that the test is completed you need to determine if it was a success or failure. If it was a success you have finished the test and the scientific method is once again proven reliable and effective. If the test is not successful we need to loop back to the hypothesis/prediction and pick a new one to fix and test. This iterative process can go on for as many questions as you have posed, predicted why, attempted a fix, and retested. What happens if you run out of questions or possibilities? Naturally you need to come up with more, or ask a colleague to assist you in this process. Watch others use this methodology of testing and debugging to learn from their experience.
In our example we have to decide if the structure change was indeed the problem. If the error message is still displaying you have to loop back and check if you correctly changed the ControlSource to the proper column, or once again made a typo, or did not add the column back to the view correctly. If it did work you are in good shape and can move on to the next test case or round of testing.
Testing vs. Debugging Testing proves that requirements were met or not met. The next step is to discover why the software was defective. Debugging can be boiled down to two simple words: problem solving. Some developers are good at it, and some developers are not so good at it. What is the difference between the two? Experience and approach.
The debugging process is performed during the construction phase, and after defects are found in unit testing, integration testing, system testing, and user acceptance testing. It is an important part of our jobs as software developers. Defects are discovered and it is our job to find out why this is and determine how it can be corrected.
Experience is an advantage because we can recognize patterns of problems we have solved previously. You learn over time that if a view is not updating correctly that the SendUpdates property could be set to false, that a data conflict could be happening during the TABLEUPDATE(),you did not provide data for a required field, you violated a primary or candidate key with duplication, and so on. Your experience with problems will also dictate what you think are the most common causes for repeat problems. Knowing the common causes of these problems will lead us to solutions faster. Experience will allow you to solve your own problems faster and maybe even more importantly, be able to solve problems introduced by other developers (from our team, or from a previous developer on a project you joined midstream). The more experience you have developing software will also provide numerous opportunities to solve new problems and see different types of defects, adding to the recognized defect patterns.
There are many approaches to determining the problem and figuring out the solution. The two most common are the shotgun and the scientific method. The shotgun approach is a random way if implementing various code fixes without any rhyme or reason to see if you get lucky and find the solution. You see this approach with less experienced developers. This approach usually takes more time and if a solution is implemented, it is hard to determine what actually resolved the defect, and to learn from the original mistake. The scientific approach gives us a basis to observe the problem, formulate questions, predict why it is happening, attempt to fix the problem, and verify
it is fixed. This approach is definitely proven to work, requires a formal approach, and produces the additional benefit of learning from the mistakes made. The additional experience also hones our debugging skills so problems can be solved faster the next time the pattern is recognized.
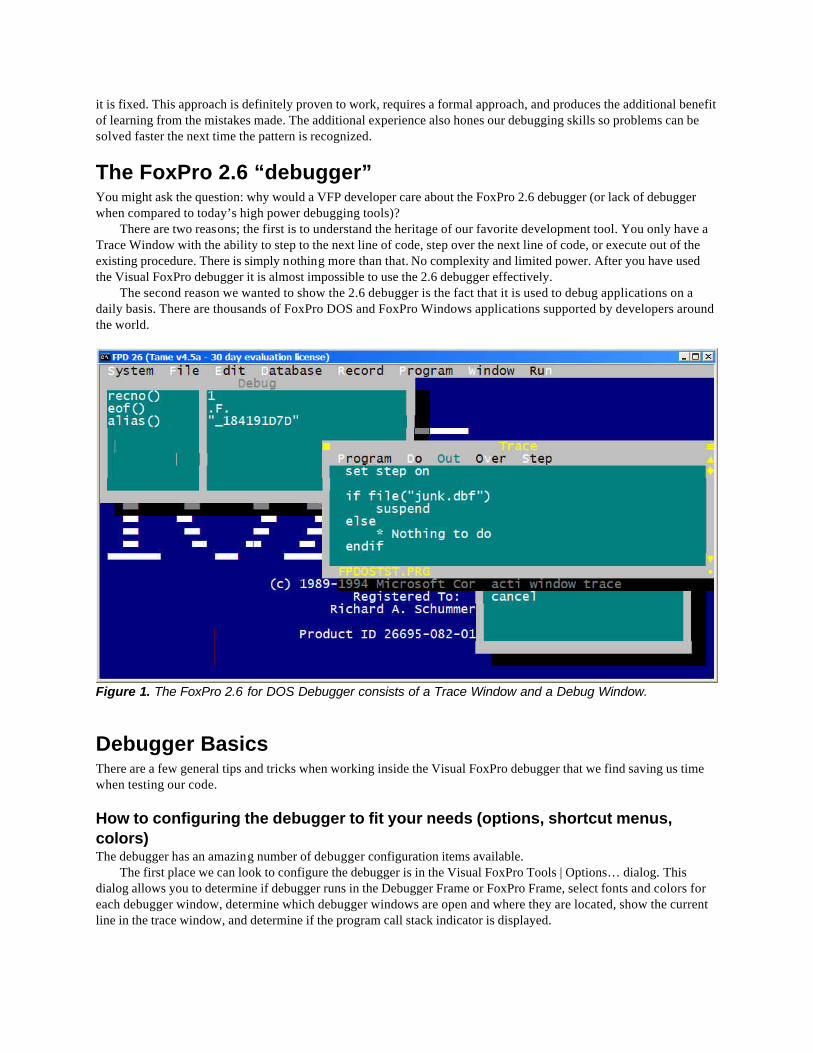
The FoxPro 2.6 “debugger” You might ask the question: why would a VFP developer care about the FoxPro 2.6 debugger (or lack of debugger when compared to today’s high power debugging tools)?
There are two reasons; the first is to understand the heritage of our favorite development tool. You only have a Trace Window with the ability to step to the next line of code, step over the next line of code, or execute out of the existing procedure. There is simply nothing more than that. No complexity and limited power. After you have used the Visual FoxPro debugger it is almost impossible to use the 2.6 debugger effectively.
The second reason we wanted to show the 2.6 debugger is the fact that it is used to debug applications on a daily basis. There are thousands of FoxPro DOS and FoxPro Windows applications supported by developers around the world.
Figure 1. The FoxPro 2.6 for DOS Debugger consists of a Trace Window and a Debug Window.
Debugger Basics There are a few general tips and tricks when working inside the Visual FoxPro debugger that we find saving us time when testing our code.
How to configuring the debugger to fit your needs (options, shortcut menus, colors) The debugger has an amazing number of debugger configuration items available.
The first place we can look to configure the debugger is in the Visual FoxPro Tools | Options… dialog. This dialog allows you to determine if debugger runs in the Debugger Frame or FoxPro Frame, select fonts and colors for each debugger window, determine which debugger windows are open and where they are located, show the current line in the trace window, and determine if the program call stack indicator is displayed.
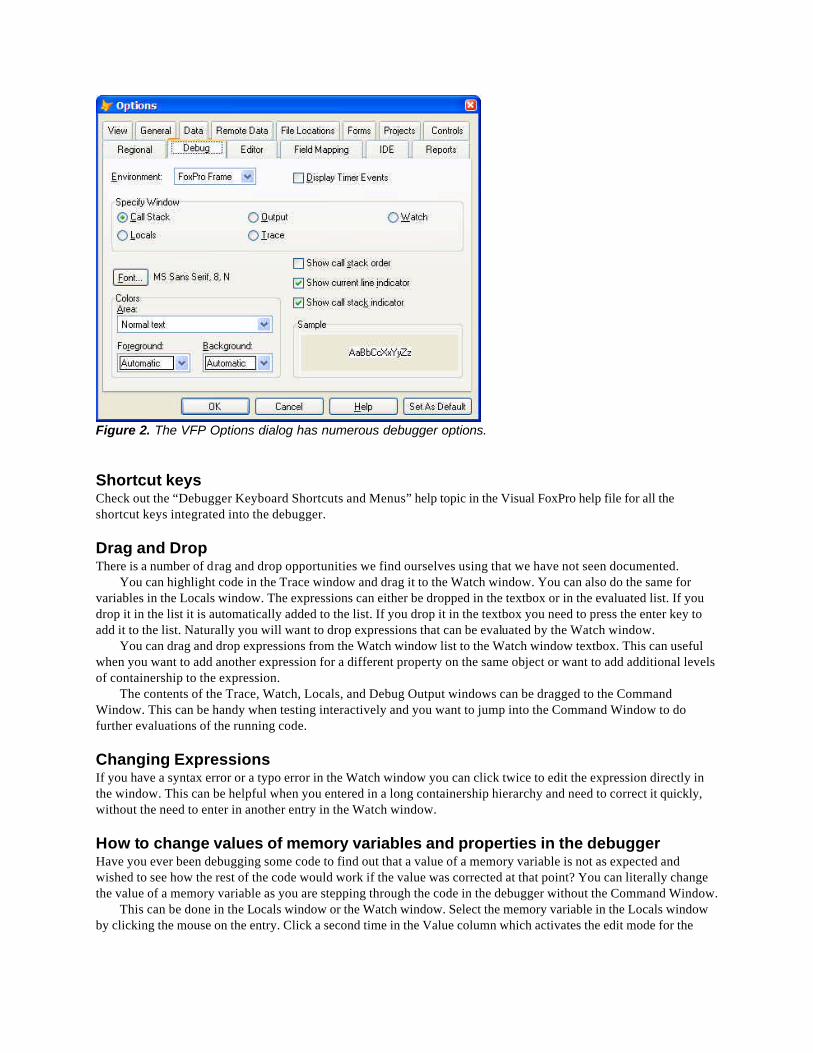
Figure 2. The VFP Options dialog has numerous debugger options.
Shortcut keys Check out the “Debugger Keyboard Shortcuts and Menus” help topic in the Visual FoxPro help file for all the shortcut keys integrated into the debugger.
Drag and Drop There is a number of drag and drop opportunities we find ourselves using that we have not seen documented.
You can highlight code in the Trace window and drag it to the Watch window. You can also do the same for variables in the Locals window. The expressions can either be dropped in the textbox or in the evaluated list. If you drop it in the list it is automatically added to the list. If you drop it in the textbox you need to press the enter key to add it to the list. Naturally you will want to drop expressions that can be evaluated by the Watch window.
You can drag and drop expressions from the Watch window list to the Watch window textbox. This can useful when you want to add another expression for a different property on the same object or want to add additional levels of containership to the expression.
The contents of the Trace, Watch, Locals, and Debug Output windows can be dragged to the Command Window. This can be handy when testing interactively and you want to jump into the Command Window to do further evaluations of the running code.
Changing Expressions If you have a syntax error or a typo error in the Watch window you can click twice to edit the expression directly in the window. This can be helpful when you entered in a long containership hierarchy and need to correct it quickly, without the need to enter in another entry in the Watch window.
How to change values of memory variables and properties in the debugger Have you ever been debugging some code to find out that a value of a memory variable is not as expected and wished to see how the rest of the code would work if the value was corrected at that point? You can literally change the value of a memory variable as you are stepping through the code in the debugger without the Command Window.
This can be done in the Locals window or the Watch window. Select the memory variable in the Locals window by clicking the mouse on the entry. Click a second time in the Value column which activates the edit mode for the
value. Enter in the value you want the memory variable to be and move off the entry via the tab key, enter key, or via a mouse click on another item in the debugger.
Now stepping through the code will use the new value and you will be able to evaluate how well the code is working when expected values are used.
How to get quick access to the property values of a specific object We know this is an old tip from as far back as 1995, but we have had a few new developers cross our paths since then and see some value in repeating the tip once more. The SYS(1270) function gets an object reference to the object directly beneath the mouse pointer. We set up a couple of hotkeys to get the object reference:
ON KEY LABEL F8 ox = SYS(1270) ON KEY LABEL F7 RELEASE ox
Now you have a reference to look at in the Locals window, DEBUGOUT, display in a WAIT WINDOW, or even print to the Visual FoxPro desktop. In the debugger you can drill down to look at specific public properties. From the Command Window you can display the property settings as well as call the object’s public methods. Make sure to release the object, otherwise the object will not be able to be destroyed.
How to set the debugger configuration to factory settings (Example: CLEARDEBUGGERSETTINGS.PRG) There are many settings and customization capabilities for the debugger in Visual FoxPro for developers to adjust. Every once and a while you might want to just get back to the basics. This can be accomplished with one command:
CLEAR DEBUG
This command clears all breakpoints, restores the Debugger windows (Trace, Locals, Call Stack, Watch and Output) to their default positions, clears the expressions in the Watch window, and clears the Output Window. This works in the debugger frame or the FoxPro frame.
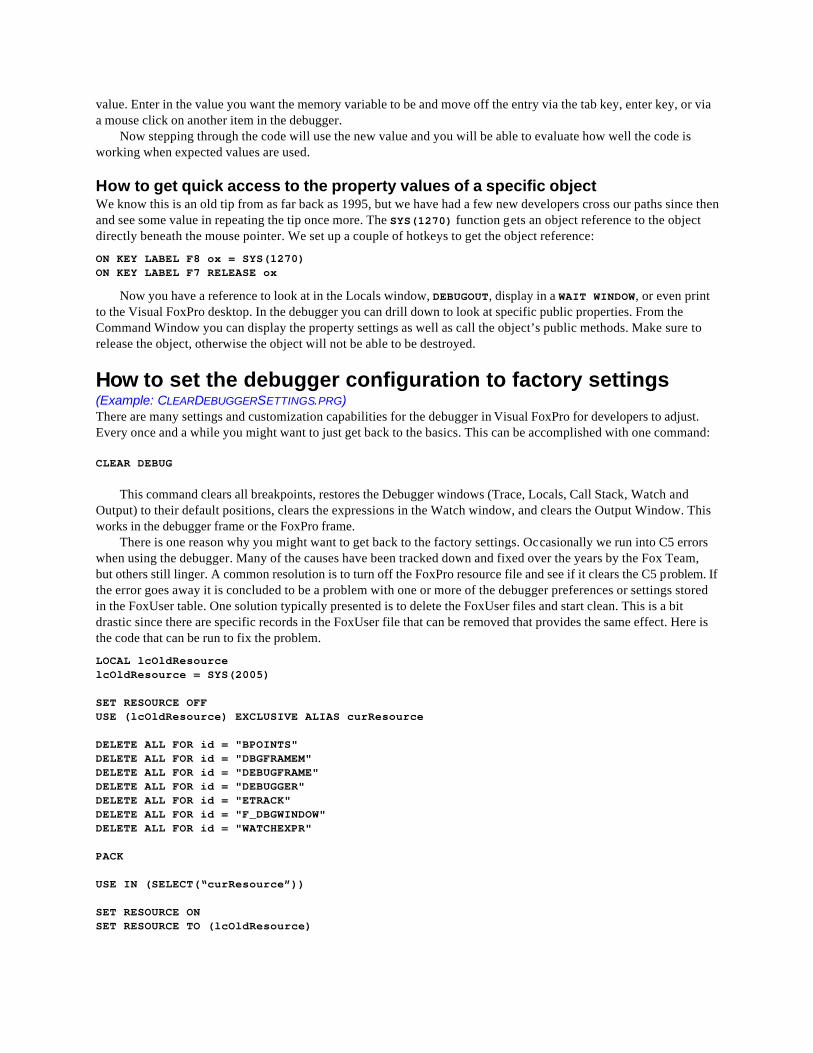
There is one reason why you might want to get back to the factory settings. Occasionally we run into C5 errors when using the debugger. Many of the causes have been tracked down and fixed over the years by the Fox Team, but others still linger. A common resolution is to turn off the FoxPro resource file and see if it clears the C5 problem. If the error goes away it is concluded to be a problem with one or more of the debugger preferences or settings stored in the FoxUser table. One solution typically presented is to delete the FoxUser files and start clean. This is a bit drastic since there are specific records in the FoxUser file that can be removed that provides the same effect. Here is the code that can be run to fix the problem.
LOCAL lcOldResource lcOldResource = SYS(2005) SET RESOURCE OFF USE (lcOldResource) EXCLUSIVE ALIAS curResource DELETE ALL FOR id = "BPOINTS" DELETE ALL FOR id = "DBGFRAMEM" DELETE ALL FOR id = "DEBUGFRAME" DELETE ALL FOR id = "DEBUGGER" DELETE ALL FOR id = "ETRACK" DELETE ALL FOR id = "F_DBGWINDOW" DELETE ALL FOR id = "WATCHEXPR" PACK USE IN (SELECT(“curResource”)) SET RESOURCE ON SET RESOURCE TO (lcOldResource)
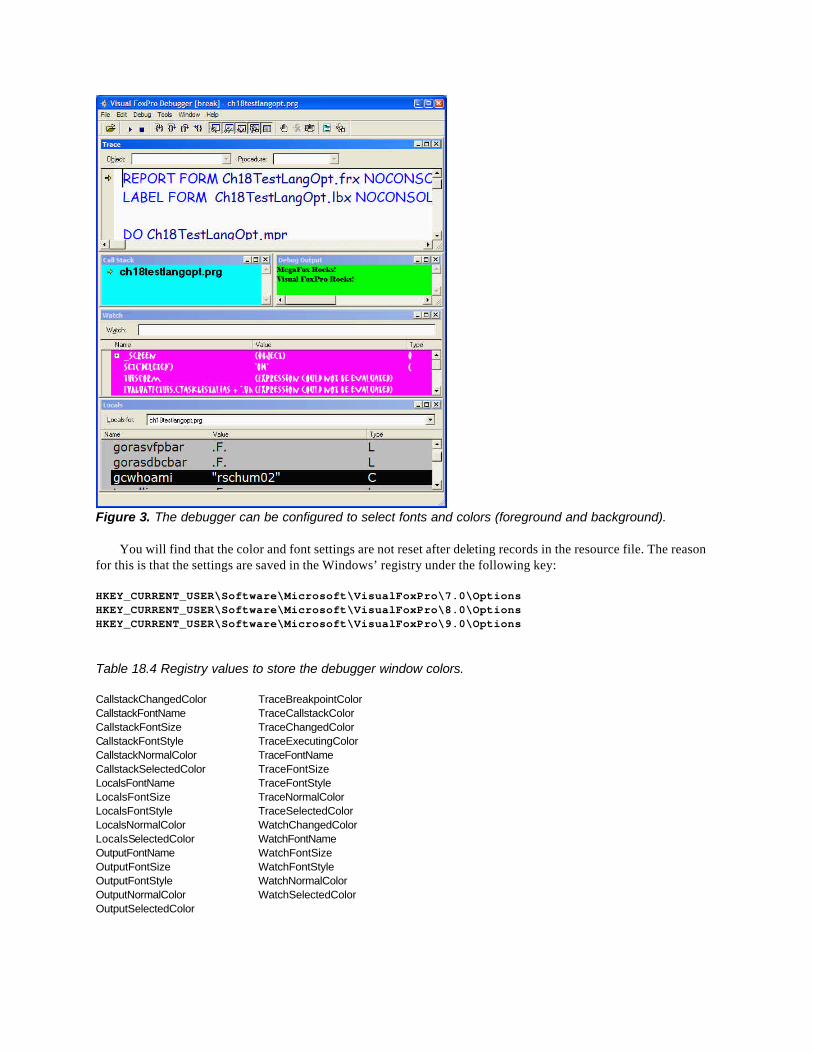
Figure 3. The debugger can be configured to select fonts and colors (foreground and background).
You will find that the color and font settings are not reset after deleting records in the resource file. The reason for this is that the settings are saved in the Windows’ registry under the following key:
HKEY_CURRENT_USER\Software\Microsoft\VisualFoxPro\7.0\Options HKEY_CURRENT_USER\Software\Microsoft\VisualFoxPro\8.0\Options HKEY_CURRENT_USER\Software\Microsoft\VisualFoxPro\9.0\Options
Table 18.4 Registry values to store the debugger window colors.
CallstackChangedColor TraceBreakpointColor CallstackFontName TraceCallstackColor CallstackFontSize TraceChangedColor CallstackFontStyle TraceExecutingColor CallstackNormalColor TraceFontName CallstackSelectedColor TraceFontSize LocalsFontName TraceFontStyle LocalsFontSize TraceNormalColor LocalsFontStyle TraceSelectedColor LocalsNormalColor WatchChangedColor LocalsSelectedColor WatchFontName OutputFontName WatchFontSize OutputFontSize WatchFontStyle OutputFontStyle WatchNormalColor OutputNormalColor WatchSelectedColor OutputSelectedColor
The color settings are not exactly straight-forward since they are comma-delimited lists of non-standard RGB() sequences (first three are the foreground color and last three are the background color), followed by the determination of the foreground and background colors and whether they are automatic or not automatic (specified by the RGB selection). The font attributes (name, size, style) can be easily handled programmatically via a registry class like the one shipped with Visual FoxPro as part of the Fox Foundation Classes. The font style is set to zero for normal, one for bold, two for italic, and three for bold and italic.
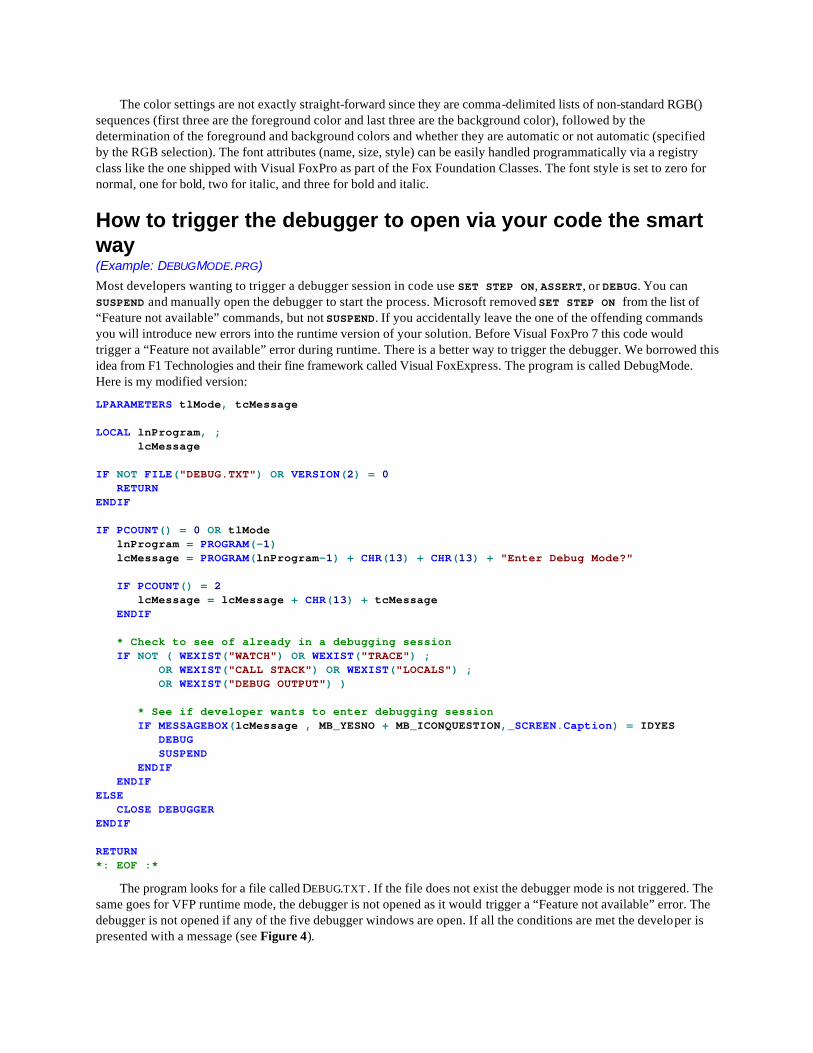
How to trigger the debugger to open via your code the smart way (Example: DEBUGMODE.PRG) Most developers wanting to trigger a debugger session in code use SET STEP ON, ASSERT, or DEBUG. You can SUSPEND and manually open the debugger to start the process. Microsoft removed SET STEP ON from the list of “Feature not available” commands, but not SUSPEND. If you accidentally leave the one of the offending commands you will introduce new errors into the runtime version of your solution. Before Visual FoxPro 7 this code would trigger a “Feature not available” error during runtime. There is a better way to trigger the debugger. We borrowed this idea from F1 Technologies and their fine framework called Visual FoxExpress. The program is called DebugMode. Here is my modified version:
LPARAMETERS tlMode, tcMessage LOCAL lnProgram, ; lcMessage IF NOT FILE("DEBUG.TXT") OR VERSION(2) = 0 RETURN ENDIF IF PCOUNT() = 0 OR tlMode lnProgram = PROGRAM(-1) lcMessage = PROGRAM(lnProgram-1) + CHR(13) + CHR(13) + "Enter Debug Mode?" IF PCOUNT() = 2 lcMessage = lcMessage + CHR(13) + tcMessage ENDIF * Check to see of already in a debugging session IF NOT ( WEXIST("WATCH") OR WEXIST("TRACE") ; OR WEXIST("CALL STACK") OR WEXIST("LOCALS") ; OR WEXIST("DEBUG OUTPUT") ) * See if developer wants to enter debugging session IF MESSAGEBOX(lcMessage , MB_YESNO + MB_ICONQUESTION,_SCREEN.Caption) = IDYES DEBUG SUSPEND ENDIF ENDIF ELSE CLOSE DEBUGGER ENDIF RETURN *: EOF :*
The program looks for a file called DEBUG.TXT . If the file does not exist the debugger mode is not triggered. The same goes for VFP runtime mode, the debugger is not opened as it would trigger a “Feature not available” error. The debugger is not opened if any of the five debugger windows are open. If all the conditions are met the developer is presented with a message (see Figure 4).
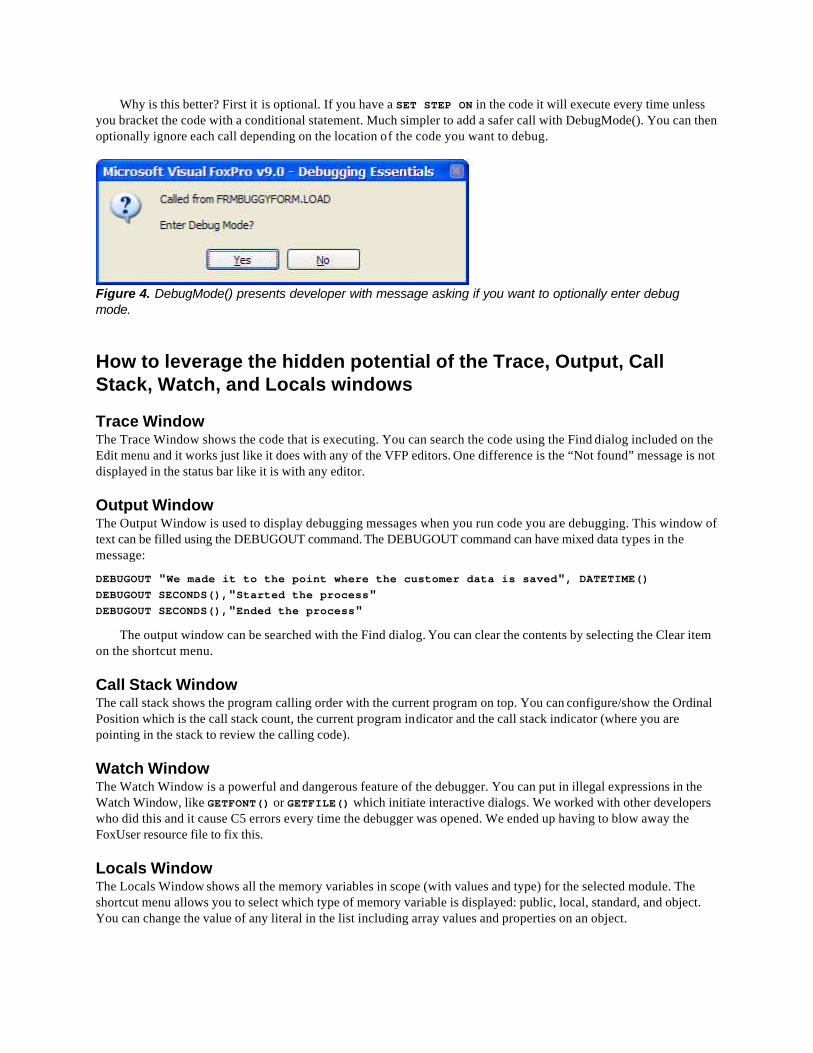
Why is this better? First it is optional. If you have a SET STEP ON in the code it will execute every time unless you bracket the code with a conditional statement. Much simpler to add a safer call with DebugMode(). You can then optionally ignore each call depending on the location of the code you want to debug.
Figure 4. DebugMode() presents developer with message asking if you want to optionally enter debug mode.
How to leverage the hidden potential of the Trace, Output, Call Stack, Watch, and Locals windows
Trace Window The Trace Window shows the code that is executing. You can search the code using the Find dialog included on the Edit menu and it works just like it does with any of the VFP editors. One difference is the “Not found” message is not displayed in the status bar like it is with any editor.
Output Window The Output Window is used to display debugging messages when you run code you are debugging. This window of text can be filled using the DEBUGOUT command. The DEBUGOUT command can have mixed data types in the message:
DEBUGOUT "We made it to the point where the customer data is saved", DATETIME() DEBUGOUT SECONDS(),"Started the process" DEBUGOUT SECONDS(),"Ended the process"
The output window can be searched with the Find dialog. You can clear the contents by selecting the Clear item on the shortcut menu.
Call Stack Window The call stack shows the program calling order with the current program on top. You can configure/show the Ordinal Position which is the call stack count, the current program indicator and the call stack indicator (where you are pointing in the stack to review the calling code).
Watch Window The Watch Window is a powerful and dangerous feature of the debugger. You can put in illegal expressions in the Watch Window, like GETFONT() or GETFILE() which initiate interactive dialogs. We worked with other developers who did this and it cause C5 errors every time the debugger was opened. We ended up having to blow away the FoxUser resource file to fix this.
Locals Window The Locals Window shows all the memory variables in scope (with values and type) for the selected module. The shortcut menu allows you to select which type of memory variable is displayed: public, local, standard, and object. You can change the value of any literal in the list including array values and properties on an object.
How to save and restore debugger configuration settings (Example: DEBUGGERCONFIGSAVED.DBG) A Visual FoxPro developer can go through a lot of work configuring the debugger with the settings for the watch window, developing the exact breakpoints needed for an application or module, and selecting certain events to be tracked. The settings can change depending on the application or a specific module in an application. We can delete expressions from the watch window and enter in new ones as we test various modules, we can toggle breakpoints in use and not in use, and we can move events that are tracked on and off the list. Another way is to save the exact configuration for the module and later load the configuration without the need to reenter the expressions or toggle the breakpoints.
This is accomplished via the Debug frame only. Using the menu, you can select the File | Save Configuration… to create a file. The file save dialog will default to the current Visual FoxPro directory. To restore a previous configuration you use the File | Load Configuration… menu option. The file contents are stored in an ASCII text file. Here is an example:
DBGCFGVERSION=4 WATCH=_screen WATCH=set("deleted") WATCH=set("path") WATCH=thisform WATCH=curdir() WATCH=recno() WATCH=eof() WATCH=_vfp.ActiveProject BPMESSAGE=OFF BREAKPOINT BEGIN TYPE=2 CLASS= LINE=0 EXPR=EOF("curReport") DISABLED=0 EXACT=0 BREAKPOINT END BREAKPOINT BEGIN TYPE=3 CLASS= LINE=0 EXPR="MAIN"$PROGRAM() DISABLED=1 EXACT=0 BREAKPOINT END EVENTWINDOW=ON EVENTFILE= EVENTLIST BEGIN Activate, Deactivate EVENTLIST END
You can manipulate the contents safely and reload the configuration. Make backups of this file if you are worried of breaking the layout.
How to reorder the contents of the watch window without deleting and re-entering each expression (Example: DEBUGGERCONFIGSAVED.DBG and DEBUGGERCONFIGVFPSTANDARD.DBG)
There might be a time when you have numerous watch expressions in the watch window and feel the need to reorder them to a more logical grouping. You could delete and re-enter each expression in the order you prefer, or you can use the following trick to save you a whole bunch of time.
First save the debugger configuration once you have all the expressions in the watch window that you prefer. Note that you will need to be using the Debugger frame to accomplish this (see previous section on “How can I save and restore the configuration of the debugger?”
Open up the debugger configuration file with a MODIFY FILE command. This file is nothing more than a text file. Each of the watch expressions start with WATCH=, followed by the expression that is evaluated. You can sort the watch items in this file and save it. Load the configuration and the watch window will have the expressions in a new order.
Strangely enough, we decided to try to break this file by sticking WATCH= expressions throughout the file. The expressions showed up in the watch window no matter where we stuck them in the file. We do not support you doing this, just noting the observation.
How to get rid of “Source is out of date” messages The trick to getting rid of the “Source is out of date” messages is to recompile the source code that is triggering the message with the project’s Debug Info turned on. What probably has happened is that the code was last compiled with Debug Info turned off. Note that Visual FoxPro code does not get recompiled unless there is a change since the module was last recompiled, you manually recompile the code with the COMPILE command, or you recompile all files in a project by setting the Recompile All Files option on the build dialog.
How to step back in time in the Trace window (re-executing code) Visual FoxPro developers have the same luxury as someone watching a sporting event on television, instant replay. If you have ever stepped through code and did not see the problem or accidentally click on the Step Out when you meant to click on the Step In, you can step back in time using the Set Next Statement available in the Trace Window shortcut menu. If you are running in the Debug Frame you can use the Debug | Set Next Statement menu item.
One of the big situations we rerun certain code is to see how the code runs with different values for a memory variable or a property. Check out how it runs with different conditions triggered. This is also an excellent way to trigger code that is never expected to run under normal data conditions.
How to debug a complicated line of code (Example: BREAKUPBAD.PRG and BREAKUPGOOD.PRG) We have all written long complicated lines of code to enforce the business rules to meet the requirements stated by our customers. The difference between writing one line of complicated code and numerous line of code can be the difference between long, complicated debugging sessions, or a quicker solution.
The key to debugging complicated code is to break up the code into multiple lines. In the case of an IF statement where we have more than one logical condition, it might be tough to determine which conditions determine if the THEN side of the logic or why the ELSE is executed.
Listing 1. Example of IF logic that is difficult to debug. * Bazillion Conditions IF loHockey.TicketsAvailable() = .T. AND llGroupPurchase = .F. AND ; DetermineTrophy(lcSport) = "Stanley Cup" AND loHockey.cHomeTeam = "Red Wings" AND ; loHockey.cVisitingTeam = "Flyers" AND (llDrewSpeedieInDetroit = .T. OR ; llToniFeltmanInDetroit = .T. OR llMikeFeltmanInDetroit = .T.) loHockey.lPurchaseMultipleTickets = .T. ELSE loHockey.lPurchaseMultipleTickets = .F. ENDIF
The problem with this code is that you cannot easily determine which of the conditions would cause me to
purchase one ticket or multiple tickets. In the trace window all you would know is that the conditions evaluated to true or false, not which condition made me get tickets for all my hockey friends. This code might be better for debugging:
Listing 2. Example of IF logic easier to debug. * Not "best practice" code, but easier to debug IF loHockey.TicketsAvailable() = .T. AND llGroupPurchase = .F. IF DetermineTrophy(lcSport) = "Stanley Cup" IF loHockey.cHomeTeam = "Red Wings" AND loHockey.cVisitingTeam = "Flyers" IF DrewSpeedieInDetroit = .T. OR ; llToniFeltmanInDetroit = .T. OR ; llMikeFeltmanInDetroit = .T. loHockey.lPurchaseMultipleTickets = .T. ELSE loHockey.lPurchaseMultipleTickets = .F. ENDIF ELSE loHockey.lPurchaseMultipleTickets = .F. ENDIF ELSE loHockey.lPurchaseMultipleTickets = .F. ENDIF ELSE loHockey.lPurchaseMultipleTickets = .F. ENDIF
As we are stepping through the code we stop at each individual IF statement. This granular control will give you
information to make better informed changes to the code to make it work. Sometimes breaking up code is hard to do, and sometimes it produces code that violates “best practice” rules (such as too many indented IF conditions, but in the case where this happens you can put the code back with the correct logic after debugging the problem.
The sample code also demonstrates a large SQL Select statement. It is three queries UNION’ed together. The common problem is that the structures are not exact matches or one of the queries is not producing the expected results. The best way to debug this is the break out the individual queries, then merge them together with the UNION in a separate step. Evaluate the results of the individual queries and check out the structure of the different queries. You can also merge the two queries at a time to see which query is causing the non-matching structure errors.
SELECT * FROM cOutlook1 UNION ; SELECT * FROM curOutlook2 UNION ; SELECT * FROM curOutlook3 ORDER BY 6, 7 ; INTO CURSOR curOutlook4
How to set sophisticated breakpoints, not just ones that stop on a specific line of code Breakpoints are pretty straightforward if you need to stop on a specific line of code. In this case you can use the Trace window and double-click on the left margin, or right-click on the left margin of an editor and selecting Toggle Breakpoint, or double-click on the editor margin. When the code is being debugged the breakpoint will stop the execution. I will hazard a guess that this is 70% of the breakpoint usage in Visual FoxPro. Another 20% of the breakpoints stop code when a value or expression has changed. This can be set in the Watch window by double-clicking in the left margin. Both of these breakpoint types can be set up in the Breakpoint dialog, but rarely are because the interactive techniques are faster.
What about the other ten percent? These are breakpoints you typically have to set up in the Breakpoint dialog and are usually the more powerful breakpoints. With knowledge comes power. So the intent of this section is to highlight a few of the breakpoints that fall into the other ten percent.
Breakpoints at location if expression is true Earlier I noted that setting a breakpoint to stop at a location is as simple as clicking on the trace window or editor window margins. How about conditionally stopping at a location? Sure, set up a breakpoint using the option “Break
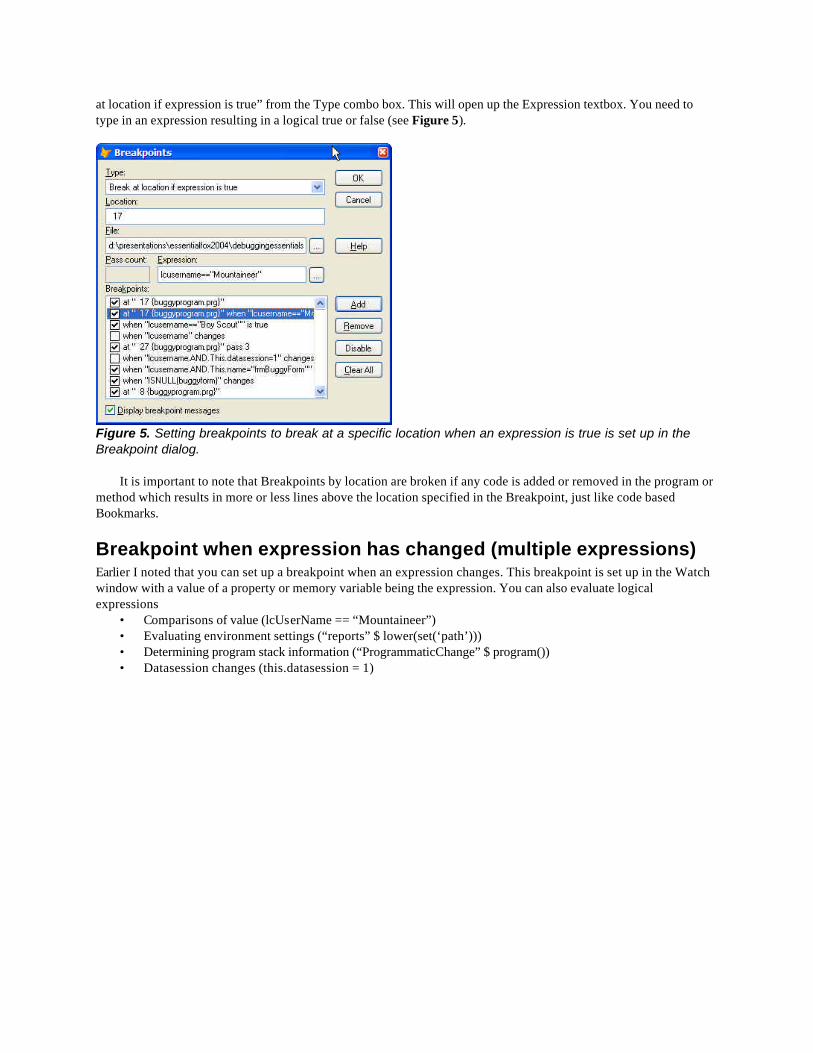
at location if expression is true” from the Type combo box. This will open up the Expression textbox. You need to type in an expression resulting in a logical true or false (see Figure 5).
Figure 5. Setting breakpoints to break at a specific location when an expression is true is set up in the Breakpoint dialog.
It is important to note that Breakpoints by location are broken if any code is added or removed in the program or method which results in more or less lines above the location specified in the Breakpoint, just like code based Bookmarks.
Breakpoint when expression has changed (multiple expressions) Earlier I noted that you can set up a breakpoint when an expression changes. This breakpoint is set up in the Watch window with a value of a property or memory variable being the expression. You can also evaluate logical expressions
• Comparisons of value (lcUserName == “Mountaineer”) • Evaluating environment settings (“reports” $ lower(set(‘path’))) • Determining program stack information (“ProgrammaticChange” $ program()) • Datasession changes (this.datasession = 1)
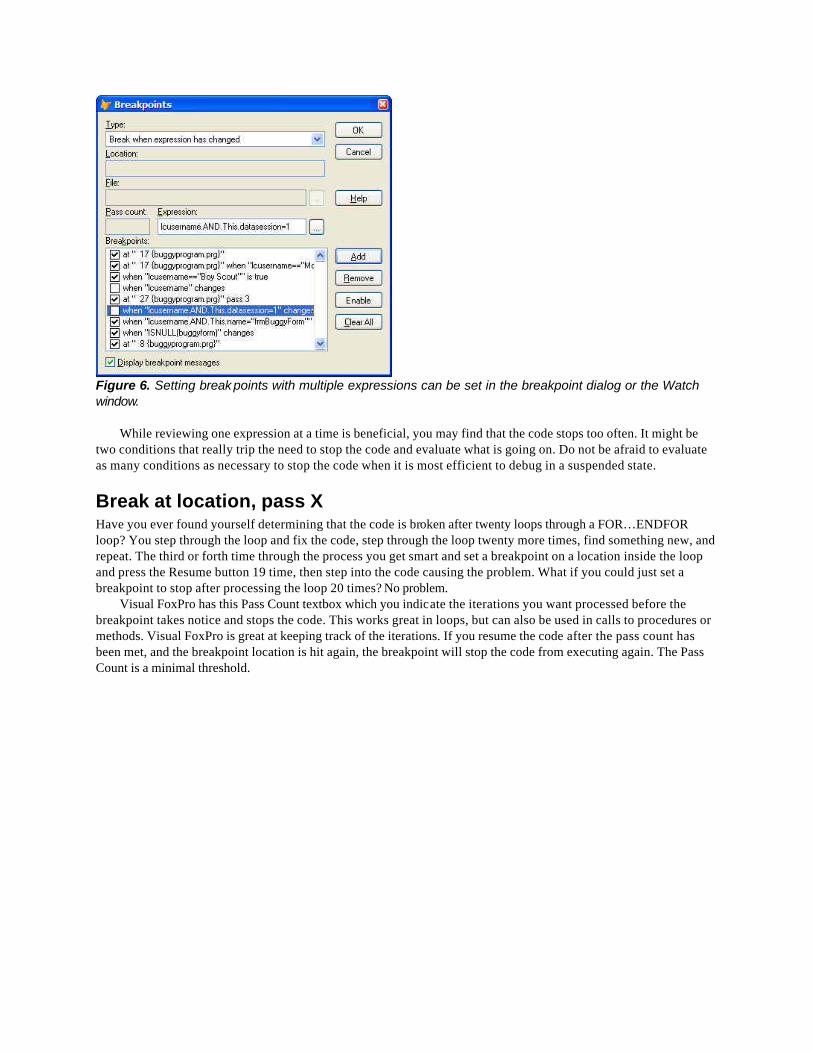
Figure 6. Setting break points with multiple expressions can be set in the breakpoint dialog or the Watch window.
While reviewing one expression at a time is beneficial, you may find that the code stops too often. It might be two conditions that really trip the need to stop the code and evaluate what is going on. Do not be afraid to evaluate as many conditions as necessary to stop the code when it is most efficient to debug in a suspended state.
Break at location, pass X Have you ever found yourself determining that the code is broken after twenty loops through a FOR…ENDFOR loop? You step through the loop and fix the code, step through the loop twenty more times, find something new, and repeat. The third or forth time through the process you get smart and set a breakpoint on a location inside the loop and press the Resume button 19 time, then step into the code causing the problem. What if you could just set a breakpoint to stop after processing the loop 20 times? No problem.
Visual FoxPro has this Pass Count textbox which you indicate the iterations you want processed before the breakpoint takes notice and stops the code. This works great in loops, but can also be used in calls to procedures or methods. Visual FoxPro is great at keeping track of the iterations. If you resume the code after the pass count has been met, and the breakpoint location is hit again, the breakpoint will stop the code from executing again. The Pass Count is a minimal threshold.
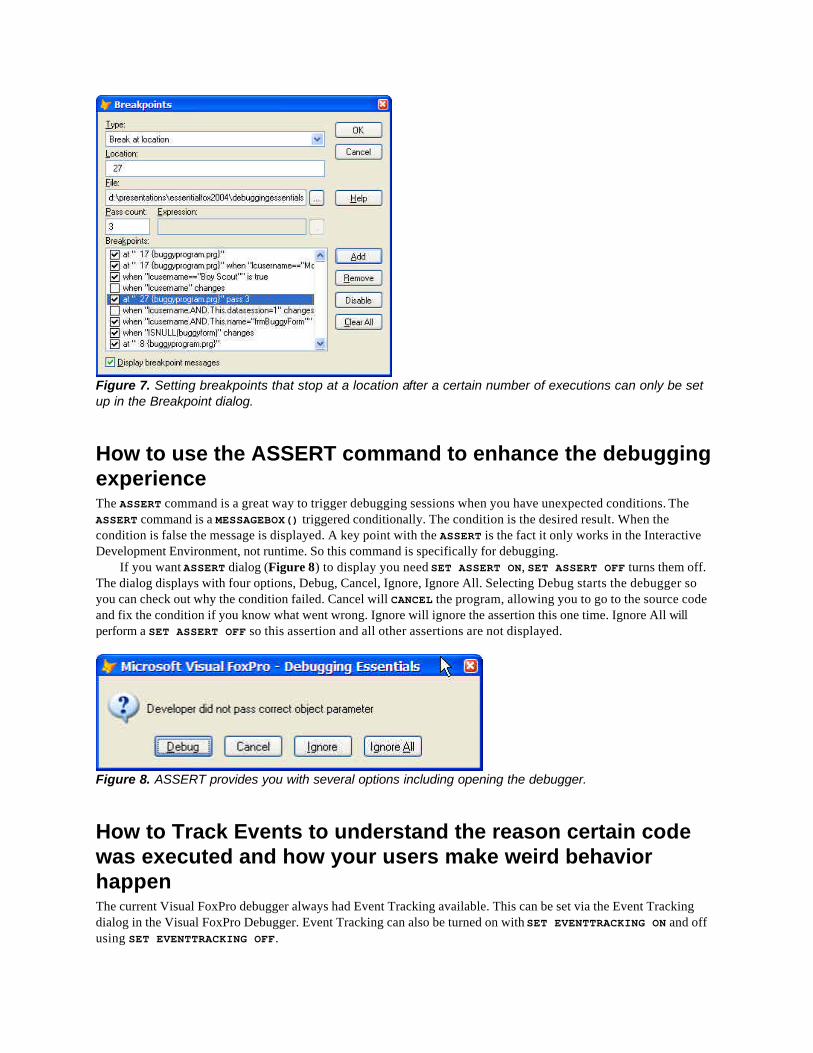
Figure 7. Setting breakpoints that stop at a location after a certain number of executions can only be set up in the Breakpoint dialog.
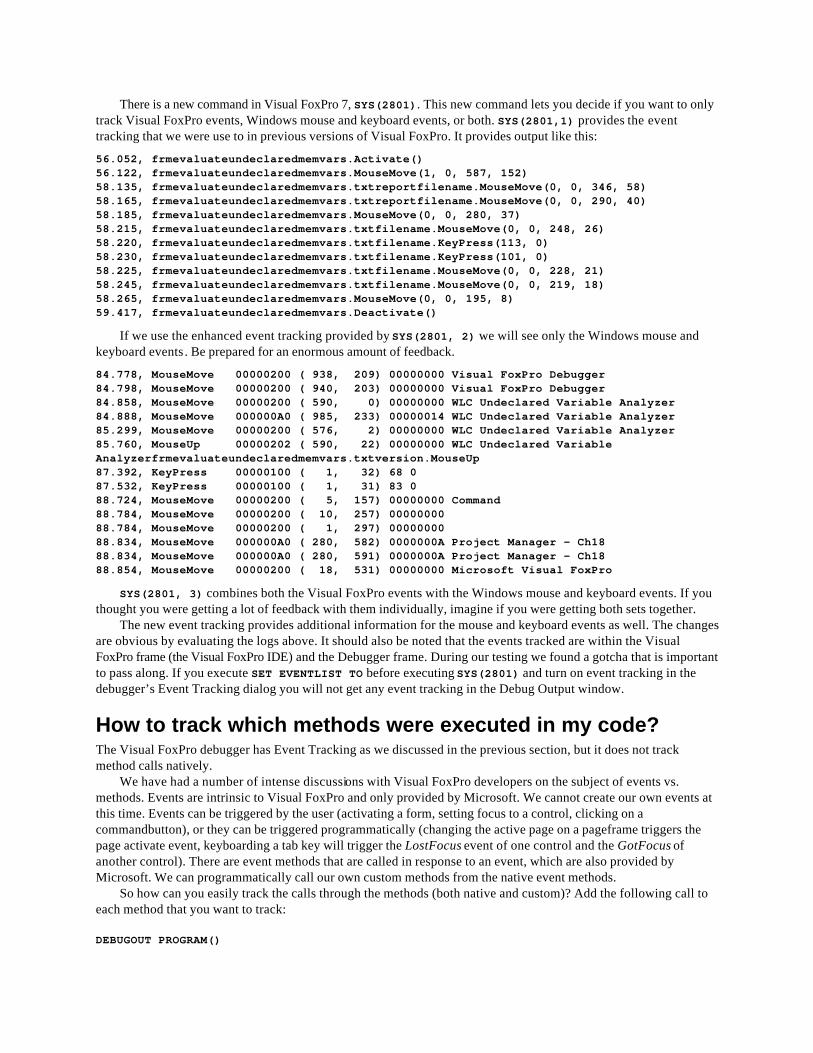
How to use the ASSERT command to enhance the debugging experience The ASSERT command is a great way to trigger debugging sessions when you have unexpected conditions. The ASSERT command is a MESSAGEBOX() triggered conditionally. The condition is the desired result. When the condition is false the message is displayed. A key point with the ASSERT is the fact it only works in the Interactive Development Environment, not runtime. So this command is specifically for debugging.
If you want ASSERT dialog (Figure 8) to display you need SET ASSERT ON, SET ASSERT OFF turns them off. The dialog displays with four options, Debug, Cancel, Ignore, Ignore All. Selecting Debug starts the debugger so you can check out why the condition failed. Cancel will CANCEL the program, allowing you to go to the source code and fix the condition if you know what went wrong. Ignore will ignore the assertion this one time. Ignore All will perform a SET ASSERT OFF so this assertion and all other assertions are not displayed.
Figure 8. ASSERT provides you with several options including opening the debugger.
How to Track Events to understand the reason certain code was executed and how your users make weird behavior happen The current Visual FoxPro debugger always had Event Tracking available. This can be set via the Event Tracking dialog in the Visual FoxPro Debugger. Event Tracking can also be turned on with SET EVENTTRACKING ON and off using SET EVENTTRACKING OFF.
There is a new command in Visual FoxPro 7, SYS(2801). This new command lets you decide if you want to only track Visual FoxPro events, Windows mouse and keyboard events, or both. SYS(2801,1) provides the event tracking that we were use to in previous versions of Visual FoxPro. It provides output like this:
56.052, frmevaluateundeclaredmemvars.Activate() 56.122, frmevaluateundeclaredmemvars.MouseMove(1, 0, 587, 152) 58.135, frmevaluateundeclaredmemvars.txtreportfilename.MouseMove(0, 0, 346, 58) 58.165, frmevaluateundeclaredmemvars.txtreportfilename.MouseMove(0, 0, 290, 40) 58.185, frmevaluateundeclaredmemvars.MouseMove(0, 0, 280, 37) 58.215, frmevaluateundeclaredmemvars.txtfilename.MouseMove(0, 0, 248, 26) 58.220, frmevaluateundeclaredmemvars.txtfilename.KeyPress(113, 0) 58.230, frmevaluateundeclaredmemvars.txtfilename.KeyPress(101, 0) 58.225, frmevaluateundeclaredmemvars.txtfilename.MouseMove(0, 0, 228, 21) 58.245, frmevaluateundeclaredmemvars.txtfilename.MouseMove(0, 0, 219, 18) 58.265, frmevaluateundeclaredmemvars.MouseMove(0, 0, 195, 8) 59.417, frmevaluateundeclaredmemvars.Deactivate()
If we use the enhanced event tracking provided by SYS(2801, 2) we will see only the Windows mouse and keyboard events . Be prepared for an enormous amount of feedback.
84.778, MouseMove 00000200 ( 938, 209) 00000000 Visual FoxPro Debugger 84.798, MouseMove 00000200 ( 940, 203) 00000000 Visual FoxPro Debugger 84.858, MouseMove 00000200 ( 590, 0) 00000000 WLC Undeclared Variable Analyzer 84.888, MouseMove 000000A0 ( 985, 233) 00000014 WLC Undeclared Variable Analyzer 85.299, MouseMove 00000200 ( 576, 2) 00000000 WLC Undeclared Variable Analyzer 85.760, MouseUp 00000202 ( 590, 22) 00000000 WLC Undeclared Variable Analyzerfrmevaluateundeclaredmemvars.txtversion.MouseUp 87.392, KeyPress 00000100 ( 1, 32) 68 0 87.532, KeyPress 00000100 ( 1, 31) 83 0 88.724, MouseMove 00000200 ( 5, 157) 00000000 Command 88.784, MouseMove 00000200 ( 10, 257) 00000000 88.784, MouseMove 00000200 ( 1, 297) 00000000 88.834, MouseMove 000000A0 ( 280, 582) 0000000A Project Manager - Ch18 88.834, MouseMove 000000A0 ( 280, 591) 0000000A Project Manager - Ch18 88.854, MouseMove 00000200 ( 18, 531) 00000000 Microsoft Visual FoxPro
SYS(2801, 3) combines both the Visual FoxPro events with the Windows mouse and keyboard events. If you thought you were getting a lot of feedback with them individually, imagine if you were getting both sets together.
The new event tracking provides additional information for the mouse and keyboard events as well. The changes are obvious by evaluating the logs above. It should also be noted that the events tracked are within the Visual FoxPro frame (the Visual FoxPro IDE) and the Debugger frame. During our testing we found a gotcha that is important to pass along. If you execute SET EVENTLIST TO before executing SYS(2801) and turn on event tracking in the debugger’s Event Tracking dialog you will not get any event tracking in the Debug Output window.
How to track which methods were executed in my code? The Visual FoxPro debugger has Event Tracking as we discussed in the previous section, but it does not track method calls natively.
We have had a number of intense discussions with Visual FoxPro developers on the subject of events vs. methods. Events are intrinsic to Visual FoxPro and only provided by Microsoft. We cannot create our own events at this time. Events can be triggered by the user (activating a form, setting focus to a control, clicking on a commandbutton), or they can be triggered programmatically (changing the active page on a pageframe triggers the page activate event, keyboarding a tab key will trigger the LostFocus event of one control and the GotFocus of another control). There are event methods that are called in response to an event, which are also provided by Microsoft. We can programmatically call our own custom methods from the native event methods.
So how can you easily track the calls through the methods (both native and custom)? Add the following call to each method that you want to track:
DEBUGOUT PROGRAM()
OR
DEBUGOUT "Progam " + PROGRAM() + ; " called by " + PROGRAM(PROGRAM(-1)-1)
You will need to make sure the Debug Output window is open when you test out the feature in the application. The reason we prefer the DEBUGOUT command instead of a MESSAGEBOX or a WAIT WINDOW is that the last two create side effects like triggering Deactivate, Activate, LostFocus, and GotFocus events. The contents of the output window can be reviewed directly or saved to a file. If you are doing some regression testing of a component it can be helpful to save the before and after files and then do a comparison of the two to see if anything has changed. You can save the file by right-clicking on the Debug Output window and using the Save As menu option or by using the command SET DEBUGOUT TO <filename>.
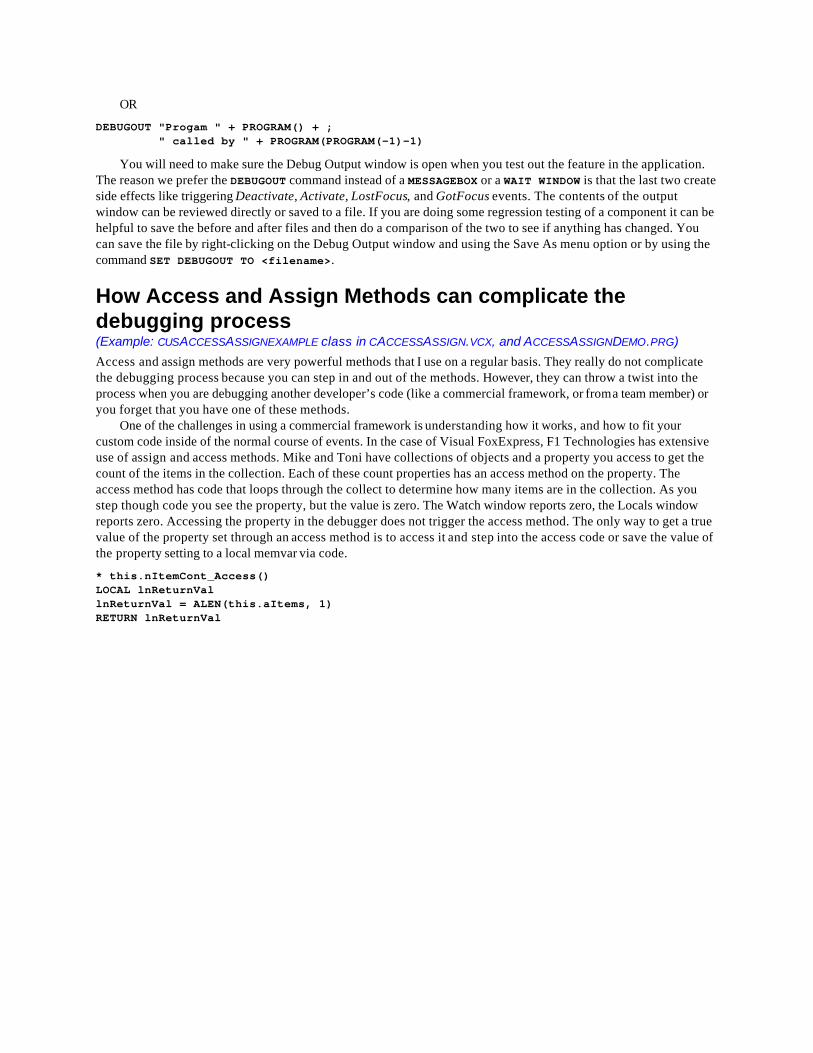
How Access and Assign Methods can complicate the debugging process (Example: CUSACCESSASSIGNEXAMPLE class in CACCESSASSIGN.VCX, and ACCESSASSIGNDEMO.PRG) Access and assign methods are very powerful methods that I use on a regular basis. They really do not complicate the debugging process because you can step in and out of the methods. However, they can throw a twist into the process when you are debugging another developer’s code (like a commercial framework, or from a team member) or you forget that you have one of these methods.
One of the challenges in using a commercial framework is understanding how it works, and how to fit your custom code inside of the normal course of events. In the case of Visual FoxExpress, F1 Technologies has extensive use of assign and access methods. Mike and Toni have collections of objects and a property you access to get the count of the items in the collection. Each of these count properties has an access method on the property. The access method has code that loops through the collect to determine how many items are in the collection. As you step though code you see the property, but the value is zero. The Watch window reports zero, the Locals window reports zero. Accessing the property in the debugger does not trigger the access method. The only way to get a true value of the property set through an access method is to access it and step into the access code or save the value of the property setting to a local memvar via code.
* this.nItemCont_Access() LOCAL lnReturnVal lnReturnVal = ALEN(this.aItems, 1) RETURN lnReturnVal
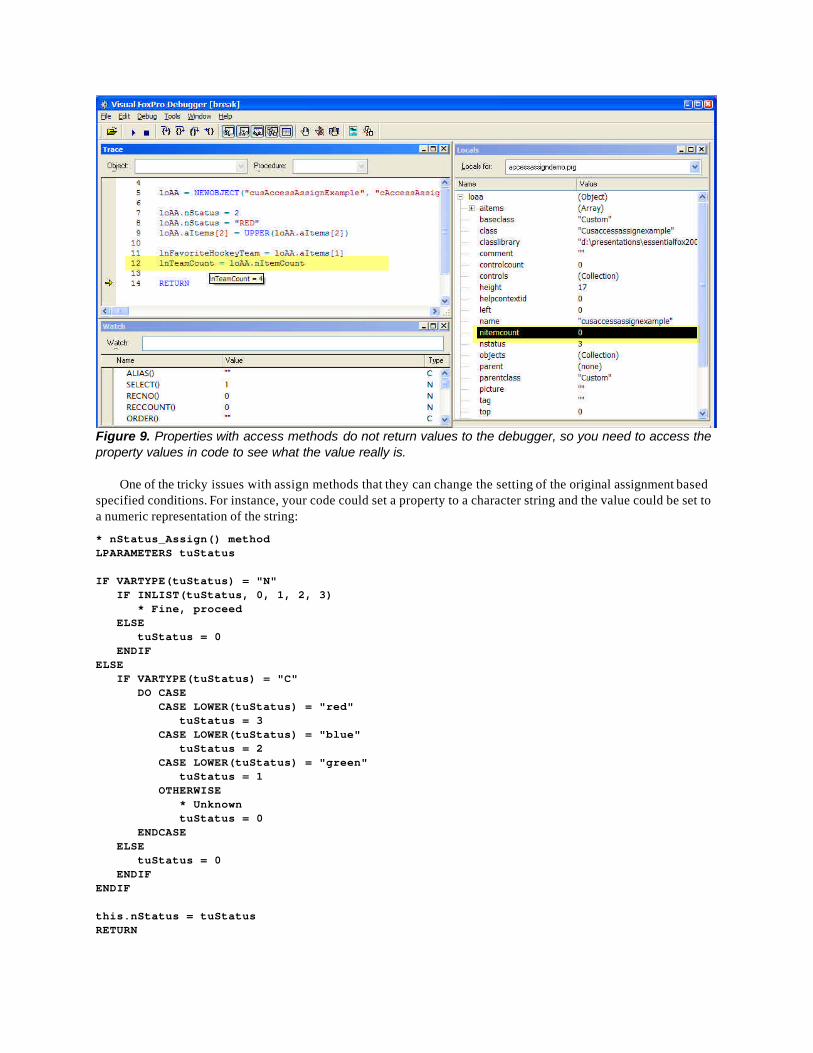
Figure 9. Properties with access methods do not return values to the debugger, so you need to access the property values in code to see what the value really is.
One of the tricky issues with assign methods that they can change the setting of the original assignment based specified conditions. For instance, your code could set a property to a character string and the value could be set to a numeric representation of the string:
* nStatus_Assign() method LPARAMETERS tuStatus IF VARTYPE(tuStatus) = "N" IF INLIST(tuStatus, 0, 1, 2, 3) * Fine, proceed ELSE tuStatus = 0 ENDIF ELSE IF VARTYPE(tuStatus) = "C" DO CASE CASE LOWER(tuStatus) = "red" tuStatus = 3 CASE LOWER(tuStatus) = "blue" tuStatus = 2 CASE LOWER(tuStatus) = "green" tuStatus = 1 OTHERWISE * Unknown tuStatus = 0 ENDCASE ELSE tuStatus = 0 ENDIF ENDIF this.nStatus = tuStatus RETURN
In this particular example your code will make the assignment with this.nStatus = “Red”, yet the property in the Watch window will say nStatus = 3. If you are unaware of the setting transformation in an assign method, you could find yourself asking the obvious question” “How the heck does this happen?” Make sure to keep in the back of your mind that the code could be altered by an assign method and the “event” could be firing without informing you.
The good news is that Visual FoxPro allows you to step into assignments and the debugger will step you through the code so you can see how the transformations happen. Over the years I have personally used Step Over more than Step into, especially working with framework code to save me time looking at all the various access and assign code that I normally do not need to look at. It is the special cases that burn me.
How BINDEVENTS() complicates the debugging process BINDEVENTS(), introduced in Visual FoxPro 8, complicates the debugging process in the same fashion as access and assign methods. Delegate code can be fired at “unexpected times.” I write unexpected, because you may not be aware that the property, event, or method could be bound by BINDEVENTS(). The same solution with regard to stepping into code applies to BINDEVENT() code. You can also use AEVENTS() to determine if the object is bound to BINDEVENTS() code.
How BINDEVENTS() helps the debugging process (Example: CUSMEMBERLOGGER class in CMEMBERLOGGER.VCX, and BINDEVENTSLOGGINGDEMO.SCX) Drew Speedie wrote an article in the June 2004 issue of FoxPro Advisor, “BINDEVENT() Simplifies PEM Logging”, that pushed me over the hump on how developers can log every method fired, not just the intrinsic event methods (as we can do with the Event Tracking in the debugger). All, without the need to write a program call in each custom method and each intrinsic event method. Drew’s logging class is based on BINDEVENT() and not only handles events and methods, but can track changes to custom and intrinsic properties. I took Drew’s example and extended it to output to the Debug Output window, text file, WAIT WINDOW, and the screen as he did.
The concept is simple: create a generic object that logs information. In this case, the logging is called via BINDEVENT() delegated code. I am not going to print the code here, but you can find all the code in the cusMemberLogger class in the cMemberLogger.vcx class library. There are two key methods that are bound via BINDEVENTS(), LogPEMBefore and LogPEMAfter. Each of these methods call the GetMemberDetails method to determine the information which is output and the LogIt method to output the information. Once the property, event, or method is bound, the code in the delegate method (LogPEMBefore and LogPEMAfter) executes and logs the execution (method or event), or the value (property).
The implementation is straightforward: instantiate the cusMemberLogger class to a memory variable or property, and bind the PEMs you want logged. There is sample code in the Load event method of the BindEventsLoggingDemo form:
IF TYPE("_screen.oMemberLogging") = "U" _screen.AddProperty("oMemberLogging", .NULL.) ENDIF IF ISNULL(_screen.oMemberLogging) _screen.oMemberLogging = NEWOBJECT("cusMemberLogger", "cMemberLogger.vcx") ENDIF IF TYPE("_screen.oMemberLogging") = "O" AND NOT ISNULL(_screen.oMemberLogging) _screen.oMemberLogging.cLogType = "_screen" * Bind Methods/Events for logging BINDEVENT(this, "Activate", _screen.oMemberLogging, "LogPEMBefore", 1) && Intrinsic Method BINDEVENT(this, "Show", _screen.oMemberLogging, "LogPEMAfter", 1) && Intrinsic Method BINDEVENT(this, "Click", _screen.oMemberLogging, "LogPEMAfter", 1) && Event BINDEVENT(this, "CustomMethod", _screen.oMemberLogging, "LogPEMAfter", 1) && Custom Method
* Bind Properties for logging BINDEVENT(this, "BufferMode", _screen.oMemberLogging, "LogPEMBefore", 0) BINDEVENT(this, "BufferMode", _screen.oMemberLogging, "LogPEMAfter", 1) BINDEVENT(this, "cCustomProperty", _screen.oMemberLogging, "LogPEMAfter", 1) ENDIF
Any time an event is triggered, a custom or intrinsic method is called, or a property is assigned, a log entry is made. I hope the impact of this capability for debugging is apparent. If you ever run into a situation where you do not understand how or when a property was changed or the sequence of events and methods that took place, this is the technique for you. It does not provide you key information like the call stack (because it is not available to the delegate code), but if you log the key PEMs it can lead you to solving your anamoly.
The drawbacks might not be obvious. BINDEVENTS() cannot be hooked to properties, events or methods that are not public in scope (hidden and protected). The VFP Help file explicitly explains that you do not want to interact BINDEVENTS() to assign methods, as they are scoped protected. This should not be a problem since you can bind the property to the logger object.
Other reasons to read Drew’s article is that he demonstrates and provides code to generically bind all the properties, events, and methods of an object so you can track it all. He also discusses the disadvantages.
How COM objects complicate the debugging process The issue with Visual FoxPro COM objects accessed outside of Visual FoxPro is that the debugger is not available. The code is running in the context of the calling application. They way I have debugged COM object is using STRTOFILE() to dump out messages I typically display in the Debug Output window. I can then open the text file to evaluate what code was run, what property and memory variable settings were made. You can also dump out LIST MEMORY and the calling stack using ASTACKINFO() along
Naturally you can test the COM object inside of Visual FoxPro using the Command Window or a program. Using this technique is a great way to find the initial anomalies. The problem is when interaction with the other applications gives different results than what you get using VFP to test it out. This happens because you miss a condition, improperly code for parameters passed by the calling application, or there is some incompatibility or bug in the calling application.
How to determine which variables in your code are accidentally scoped PRIVATE (Example: EVALUNDECLAREDVARS.SCX/SCT, CH18TESTLANGOPT.*) Visual FoxPro 7 introduced a new feature in the debugger that helps track which variables are not declared in our code. This is accomplished by setting the application object’s new property called LanguageOptions to one. This setting, combined with the execution of your program code will dump a comma-delimited string of information about undeclared variables to the debugger’s output window.
Why is tracking undeclared variables so important to a developer if Visual FoxPro does not require the declaration to run? Visual FoxPro will automatically determine that a new variable is referenced, add it to the list of variables the code is using, and scope it private. Technically it is not important unless the scope of private is a problem in your code. The example we like to use is when a method executes and automatically declares a variable with private scope and calls another method that also has the same variable undeclared (already private in scope). The called method changes the value and returns to the previous method. This side effect could be completely unexpected and lead to a long debugging session because of the confusion.
This new capability works for all code, whether in programs, class methods, form methods, report and label methods (like the dataenvironment), menus, or stored procedures. If it has code, it can be tested. This new capability does have a catch. Visual FoxPro can only determine undeclared variables in code it executes. If the code is bracketed by a condition and this condition does not exist during testing, it will not be checked.
Download!
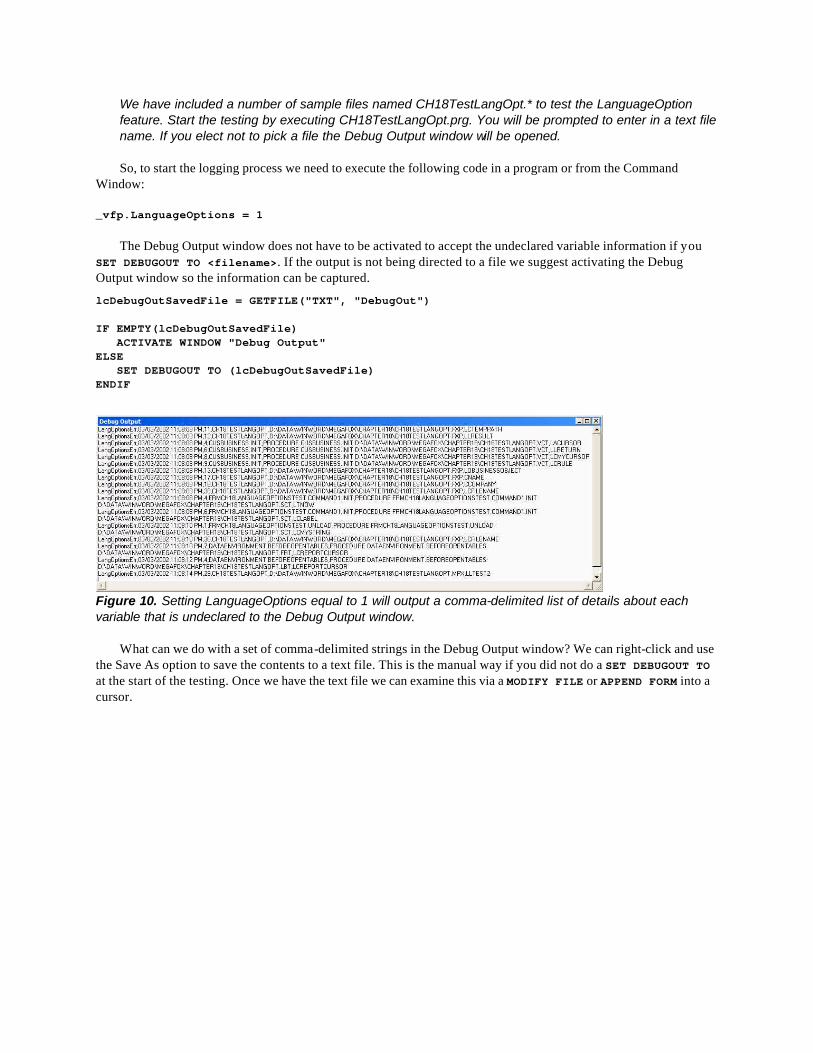
We have included a number of sample files named CH18TestLangOpt.* to test the LanguageOption feature. Start the testing by executing CH18TestLangOpt.prg. You will be prompted to enter in a text file name. If you elect not to pick a file the Debug Output window will be opened.
So, to start the logging process we need to execute the following code in a program or from the Command Window:
_vfp.LanguageOptions = 1
The Debug Output window does not have to be activated to accept the undeclared variable information if you SET DEBUGOUT TO <filename>. If the output is not being directed to a file we suggest activating the Debug Output window so the information can be captured.
lcDebugOutSavedFile = GETFILE("TXT", "DebugOut") IF EMPTY(lcDebugOutSavedFile) ACTIVATE WINDOW "Debug Output" ELSE SET DEBUGOUT TO (lcDebugOutSavedFile) ENDIF
Figure 10. Setting LanguageOptions equal to 1 will output a comma-delimited list of details about each variable that is undeclared to the Debug Output window.
What can we do with a set of comma-delimited strings in the Debug Output window? We can right-click and use the Save As option to save the contents to a text file. This is the manual way if you did not do a SET DEBUGOUT TO at the start of the testing. Once we have the text file we can examine this via a MODIFY FILE or APPEND FORM into a cursor.
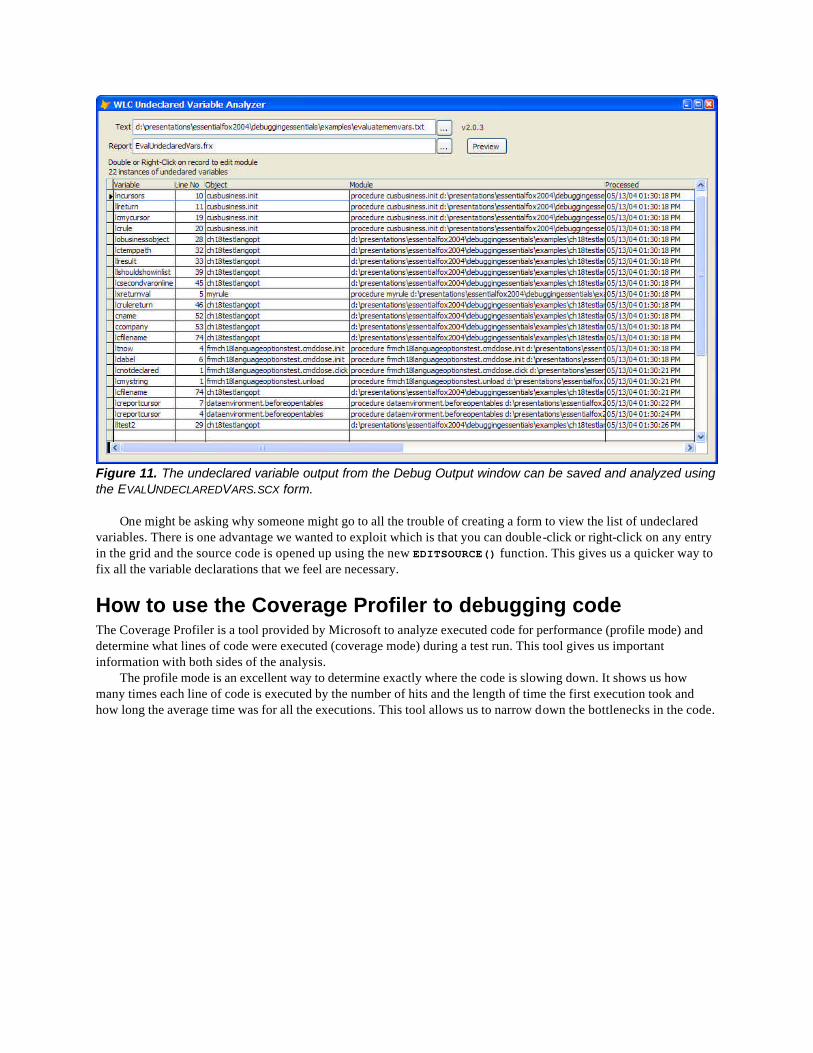
Figure 11. The undeclared variable output from the Debug Output window can be saved and analyzed using the EVALUNDECLAREDVARS.SCX form.
One might be asking why someone might go to all the trouble of creating a form to view the list of undeclared variables. There is one advantage we wanted to exploit which is that you can double-click or right-click on any entry in the grid and the source code is opened up using the new EDITSOURCE() function. This gives us a quicker way to fix all the variable declarations that we feel are necessary.
How to use the Coverage Profiler to debugging code The Coverage Profiler is a tool provided by Microsoft to analyze executed code for performance (profile mode) and determine what lines of code were executed (coverage mode) during a test run. This tool gives us important information with both sides of the analysis.
The profile mode is an excellent way to determine exactly where the code is slowing down. It shows us how many times each line of code is executed by the number of hits and the length of time the first execution took and how long the average time was for all the executions. This tool allows us to narrow down the bottlenecks in the code.
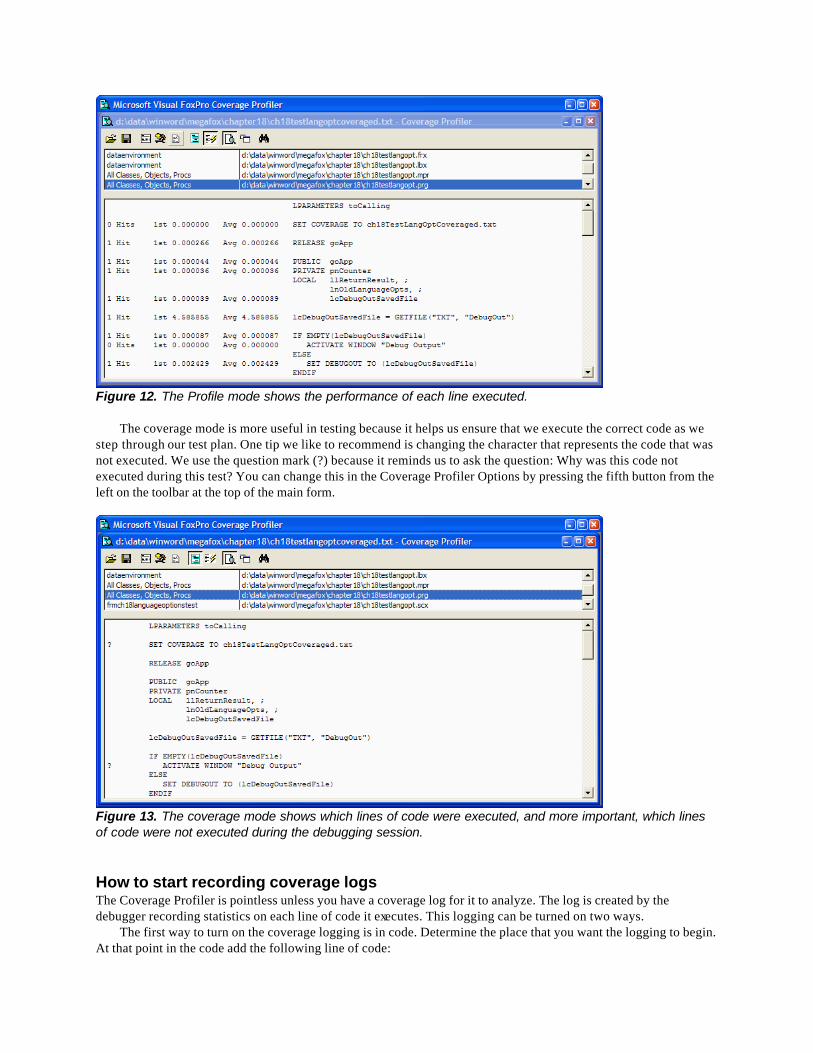
Figure 12. The Profile mode shows the performance of each line executed.
The coverage mode is more useful in testing because it helps us ensure that we execute the correct code as we step through our test plan. One tip we like to recommend is changing the character that represents the code that was not executed. We use the question mark (?) because it reminds us to ask the question: Why was this code not executed during this test? You can change this in the Coverage Profiler Options by pressing the fifth button from the left on the toolbar at the top of the main form.
Figure 13. The coverage mode shows which lines of code were executed, and more important, which lines of code were not executed during the debugging session.
How to start recording coverage logs The Coverage Profiler is pointless unless you have a coverage log for it to analyze. The log is created by the debugger recording statistics on each line of code it executes. This logging can be turned on two ways.
The first way to turn on the coverage logging is in code. Determine the place that you want the logging to begin. At that point in the code add the following line of code:
SET COVERAGE TO c:\temp\billingperformance.txt
This turns the coverage logging on as well as directs the statistics to a file with the specified name. If the file did not exist it is created. If it exists, it will be overwritten unless you use the ADDITIVE clause after the file name. At the point in the code that you want to shut off the collection of statistics enter in the following line:
SET COVERAGE TO
This turns the coverage logging off as well as closes the coverage log file. We have noticed in some versions of Visual FoxPro that the coverage log file was not always closed until a CLOSE ALL was executed. This is definitely fixed in Visual FoxPro 7.
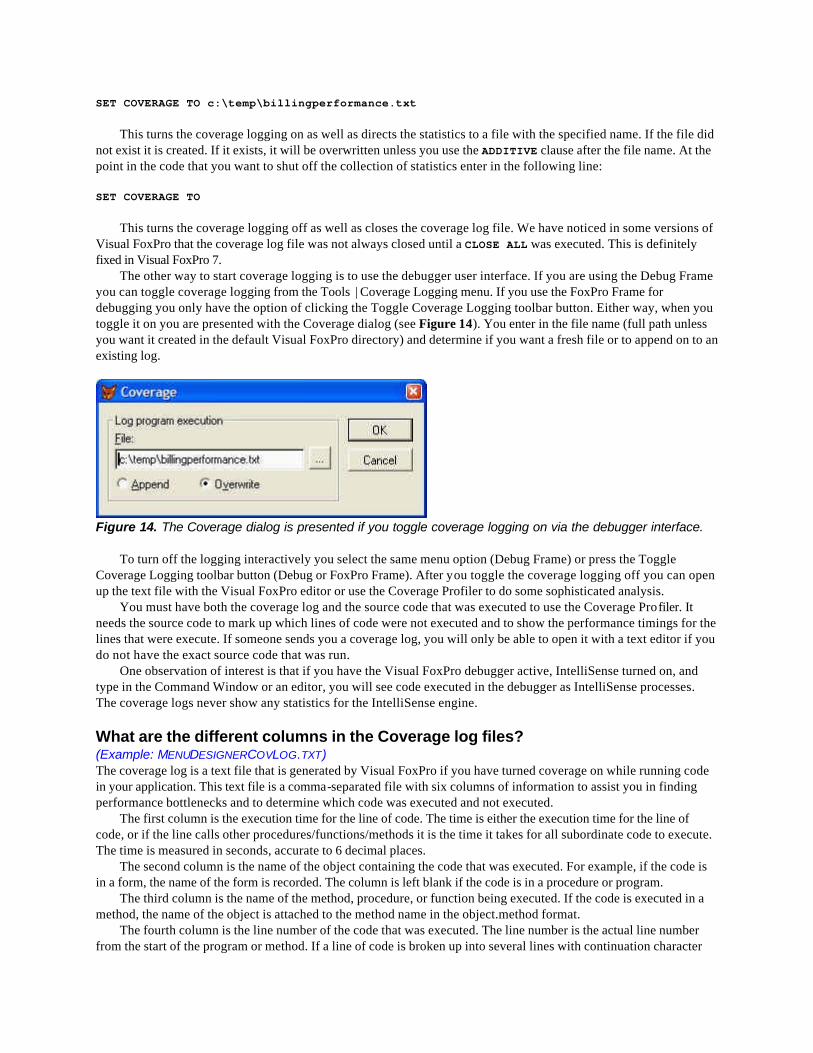
The other way to start coverage logging is to use the debugger user interface. If you are using the Debug Frame you can toggle coverage logging from the Tools | Coverage Logging menu. If you use the FoxPro Frame for debugging you only have the option of clicking the Toggle Coverage Logging toolbar button. Either way, when you toggle it on you are presented with the Coverage dialog (see Figure 14). You enter in the file name (full path unless you want it created in the default Visual FoxPro directory) and determine if you want a fresh file or to append on to an existing log.
Figure 14. The Coverage dialog is presented if you toggle coverage logging on via the debugger interface.
To turn off the logging interactively you select the same menu option (Debug Frame) or press the Toggle Coverage Logging toolbar button (Debug or FoxPro Frame). After you toggle the coverage logging off you can open up the text file with the Visual FoxPro editor or use the Coverage Profiler to do some sophisticated analysis.
You must have both the coverage log and the source code that was executed to use the Coverage Profiler. It needs the source code to mark up which lines of code were not executed and to show the performance timings for the lines that were execute. If someone sends you a coverage log, you will only be able to open it with a text editor if you do not have the exact source code that was run.
One observation of interest is that if you have the Visual FoxPro debugger active, IntelliSense turned on, and type in the Command Window or an editor, you will see code executed in the debugger as IntelliSense processes. The coverage logs never show any statistics for the IntelliSense engine.
What are the different columns in the Coverage log files? (Example: MENUDESIGNERCOVLOG.TXT) The coverage log is a text file that is generated by Visual FoxPro if you have turned coverage on while running code in your application. This text file is a comma-separated file with six columns of information to assist you in finding performance bottlenecks and to determine which code was executed and not executed.
The first column is the execution time for the line of code. The time is either the execution time for the line of code, or if the line calls other procedures/functions/methods it is the time it takes for all subordinate code to execute. The time is measured in seconds, accurate to 6 decimal places.
The second column is the name of the object containing the code that was executed. For example, if the code is in a form, the name of the form is recorded. The column is left blank if the code is in a procedure or program.
The third column is the name of the method, procedure, or function being executed. If the code is executed in a method, the name of the object is attached to the method name in the object.method format.
The fourth column is the line number of the code that was executed. The line number is the actual line number from the start of the program or method. If a line of code is broken up into several lines with continuation character
(semi-colon), it will be the last line of that code. This line number can be used to open up the editor with EDITSOURCE()
The fifth column is the fully qualified file name of the object containing the code that executed. The last column is the calling stack level for the executing code. We could not find any part of the Visual FoxPro
Coverage Profiler that does anything with this information, but it is available if you want to write an add-in that would use it to analyze the code. One idea of an add-in that would use the calling stack is to see what the deepest level of calls is in the code that was tracked in a coverage log.
How to extend the Coverage Profiler to be even better at finding the slow parts of your application (Example: CPMODULEPERFORMANCE.SCX, CPMODULEPERFORMANCEREG.PRG) The standard profiling mode of the Coverage Profile shows the performance of the individual lines of code that were executed. What if you wanted to see the combined performance numbers of all the lines of code within a method or for a module? One solution would be to pull out a calculator and add up all the lines displayed in the Coverage Profiler. The flaw with this is that the Profiler mode shows the average execution, not the actual execution speed. The more appropriate method would be to create an add-in to the Coverage Profiler that summarizes the line execution details into a nice form for the developer. This section will discuss the program that does this and also demonstrates how to register a Coverage Profiler add-in that calls a form that is displayed when the add-in is activated.
The CPMODULEPERFORMANCEREG.PRG is a program that registers the add-in and adds a toolbar button to the main Coverage Profiler form. The Coverage Profiler passes a reference of itself to the add-in; therefore you must accept a parameter in the add-in program. The majority of the code in the program is safety code. What we mean by this is that it checks to make sure it is called from the Coverage Profiler, it has not been called previously in this Coverage Profiler session, and insures that the toolbar button is instanced only once.
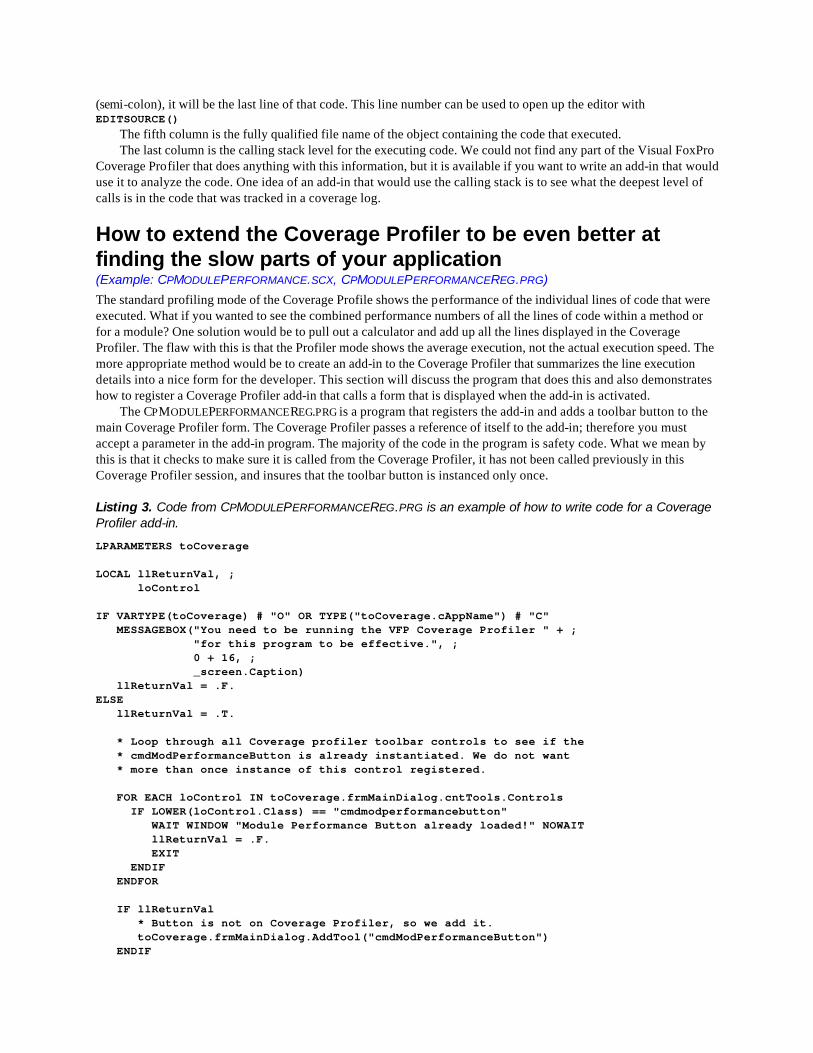
Listing 3. Code from CPMODULEPERFORMANCEREG.PRG is an example of how to write code for a Coverage Profiler add-in.
LPARAMETERS toCoverage LOCAL llReturnVal, ; loControl IF VARTYPE(toCoverage) # "O" OR TYPE("toCoverage.cAppName") # "C" MESSAGEBOX("You need to be running the VFP Coverage Profiler " + ; "for this program to be effective.", ; 0 + 16, ; _screen.Caption) llReturnVal = .F. ELSE llReturnVal = .T. * Loop through all Coverage profiler toolbar controls to see if the * cmdModPerformanceButton is already instantiated. We do not want * more than once instance of this control registered. FOR EACH loControl IN toCoverage.frmMainDialog.cntTools.Controls IF LOWER(loControl.Class) == "cmdmodperformancebutton" WAIT WINDOW "Module Performance Button already loaded!" NOWAIT llReturnVal = .F. EXIT ENDIF ENDFOR IF llReturnVal * Button is not on Coverage Profiler, so we add it. toCoverage.frmMainDialog.AddTool("cmdModPerformanceButton") ENDIF
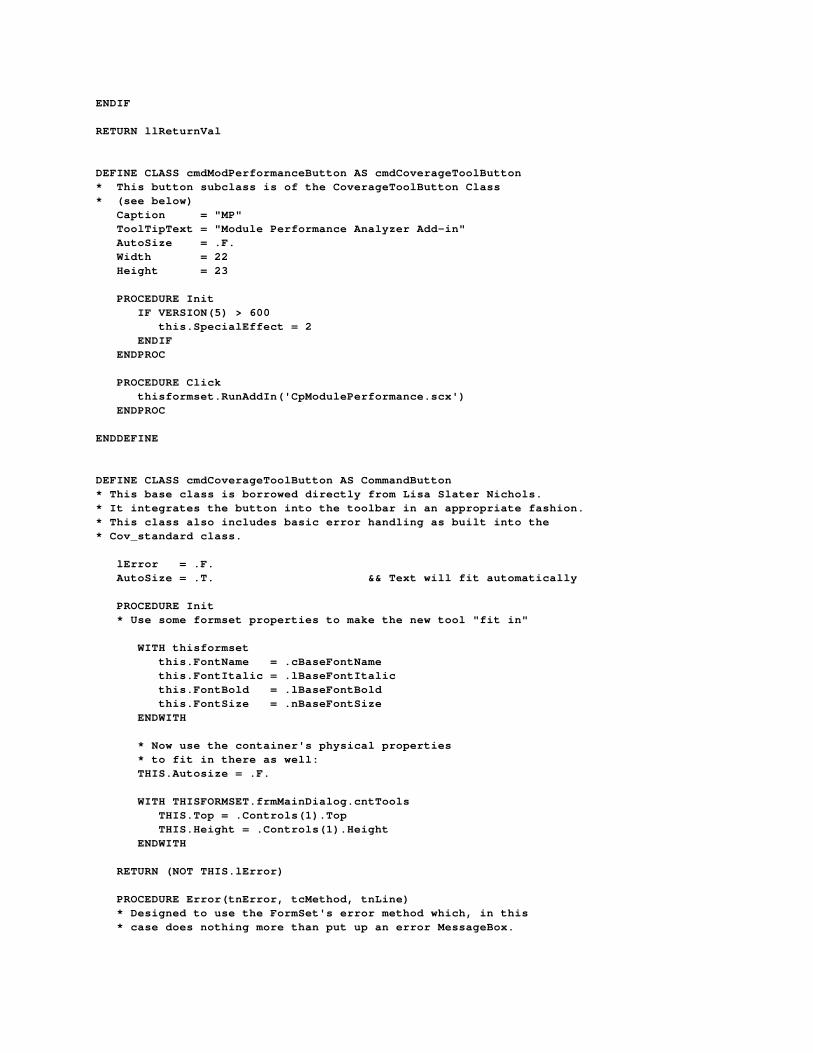
ENDIF RETURN llReturnVal DEFINE CLASS cmdModPerformanceButton AS cmdCoverageToolButton * This button subclass is of the CoverageToolButton Class * (see below) Caption = "MP" ToolTipText = "Module Performance Analyzer Add-in" AutoSize = .F. Width = 22 Height = 23 PROCEDURE Init IF VERSION(5) > 600 this.SpecialEffect = 2 ENDIF ENDPROC PROCEDURE Click thisformset.RunAddIn('CpModulePerformance.scx') ENDPROC ENDDEFINE DEFINE CLASS cmdCoverageToolButton AS CommandButton * This base class is borrowed directly from Lisa Slater Nichols. * It integrates the button into the toolbar in an appropriate fashion. * This class also includes basic error handling as built into the * Cov_standard class. lError = .F. AutoSize = .T. && Text will fit automatically PROCEDURE Init * Use some formset properties to make the new tool "fit in" WITH thisformset this.FontName = .cBaseFontName this.FontItalic = .lBaseFontItalic this.FontBold = .lBaseFontBold this.FontSize = .nBaseFontSize ENDWITH * Now use the container's physical properties * to fit in there as well: THIS.Autosize = .F. WITH THISFORMSET.frmMainDialog.cntTools THIS.Top = .Controls(1).Top THIS.Height = .Controls(1).Height ENDWITH RETURN (NOT THIS.lError) PROCEDURE Error(tnError, tcMethod, tnLine) * Designed to use the FormSet's error method which, in this * case does nothing more than put up an error MessageBox.
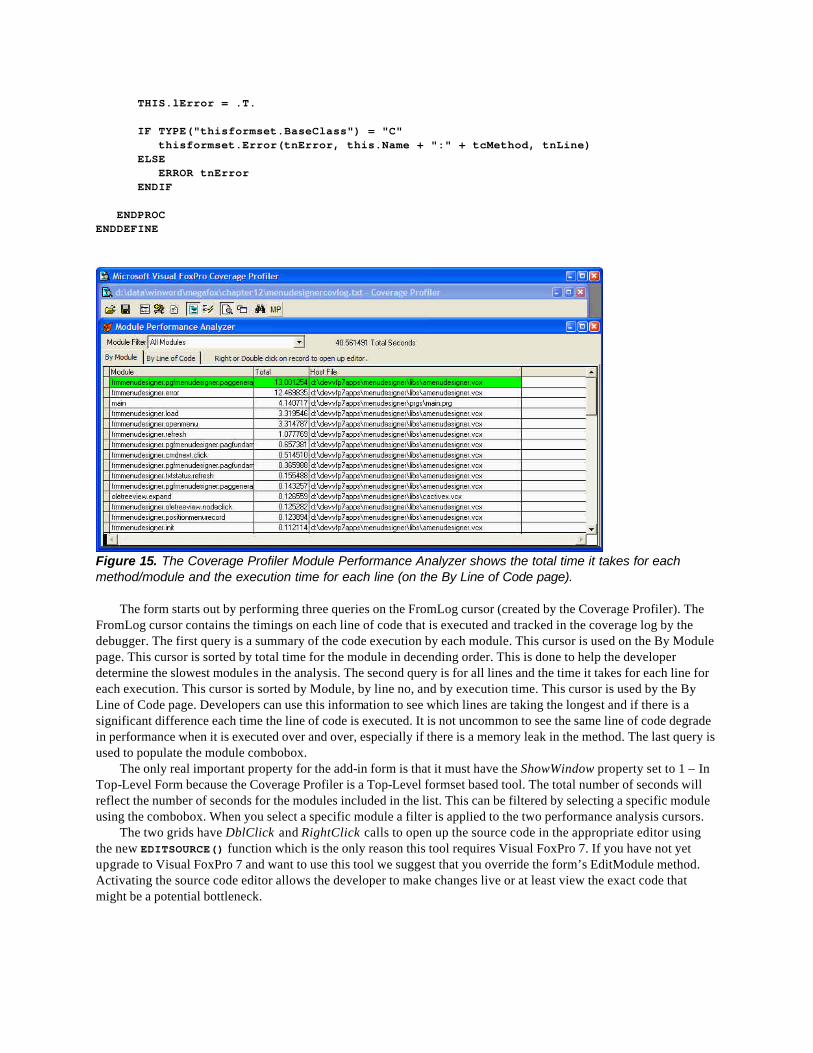
THIS.lError = .T. IF TYPE("thisformset.BaseClass") = "C" thisformset.Error(tnError, this.Name + ":" + tcMethod, tnLine) ELSE ERROR tnError ENDIF ENDPROC ENDDEFINE
Figure 15. The Coverage Profiler Module Performance Analyzer shows the total time it takes for each method/module and the execution time for each line (on the By Line of Code page).
The form starts out by performing three queries on the FromLog cursor (created by the Coverage Profiler). The FromLog cursor contains the timings on each line of code that is executed and tracked in the coverage log by the debugger. The first query is a summary of the code execution by each module. This cursor is used on the By Module page. This cursor is sorted by total time for the module in decending order. This is done to help the developer determine the slowest modules in the analysis. The second query is for all lines and the time it takes for each line for each execution. This cursor is sorted by Module, by line no, and by execution time. This cursor is used by the By Line of Code page. Developers can use this information to see which lines are taking the longest and if there is a significant difference each time the line of code is executed. It is not uncommon to see the same line of code degrade in performance when it is executed over and over, especially if there is a memory leak in the method. The last query is used to populate the module combobox.
The only real important property for the add-in form is that it must have the ShowWindow property set to 1 – In Top-Level Form because the Coverage Profiler is a Top-Level formset based tool. The total number of seconds will reflect the number of seconds for the modules included in the list. This can be filtered by selecting a specific module using the combobox. When you select a specific module a filter is applied to the two performance analysis cursors.
The two grids have DblClick and RightClick calls to open up the source code in the appropriate editor using the new EDITSOURCE() function which is the only reason this tool requires Visual FoxPro 7. If you have not yet upgrade to Visual FoxPro 7 and want to use this tool we suggest that you override the form’s EditModule method. Activating the source code editor allows the developer to make changes live or at least view the exact code that might be a potential bottleneck.
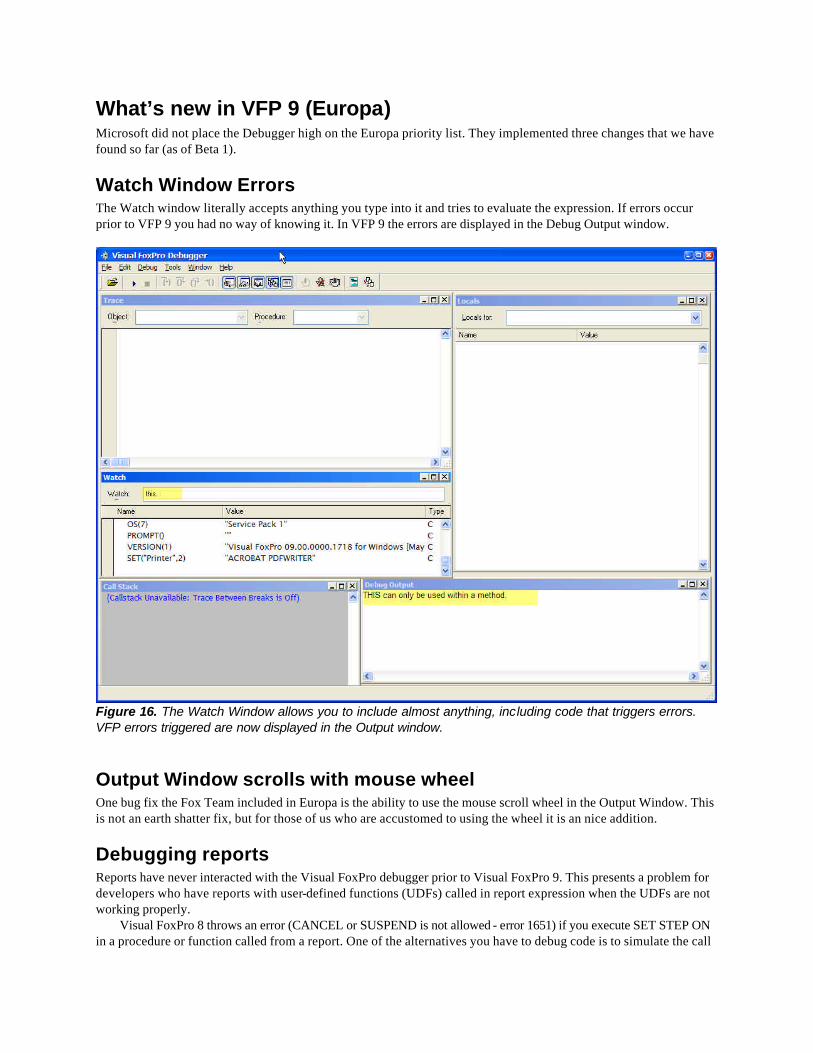
What’s new in VFP 9 (Europa) Microsoft did not place the Debugger high on the Europa priority list. They implemented three changes that we have found so far (as of Beta 1).
Watch Window Errors The Watch window literally accepts anything you type into it and tries to evaluate the expression. If errors occur prior to VFP 9 you had no way of knowing it. In VFP 9 the errors are displayed in the Debug Output window.
Figure 16. The Watch Window allows you to include almost anything, including code that triggers errors. VFP errors triggered are now displayed in the Output window.
Output Window scrolls with mouse wheel One bug fix the Fox Team included in Europa is the ability to use the mouse scroll wheel in the Output Window. This is not an earth shatter fix, but for those of us who are accustomed to using the wheel it is an nice addition.
Debugging reports Reports have never interacted with the Visual FoxPro debugger prior to Visual FoxPro 9. This presents a problem for developers who have reports with user-defined functions (UDFs) called in report expression when the UDFs are not working properly.
Visual FoxPro 8 throws an error (CANCEL or SUSPEND is not allowed - error 1651) if you execute SET STEP ON in a procedure or function called from a report. One of the alternatives you have to debug code is to simulate the call
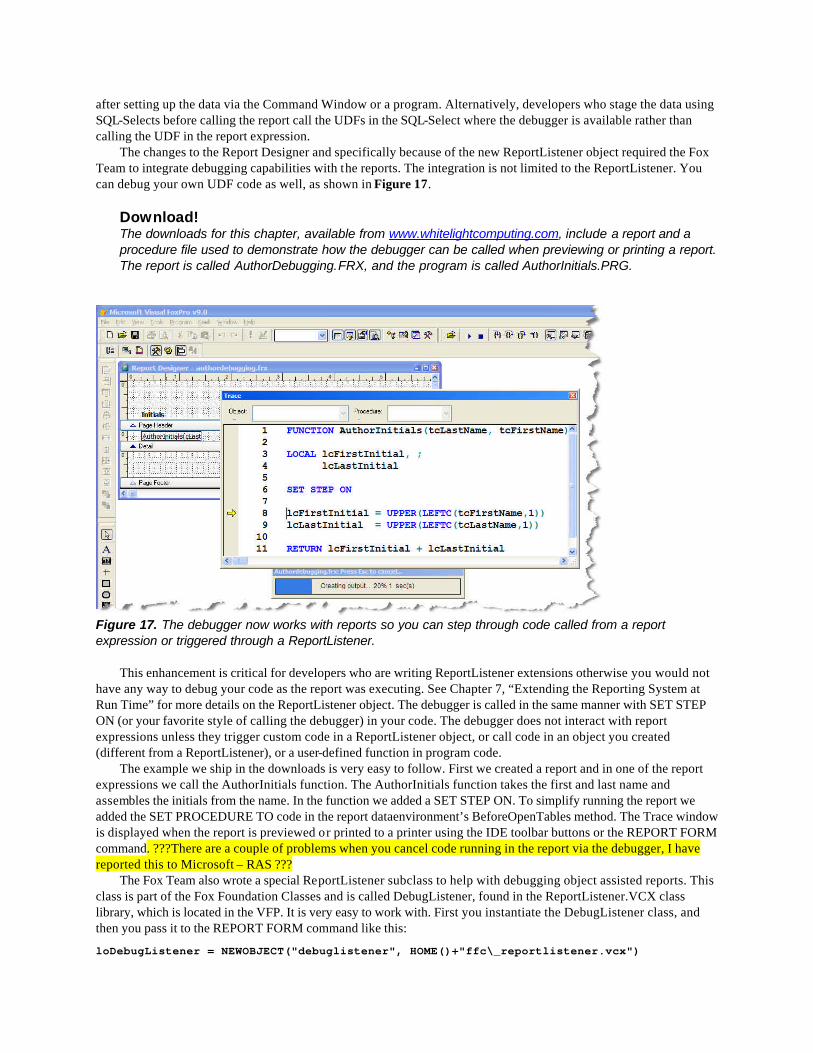
after setting up the data via the Command Window or a program. Alternatively, developers who stage the data using SQL-Selects before calling the report call the UDFs in the SQL-Select where the debugger is available rather than calling the UDF in the report expression.
The changes to the Report Designer and specifically because of the new ReportListener object required the Fox Team to integrate debugging capabilities with the reports. The integration is not limited to the ReportListener. You can debug your own UDF code as well, as shown in Figure 17.
Download! The downloads for this chapter, available from www.whitelightcomputing.com, include a report and a procedure file used to demonstrate how the debugger can be called when previewing or printing a report. The report is called AuthorDebugging.FRX, and the program is called AuthorInitials.PRG.
Figure 17. The debugger now works with reports so you can step through code called from a report expression or triggered through a ReportListener.
This enhancement is critical for developers who are writing ReportListener extensions otherwise you would not have any way to debug your code as the report was executing. See Chapter 7, “Extending the Reporting System at Run Time” for more details on the ReportListener object. The debugger is called in the same manner with SET STEP ON (or your favorite style of calling the debugger) in your code. The debugger does not interact with report expressions unless they trigger custom code in a ReportListener object, or call code in an object you created (different from a ReportListener), or a user-defined function in program code.
The example we ship in the downloads is very easy to follow. First we created a report and in one of the report expressions we call the AuthorInitials function. The AuthorInitials function takes the first and last name and assembles the initials from the name. In the function we added a SET STEP ON. To simplify running the report we added the SET PROCEDURE TO code in the report dataenvironment’s BeforeOpenTables method. The Trace window is displayed when the report is previewed or printed to a printer using the IDE toolbar buttons or the REPORT FORM command. ???There are a couple of problems when you cancel code running in the report via the debugger, I have reported this to Microsoft – RAS ???
The Fox Team also wrote a special ReportListener subclass to help with debugging object assisted reports. This class is part of the Fox Foundation Classes and is called DebugListener, found in the ReportListener.VCX class library, which is located in the VFP. It is very easy to work with. First you instantiate the DebugListener class, and then you pass it to the REPORT FORM command like this:
loDebugListener = NEWOBJECT("debuglistener", HOME()+"ffc\_reportlistener.vcx")
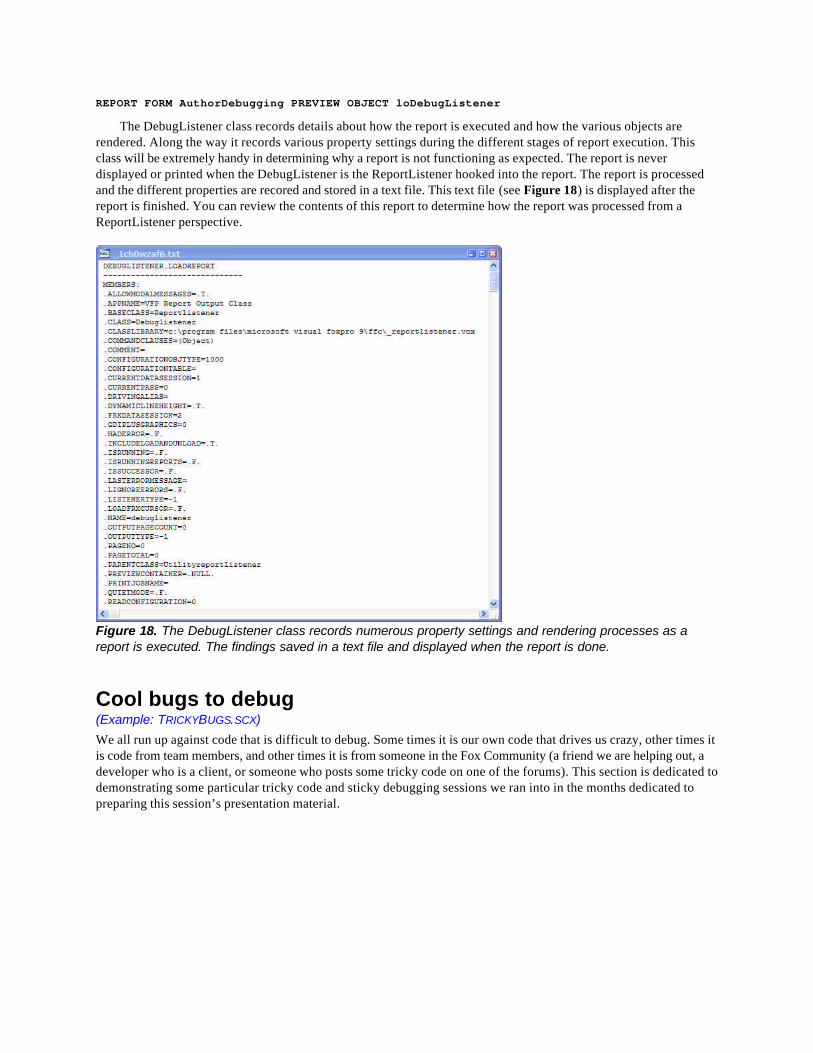
REPORT FORM AuthorDebugging PREVIEW OBJECT loDebugListener
The DebugListener class records details about how the report is executed and how the various objects are rendered. Along the way it records various property settings during the different stages of report execution. This class will be extremely handy in determining why a report is not functioning as expected. The report is never displayed or printed when the DebugListener is the ReportListener hooked into the report. The report is processed and the different properties are recored and stored in a text file. This text file (see Figure 18) is displayed after the report is finished. You can review the contents of this report to determine how the report was processed from a ReportListener perspective.
Figure 18. The DebugListener class records numerous property settings and rendering processes as a report is executed. The findings saved in a text file and displayed when the report is done.
Cool bugs to debug (Example: TRICKYBUGS.SCX) We all run up against code that is difficult to debug. Some times it is our own code that drives us crazy, other times it is code from team members, and other times it is from someone in the Fox Community (a friend we are helping out, a developer who is a client, or someone who posts some tricky code on one of the forums). This section is dedicated to demonstrating some particular tricky code and sticky debugging sessions we ran into in the months dedicated to preparing this session’s presentation material.
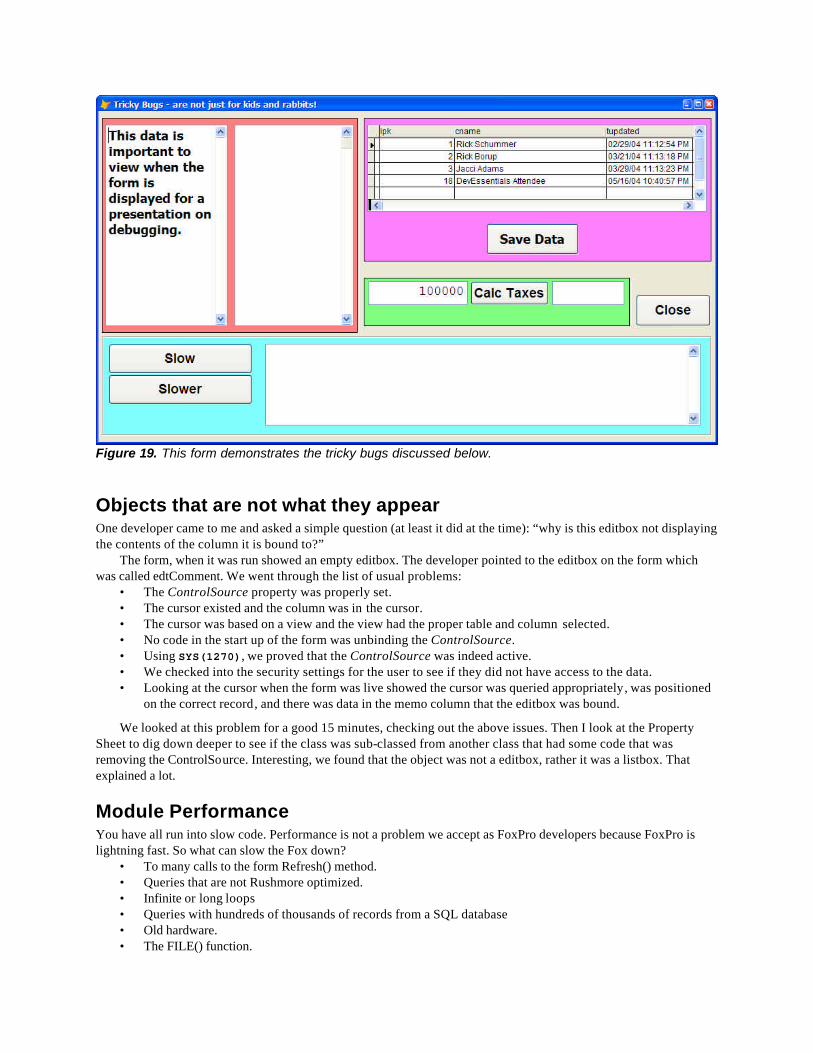
Figure 19. This form demonstrates the tricky bugs discussed below.
Objects that are not what they appear One developer came to me and asked a simple question (at least it did at the time): “why is this editbox not displaying the contents of the column it is bound to?”
The form, when it was run showed an empty editbox. The developer pointed to the editbox on the form which was called edtComment. We went through the list of usual problems:
• The ControlSource property was properly set. • The cursor existed and the column was in the cursor. • The cursor was based on a view and the view had the proper table and column selected. • No code in the start up of the form was unbinding the ControlSource. • Using SYS(1270), we proved that the ControlSource was indeed active. • We checked into the security settings for the user to see if they did not have access to the data. • Looking at the cursor when the form was live showed the cursor was queried appropriately, was positioned
on the correct record, and there was data in the memo column that the editbox was bound.
We looked at this problem for a good 15 minutes, checking out the above issues. Then I look at the Property Sheet to dig down deeper to see if the class was sub-classed from another class that had some code that was removing the ControlSource. Interesting, we found that the object was not a editbox, rather it was a listbox. That explained a lot.
Module Performance You have all run into slow code. Performance is not a problem we accept as FoxPro developers because FoxPro is lightning fast. So what can slow the Fox down?
• To many calls to the form Refresh() method. • Queries that are not Rushmore optimized. • Infinite or long loops • Queries with hundreds of thousands of records from a SQL database • Old hardware. • The FILE() function.
The FILE() function? Yep. I specifically checked all the above items on a form initialization for a customer. The form was taking 30-60 seconds depending on the hardware. I used the SQL Showplan feature of VFP (SYS(3054)) to wring out 7 seconds from one query by adding an index to a table, but this still left 23 seconds. I placed DEBUGOUT PROGRAM(), SECONDS() commands at the beginning and end of Load, Init and Activate event methods. This allowed me to determine which methods were slow. The form Activate was taking 95% of the time. This is where I found the SQL Select which took a little more than 7 seconds. It still was slow. I inserted more DEBUGOUT commands to see exactly where the problem had hidden itself. To my shocking surprise, it was a FILE() function. The function was checking for an image file that was displayed on the form. The kicker was, the image was in a folder along with 20,000 (yes, twenty-thousand) files. This “search” was taking a very long time. Lesson learned? Never place that many files in the same folder! The other thing I forgot during this process was to use the Coverage Profiler.
Why is this happening? Similar to the performance bug, I struggled to find a bug that was happening only periodically. It only happened under certain condition which is not that uncommon, but this time the bug was hidden in an event that was not triggered regularly because it was strictly triggered by user interaction.
This bug required a tedious foundation of DEBUGOUT commands and Event Tracking. I added the DEBUGOUT commands to all the methods in the form that had code and turned Event Tracking on for the following events:
Activate Click DblClick Deactivate Destroy Error GotFocus Init InteractiveChange KeyPress Load LostFocus ProgrammaticChange Resize RightClick Scrolled Unload Valid When
I ran the form and started interacting with it. When the bug appeared I was able to see the order of methods and events that fired and how the code interacted to trigger the problem. This is just one approach, and it was definitely tedious.
Variable/Property Scoping problems Ever run some code having side-effects? You know the code, the type of code which changes memory variables unexpectedly. It usually happens when the memory variable is implicitly PRIVATE because the developer did not declare it in a calling program, and later calls a procedure, function, or method with another undeclared instance of the same variable.
Resources • Debugging Visual FoxPro Applications, by Nancy Folsom, Hentzenwerke Publishing, ISBN: 1-930919-20-4 • MegaFox: 1002 Things You Wanted To Know About Extending Visual FoxPro (Chapter 18), by Marcia Akins,
Andy Kramek, Rick Schummer, Hentzenwerke Publishing, ISBN: 1-930919-27-1

Conclusion We all have horrific stories and experiences that we can tell personally when debugging and testing were not done, or not done well. The key to debugging is to learn from the mistakes, improve the debugging process, and find techniques that lead to defect-free releases. Hopefully, this whitepaper presented some ideas that will lead you in the right direction.
It is important to remember, while we all strive to make that perfect release and to write defect-free code, that software and the environment that it runs in gets more and more complex. This complexity will likely continue to make our jobs as software developers more difficult. Learning better debugging techniques and sharing them with the development community will establish best practices. The better we get as a community, the more our customers will begin to trust in our capabilities as an industry.
Special Thanks I want to thank the guinea pigs that put up with the rehearsals to insure that this presentation was refined for primetime at the DevEssentials 2004 Conference. The Detroit Area Fox User Group members provided excellent feedback to me and I really appreciate the frank and honest evaluations that were provided.
I want to thank Steve Dingle, tech editor of MegaFox: 1002 Things You Wanted To Know About Extending Visual FoxPro , who reviewed all the material in Chapter 12, VFP Tool Extensions and Tips and Chapter 18, Testing and Debugging, which some of this material was borrowed.
Copyright Copyright 2004 Richard A. Schummer. All Worldwide Rights Reserved
Author Profile Rick Schummer is the President and lead geek at his company White Light Computing, Inc., headquartered in southeast Michigan, USA. He prides himself in guiding his customer’s Information Technology investment toward success. After hours you might find him creating developer tools that improve developer productivity, or writing articles for his favorite Fox periodicals and user group newsletters. Rick is a co-author of Deploying Visual FoxPro Solutions, MegaFox: 1002 Things You Wanted To Know About Extending Visual FoxPro, and 1001 Things You Always Wanted to Know About Visual FoxPro. He is a founding member and Secretary of the Detroit Area Fox User Group (DAFUG) and a regular presenter at user groups in North America. Rick has enjoyed presenting at GLGDW 2000-2003, Essential Fox 2002-2004, VFE DevCon2K2, and scheduled to speak at the Southwest Fox 2004 conference. [email protected], [email protected], http://www.whitelightcomputing.com and http://www.rickschummer.com