Embed Size (px)
Citation preview
Debt Road Show Presentation
29 May 2014
- Howard Millar CFO & Deputy Chief Executive
- Neil Sorahan Finance Director
- John O’Flynn Treasury Manager
© This presentation is subject to copyright and may not be copied or used without the express prior consent of Ryanair
LOW FARES. MADE SIMPLE.
EUROPES ONLY ULTRA LOW COST CARRIER
2
Proven, resilient business model
Structural cost advantages deliver Europe’s lowest fares
Europe’s No 1, traffic – 84.6m (No.1 or 2 in most markets)
Europe’s No 1, coverage – 68 Bases, 186 Airports, 30 countries
Europe’s No 1, customer service – On time, fewest lost bags & cancellations
– Improving customer & digital experience
Low cost aircraft order delivers traffic growth to over 110m by FY 19
Industry leading cash generation & liquidity
Unblemished 30 year safety record
Worlds highest rated airline – BBB+ S&P / BBB+ Fitch
© This presentation is subject to copyright and may not be copied or used without the express prior consent of Ryanair
LOW FARES. MADE SIMPLE.
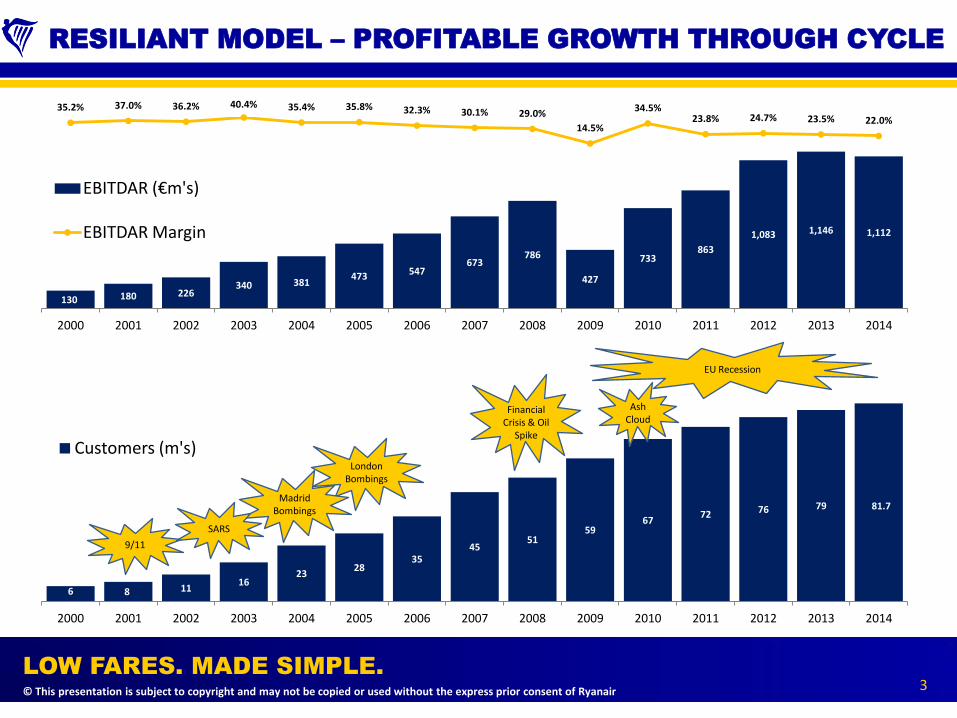
RESILIANT MODEL – PROFITABLE GROWTH THROUGH CYCLE
3
130 180 226 340 381
473 547 673
786
427
733 863
1,083 1,146 1,112
35.2% 37.0% 36.2% 40.4% 35.4% 35.8% 32.3% 30.1% 29.0%
14.5%
34.5% 23.8% 24.7% 23.5% 22.0%
-150.0%
-130.0%
-110.0%
-90.0%
-70.0%
-50.0%
-30.0%
-10.0%
10.0%
30.0%
0
200
400
600
800
1000
1200
1400
2000 2001 2002 2003 2004 2005 2006 2007 2008 2009 2010 2011 2012 2013 2014
EBITDAR (€m's)
EBITDAR Margin
6 8 11 16
23 28
35 45
51 59
67 72 76 79
-
10
20
30
40
50
60
70
80
90
2000 2001 2002 2003 2004 2005 2006 2007 2008 2009 2010 2011 2012 2013 2014
Customers (m's)
EU Recession
London Bombings
Madrid Bombings 81.7
9/11
SARS
Financial Crisis & Oil
Spike
Ash Cloud
© This presentation is subject to copyright and may not be copied or used without the express prior consent of Ryanair
LOW FARES. MADE SIMPLE.
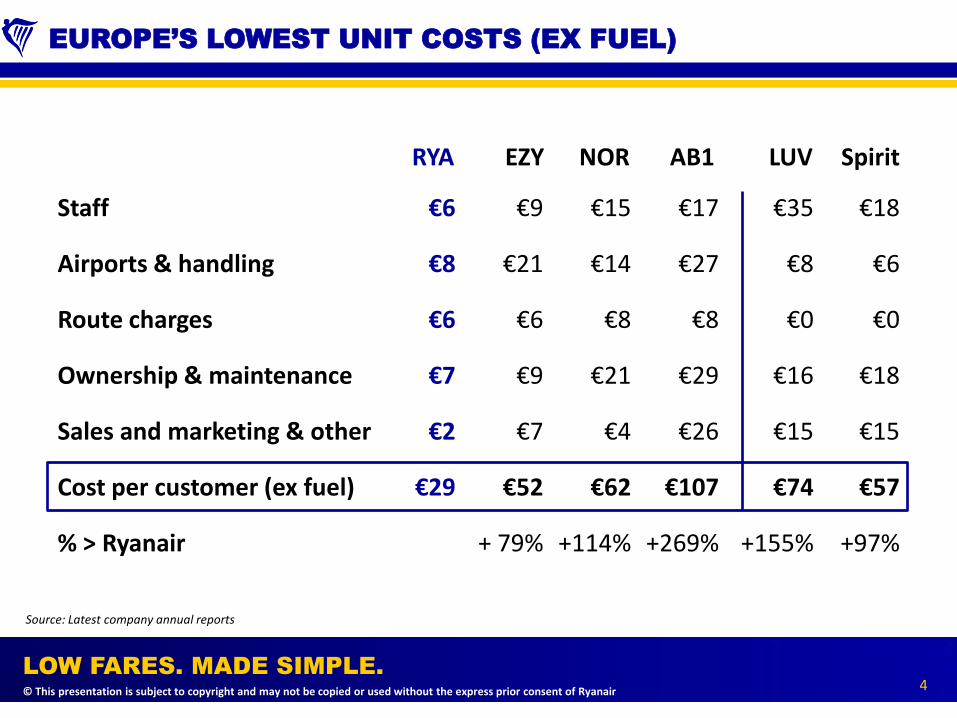
EUROPE’S LOWEST UNIT COSTS (EX FUEL)
4
Source: Latest company annual reports
RYA EZY NOR
Staff
Airports & handling
Route charges
Ownership & maintenance
Sales and marketing & other
Cost per customer (ex fuel)
% > Ryanair
€6
€8
€6
€7
€2
€29
€9
€21
€6
€9
€7
€52
+ 79%
€15
€14
€8
€21
€4
€62
+114%
€35
€8
€0
€16
€15
€74
+155%
LUV Spirit
€18
€6
€0
€18
€15
€57
+97%
€17
€27
€8
€29
€26
€107
+269%
AB1

© This presentation is subject to copyright and may not be copied or used without the express prior consent of Ryanair
LOW FARES. MADE SIMPLE.
EUROPE’S LOWEST FARES
5
LOW Ryanair
MEDIUM Norwegian
easyJet
Aer Lingus (s/h)
Air Berlin
HIGH Alitalia
Lufthansa
IAG
AF-KLM
+ 80%
+ 83%
+ 102%
+ 163%
+ 222%
+ 411%
+ 426%
+ 552%
% > Ryanair Avg. Fare
€46
€83
€84
€93
€121
€148
€235
€242
€300 Source: Latest company annual reports.
(-4%)

© This presentation is subject to copyright and may not be copied or used without the express prior consent of Ryanair
LOW FARES. MADE SIMPLE.
EUROPE’S NO.1 – TRAFFIC
6
52 54
61 62
81.7 84.6
89.0
96.0
104.0
112.0
50
60
70
80
90
100
110
Customers (m’s)
FY 2014
FY 2016 FY 2015 FY 2018 FY 2017 FY 2019
Ryanair Growth Projections Source: Latest traffic stats from company websites (inter European short haul only) for 12 mths to Mar14 .
© This presentation is subject to copyright and may not be copied or used without the express prior consent of Ryanair
LOW FARES. MADE SIMPLE.
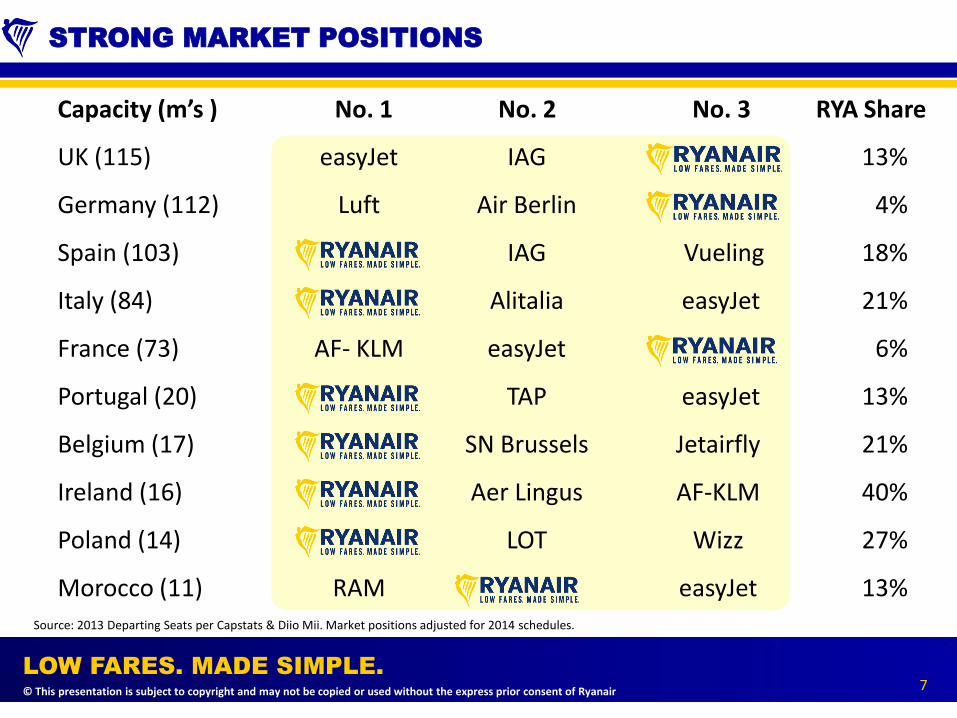
STRONG MARKET POSITIONS
7
UK (115)
Germany (112)
Spain (103)
Italy (84)
France (73)
Portugal (20)
Belgium (17)
Ireland (16)
Poland (14)
Morocco (11)
13%
4%
18%
21%
6%
13%
21%
40%
27%
13%
RYA Share
Source: 2013 Departing Seats per Capstats & Diio Mii. Market positions adjusted for 2014 schedules.
Capacity (m’s ) No. 1 No. 2
Vueling
easyJet
easyJet
Jetairfly
AF-KLM
Wizz
easyJet
No. 3
IAG
Air Berlin
IAG
Alitalia
easyJet
TAP
SN Brussels
Aer Lingus
LOT
easyJet
Luft
AF- KLM
RAM
© This presentation is subject to copyright and may not be copied or used without the express prior consent of Ryanair
LOW FARES. MADE SIMPLE.
8
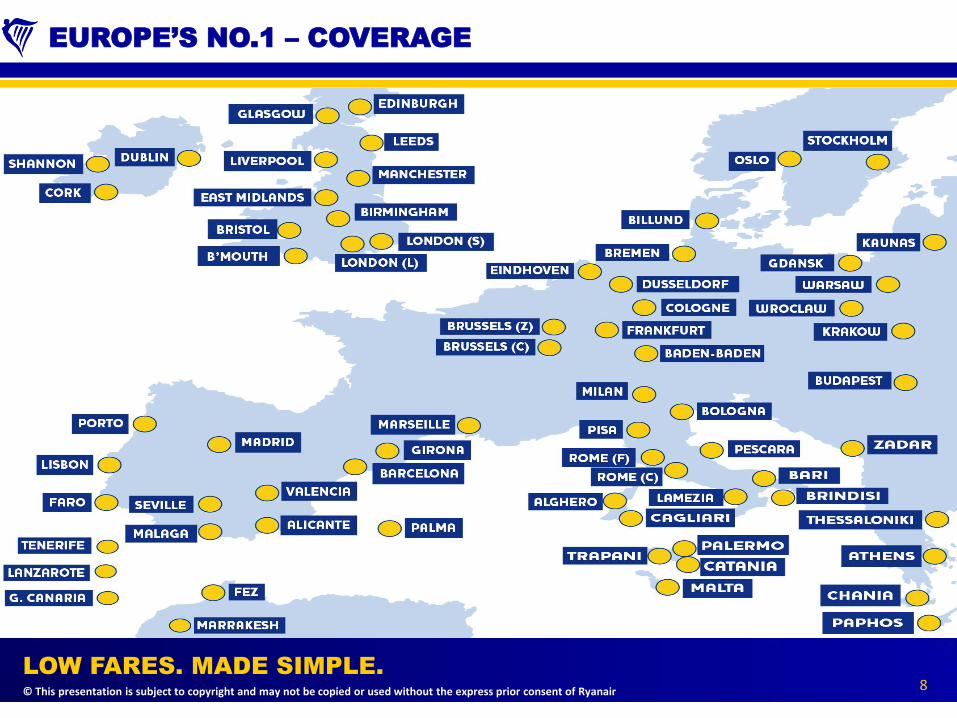
EUROPE’S NO.1 – COVERAGE

© This presentation is subject to copyright and may not be copied or used without the express prior consent of Ryanair
LOW FARES. MADE SIMPLE.
CUSTOMER EXPERIENCE IMPROVING
9
RECAPTCHA scrapped for individuals – Oct 13
24hr grace period to correct minor booking errors – Nov 13
Quiet flights (early AM, late PM) – Nov 13
2nd free small carry on bag – Dec 13
Boarding card reissue & bag fees cut – Dec 13
New Groups & Corporate Travel Department – Jan 14
Allocated seating – Feb 14
Improving experience supported by T.V. advertising

© This presentation is subject to copyright and may not be copied or used without the express prior consent of Ryanair
LOW FARES. MADE SIMPLE.
DIGITAL EXPERIENCE IMPROVING
10
Simpler website (17 to 5 clicks) – Nov 13
“My Ryanair”, customer registration – Dec 13
New website including “Fare Finder” feature, great response – Mar 14
GDS partnership (Galileo/Worldspan platform) for business agents – April 14
New mobile app for smart phones & tablets – June 14
New family and business products in pipeline
Program of continuous IT & digital improvement underway
© This presentation is subject to copyright and may not be copied or used without the express prior consent of Ryanair
LOW FARES. MADE SIMPLE.
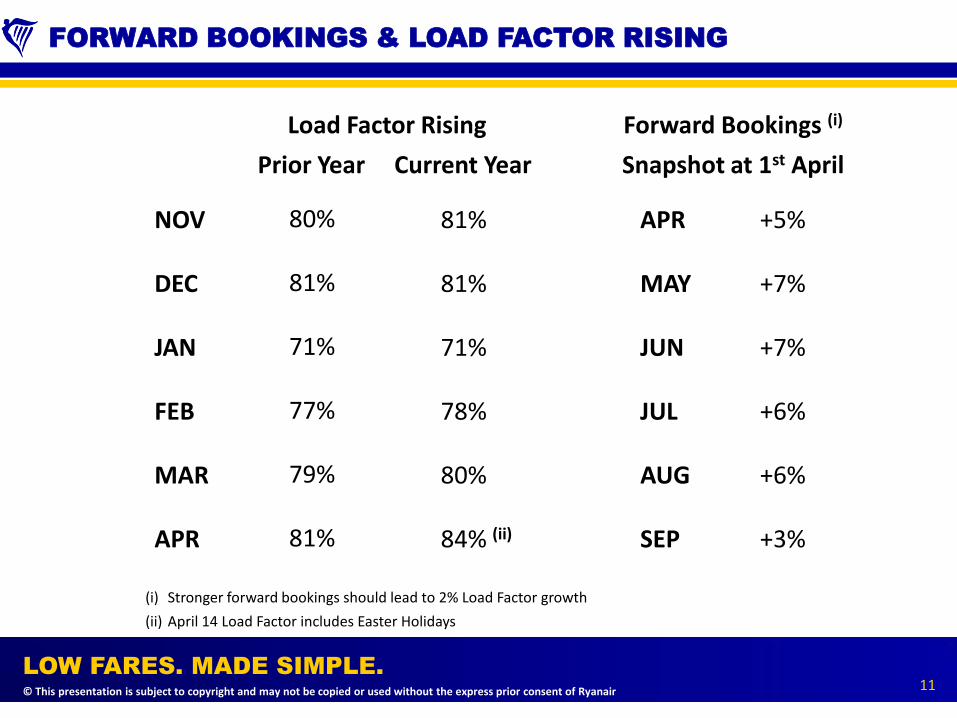
FORWARD BOOKINGS & LOAD FACTOR RISING
11
NOV
DEC
JAN
FEB
MAR
APR
Load Factor Rising
Prior Year Current Year
80%
81%
71%
77%
79%
81%
81%
81%
71%
78%
80%
84% (ii)
Snapshot at 1st April
APR
MAY
JUN
JUL
AUG
SEP
+5%
+7%
+7%
+6%
+6%
+3%
(ii) April 14 Load Factor includes Easter Holidays
(i) Stronger forward bookings should lead to 2% Load Factor growth
Forward Bookings (i)

© This presentation is subject to copyright and may not be copied or used without the express prior consent of Ryanair
LOW FARES. MADE SIMPLE.
LOW COST 180 AIRCRAFT ORDER
12
All Boeing 737-800NG aircraft
Maintains cost leadership and fleet commonality
USD pricing “not dissimilar” to previous 2005 order. EUR/USD rate better.
Provides passenger growth to c. 110m by FY19
Maintains young fleet – average age 5 years
EU flags restructuring - creates airport demand for Ryanair growth
25% of growth allocated to low cost London Stansted
Deals at Warsaw, Dublin, Lisbon, Brussels, Rome, Athens & Cologne
© This presentation is subject to copyright and may not be copied or used without the express prior consent of Ryanair
LOW FARES. MADE SIMPLE.
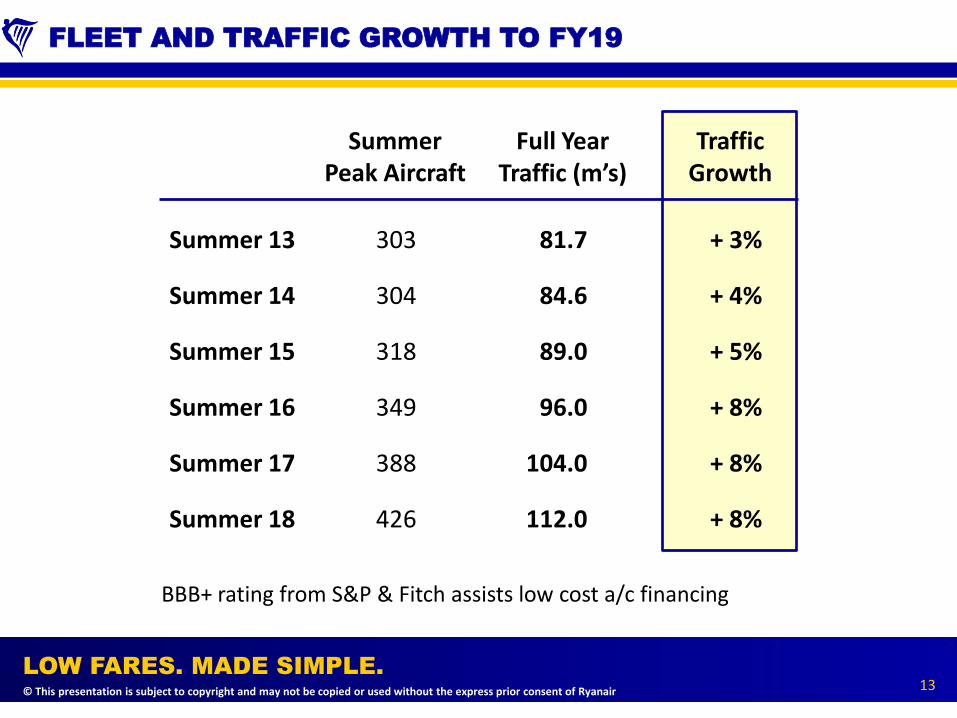
FLEET AND TRAFFIC GROWTH TO FY19
13
81.7
84.6
89.0
96.0
104.0
112.0
Summer 13
Summer 14
Summer 15
Summer 16
Summer 17
Summer 18
303
304
318
349
388
426
+ 3%
+ 4%
+ 5%
+ 8%
+ 8%
+ 8%
Summer Peak Aircraft
Full Year Traffic (m’s)
Traffic Growth
BBB+ rating from S&P & Fitch assists low cost a/c financing

© This presentation is subject to copyright and may not be copied or used without the express prior consent of Ryanair
LOW FARES. MADE SIMPLE.
FULL YEAR RESULTS
14
Traffic
Load Factor
Average Fare (includes bag)
Revenue Per Passenger
Revenue
Profit after Tax
79.3m
82%
€48
€62
€4,884m
€569m
Mar 13
Mar 14
81.7m
83%
€46
€62
€5,037m
€523m
+3%
+1%
-4%
0%
+3%
-8%
© This presentation is subject to copyright and may not be copied or used without the express prior consent of Ryanair
LOW FARES. MADE SIMPLE.
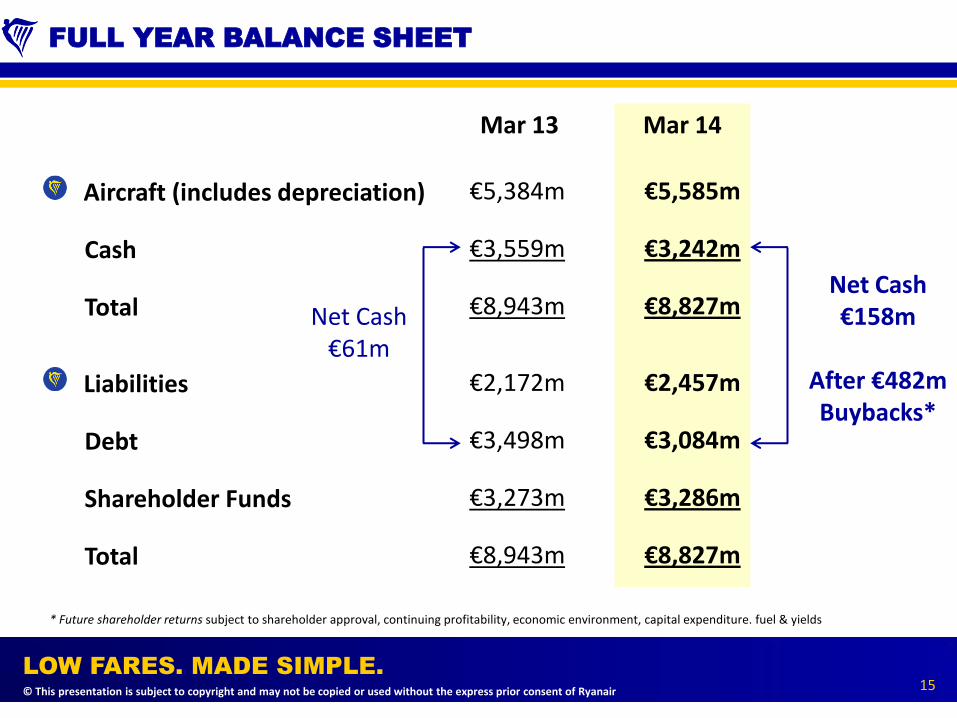
FULL YEAR BALANCE SHEET
15
Aircraft (includes depreciation)
Cash
Total
Liabilities
Debt
Shareholder Funds
Total
€5,384m
€3,559m
€8,943m
€2,172m
€3,498m
€3,273m
€8,943m
Mar 13
€5,585m
€3,242m
€8,827m
€2,457m
€3,084m
€3,286m
€8,827m
Mar 14
Net Cash €61m
Net Cash €158m
After €482m Buybacks*
* Future shareholder returns subject to shareholder approval, continuing profitability, economic environment, capital expenditure. fuel & yields
© This presentation is subject to copyright and may not be copied or used without the express prior consent of Ryanair
LOW FARES. MADE SIMPLE.
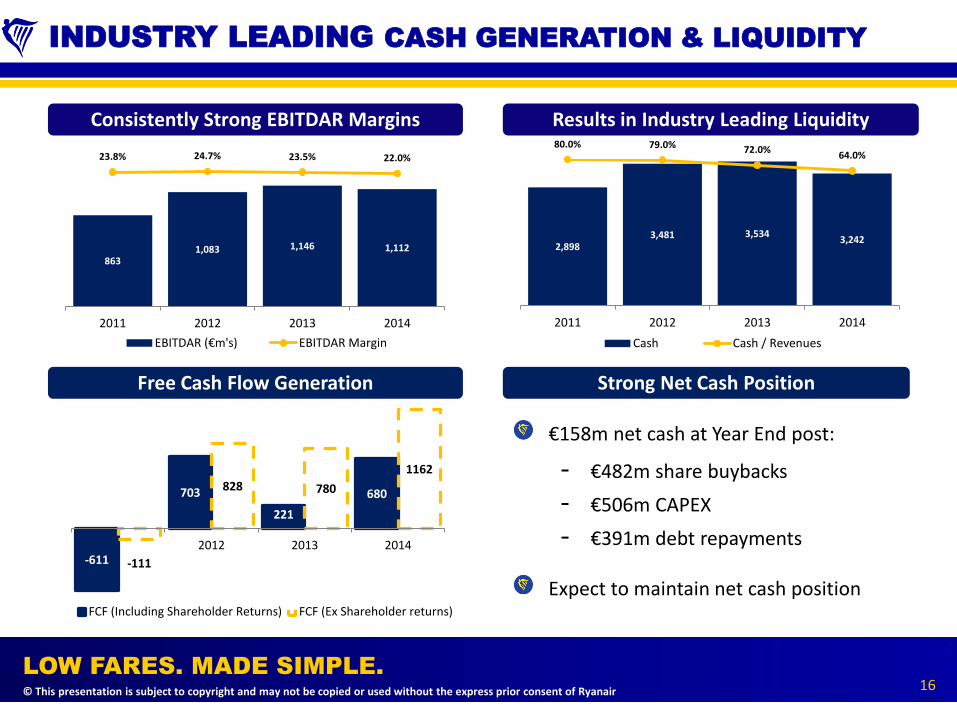
INDUSTRY LEADING CASH GENERATION & LIQUIDITY
16
Free Cash Flow Generation
Results in Industry Leading Liquidity Consistently Strong EBITDAR Margins
863 1,083 1,146 1,112
23.8% 24.7% 23.5% 22.0%
-150.0% -130.0% -110.0% -90.0% -70.0% -50.0% -30.0% -10.0% 10.0% 30.0%
0
200
400
600
800
1000
1200
1400
2011 2012 2013 2014
EBITDAR (€m's) EBITDAR Margin
2,898 3,481 3,534
3,242
80.0% 79.0% 72.0% 64.0%
-150.0%
-100.0%
-50.0%
0.0%
50.0%
-400
100
600
1100
1600
2100
2600
3100
3600
2011 2012 2013 2014
Cash Cash / Revenues
€158m net cash at Year End post:
- €482m share buybacks
- €506m CAPEX
- €391m debt repayments
Expect to maintain net cash position
Strong Net Cash Position
-611
703
221
680
-111
828 780
1162
2012 2013 2014
FCF (Including Shareholder Returns) FCF (Ex Shareholder returns)
© This presentation is subject to copyright and may not be copied or used without the express prior consent of Ryanair
LOW FARES. MADE SIMPLE.
CONSERVATIVE FINANCIAL POLICIES
17
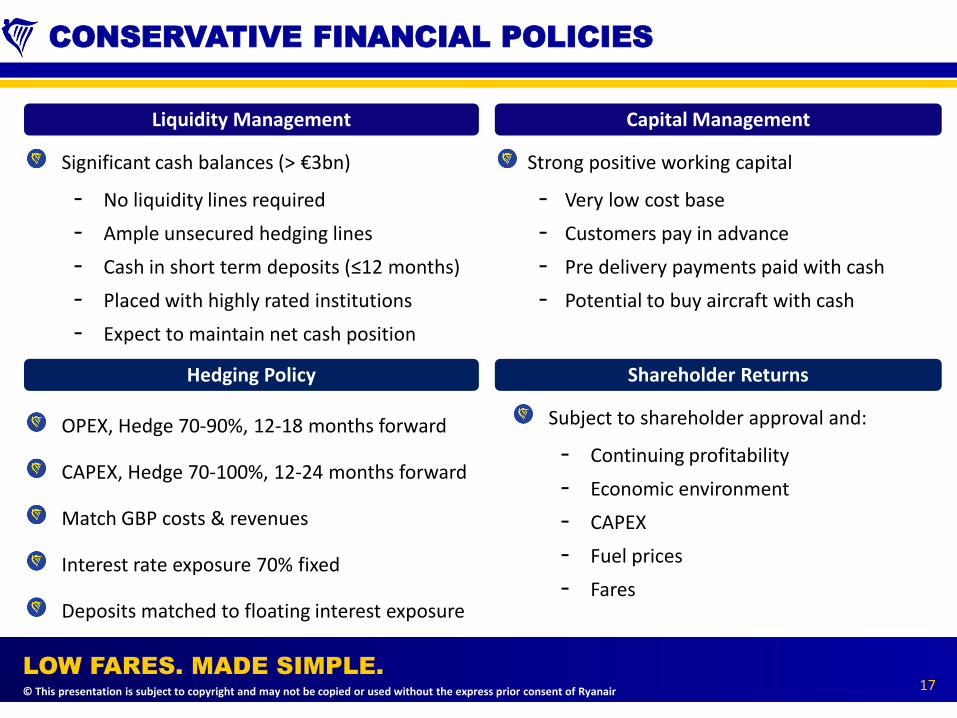
Hedging Policy
Capital Management Liquidity Management
Shareholder Returns
Subject to shareholder approval and:
- Continuing profitability
- Economic environment
- CAPEX
- Fuel prices
- Fares
Strong positive working capital
- Very low cost base
- Customers pay in advance
- Pre delivery payments paid with cash
- Potential to buy aircraft with cash
Significant cash balances (> €3bn)
- No liquidity lines required
- Ample unsecured hedging lines
- Cash in short term deposits (≤12 months)
- Placed with highly rated institutions
- Expect to maintain net cash position
OPEX, Hedge 70-90%, 12-18 months forward
CAPEX, Hedge 70-100%, 12-24 months forward
Match GBP costs & revenues
Interest rate exposure 70% fixed
Deposits matched to floating interest exposure

© This presentation is subject to copyright and may not be copied or used without the express prior consent of Ryanair
LOW FARES. MADE SIMPLE.
WORLDS HIGHEST RATED AIRLINE
18
BBB+ corporate rating from S&P & Fitch
– Worlds highest rated airline
– Stable outlooks
– “a-” anchor (S&P), notched due to possible CAPEX & shareholder returns
– Industry leading liquidity, cost base & cash generation
– BBB+ note rating expected
Ratings provide direct access to competitive capital markets funding
Scalable source of Euro unsecured debt + EETC financing
Supplements existing financing options, Ex-Im available as low cost backstop

© This presentation is subject to copyright and may not be copied or used without the express prior consent of Ryanair
LOW FARES. MADE SIMPLE.
DEBUT ISSUANCE – TERMS AND CONDITIONS
19
Issuer Ryanair Limited
Guarantor Ryanair Holdings PLC
Issuer Ratings BBB+/BBB+
Expected Note Rating BBB+/BBB+
Status Senior, unsecured
Currency EUR
Tenor 7 years
Size Benchmark
Use of Proceeds GCP
Denomination €100K + €1k
Governing Law English
Listing Dublin
Covenants Change of Control, Negative Pledge, Cross Default
Documentation Ryanair Limited EUR3bn EMTN Programme
Global Co-ordinator Citi
Bookrunners BNP Paribas, Citi, Deutsche Bank
© This presentation is subject to copyright and may not be copied or used without the express prior consent of Ryanair
LOW FARES. MADE SIMPLE.
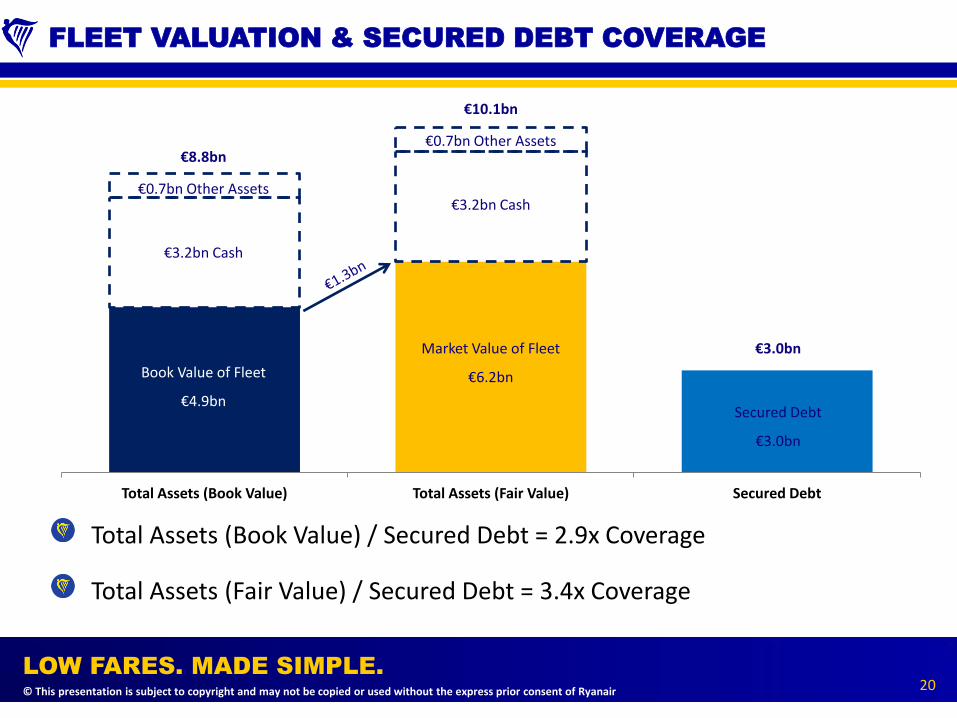
Total Assets (Book Value) Total Assets (Fair Value) Secured Debt
FLEET VALUATION & SECURED DEBT COVERAGE
20
Total Assets (Book Value) / Secured Debt = 2.9x Coverage
Total Assets (Fair Value) / Secured Debt = 3.4x Coverage
€0.7bn Other Assets
€3.2bn Cash
Market Value of Fleet
€6.2bn
Secured Debt
€3.0bn
Book Value of Fleet
€4.9bn
€0.7bn Other Assets
€3.2bn Cash
€8.8bn
€10.1bn
€3.0bn
© This presentation is subject to copyright and may not be copied or used without the express prior consent of Ryanair
LOW FARES. MADE SIMPLE.
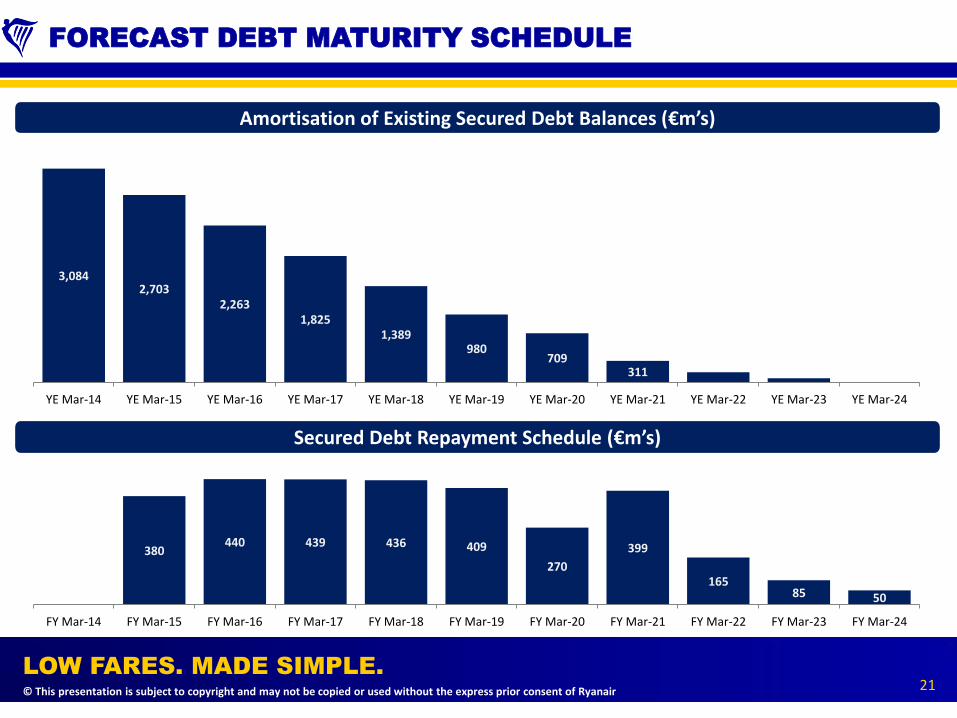
FORECAST DEBT MATURITY SCHEDULE
21
Secured Debt Repayment Schedule (€m’s)
Amortisation of Existing Secured Debt Balances (€m’s)
3,084 2,703
2,263 1,825
1,389 980
709 311
YE Mar-14 YE Mar-15 YE Mar-16 YE Mar-17 YE Mar-18 YE Mar-19 YE Mar-20 YE Mar-21 YE Mar-22 YE Mar-23 YE Mar-24
380 440 439 436 409
270
399
165 85 50
FY Mar-14 FY Mar-15 FY Mar-16 FY Mar-17 FY Mar-18 FY Mar-19 FY Mar-20 FY Mar-21 FY Mar-22 FY Mar-23 FY Mar-24
© This presentation is subject to copyright and may not be copied or used without the express prior consent of Ryanair
LOW FARES. MADE SIMPLE.
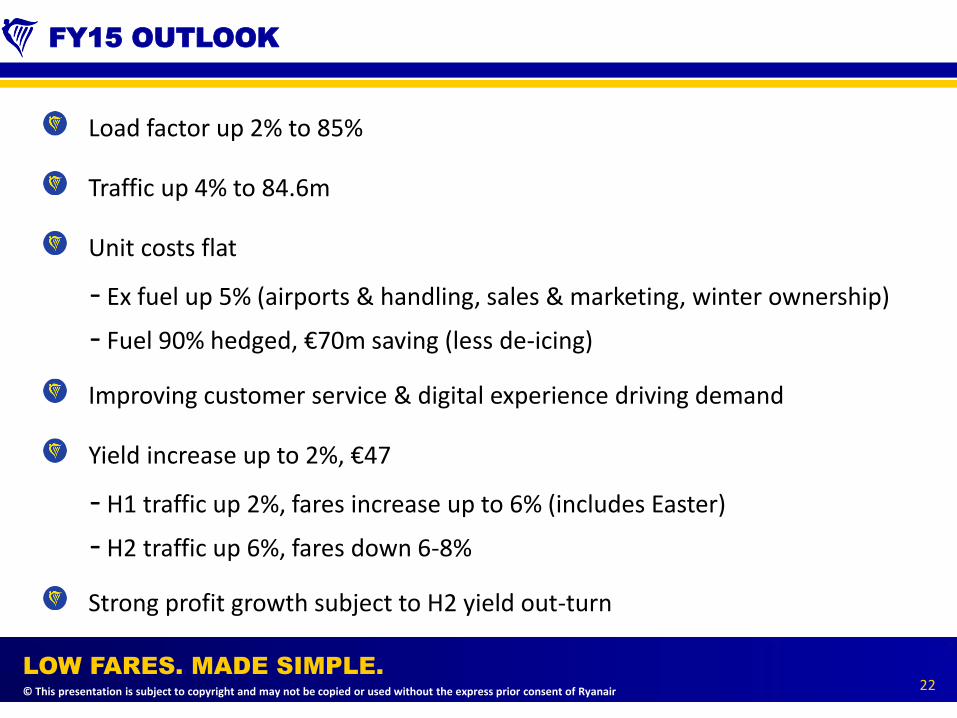
FY15 OUTLOOK
22
Load factor up 2% to 85%
Traffic up 4% to 84.6m
Unit costs flat
- Ex fuel up 5% (airports & handling, sales & marketing, winter ownership)
- Fuel 90% hedged, €70m saving (less de-icing)
Improving customer service & digital experience driving demand
Yield increase up to 2%, €47
- H1 traffic up 2%, fares increase up to 6% (includes Easter)
- H2 traffic up 6%, fares down 6-8%
Strong profit growth subject to H2 yield out-turn
© This presentation is subject to copyright and may not be copied or used without the express prior consent of Ryanair
LOW FARES. MADE SIMPLE.
SUMMARY
23
Proven, resilient business model – unique structural cost advantages
Lowest costs and fares in Europe
Industry leading liquidity and cash generation
No 1 or 2 share in major EU markets
Fwd bookings & load factors ahead of 2013
Worlds highest rated airline
– Provides access to low cost capital markets to fund 180 new aircraft
“Always getting better” delivers for customers, people & stakeholders
Appendices
19 May 2014
© This presentation is subject to copyright and may not be copied or used without the express prior consent of Ryanair
LOW FARES. MADE SIMPLE.
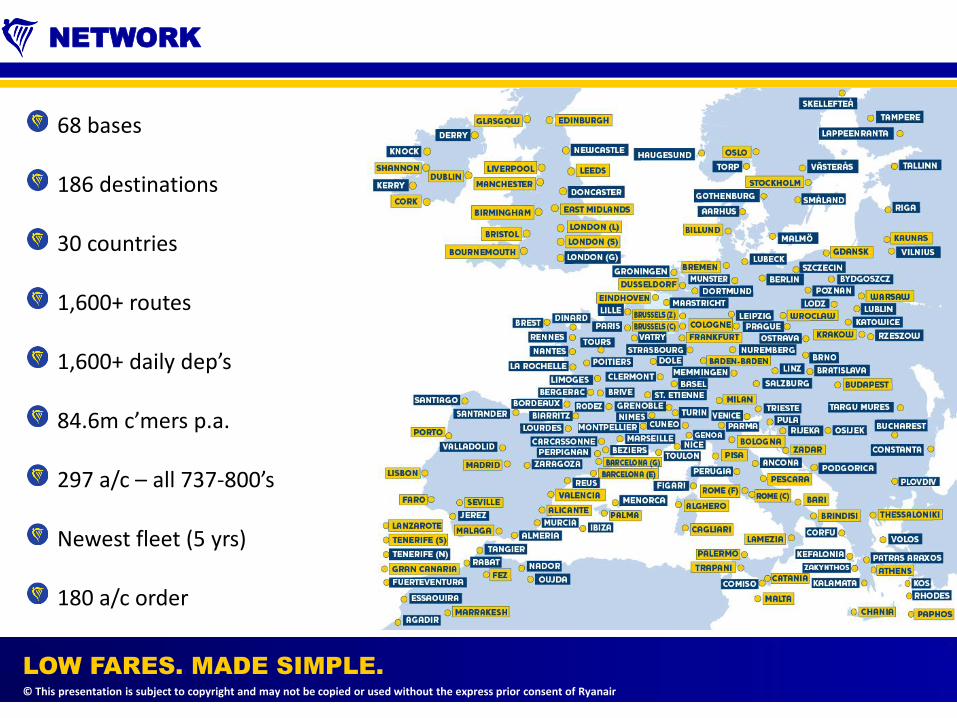
NETWORK
68 bases
186 destinations
30 countries
1,600+ routes
1,600+ daily dep’s
84.6m c’mers p.a.
297 a/c – all 737-800’s
Newest fleet (5 yrs)
180 a/c order
© This presentation is subject to copyright and may not be copied or used without the express prior consent of Ryanair
LOW FARES. MADE SIMPLE.
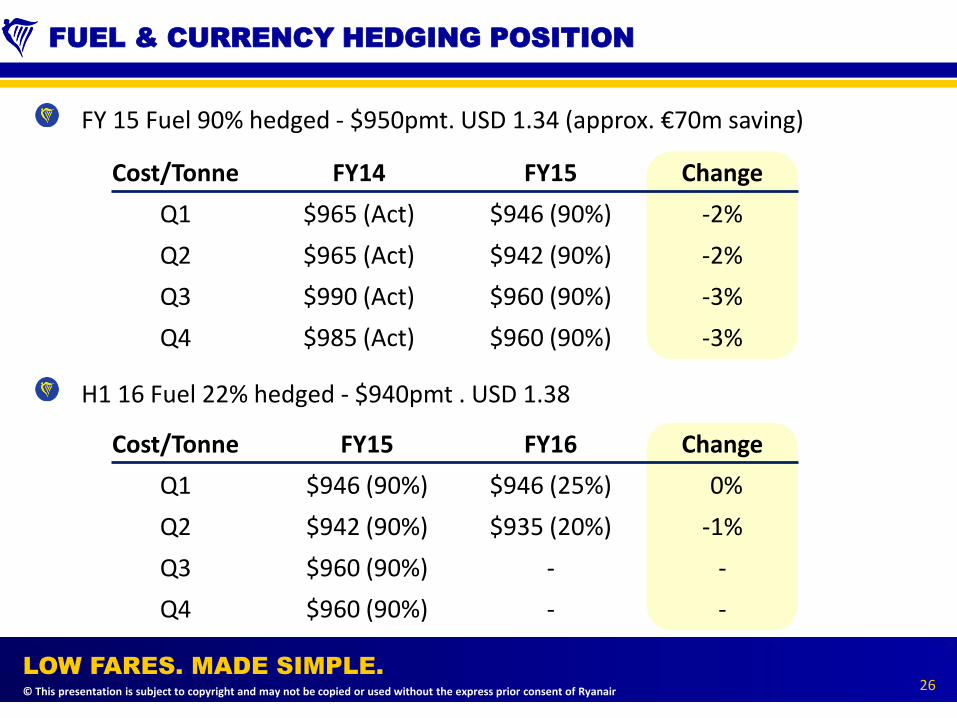
FUEL & CURRENCY HEDGING POSITION
26
FY 15 Fuel 90% hedged - $950pmt. USD 1.34 (approx. €70m saving)
H1 16 Fuel 22% hedged - $940pmt . USD 1.38
Cost/Tonne
Q1
Q2
Q3
Q4
FY14
$965 (Act)
$965 (Act)
$990 (Act)
$985 (Act)
FY15
$946 (90%)
$942 (90%)
$960 (90%)
$960 (90%)
Change
-2%
-2%
-3%
-3%
Cost/Tonne
Q1
Q2
Q3
Q4
FY16
$946 (25%)
$935 (20%)
-
-
Change
0%
-1%
-
-
FY15
$946 (90%)
$942 (90%)
$960 (90%)
$960 (90%)

© This presentation is subject to copyright and may not be copied or used without the express prior consent of Ryanair
LOW FARES. MADE SIMPLE.
DISCLAIMER
THIS PRESENTATION IS NOT AN OFFER OR SOLICITATION OF AN OFFER TO BUY OR SELL SECURITIES. IT IS SOLELY FOR USE AT AN INVESTOR PRESENTATION AND IS PROVIDED AS INFORMATION ONLY. THIS PRESENTATION DOES NOT CONTAIN ALL OF THE INFORMATION THAT IS MATERIAL TO AN INVESTOR. BY ATTENDING THE PRESENTATION OR BY READING THE PRESENTATION SLIDES YOU AGREE TO BE BOUND AS FOLLOWS:
This presentation is strictly confidential to the recipient, is being distributed to a limited range of invited persons solely for their own information, may not be distributed to the press or any other person, and may not be reproduced or published, in whole or in part, in any form. Failure to comply with this restriction may constitute a violation of applicable securities laws.
This document is not a prospectus for any securities. Investors should only subscribe for any securities on the basis of information in a relevant prospectus and term sheet, and not on the basis of any information provided herein.
This presentation has been prepared by Ryanair Limited (the “Company”) and may be amended and supplemented and may not be relied upon for the purposes of entering into any transaction. The information contained herein has been obtained from sources believed to be reliable. Although the Company has taken all reasonable care to ensure that the information herein is accurate and correct, no representation, warranty or undertaking, express or implied, is given by or on behalf of the Company or any of its directors, officers, employees, shareholders, affiliates, agents, advisers, other representatives (collectively, "Representatives") or any other person as to, and no reliance should be placed on, the fairness, accuracy, completeness or correctness of the information or the opinions contained herein or any other material discussed at the presentation. Neither the Company nor any Representatives nor any other person shall have any liability whatsoever (in negligence or otherwise) for any loss howsoever arising from any use of this presentation or any other material discussed at the presentation or their contents or otherwise arising in connection with the presentation. The views reflected herein are solely those of the Company and are subject to change without notice. All estimates, projections, valuations and statistical analyses are provided to assist the recipient in the evaluation of the matters described herein and may be based on subjective assessments and assumptions and may use one among alternative methodologies that produce different results, and to the extent that they are based on historical information, they should not be relied upon as an accurate prediction of future performance. Certain analysis is presented herein and is intended solely for purposes of indicating a range of outcomes that may result from changes in market parameters. It is not intended to suggest that any outcome is more likely than another, and it does not include all possible outcomes or the range of possible outcomes, one of which may be that the investment value declines to zero.
This presentation may include forward-looking statements that reflect the Company’s intentions, beliefs or current expectations. Forward-looking statements involve all matters that are not historical by using the words “may”, “will”, “would”, “should”, “expect”, “intend”, “estimate”, “anticipate”, “target”, “believe” and similar expressions or their negatives. Such statements are made on the basis of assumptions and expectations that the Company currently believes are reasonable, but could prove to be wrong. Any forward-looking statements made by or on behalf of the Company speak only as at the date of this presentation. Save as required by any applicable laws or regulations, the Company undertakes no obligation publicly to release the results of any revisions to any forward-looking statements in this document that may occur due to any change in its expectations or to reflect events or circumstances after the date of this document.
No action has been taken or will be taken that would permit a public offering of any securities in any jurisdiction in which action for that purpose is required. No offers, sales, resales or delivery of any securities or distribution of any offering material relating to any such securities may be made in or from any jurisdiction except in circumstances which will result in compliance with any applicable laws and regulations.
This presentation is for the recipient’s use only. This presentation is not for distribution to retail clients. In particular , neither this presentation nor any copy hereof may be sent or taken or distributed in the United States or to any U.S. person (as such term is defined in Regulation S under the U.S. Securities Act 1933, as amended (the “Securities Act”)), except pursuant to an exemption from the registration requirements of the Securities Act. This presentation, if handed out at a physical investor meeting or presentation, should be returned promptly at the end of such meeting or presentation. If this presentation has been received in error it must be returned immediately to the Company. Accordingly, this presentation is being provided only to persons that are (i)“qualified institutional buyers” within the meaning of Rule 144A under the Securities Act or (ii) not “U.S. persons” within the meaning of Regulation S under the Securities Act. By accepting the delivery of this presentation, the recipient warrants and acknowledges that it falls within the category of persons under clause (i) or (ii). No representation can be made as to the availability of the exemption provided by Rule 144 for re-sales of any securities offered by or guaranteed by the Company. No securities offered by or guaranteed by the Company have been recommended by, or approved by, the United States Securities and Exchange Commission or any other United States federal or state securities commission or regulatory authority, nor has any such commission or regulatory authority passed upon the accuracy or adequacy of this presentation.
This presentation is being communicated only to (i) persons who have professional experience in matters relating to investments falling within Article 19(5) of The Financial Services and Markets Act 2000 (Financial Promotion) Order 2005 (the “Order”), or (ii) high net worth entities, and other persons to whom it may lawfully be communicated, falling within Article 49(2)(a) to (d) of the Order (all such persons together being referred to as “relevant persons”). This presentation is communicated only to relevant persons and must not be acted on or relied on by persons who are not relevant persons. Any investment or investment activity to which this presentation relates is available only to relevant persons and will be engaged in only with relevant persons. By attending the presentation to which this document relates or by accepting this document you will be taken to have represented, warranted and undertaken that (i) you are a relevant person (as defined above); (ii) you have read and agree to comply with the contents of this notice; and (iii) you will treat and safeguard as strictly private and confidential all such information and take all reasonable steps to preserve such confidentiality.
This presentation does not constitute an offer or an agreement, or a solicitation of an offer or an agreement, to enter into any transaction (including for the provision of any services). No assurance is given that any such transaction can or will be arranged or agreed. Before entering into any transaction, you should consider the suitability of the transaction to your particular circumstances and independently review (with your professional advisers as necessary) the specific financial risks as well as the legal, regulatory, credit, tax and accounting consequences. This document does not disclose all the risks and other significant issues related to an investment in any securities/transaction. Prior to transacting, potential investors should ensure that they fully understand the terms of any securities/transaction and any applicable risks.