Embed Size (px)
Citation preview

Debt Relief for the Poorest: An Evaluation Update of the HIPC Initiative
Victoria ElliottShonar Lala
ODI: Re-Examining Sovereign Debt Series
July 11, 2006
www.worldbank.org/ieg/hipc

2
Builds on findings of IEG’s 2003 evaluation
• Clarify the objectives and how they are to be achieved
• Debt relief must be additional, but not yet enough evidence to determine this
• Prospects for debt sustainability tenuous or poor in the majority of completion point countries
• Maintain policy standards for qualification

3
HIPC Initiative’s objectives remain largely unchanged
• Key objective is “to provide eligible countries a base from which to achieve debt sustainability and exit the rescheduling cycle”
• Has maintained its objective of “freeing up resources for poverty reduction”
• Some stakeholders consider poverty reduction the primary objective of debt relief

4
Debt relief has been additional
0
5
10
15
20
1990
2000
2004
Net
Tra
nsfe
rs (b
illio
ns o
f $s)
Total Net Transfers Non-Debt Relief Transfers
Trend: -3% grow th rate
Actual: 11% grow th rate

5
… so HIPC countries get a larger share of aid
1994 - 1999 1999 - 2004
Other Developing Countries38 HIPCs
Share of Net Resource Transfers
40%
60%
54%
46%

6
…even though HIPC countries have weaker policies and institutions
2.5
3
3.5
4
1999 2000 2001 2002 2003 2004
Ove
rall
CPIA
Sco
re
38 HIPCsOther Developing Countries
7
Debt ratios have regressed for many HIPC beneficiaries
• Relief granted under E-HIPC reduced debt ratios to half their initial levels in 18 countries
• But debt ratios have deteriorated subsequently in 11 out of 13 countries with current data
• In 8 countries, they exceed HIPC thresholds
Mean Debt Ratios(NPV of debt to
exports/revenues)Export Fiscal
Before relief
310% 445
After relief
142 181
Current estimate (2003)
174 218
of 150% or 250%

8
Why have post-completion point countries’ debt ratios risen?
-0.3
-0.2
-0.1
0
0.1
0.2
0.3
0.4
Factors Affecting Debt Ratios
Cha
nge
in D
ebt R
atio
s (%
)
Early Later
DiscountRates
ExchangeRates
New Borrowing
Export /Fiscal Revenues
Total

9
HIPC beneficiaries continue to be vulnerable
Risk of debt distress
Vulnerabilities
Burkina Faso Moderate Needs to remain macro-economically stable and continue to mobilize revenues
Double trade shock; hinges on highly concessionalfinancing
Poor export performance or less favorable terms of donor financing; a nominal depreciation
Fiscal policy slippages and external shocks
Poor export performance or less favorable terms of donor financing
Heavy reliance on donor support; macroeconomic shocks and imprudent debt management
Terms of new borrowing and export shocks in particular; but sensitive to most stress tests
Needs highly concessional financing and swift diversification of exports
Ghana Moderate
Mali Moderate
Tanzania Moderate
Uganda Moderate
Mauritania Moderate
Ethiopia High
Rwanda High
Source: Low Income Country Debt Sustainability Analyses
10
Post-completion point countries have grown the fastest in recent years
Real GDP Growth Rates Old (1980–93) Early (1994–1998) Recent (1999–2003) 18 Post-completion point 1.7 4.3 4.3 30 Non-HIPC IDA only 1.1 3.5 3.8 10 Decision point 2.2 1.2 2.7 10 Pre-decision point 0.5 7.0 2.7 Source: World Development Indicators

11
…and still score highest on key policy ratings
2
2.5
3
3.5
4
1999 2000 2001 2002 2003 2004
Over
all C
PIA
Scor
e
Post CP HIPC DP HIPC
Non HIPC IDA Only Pre DP HIPC

12
Modest progress on MDGs in 18 post-completion point countries
Countries with data
Progress: 1999 to 2004
Reduce child mortality 18 Improvement
Promote gender equality and empower women
4 Improvement
Achieve universal primary education 13 Modest improvement
Ensure environmental sustainability 17 Modest improvement
Combat HIV/AIDS, malaria and other diseases
14 No change
Develop a global partnership for development
11 Modest improvement
Eradicate extreme hunger and poverty 1 No change
Improve maternal health 0 UNKNOWN
13
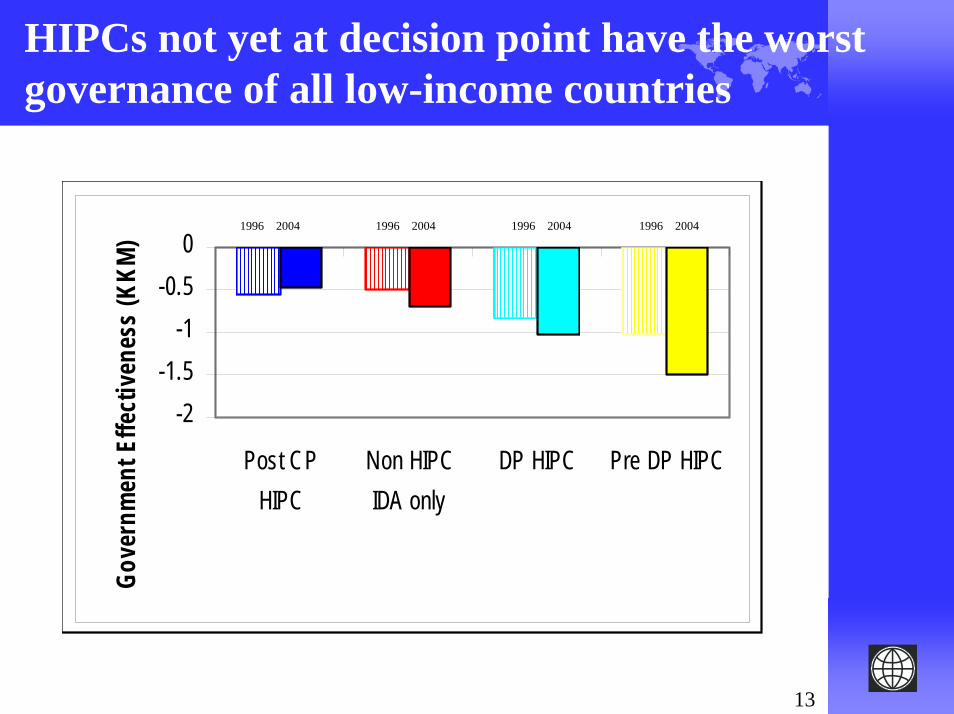
HIPCs not yet at decision point have the worst governance of all low-income countries
-2-1.5
-1-0.5
0
Post CPHIPC
Non HIPCIDA only
DP HIPC Pre DP HIPC
Gove
rnm
ent E
ffect
iven
ess
(KKM
) 1996 2004 1996 2004 1996 20041996 2004

14
Debt management capacity has worsened in all low-income countries
2
2.5
3
3.5
4
4.5
1999 2000 2001 2002 2003 2004
Debt
Ser
vice
and
Deb
t Man
agem
ent
(CPI
A)
Post CP HIPC DP HIPC Non HIPC IDA Only Pre DP HIPC

15
Summary
• HIPC is affecting the overall allocation of concessional resources
• Debt relief alone does not guarantee debt sustainability
• Countries not yet at decision point face serious challenges in managing their economies
• HIPC countries need help in improving their debt management capacity