Embed Size (px)
Citation preview

WWW.IBISWORLD.COM Debt Collection Agencies in the US June 2019 1
IBISWorld Industry Report 56144Debt Collection Agencies in the USJune 2019 Anna Amir
Circle the sharks: Increasingly stringent regulations have made it harder to collect debt
2 About this Industry2 Industry Definition
2 Main Activities
2 Similar Industries
3 Additional Resources
4 Industry at a Glance
5 Industry Performance5 Executive Summary
5 Key External Drivers
7 Current Performance
9 Industry Outlook
11 Industry Life Cycle
13 Products and Markets13 Supply Chain
13 Products and Services
15 Demand Determinants
16 Major Markets
17 International Trade
18 Business Locations
20 Competitive Landscape20 Market Share Concentration
20 Key Success Factors
20 Cost Structure Benchmarks
22 Basis of Competition
23 Barriers to Entry
24 Industry Globalization
25 Major Companies25 Alorica Inc.
26 Encore Capital Group Inc.
27 PRA Group Inc.
27 GC Services
29 Operating Conditions29 Capital Intensity
30 Technology and Systems
31 Revenue Volatility
31 Regulation and Policy
33 Industry Assistance
34 Key Statistics34 Industry Data
34 Annual Change
34 Key Ratios
35 Industry Financial Ratios
36 Jargon & Glossary
www.ibisworld.com | 1-800-330-3772 | [email protected]
This report was provided toSeattle Pacific University (2134440152)by IBISWorld on 03 December 2019 in accordance with their license agreement with IBISWorld

WWW.IBISWORLD.COM Debt Collection Agencies in the US June 2019 2
The Debt Collection Agencies industry comprises businesses that pursue payments on debts owed by individuals and businesses. Most collection agencies operate as agents of creditors and render
their services for a fee or percentage of the total amount owed. Other agencies purchase debt portfolios from creditors at a discount and then pursue outstanding balances for their own gain.
The primary activities of this industry are
Account collection services
Bill collection services
Debt collection services
Delinquent account collection services
Tax collection services on a contract or fee basis
Collection on debt portfolios
Repossession services
Credit reporting services
52221 Credit Card Issuing in the USCredit card companies employ debt collection agencies to collect defaulted debt.
52231 Loan Brokers in the USEstablishments that arrange loans, especially mortgages, by bringing borrowers and lenders together on a commission or fee basis.
52239 Loan Administration, Check Cashing & Other Services in the USLoan servicing institutions outsource default loans to debt collection agencies for collection.
56145 Credit Bureaus & Rating Agencies in the USCredit bureaus provide credit reports on individuals and businesses.
Industry Definition
Main Activities
Similar Industries
About this Industry
The major products and services in this industry are
Contingency collections services by letter and email
Early-out receivables services
Portfolio acquisition
Other contingency collections services
Other
Provided to: Seattle Pacific University (2134440152) | 03 December 2019

WWW.IBISWORLD.COM Debt Collection Agencies in the US June 2019 3
About this Industry
Additional Resources For additional information on this industry
www.acainternational.org The Association of Credit and Collection Professionals
www.commercialcollectionagenciesofamerica.com The Commercial Collection Agency Association
www.federalreserve.gov The Federal Reserve
www.commercialcollector.com The International Association of Commercial Collectors
IBISWorld writes over 1000 US industry reports, which are updated up to four times a year. To see all reports, go to www.ibisworld.com
Provided to: Seattle Pacific University (2134440152) | 03 December 2019

WWW.IBISWORLD.COM Debt Collection Agencies in the US June 2019 4
% c
hang
e
9
-3
0
3
6
2513 15 17 19 21 23Year
Aggregate household debt
SOURCE: WWW.IBISWORLD.COM
% c
hang
e
4
-8
-6
-4
-2
0
2
2511 13 15 17 19 21 23Year
Revenue Employment
Revenue vs. employment growth
Products and services segmentation (2019)
63.3%Other contingency collections services
22.8%Contingency collections
services by letter and email
5.9%Early-out receivables services
4.4%Other
3.6%Portfolio
acquisition
Key Statistics Snapshot
Industry at a GlanceDebt Collection Agencies in 2019
Industry Structure Life Cycle Stage Mature
Revenue Volatility Medium
Capital Intensity Low
Industry Assistance Low
Concentration Level Low
Regulation Level Medium
Technology Change Medium
Barriers to Entry Low
Industry Globalization Low
Competition Level Medium
Revenue
$11.5bnProfit
$1.2bnWages
$4.8bnBusinesses
7,837
Annual Growth 19–24
-2.2%Annual Growth 14–19
-2.9%
Key External DriversAggregate household debtOutsourcing to the Debt Collection Agencies industryPer capita disposable incomeYield on 10-year Treasury note
Market ShareAlorica Inc. 16.9%
Encore Capital Group Inc. 6.8%
PRA Group Inc. 5.4%
p. 25
p. 5
FOR ADDITIONAL STATISTICS AND TIME SERIES SEE THE APPENDIX ON PAGE 34
SOURCE: WWW.IBISWORLD.COM
Provided to: Seattle Pacific University (2134440152) | 03 December 2019

WWW.IBISWORLD.COM Debt Collection Agencies in the US June 2019 5
Key External Drivers Aggregate household debtThe more debt households accrue, the more collection opportunities arise for industry operators. At a certain point, however, increased financial liability increases the chance of default. Typically, after defaulting, households begin the process of paying off old debt while avoiding new debt, which is also known as deleveraging. This process leads to fewer opportunities for debt collectors.
Fortunately for industry operators, aggregate household debt is expected to rise in 2019, representing a potential opportunity for the industry.
Outsourcing to the Debt Collection Agencies industryCredit-issuing companies have attempted to manage cash flow and costs by outsourcing debt collection services at higher rates. This ongoing
Executive Summary Over the five years to 2019, revenue for the Debt Collection Agencies industry is expected to contract at an annualized rate of 2.9% to $11.5 billion. At the start of the period, cautious consumers began deleveraging, and aggregate household debt decreased between 2014 and 2015, which resulted in lower industry revenue. Beginning in 2016, industry revenue continued to decline, even though households were readily assuming debt. This is partly attributed to more stringent supervision from the Consumer Financial Protection Bureau (CFPB) and lower debt
recovery rates. As a result, industry revenue is expected to contract an estimated 1.5% in 2019 alone as regulations continue to mount and the enforcement of these regulations becomes a major priority for the CFPB.
Overall, the level of debt in the United States has increased slightly during the five-year period as the Federal Reserve raised interest rates several times. This regulatory behavior encourages households to take on more debt while rates are still relatively low. However, rates are expected to plateau and remain
at historically low levels. Moreover, consumer conditions will continue to improve, which will further increase demand for household credit. Thus, declining industry revenue during the period is not a result of industry services becoming less valuable, but rather a product of more stringent regulations that have made it harder to collect debt. Despite declining revenue, industry profit, measured as earnings before interest and taxes, is expected to grow slightly during the five-year period.
Over the five years to 2024, aggregate household debt is expected to increase at an annualized rate of 3.9%, compared with 0.8% during the previous five-year period. However, IBISWorld forecasts that only the largest establishments will be able to take advantage of these opportunities, as rising regulatory costs will limit the number of smaller operators entering the industry. While rising aggregate household debt should result in a steady increase in potential revenue sources, further regulations proposed by the CFPB are likely to be fully implemented over the next five years. These regulations seek to curtail collectors’ aggressive tactics and will ultimately increase the cost for industry operators and limit their demand. Due to these factors, IBISWorld expects industry revenue to continue to decline at an annualized rate of 2.2% to $10.2 billion over the five years to 2024.
Industry PerformanceExecutive Summary | Key External Drivers | Current Performance Industry Outlook | Life Cycle Stage
Declining industry revenue is not a result of industry services becoming less valuable, but rather a product of more stringent regulations
Provided to: Seattle Pacific University (2134440152) | 03 December 2019

WWW.IBISWORLD.COM Debt Collection Agencies in the US June 2019 6
Industry Performance
Key External Driverscontinued
trend has resulted in increased opportunities for industry operators. Outsourcing to the Debt Collection Agencies industry is expected to slightly decrease in 2019, representing a potential threat to the industry.
Per capita disposable incomeAn increase in disposable income typically results in increased borrowing activity, which benefits industry operators, particularly within accounts receivable management services. Additionally, increases in disposable income typically translate to higher
collection rates for debt collection agencies. Per capita disposable income is expected to increase in 2019.
Yield on 10-year Treasury noteThe yield on a 10-year Treasury bond serves as a proxy for interest rates. Although the two do not always line up, traditionally, a decrease in interest rates is associated with a rise in borrowing by consumers and businesses. As borrowing causes demand for accounts receivable to increase, management also rises, driving industry growth. The yield on a 10-year Treasury note is expected to decrease in 2019.
% c
hang
e4
-4
-2
0
2
2513 15 17 19 21 23Year
Per capita disposable income
SOURCE: WWW.IBISWORLD.COM
% c
hang
e
9
-3
0
3
6
2513 15 17 19 21 23Year
Aggregate household debt
Provided to: Seattle Pacific University (2134440152) | 03 December 2019

WWW.IBISWORLD.COM Debt Collection Agencies in the US June 2019 7
Industry Performance
Current Performance
Performance in the Debt Collection Agencies industry is largely driven by the overall availability of collection opportunities, i.e. the number of defaulted accounts that an agency services. The total amount of collectible debt for industry operators is derived from total consumer debt and the degree to which delinquent debt is outsourced to credit agencies. The recovery rate, the percentage of debt that an agency can collect, is also an important component of industry performance and largely speaks to consumers’ ability to repay their liabilities. The recovery rate is generally influenced by individual agency strategies and macroeconomic conditions, such as household disposable income and the unemployment rate.
Over the five years to 2019, industry revenue is expected to decline at an annualized rate of 2.9% to $11.5 billion. This decline is a result of stringent regulations and fewer collection opportunities. Aggregate household debt in the US declined between 2014 and 2015, reducing the number of collection opportunities for industry operators. However, since 2015, consumers have cautiously accrued debt, and aggregate household debt has been gradually increasing at a relatively low rate. Prudent consumer debt accrual during the period has resulted in decreased demand for industry services, which has negatively affected industry revenue.
In addition to weak demand, stronger regulations imposed by the Consumer Financial Protection Bureau (CFPB) have also threatened the industry. For many small-time players, these new rules have limited their ability to compete and have negatively affected these agencies’ margins. In 2019, industry revenue is expected to shrink 1.5%.
Since 2014, the industry has attempted to bolster profit margins by consolidating and privatizing enterprises to increase efficiency and take advantage of economies of scale. As a result, IBISWorld estimates that the number of enterprises has fallen at an annualized rate of 2.8% to 7,837 in 2019. During the five-year period, employment is expected to drop at an annualized rate of 2.9% to 115,041 people as businesses seek to reduce redundancies following consolidation.
% c
hang
e
4
-8
-6
-4
-2
0
2
2511 13 15 17 19 21 23Year
Industry revenue
SOURCE: WWW.IBISWORLD.COM
Consumer debt Prior to the recession, credit lending standards were relatively lenient, and Americans increasingly funded expenditures through credit cards, mortgage financing and home equity loans. As a result, collection agencies benefited from increases in available debt. The expansion of revolving and nonrevolving credit caused consumer
credit to grow. Revolving credit enables the consumer to use a preapproved credit limit repeatedly and to redraw paid funds, which are based on the amount of credit withdrawn plus interest on a specific date. Revolving credit options can include home equity loans and some credit cards. Nonrevolving credit, conversely, must be paid off in full,
Provided to: Seattle Pacific University (2134440152) | 03 December 2019

WWW.IBISWORLD.COM Debt Collection Agencies in the US June 2019 8
Industry Performance
usually through installments, and it cannot be borrowed repeatedly. Common examples of nonrevolving debt include auto and education loans.
Despite more stringent lending standards being introduced in the wake of the recession, access to credit has increased over the five years to 2019 as the economy has grown, unemployment has dropped and per capita disposable income has risen. At the beginning of the period, due to the recession’s lingering effects, consumers continued deleveraging, with total household debt decreasing 2.0% and 0.4% in 2014 and
2015, respectively. Aggregate household debt began to climb marginally in 2016 and continued to rise over the remaining years of the period. During the latter half of the period, IBISWorld estimates that debt recovery rates fell due to increased regulation. A recent study completed by the Federal Reserve Bank of Philadelphia found that recovery rates on charged-off assets decreased 1.1% for each added regulation. Falling recovery rates have decreased returns on existing assets and, compounded with limited collection opportunities, drained industry revenue.
Consumer debt continued
Increased regulations Prior to the start of the period, the Dodd-Frank Act grants the Consumer Financial Protection Bureau (CFPB) enforcement and rule-making powers over large consumer debt collectors. Any collection agency with more than $10.0 million in annual receipts is subject to the CFPB’s supervisory authority. The CFPB will ensure that debt collectors provide required disclosures to consumers, provide accurate information, have a consumer complaint and dispute resolution process and communicate civilly and honestly with consumers. The bureau has turned its attention toward debt collection practices as consumers file complaints about third-party debt collectors.
In general, the CFPB has moved to raise the standard of substantiation for debt buyers and third-party collectors, mainly through enforcement. The CFPB wishes to limit collectors contacting consumers and raise the quality of information needed from collectors before collection can occur to ensure that collectors are targeting the right debt. These policies, if fully implemented, would reduce the pool of available distressed accounts that can be collected on, reducing demand for industry
services and increasing the cost to operate in the industry. The CFPB litigated several significant cases in 2015 regarding collection tactics and the use of unverifiable and inaccurate information. Although these regulations currently target third-party collectors, the CFPB is expected to continue to pursue these regulations through litigation and enforcement for all collectors, including first-party participants.
A 2015 study by the Philadelphia Federal Reserve Bank found that stricter debt collection regulations correlated with fewer operators in the industry and lower recovery rates on delinquent credit card loans. Using an index of the state-level strictness of debt collection laws, the study found that a 1.0 percentage point increase in regulations resulted in a 16.0% decline in debt collectors per 1.0 million people and a 9.0% decline in the recovery rates of the
The CFPB is raising the standard of substantiation for debt buyers and third-party collectors
Provided to: Seattle Pacific University (2134440152) | 03 December 2019

WWW.IBISWORLD.COM Debt Collection Agencies in the US June 2019 9
Industry Performance
Industry Outlook
Over the five years to 2024, many operators in the Debt Collection Agencies industry will continue to be negatively affected by trends in employment and government regulation. Increasing collection rates and outstanding credit are expected to provide growth opportunities for the industry, yet expanding regulations have the potential to fundamentally change the operating landscape. Household debt is projected to increase between 2020 and 2024, bolstering industry revenue as the pool of outstanding debt
rises. However, unemployment rates are expected to rise, which will reduce consumers’ ability to pay back outstanding loans and dampen recovery rates. Moreover, each additional piece of regulation imposed by the Consumer Financial Protection Bureau (CFPB) will further lower the recovery rate, effectively erasing potential gains. As a result, without drastic changes to the CFPB, IBISWorld expects industry revenue to decrease at an annualized rate of 2.2% to $10.2 billion over the next five years.
sample group. Further, these two effects led to a decrease in the number of new revolving lines of credit, which limits the availability of future collection. While
these connections are not meant to imply causality, they do suggest a strong inverse relation between regulation and industry performance.
Increased regulations continued
Consumer credit As the economy continues to grow, access to credit will continue to rise as well, potentially increasing household debt. IBISWorld projects that household debt levels will increase at an annualized rate of 3.9% to $15.6 trillion over the next five years, amid rising interest rates. Credit growth has historically been associated with improved macroeconomic conditions, which includes lower unemployment rates, higher disposable income and rising housing prices. The macroeconomic landscape for consumers is projected to improve over the next five years as the economy continues to prosper. Although interest rates are expected to remain relatively stable over the next five years.
Furthermore, the growth in consumer credit depends on the level of unmanageable debt already in the market, and creditors’ ability to manage uncollectible accounts. Charge-offs are expected to return to historical averages
between 2019 and 2024. This situation is projected to benefit the industry because the pool of outstanding debt increases as the proportion of unmanageable debt drops, which drives business. Increased outsourcing of debt collection duties is projected to persist in 2024 due to businesses exercising caution with operational cash flow and costs. Outsourcing will likely occur at earlier stages in the delinquency process, increasing agencies’ likelihood to collect on delinquent debts. The greater availability of new business, combined with earlier collection cycles, will likely improve collection rates and support revenue growth.
Increased outsourcing of debt collection duties is projected to persist
Provided to: Seattle Pacific University (2134440152) | 03 December 2019

WWW.IBISWORLD.COM Debt Collection Agencies in the US June 2019 10
Industry Performance
Mergers and acquisitions
In a tough regulatory environment, the industry is expected to engage in a small degree of consolidation, wherein larger industry players grow by acquiring smaller companies. Increased regulation is expected to bring greater compliance costs, harming smaller players more than larger ones. In addition, larger players will look to grow revenue by acquiring smaller operators with high-quality debt portfolios. Just as revenue is expected to decline during the period, the number of industry establishments is expected to decline at an annualized rate of 2.4% to 7,400, as larger enterprises gain market share at the expense of their smaller counterparts. Industry profit is also expected to decline as a result of increasingly stringent regulations.
Consolidation is beneficial to collection agencies because it enables them to use economies of scale when negotiating contracts, purchasing debt portfolios and locating delinquent customers. At the same time, most of the agencies’ clientele
is subject to consolidation trends within their own industries, including banking, telecommunications and healthcare. The need for larger debt agencies grows as customers consolidate because major customers offer higher volumes than their smaller counterparts. As a result, the number of large debt collection agencies is expected to rise over the next five years, either through organic growth or mergers and acquisitions. The consolidation trend will also likely lower costs due to greater leveraging of information technology (IT) systems. The use of IT programs will improve employee productivity and collection rates, thereby lowering costs.
Increased regulation is expected to bring greater compliance costs, harming smaller players more
Technological developments
Technological developments over the next five years will likely include improvements in data warehousing, proprietary databases, computerized calling systems, debtor location databases and the use of statistical models to more accurately forecast the probability of payment. The use of technology solutions will likely result in better collection rates as agents will gain access to tools such as statistical models, scoring systems and segmentation formulas. Technological investments will also gain importance
as regulatory and compliance requirements increase, especially regarding data security.
Technological improvements will not only increase collection rates but also lower costs and improve productivity. Advanced technologies will decrease hiring levels with improved efficiency. Employment will continue to decline as the number of establishments decreases. Overall, employment is forecast to continue to decline, falling an annualized 2.4% to 102,070 workers over the five years to 2024.
Provided to: Seattle Pacific University (2134440152) | 03 December 2019

WWW.IBISWORLD.COM Debt Collection Agencies in the US June 2019 11
Industry PerformanceIndustry value added is forecast to decline, opening debate to the industry’s current life cycle
The industry continues to consolidate and privatize operations
Technological change has not been a major driver of industry growth
There have been no major introductions of new products or services
Life Cycle Stage
Provided to: Seattle Pacific University (2134440152) | 03 December 2019

WWW.IBISWORLD.COM Debt Collection Agencies in the US June 2019 12
Industry Performance
Industry Life Cycle The Debt Collection Agencies industry is at an interesting crossroad. Currently, IBISWorld classifies the industry as mature. However, the looming prospect of further regulation could result in the industry entering the declining stage of its life cycle. Conversely, any dismantling of these regulations would immediately benefit the industry. Currently, the industry is characterized by a stable product segment and a declining number of establishments. However, industry value added (IVA), a measure of the industry’s total contribution to the national economy, is declining while GDP continues to rise. The industry’s IVA is expected to decline at an annualized rate of 2.4% over the 10 years to 2024. In contrast, US GDP is forecast to increase at an annualized rate of 2.2% during the same period. An industry with an IVA changing at a slower rate than the US economy is typically characterized as
an industry in the mature stage of its economic life cycle.
Demand for industry services is largely driven by the level of aggregate household debt. The higher the amount of debt, the more likely debt collection services will be needed. While the industry has introduced new technology to better forecast collection rates and establish contact with debtors, the industry’s product segments have remained fairly stable. Stable product segmentation is indicative of an industry in its mature phase.
Over the 10 years to 2024, the number of industry enterprises will decline due to rising costs associated with increased regulation. Further, debt portfolio sellers are becoming more selective in their choice of clientele. These pressures are causing smaller operators to exit the industry or be acquired by larger players. Consolidation within an industry is a trait indicative of an industry in its mature phase.
This industry is Mature
Provided to: Seattle Pacific University (2134440152) | 03 December 2019

WWW.IBISWORLD.COM Debt Collection Agencies in the US June 2019 13
Products and Services
Contingency collection servicesContingency collection services generate the largest share of Debt Collection Agencies industry revenue, as it is the most widely used method for recovering income on nonperforming or delinquent debt accounts. Multiple methods are used to contract the
owners of these delinquent accounts, including email, letters, telephone calling among others. Overall, this segment is expected to account for 86.1% of industry revenue, with the bulk of the segment coming from written correspondence. Under the system, creditors write off loans or
Products & MarketsSupply Chain | Products and Services | Demand Determinants Major Markets | International Trade | Business Locations
KEY BUYING INDUSTRIES
52221 Credit Card Issuing in the US Credit card issuing banks use collection agencies to recover delinquent credit card receivables.
52229 Real Estate Loans & Collateralized Debt in the US Financial firms use collection agencies to recover delinquent debt associated with mortgages, home equity loans and credit lines.
53111 Apartment Rental in the US Real estate lessors use collection agencies to recover delinquent rental receipts.
62 Healthcare and Social Assistance in the US Healthcare providers, most notably hospitals, use collection agencies to recover delinquent debt associated with patient medical bills.
KEY SELLING INDUSTRIES
52221 Credit Card Issuing in the US Credit card companies sell portfolios of delinquent credit cards to collection agencies.
52229 Real Estate Loans & Collateralized Debt in the US Mortgage servicing companies sell portfolios of delinquent mortgages to collection agencies.
56145 Credit Bureaus & Rating Agencies in the US Credit bureaus provide rating services on delinquent debt purchased by collection agencies. Industry participants also use bureaus to locate delinquent consumers and determine the likelihood of debt recovery.
Supply Chain
Products and services segmentation (2019)
Total $11.5bn
63.3%Other contingency collections services
22.8%Contingency collections
services by letter and email
5.9%Early-out receivables services
4.4%Other
3.6%Portfolio
acquisition
SOURCE: WWW.IBISWORLD.COM
Provided to: Seattle Pacific University (2134440152) | 03 December 2019

WWW.IBISWORLD.COM Debt Collection Agencies in the US June 2019 14
Products & Markets
Products and Servicescontinued
place them with collection agencies after accounts are deemed uncollectible. Then, collection agencies are paid a fee calculated as a percentage of the amount of debt recovered on these uncollectible accounts.
Receivables are generally valued on the creditor’s balance sheet at a discount, with reserves established to hedge against the possibility of noncollection. The commission rate for contingent-fee services is generally based on the degree of collection difficulty. Generally, the earlier the placement, the lower the commission rate, due to the higher probability of debt recovery.
In the contingent collecting business, there are three main types of placements; each represents a different stage in the cycle of account collection. Primary placements are accounts that are usually 90 to 270 days past due. These types of accounts usually comprise first-time placements and have the highest collection rates and lowest commissions. Secondary placements are generally 270 to 360 days past due and have already been recalled from a primary collection agency. Tertiary placements are typically accounts that are more than 360 days past due and have been recalled from one or more collection agencies. Tertiary placements normally receive the highest commission rates due to the difficulty of collecting them.
Portfolio-acquisition servicingThe purchasing of delinquent debt portfolios generates 3.6% of industry revenue is an alternative to contingent collection servicing. Under government mandate, the Resolution Trust Corporation and the Federal Deposit Insurance Corporation began to sell portfolios of nonperforming loans in the 1980s. The program was designed to cleanse these entities of bad loans by enabling them to sell charged-off debt. The practice’s success spurred other
creditors such as private entities to join in this practice, resulting in the present-day market.
The majority of purchased portfolios originate from the bankcard receivable and retail markets. Industry operators typically purchase these portfolios at a deep discount from the aggregate principal value of the accounts, with an inverse correlation between the purchase price and the age of the delinquent accounts (i.e. younger accounts are less expensive). Once purchased, agencies employ traditional collection techniques to obtain payment of nonperforming accounts.
Early-out receivables servicesEarly-out receivables services are expected to generate 5.9% of industry revenue. While this segment is less common than contingency collections, it remains an important service structure for debt collections. Early-out services involve collection agencies contacting individuals prior to the claims being placed in full collections. This service is frequently used by hospitals and other healthcare professionals. Over the five years to 2019, this segment has increased as it helps improve operational efficiency.
Other servicesEstimated to generate 4.4% of industry revenue in 2019, credit rating reports are considered a minor but still-important part of the debt collection process. Collection agencies write credit reports and then sell them to credit-reporting agencies not only to generate revenue but also to extract funds from debtors. Throughout the collection process, collection agencies will use the threat of reporting defaulted debt to credit agencies as a tool to persuade, or more often scare debtors to pay. The threat of reporting defaulted credit often works because of the long-term effects it can have on a debtor’s ability to secure financing. Revenue from this segment is
Provided to: Seattle Pacific University (2134440152) | 03 December 2019

WWW.IBISWORLD.COM Debt Collection Agencies in the US June 2019 15
Products & Markets
Demand Determinants
Economic growthDuring times of strong economic growth, US debt levels increase, particularly within the consumer sector. Strong economic growth coincides with job creation, asset appreciation and high consumer sentiment. As a result, consumers will often borrow more money, especially if asset holdings such as real estate or equities gain value. When debt levels increase, the potential pool of debt also rises, particularly if banks lower lending standards to boost borrowing activity and market share. However, lower lending standards and higher debt levels cause demand for Debt Collection Agencies industry services to rise as the potential pool of delinquent borrower’s increases. During periods of economic downturn, economic growth stagnates and consumers typically begin to lower their own debt levels, which decreases demand for industry services. Banks and credit unions also became less willing to lend money as consumers are more likely to default on their debt. This created a lower pool of debt for industry participants.
Interest ratesInterest rates are an important indicator of industry demand since lending activity rises when rates are low. Low interest rates influence borrowing activity because the cost of debt declines as rates fall. This factor is important for industry performance because growth is driven by the amount of consumer and commercial debt within the marketplace. Higher debt levels support demand for industry services because loan originators generally outsource management of accounts receivables and sell performing and nonperforming debt. Despite low but rising
interest rates over the past five years, the level of debt has actually been decreasing due to tighter restrictions on lending.
Desire to reduce operating expensesOutsourcing of noncore functions also influences demand for debt collection services. In recent years, many large corporations have recognized the advantages of outsourcing, which are often driven by industry-specific factors. The complexity of accounts receivable management and collection functions in certain industries has increased significantly in recent years. For example, with the increasing popularity of health maintenance organizations and preferred provider organizations, healthcare institutions experience the challenge of billing large insurance companies and individuals who are required to pay small, one-time co-payments. The end result of outsourcing for businesses is lower costs and increased cash flow. Outsourcing also forces other companies to compete for business, thus improving the overall quality of debt collecting operations. Over the past five years, outsourcing has been a key factor in bolstering industry revenue.
Disposable incomeDisposable income directly correlates to the amount of debt a consumer is willing to carry. The more disposable income a consumer makes, the more they are able to borrow. Several factors determine disposable income, including age, education and the unemployment rate. While improvements in education over the past decade have consistently contributed to increasing income levels, the unemployment rate has had a far
Products and Servicescontinued
expected to remain steady over the next five years as credit scores remain a cornerstone of consumer financing.
Provided to: Seattle Pacific University (2134440152) | 03 December 2019

WWW.IBISWORLD.COM Debt Collection Agencies in the US June 2019 16
Products & Markets
Major Markets
Financial services sectorIBISWorld estimates that the financial services sector accounts for 36.6% of Debt Collection Agencies industry revenue. Clients in this segment consist of commercial banks, credit card issuers, loan providers and a host of others. The probability of collection usually determines which services the customer chooses. If an institution, wishes to lower the liabilities on their balance sheets, they may sell a portfolio of debt to a collection agency at a depressed price. By doing so, such institutions or agencies are able to collect some tangible amount while writing off the rest.
Telecommunications and utility sectorThe telecommunications and utility sectors are expected to account for 20.1% of industry revenue in 2019. Debt recovered in this industry usually stems from individual consumers who default on their telephone bills (usually a
contract) or electricity bills. While some telecommunication carriers and utility companies require credit checks on new customers others do not, this leads to a high number of consumers who set up services but are soon unable to pay the bill. At this point, companies contact debt collectors who then take over the process and try to recover the lost debt. Overall, this segment has increased during the period due to increased demand for telecommunication and utility services.
Healthcare sectorThe healthcare services providers, mostly hospitals account for a significant share of industry demand. IBISWorld expects this segment to account for 11.3% of industry revenue in 2019. Hospital expenses can amount to large sums, leading to potentially profitable accounts for debt collectors. In the past, hospitals were hesitant to refer accounts to debt collectors out of fear of losing part of
Demand Determinantscontinued
greater effect recently. When the unemployment rate remains stubbornly elevated, disposable income grows more slowly. Over the past five years, falling unemployment has supported
income growth for consumers. In the coming five years disposable income is forecasted to increase steadily, encouraging households to take on more debt.
Major market segmentation (2019)
Total $11.5bn
36.6%Financial services
9.0%Government
agencies
20.1%Telecommunications and utility
13.3%Other
11.3%Healthcare
9.7%Retail
SOURCE: WWW.IBISWORLD.COM
Provided to: Seattle Pacific University (2134440152) | 03 December 2019

WWW.IBISWORLD.COM Debt Collection Agencies in the US June 2019 17
Products & Markets
International Trade Most delinquent US debt is assigned or sold to domestic collection agencies. US collection agencies have a better knowledge of the marketplace, particularly regarding legal requirements and procedures. Several Debt Collection Agencies industry major players have set up offices outside of the US market to
lower costs and diversify operations, but the majority of these establishments are call centers associated with US domiciled enterprises. Foreign creditors do participate in the US market, but they generally operate under a local subsidiary that specializes in the marketplace.
Major Marketscontinued
their customer base. In addition, charity institutions would sometimes step in and pay a portion of the debt, softening the blow for hospitals. However, as the number of individuals who are insured has increased significantly during the period, according to the Center for Disease Control and Prevention, hospitals are now better positioned to receive payments from insurers. As a result, this market’s share of industry revenue has decreased during the period.
Retail sectorIn 2019, IBISWorld expects the retail sector to account for 9.7% of industry revenue. This segment’s customers usually consist of retail stores that let consumers buy products on credit. While initially retailers will try and track down debtors who are delinquent themselves, however as time goes by and the cost of recouping funds become too high, they may contact a debt collection agency. During periods of economic downturn,
households typically begin deleveraging and postponing big-ticket items, and demand for industry services from this segment would fall. With overall economic improvement and gains in disposable income, demand for big-ticket has increased over the five years to 2019.
Government agenciesGovernment agencies, including both the federal and local governments are expected to account for 9.0% of total industry revenue. This market has been growing during the period, as a portion of it includes federal student loans. Both tuition and enrollment have been increasing during the period, resulting in increased demand for student loans to help cover educational expenses.
OtherOther markets are expected to account for 13.3% of industry revenue and include the technology and transportation sectors.
Provided to: Seattle Pacific University (2134440152) | 03 December 2019

WWW.IBISWORLD.COM Debt Collection Agencies in the US June 2019 18
Products & Markets
Business Locations 2019
MO1.8
West
West
West
Rocky Mountains Plains
Southwest
Southeast
New England
VT0.1
MA1.7
RI0.1
NJ3.1
DE0.6
NH0.5
CT0.8
MD1.6
DC0.0
1
5
3
7
2
6
4
8 9
Additional States (as marked on map)
AZ2.5
CA10.6
NV1.1
OR1.8
WA2.7
MT0.6
NE0.9
MN2.2
IA0.5
OH3.1 VA
1.9
FL6.9
KS1.3
CO2.2
UT1.1
ID0.7
TX7.3
OK1.4
NC1.9
AK0.3
WY0.5
TN1.6
KY1.2
GA3.6
IL4.3
ME0.3
ND0.4
WI1.3 MI
2.1 PA4.2
WV0.2
SD0.4
NM0.3
AR0.7
MS0.7
AL1.1
SC1.0
LA1.4
HI0.4
IN2.2
NY10.9 5
67
8
321
4
9
SOURCE: WWW.IBISWORLD.COM
Mid- Atlantic
Establishments (%)
Less than 3% 3% to less than 10% 10% to less than 20% 20% or more
Great Lakes
Provided to: Seattle Pacific University (2134440152) | 03 December 2019

WWW.IBISWORLD.COM Debt Collection Agencies in the US June 2019 19
Products & Markets
Business Locations The geographic distribution of debt collection agencies largely reflects general economic and business activity. The spread is also virtually identical to the US population distribution and business support services. The majority of business operations are conducted over the phone, but local establishments help ensure that collectors can locate delinquent customers and merchandise. This factor is particularly important with auto loans and the repossession of automobiles.
The Southeast accounts for the largest share of debt collection agencies in the United States. IBISWorld estimates that the region accounts for 25.7% of the US population and 22.2% of Debt Collection Agencies industry establishments. Of the 22.2% of establishments the region holds, 6.9% are concentrated in Florida due to the regions rather large population density. Similarly, the Great Lakes region accounts for 13.0% of industry establishments, in line with its share of the US population. Furthermore, the region is home to the state of Illinois, which accounts for 4.3% of industry establishments.
Another significant region for the industry is the Mid-Atlantic. The region accounts for 20.4% of collection agencies. New York accounts 10.9% of establishments in the region. The Mid-Atlantic, particularly New York, is home to many collection agencies predominantly because a large percentage of the US population is located there.
%
30
0
10
20
Sout
hwes
t
Wes
t
Gre
at L
akes
Mid
-Atla
ntic
New
Eng
land
Plai
ns
Rock
y M
ount
ains
Sout
heas
t
EstablishmentsPopulation
Distribution of establishments vs. population
SOURCE: WWW.IBISWORLD.COM
Provided to: Seattle Pacific University (2134440152) | 03 December 2019

WWW.IBISWORLD.COM Debt Collection Agencies in the US June 2019 20
Cost Structure Benchmarks
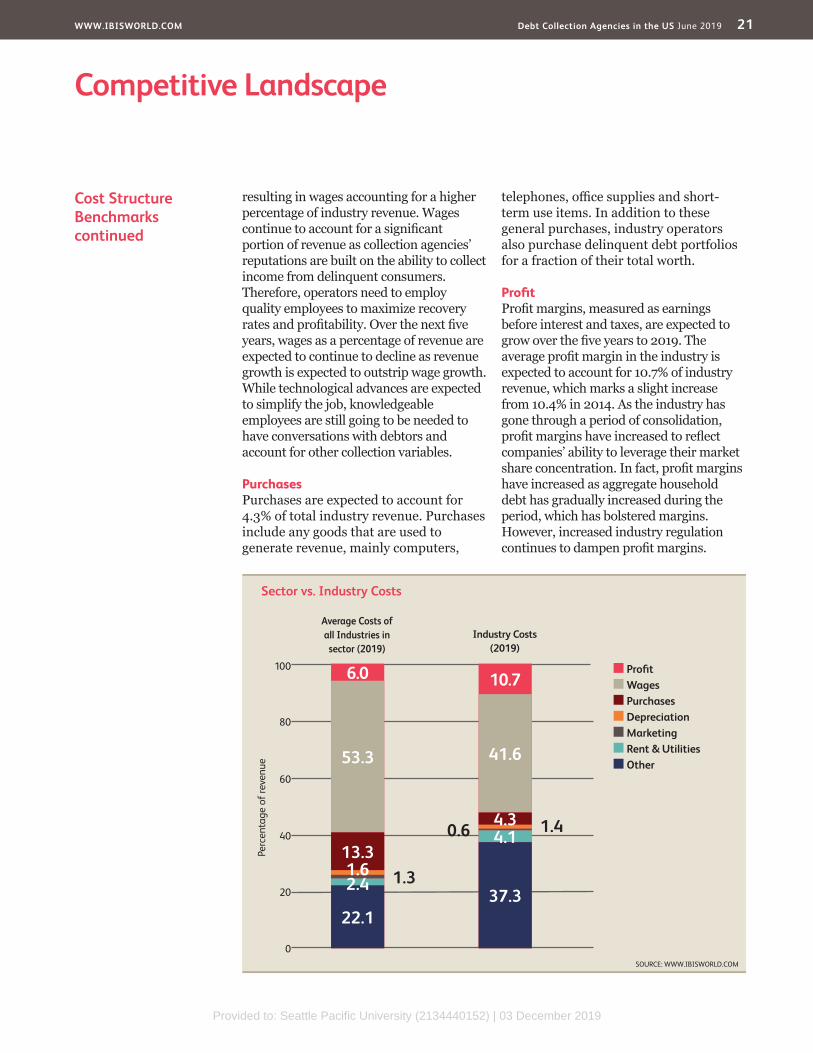
Cost structures for companies operating in the Debt Collection Agencies industry vary depending on the size and scope of the company. The breakdown of costs presented here is an average for all industry players.
WagesWages are expected to account for 41.6% of industry revenue in 2019, up from 40.8% in 2014. Over the five years to 2019, total wages and revenue have both declined, with revenue declining at a faster rate,
Key Success Factors Maintenance of excellent customer relationsA significant amount of growth stems from the maintenance and expansion of existing client relationships.
Highly trained workforceCollectors must be trained in collection techniques, state and federal collection laws, systems, negotiation skills and skip tracing, which is the ability to locate delinquent debtors.
Automation – reduces costs, particularly those associated with laborAutomation of services reduces labor costs and increases margins.
Ability to effectively manage debtorsCollection rates diminish as time progresses. The ability to act quickly in
response to late payments is important for successfully collecting income on delinquent accounts.
Having a high prior success rate (including completed prior contracts)A company’s reputation is based on the ability to collect income from delinquent consumers. It is important to have high recovery rates to establish a strong reputation within the industry, develop new business and retain existing clientele.
Experienced work forceThe ability to hire, train and retain effective collectors is key to continued growth. A skilled and experienced collector may have a work queue of up to 1,000 accounts, compared with the estimated average of 800.
Market Share Concentration
The Debt Collection Agencies industry remains fragmented, with the top four businesses expected to account for 31.4% of the industry in 2019, according to IBISWorld estimates. More than half the industry comprises sole proprietors and partnerships due to the industry’s low barriers to entry. Over the past five years, the top four businesses market share has increased significantly as a result of Alorica Inc.’s 2016 acquisition of Expert Global Solutions, which nearly doubled the company’s industry-relevant revenue. Market share concentration is expected to continue increasing over the next five
years as companies look to mergers and acquisitions for increased revenue.
Acquisition activity is common in a mature marketplace, and IBISWorld projects that this trend will continue over the next five years as businesses focus on cutting costs and improving productivity. Companies will look to grow market share by acquiring smaller operators and their portfolios. Greater reliance on information technology and the ability to leverage economies of scale in business transactions is forecast to support future acquisition activity, increasing market concentration.
Competitive LandscapeMarket Share Concentration | Key Success Factors | Cost Structure Benchmarks Basis of Competition | Barriers to Entry | Industry Globalization
Level Concentration in this industry is Low
IBISWorld identifies 250 Key Success Factors for a business. The most important for this industry are:
Provided to: Seattle Pacific University (2134440152) | 03 December 2019
WWW.IBISWORLD.COM Debt Collection Agencies in the US June 2019 21
Competitive Landscape
Cost Structure Benchmarkscontinued
resulting in wages accounting for a higher percentage of industry revenue. Wages continue to account for a significant portion of revenue as collection agencies’ reputations are built on the ability to collect income from delinquent consumers. Therefore, operators need to employ quality employees to maximize recovery rates and profitability. Over the next five years, wages as a percentage of revenue are expected to continue to decline as revenue growth is expected to outstrip wage growth. While technological advances are expected to simplify the job, knowledgeable employees are still going to be needed to have conversations with debtors and account for other collection variables.
PurchasesPurchases are expected to account for 4.3% of total industry revenue. Purchases include any goods that are used to generate revenue, mainly computers,
telephones, office supplies and short-term use items. In addition to these general purchases, industry operators also purchase delinquent debt portfolios for a fraction of their total worth.
ProfitProfit margins, measured as earnings before interest and taxes, are expected to grow over the five years to 2019. The average profit margin in the industry is expected to account for 10.7% of industry revenue, which marks a slight increase from 10.4% in 2014. As the industry has gone through a period of consolidation, profit margins have increased to reflect companies’ ability to leverage their market share concentration. In fact, profit margins have increased as aggregate household debt has gradually increased during the period, which has bolstered margins. However, increased industry regulation continues to dampen profit margins.
Sector vs. Industry Costs
n Profi tn Wagesn Purchasesn Depreciationn Marketingn Rent & Utilitiesn Other
Average Costs of all Industries in sector (2019)
Industry Costs (2019)
0
20
40
60
Perc
enta
ge o
f rev
enue
80
100
SOURCE: WWW.IBISWORLD.COM
6.0 10.7
37.3
4.10.6 1.44.3
41.6
22.1
2.4 1.31.613.3
53.3
Provided to: Seattle Pacific University (2134440152) | 03 December 2019

WWW.IBISWORLD.COM Debt Collection Agencies in the US June 2019 22
Competitive Landscape
Basis of Competition Internal competitionDebt collection services are divided into accounts receivable management (ARM) and portfolio services. Under the ARM structure, agencies gain competitive advantages through pricing and quality of service. Prices are generally associated with fees that agencies charge for collection services, which are based on the degree of difficulty in recovering income on delinquent accounts. Quality of service is determined by prior success factors associated with recovery rates. Generally, a larger workforce and more established relationships in the Debt Collection Agencies industry help improve an operator’s success in recovering debt. Other factors that are important for ARM accounts include customized solutions, personalized service and advanced information technology systems.
Collection agencies generally gain a competitive advantage under the portfolio services sector by having the ability to value and purchase charged-off
debt. A loan is charged off when a lender deems that the debt is uncollectible. The ability to properly value charged-off debt is important to maintain strong profit margins and successful portfolio operations. Access to capital is also important when trying to acquire debt, as well as the ability to operate over large geographic areas also makes an agency more desirable as debtors are often spread out in line with the general distribution of the population. Over the past five years, the larger companies, such as Alorica Inc. and Encore Capital Group Inc., have been able to acquire smaller companies, thus expanding their geographic coverage.
Industry clientele, such as banks and credit card companies, often choose to outsource their accounts receivable portfolios to industry participants to decrease their own costs, while increasing their cash flow. Outsourcing also creates a substantial amount of competition over portfolio rights, which often increases the quality of collection
Cost Structure Benchmarkscontinued
DepreciationDepreciation costs are relatively stable in the Debt Collection Agencies industry. As a result, IBISWorld anticipates that depreciation will account for 1.4% of industry revenue in 2019, as it did it in 2014.
MarketingWhile industry participants rely on employees to collect outstanding debts and acquire new business, industry services also rely on marketing services to gain new clients. Marketing costs are expected to account for 0.6% of industry revenue in 2019.
RentCollection agencies need a physical location to house staff and meet with
debtor and creditors. As a result, IBISWorld estimates that 2.4% of industry revenue goes toward rent.
UtilitiesIn 2019, IBISWorld estimates that utilities account for 1.7% of industry revenue.
OtherOther expenses are expected to account for 37.3% of total revenue, according to IBISWorld estimates. The largest other expense incurred by industry participants are collection expenses and include any expenses associated with collecting payments on delinquent accounts, including mailing expenses and third-party contingency fees. Other collection outlays include legal expenses and debt write-off charges.
Level & Trend Competition in this industry is Medium and the trend is Increasing
Provided to: Seattle Pacific University (2134440152) | 03 December 2019

WWW.IBISWORLD.COM Debt Collection Agencies in the US June 2019 23
Competitive Landscape
Barriers to Entry Overall, there are few barriers to entry in the Debt Collection Agencies industry. The industry is highly labor intensive, with wages accounting for the largest share of operating costs. The industry has relatively few major players and is highly fragmented demonstrated by a large number of companies in the industry. In 2019, IBISWorld estimates that there are 8,377 establishments in the industry, with the average establishment employing 14 to 15 workers. Starting a collection agency does not require significant technological investment, however, this trend is slowly changing as technology becomes more important in reducing wage costs. Additionally, there are minimal overhead costs, since most expenses are variable and largely dependent on a company’s willingness to advertise or aggressively seek delinquent consumers.
Nonetheless, the access to information technology has become critical to the success of many collection operations. This trend will likely continue since information technology can improve
productivity by lowering labor costs and improving collection rates. This development is expected to benefit larger corporations that are able to invest in technology improvements and then spread those costs over larger books of business. Increased consolidation is also expected to heighten competition and barriers to entry. Still, over the next five years, barriers to entry are expected to remain low, but the success of new entrants is expected to decrease as clients prioritize information technology and geographic scope.
Basis of Competitioncontinued
services beyond what these companies could affordably offer internally. In fact, these companies will often employ several collection agencies to keep internal industry competition high.
External competitionDespite the lower costs of outsourcing debt collections, some large companies
will handle their own collection efforts, or at the very least, extend their initial collection effort before selling the servicing rights or debt to a collection agency. This external competition of in-house operations forces industry participants to spend more on marketing to convince clients to continue to use their services.
Barriers to Entry checklist
Competition MediumConcentration LowLife Cycle Stage MatureCapital Intensity LowTechnology Change MediumRegulation and Policy MediumIndustry Assistance Low
SOURCE: WWW.IBISWORLD.COM
Level & Trend Barriers to Entry in this industry are Low and Increasing
Provided to: Seattle Pacific University (2134440152) | 03 December 2019

WWW.IBISWORLD.COM Debt Collection Agencies in the US June 2019 24
Competitive Landscape
Industry Globalization
The major players associated within the Debt Collection Agencies industry are all United States-owned and operated. However, there has been a trend toward globalization, as companies diversify operations through joint ventures and subsidiaries. Major players, most notably Alorica Inc. through its subsidiarity Expert Global Solutions, have recently started to expand their
operations internationally. These trends will likely increase in the future as the financial markets continue to consolidate and business process outsourcing gains popularity in the international market. Globalization is projected to support growth of larger enterprises, but it will also likely increase competition as more foreign players enter the market.
Level & Trend Globalization in this industry is Low and the trend is Increasing
Provided to: Seattle Pacific University (2134440152) | 03 December 2019

WWW.IBISWORLD.COM Debt Collection Agencies in the US June 2019 25
Player Performance Alorica Inc. (Alorica) is the largest customer management solutions provider in the United States and has operations abroad. Formerly known as Advanced Contact Solutions Inc., the company was founded in 1999. It is headquartered in Irvine, CA, and provides customer care, revenue generation, receivables management and supply chain management services, among other customer management solutions services. The company provides its services to many sectors of the economy, including the automotive, retail, energy and utilities, financial services and healthcare industries. The company employs an estimated 100,000 people over 130 locations and across 15 countries.
While Alorica has been a known entity as a customer management solutions provider, the company entered the Debt Collection Agencies industry through its acquisition of Expert Global Solutions
(EGS) in 2016. Headquartered in Plano, TX, EGS was the largest collection agency in the United States. The acquisition doubled Alorica’s business operations and was completed June 2016. While EGS is now a subsidiary of Alorica, it continues to operate in the industry through its own subsidiaries.
Financial performanceAlorica is a private company and is therefore not required to report its financial earnings. Using available information, IBISWorld estimates that Alorica’s industry-specific revenue is expected to increase an annualized 9.7% to $1.9 billion over the five years to 2019. During the period, the company has outperformed the rest of the industry due to its successful acquisition of EGS in 2016, which have helped grow the company’s customer base. In fact, the acquisition resulted in a 96.7% increase
Major CompaniesAlorica Inc. | Encore Capital Group Inc. PRA Group Inc. | Other Companies
70.9%Other
Alorica Inc. 16.9%
Encore Capital Group Inc. 6.8%
PRA Group Inc. 5.4%
SOURCE: WWW.IBISWORLD.COM
Major Players(Market Share)
Alorica Inc. (US industry-specifi c segment) - fi nancial performance*
YearRevenue
($ million) (% change)Operating Income
($ million) (% change)
2014 1,220.4 N/C 126.9 N/C
2015 1,136.6 -6.9 117.1 -7.7
2016 2,235.9 96.7 234.8 100.5
2017 2,142.7 -4.2 231.4 -1.4
2018 2,025.1 -5.5 216.3 -6.5
2019 1,935.1 -4.4 207.4 -4.1
*Estimates SOURCE: IBISWORLD
Alorica Inc. Market Share: 16.9%
Provided to: Seattle Pacific University (2134440152) | 03 December 2019

WWW.IBISWORLD.COM Debt Collection Agencies in the US June 2019 26
Major Companies
Player Performance Founded in 1953 and headquartered in San Diego, Encore Capital Group Inc. (ECG) is a leading player in the Debt Collection Agencies industry. While most industry-specific operations are conducted in the United States, ECG also operates on a global scale, with locations in India, Spain, Australia, Costa Rica and the United Kingdom. Globally, the company had an estimated 7,900 employees and generated nearly $1.2 billion in revenue in 2018 (latest data available).
ECG employs proprietary models to value portfolios of debt, making them a leading player in the industry. The company currently has only one operating segment, as ECG divested from Propel Acquisition LLC in March 2016. This former segment was a tax lien business; ECG paid homeowners’ tax liens for them in exchange for a payment agreement backed by a tax lien on their property. The remaining segment is its
portfolio purchase and recovery business, in which ECG purchases portfolios of defaulted consumer debt at a discounted rate and recovers a substantial portion of the debt to turn a profit.
Financial performanceDriven in part by a robust performance and several acquisitions, ECG’s revenue has grown at an annualized rate of 1.4% to $773.8 million over the five years to 2019. The company has benefited from outperformance of purchased loan portfolios. In addition, the company has been able to expand its portfolio over the past five years and, as a result, accretion revenue has been positive, driving overall revenue for the company. In addition to purchased portfolios, the company has benefited from its acquisitions prior to the start of the period. With a larger portfolio group and higher yields on existing portfolios, growth has been strong.
Player Performancecontinued
in industry revenue that year and significantly boosted the company’s market share moving forward.
Encore Capital Group Inc. (US industry-specifi c segment) - fi nancial performance*
YearRevenue
($ million) (% change)Operating Income
($ million) (% change)
2014 723.2 N/C 544.9 N/C
2015 709.4 -1.9 564.3 3.6
2016 669.6 -5.6 511.7 -9.3
2017 665.6 -0.6 545.0 6.5
2018 709.5 6.6 581.6 6.7
2019 773.8 9.1 575.9 -1.0
*Estimates SOURCE: ANNUAL REPORT AND IBISWORLD
Encore Capital Group Inc. Market Share: 6.8%
Provided to: Seattle Pacific University (2134440152) | 03 December 2019

WWW.IBISWORLD.COM Debt Collection Agencies in the US June 2019 27
Major Companies
Other Company Performance
Privately held and headquartered in Houston, GC Services is one of the top US collection agencies. According to the limited information that is publicly available, the company has an estimated 7,000 employees across 30 call center
locations. IBISWorld estimates that the company will generate $269.3 million in revenue in 2019. The company’s operations primarily consist of customer care services and account receivables management. The customer relations
Player Performance Founded in 1996 and headquartered in Norfolk, VA, PRA Group Inc. (PRA) has emerged as a leading player in the Debt Collection Agencies industry over the past five years. Total company revenue grew from $876.0 million in 2014 to $908.3 million in 2018. The company has 5,377 employees across the Americas and Europe. While the company does have operations around the world, most of its industry-specific revenue is derived from operations in the United States. In 2018, just under 70.0% of revenue came from US operations, a decline from 87.5% in 2014.
The company’s primary business involves discount purchases of charged-off and bankrupt consumer debt. PRA then earns a return on this debt by collecting a multiple of the purchase price over the portfolio’s economic life. The company’s debt portfolios include receivables on Visa, MasterCard and private-label credit cards. Other
components of debt include installment loans, credit lines and deficiency balances of various legal judgments.
Financial performanceOver the past five years, total company PRA’s overall performance has strengthened during the five-year period despite declining industry-specific revenue. According to IBISWorld estimates, the company has grown at an annualized rate of 1.0% to an estimated $919.3 million in 2019. However, the company’s industry-specific revenue is expected to decline at an annualized rate of 2.6% to $615.4 million in 2019. During the period, the industry has had to adapt to changes in demand and the regulatory environment that have negatively affected revenue growth. Despite lackluster industry-specific performance, the company has been able to continue to significantly increase its profit margins through operational efficiencies.
PRA Group Inc. (US industry-specifi c segment) - fi nancial performance*
YearRevenue
($ million) (% change)Operating Income
($ million) (% change)
2014 702.0 N/C 431.8 N/C
2015 665.2 -5.2 432.6 0.2
2016 612.0 -8.0 402.7 -6.9
2017 539.1 -11.9 392.2 -2.6
2018 608.0 12.8 461.6 17.7
2019 615.4 1.2 492.8 6.8
*Estimates SOURCE: IBISWORLD
PRA Group Inc. Market Share: 5.4%
GC Services Market Share: 2.3%
Provided to: Seattle Pacific University (2134440152) | 03 December 2019

WWW.IBISWORLD.COM Debt Collection Agencies in the US June 2019 28
Major Companies
Other Company Performancecontinued
division provides inbound and outbound call center management services for credit verifications, retention and order entry and status tracking. The accounts receivable management (ARM) division provides debt collection, data management and other services to clients in the financial, retail, automotive and telecommunications sectors. GC Services also handles
receivables for the public sector, including state courts, education lenders and child support agencies. Much of GC Services’ success can be attributed to its outstanding customer service, for which the company has won several awards over the past decade. Continued development of operating processes is expected to drive GC Services’ revenue and profit.
Provided to: Seattle Pacific University (2134440152) | 03 December 2019

WWW.IBISWORLD.COM Debt Collection Agencies in the US June 2019 29
Capital Intensity The Debt Collecting Agencies industry has a low level of capital intensity. IBISWorld estimates that for every $1.00 spent on wages, industry operators will spend $0.03 in capital investment in 2019. Capital investment is mainly in computers, telephones and software to help optimize efficiency for industry employees. Over the past five years, capital intensity has remained stable despite the industry shrinking.
While capital investment remained stable, industry operators increased their labor expenses over the past five years. The industry is relatively labor intensive, with wages accounting for 41.6% of industry revenue in 2019. Following declining revenue, the number of employees in the industry has decreased
at an annualized rate of 2.9% over the five years to 2019. However, total industry wages only fell an annualized
Operating ConditionsCapital Intensity | Technology & Systems | Revenue VolatilityRegulation & Policy | Industry Assistance
Capital Intensity
0.5
0.0
0.1
0.2
0.3
0.4
SOURCE: WWW.IBISWORLD.COMDotted line shows a high level of capital intensity
Capital units per labor unit
Debt Collection Agencies
Admin., Business Support and Waste
Mgmt. Services
Economy
Level The level of capital intensity is Low
Provided to: Seattle Pacific University (2134440152) | 03 December 2019

WWW.IBISWORLD.COM Debt Collection Agencies in the US June 2019 30
Operating Conditions
Technology and Systems
Information technology has become critical to the success of many Debt Collecting Agencies industry operators. Up-to-date software enables many companies to monitor and maintain information and communication structures efficiently and effectively. Modern software has provided industry players with automated processing systems, collection segmentation processes, timely debt reminder systems, appropriate regulatory management procedures and various other IT-related efficiencies.
Overall, the Debt Collection Agencies industry uses advanced information and communication technology (ICT) to provide accounts receivable management services. Larger industry participants have a centralized computer-based information system that supports the core processing functions under a set of integrated databases. These data centers provide the infrastructure for collection services, hardware support and server management. The integrated approach helps assure agencies that consistent sources are processed efficiently. A combination of purchased and proprietary software systems tailored to the needs of the business is normally used for portfolio and client management, skip tracing, check taking,
financial and management accounting, reporting and planning and analysis. These systems also support debtors, with online access to account information, account status and payment entry.
Many industry operators use call centers to contact debtors, some advanced technologies help make this process more efficient. These technologies include predictive dialing, automated call distribution systems, digital recording, workforce management systems and customized computer software.
The technological improvements made in this industry do not necessarily replace the need for labor, rather they greatly increase productivity in the collections and processing operations. With difficult tasks, such as locating a debtor’s contact information or determining the worth of pursuing a particular debtor, there are many variables that have to be accounted for throughout the collections process. Rather than spend even more on training and depend on employees to make correct decisions quickly, engagement planning increases efficiency and accuracy of decisions while limiting opportunities for costly mistakes. Further, the software enables companies to speed up their collection processes, which increases revenue and profit margins.
Capital Intensitycontinued
2.5% during the same period, as quality employees are extremely important to industry performance. Due to the necessary training required, industry participants spend a large portion of revenue on wages to attract qualified employees capable of understanding all
the rules and regulations of the industry. If employees are not properly trained, they may conduct themselves inappropriately; in which case, debtors can default on their debt and report the agency to the federal government, resulting in sizable fees.
Level The level of technology change is Medium
Provided to: Seattle Pacific University (2134440152) | 03 December 2019

WWW.IBISWORLD.COM Debt Collection Agencies in the US June 2019 31
Operating Conditions
Regulation and Policy Federal and state statutes establish specific guidelines and procedures that debt collectors must follow when collecting consumer accounts. Regulation of collection agencies occurs primarily at the individual state level since most states require collection agencies to be licensed. States generally follow the guidelines of the Fair Debt Collection Practices Act (FDCPA), which provides detailed guidelines that debt collectors must follow to remain compliant with federal regulators. The Debt Collecting Agencies industry is currently categorized as having a medium level of regulations, but this level is expected to increase over the next five years, as the Federal Trade Commission (FTC) curbs aggressive debt collection practices. Failure to comply with the
proper procedure can result in hefty fines or even closure of the business.
Fair Debt Collection Practices Act of 1977The federal government enacted the FDCPA in 1977 to protect consumers from unfair and abusive collection practices. The FTC enforces the FDCPA. The FDCPA establishes specific guidelines and procedures that debt collectors must follow in communicating with consumer debtors, including the time, place and manner of such communications. Furthermore, it prohibits harassment or abuse by debt collectors, including the threat of violence or criminal prosecution, obscene language or repeated telephone calls made with the intent to abuse or harass.
Revenue Volatility Over the five years to 2019, the Debt Collection Agencies industry exhibited a low to moderate level of revenue volatility as industry revenue consistently declined. Changes in the amount of debt outstanding and collectability rates determine revenue for the industry. When economic conditions are good and debt rates are low, people tend to pay their bills
on time, leading to less revenue potential for industry participants. Conversely, when economic conditions sour and households begin to feel financial stress, they tend to skip payments increasing potential business for industry participants. Over the past five years, the economy has continued to prosper, negatively influencing industry revenue.
Level The level of volatility is Medium
Level & Trend The level of Regulation is Medium and the trend is Increasing
Provided to: Seattle Pacific University (2134440152) | 03 December 2019

WWW.IBISWORLD.COM Debt Collection Agencies in the US June 2019 32
Operating Conditions
Regulation and Policycontinued
Additionally, the FDCPA contains various notice and disclosure requirements and prohibits unfair or misleading representations by debt collectors.
The act has been criticized for its low statutory damages, but it is important to note that this is not the only recourse the FTC has concerning the punishment of abusive debt collectors. The FTC may actually shut down repeat or grossly negligent offenders. Additionally, plaintiffs can recover actual damages, costs and attorney fees. They can also pursue state law tort claims, such as the invasion of privacy and intentional infliction of emotional distress, which enables for a recovery of punitive damages. Over the past five years, the FTC has become more vigilant and as a result, major players are investing more capital in training and software.
In May 2019, the Consumer Financial Protection Bureau (CFPB) issued a Notice of Proposed Rulemaking to update the FDCPA. This purpose of this proposal is to establish clear protections against consumer harassment from debt collectors. This proposed revision would set a limit on the number of calls debt collects can place to reach consumers on a weekly basis, require collectors to provide additional information to consumers and clarify the use of technology. The FDCPA was written and enacted prior to the ubiquity of email, text messages and social media. The use of these newer methods has become increasingly common among debt collectors. Should this proposal pass, this would further hinder industry operators.
Gramm-Leach-Bliley Act of 1999This act requires that certain financial institutions, including collection agencies, develop policies to protect the privacy of consumers’ private financial
information. They must also provide notices to consumers advising them of their privacy policies. This act requires that if private personal information concerning a consumer is shared with another unrelated institution, the consumer must be given an opportunity to opt out of having such information shared. This act is enforced by the FTC. This legislation further enforces the need for operational systems that stress efficient and accurate reporting.
Bankruptcy Abuse Prevention and Consumer Protection Act of 2005To prevent any collection activity with bankrupt debtors by creditors and collection agencies, the US Bankruptcy Code prohibits certain contacts with consumers after they file bankruptcy petitions. The act, which amends Title 11 of the US Code, has made it more difficult for debtors to have their debts cleared by filing under Chapter 7 of the bankruptcy code. Debtors earning more than their state’s median income must file under Chapter 13 of the code, requiring that they submit to a repayment plan. The law also imposes credit counseling on all debtors before they file.
Section 1031 of Dodd-Frank ActThe Dodd-Frank Act grants the Consumer Financial Protection Bureau (CFPB) enforcement and rulemaking powers over large consumer debt collectors effective January 2, 2013. Any collection agency with more than $10.0 million in annual receipts is subject to the CFPB’s supervisory authority. The CFPB will ensure that debt collectors provide required disclosures to consumers, provide accurate information, have a consumer complaint and dispute resolution process and communicate civilly and honestly with consumers.
Provided to: Seattle Pacific University (2134440152) | 03 December 2019

WWW.IBISWORLD.COM Debt Collection Agencies in the US June 2019 33
Operating Conditions
Industry Assistance The Debt Collecting Agencies industry receives no direct government assistance. However, there are a few associations that help promote the interests of the Debt Collection Agencies industry. The Association of Credit and Collection Professionals (ACA) is an international association that establishes ethical standards, produces a variety of services and publications to help educate industry operators, and articulates the value of the credit and collection
industry to businesses, policymakers and consumers. The International Association of Commercial Collectors (IACC) certifies members and promotes their members’ services. Additionally, the IACC helps members navigate through the numerous regulations experienced by the industry. The Commercial Collection Agency Association (CCAA) provides educational, legislative, promotional and administrative services to its members.
Level & Trend The level of Industry Assistance is Low and the trend is Steady
Provided to: Seattle Pacific University (2134440152) | 03 December 2019

WWW.IBISWORLD.COM Debt Collection Agencies in the US June 2019 34
Key StatisticsRevenue
($m)
Industry Value Added
($m)Establish-
ments Enterprises Employment Exports ImportsWages ($m)
Domestic Demand
Aggregate household debt
($ trillion)2010 13,953.5 7,243.3 10,433 9,788 148,162 -- -- 5,596.7 N/A 14.12011 13,938.3 7,189.0 10,554 9,891 142,377 -- -- 5,404.9 N/A 13.42012 14,250.2 7,222.8 10,550 9,929 136,127 -- -- 5,398.8 N/A 13.02013 13,985.7 7,286.4 9,994 9,363 133,619 -- -- 5,398.4 N/A 12.62014 13,263.4 6,982.1 9,628 9,013 133,355 -- -- 5,417.0 N/A 12.32015 12,684.7 6,850.8 9,170 8,581 129,262 -- -- 5,366.7 N/A 12.32016 12,541.9 6,650.8 8,472 7,978 124,586 -- -- 5,170.8 N/A 12.42017 12,460.0 6,633.3 8,926 8,339 123,807 -- -- 5,138.2 N/A 12.52018 11,632.1 6,263.3 8,575 8,026 117,273 -- -- 4,853.0 N/A 12.62019 11,457.8 6,156.8 8,377 7,837 115,041 -- -- 4,764.5 N/A 12.92020 11,182.4 6,005.4 8,137 7,609 112,180 -- -- 4,646.8 N/A 13.22021 10,741.7 5,775.0 7,871 7,363 108,243 -- -- 4,479.7 N/A 13.72022 10,428.9 5,606.8 7,649 7,156 105,106 -- -- 4,349.8 N/A 14.22023 10,249.4 5,501.3 7,482 6,997 102,951 -- -- 4,263.5 N/A 14.82024 10,232.2 5,475.5 7,400 6,915 102,070 -- -- 4,232.9 N/A 15.6Sector Rank 17/26 16/26 18/26 18/26 14/26 N/A N/A 14/26 N/A N/AEconomy Rank 488/694 363/694 332/694 311/694 274/694 N/A N/A 291/694 N/A N/A
IVA/Revenue (%)
Imports/Demand
(%)
Exports/Revenue
(%)
Revenue per Employee
($’000)Wages/Revenue
(%)Employees
per Est.Average Wage
($)
Share of the Economy
(%)2010 51.91 N/A N/A 94.18 40.11 14.20 37,774.19 0.052011 51.58 N/A N/A 97.90 38.78 13.49 37,961.89 0.052012 50.69 N/A N/A 104.68 37.89 12.90 39,660.02 0.042013 52.10 N/A N/A 104.67 38.60 13.37 40,401.44 0.042014 52.64 N/A N/A 99.46 40.84 13.85 40,620.90 0.042015 54.01 N/A N/A 98.13 42.31 14.10 41,518.00 0.042016 53.03 N/A N/A 100.67 41.23 14.71 41,503.86 0.042017 53.24 N/A N/A 100.64 41.24 13.87 41,501.69 0.042018 53.84 N/A N/A 99.19 41.72 13.68 41,382.07 0.032019 53.73 N/A N/A 99.60 41.58 13.73 41,415.67 0.032020 53.70 N/A N/A 99.68 41.55 13.79 41,422.71 0.032021 53.76 N/A N/A 99.24 41.70 13.75 41,385.59 0.032022 53.76 N/A N/A 99.22 41.71 13.74 41,384.89 0.032023 53.67 N/A N/A 99.56 41.60 13.76 41,412.91 0.032024 53.51 N/A N/A 100.25 41.37 13.79 41,470.56 0.03Sector Rank 10/26 N/A N/A 16/26 9/26 13/26 15/26 16/26Economy Rank 91/694 N/A N/A 589/694 48/694 306/694 455/694 363/694
Figures are in inflation-adjusted 2019 dollars. Rank refers to 2019 data.
Revenue (%)
Industry Value Added
(%)
Establish-ments
(%)Enterprises
(%)Employment
(%)Exports
(%)Imports
(%)Wages
(%)
Domestic Demand
(%)
Aggregate household debt
(%)2011 -0.1 -0.7 1.2 1.1 -3.9 N/A N/A -3.4 N/A -5.02012 2.2 0.5 0.0 0.4 -4.4 N/A N/A -0.1 N/A -3.02013 -1.9 0.9 -5.3 -5.7 -1.8 N/A N/A 0.0 N/A -3.12014 -5.2 -4.2 -3.7 -3.7 -0.2 N/A N/A 0.3 N/A -2.42015 -4.4 -1.9 -4.8 -4.8 -3.1 N/A N/A -0.9 N/A 0.02016 -1.1 -2.9 -7.6 -7.0 -3.6 N/A N/A -3.7 N/A 0.82017 -0.7 -0.3 5.4 4.5 -0.6 N/A N/A -0.6 N/A 0.82018 -6.6 -5.6 -3.9 -3.8 -5.3 N/A N/A -5.6 N/A 0.82019 -1.5 -1.7 -2.3 -2.4 -1.9 N/A N/A -1.8 N/A 2.42020 -2.4 -2.5 -2.9 -2.9 -2.5 N/A N/A -2.5 N/A 2.32021 -3.9 -3.8 -3.3 -3.2 -3.5 N/A N/A -3.6 N/A 3.82022 -2.9 -2.9 -2.8 -2.8 -2.9 N/A N/A -2.9 N/A 3.62023 -1.7 -1.9 -2.2 -2.2 -2.1 N/A N/A -2.0 N/A 4.22024 -0.2 -0.5 -1.1 -1.2 -0.9 N/A N/A -0.7 N/A 5.4Sector Rank 26/26 26/26 26/26 26/26 26/26 N/A N/A 26/26 N/A N/AEconomy Rank 629/694 628/694 651/694 651/694 637/694 N/A N/A 635/694 N/A N/A
Annual Change
Key Ratios
Industry Data
SOURCE: WWW.IBISWORLD.COM
Provided to: Seattle Pacific University (2134440152) | 03 December 2019

WWW.IBISWORLD.COM Debt Collection Agencies in the US June 2019 35
Apr 2017 - Mar 2018 by company revenueApr 2014 - Apr 2015 - Apr 2016 - Apr 2017 - Small Medium LargeMar 2015 Mar 2016 Mar 2017 Mar 2018 (<$10m) ($10-50m) (>$50m)
Liquidity Ratios
Current Ratio 1.3 1.5 1.3 1.2 1.5 0.9 n/aQuick Ratio 1.1 1.3 1.1 1.0 1.0 0.8 n/aSales / Receivables (Trade Receivables Turnover) 14.4 12.1 10.4 11.1 11.0 12.0 n/a
Days’ Receivables 25.3 30.2 35.1 32.9 33.2 30.4 n/aCost of Sales / Inventory (Inventory Turnover) n/c n/c n/c n/c n/c n/c n/a
Days’ Inventory n/a n/a 0.4 0.4 0.4 0.4 n/aCost of Sales / Payables (Payables Turnover) 16.2 24.5 30.4 22.9 22.9 22.0 n/a
Days’ Payables 22.5 14.9 12.0 15.9 15.9 16.6 n/aSales / Working Capital 25.7 18.9 36.5 40.1 19.9 -83.2 n/a
Coverage Ratios
Earnings Before Interest & Taxes (EBIT) / Interest 13.8 21.6 7.9 11.6 35.4 5.9 n/a
Net Profit + Dep., Depletion, Amort. / Current Maturities LT Debt n/a 27.3 n/a n/a n/a n/a n/a
Leverage Ratios
Fixed Assets / Net Worth 0.3 0.5 0.8 0.4 0.2 1.0 n/aDebt / Net Worth 2.8 1.9 3.7 2.0 1.2 17.5 n/aTangible Net Worth 21.6 11.6 11.7 23.6 40.1 7.3 n/a
Operating Ratios
Profit before Taxes / Net Worth, % 73.7 85.6 53.0 56.1 70.2 n/a n/aProfit before Taxes / Total Assets, % 12.6 12.4 12.0 12.2 15.8 12.3 n/aSales / Net Fixed Assets 35.2 38.2 33.2 27.6 28.0 39.3 n/aSales / Total Assets (Asset Turnover) 2.7 2.8 2.5 2.7 2.7 3.0 n/a
Cash Flow & Debt Service Ratios (% of sales)
Cash from Trading 49.7 45.4 46.3 41.7 48.7 40.5 n/aCash after Operations 11.1 7.9 10.7 5.3 5.3 5.3 n/aNet Cash after Operations 12.1 6.7 6.9 4.6 4.9 4.5 n/aCash after Debt Amortization 2.0 1.8 n/a 0.5 0.6 0.8 n/aDebt Service P&I Coverage 3.7 4.4 2.9 2.1 3.0 1.6 n/aInterest Coverage (Operating Cash) 18.7 35.2 9.5 14.9 28.8 7.8 n/a
Assets, %
Cash & Equivalents 23.6 24.4 20.9 19.0 26.7 11.9 n/aTrade Receivables (net) 23.0 23.6 28.0 28.7 25.0 24.0 n/aInventory 0.3 n/a n/a 1.8 4.0 n/a n/aAll Other Current Assets 7.0 5.5 6.5 6.9 9.0 3.9 n/aTotal Current Assets 54.0 53.5 55.4 56.4 64.8 39.9 n/aFixed Assets (net) 10.2 11.5 12.5 11.0 9.5 14.9 n/aIntangibles (net) 19.1 24.5 16.9 18.4 9.1 30.3 n/aAll Other Non-Current Assets 16.8 10.6 15.2 14.2 16.6 15.0 n/aTotal Assets 100.0 100.0 100.0 100.0 100.0 100.0 n/aTotal Assets ($m) 1,166.7 1,373.9 1,784.9 895.3 63.4 330.0 502.0
Liabilities, %
Notes Payable-Short Term 6.1 7.7 7.3 8.1 11.3 6.0 n/aCurrent Maturities L/T/D 3.1 3.6 5.7 2.0 2.3 1.5 n/aTrade Payables 14.1 11.4 8.4 11.2 13.1 12.3 n/aIncome Taxes Payable 0.2 0.2 n/a 0.4 n/a 1.2 n/aAll Other Current Liabilities 17.9 22.3 22.0 21.2 17.1 20.5 n/aTotal Current Liabilities 41.4 45.2 43.4 42.8 43.8 41.5 n/aLong Term Debt 13.3 13.4 16.6 10.1 3.5 16.5 n/aDeferred Taxes 1.1 1.2 1.2 0.5 0.1 0.2 n/aAll Other Non-Current Liabilities 3.5 4.1 10.1 4.5 3.3 4.2 n/aNet Worth 40.7 36.1 28.6 42.0 49.2 37.6 n/aTotal Liabilities & Net Worth ($m) 1,166.7 1,373.9 1,784.9 895.3 63.4 330.0 502.0
Maximum Number of Statements Used 52 46 46 40 18 13 9
Industry Financial Ratios
Source: RMA Annual Statement Studies, rmahq.org. RMA data for all industries is derived directly from more than 260,000 statements of member financial institutions’ borrowers and prospects.Note: For a full description of the ratios refer to the Key Statistics chapter online.
Provided to: Seattle Pacific University (2134440152) | 03 December 2019

WWW.IBISWORLD.COM Debt Collection Agencies in the US June 2019 36
Jargon & Glossary
BARRIERS TO ENTRY High barriers to entry mean that new companies struggle to enter an industry, while low barriers mean it is easy for new companies to enter an industry.
CAPITAL INTENSITY Compares the amount of money spent on capital (plant, machinery and equipment) with that spent on labor. IBISWorld uses the ratio of depreciation to wages as a proxy for capital intensity. High capital intensity is more than $0.333 of capital to $1 of labor; medium is $0.125 to $0.333 of capital to $1 of labor; low is less than $0.125 of capital for every $1 of labor.
CONSTANT PRICES The dollar figures in the Key Statistics table, including forecasts, are adjusted for inflation using the current year (i.e. year published) as the base year. This removes the impact of changes in the purchasing power of the dollar, leaving only the “real” growth or decline in industry metrics. The inflation adjustments in IBISWorld’s reports are made using the US Bureau of Economic Analysis’ implicit GDP price deflator.
DOMESTIC DEMAND Spending on industry goods and services within the United States, regardless of their country of origin. It is derived by adding imports to industry revenue, and then subtracting exports.
EMPLOYMENT The number of permanent, part-time, temporary and seasonal employees, working proprietors, partners, managers and executives within the industry.
ENTERPRISE A division that is separately managed and keeps management accounts. Each enterprise consists of one or more establishments that are under common ownership or control.
ESTABLISHMENT The smallest type of accounting unit within an enterprise, an establishment is a single physical location where business is conducted or where services or industrial operations are performed. Multiple establishments under common control make up an enterprise.
EXPORTS Total value of industry goods and services sold by US companies to customers abroad.
IMPORTS Total value of industry goods and services brought in from foreign countries to be sold in the United States.
INDUSTRY CONCENTRATION An indicator of the dominance of the top four players in an industry. Concentration is considered high if the top players account for more than 70% of industry revenue. Medium is 40% to 70% of industry revenue. Low is less than 40%.
INDUSTRY REVENUE The total sales of industry goods and services (exclusive of excise and sales tax); subsidies on production; all other operating income from outside the firm (such as commission income, repair and service income, and rent, leasing and hiring income); and capital work done by rental or lease. Receipts from interest royalties, dividends and the sale of fixed tangible assets are excluded.
INDUSTRY VALUE ADDED (IVA) The market value of goods and services produced by the industry minus the cost of goods and services used in production. IVA is also described as the industry’s contribution to GDP, or profit plus wages and depreciation.
INTERNATIONAL TRADE The level of international trade is determined by ratios of exports to revenue and imports to domestic demand. For exports/revenue: low is less than 5%, medium is 5% to 20%, and high is more than 20%. Imports/domestic demand: low is less than 5%, medium is 5% to 35%, and high is more than 35%.
Industry Jargon
IBISWorld Glossary
ACCOUNTS RECEIVABLE Money owed to a company for goods or services it has sold.
COLLECTIVITY RATE Also known as a recovery rate, this rate is calculated by subtracting recovered income from total outstanding debt. The higher the rate, the greater percentage of income recovered.
NONREVOLVING CREDIT Credit unable to be used after payment, including auto, home and student loans.
PRIMARY PLACEMENT An account that is typically 90 to 270 days past due and has the highest recovery rates and lowest commissions.
REVOLVING CREDIT Credit lacking a fixed number of payments that can also be used again after payment, such as credit cards.
SECONDARY PLACEMENT An account generally 270 to 360 days past due and has already been recalled from a primary collection agency.
SKIP TRACING Collection work associated with collecting information that will assist collectors in locating delinquent debtors.
TERTIARY PLACEMENT An account 360 days past due, which has the lowest recovery rates and highest commissions. It has generally been recalled from one or more collection agencies.
Provided to: Seattle Pacific University (2134440152) | 03 December 2019

WWW.IBISWORLD.COM Debt Collection Agencies in the US June 2019 37
Jargon & Glossary
LIFE CYCLE All industries go through periods of growth, maturity and decline. IBISWorld determines an industry’s life cycle by considering its growth rate (measured by IVA) compared with GDP; the growth rate of the number of establishments; the amount of change the industry’s products are undergoing; the rate of technological change; and the level of customer acceptance of industry products and services.
NONEMPLOYING ESTABLISHMENT Businesses with no paid employment or payroll, also known as nonemployers. These are mostly set up by self-employed individuals.
PROFIT IBISWorld uses earnings before interest and tax (EBIT) as an indicator of a company’s profitability. It is calculated as revenue minus expenses, excluding interest and tax.
VOLATILITY The level of volatility is determined by averaging the absolute change in revenue in each of the past five years. Volatility levels: very high is more than ±20%; high volatility is ±10% to ±20%; moderate volatility is ±3% to ±10%; and low volatility is less than ±3%.
WAGES The gross total wages and salaries of all employees in the industry. The cost of benefits is also included in this figure.
IBISWorld Glossary continued
Provided to: Seattle Pacific University (2134440152) | 03 December 2019

Disclaimer
This product has been supplied by IBISWorld Inc. (‘IBISWorld’) solely for use by its authorized licenses strictly in accordance with their license agreements with IBISWorld. IBISWorld makes no representation to any other person with regard to the completeness or accuracy of the data or information contained herein, and it accepts no responsibility and disclaims all liability (save for liability which cannot be lawfully disclaimed) for loss or damage whatsoever suffered or incurred by any other person resulting from the use
of, or reliance upon, the data or information contained herein. Copyright in this publication is owned by IBISWorld Inc. The publication is sold on the basis that the purchaser agrees not to copy the material contained within it for other than the purchasers own purposes. In the event that the purchaser uses or quotes from the material in this publication – in papers, reports, or opinions prepared for any other person – it is agreed that it will be sourced to: IBISWorld Inc.
At IBISWorld we know that industry intelligence is more than assembling factsIt is combining data with analysis to answer the questions that successful businesses askIdentify high growth, emerging & shrinking marketsArm yourself with the latest industry intelligenceAssess competitive threats from existing & new entrantsBenchmark your performance against the competitionMake speedy market-ready, profit-maximizing decisions
Who is IBISWorld?We are strategists, analysts, researchers, and marketers. We provide answers to information-hungry, time-poor businesses. Our goal is to provide real world answers that matter to your business in our 700 US industry reports. When tough strategic, budget, sales and marketing decisions need to be made, our suite of Industry and Risk intelligence products give you deeply-researched answers quickly.
IBISWorld MembershipIBISWorld offers tailored membership packages to meet your needs.
Copyright 2019 IBISWorld Inc
www.ibisworld.com | 1-800-330-3772 | [email protected]