Embed Size (px)
Citation preview
DEBT CAPITAL MARKETS REVIEW MANAGING UNDERWRITERS First Half 2017
REUTERS//Marcos Brindicci
Banking Composite of Top US Debt Bookrunners 8
IFR Markets Supplement 9
US Securitizations ex.CMBS, Agency CMO, CDO & Self-Funded(F20a) Thomson Reuters Solutions for the Deal Making
Community
14
Brazilian Domestic Debt (BR2)
Global Debt by Mexican Issuers (MX1)
2
Australia Deals Intelligence
All Australian International Bonds (AJ7)
All Australian Debt (ex self-funded) (AJ3a)
Japan Debt
7
3
7
7
4
All Bonds in Euros (N1)
Global High Yield Debt - Non-US Dollar Denominated (B6)
10
14
11All Global Green Bonds (GR01)
All International Green Bonds (JG1) 11
1
1
1
2
6
Asia Debt
Asia Deals Intelligence
International Debt
All International Bonds (J1)
All International Securitizations (J10c)
EMEA Deals Intelligence 10
10
10
3
https://www.thomsonone.com
Bonds Targeted in Japan (AP4)
Debt Capital Markets Criteria Summary
3
17
Global Debt
Global Deals Intelligence
Global Debt, Equity & Equity Related (A1)
Global Debt and Syndicated Loans (DL1)
Global Scorecard
18
US High Yield Corporate Debt (F8)
Japanese Corporate Debt (AP3)
Global Investment Grade Corporate Debt (B7)
All Bonds in Yen (AP5)
Global Asset-Backed Securities (B11) & (B13) 3
Japan Deals Intelligence
Banking Composite of Top Global Debt Bookrunners
6
13
13
US Debt
Global Debt Rankings - Last Ten Years
20
19
All Federal Credit Agency Debt (H1)
US Debt (F1) 6
US Mortgage-Backed Securities (F11)
US Asset-Backed Securities (F14) Criteria Summary
14
14
5
18
17
US Investment Grade Corporate Debt (F9)
6
Middle East Emerging Market Bonds (L5)
17
Japanese Securitizations (AP2)
2
First Half 2017 | Debt Capital Markets | Managing Underwriters
Debt Capital Markets ReviewTable of Contents
Global Mortgage-Backed Securities (B10)
16
Leading Underwriters for First Half 2017
Global Debt (B1) Australian Debt
Global Debt and Syndicated Loans Islamic Finance (DL2)
17
All Asian Currencies (ex-Japan, ex-Australia, ex-China) (AS1a)
All Asian Currencies (ex-Japan, ex-Australia) (AS1)
Samurai Bonds (AP1)
16
16
15
15Dim Sum Bonds (AS24a)
15Asian G3 Currency Bonds (ex-Japan, ex-Australia) (AR2)
Australian Dollar Non-Securitized Bonds (ex self-funded)(AJ6)
15
15
16
12
12
12
12
EMEA Emerging Market Bonds (L2)
Global High Yield Deals Intelligence
Global High Yield Debt (B4)
Global High Yield Debt - US Dollar Denominated (B5)
All International Emerging Market Bonds (L1) 13
13
13
14
Latin America Emerging Market Bonds (L3)
Asia-Pacific Emerging Market Bonds (L4)
Global Debt in Mexican Pesos (MX2)
Domestic Mexican Debt (MX3)
High Yield
Emerging Market Debt
Emerging Market Debt - Latin America
All Brazilian Debt (BR1)
1
Global Deals Intelligence
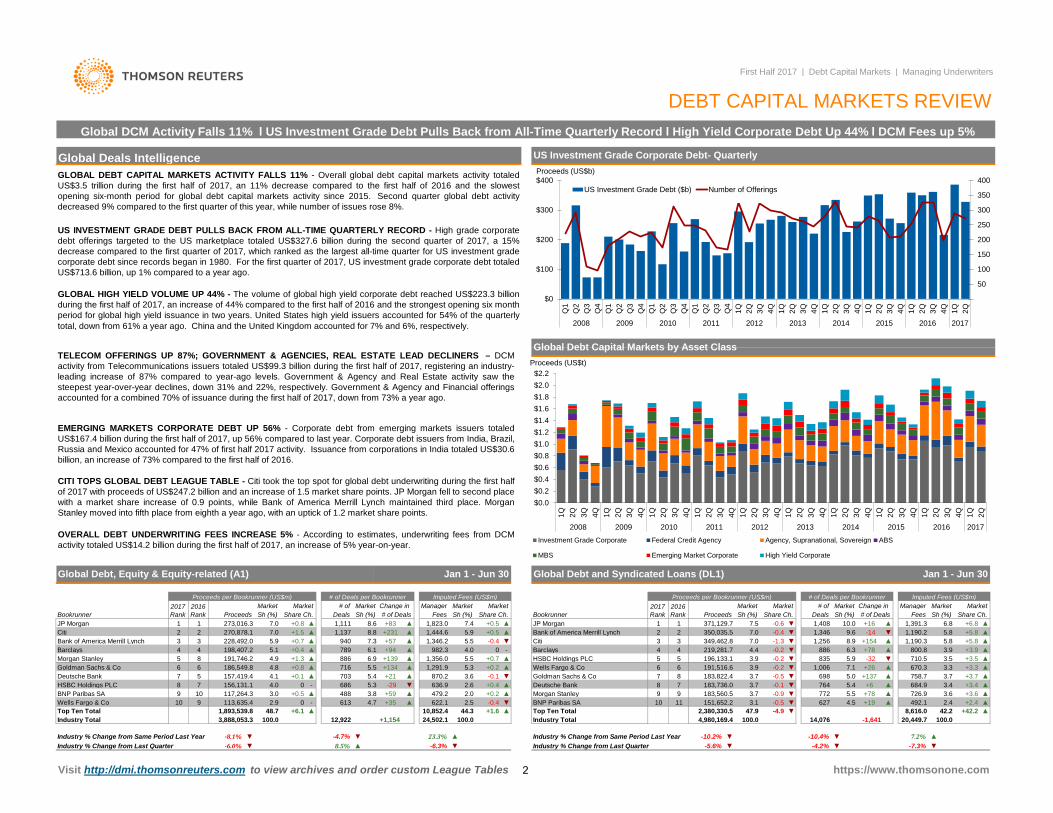
Global Debt Capital Markets by Asset Class
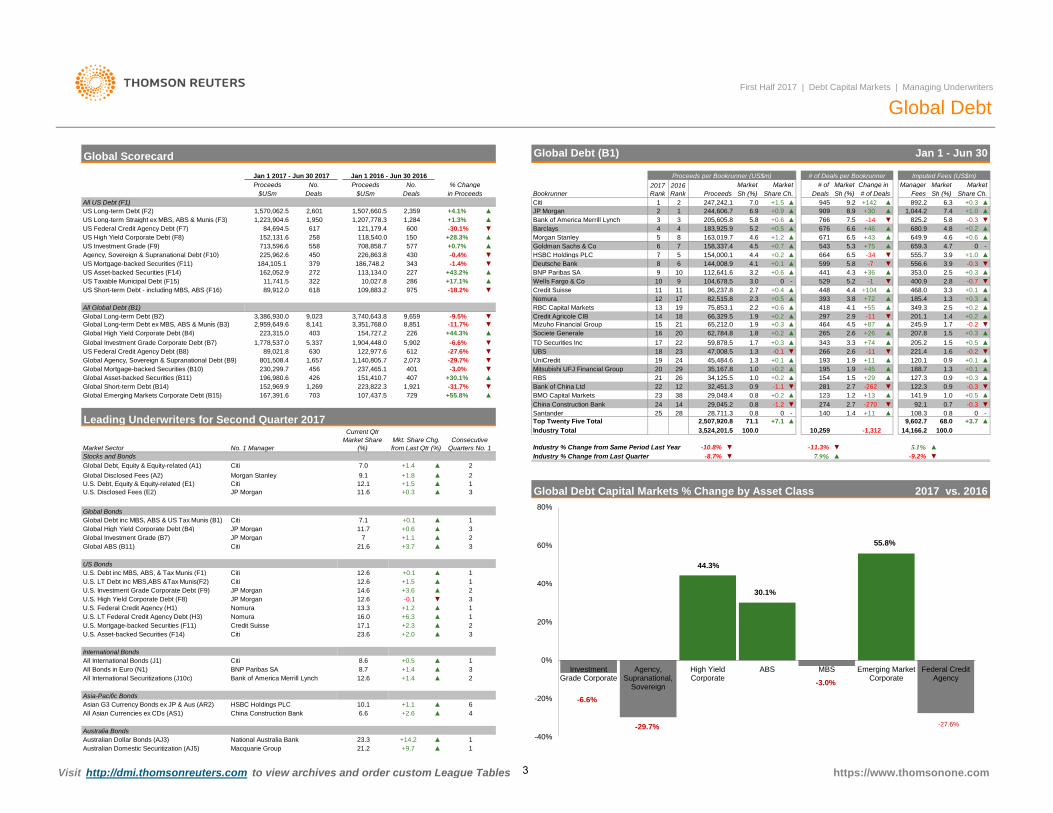
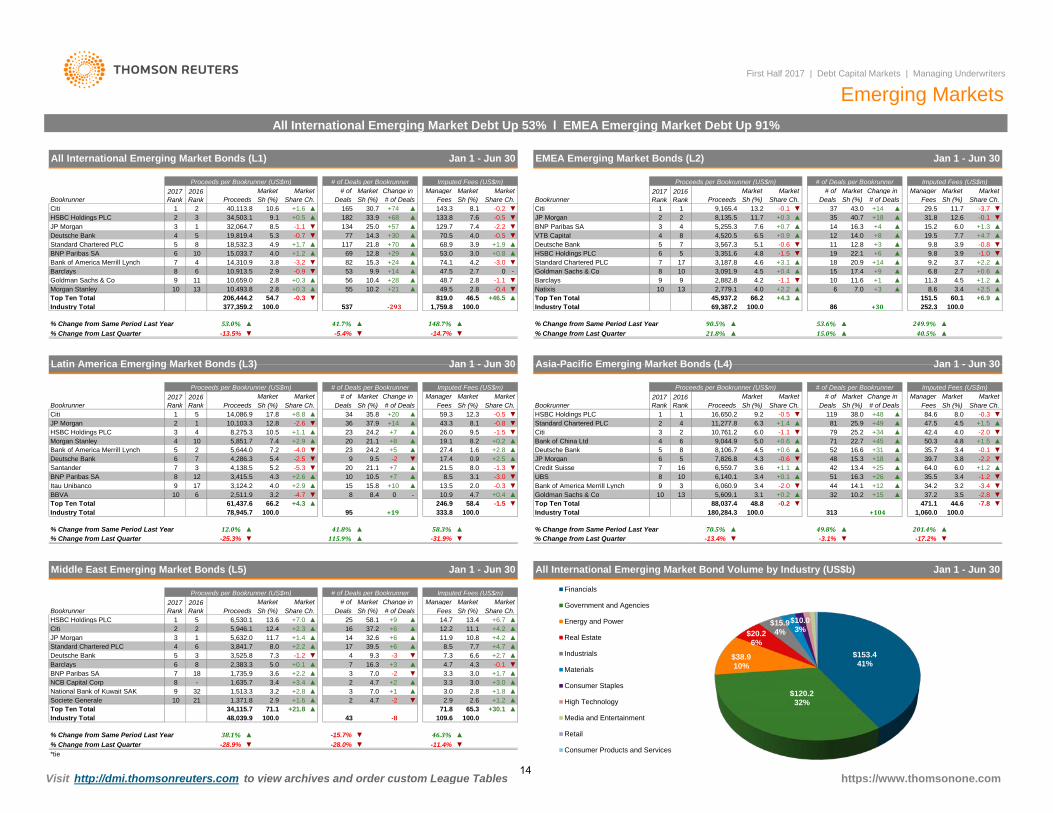
EMERGING MARKETS CORPORATE DEBT UP 56% - Corporate debt from emerging markets issuers totaledUS$167.4 billion during the first half of 2017, up 56% compared to last year. Corporate debt issuers from India, Brazil,Russia and Mexico accounted for 47% of first half 2017 activity. Issuance from corporations in India totaled US$30.6billion, an increase of 73% compared to the first half of 2016.
CITI TOPS GLOBAL DEBT LEAGUE TABLE - Citi took the top spot for global debt underwriting during the first halfof 2017 with proceeds of US$247.2 billion and an increase of 1.5 market share points. JP Morgan fell to second placewith a market share increase of 0.9 points, while Bank of America Merrill Lynch maintained third place. MorganStanley moved into fifth place from eighth a year ago, with an uptick of 1.2 market share points.
OVERALL DEBT UNDERWRITING FEES INCREASE 5% - According to estimates, underwriting fees from DCMactivity totaled US$14.2 billion during the first half of 2017, an increase of 5% year-on-year.
US Investment Grade Corporate Debt- Quarterly
GLOBAL DEBT CAPITAL MARKETS ACTIVITY FALLS 11% - Overall global debt capital markets activity totaledUS$3.5 trillion during the first half of 2017, an 11% decrease compared to the first half of 2016 and the slowestopening six-month period for global debt capital markets activity since 2015. Second quarter global debt activitydecreased 9% compared to the first quarter of this year, while number of issues rose 8%.
100.0-1,641
▲▲
42.2 +42.28,616.0+2.42.4+3.63.6
▲
7.1 3.33.9 835
▼ +265.9 710.5
▲▼
8.91,256219,281.7
▼-14+154
▼▲
6.3
9.61,190.3 5.8 ▲1,190.2 +5.8
+5.8▲5.8▲6.8 +6.8
FeesMarket
▲ 1,391.3Sh (%)
Imputed Fees (US$m)
# of DealsSh (%) DealsMarket
Share Ch.# of Market
Sh (%)+16
Jan 1 - Jun 30
Market
-0.6
▼
Proceeds per Bookrunner (US$m)Manager
Global Debt and Syndicated Loans (DL1)
Share Ch.
-0.4
# of Deals per Bookrunner
-0.2
7.0 -1.37.0
Change in
10.01,346
7.5
-4.9
1,0063.9
1,408▼
▼-0.2-0.2
726.9
758.7▲
5.55.4764 ▲
▲+78+6
3.7
▼
▼▼
7
9▲
5.0
4.5
3.7 +3.7
+78886
+19
-32
698
772
▲3.5800.8 ▲3.9
▲+3.3670.3+3.5
▲▲
3.4-0.5
+3.4
14,076
-4.2%
1,346.2
▼
2,380,330.5
-10.2%
349,462.8
5
34
▲
68▼
▲
Citi4
492.1▼
2.5 ▼Top Ten Total
151,652.2 ▼-0.5
196,133.1+3.9
3.7
4.4
684.9+137
-0.1183,736.0
▲
191,516.63.7
-0.9
4,980,169.4
627
371,129.72
32
65
1
▼
1Bank of America Merrill Lynch
MarketSh (%) Share Ch.
-HSBC Holdings PLC
▼+0.55.9 ▲
+0.7
-0.44.0 0
Global Debt, Equity & Equity-related (A1) Jan 1 - Jun 30
Proceeds per Bookrunner (US$m) # of Deals per BookrunnerMarket2017
Rank Sh (%)ManagerMarket Market
Fees1,823.0 JP Morgan7.4
Imputed Fees (US$m)
▲+0.5
MarketBookrunner
2017 Rank
2016 Rank Proceeds
350,035.5
Share Ch.
▲
Deals▲8.6+0.8 +83
+57+231
# of
1,111▲▲
# of DealsChange in
1,444.65.5940
ProceedsMarketSh (%)
2016 Rank
7.0
Bookrunner
Citi 2 2 270,878.1JP Morgan 1 1 273,016.3 7.0
5.9▲ 8.8+1.5▲
+0.71,137
Bank of America Merrill Lynch 3 3 228,492.0 7.35.1 +0.4 ▲ 789 6.1
Goldman Sachs & Co
982.3▲
2.6
1,291.9 Wells Fargo & Co
Barclays
▲-0.1+0.4
Morgan Stanley 5 8 191,746.2 4.9Barclays 4 4 198,407.2
Deutsche Bank
1,356.0+0.8 ▲ 5.5
4.1 703
▲+1.3 ▲+94 ▲
186,549.8▲ 870.2
3.8636.9
117,264.3 +0.5 488
+0.25.4
-295.3▲+21
6.9
3.6
886 +139 5.5▲
74.0
4.8+0.1
716
▲
+134
+0.2
5.3
▲
Goldman Sachs & Co183,822.4
9622.1 BNP Paribas SA 10
5 157,419.46 6
7
114.7+59
Wells Fargo & Co▲
686 ▼
+35-
HSBC Holdings PLCBNP Paribas SA 10
-479.2
78
1,893,539.8 +6.1
8Deutsche Bank
Top Ten Total613
+1,154
156,131.1
3.19
9 0113,635.4183,560.5Morgan Stanley
-0.42.0
0
10 2.948.7
Industry Total24,502.1 100.044.3▲ 47.9
100.0
▼-5.6%
23.3% ▲ ▼▼▼
Visit http://dmi.thomsonreuters.com to view archives and order custom League Tables
▼
https://www.thomsonone.com
▼▲8.5%
DEBT CAPITAL MARKETS REVIEW
12,922
Global DCM Activity Falls 11% l US Investment Grade Debt Pulls Back from All-Time Quarterly Record l High Yield Corporate Debt Up 44% l DCM Fees up 5%
-8.1%
▲3.0
▲
100.0
First Half 2017 | Debt Capital Markets | Managing Underwriters
10,852.4 +1.620,449.73,888,053.3
-6.0%Industry % Change from Last QuarterIndustry % Change from Same Period Last Year
Industry Total
-6.3%Industry % Change from Same Period Last Year-4.7%
-7.3%Industry % Change from Last Quarter▼ 7.2%▼ -10.4%
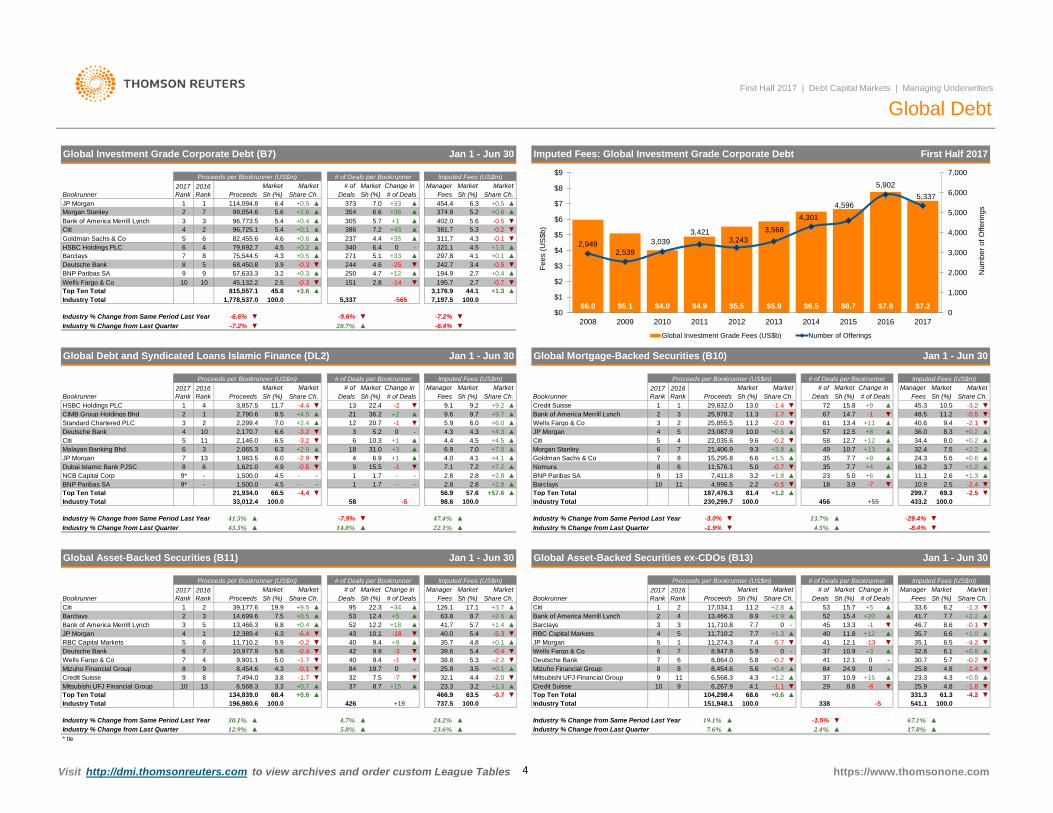
US INVESTMENT GRADE DEBT PULLS BACK FROM ALL-TIME QUARTERLY RECORD - High grade corporatedebt offerings targeted to the US marketplace totaled US$327.6 billion during the second quarter of 2017, a 15%decrease compared to the first quarter of 2017, which ranked as the largest all-time quarter for US investment gradecorporate debt since records began in 1980. For the first quarter of 2017, US investment grade corporate debt totaledUS$713.6 billion, up 1% compared to a year ago.
GLOBAL HIGH YIELD VOLUME UP 44% - The volume of global high yield corporate debt reached US$223.3 billionduring the first half of 2017, an increase of 44% compared to the first half of 2016 and the strongest opening six monthperiod for global high yield issuance in two years. United States high yield issuers accounted for 54% of the quarterlytotal, down from 61% a year ago. China and the United Kingdom accounted for 7% and 6%, respectively.
TELECOM OFFERINGS UP 87%; GOVERNMENT & AGENCIES, REAL ESTATE LEAD DECLINERS – DCM activity from Telecommunications issuers totaled US$99.3 billion during the first half of 2017, registering an industry-leading increase of 87% compared to year-ago levels. Government & Agency and Real Estate activity saw thesteepest year-over-year declines, down 31% and 22%, respectively. Government & Agency and Financial offeringsaccounted for a combined 70% of issuance during the first half of 2017, down from 73% a year ago.
$0.0$0.2$0.4$0.6$0.8$1.0$1.2$1.4$1.6$1.8$2.0$2.2
1Q 2Q 3Q 4Q 1Q 2Q 3Q 4Q 1Q 2Q 3Q 4Q 1Q 2Q 3Q 4Q 1Q 2Q 3Q 4Q 1Q 2Q 3Q 4Q 1Q 2Q 3Q 4Q 1Q 2Q 3Q 4Q 1Q 2Q 3Q 4Q 1Q 2Q
2008 2009 2010 2011 2012 2013 2014 2015 2016 2017
Proceeds (US$t)
Investment Grade Corporate Federal Credit Agency Agency, Supranational, Sovereign ABS
MBS Emerging Market Corporate High Yield Corporate
50
100
150
200
250
300
350
400
$0
$100
$200
$300
$400
Q1
Q2
Q3
Q4
Q1
Q2
Q3
Q4
Q1
Q2
Q3
Q4
Q1
Q2
Q3
Q4
1Q 2Q 3Q 4Q 1Q 2Q 3Q 4Q 1Q 2Q 3Q 4Q 1Q 2Q 3Q 4Q 1Q 2Q 3Q 4Q 1Q 2Q
2008 2009 2010 2011 2012 2013 2014 2015 2016 2017
Proceeds (US$b)
US Investment Grade Debt ($b) Number of Offerings
2
All US Debt (F1)
▲▲
+0.5
104,678.5112,641.6
+0.6
3.2 ▲03.0
Sh (%)Share Ch.945 +142+1.5
Market
7.0Sh (%) Share Ch.# of Deals
MarketManager
+0.2
# of
+0.6
29,048.4
154,000.1 +0.2+0.1
+0.2
441
2.2▲
+0.4-
+0.6▲
2.32.7
# of Deals per Bookrunner
825.2
6.39.2
4.54.4
12
2017 Rank
Change in
First Half 2017 | Debt Capital Markets | Managing Underwriters
+0.7
Global Debt (B1)
▲ 909766
Proceeds per Bookrunner (US$m)
5.8
Global Debt
Proceeds Market
Jan 1 - Jun 30
▼▲
+0.3
Imputed Fees (US$m)Market
Deals
-0.35.8▼▲
Credit Suisse
4.1
3
6
▲56 7
11
▲
+1.2
Bank of America Merrill Lynch
Bookrunner Sh (%)Market
Proceeds
4 183,925.9205,605.8244,606.7
$USmNo. % Change
Deals2016 Rank
121,179.4
▲1,2841,207,778.32,359
150
1,507,660.53
Jan 1 2017 - Jun 30 2017
JP MorganUS Long-term Straight ex MBS, ABS & Munis (F3)
+4.1%1,950
1,570,062.5
US Federal Credit Agency Debt (F7)
11,741.5162,052.9
152,131.6
2,601
713,596.6
379
Australia Bonds
Visit http://dmi.thomsonreuters.com to view archives and order custom League Tables
84,694.5
225,962.6 450
617258558
1,223,904.6
US Mortgage-backed Securities (F11)
US Long-term Debt (F2)▲
Barclays
184,105.1HSBC Holdings PLC
577
+1.3%
+0.7%118,540.0
Australian Domestic Securitization (AJ5) Macquarie Group 21.2
89,912.0 618
▲+9.7
23.3
https://www.thomsonone.com
2▲
▲
3
2
1
1
1
▲
2
▲
▲
▼▲
1
3
1
3
National Australia BankAustralian Dollar Bonds (AJ3)
10.1China Construction Bank
▲
+1.4
322272 227
+44.3%
3
▲
Consecutive Quarters No. 1
600
-9.5%-11.7%
-6.6%
401
▲113,134.0
708,858.7▼
-30.1%
-0.4%
+43.2%-1.4%186,748.2
+28.3% ▲
-18.2%
▲
▼
13
Wells Fargo & Co
Goldman Sachs & Co7
▼
▲BNP Paribas SA
Morgan Stanley
UBS
China Construction Bank23
29
▼
▼
25
2016
241923
21
Deutsche Bank
UniCredit
Credit Agricole CIB
▲
29,045.2
26
17
19Nomura
15
▼
0.838
0.80.814
28 28,711.3
22
18
+7.1Industry TotalTop Twenty Five Total
100.02,507,920.83,524,201.5
71.1
Societe Generale
RBC Capital Markets14
24
Mizuho Financial Group 65,212.0
45,484.6
66,329.5
47,008.518
75,853.1
▼
12
Mitsubishi UFJ Financial Group
▼
▼
BMO Capital Markets
RBS20
Bank of China Ltd
TD Securities Inc
Mkt. Share Chg. from Last Qtr (%) Industry % Change from Same Period Last Year
21
9,659
▼612
226▼
3
+14.2
+1.16.6 +2.6
Global Debt Capital Markets % Change by Asset Class
Santander
▼-10.8%-8.7%
0
▲
▲ 64▲
1
Industry % Change from Last Quarter
62,784.8
22 12
-0.159,878.5
158,337.4163,019.7
144,008.910
1096,237.811
85
9
82,515.8
9
17
Deals
Jan 1 2016 - Jun 30 2016
109,883.2
226,863.8
Proceeds
Global Scorecard
No.
Citi$USm in Proceeds
+0.9
Fees▲247,242.1 ▲1 2
+30 +1.0892.2
6.9▲
649.98▲ 6.66764 5.2
4.6 ▲+0.5
▲8.9
659.3-34 ▼
5.3▲+43671 6.5
556.6
7.41,044.2-147.5
+0.24.8680.9+46 ▲
664543
6.5▲
-7 ▼599▲2.5 +0.3
-4.7
▲ 353.0
▲0
▼
▲4.6
3.9
▲+0.6+75
555.7 +1.03.9-0.3
265
+104
+87
-11▲▼
4.4
297464
+72
5.2
4.52.9
448529
3933.3 +0.1 ▲▲
5.8
418
4.3-1
468.0
+36
+553.8
▲
4.1
▼-0.7▼ 400.9 2.8
1.3
1.9
+0.2+0.1
+0.3
1.3
▲1.9
1.8+0.3
▲
1.3
1.0 +0.22.7
2.6▼ 266
1.528132,451.3
34,125.50.9 -1.1
▲154
1.0
▼
35,167.8▲
▼- 140
-1.2
3.3
193195
+0.2
1.9
343
+13123 1.2
▲+11▼274
1.42.7
▲9,602.7▲14,166.2 100.0
-11.3% ▼
68.0 +3.710,259 -1,312
5.1% ▲-9.2%▲7.9%▼ ▼
2017 vs. 2016
Market SectorStocks and BondsGlobal Debt, Equity & Equity-related (A1) Citi
+0.6
111.6
▲
+3.6
▲
230,299.7
▲▲
No. 1 Manager
+0.3
196,980.61,269
1
2
▲
+55.8%
2
3
2▲
▲+1.5 1+0.1
▲
7.1
All Asian Currencies ex CDs (AS1)
▲+1.1+3.721.6
JP Morgan ▲
Morgan StanleyCiti
▲Citi
4071,921
+1.8
Global Short-term Debt (B14)
Current Qtr Market Share
(%)
JP Morgan
Global Bonds
+1.5
107,437.5 729
1,904,448.0
+1.47.0
2,073
9.1
+17.1%
430
286
343
3,740,643.8
10,027.8
3,386,930.0
154,727.2223,315.02,959,649.6
4038,1419,023
International Bonds
12.6
Citi+2.3U.S. Mortgage-backed Securities (F11)
U.S. Asset-backed Securities (F14)
Nomura
17.1
+1.2U.S. LT Federal Credit Agency Debt (H3) +6.3
+2.0
U.S. Debt, Equity & Equity-related (E1)
+0.1
12.1
U.S. Investment Grade Corporate Debt (F9)
U.S. Disclosed Fees (E2)
U.S. LT Debt inc MBS,ABS &Tax Munis(F2)12.6
JP MorganCiti
All International Bonds (J1)
U.S. Debt inc MBS, ABS, & Tax Munis (F1)
-0.1
All International Securitizations (J10c)
▲16.0
U.S. High Yield Corporate Debt (F8)13.3
JP Morgan14.6
JP Morgan
US Bonds
Asian G3 Currency Bonds ex JP & Aus (AR2)Asia-Pacific Bonds
HSBC Holdings PLC
BNP Paribas SA
Global Investment Grade (B7)
8.7
Global Debt inc MBS, ABS & US Tax Munis (B1)
U.S. Federal Credit Agency (H1)Nomura
12.6
Global Asset-backed Securities (B11)
167,391.6
+1.4
+0.5All Bonds in Euro (N1)
Global High Yield Corporate Debt (B4)
Citi
11.77
Global ABS (B11)
12.6
Citi
1,140,805.7
23.6
8.6
152,969.9
237,465.1
223,822.3
Leading Underwriters for Second Quarter 2017
456426
Credit Suisse
Citi
Bank of America Merrill Lynch
▲
▲
703
Global Disclosed Fees (A2)
1.7
-3.0%151,410.7
-29.7%1,657
5,3372.6
3,351,768.0
1.9▲ +11
-118,851
5,902 ▲1.7
185.4
▼2.5
▲▲
207.8
349.31.4201.1
▲
1.5
+29+45
+74
0.71.0
-262
-270
▲
92.1
▲
▼ 0.9
00.8
122.3
108.3
▲-0.3+0.5
+0.30.9
141.9
127.3188.7
221.40.9
+26245.9
1.6
▲
+0.3 ▲
▲▼
▲-0.2
▲120.1
+0.3
205.2
+0.1
▼
1.3
▲+0.2
+0.5
▲
Global Long-term Debt ex MBS, ABS & Munis (B3)
▲▼-0.3
+0.1-27.6%
1.5
122,977.6630
-▼
+0.2Global Long-term Debt (B2)
Global Mortgage-backed Securities (B10)
-0.2
▲
Global Investment Grade Corporate Debt (B7)
Global Agency, Sovereign & Supranational Debt (B9) ▲
Global Emerging Markets Corporate Debt (B15)
US Federal Credit Agency Debt (B8)
+30.1%-31.7%
801,508.4
US High Yield Corporate Debt (F8)
Global High Yield Corporate Debt (B4)
All Global Debt (B1)
Agency, Sovereign & Supranational Debt (F10)
89,021.8
975
US Investment Grade (F9)
US Short-term Debt - including MBS, ABS (F16)US Taxable Municipal Debt (F15)US Asset-backed Securities (F14)
1,778,537.0
-6.6%
-29.7%
44.3%
30.1%
-3.0%
55.8%
-27.6%
-40%
-20%
0%
20%
40%
60%
80%
InvestmentGrade Corporate
Agency,Supranational,
Sovereign
High YieldCorporate
ABS MBS Emerging MarketCorporate
Federal CreditAgency
3
* tie
First Half 2017
BNP Paribas SA 4.5-
Visit http://dmi.thomsonreuters.com to view archives and order custom League Tables
Imputed Fees (US$m)
-0.4
Jan 1 - Jun 30
1
Citi
Top Ten Total
9*
Industry Total
Industry % Change from Last Quarter
1
Proceeds per Bookrunner (US$m)2017 Rank
Industry % Change from Same Period Last Year
▼
2.4%
Industry Total
Industry % Change from Same Period Last Year▲▲
▲▲
41.5%
▲
43.3%
-1,500.0
33,012.4
9*
▲
56.9
47.4%
Malayan Banking Bhd
▲▼
40 9.4
RBC Capital Markets
7.6%
Industry TotalTop Ten Total
19.1%
Credit Suisse13
https://www.thomsonone.com
▲
35.740
▼
Industry % Change from Last Quarter 12.9% 17.8%
6,568.3134,839.0
5.6
58
-136.66.5
91
7.14.9 15.5-4.5
8
6 ▲JP Morgan 6.9▼
+2.96.3 186.0
20.7
Dubai Islamic Bank PJSC7
Citi 5 11 2,146.02,065.3
61,983.5
Deutsche Bank 4-1
36.2Standard Chartered PLC 3 2
2+2.47.0
3,857.5HSBC Holdings PLC218.51 +4.52,790.6 ▲CIMB Group Holdings Bhd
-4.4DealsBookrunner
2.8 -14
Market
▼
151▼
297.8
195.73,176.9
242.7
▼
4.6 -25+12+0.3
7.2
▲-0.3
▲
79,692.7
57,633.3
321.1
+3.6-0.7
Imputed Fees: Global Investment Grade Corporate Debt
+0.4
▲+0.5
Deutsche BankBNP Paribas SA 9
4.38
HSBC Holdings PLC 6 4
305▲
59 3.2
+0.2
3.9 244-0.3▲
+0.1237
5.44.6
▲ 386▲+0.6
Barclays
99,054.6
Goldman Sachs & Co 596,725.196,773.53
2
26
JP Morgan
7
3
75,544.58
Bank of America Merrill Lynch
114,094.8
82,455.64Citi
Sh (%)
+0.8
# ofFees
MarketMarket
Morgan Stanley+0.5
▲
2016 Rank Share Ch.
17
Market
5.6+0.5+1.6
Proceeds1
+36
Market
▲
11.7Sh (%) Share Ch.
▼
2017 Rank
+5
▲
13.3
▲
4
+2-2
Market
17,034.141.7
11.22▲▲
+4.5
+1
312
1Share Ch.
Global Asset-Backed Securities (B11)
NCB Capital Corp
▲ 4.5▲
Share Ch.
-4.4
▲
Bookrunner
-1.9%
31.0
Sh (%)
2.8-21,934.0
-3.0%
▼ 9.2
4.1
Market
-
▼
2,299.4
13
46.7+12
▲
+4.1
Bank of America Merrill Lynch
+7.0
▼
▲Citi
▲
-4.2JP Morgan11.811,710.2 +1.0▲40
41 ▼ 35.1
8.67.7
7
6
7,494.089
3
5.339.6
Fees
63.82
▼
126.1
-0.25
Sh (%)
4
Proceeds
Wells Fargo & Co
Mitsubishi UFJ Financial Group 10
▼
# of Deals
Mizuho Financial Group ▼
9.4
-7.9%
10 2,170.7
22.4
-0.5
6.6 -3.2 ▼10.3
1.7
▼
9
Sh (%)
-
66.5
1,500.0
16.86.3
9,901.16
▼
4
6.5 -3.2 6
1,621.0
-
13▲
-2.9
-
4
Proceeds per Bookrunner (US$m)2017 Rank
2016 Rank Proceeds
Market
19.7
Fees9.1
▲
0
6.9
4.3
7.0
6.0
# of Deals
4.5
2.7
Jan 1 - Jun 30
# of Deals per Bookrunner
2.7▲
-9.6%
250
+1.5
▼
-0.2
▼
4.1
44.1
4.3
100.0
3.4
373
▲
▲7.0▲
5.7▲
+354.4
6.65.4 +0.4
311.7
402.0
Change in
6.4
▲+43▲+1
# of Deals per Bookrunner Imputed Fees (US$m)
Global Debt
Jan 1 - Jun 30
4.7
# of Deals
▲-
▼
MarketProceeds per Bookrunner (US$m)
Bookrunner
Global Investment Grade Corporate Debt (B7)
Sh (%)+33
Deals
354454.4
▲
Sh (%)
5.3381.7▼▼
6.3
0+33
6.4
▼68,450.8271
4.5 340▲ 5.1
Sh (%)
1045.8
2.5
MarketSh (%)
-6.6%
100.0
Industry % Change from Same Period Last Year
1,778,537.0
# of
Industry % Change from Last Quarter
Manager
20.7%
Market
Wells Fargo & Co 45,132.210
Industry Total815,557.1Top Ten Total
▼
Global Mortgage-Backed Securities (B10)
5,337
-6.4%
-565
Global Debt and Syndicated Loans Islamic Finance (DL2)
-7.2%
7,197.5
# of Deals per Bookrunner
29,832.0Credit Suisse▲+9.2
Proceeds per Bookrunner (US$m)2016 Rank
2017 Rank
Market
Wells Fargo & Co
▲
2.82.8
+2.8+57.6
NomuraGoldman Sachs & Co
Market
22.1%
7.2
Jan 1 - Jun 30
-5
▲+2.8
5.2 -▲
+7.2
Change in
100.0▼
▼
Share Ch.
194.9▼
-7.2%
▲▼
Market
9.6+6.0
▲
4.35.9
5.25.6
Share Ch.Manager
374.9-0.5
+4.3
+1.3
+0.1
▼
▲-0.5
Market
▲+9.7
Imputed Fees (US$m)
▼5
▲
58
+1.5
-0.2
▲
10.715,295.8
Morgan Stanley9.69.37
5
13.7%4.5%
4,996.5
▼ 358
▼
Imputed Fees (US$m)Change in ManagerMarket
Deals Sh (%) Sh (%)Market
Share Ch.Market
# of
8 35 7.711,576.1 5.0
22,035.6
# of
15.415.7
49
Sh (%)+2.8
Market
Global Asset-Backed Securities ex-CDOs (B13)
6
0
▼
JP Morgan4
Share Ch.
▼
-1.7
Sh (%)-3.2
MarketFees
▲-0.1
48.5▼ 6715.8▼
-6.4
Deals
4.0
+3495
+3
▼
Change in
+0.5
-
7.5
+13
-1
12.419.9
1.7-
14,699.6
12,389.4Bank of America Merrill LynchBarclays
2
JP Morgan
45.372
12.7
Market Market
98.6
14.8%
64.4
7
Top Ten Total
4
▼10.513.0 ▲+9
5
Bookrunner
▲
Citi
# of
Industry % Change from Same Period Last Year
ManagerBookrunner
39,177.6
2016 Rank
▲
▲
84
30.1%
196,980.6
▲
5.9
+0.4
5.0
13,466.3
-0.1
3.3-1.7
+0.6 ▲
-1.4
3 225,978.2
▲
Proceeds1
57
3
# of Deals
▼11.2 -2.011.3 14.7 -1
▲
1
+116125,855.52
13.4-0.5
21,406.9
10.023,087.9▲
+13+3.8+12
12.5 +8▼40.6 9.4
▼
▲ +0.28.3
▼11.2-2.1
▲7.5
+0.6
34.4
6.6
+0.28.0
▲▲ ▲ 32.4
▲36.0
▲▲
+2.224.3
2.65.0 +6+4
5.6+9
3.2 ▲+1.8 ▲ 23▲-0.7 7.7
+1.311.1+1.216.2 3.7
Barclays 10 2.2BNP Paribas SA 9 7,411.8
1113
187,476.33.9
81.4 +1.2100.0
▼-0.5 ▼▲
-8.4%
2.5
+55 433.2456
10.9-718 ▼▼
▲
Share Ch.MarketChange in
-29.4%
-2.5
▲
100.0299.7
-2.4
# of Deals per Bookrunner
69.3
▼
Imputed Fees (US$m)
Industry % Change from Same Period Last Year
42
53
43
4.3
3
-1.784
▼11,710.2
7
▲▲+9.5 22.3
▼
▲ -1.352
+1.4▲+2.6▲17.1
Bank of America Merrill Lynch
Industry Total
Industry % Change from Last Quarter
+3.7
11,710.82
Barclays 3▲
-1-3
8.7
5
38.8
Sh (%)▲
Proceeds
Wells Fargo & Co-0.4
13,466.333.6
2016 Rank
34
65▲
▼-5.35.440.0▲ 41.7
-18+18
4.8
▼-
9.9
12.210.1
+9
▼
3.8 328.7+0.7
426
25.832.1▼ 7.5 -7
68.4 +0.6 ▲100.0 737.5
8,947.9▼
+19466.9
▼
+20
▲▲ +1537
19.7 0
+0.135.7
-1.1
▲+2.2
6.1
▼
+0.8
7.76.2
-0.1 ▼-1
3.5
45-
-2.2
4.4 Mitsubishi UFJ Financial Group
+35.4
5.7
24.2%
▼▲
5.9
+0.1
▲
100.0
▲
3.2
▲
+1.952
8
Top Ten Total63.5
11
▼9
1
Credit Suisse
5.8%
Manager
▲
▲
53# of DealsSh (%)
▲4.7%
Market
Jan 1 - Jun 30
Share Ch.
Proceeds per Bookrunner (US$m)2017 Rank
8.9
FeesMarket
# of Deals per Bookrunner
Deals+5
Industry % Change from Last Quarter
8,454.69▼
+1.3-0.7 104,298.4
▲23.6%
5.8
7.411,274.3
8,864.0
4.1
▲
-2.0
▼
5.6 +0.4
7.7-5.7+1.3
▼
▲12.1 0 - 30.7 5.7 -0.2
▲ 32.8
▲
▼
▼
▲+0.825.8 4.8 -1.4
▼61.3
4.8-6 25.923.3
RBC Capital Markets
10.9-12.1
-4.2
0
-1.8
24.94.3▲
331.3▲
-0.2▲
+15+1.284 -
▼
Deutsche Bank
6,568.3 4.3
7
▲
37▲
370
▼
10.9
41
+0.6
100.0
2.8
57.6
First Half 2017 | Debt Capital Markets | Managing Underwriters
230,299.7
-1.5%
338
▲67.1%
100.0541.1151,948.1
▼8.6
100.0 -5
2968.6
6,267.9
8,454.6
7
10▲
▼
Mizuho Financial Group68
23.3
Deutsche Bank 10,977.9
$6.0 $5.1 $4.0 $4.9 $5.5 $5.9 $6.5 $6.7 $7.8 $7.2
2,949 2,539
3,039 3,421
3,243 3,568
4,301 4,596
5,902 5,337
0
1,000
2,000
3,000
4,000
5,000
6,000
7,000
$0
$1
$2
$3
$4
$5
$6
$7
$8
$9
2008 2009 2010 2011 2012 2013 2014 2015 2016 2017
Num
ber o
f Offe
rings
Fees
(US
$b)
Global Investment Grade Fees (US$b) Number of Offerings
4
Banking Composite: Global Debt
Visit http://dmi.thomsonreuters.com to view archives and order custom League Tables
First Half 2017 | Debt Capital Markets | Managing Underwriters
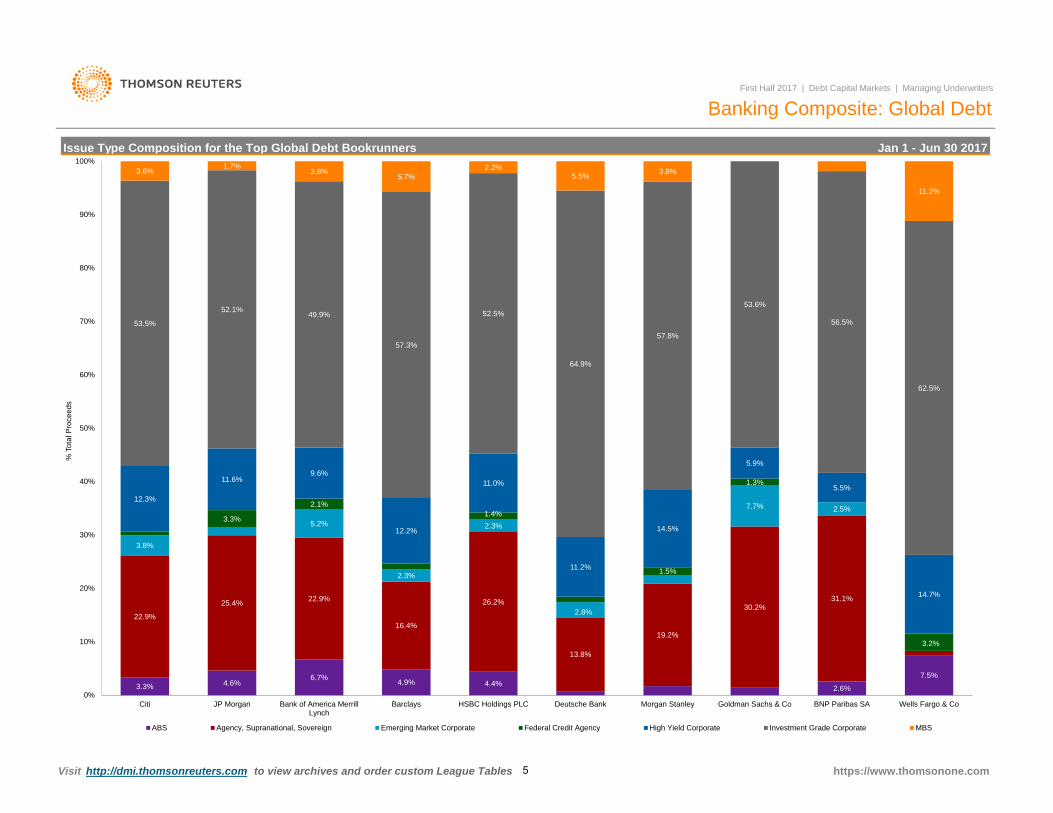
Issue Type Composition for the Top Global Debt Bookrunners Jan 1 - Jun 30 2017
https://www.thomsonone.com
3.3% 4.6% 6.7% 4.9% 4.4% 2.6%
7.5%
22.9%
25.4% 22.9%
16.4%
26.2%
13.8%
19.2%
30.2% 31.1%
3.8%
5.2%
2.3%
2.3%
2.8%
7.7% 2.5%
0.0%
3.3%
2.1%
1.1%
1.4%
1.5%
1.3%
0.0%
3.2%
12.3%
11.6% 9.6%
12.2%
11.0%
11.2%
14.5%
5.9%
5.5%
14.7%
53.5%
52.1% 49.9%
57.3%
52.5%
64.9%
57.8%
53.6%
56.5%
62.5%
3.6% 1.7%
3.8% 5.7%
2.2% 5.5% 3.8% 1.9%
11.2%
0%
10%
20%
30%
40%
50%
60%
70%
80%
90%
100%
Citi JP Morgan Bank of America MerrillLynch
Barclays HSBC Holdings PLC Deutsche Bank Morgan Stanley Goldman Sachs & Co BNP Paribas SA Wells Fargo & Co
% T
otal
Pro
ceed
s
ABS Agency, Supranational, Sovereign Emerging Market Corporate Federal Credit Agency High Yield Corporate Investment Grade Corporate MBS
5
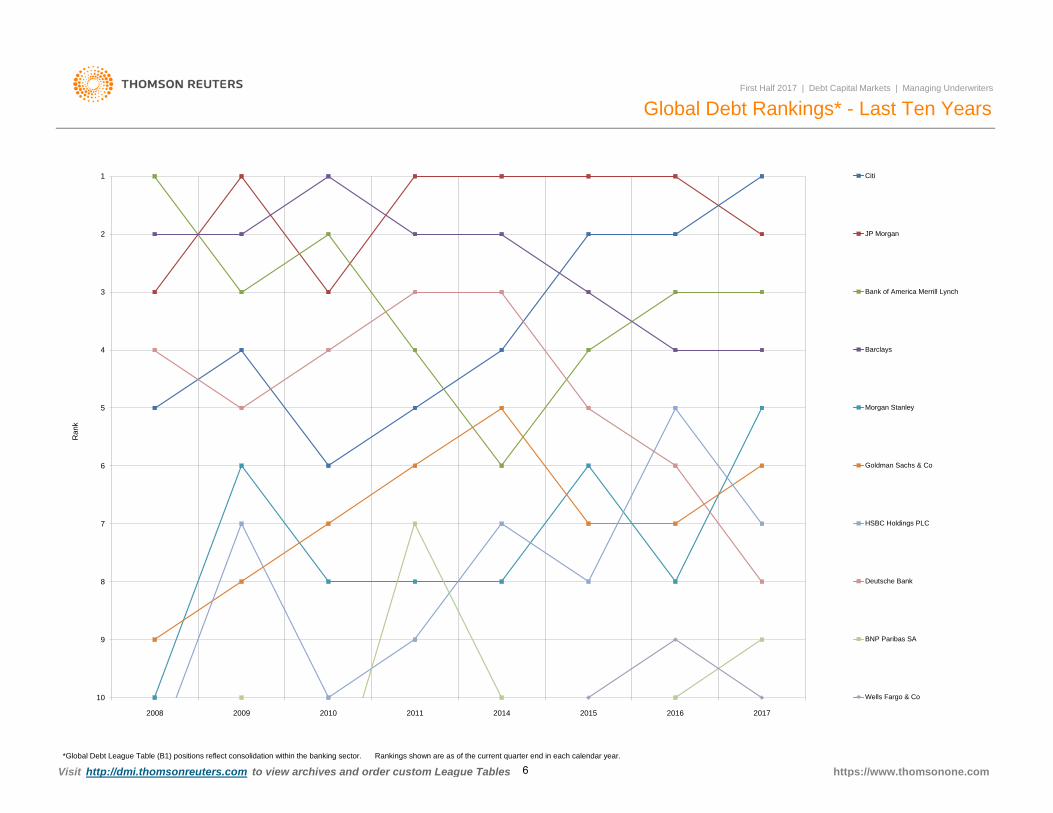
Visit http://dmi.thomsonreuters.com to view archives and order custom League Tables*Global Debt League Table (B1) positions reflect consolidation within the banking sector. Rankings shown are as of the current quarter end in each calendar year.
https://www.thomsonone.com
First Half 2017 | Debt Capital Markets | Managing Underwriters
Global Debt Rankings* - Last Ten Years
1
2
3
4
5
6
7
8
9
10
2008 2009 2010 2011 2014 2015 2016 2017
Ran
k
Citi
JP Morgan
Bank of America Merrill Lynch
Barclays
Morgan Stanley
Goldman Sachs & Co
HSBC Holdings PLC
Deutsche Bank
BNP Paribas SA
Wells Fargo & Co
6
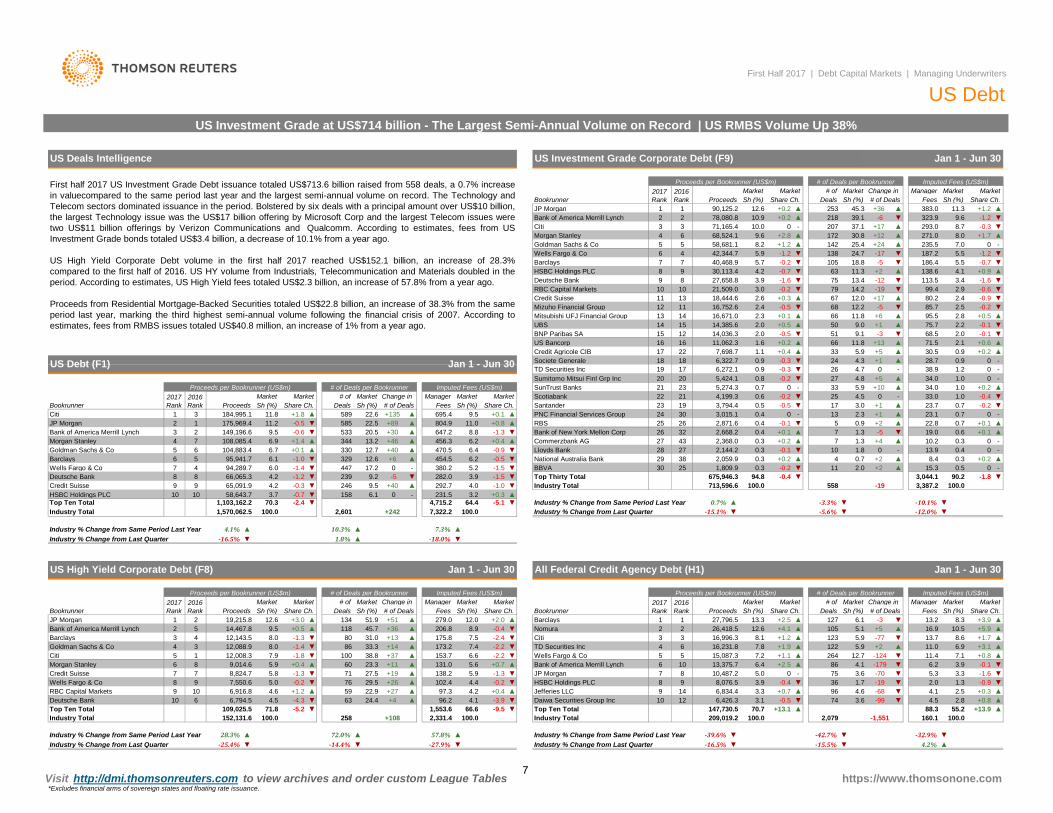
First half 2017 US Investment Grade Debt issuance totaled US$713.6 billion raised from 558 deals, a 0.7% increasein valuecompared to the same period last year and the largest semi-annual volume on record. The Technology andTelecom sectors dominated issuance in the period. Bolstered by six deals with a principal amount over US$10 billion,the largest Technology issue was the US$17 billion offering by Microsoft Corp and the largest Telecom issues weretwo US$11 billion offerings by Verizon Communications and Qualcomm. According to estimates, fees from USInvestment Grade bonds totaled US$3.4 billion, a decrease of 10.1% from a year ago.
US High Yield Corporate Debt volume in the first half 2017 reached US$152.1 billion, an increase of 28.3%compared to the first half of 2016. US HY volume from Industrials, Telecommunication and Materials doubled in theperiod. According to estimates, US High Yield fees totaled US$2.3 billion, an increase of 57.8% from a year ago.
Proceeds from Residential Mortgage-Backed Securities totaled US$22.8 billion, an increase of 38.3% from the sameperiod last year, marking the third highest semi-annual volume following the financial crisis of 2007. According toestimates, fees from RMBS issues totaled US$40.8 million, an increase of 1% from a year ago.
+0.28.4-
+24+0.2 0.7▼-0.2
▲--▲
0.5
+0.100
0
0.60.30.40.3
▲
19.010.213.9
15.3
▼▲-▲
2.0
-5+40
+2
1.31.31.8
77
10
1,809.9 11
▲▲▼▲
0.3
+0.1+0.2-0.1
0.30.30.3
2,668.22,368.02,144.22,059.9
432738
32
Goldman Sachs & Co 5 6 104,883.4 ▲13.2
30
Bank of New York Mellon CorpCommerzbank AGLloyds BankNational Australia BankBBVA
26272829
25
Industry % Change from Same Period Last Year 4.1% ▲1.8%Industry % Change from Last Quarter -16.5% ▼
10.3%
100.0-1,551
▲Industry % Change from Same Period Last Year -39.6% ▼
2,079 160.1
▼ -32.9% ▼▲-15.5%
100.0
-42.7%
Industry Total 209,019.2
-14.4% ▼
100.0
72.0%
2,331.4 100.0
▲▲88.3 +13.9
4.5 2.855.270.7 +13.1 ▲
+0.8-68▲-99
Top Ten Total 147,730.5▼3.1 -0.5 ▼ 74 3.6
▲Daiwa Securities Group Inc 10 12 6,426.3
96Jefferies LLC 4.69 141.7 2.0 ▼
3.3 +0.7-19 ▼
2.5 +0.34.1HSBC Holdings PLC 8 9 8,076.5 3.9 -0.4 ▼
6,834.4
5.3 3.3 -1.66.2
▼1.3 -0.9
3.9JP Morgan 7 8 10,487.2
36
▼▼3.6 -70 ▼5.0 0 - 75
6.4 +2.5 ▲7.1
-0.111.4
86 4.1 -179 ▼▲
Bank of America Merrill Lynch 6 10 13,375.7Wells Fargo & Co 5 5 15,087.3 +0.87.2 +1.1
+2 ▲12.7 -124 ▼264▲
+1.9 ▲ 122 5.9 11.0 ▲
+5.9 ▲▲
6.9 +3.1TD Securities Inc 4 6 16,231.8 7.85.9Citi 3 3 16,996.3 -77 ▼ 13.7 8.6 +1.7
8.3 +3.9+5 ▲ 16.9
8.1 +1.2 ▲ 123105 5.1▲ 10.5
▼ 13.2 ▲Nomura 2 2 26,418.5 12.6 +4.1Barclays 1 1 27,796.5 13.3 +2.5
Fees Sh (%) Share Ch.6.1 -3▲ 127
Market Change in Manager Market MarketSh (%) Share Ch. Deals Sh (%) # of Deals
All Federal Credit Agency Debt (H1)
2017 Rank
2016 RankBookrunner Proceeds
Market Market # ofProceeds per Bookrunner (US$m) # of Deals per Bookrunner Imputed Fees (US$m)
US High Yield Corporate Debt (F8) Jan 1 - Jun 30
Proceeds per Bookrunner (US$m) # of Deals per Bookrunner Imputed Fees (US$m)
▲▲ ▲
▼-18.0%
Jan 1 - Jun 30
64.4 -5.1 ▼100.0
4,715.2+242 7,322.22,6011,570,062.5 100.0
70.3 -2.4Industry Total
▼3.2
Top Ten Total 1,103,162.2158 6.1 0 - 231.5
-1.0Credit Suisse 9 9 65,091.9HSBC Holdings PLC 10 10 58,643.7
▼4.2 -0.3 ▼3.7 -0.7 ▼
246+0.3 ▲
▼9.5 +40 4.0
3.9▲ 292.7
-1.5▼ 282.0▼
Deutsche Bank 8 8 66,065.3 4.2 -1.2 ▼ -5380.2447 -
239 9.217.2 0
▼Barclays5.2 -1.5
330454.5 6.2
6.4
-1.4 ▼▼▼-0.9
Wells Fargo & Co 7 4 94,289.7 6.06.1 -1.0 329 12.6 +6 ▲ -0.5
▲ 470.56 5 95,941.7
▲6.7 +0.1
+46 ▲12.7 +40
456.3Morgan Stanley 4 7 108,085.4 6.9 +1.4 ▲ +0.4
▲▼8.8 -1.39.5 -0.6 ▼ 533 20.5
11.0Bank of America Merrill Lynch 3 2 149,196.6
6.2+30 ▲ 647.2
344
9.5 +0.1585 22.5 +89 ▲
▲ 695.4+0.8804.9
▲JP Morgan 2 1 175,969.4 11.2 -0.5 ▼Citi 1
Sh (%) Share Ch.3 184,995.1 22.6 +135▲ 58911.8 +1.8
Sh (%) Share Ch. Deals Sh (%) # of Deals Fees# of Market Market MarketChange in Manager2017
Rank2016 RankBookrunner Proceeds
Market Market
Market MarketMarket Market # of Market Change in Manager2017 Rank
2016 RankBookrunner Proceeds Sh (%) Share Ch.Sh (%) Share Ch. Deals Sh (%) # of Deals Fees
+36 ▲JP Morgan 1 2 19,215.8 12.6 +3.0 ▲ 134 51.9 +51 12.0 +2.0▲ 279.0 ▲Bank of America Merrill Lynch 2 5 14,467.8 9.5 +0.5 ▲ -0.4 ▼Barclays 3 4 12,143.5
206.8 8.9▲ 175.8
118 45.731.0 +13 7.5 -2.48.0 -1.3 ▼ 80 ▼
Goldman Sachs & Co 4 3 12,088.9 8.0 -1.4 ▼ -2.2 ▼173.2 7.4▲ 153.7
86 33.3 +14 ▲7.9 -1.8 ▼ 100Citi 5 1 12,008.3
+0.7 ▲38.8 +37 6.6 -2.2
+11 ▲▼
5.6Morgan Stanley 6 8 9,014.6 5.9 +0.4 ▲Credit Suisse 7 7 8,824.7
131.0▲ 138.2
60 23.327.5 +19 5.9 -1.35.8 -1.3 ▼ 71 ▼
Wells Fargo & Co 8 9 7,550.6 5.0 -0.2 ▼ -0.2 ▼102.4 4.4▲ 97.3
76 29.5 +26 ▲4.6 +1.2 ▲ 59RBC Capital Markets 9 10 6,916.8
-3.9 ▼22.9 +27 4.2 +0.4
+4 ▲▲
24.4Deutsche Bank 10 6 6,794.5 4.5 -4.3 ▼ 96.21,553.671.8 -5.2 ▼
63
258 +108
▼
Industry Total 152,131.6
4.1109,025.5
713,596.6 100.0
Industry % Change from Last Quarter -15.1% ▼ ▼
Industry % Change from Last Quarter -25.4% ▼Industry % Change from Same Period Last Year 28.3% ▲
558
Top Ten Total
Industry % Change from Same Period Last Year 0.7% ▲
-19Industry Total
▼
90.2100.0
-0.4 ▼ 3,044.1
30.5
80.285.795.575.7
675,946.3 94.8
0.4
▼▲
▼
▲
▲▼▲▲
68.571.5
▼RBC Capital Markets 10 10 21,509.0 3.0 -0.2 ▼ ▼
3.4 -1.679 14.2
13.4 -12-19 -0.699.4 2.9
63 11.33.9 -1.6 ▼ 113.575 ▼
+0.9 ▲138.6 4.130,113.4 4.2 +2 ▲-0.7 ▼
▼5.5 -0.7 ▼5.5
▼187.2186.45.7 -0.2 ▼ -5
-1.2 ▼ -17105 18.8138
+1.7235.5▲
-1.2
172 30.8 271.0
24.7 ▼
▲7.0 0 -142 25.4 +24
+12 ▲ 8.0
Wells Fargo & Co 6 4 42,344.78.2 +1.25.9
8.7 ▼Morgan Stanley 4 6 68,524.1 9.6
-0.3+2.8 ▲
218▲ 293.00 - 37.1 +17207
Deutsche BankHSBC Holdings PLC
Credit SuisseMizuho Financial Group
▼Citi 3 3 71,165.4 10.0
Proceeds per Bookrunner (US$m) # of Deals per Bookrunner Imputed Fees (US$m)
Barclays
US Deals Intelligence
US Debt (F1) Jan 1 - Jun 30
Bank of America Merrill Lynch
Goldman Sachs & Co
8
78,080.8
5 5 58,681.1
40,468.9
2 2
7
2017 Rank
2016 RankBookrunner
MarketSh (%)
First Half 2017 | Debt Capital Markets | Managing Underwriters
US DebtUS Investment Grade at US$714 billion - The Largest Semi-Annual Volume on Record | US RMBS Volume Up 38%
US Investment Grade Corporate Debt (F9) Jan 1 - Jun 30
▼
Proceeds
Proceeds per Bookrunner (US$m) # of Deals per Bookrunner Imputed Fees (US$m)
▼
9.6 -1.2
Market # of Market Market MarketShare Ch. Deals Sh (%)
-3.3%
0.96,322.7
14,036.3
5,274.30.80.7
JP Morgan 1
9 8
12
27,658.8
11 13
7
18,444.616,752.616,671.014,385.6
12.6 +0.2 ▲1 90,125.2
9
10.9 +0.2 ▲
▲
253 45.3
https://www.thomsonone.com
▼
Share Ch.+36 ▲ 383.0 11.3 +1.2 ▲
Sh (%)
+5
▼
▼Industry % Change from Last Quarter57.8% ▲
-27.9% ▼
Change in
▼
▼-
+0.4-0.3-0.3
Manager
39.1 -6 ▼ 323.9
Fees# of Deals
-5.6%
66.6 -9.5
7.3%
-16.5%
4,199.3
25
3,794.43,015.12,871.626
19
5,424.1
Top Thirty Total
2122
2423Santander
PNC Financial Services Group
SunTrust BanksScotiabank
111415
131415
2019
17 7,698.7
30
1817202321
Sumitomo Mitsui Finl Grp Inc
Mitsubishi UFJ Financial GroupUBSBNP Paribas SAUS Bancorp
Societe GeneraleCredit Agricole CIB 1.1
TD Securities Inc
121622
11,062.3
6,272.1
16
180.9
2.62.42.32.02.01.6
0.60.50.4
+0.3-0.5+0.1+0.5-0.5+0.2
0▼
0-0.1
▼-▼
▼
-0.2-0.5
▼▲▲▼
▲▼
-0.2
516633
▲ 67686650
▲5.94.3
135
242627332517
12.012.211.89.09.1
11.8
4.74.8
3.02.3
5.94.5
+1
+10
+5+10
0+1
+17-5
+6+1-3
+13
▲▲-
▲▲-
28.738.934.034.033.023.7
0.9
0.7
1.00.7
1.01.0
0.91.2
2.02.1
2.42.52.82.2
0
0+0.2
0
-0.9-0.2+0.5-0.1-0.1+0.6
▼
▲--
▼▲
+0.2
23.1
-1.83,387.2
-12.0%
-▲▼-0.4
-10.1%
▼
+2
▲▲▲
4.2%
-0.20
+0.10.722.8
Visit http://dmi.thomsonreuters.com to view archives and order custom League Tables
▼-
0.4RBS ▲0.9
*Excludes financial arms of sovereign states and floating rate issuance.
7
Jan 1 - Jun 30
▲Industry % Change from Last Quarter -8.0% ▼ 17.1% ▲ 25.4% ▲Industry % Change from Same Period Last Year 75.4%
+9 384.6178
-1.4% ▼ 5.3% ▲
67.9100.0
▼Industry Total 106,900.9 100.0
-1.3+1.3 ▲
Top Ten Total 80,834.3 75.6 -3.0 ▼17 9.6 +9 ▲ 12.1
261.13.15.6 0 -
Mizuho Financial Group 10 13 4,517.8 4.2 +1.9 ▲▼ 25 14.0 -4 ▼ 21.6Credit Suisse 9 8 5,181.6 4.9 -1.1
+12 ▲ 15.0 3.9 +1.2 ▲▼
Mitsubishi UFJ Financial Group 8 9 5,350.0 5.0 +1.9 ▲ 21 11.820.8 0 - 23.2 6.0 -1.0
+0.3 ▲Deutsche Bank 7 6 7,238.9 6.8 -1.1 ▼ 37
36 20.2 +2 ▲ 29.2 7.66.9 -1.6 ▼
Wells Fargo & Co 6 4 8,917.2 8.3 -0.3 ▼▼ 43 24.2 +1 ▲ 26.5Citi 5 3 9,089.1 8.5 -2.0
-11 ▼ 30.8 8.0 -3.9 ▼▲
JP Morgan 4 1 9,287.8 8.7 -5.3 ▼ 37 20.817.4 +9 ▲ 27.9 7.3 +1.4
+1.8 ▲RBC Capital Markets 3 7 9,446.0 8.8 +1.7 ▲ 31
46 25.8 +20 ▲ 32.5 8.511.0 -0.8 ▼
Bank of America Merrill Lynch 2 5 10,465.3 9.8 +1.6 ▲▼ 43 24.2 0 - 42.3
# of Deals Fees Sh (%) Share Ch.Barclays 1 2 11,340.6 10.6 -0.3Bookrunner Proceeds Sh (%) Share Ch. Deals Sh (%)
# of Market Change in Manager Market MarketProceeds per Bookrunner (US$m) # of Deals per Bookrunner Imputed Fees (US$m)
2017 Rank
2016 Rank
Market Market
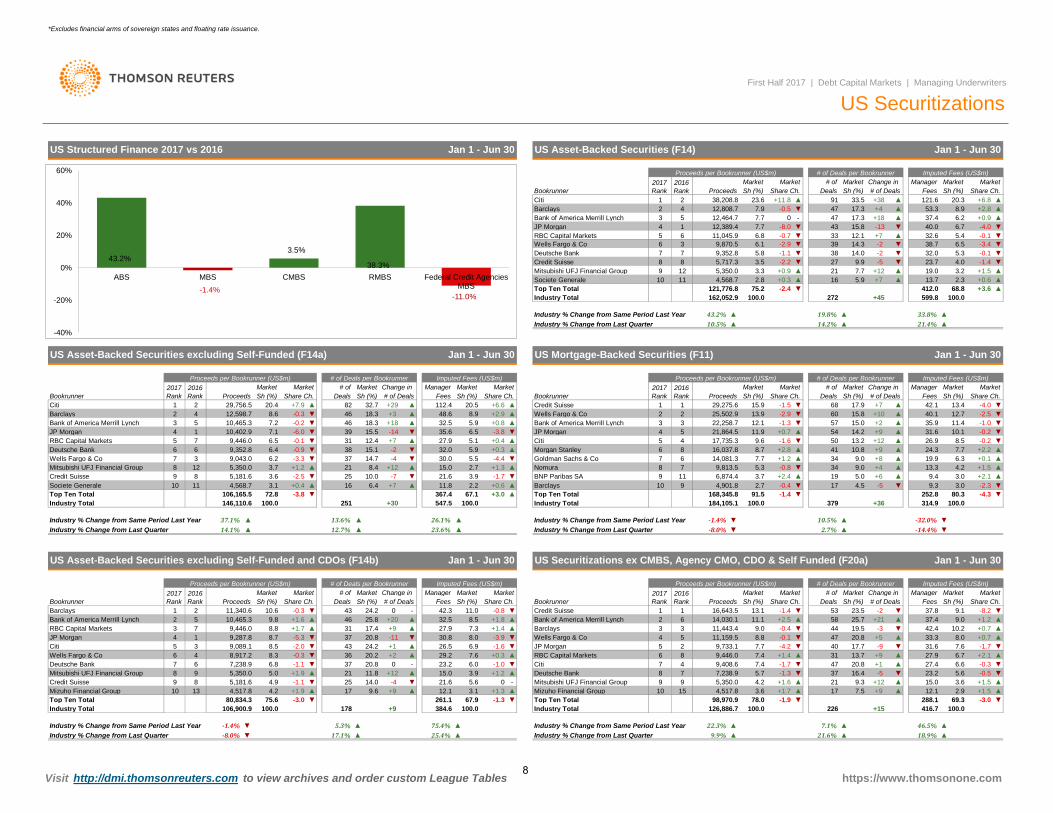
Jan 1 - Jun 30US Securitizations ex CMBS, Agency CMO, CDO & Self Funded (F20a)
▲Industry % Change from Last Quarter 14.1% ▲ 12.7% ▲
US Asset-Backed Securities excluding Self-Funded and CDOs (F14b)
23.6% ▲Industry % Change from Same Period Last Year 37.1% ▲ 13.6% ▲ 26.1%
+30 547.5251 100.0▲
Industry Total 146,110.6 100.0367.4 67.1 +3.0
+0.6 ▲Top Ten Total 106,165.5 72.8 -3.8 ▼
16 6.4 +7 ▲ 11.8 2.23.9 -1.7 ▼
Societe Generale 10 11 4,568.7 3.1 +0.4 ▲▼ 25 10.0 -7 ▼ 21.6Credit Suisse 9 8 5,181.6 3.6 -2.5
+12 ▲ 15.0 2.7 +1.3 ▲▼
Mitsubishi UFJ Financial Group 8 12 5,350.0 3.7 +1.2 ▲ 21 8.414.7 -4 ▼ 30.0 5.5 -4.4
+0.3 ▲Wells Fargo & Co 7 3 9,043.0 6.2 -3.3 ▼ 37
38 15.1 -2 ▼ 32.0 5.95.1 +0.4 ▲
Deutsche Bank 6 6 9,352.8 6.4 -0.9 ▼▼ 31 12.4 +7 ▲ 27.9RBC Capital Markets 5 7 9,446.0 6.5 -0.1
-14 ▼ 35.6 6.5 -3.8 ▼▲
JP Morgan 4 1 10,402.9 7.1 -6.0 ▼ 39 15.518.3 +18 ▲ 32.5 5.9 +0.8
+2.9 ▲Bank of America Merrill Lynch 3 5 10,465.3 7.2 -0.2 ▼ 46
46 18.3 +3 ▲ 48.6 8.920.5 +6.6 ▲
Barclays 2 4 12,598.7 8.6 -0.3 ▼▲ 82 32.7 +29 ▲ 112.4Citi 1 2 29,756.5 20.4 +7.9
Deals Sh (%) # of Deals Fees Sh (%) Share Ch.# of Market Change in Manager Market Market2017
Rank2016 Rank
Market MarketBookrunner Proceeds Sh (%) Share Ch.
US Asset-Backed Securities excluding Self-Funded (F14a) Jan 1 - Jun 30
Proceeds per Bookrunner (US$m) # of Deals per Bookrunner Imputed Fees (US$m)
9Mizuho Financial Group 17▲10 15
94,517.8 +1.7
+1.6
US Structured Finance 2017 vs 2016 Jan 1 - Jun 30
▼
▲
100.078.0 -1.9
5,350.0
Industry TotalTop Ten Total 98,970.9
20.84716.4
7.5Mitsubishi UFJ Financial Group
▲
▲4.23.6
9.9% ▲Industry % Change from Same Period Last Year 22.3%
126,886.7
▲
Industry % Change from Last Quarter
https://www.thomsonone.com
416.7 100.0288.1 69.3 -3.0 ▼
226 +15
▲ 15.0 3.6+1.5▲ 12.1 2.9+9
▼-0.521 9.3 ▲
-5+1.5+12
23.2 5.6▼
Deutsche Bank 8 7 7,238.9 5.7 -1.3 ▼ 37-0.3
▼
+1.4 ▲7.4 -1.7 ▼ +17.4 13.7 +9 ▲
▲ 27.4 6.6Citi 7 4 9,408.6RBC Capital Markets 9,446.0
▲▼▲
▼ 31.6 7.6 -1.7▲
6.727.9JP Morgan 5 2 9,733.1
+0.7
+2.131
8.033.37.7
▲Wells Fargo & Co 4 5 11,159.5 8.8 -0.1 ▼Barclays 9.0
9.0 +1.23 11,443.4
11.1 +2.5 ▲10.2 +0.7
25.7 ▲-0.4 ▼ 44 19.5 -3 ▼ 42.4
37.458
▲
599.8
33.8%Industry % Change from Last Quarter 10.5% ▲
43.2%▲ 21.4%14.2%
272 +45
▲▲
+3.6 ▲Industry Total 162,052.9 100.0 100.0
412.013.7 2.3
▼ 68.8▲
Top Ten Total 121,776.8 75.2 -2.4+0.3 ▲
+1.516 5.9 +7 ▲ +0.6
▲Societe Generale 10 11 4,568.7 2.8Mitsubishi UFJ Financial Group ▲ 19.0 3.2
-1.4 ▼12 5,350.0 3.3 +0.9 ▲ 21 7.7 +12
23.7 4.05.3
27 9.9 -5 ▼-2.2 ▼▼5.8 -1.1 389,352.8
Credit Suisse 8 8 5,717.3 3.5
▼ -3.4 ▼14.0 -2 ▼ 32.0 ▼-0.1
9,870.5 6.15 ▲ 32.6
-2.9 ▼ 39 14.3 -2
US Asset-Backed Securities (F14) Jan 1 - Jun 30
# of Market Change in MarketSh (%)
Market
Proceeds per Bookrunner (US$m) # of Deals per Bookrunner
US Mortgage-Backed Securities (F11)
4791 33.5
17,735.3
Bookrunner Proceeds2017 Rank
45 21,864.5
25,502.9
Sh (%)Credit Suisse 1 1
Share Ch.68
Goldman Sachs & Co
Wells Fargo & Co 2
Citi
3
5Morgan Stanley
JP Morgan 4
Market # of Market Change in Manager Market
Manager
17.9 -4.0+7 ▲ 42.1# of Deals
13.4FeesSh (%)
2017 Rank
2016 Rank
▼Sh (%)
Jan 1 - Jun 30
# of Deals per Bookrunner Imputed Fees (US$m)
2 38,208.82
Bookrunner Proceeds
Proceeds per Bookrunner (US$m)Market Market
JP Morgan7.7 0 -
Barclays▲
5 12,464.7
Citi 1
11.9▼
+0.7 ▲9.6
Share Ch.23.6 +11.8
▼
Market
60-2.9 ▼15.9 -1.5 ▼
▲ 31.6 10.1
2016 Rank
29,275.6
54 14.257 15.0
13.935.9 11.4
Imputed Fees (US$m)
▼5.4 -0.138.7 6.5
Share Ch.Market
▼+2 ▲-2.5 ▼40.1-1.0
12.7+10 ▲
▲+6.8 ▲121.6+2.8
# of Deals
+4 53.3 8.9
Fees Sh (%)Deals Sh (%) Share Ch.▲ 20.3+38
17.3 ▲
1 12,389.4 7.7
7.94 12,808.7
▼ ▼
15.8
Deals
▲47 17.3 +18 ▲ +0.937.4 6.2
-0.2 ▼+9
-1333 12.1 +7
19.8% ▲
15.8
▼
-0.2 ▼50 13.2 +12 ▲ 26.9 8.5
4020.8
+21
Top Ten TotalIndustry Total
91.5 -1.4
Nomura
10Barclays
7 9,813.5BNP Paribas SA 9 11
8 16,037.8
4,901.89
+5-9-4.2 ▼
4717.7
Market
6 8
3
Proceeds per Bookrunner (US$m) # of Deals per BookrunnerMarket
10.8 +9
17 4.5
9.09.0
3434
41
19
▲ +2.2
▲
7.724.3+8 ▲ 19.9
13.3+4
▲6.3
+2.1 ▲▲
+0.1 ▲4.2 +1.53.0▲
-5-0.4 ▼▲+2.4 5.0 +6
-2.3 ▼-4.3
9.3▼252.8
3.0
2.7% ▲▲10.5%
379
6.8 -0.7 ▼
First Half 2017 | Debt Capital Markets | Managing Underwriters
US Securitizations
▲
5.3 -0.8
8.7 +2.8
-8.0
7.7
-1.6 ▼
-1.3
+1.2
-0.5
22,258.7 12.1
2017 Rank
2016 RankBookrunner
614,081.3
Imputed Fees (US$m)
40.0 6.7 -4.0 ▼43
▼-14.4% ▼-32.0%
100.0314.980.3
9.4
9.1Sh (%)# of Deals Share Ch.
Market
▼+36
MarketMarketSh (%)
-2Fees
▼ 37.8
ManagerChange in Share Ch. Deals
6 11,045.9
# of
2.73.7
▲▼
-8.0%
168,345.8
Industry % Change from Same Period Last YearIndustry % Change from Last Quarter
7
-1.4% ▼
6,874.4
6
Industry % Change from Same Period Last Year
Bank of America Merrill Lynch23
RBC Capital Markets
Bank of America Merrill Lynch 3
Wells Fargo & Co 6 3Deutsche Bank 7 7
53 23.5 -8.2 ▼Bank of America Merrill Lynch 2 6 14,030.1Credit Suisse 1
9
8
4
1 16,643.5 13.1
184,105.1 100.0
Sh (%)
▼
Proceeds-1.4 ▼
▲
▲21.6% ▲ 18.9% ▲
7.1% 46.5%
Visit http://dmi.thomsonreuters.com to view archives and order custom League Tables
*Excludes financial arms of sovereign states and floating rate issuance.
43.2%
-1.4%
3.5%
38.3%
-11.0%
-40%
-20%
0%
20%
40%
60%
ABS MBS CMBS RMBS Federal Credit AgenciesMBS
8
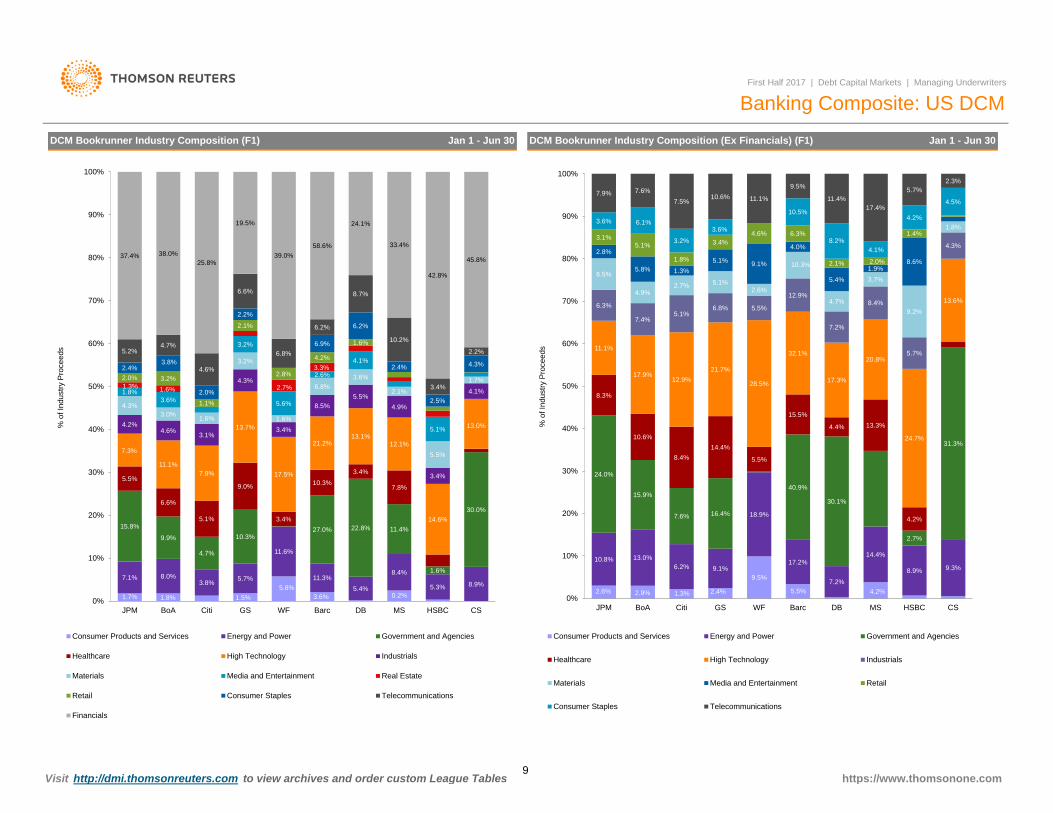
DCM Bookrunner Industry Composition (Ex Financials) (F1) Jan 1 - Jun 30DCM Bookrunner Industry Composition (F1) Jan 1 - Jun 30
https://www.thomsonone.com
First Half 2017 | Debt Capital Markets | Managing Underwriters
Banking Composite: US DCM
Visit http://dmi.thomsonreuters.com to view archives and order custom League Tables
2.6% 2.9% 1.3% 2.4%
9.5%
5.5% 4.2% 0.5%
10.8% 13.0% 6.2% 9.1%
18.9%
17.2%
7.2%
14.4%
8.9% 9.3%
24.0%
15.9%
7.6% 16.4%
40.9%
30.1%
2.7%
31.3%
8.3%
10.6%
8.4% 14.4%
5.5%
15.5%
4.4% 13.3%
4.2%
11.1%
17.9% 12.9%
21.7%
28.5%
32.1%
17.3%
20.8%
24.7%
13.6% 6.3%
7.4% 5.1%
6.8% 5.5%
12.9%
7.2%
8.4%
5.7%
4.3%
6.5%
4.9% 2.7% 5.1%
2.6%
10.3%
4.7%
3.7%
9.2%
1.8%
2.8%
5.8% 1.3% 5.1% 9.1%
4.0%
5.4% 1.9%
8.6%
3.1% 5.1%
1.8%
3.4% 4.6% 6.3%
2.1% 2.0%
1.4%
3.6% 6.1%
3.2%
3.6%
10.5%
8.2% 4.1%
4.2%
4.5% 7.9% 7.6%
7.5% 10.6% 11.1%
9.5%
11.4% 17.4%
5.7% 2.3%
0%
10%
20%
30%
40%
50%
60%
70%
80%
90%
100%
JPM BoA Citi GS WF Barc DB MS HSBC CS
% o
f Ind
ustry
Pro
ceed
s
Consumer Products and Services Energy and Power Government and Agencies
Healthcare High Technology Industrials
Materials Media and Entertainment Retail
Consumer Staples Telecommunications
1.7% 1.8% 1.5% 5.8%
3.6% 0.2%
7.1% 8.0% 3.8% 5.7%
11.6%
11.3% 5.4%
8.4%
5.3% 8.9%
15.8%
9.9%
4.7%
10.3% 27.0% 22.8% 11.4%
1.6%
30.0%
5.5%
6.6%
5.1%
9.0%
3.4%
10.3% 3.4%
7.8%
7.3%
11.1% 7.8%
13.7%
17.5%
21.2% 13.1%
12.1%
14.6%
13.0% 4.2% 4.6% 3.1%
4.3%
3.4%
8.5% 5.5%
4.9%
3.4%
4.1%
4.3% 3.0% 1.6%
3.2%
1.6%
6.8% 3.6%
2.1%
5.5%
1.7%
1.8% 3.6%
3.2%
5.6%
2.6%
4.1%
5.1%
1.3% 1.6% 2.7%
3.3%
1.3%
1.2% 2.0% 3.2%
1.1%
2.1%
2.8%
4.2%
1.6%
2.4% 3.8%
2.0%
2.2%
6.9%
6.2%
2.4%
2.5%
4.3%
5.2% 4.7%
4.6%
6.6%
6.8%
6.2%
8.7%
10.2%
3.4%
2.2%
37.4% 38.0% 25.8%
19.5%
39.0% 58.6%
24.1%
33.4%
42.8%
45.8%
0%
10%
20%
30%
40%
50%
60%
70%
80%
90%
100%
JPM BoA Citi GS WF Barc DB MS HSBC CS
% o
f Ind
ustry
Pro
ceed
s
Consumer Products and Services Energy and Power Government and Agencies
Healthcare High Technology Industrials
Materials Media and Entertainment Real Estate
Retail Consumer Staples Telecommunications
Financials
9
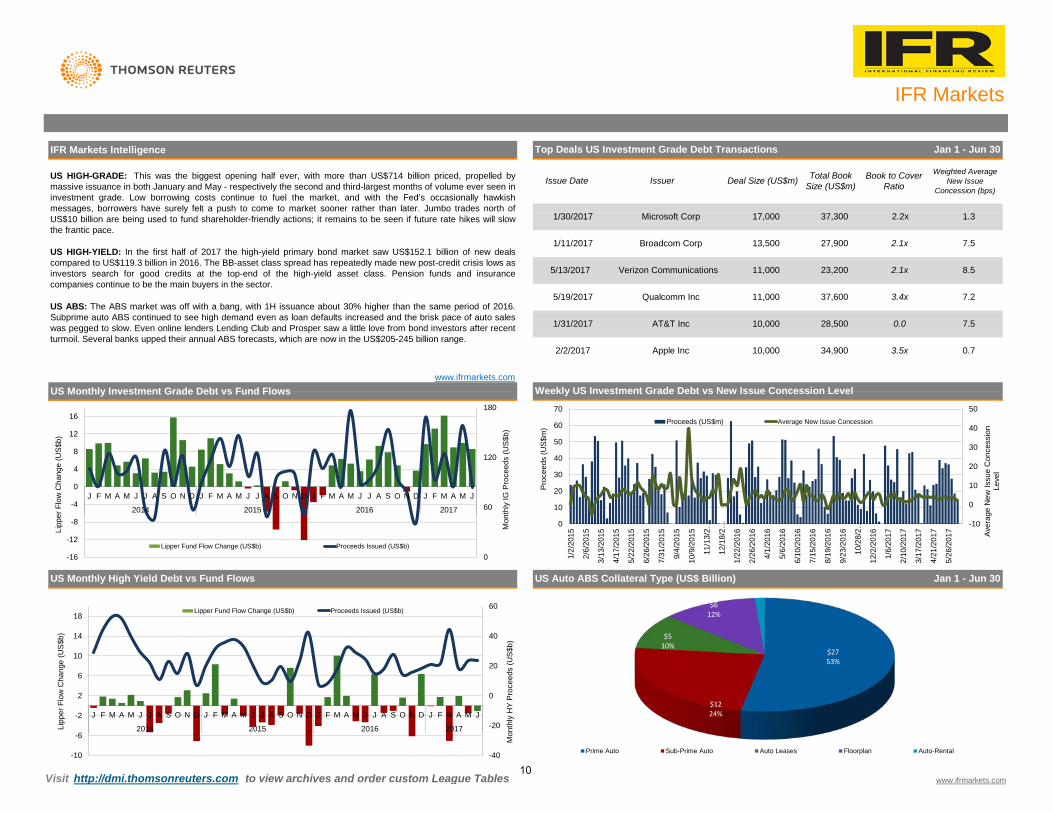
2/2/2017 Apple Inc 10,000 34,900 3.5x 0.7
IFR Markets
Top Deals US Investment Grade Debt Transactions Jan 1 - Jun 30IFR Markets Intelligence
www.ifrmarkets.com
US Monthly High Yield Debt vs Fund Flows
www.ifrmarkets.com
Visit http://dmi.thomsonreuters.com to view archives and order custom League Tables
Weekly US Investment Grade Debt vs New Issue Concession Level
Jan 1 - Jun 30
US Monthly Investment Grade Debt vs Fund Flows
1.3
Book to Cover Ratio
Weighted Average New Issue
Concession (bps)
US Auto ABS Collateral Type (US$ Billion)
11,000
10,000
5/13/2017
1/30/2017 Microsoft Corp 17,000
Verizon Communications
Broadcom Corp
Qualcomm Inc
AT&T Inc
US HIGH-GRADE: This was the biggest opening half ever, with more than US$714 billion priced, propelled bymassive issuance in both January and May - respectively the second and third-largest months of volume ever seen ininvestment grade. Low borrowing costs continue to fuel the market, and with the Fed’s occasionally hawkishmessages, borrowers have surely felt a push to come to market sooner rather than later. Jumbo trades north ofUS$10 billion are being used to fund shareholder-friendly actions; it remains to be seen if future rate hikes will slowthe frantic pace.
US HIGH-YIELD: In the first half of 2017 the high-yield primary bond market saw US$152.1 billion of new dealscompared to US$119.3 billion in 2016. The BB-asset class spread has repeatedly made new post-credit crisis lows asinvestors search for good credits at the top-end of the high-yield asset class. Pension funds and insurancecompanies continue to be the main buyers in the sector.
US ABS: The ABS market was off with a bang, with 1H issuance about 30% higher than the same period of 2016.Subprime auto ABS continued to see high demand even as loan defaults increased and the brisk pace of auto saleswas pegged to slow. Even online lenders Lending Club and Prosper saw a little love from bond investors after recentturmoil. Several banks upped their annual ABS forecasts, which are now in the US$205-245 billion range.
5/19/2017
1/11/2017 27,900 2.1x 7.5
11,000 23,200
1/31/2017
8.5
37,600
28,500
3.4x 7.2
0.0 7.5
Issue Date Issuer Deal Size (US$m) Total Book Size (US$m)
2.1x
13,500
37,300 2.2x
$27 53%
$12 24%
$5 10%
$6 12%
Prime Auto Sub-Prime Auto Auto Leases Floorplan Auto-Rental-40
-20
0
20
40
60
-10
-6
-2
2
6
10
14
18
J F M A M J J A S O N D J F M A M J J A S O N D J F M A M J J A S O N D J F M A M J
2014 2015 2016 2017Lipp
er F
low
Cha
nge
(US
$b)
Mon
thly
HY
Pro
ceed
s (U
S$b
)
Lipper Fund Flow Change (US$b) Proceeds Issued (US$b)
0
60
120
180
-16
-12
-8
-4
0
4
8
12
16
J F M A M J J A S O N D J F M A M J J A S O N D J F M A M J J A S O N D J F M A M J
2014 2015 2016 2017
Lipp
er F
low
Cha
nge
(US
$b)
Mon
thly
IG P
roce
eds
(US
$b)
Lipper Fund Flow Change (US$b) Proceeds Issued (US$b)
-10
0
10
20
30
40
50
0
10
20
30
40
50
60
70
1/2/
2015
2/6/
2015
3/13
/201
5
4/17
/201
5
5/22
/201
5
6/26
/201
5
7/31
/201
5
9/4/
2015
10/9
/201
5
11/1
3/2…
12/1
8/2…
1/22
/201
6
2/26
/201
6
4/1/
2016
5/6/
2016
6/10
/201
6
7/15
/201
6
8/19
/201
6
9/23
/201
6
10/2
8/2…
12/2
/201
6
1/6/
2017
2/10
/201
7
3/17
/201
7
4/21
/201
7
5/26
/201
7
Pro
ceed
s (U
S$m
)
Aver
age
New
Issu
e C
once
ssio
n Le
vel
Proceeds (US$m) Average New Issue Concession
10
Visit http://dmi.thomsonreuters.com to view archives and order custom League Tables
First HalfEuropean Financial and Corporate Inv Grade By Domicile Nation
Proceeds per Bookrunner (US$m)
Bank of America Merrill Lynch 1
Market Market
JP Morgan
5.2%
10.6 +0.1
▼ -20.3%
61
-20.4%Industry % Change from Last Quarter
Sh (%)
# of Deals per Bookrunner
-18.5% ▼
Sh (%)# of Deals2017 Rank
▲
Jan 1 - Jun 30
▼
10,359.3 100.0-1.058.1
▲ 21.2%
3,237 +159
BNP Paribas SA 9
3.6%
8
2,357,324.31,371,708.6
Industry Total
10 13
▲
114,744.2100,767.6
98122,624.1
-4.9▼9.8 +81▼54.9
+0.34.3
▼
- 388317
+2712.0▲ 385.2
▼▲ 319.7
5,682.8
3.14.9 488.3365 11.3 +61+0.8 ▲
▲▲
-0.2-0.4
▲
518.1
3.7
+0.7-1.1
▲5655.5
▼+3515.1 493.6+63
17.5 +28 5.0566.8
4.7
▲▼
-1.3▲+0.5
4.813.1
5.2 -0.7 ▼ 490423▼5.6
▼ 521
-0.2
6.3 5.7
Goldman Sachs & Co 6 7 132,607.7139,969.7
-1.1 ▼
▼16.1
6.7-0.2 ▼ 555 17.1-0.8
▼-0.7
+34 ▲690.5
-0.9 ▼+60 ▲
594.7
8.4 -0.47.3+143 759.7
Market MarketSh (%) Share Ch.
▼702
▲ 689 21.321.7 866.2+42 ▲
▲
+0.3 ▲6.6▲ 142.6 +0.2
▲ 100.6▲
4.7
Deals
First Half 2017 | Debt Capital Markets | Managing Underwriters
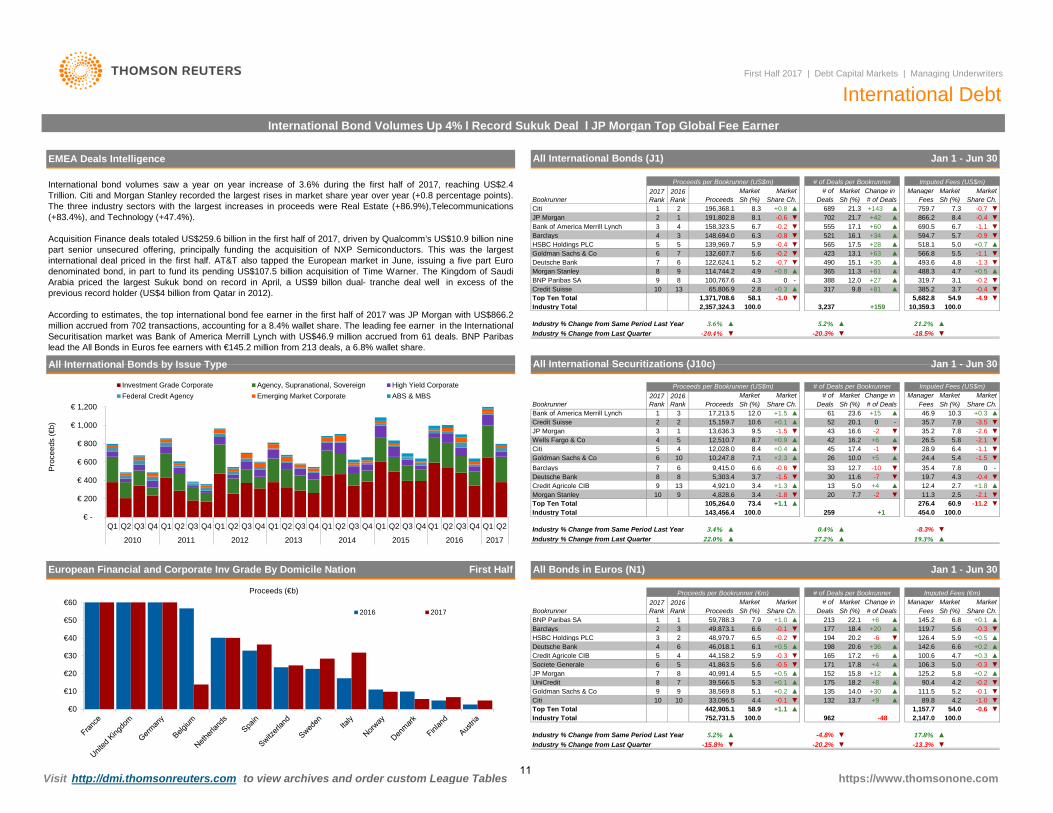
International DebtInternational Bond Volumes Up 4% l Record Sukuk Deal l JP Morgan Top Global Fee Earner
All International Bonds (J1) Jan 1 - Jun 30EMEA Deals Intelligence
# of MarketFeesProceeds
Change in ManagerImputed Fees (US$m)
▼ 126.4 5.9
# of Deals per Bookrunner
Sh (%) # of Deals
175▲
+4
Proceeds per Bookrunner (US$m)2017 Rank
2016 RankBookrunner
+1.0
https://www.thomsonone.com
17.8 106.3 5.0 ▼-0.35.8125.2 +0.2
5.9 -0.4
2.8 ▲
100.0
All Bonds in Euros (N1)
065,806.9Credit Suisse
Market Market
+0.88.18.3
-0.6
Sh (%) Share Ch.
▼
▼ 165 17.2Deutsche Bank
5.9▲
-0.344,158.246,018.1 6.1
Societe Generale 6 5
4 6Credit Agricole CIB 5 4
177 +20
+6198 20.6 +36194
5.6119.7 ▼-0.3▲+0.5
+0.56.5 -0.2 ▼ ▲-620.2HSBC Holdings PLC 3 2 48,979.7
Barclays 2 3 49,873.1
Share Ch.+0.1
6.6 -0.1 18.4▼▲
Fees Sh (%)145.2▲
Change in
6.859,788.3Share Ch.Proceeds # of Deals
+6Sh (%)
22.1
2016 Rank
1Sh (%)
1
# of
7.9 213▲Deals
BNP Paribas SABookrunner
MarketProceeds per Bookrunner (€m)
+2.3Barclays
Market
100.0
3.43.7
8.7
15,159.7
196,368.1
2 2
4
191,802.8
Proceeds
6.7
5
158,323.5148,694.0
17,213.5
Deutsche Bank 87
Top Ten Total
3
Industry % Change from Same Period Last Year
3Credit Suisse
Citi 1 2
Bank of America Merrill Lynch 4Barclays 3
3JP Morgan 2 1
2016 Rank
HSBC Holdings PLC 5
Bookrunner
Morgan StanleyDeutsche Bank 7 6
Market# of Market Change in Manager
All International Securitizations (J10c)
Imputed Fees (US$m)Market
Share Ch.
# of Deals per Bookrunner
+0.3Deals
20.1 0 -+15
+0.98.4
FeesShare Ch.12.0 +1.5
Sh (%)
28.9
▼52
MarketManager Market
46.9
Jan 1 - Jun 30
23.6
▼
▲
Market
5.8+6-2.6-2.1
35.4-0.4
12.7 -10 ▼
Imputed Fees (€m)
426.4
16.2
▼▼16.6 -2
7.9
-1.1
▲-3.5
10.3
13,636.3 -1.5 ▼ 35.2 7.8
▲
439.5▲ 26.5▲
35.7
Wells Fargo & Co 4 5 12,510.7
▲1
▼Goldman Sachs & Co 6 10 10,247.8
45Citi 5 4 12,028.024.4 5.4
+0.4 17.4 -1 ▼▲7.1 ▲
6 9,415.0 6.6 -0.6 33▼▲ 26 10.0 +5
+1.82.7▲13
▼-7.8 0
4.3
-1.5
8 5,303.4 ▼-7 ▼ 19.7-1.5 11.630▼+1.3
-2.1Credit Agricole CIB 9 13 4,921.0Morgan Stanley 10 11.3
▲9
5.0 +4
Top Ten Total 105,264.04,828.6 -1.8 ▼ 2.5 ▼
▲20 7.7 -2 ▼
12.4
454.060.973.4
3.4+1.1 ▲
-8.3%▲
▼-11.2+1 100.0
276.4259
▼Industry % Change from Last Quarter 22.0% ▲ 27.2%
▲19.3% ▲
2017 Rank
0.4%
▲5.6 -0.5 ▼ 171
Industry Total
Industry % Change from Same Period Last Year 3.4% ▲
143,456.4
▲ 152▲
41,863.58 40,991.4
5.3 +0.15.5 +0.5
18.2 +8 ▲ -0.2▲15.8 +12
90.4Goldman Sachs & Co 9 9 38,569.8
JP Morgan 7UniCredit 8 7 39,566.5
5.1 +0.2▼
▲ 111.5 5.2 -0.1▲ 1354.2
14.0 +304.289.8
▼Citi 10 10 33,096.5 4.4
442,905.113.7
▲▼ 132
58.9 +1.1 ▼▼+9 ▲ -1.0-0.1
54.0 -0.61,157.7100.02,147.0-48
Industry % Change from Same Period Last Year 5.2% ▲ -4.8% ▼ 17.8% ▲▼ -13.3%
Industry Total 752,731.5 100.0
International bond volumes saw a year on year increase of 3.6% during the first half of 2017, reaching US$2.4Trillion. Citi and Morgan Stanley recorded the largest rises in market share year over year (+0.8 percentage points).The three industry sectors with the largest increases in proceeds were Real Estate (+86.9%),Telecommunications(+83.4%), and Technology (+47.4%).
Acquisition Finance deals totaled US$259.6 billion in the first half of 2017, driven by Qualcomm’s US$10.9 billion ninepart senior unsecured offering, principally funding the acquisition of NXP Semiconductors. This was the largestinternational deal priced in the first half. AT&T also tapped the European market in June, issuing a five part Eurodenominated bond, in part to fund its pending US$107.5 billion acquisition of Time Warner. The Kingdom of SaudiArabia priced the largest Sukuk bond on record in April, a US$9 billon dual- tranche deal well in excess of theprevious record holder (US$4 billion from Qatar in 2012).
According to estimates, the top international bond fee earner in the first half of 2017 was JP Morgan with US$866.2million accrued from 702 transactions, accounting for a 8.4% wallet share. The leading fee earner in the InternationalSecuritisation market was Bank of America Merrill Lynch with US$46.9 million accrued from 61 deals. BNP Paribaslead the All Bonds in Euros fee earners with €145.2 million from 213 deals, a 6.8% wallet share.
All International Bonds by Issue Type
Top Ten Total
▼Industry % Change from Last Quarter -15.8% ▼ -20.2%
962
€ -
€ 200
€ 400
€ 600
€ 800
€ 1,000
€ 1,200
Q1 Q2 Q3 Q4 Q1 Q2 Q3 Q4 Q1 Q2 Q3 Q4 Q1 Q2 Q3 Q4 Q1 Q2 Q3 Q4 Q1 Q2 Q3 Q4 Q1 Q2 Q3 Q4 Q1 Q2
2010 2011 2012 2013 2014 2015 2016 2017
Pro
ceed
s (€
b)
Investment Grade Corporate Agency, Supranational, Sovereign High Yield CorporateFederal Credit Agency Emerging Market Corporate ABS & MBS
€0
€10
€20
€30
€40
€50
€60 Proceeds (€b)
2016 2017
11
First Half 2017 | Debt Capital Markets | Managing Underwriters
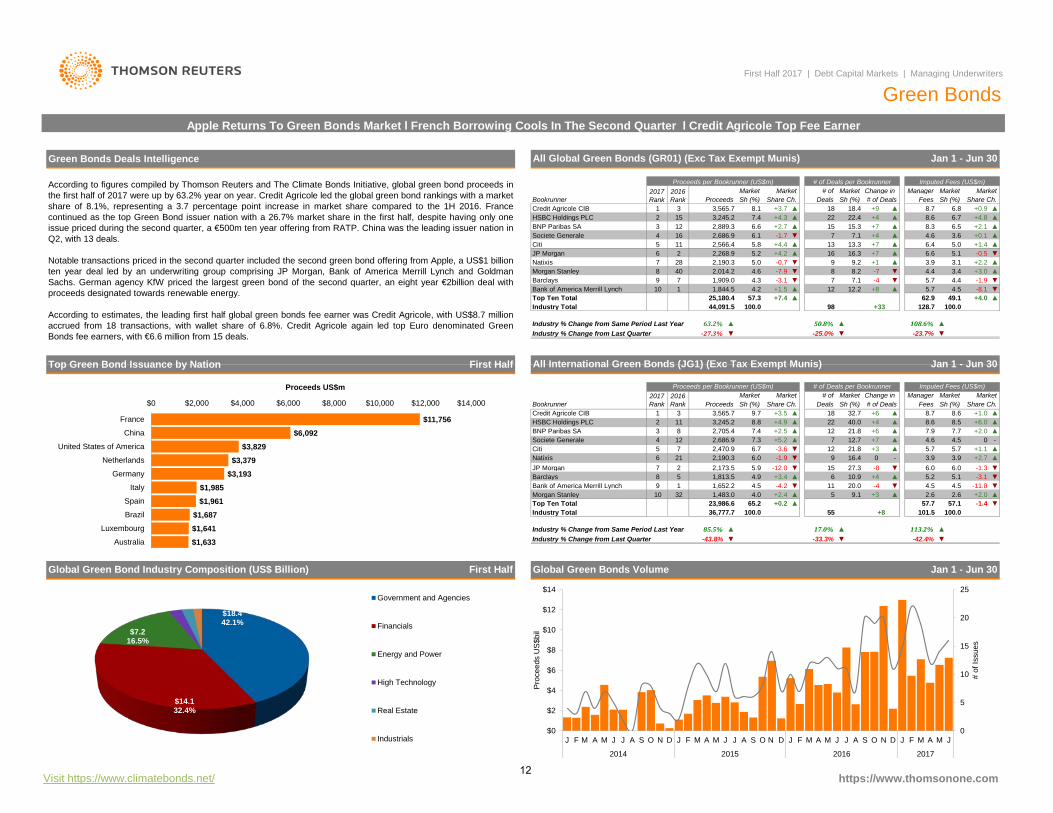
Green BondsApple Returns To Green Bonds Market l French Borrowing Cools In The Second Quarter l Credit Agricole Top Fee Earner
Green Bonds Deals Intelligence All Global Green Bonds (GR01) (Exc Tax Exempt Munis) Jan 1 - Jun 30
According to figures compiled by Thomson Reuters and The Climate Bonds Initiative, global green bond proceeds inthe first half of 2017 were up by 63.2% year on year. Credit Agricole led the global green bond rankings with a marketshare of 8.1%, representing a 3.7 percentage point increase in market share compared to the 1H 2016. Francecontinued as the top Green Bond issuer nation with a 26.7% market share in the first half, despite having only oneissue priced during the second quarter, a €500m ten year offering from RATP. China was the leading issuer nation inQ2, with 13 deals.
Notable transactions priced in the second quarter included the second green bond offering from Apple, a US$1 billionten year deal led by an underwriting group comprising JP Morgan, Bank of America Merrill Lynch and GoldmanSachs. German agency KfW priced the largest green bond of the second quarter, an eight year €2billion deal withproceeds designated towards renewable energy.
According to estimates, the leading first half global green bonds fee earner was Credit Agricole, with US$8.7 millionaccrued from 18 transactions, with wallet share of 6.8%. Credit Agricole again led top Euro denominated GreenBonds fee earners, with €6.6 million from 15 deals.
Proceeds per Bookrunner (US$m) # of Deals per Bookrunner Imputed Fees (US$m)2017 Rank
2016 Rank
Market Market # of Market Change in Manager Market MarketBookrunner Proceeds Sh (%) Share Ch. Deals Sh (%) # of Deals Fees Sh (%) Share Ch.Credit Agricole CIB 1 3 3,565.7 8.1 +3.7 ▲ 18 18.4 +9 ▲ 8.7 6.8 +0.9 ▲HSBC Holdings PLC 2 15 3,245.2 7.4 +4.3 ▲ 22 22.4 +4 ▲ 8.6 6.7 +4.8 ▲BNP Paribas SA 3 12 2,889.3 6.6 +2.7 ▲ 15 15.3 +7 ▲ 8.3 6.5 +2.1 ▲Societe Generale 4 16 2,686.9 6.1 -1.7 ▼ 7 7.1 +4 ▲ 4.6 3.6 +0.1 ▲Citi 5 11 2,566.4 5.8 +4.4 ▲ 13 13.3 +7 ▲ 6.4 5.0 +1.4 ▲JP Morgan 6 2 2,268.9 5.2 +4.2 ▲ 16 16.3 +7 ▲ 6.6 5.1 -0.5 ▼Natixis 7 28 2,190.3 5.0 -0.7 ▼ 9 9.2 +1 ▲ 3.9 3.1 +2.2 ▲Morgan Stanley 8 40 2,014.2 4.6 -7.9 ▼ 8 8.2 -7 ▼ 4.4 3.4 +3.0 ▲Barclays 9 7 1,909.0 4.3 -3.1 ▼ 7 7.1 -4 ▼ 5.7 4.4 -1.9 ▼Bank of America Merrill Lynch 10 1 1,844.5 4.2 +1.5 ▲ 12 12.2 +8 ▲ 5.7Top Ten Total 25,180.4 57.3 +7.4 62.9 49.1
4.5 -8.1 ▼
98▲
128.7 100.0+4.0 ▲
Industry Total 44,091.5 100.0
Industry % Change from Same Period Last Year 63.2% ▲ 50.8% ▲ 108.6%-27.3% ▼ -25.0% ▼ -23.7%
▲
+33
▼
Top Green Bond Issuance by Nation First Half All International Green Bonds (JG1) (Exc Tax Exempt Munis) Jan 1 - Jun 30
Proceeds per Bookrunner (US$m) # of Deals per Bookrunner Imputed Fees (US$m)
Industry % Change from Last Quarter
2017 Rank
2016 Rank
Market MarketBookrunner Proceeds Sh (%) Share Ch.
# of Market Change in Manager Market MarketDeals Sh (%) # of Deals Fees Sh (%) Share Ch.
Credit Agricole CIB 1 3 3,565.7 9.7 +3.5 ▲ 18 32.7 +6 ▲ 8.7 8.6 +1.0 ▲HSBC Holdings PLC 2 11 3,245.2 8.8 +4.9 ▲ 22 40.0 +4 ▲ 8.6 8.5 +6.0 ▲BNP Paribas SA 3 8 2,705.4 7.4 +2.5 ▲ 12 21.8 +6 ▲ 7.9 7.7 +2.0 ▲Societe Generale 4 12 2,686.9 7.3 +5.2 ▲ 7 12.7 +7 ▲ 4.6 4.5 0 -Citi 5 7 2,470.9 6.7 -3.6 ▼ 12 21.8 +3 ▲ 5.7 5.7 +1.1 ▲Natixis 6 21 2,190.3 6.0 -1.9 ▼ 9 16.4 0 - 3.9 3.9 +2.7 ▲JP Morgan 7 2 2,173.5 5.9 -12.0 ▼ 15 27.3 -8 ▼ 6.0 6.0 -1.3 ▼Barclays 8 5 1,813.5 4.9 +3.4 ▲ 6 10.9 +4 ▲ 5.2 5.1 -3.1 ▼Bank of America Merrill Lynch 9 1 1,652.2 4.5 -4.2 ▼ 11 20.0 -4 ▼ 4.5 4.5 -11.8 ▼Morgan Stanley 10 32 1,483.0 4.0 +2.4 ▲ 5 9.1 +3 ▲ 2.6 2.6 +2.0 ▲Top Ten Total 23,986.6 65.2 +0.2 ▲ 57.7 57.1 -1.4
100.0▼
Industry Total 36,777.7 100.0
▲ 17.0% ▲ 113.2%
+8 101.555
▲Industry % Change from Last Quarter -43.8% ▼ -33.3% ▼ -42.4% ▼Industry % Change from Same Period Last Year 85.5%
Visit https://www.climatebonds.net/ https://www.thomsonone.com
Global Green Bond Industry Composition (US$ Billion) First Half Global Green Bonds Volume Jan 1 - Jun 30
0
5
10
15
20
25
$0
$2
$4
$6
$8
$10
$12
$14
J F M A M J J A S O N D J F M A M J J A S O N D J F M A M J J A S O N D J F M A M J
2014 2015 2016 2017
# of
Issu
es
Pro
ceed
s U
S$b
il
$18.4 42.1%
$14.1 32.4%
$7.2 16.5%
679.50 1.6% Government and Agencies
Financials
Energy and Power
High Technology
Real Estate
Industrials
$11,756 $6,092
$3,829 $3,379
$3,193 $1,985 $1,961
$1,687 $1,641 $1,633
$0 $2,000 $4,000 $6,000 $8,000 $10,000 $12,000 $14,000
France
China
United States of America
Netherlands
Germany
Italy
Spain
Brazil
Luxembourg
Australia
Proceeds US$m
12
Visit http://dmi.thomsonreuters.com to view archives and order custom League Tables
▼ -15.8% ▼Industry % Change from Last Quarter -20.5% ▼ -16.1%Industry % Change from Same Period Last Year 61.3% ▲ 58.5% ▲ 78.2% ▲
+38+2.3 ▲
Industry Total 45,576.8 100.0 495.3103 100.063.5▲ 314.1Top Ten Total 28,705.4 63.0 +8.0
MarketSh (%)
▼
Fees Sh (%) Share Ch.Market Manager# of Market Change in
▼Industry % Change from Last Quarter -24.1% ▼
Sh (%) # of DealsJP Morgan
Industry % Change from Same Period Last Year 41.5%
Top Ten Total 116,499.5
▲ 86.0% ▲ 74.6% ▲-27.8% ▼-17.4%
305 +141 2,659.9 100.0-12.0 ▼
Industry Total 173,931.9 100.0
▲66.9 -9.0 ▼ 1,657.3 62.5
+28 ▲ +0.173
100.0 3.83.9102.9
60 19.74.0 +0.7 ▲▼
RBC Capital Markets 10 10 7,029.3Deutsche Bank 9 6 7,375.4
▼4.2 -4.5
+25 ▲23.9 +12 ▲ ▼24.9 102.4 3.9 -0.5
-3.94.3 -0.9 ▼ 76Wells Fargo & Co 8 9 7,550.6
22.6 +20 ▲ 141.4 5.3 +0.5-0.2 ▼
▲Morgan Stanley 7 8 10,075.2 5.8 +0.5 ▲ 69
-2.883 27.2 +28 ▲
105184.2 6.9
5.96.6 -0.4 ▼
▼Credit Suisse 6 7 11,549.4Citi 5 2 12,335.1
▼7.1 -2.3
+16 ▲34.4 +41 ▲
12,639.1157.6 ▼
29.2 180.0 6.8 -2.5-2.8
7.3 -2.0 ▼ 89+16 ▲ 180.6 6.883
-1.3 ▼▼Barclays 3 5 12,686.7 7.3 -1.7 ▼
214.1 8.1126 41.3 +41 ▲▲11.7 +2.2 45.9140
27.28.6 -0.6 ▼
+1.4# of Deals Fees Sh (%) Share Ch.
294.1 11.1+55 ▲ ▲
Change in ManagerMarket Market # of Market
▲▼ -25.4% ▼
Industry % Change from Same Period Last Year 44.3%Industry % Change from Last Quarter -22.7% ▼ -16.0%
+177
▲ 78.3% ▲ 74.1%
100.0▼
Industry Total 223,315.0 100.061.63.3
-9.1403 3,197.0
▲Top Ten Total 144,088.4 64.4 -5.4 ▼ 1,965.6
78103.93.3
3.4+24 ▲ 109.09 8,088.0RBC Capital Markets 10 10 7,436.1
9Wells Fargo & Co ▼+0.6 ▲
▼ -0.566 16.4 +32 ▲ +0.2
26.6 159.2 5.0 -3.4 ▼3.6 -0.7
+26 ▲19.4
5.4 -4.3 ▼ 107Deutsche Bank 8 1 12,106.520.6 +29 ▲ 173.2 5.4 +1.3
+0.1 ▲▲Morgan Stanley 7 8 12,786.3 5.7 +1.2 ▲ 83
-2.5109 27.0 +43 ▲122
215.8 6.85.6
6.2 -0.3 ▼▼
Credit Suisse 6 7 13,844.7Citi 5 4 14,742.5
▼6.6 -1.9
+29 ▲30.3 +50 ▲ 178.3 ▼26.6 215.6 6.7 -2.47.2 -0.9 ▼ 107
115Barclays 4 6 16,103.0
▼Goldman Sachs & Co 3 2 16,278.4 7.3 -1.4 ▼ ▲ 220.4+48
28.5 +3436.0 -1.07.5
6.9 -2.5
+1.6 ▲▼Bank of America Merrill Lynch 2 5 17,421.9 7.8 -0.4 ▲
JP Morgan 1 3 25,281.0 11.3 +2.7 ▲▲ 177 43.9 11.0239.3350.9+78
145▼
Market MarketSh (%) Share Ch. Deals Sh (%) # of Deals Fees Sh (%) Share Ch.Market Market # of Market Change in Manager
Proceeds per Bookrunner (US$m) # of Deals per Bookrunner Imputed Fees (US$m)2017 Rank
2016 RankBookrunner Proceeds
First Half 2017 | Debt Capital Markets | Managing Underwriters
High Yield DebtFirst Half Volumes Up 44% l Netflix European High Yield Market Debut l JP Morgan Tops Global Fee Rankings
Global High Yield Debt (B4) Jan 1 - Jun 30Global High Yield Deals Intelligence
Global High Yield Debt - US Dollar Denominated (B5) Jan 1 - Jun 30
Global High Yield Debt - Non-US Dollar Denominated (B6) Jan 1 - Jun 30
Proceeds per Bookrunner (US$m)
Bookrunner Proceeds Sh (%) Share Ch.
Bookrunner Proceeds
20,336.6Bank of America Merrill Lynch 2 4 14,922.1
Goldman Sachs & Co 4 3
2017 Rank
2017 Rank
Proceeds per Bookrunner (€m)
2016 Rank
JP Morgan 1 1
MarketMarket
# of Deals per Bookrunner Imputed Fees (US$m)
# of Deals per Bookrunner Imputed Fees (€m)
Deals Sh (%)Market Market
1 4 4,545.8Share Ch. Deals
10.0
2016 Rank
35+24+14
+4.7 ▲ 39 37.9Deutsche Bank 2 1 4,355.0 ▲ 51.89.6 -3.5 34.0▼
+2.8 ▲10.5 -0.6 ▼
▲ 52.2 10.6
Goldman Sachs & Co 3 2 3,372.2 7.4 +1.1 ▼30 29.1 +19 ▲ 37.4 7.6▲ -2.56.5 025.2 +13 ▲ 32.4
+0.5 ▲ -0.4 ▼Barclays 4 6 3,160.3 ▲ 26
Morgan Stanley 6 22 2,500.8
-HSBC Holdings PLC 5 3 2,649.1 5.8 5.0
▲
https://www.thomsonone.com
22.3 +10 ▲ 23.5 4.7 +0.3
32 24.931.1 +16 ▲14.6 +9
Bank of America Merrill Lynch5.9 +4.9▲ 29.4
7 11 2,328.4▲ 15
Citi 8 5 2,232.3 4.9 19.2-
-0.3 ▼ 20 19.4▲
3.9 -1.3▲ 23
+0.8▼+10 ▲
Credit Suisse 9 8 2,107.8 4.6 02.9
▲BNP Paribas SA 10 9 1,453.7 21.4 +4 ▲
27.2
+1.9
-1.7+15
▼ 225.928 ▲ 29.1
14.2
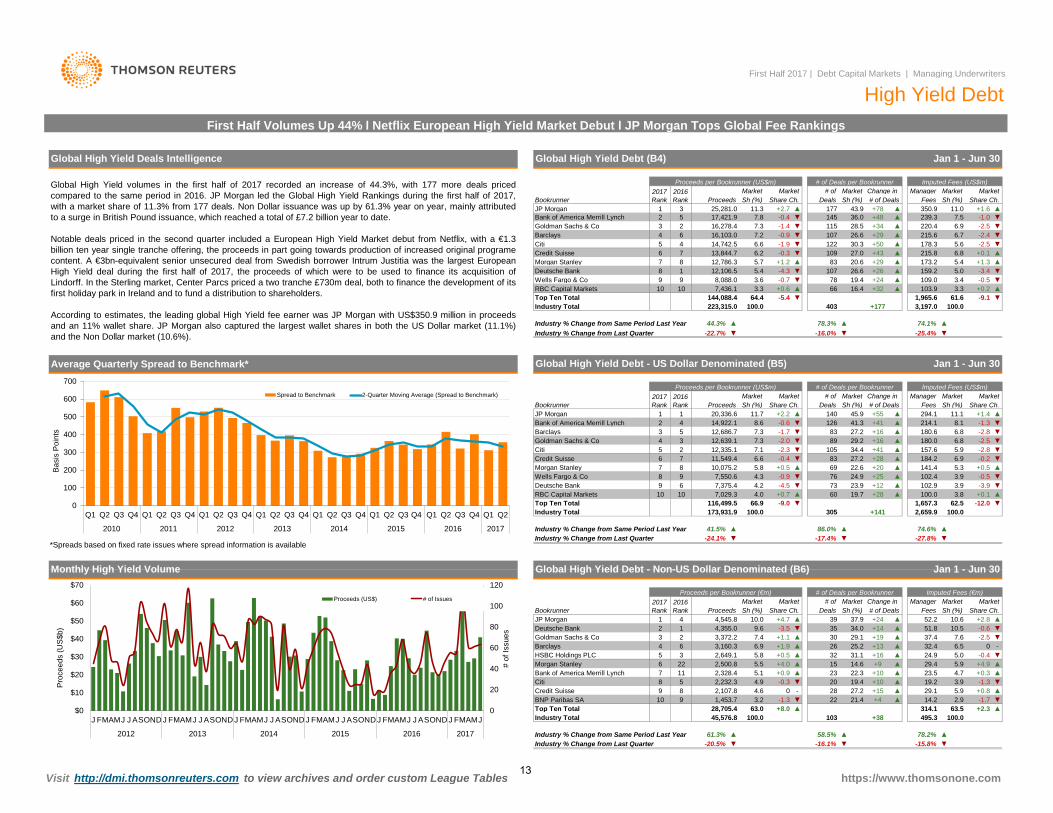
Global High Yield volumes in the first half of 2017 recorded an increase of 44.3%, with 177 more deals pricedcompared to the same period in 2016. JP Morgan led the Global High Yield Rankings during the first half of 2017,with a market share of 11.3% from 177 deals. Non Dollar issuance was up by 61.3% year on year, mainly attributedto a surge in British Pound issuance, which reached a total of £7.2 billion year to date.
Notable deals priced in the second quarter included a European High Yield Market debut from Netflix, with a €1.3billion ten year single tranche offering, the proceeds in part going towards production of increased original programecontent. A €3bn-equivalent senior unsecured deal from Swedish borrower Intrum Justitia was the largest EuropeanHigh Yield deal during the first half of 2017, the proceeds of which were to be used to finance its acquisition ofLindorff. In the Sterling market, Center Parcs priced a two tranche £730m deal, both to finance the development of itsfirst holiday park in Ireland and to fund a distribution to shareholders.
According to estimates, the leading global High Yield fee earner was JP Morgan with US$350.9 million in proceedsand an 11% wallet share. JP Morgan also captured the largest wallet shares in both the US Dollar market (11.1%)and the Non Dollar market (10.6%).
Average Quarterly Spread to Benchmark*
Monthly High Yield Volume
3.2 -1.3
5.1 +0.95.5 +4.0
6.9
0
100
200
300
400
500
600
700
Q1 Q2 Q3 Q4 Q1 Q2 Q3 Q4 Q1 Q2 Q3 Q4 Q1 Q2 Q3 Q4 Q1 Q2 Q3 Q4 Q1 Q2 Q3 Q4 Q1 Q2 Q3 Q4 Q1 Q2
2010 2011 2012 2013 2014 2015 2016 2017
Bas
is P
oint
s
Spread to Benchmark 2-Quarter Moving Average (Spread to Benchmark)
*Spreads based on fixed rate issues where spread information is available
0
20
40
60
80
100
120
$0
$10
$20
$30
$40
$50
$60
$70
J FMAMJ J ASOND J FMAMJ J ASOND J FMAMJ J ASOND J FMAMJ J ASOND J FMAMJ J ASOND J FMAMJ
2012 2013 2014 2015 2016 2017
# of
Issu
es
Pro
ceed
s (U
S$b
)
Proceeds (US$) # of Issues
13
*tie
Visit http://dmi.thomsonreuters.com to view archives and order custom League Tables
Jan 1 - Jun 30All International Emerging Market Bond Volume by Industry (US$b)
90.5%21.8%
▲115.9% ▲ -31.9% ▼ -13.4%
41.8% ▲
46.3%
-8
-15.7%
65.3▲▲+30.171.8
-28.0% ▼ -11.4% ▼▲
109.6
▼
100.043
▲
3.3▲
4.7▲
2.6
▲+1.7
2.9
▼
Industry Total
53.6% ▲ 249.9% ▲15.0% ▲ 40.5%
% Change from Last Quarter -28.9% ▼% Change from Same Period Last Year 38.1% ▲
Top Ten Total 34,115.7Societe Generale 10 1,371.8 ▲
+21.871.1-24.7
48,039.9
2.9 +1.621
100.0▲
National Bank of Kuwait SAK 9 32 1,513.3 +2.8 ▲3.2 3 2.8▲ 3.0+1.2
7.0 +1 +1.82 ▼
2 4.7 +2 ▲3.43.0▼ 3.33.0+3.4 ▲ +3.0
7.0 -2NCB Capital Corp 8 - 1,635.7
33.616.3 +3 ▲
Deutsche Bank 5 35.067.3
Barclays3,525.8
+0.1-1.2
7▲+2.2 ▲
▼ 48 2,383.3
BNP Paribas SA 7 18 1,735.9
▲7.3 6.6 +2.7▼-0.14.3
▲17 39.5 +6 ▲ 8.5 7.79.3 -3
▲32.6 +611.7 +1.4 ▲
8.010.8 +4.2▲
+4.7Standard Chartered PLC 4 6 3,841.711.9
+2.2
HSBC Holdings PLC
14▲16 37.2 +6 ▲ 12.2 +4.2▲
14.7+2.3 ▲
58.1 +9
JP Morgan 3 1 5,632.0
1 ▲Citi 2 2 5,946.1 12.4 11.1
13.4 +6.7▲Deals Sh (%)
13.6 +7.0 ▲ 25Sh (%)
5 6,530.1
MarketSh (%) Share Ch.# of Deals Fees
Change in ManagerShare Ch.
Proceeds per Bookrunner (US$m)Market Market # of Market
# of Deals per BookrunnerMarket
100.0
Imputed Fees (US$m)2017 Rank
2016 RankBookrunner Proceeds
Middle East Emerging Market Bonds (L5) Jan 1 - Jun 30
% Change from Last Quarter -25.3% ▼ % Change from Last Quarter ▼ -3.1% ▼ -17.2% ▼▲ 201.4% ▲
1,060.0
% Change from Same Period Last Year 70.5% ▲
+104
49.8%
Industry Total▼
313 100.044.6471.1
-2.8▲ 37.2
180,284.3-0.2 ▼ -7.8
▼Top Ten Total 88,037.4 48.8Goldman Sachs & Co 10 13 5,609.1
34.2 3.23.1 +0.2 ▲ 32 10.2 +15 3.5
14.1 +12 ▲Bank of America Merrill Lynch 9 3 6,060.9-1.2 ▼
3.4 -2.051 16.3
▼ -3.4 ▼44
39.7▲
▲ 35.53.4 +0.1 ▲ +26UBS 8 10 6,140.16.06,559.7 ▲3.6 +1.13.4
▲42 13.4 +25 ▲ 64.0 +1.2
-0.1 ▼3.8 -2.2 ▼
52+18
35.7 3.415.3
8,106.7 4.5-0.67,826.8
16.6 +31▼ 484.3
Proceeds per Bookrunner (US$m) # of Deals per Bookrunner
Deutsche Bank 5 8
Market # of MarketImputed Fees (US$m)
+0.6 ▲
2017 Rank
2016 Rank
1 1Proceeds
Market
- 10.9 ▲-0.3
▼100.0
-1.5333.8
58.44.7 +0.4
7 16JP Morgan 6Credit Suisse
5
▼
100.0 95 +19Industry Total 78,945.7
▲% Change from Same Period Last Year 12.0% 58.3%
246.9+4.3 ▲8.4 03.2 -4.7 ▼ 8
66.2BBVA 10 6 2,511.9Top Ten Total 61,437.6
15 15.8 +10 ▲ 13.5 2.0+2.6
5.2 -5.3▲BNP Paribas SA
Santander
+2.9 ▲Itau Unibanco 9 17 3,124.2 4.0108 12 3,415.5 4.3207 3 4,138.5 ▼ +7 ▲
▼21.110.5 +7 ▲ 8.5
-1.3 ▼3.1 -3.0 ▼
21.5
10Morgan Stanley 4
▲17.4 0.9Deutsche Bank 6 7 4,286.3
Citi 1 5 14,086.9
ManagerImputed Fees (US$m)
2017 Rank
2016 Rank ProceedsBookrunner # of Deals
Jan 1 - Jun 30
FeesMarket Market # of Market
▼
+0.5
Change in Proceeds per Bookrunner (US$m) # of Deals per Bookrunner
Latin America Emerging Market Bonds (L3)
▲
% Change from Last Quarter
HSBC Holdings PLC
5.3
-0.5
# of
Citi 1 2 40,113.8 10.6Sh (%)
6.57 3,567.3
-1.5-0.6
5 3,351.65.1
+0.9
Proceeds per Bookrunner (US$m)2017 Rank
2016 Rank
MarketShare Ch.Bookrunner Proceeds Sh (%)
Market
Asia-Pacific Emerging Market Bonds (L4)
▲ 165
Market
133.8
4 8 4,520.5
182 +68
▲-5.4% ▼
+1.6
76
% Change from Last Quarter
▲▲25.0
MarketMarketChange in ManagerBookrunner Sh (%)
▼ 16,650.2 9.2 -0.5DealsSh (%) Share Ch.
▼ 119 +48 ▼Fees Sh (%) Share Ch.
-0.3▲# of Deals
8.084.6Share Ch.
17.8 35.8Deals Sh (%)
+8.8 ▲ 34-0.8 ▼ Standard Chartered PLC 4
▲+20 59.3 12.343.3▲
HSBC Holdings PLC 3 4 8,275.3 10.5JP Morgan 2 1 10,103.3 +14
▼-1.5
38.0-0.56.311,277.8 25.981
HSBC Holdings PLC-2.6 ▼ 36 37.9
23 24.2+1.1 ▲▲
4.0▲Bank of China Ltd
-2.0 ▼+1.547.52
25.2▲
+7 ▲ 9.526.0 42.479Citi 3 24.5
-4.0 +2.827.4+2.9 ▲ +0.2
8.1
1.6
▲
https://www.thomsonone.com
22.7 +45 ▲ 50.3 4.8 ▲71 +1.5▲
Proceeds per Bookrunner (US$m)
▲5.09,044.94 6 +0.6 ▲6.0
First Half 2017 | Debt Capital Markets | Managing Underwriters
Emerging MarketsAll International Emerging Market Debt Up 53% l EMEA Emerging Market Debt Up 91%
Jan 1 - Jun 30EMEA Emerging Market Bonds (L2)All International Emerging Market Bonds (L1) Jan 1 - Jun 30
▼30.7 +7433.9
▲ 143.3 8.1 -0.2 ▼7.62 3 34,503.1
134▼8.5 -1.19.1
-0.7JP Morgan 3 1 32,064.7Deutsche Bank 4 5 19,819.4 ▼
▼14.3 +30 ▲
7.4 -2.2-0.5
+57 129.770.5 4.0
4.9 +1.7 ▲ 117 21.8 +7077
3.953.0
▲ 68.9Standard Chartered PLC 5 8 18,532.3+2969 12.8
Bank of America Merrill Lynch 7 4 14,310.9BNP Paribas SA 6 10 15,033.7
+24▼▲
82 15.3 ▲9.9 +14▼
▲3.8 -3.2
53
4.0 +1.2
Barclays 8 6 10,913.5
54.7
562.8 +0.3 ▲13Morgan Stanley 10
10.4Goldman Sachs & Co 9 11 10,659.010,493.8
Imputed Fees (US$m)Change in
DealsMarketMarketManager
Fees# of Deals
# of Deals per Bookrunner
Share Ch.
▲+282.8 +0.3
2.9 -0.9
55Top Ten Total 206,444.2Industry Total
-0.3537
3.074.1
▲2.8
47.5
100.0819.0 46.5
2.7
▲
▼
4.2
2.8
-293
Sh (%)
+2110.2▲
0▼▲
▼
-3.0-
-1.1
▼
HSBC Holdings PLC▲
VTB Capital
Standard Chartered PLC
Deutsche Bank+1.9+0.8
Natixis 10
1,759.8
48.7 ▼49.5
▲19 22.1 +6
% Change from Same Period Last Year 53.0% ▲
20.9 +14+3.1
14▲ 12
▼▼12.6 -0.1
-3.7▲ 11.7
Goldman Sachs & Co 8 10
# of Deals37
16.340.7
▲▲
14.0
▲
2,882.89 11.6 +1
+354.8
3,187.8 9.217.4 +9
Barclays
17
4.09
2,779.1
183,091.9 ▲
3.7 ▲+0.6+2.2
4.24.54.6
+0.4 15
5.4 -2.5
148.7%
13
▲
-0.4 ▲+4.366.2
377,359.2
5 2
100.0
5,851.7
12.8
Sh (%)
-13.5%
Bank of America Merrill Lynch 5,644.0 ▲21.1 +8 ▲
23 24.27.47.2
41.7%
▼ +520
Jan 1 - Jun 30
8.2
▲
MarketMarketShare Ch.
Imputed Fees (US$m)2017 Rank
2016 Rank
Market MarketChange in Market Market
▲
19.1
▼
# of Deals per Bookrunner
▼
Sh (%)
-14.7%
610
+46.5
Bookrunner Proceeds Sh (%) Share Ch. Deals Sh (%) Sh (%)Fees Share Ch.Manager
Citi 1 1 9,165.4 43.0
Market # of
13.2JP Morgan 2 2BNP Paribas SA 3 4 5,255.3
+0.3 ▲8,135.5 11.7▲7.6 +0.7
-0.1 ▼35
+14 29.5
+8+4
31.8+18 ▲▲
7.715.2
+4.7 ▲6.0
19.5+1.3
-1.0 ▼3.9 -0.8 ▼
▲▲ 9.812.8▼ 11
▼
4.511.3
9.8 3.9
2.7▲ ▲ 6.8
8.6▲
7.0 +3 ▲-1.1 ▼ +1.2
+2.5▲▲▲
+6.945,937.23.4+2.2
100.0▲
10,761.2+1.4-1.1
+49+34
▲
69,387.2 252.3
% Change from Same Period Last Year
+30
▲
Industry Total
9 9.5 -2 +2.5▼8.0
8660.1151.5Top Ten Total
100.0
$153.4 41%
$120.2 32%
$38.9 10%
$20.2 6%
$15.9 4%
$10.0 3%
Financials
Government and Agencies
Energy and Power
Real Estate
Industrials
Materials
Consumer Staples
High Technology
Media and Entertainment
Retail
Consumer Products and Services
14
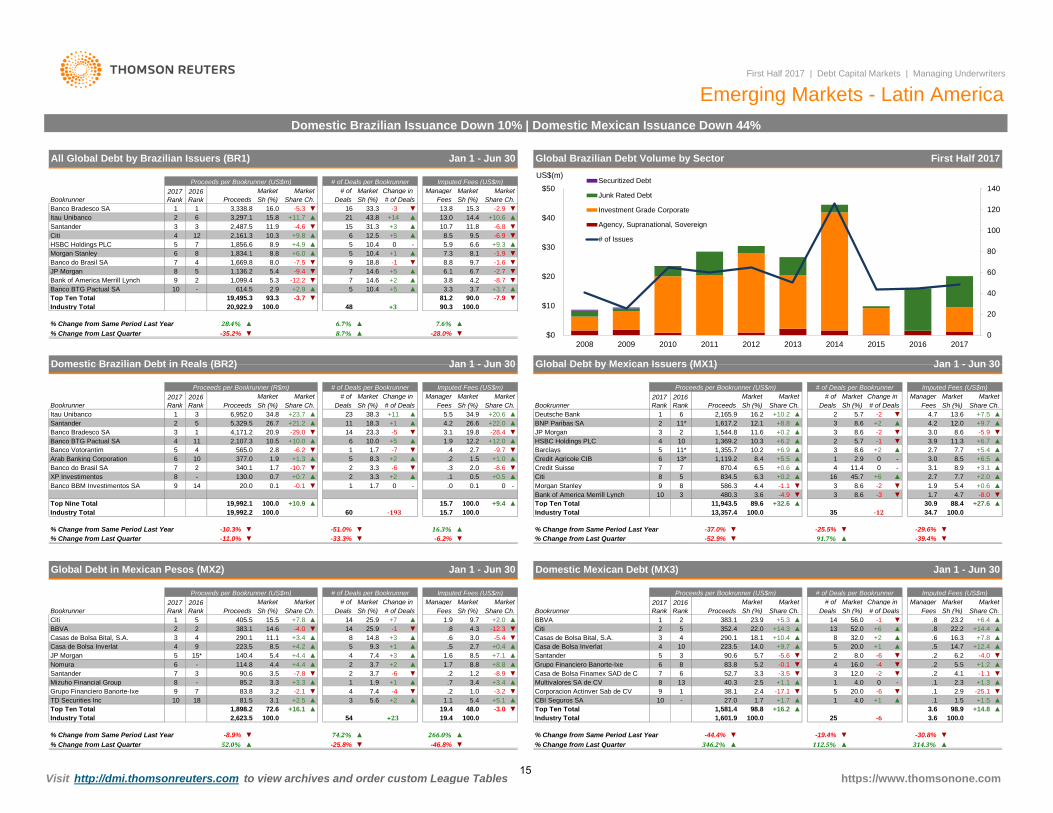
Visit http://dmi.thomsonreuters.com to view archives and order custom League Tables
▲% Change from Last Quarter -11.0% ▼ -33.3% ▼ -6.2% ▼% Change from Same Period Last Year -10.3% ▼ -51.0% ▼ 16.3%
-193 15.760 100.0▲
Industry Total 19,992.2 100.015.7 100.0 +9.4Top Nine Total 19,992.1 100.0 +10.9 ▲
0.1 0 -▼ 1 1.7 0 - .0Banco BBM Investimentos SA 9 14 20.0 0.1 -0.1+2 ▲ .1 0.5 +0.5 ▲
▼XP Investimentos 8 - 130.0 0.7 +0.7 ▲ 2 3.3
3.3 -6 ▼ .3 2.0 -8.6+1.0 ▲
Banco do Brasil SA 7 2 340.1 1.7 -10.7 ▼ 25 8.3 +2 ▲ .2 1.5
2.7 -9.7 ▼Arab Banking Corporation 6 10 377.0 1.9 +1.3 ▲
▼ 1 1.7 -7 ▼ .4Banco Votorantim 5 4 565.0 2.8 -6.2+5 ▲ 1.9 12.2 +12.0 ▲
▼Banco BTG Pactual SA 4 11 2,107.3 10.5 +10.0 ▲ 6 10.0
23.3 -5 ▼ 3.1 19.8 -28.4+22.0 ▲
Banco Bradesco SA 3 1 4,171.2 20.9 -29.0 ▼ 1411 18.3 +1 ▲ 4.2 26.6
34.9 +20.6 ▲Santander 2 5 5,329.5 26.7 +21.2 ▲
▲ 23 38.3 +11 ▲ 5.5Itau Unibanco 1 3 6,952.0 34.8 +23.7Deals Sh (%) # of Deals Fees Sh (%) Share Ch.
# of Market Change in Manager Market Market2017 Rank
2016 Rank
Market MarketBookrunner Proceeds Sh (%) Share Ch.
Domestic Brazilian Debt in Reals (BR2) Jan 1 - Jun 30
Proceeds per Bookrunner (R$m) # of Deals per Bookrunner Imputed Fees (US$m)
Proceeds per Bookrunner (US$m) # of Deals per Bookrunner Imputed Fees (US$m)Market
First Half 2017 | Debt Capital Markets | Managing Underwriters
Emerging Markets - Latin AmericaDomestic Brazilian Issuance Down 10% | Domestic Mexican Issuance Down 44%
Change in 2017 Rank
2016 Rank
Market
All Global Debt by Brazilian Issuers (BR1) Jan 1 - Jun 30
Bookrunner Proceeds Sh (%) Share Ch. DealsMarket Market # of Manager Market
Share Ch.Banco Bradesco SA 1 1 3,338.8 16.0
Sh (%) # of Deals Fees▼16 33.3 -3 ▼ 13.8
Sh (%)-5.3 ▼ -2.9
Itau Unibanco 2 6 3,297.115.3
43.8 +14 ▲ 13.0 14.4 +10.615 31.3
15.8 +11.7 ▲ 21 ▲Santander 3 3 2,487.5 11.9 -4.6 ▼ -6.8 ▼+3 ▲ 10.7 11.8
8.9Citi 4 12 2,161.3 10.3HSBC Holdings PLC 5 7 1,856.6
▼12.5 +5 ▲ 8.5+9.8 ▲▲5 10.4 0 - 5.9 6.6 +9.3
8.1 -1.98.8 +6.0 ▲
6 9.5 -6.9+4.9 ▲
▼ 8.8Morgan Stanley 6 8 1,834.1
-1.6 ▼9 18.810.4 +1 ▲ 7.35
-1
9 2
▼Banco do Brasil SA 7 4 1,669.8 8.0 -7.5 ▼
-9.4 ▼9.7
5.3JP Morgan 8 5 1,136.2 5.4Bank of America Merrill Lynch ▼ -8.7
▼14.6 +5 ▲ 6.17 6.7 -2.7▼7 14.6 +2 ▲ 3.8 4.2
▲ 3.3 +3.7Banco BTG Pactual SA 10 - 614.5 +2.9 3.71,099.4
10.4 +52.9 ▲ 5-12.2
Top Ten Total 19,495.3▲
93.3 -3.7 ▼ -7.9 ▼81.2 90.0+3 90.3 100.0
% Change from Same Period Last Year 28.4% ▲ 6.7% ▲
Industry Total
▼ 8.7%7.6% ▲
-28.0% ▼
20,922.9 100.0
Proceeds per Bookrunner (US$m)
▲
48
Global Debt by Mexican Issuers (MX1)
-35.2%% Change from Last Quarter
Jan 1 - Jun 30
2017 Rank
# of Deals per Bookrunner Imputed Fees (US$m)Change in Manager Market Market2016
RankMarket Market # of Market
Sh (%) Share Ch.Bookrunner Proceeds Sh (%) Share Ch. Deals Sh (%) # of Deals Fees▲ 2 5.7 -2Deutsche Bank 1 6
8.6BNP Paribas SA 2 11*2,165.9 16.2 +10.2
31,617.2 12.1 ▲▼ 4.7
+213.6 +7.5 ▲
+8.8 ▲8.6 -5.9 ▼
▲ 4.2 12.0 +9.7▼ 3.0-2
1,369.28.6
10.3 +6.21,544.8 11.6 +0.2 ▲ 3
HSBC Holdings PLC 4 10JP Morgan 3 2
▲7.7 +5.4 ▲3 8.6
2 11.3 +6.7 ▲▼ 3.95.7 -1+2 ▲ 2.7Barclays 5 11* 1,355.7 ▲
2.910.2 +6.9
0Credit Agricole CIB 6 13* 1,119.2 8.4 +5.5 ▲ 1 ▲8.9 +3.1 ▲
- 3.0 8.5 +6.5- 3.1Credit Suisse 7 7 870.4 6.5 +0.6 ▲ 4
Citi 8 50
834.511.4
6.3 +0.28.6
▲ 165.4 +0.6 ▲-2 ▼ 1.97.7
10 3 480.3
▲ 2.745.7 +64.4 -1.1 3Morgan Stanley 9 8 586.3 ▼
8.6Bank of America Merrill Lynch ▼88.4 +27.6 ▲
▼ 1.7▼ 3
13,357.4 -12
3.6 -4.9
100.0
-3Top Ten Total 11,943.5 89.6 +32.6
-39.4%
▲ 30.9Industry Total
# of Market
Global Debt in Mexican Pesos (MX2) Jan 1 - Jun 30
Proceeds per Bookrunner (US$m) # of Deals per Bookrunner Imputed Fees (US$m)Change in Manager
▲
BookrunnerMarket
▼
MarketDealsProceeds
Market MarketSh (%)
15.5 +7.8
# ofSh (%) Share Ch.
Jan 1 - Jun 30
Proceeds per Bookrunner (US$m)
Share Ch.Market
35
Deals Sh (%)
91.7%
Market# of Deals Fees
Domestic Mexican Debt (MX3)
-25.5%
2017 Rank
2016 Rank Bookrunner Proceeds Sh (%) Share Ch.
2016 Rank
+7
% Change from Last Quarter% Change from Same Period Last Year
Market2017 Rank
-37.0% ▼-52.9% ▼
BBVA5 405.5Citi 1 ▲ 1.9 9.7 +2.025.9# of Deals Fees
1 2▲ 14 383.1 23.9Sh (%)
▲Sh (%) Share Ch.
2 383.1BBVA 2 4.3 -12.3▼ .8
SantanderMizuho Financial Group 8
▼
4.7 -8.0
▼ 1414.6 -4.0
+2.0 ▲
▼ Citi 2 5.8 23.2 +6.4 ▲
25.9 -14 290.1
352.4 22.014.8 +3 ▼ Casas de Bolsa Bital, S.A.
-1 ▼+5.3 ▲ 14 56.0.8 22.2
3.0▲ 13 52.0
+2 ▲290.1+14.4
-5.4▲ .6+14.3 ▲+6 ▲
3 4Casas de Bolsa Bital, S.A. ▲ 8 32.011.1 +3.4 ▲ 8 18.1 +10.4+9.7Casa de Bolsa Inverlat 4 9 ▲ 5 +1223.5 9.3 ▲ ▲ 54
3 .6 16.38.5 +4.2 2.7 +0.4▲
+4.4 8.510.5
Santander+12.4 ▲
▼ -4.0 ▼5.5223.5 14.0 14.7.2 6.2
7
JP Morgan 5 90.6 5.7 -5.63 ▼
Multivalores SA de CV
2Nomura 6 88.8
-7.8
+7.115* 140.4
+7.8 ▲
3.76
+1 ▲
Grupo Financiero Banorte-Ixe
20.0
- 114.8 +4.4▲ 4 ▲
Casa de Bolsa Inverlat7.4 +3 -6
+2 ▲8.05.4 ▲ 1.6
4.4 2 16.0
Manager
▼+8.8▲ 1.7 4▲Casa de Bolsa Finamex SAD de C 7 6▼ 23.5 3.7
▲-4-6 ▼1.2 3 12.0
.2 5.583.83 90.6 ▼-8.9▼ .2 .2 4.152.7 3.3 -3.5
2.33.4 1 4.0 .113▲ 1 8+11.9
34.7
0+3.4▲ .7+3.3 ▲3.3 ▲7 83.8
▼
▼ 4 .2- 85.2
Corporacion Actinver Sab de CV 9 11.0 -3.2▼▲
▼-2.5 +1.1
▼
▼-1.1 ▼-2
Grupo Financiero Banorte-Ixe 9 38.1 2.4 -17.1 ▼3.2 -2.1 7.4 -4TD Securities Inc 10
1,898.2Top Ten Total81.5
52.0%
▲
100.0
40.35 20.0
+1.3
+1.25.2 -0.1
Change in
▲1.7 +1.72.9
5.418 1 4.03.1 +2.5▼ Top Ten Total
--6
▲ CBI Seguros SA 10▼
Market Market
+5.1▲ 1.1
-29.6%
-25.1 ▼
# of Deals per Bookrunner Imputed Fees (US$m)
▲.1 1.5
48.0
.1
-3.019.472.6 +16.1+1.5 ▲+127.0
+14.8 ▲1,581.4▲
98.9+25.6
1,601.9100.019.4 Industry Total
3
% Change from Last Quarter
Industry Total+16.298.8
100.0 54
-25.8% ▼
252,623.5
▲▼% Change from Same Period Last Year -8.9%▲ % Change from Last Quarter
+233.6▲3.6
-46.8%74.2% % Change from Same Period Last Year -44.4%266.0% ▼ -19.4%
-6 100.0
▼346.2% ▲ 112.5% ▲ ▲
▼ -30.8%314.3%
100.0
https://www.thomsonone.com
Global Brazilian Debt Volume by Sector First Half 2017
▲▼
0
20
40
60
80
100
120
140
$0
$10
$20
$30
$40
$50
2008 2009 2010 2011 2012 2013 2014 2015 2016 2017
US$(m) Securitized Debt
Junk Rated Debt
Investment Grade Corporate
Agency, Supranational, Sovereign
# of Issues
15
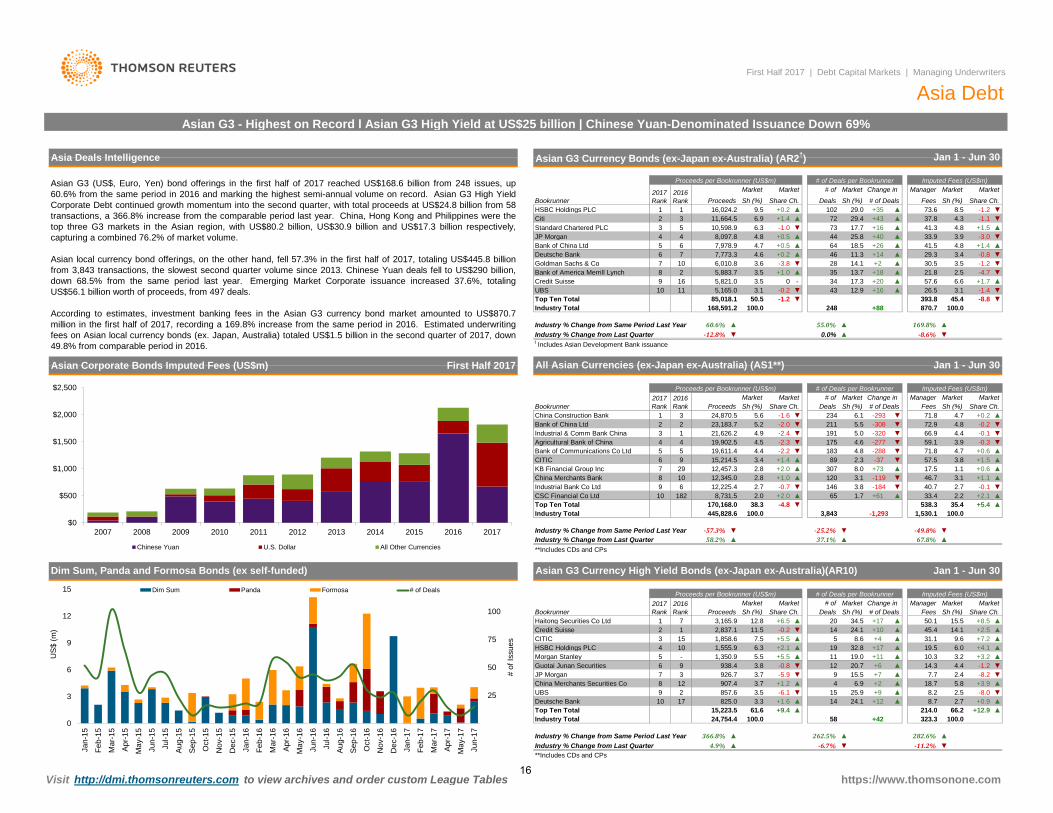
**Includes CDs and CPs
**Includes CDs and CPs
65
-57.3%
2.0
100.0
▼
# of
▼4
2.8
Industry % Change from Last Quarter 58.2% ▲
Top Ten Total
-2.2CITIC
Industrial & Comm Bank China
China Merchants Bank
▲
-0.7
Agricultural Bank of ChinaBank of Communications Co Ltd 5
2
33.4▲
183
12,345.0
CSC Financial Co Ltd ▲ 1.7
+1.4
+1.0
445,828.6▲
▲▼
2.2
-25.2% -49.8%37.1% 67.8%
▼
89
146
-4.8
▲ 120
+2.0
+2.0 307
▼
▼
▲
+61
6299
4
KB Financial Group Inc 73.4
2
19,611.4 4.4
2.8
4.5
12,457.3
5▼
23,183.721,626.2
-2.3 4.64.9
-2.0 ▼ 5.5
FeesSh (%)-293 +0.2 ▲
-0.271.8
4.8▼4.7
Sh (%)
▼-1.6
-2.4 ▼
▼ 6.1
191 5.0-308
234Deals
72.9211
Market MarketMarket Manager
5.6
Market # of# of DealsShare Ch.
▼ 66.9
71.8
-32059.1 3.9▼
-288-277
▼
Share Ch.
▲▼-0.1
▼
57.54.7
4.4
3.1▼▼
8 10
3,843 1,530.1-1,293 100.035.4
▲
Market
+1.5▼-37+73
46.7
+5.4
2.7
▲ 17.5
Market Change in
https://www.thomsonone.com
40.7-184
8.0 ▲2.3
45.4393.8
169.8%
Jan 1 - Jun 30
# of Deals per Bookrunner Imputed Fees (US$m)
▲0.0% ▼55.0%
50.5 -1.2
-8.6%▲ ▲
168,591.2
60.6%
+88▼▼Top Ten Total 85,018.1
-1.4
Industry Total
▲
-8.8248
17.33.1
-
870.7 100.0
▼ 26.53.1 -0.2 ▼43 12.9 +16 ▲3.5 +1.7
+1.0 ▲ -4.7+18 ▲6.6
35 13.7 21.8Credit Suisse 9 16 5,821.0 0Bank of America Merrill Lynch 8 2 5,883.7 2.5
▲ 57.6+2034
▼14.1 +2 ▲ 30.5▼
-1.2▼ 28 3.5
25.8▲▲ 41.5 4.8
3.646+0.2 ▲ 11.3 ▼+14 ▲ -0.83.429.3
▼+40+0.5 ▲ 64 +1.4
▲ ▲6.3 +1.5
18.5 +26-3.03.9
7344 33.9
17.7
Share Ch.
Jan 1 - Jun 30
Sh (%)
+16 ▲ 41.3 4.8
MarketManager
▲
First Half 2017 | Debt Capital Markets | Managing Underwriters
Asia DebtAsian G3 - Highest on Record l Asian G3 High Yield at US$25 billion | Chinese Yuan-Denominated Issuance Down 69%
Asian G3 Currency Bonds (ex-Japan ex-Australia) (AR2†)Asia Deals Intelligence
Asian G3 (US$, Euro, Yen) bond offerings in the first half of 2017 reached US$168.6 billion from 248 issues, up60.6% from the same period in 2016 and marking the highest semi-annual volume on record. Asian G3 High YieldCorporate Debt continued growth momentum into the second quarter, with total proceeds at US$24.8 billion from 58transactions, a 366.8% increase from the comparable period last year. China, Hong Kong and Philippines were thetop three G3 markets in the Asian region, with US$80.2 billion, US$30.9 billion and US$17.3 billion respectively,capturing a combined 76.2% of market volume.
Asian local currency bond offerings, on the other hand, fell 57.3% in the first half of 2017, totaling US$445.8 billionfrom 3,843 transactions, the slowest second quarter volume since 2013. Chinese Yuan deals fell to US$290 billion,down 68.5% from the same period last year. Emerging Market Corporate issuance increased 37.6%, totalingUS$56.1 billion worth of proceeds, from 497 deals.
According to estimates, investment banking fees in the Asian G3 currency bond market amounted to US$870.7million in the first half of 2017, recording a 169.8% increase from the same period in 2016. Estimated underwritingfees on Asian local currency bonds (ex. Japan, Australia) totaled US$1.5 billion in the second quarter of 2017, down49.8% from comparable period in 2016.
1 102
Market Market
▲
Imputed Fees (US$m)
11,664.5 -1.173.6 ▼
4.3▲29.4
Fees
+0.5
▲ 37.8
Deals
+1.4 +43+35
72
# of Deals per Bookrunner# of
▼-1.0
Share Ch. Sh (%)
Change in
# of Deals
Market
29.0
Proceeds per Bookrunner (US$m)
+0.2 ▲16,024.2
2016 Rank
HSBC Holdings PLC
5
78
17
1,350.9 +5.5-
▲+0.61.1
+1.2
+5.5
8,731.5
5.5
2016 Rank Sh (%)
170,168.0 38.3
Industry % Change from Same Period Last Year
2
Morgan Stanley
▲
3.8+1.1-119
4.8 +0.6
+2.1
3.1
538.3
825.0
Guotai Junan Securities
910
6
4.9% ▲
Jan 1 - Jun 30
Proceeds per Bookrunner (US$m) # of Deals per Bookrunner Imputed Fees (US$m)
1,555.9
1
1,858.611.5
3,165.9
5.2
Sh (%)
Proceeds
2.7
19,902.5
15,214.5
12,225.4
3
▲3.8
Proceeds
-0.3 ▼▼-0.1
1
▲
7
3Citi
Market
Industry % Change from Same Period Last YearIndustry % Change from Last Quarter
Bank of China Ltd 4.74.8
7,773.3Deutsche Bank
52
1
8,097.810,598.9
3
65
Sh (%)Bookrunner9.51
Proceeds
4JP Morgan
6.9
2017 Rank
Market
▼-1.2
Bank of China Ltd
3.5
100.0
▼-12.8%
2016 Rank
7
Standard Chartered PLC
China Construction Bank 24,870.5
182
175
Industry Total
8.5
46 7,978.9
4.6
UBSDeutsche Bank
6
2017 Rank
UBS 10
All Asian Currencies (ex-Japan ex-Australia) (AS1**)
Asian G3 Currency High Yield Bonds (ex-Japan ex-Australia)(AR10)
Bookrunner
10 6,010.8
t Includes Asian Development Bank issuance
3
Goldman Sachs & Co
Industrial Bank Co Ltd
11 5,165.0
▲
-3.8
10
312
Proceeds per Bookrunner (US$m)2017 Rank
-0.2
Top Ten Total
JP MorganChina Merchants Securities Co
24,754.4
+2.1
2907.4
9+1.6
857.6
100.015,223.5 61.6
3.3
7.5HSBC Holdings PLC
3 15
9 938.4
7
4
Haitong Securities Co Ltd 12.82,837.1
8.6▼ 24.1
6.3
+6.5Bookrunner
1Credit Suisse
10CITIC
Change in # of DealsShare Ch. Deals
20 34.5 +17 ▲
MarketSh (%)
▲▲15.5
45.4+8.5+2.5
50.1
MarketSh (%) Share Ch.MarketManager
Fees
14.1▲
▲ 19.5 6.0 +4.1+17+4 31.1▲ +7.2▲ 5+10
32.8
▲
▲ 19
149.6
▼4.4▲+3.210.3▲
3.2-1.214.3
▲
+9
+7▲
+11
15.5
11
▼ 154
3.8 -0.8 12 20.7-8.2926.7 ▲
▼ +6 ▲▲
7.7▼ 9
3.5 -6.13.73.7 -5.9
19.0
▼2.4
8.2
▲▲▼-8.0
+0.9
▲
+12.9▲ 14 2.7▲ 66.2
8.7+1224.1 ▲
▲+22.525.95.818.7
▲+3.96.9
214.0+9.4323.3
Industry % Change from Same Period Last Year 366.8% ▲ 262.5% ▲
Industry Total 58
▼
First Half 2017
Visit http://dmi.thomsonreuters.com to view archives and order custom League Tables
Asian Corporate Bonds Imputed Fees (US$m)
-11.2%282.6%
100.0+42
▼▲
Industry % Change from Last Quarter
Dim Sum, Panda and Formosa Bonds (ex self-funded)
-6.7%
$0
$500
$1,000
$1,500
$2,000
$2,500
2007 2008 2009 2010 2011 2012 2013 2014 2015 2016 2017
Chinese Yuan U.S. Dollar All Other Currencies
25
50
75
100
0
3
6
9
12
15
Jan-
15
Feb-
15
Mar
-15
Apr
-15
May
-15
Jun-
15
Jul-1
5
Aug
-15
Sep
-15
Oct
-15
Nov
-15
Dec
-15
Jan-
16
Feb-
16
Mar
-16
Apr
-16
May
-16
Jun-
16
Jul-1
6
Aug
-16
Sep
-16
Oct
-16
Nov
-16
Dec
-16
Jan-
17
Feb-
17
Mar
-17
Apr
-17
May
-17
Jun-
17
# of
Issu
es
US
$ (m
)
Dim Sum Panda Formosa # of Deals
16
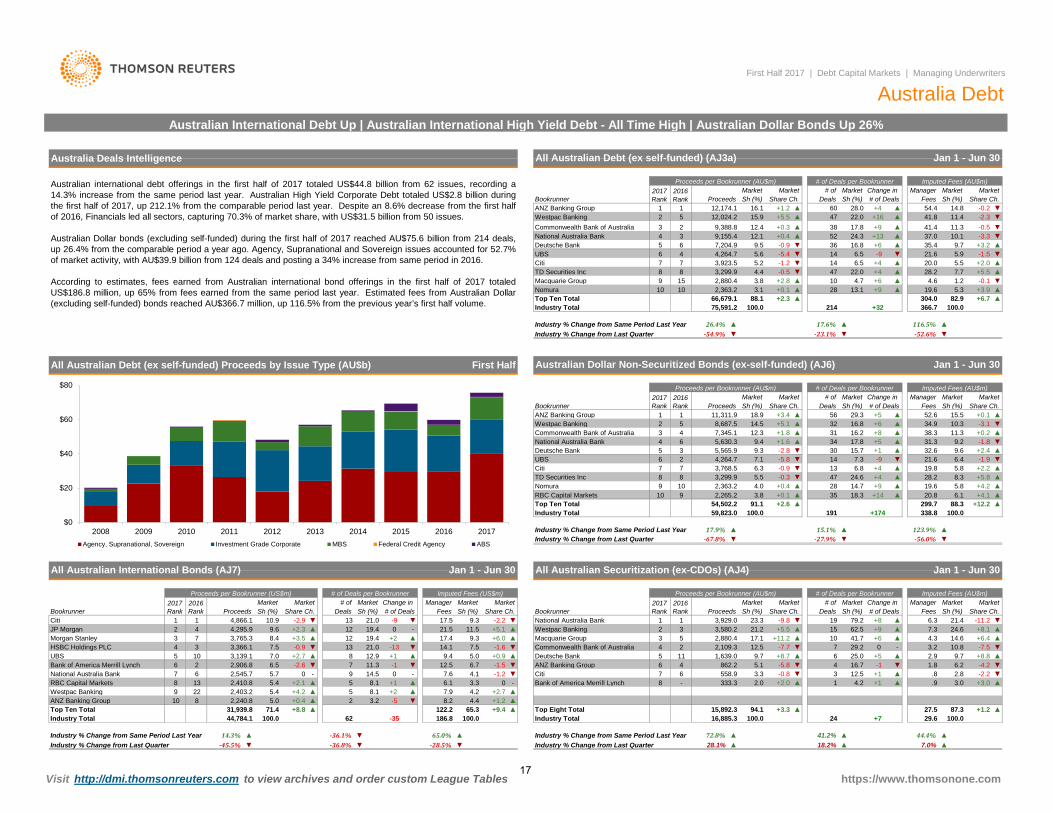
Citi ▼
RBC Capital Markets
45,630.3
Nomura
17.9%
Top Ten Total10
▼65.0%14.3%
-36.8%▼-36.1%
8
TD Securities Inc
Bank of America Merrill Lynch
▲ ▼
4
Industry % Change from Same Period Last Year
100.0
-5.4+6
▼
▲2
3
22.010
8
7,345.18,687.5
2,880.4
Australia Deals Intelligence
1Westpac Banking
2,363.210
3,299.9
Industry Total
6
1
All Australian Debt (ex self-funded) (AJ3a)
Sh (%)
▲
91.12,265.2
Industry % Change from Same Period Last Year
9
Industry Total
47
5
8
8 -
ANZ Banking Group
9
▼▲7.7
▲ 4.6
20.028.2
5.5▲
41.4+13
21.6
▲16.8
38
36
Deals
47▲60 +4
52
22.0
▲
-2.341.8 ▼28.0
+16 11.4
+12.288.3
+5.8
+14 ▲
▼
Jan 1 - Jun 30
▲
▲
+4.2 ▲▲+4.1
-1.9+2.4
▲▲19.8
▼
1.2
First Half 2017 | Debt Capital Markets | Managing Underwriters
6.4
▲
100.0
100.0
Jan 1 - Jun 30
+2.2
▲
▲
6.1
▲
20.8
▲6.8
+4
▲
▲
5.8
44.4%
299.7
▼
35
+174
+914.718.3
24.6
191
▲
▲
+4-9 21.6
19.6
Market
▲
Australia Debt
▼
59,823.0
Industry % Change from Last Quarter ▼-67.8%15.1% ▲
338.8100.0
▲ +1.2
https://www.thomsonone.com
-27.9% ▼ -56.0%123.9%
18.2% ▲▲
+2.6 ▲54,502.2+0.1
▲▲
283,299.9
+0.43.8
5.5 -0.35.8
28.2 8.3▼10 2,363.2 4.0
Citi ▼47
3,768.5 6.3 13-0.914 7.3
Deutsche Bank -2.8 ▼UBS 6 2 ▼4,264.7 7.1
9.4 34
-5.85 3 5,565.9 9.3 30
+1.6 ▼+5 ▲ 31.3 9.2 -1.815.717.8
9.6+1 32.6
12.3 31 +8▲
+5.1▲ 16.2
+616.8+1.8
10.3▲11.3▲ 38.3▼▲ -3.134.9
+0.2
▲▲ 32
1 12 5 14.5
11,311.9 18.9Sh (%)
29.356 15.5 ▲+0.152.6▲+5Share Ch.
Jan 1 - Jun 30
MarketSh (%) # of Deals FeesShare Ch. Deals
# of Deals per BookrunnerChange in
Imputed Fees (AU$m)Market
Proceeds per Bookrunner (AU$m)Manager
Bookrunner Proceeds Sh (%)2017 Rank
2016 Rank
Market
7.0%Industry % Change from Last Quarter72.8% ▲ 41.2%28.1% ▲
+3.4
16,885.3 100.0 24 +7 29.6Top Eight Total 15,892.3 94.1 +3.3
▲+1 ▲ .9 3.0+2.0 ▲ 4.2333.3 2.0 1-2.2▼+3.0
-0.8 ▼+1 ▲ .8 2.83 12.5-4.2 ▼-1 ▼ 1.8 6.2
Citi 7 6 558.9 3.3-5.8 ▼ 16.76 4 862.2 5.1 4
+8.8 ▲+5 ▲ 2.9 9.7-7.5 ▼0 - 3.2 10.8
6 25.0Commonwealth Bank of AustraliaDeutsche Bank 5 11 1,639.0 9.7 +8.7 ▲
-7.7 ▼ 29.24 2 2,109.3 12.5 7+6.4 ▲+6 ▲ 4.3 14.6
+9 ▲ 7.3 24.61510
62.5Westpac BankingMacquarie Group 3 5 2,880.4 17.1
3 3,580.2 21.2223.31
41.7+11.2
Share Ch.▼+8
+5.5 ▲▲
+8.1 ▲
# ofProceeds
Market
3,929.0DealsSh (%)
-9.8 19
Market Market MarketMarket Change in
6.3 21.4# of Deals
79.2 -11.2
All Australian Securitization (ex-CDOs) (AJ4)
Proceeds per Bookrunner (AU$m) # of Deals per Bookrunner2017 Rank
Imputed Fees (AU$m)
Share Ch. Sh (%)▼
ManagerSh (%)
116.5%-52.6%
▲▼
100.0
Fees
Market# of
-0.5
+0.13.84.4
-1.2
366.766,679.1 ▲
28
+32
3.115
National Australia Bank
ANZ Banking Group
3
CitiTD Securities Inc 8Macquarie Group
▼
Industry Total
Imputed Fees (US$m)
Industry % Change from Last QuarterIndustry % Change from Same Period Last Year
Australian Dollar Non-Securitized Bonds (ex-self-funded) (AJ6)
# of Market
JP Morgan 2 4 4,295.99.3
ANZ Banking Group
Commonwealth Bank of AustraliaNational Australia Bank
-9
Nomura 109
13# of Deals
19.4 0
Top Ten Total
Westpac Banking
9.6 +2.3 ▲ 12▼
21.517.5
-National Australia Bank
Manager Market Market
1Sh (%)Fees
-2.2
-54.9% ▼
All Australian International Bonds (AJ7) Jan 1 - Jun 30
BookrunnerSh (%) Share Ch.2017 Rank
7 7
Change in # ofProceeds Share Ch.Sh (%)
2016 Rank
4,866.1 10.9 -2.9
-23.1% ▼▲▲ 17.6%
# of Deals per Bookrunner
Deals
214100.075,591.2
26.4%
13.1▲88.1 +2.3
▲+2.8
▲82.9▲
+6.7+9
304.0+3.95.3▲ 19.6
▲
-0.14.7+5.5
+6+4+4 +2.06.5
-0.9 ▲
▼▼ 6.5
14-9 ▼
▼14
2 ▲+917.8 ▼▼37.0
11.3-3.324.3+3.2 ▲
UBS7,204.9
12.1Deutsche Bank 9.735.4
5.9 -1.57
65.69.5
6 4,264.75.2
5
7 3,923.5
Commonwealth Bank of Australia 34
4
Sh (%)
12.412,024.2 15.9
+0.310.1+0.49,155.4
+5.5▲
12,174.1
9,388.8
▲Proceeds
Australian International Debt Up | Australian International High Yield Debt - All Time High | Australian Dollar Bonds Up 26%
Bookrunner
Proceeds per Bookrunner (AU$m) Imputed Fees (AU$m)
16.1Share Ch.Share Ch. # of Deals
ManagerFees
Change in Sh (%)
Market
14.8 ▼
▲
Market
21.0
3,765.3 +6.0
Market Market
11.5 +5.112 +2 17.4
▲
▼-1 6.7 -1.5
Bookrunner
Morgan Stanley ▲3 7
1 1
2016 Rank
Proceeds per Bookrunner (US$m)
9.3
▲ 8 9.413
19.44 3 3,366.1 ▼
8.4 +3.5HSBC Holdings PLC
7.0 +2.7 +1-1.67.5
12.921.0 -13
5.014.1▼
74.17.6
7.5 -0.9
-12.5
National Australia Bank
▲▼11.3
9
+0.9UBS 5 10 3,139.1Bank of America Merrill Lynch 6 2 2,906.8 6.5 -2.6
8 130
▼
5.45.77 14.52,545.7 -6 0
5.42,410.8
▲
+9.4
03.3+1
65.3▼
2,403.2
31,939.8-5
▲▲
+4.2 8.18.15
Industry Total
3.2▲ 2
100.0
+0.42,240.8
-35▲
62
Westpac Banking 9ANZ Banking Group 10
71.444,784.1
Industry % Change from Same Period Last Year
▲
+1.2
▼
▲
RBC Capital Markets
▲
-▲
+8.8
Industry % Change from Last Quarter -28.5%
186.8
-1.2
▼▲
122.2
7.94.4 +1.2 ▲
6.14.2
8.2▲
+2.122
27.5 87.3
Market
-0.254.4
▼
-0.5
2016 Rank
Visit http://dmi.thomsonreuters.com to view archives and order custom League Tables
-45.5%
Australian international debt offerings in the first half of 2017 totaled US$44.8 billion from 62 issues, recording a14.3% increase from the same period last year. Australian High Yield Corporate Debt totaled US$2.8 billion duringthe first half of 2017, up 212.1% from the comparable period last year. Despite an 8.6% decrease from the first halfof 2016, Financials led all sectors, capturing 70.3% of market share, with US$31.5 billion from 50 issues.
Australian Dollar bonds (excluding self-funded) during the first half of 2017 reached AU$75.6 billion from 214 deals,up 26.4% from the comparable period a year ago. Agency, Supranational and Sovereign issues accounted for 52.7%of market activity, with AU$39.9 billion from 124 deals and posting a 34% increase from same period in 2016.
According to estimates, fees earned from Australian international bond offerings in the first half of 2017 totaledUS$186.8 million, up 65% from fees earned from the same period last year. Estimated fees from Australian Dollar(excluding self-funded) bonds reached AU$366.7 million, up 116.5% from the previous year’s first half volume.
All Australian Debt (ex self-funded) Proceeds by Issue Type (AU$b) First Half
Top Ten Total
Market2017 Rank
# of Deals per BookrunnerMarket
8
▲+25 +2.7
5.0
$0
$20
$40
$60
$80
2008 2009 2010 2011 2012 2013 2014 2015 2016 2017Agency, Supranational, Sovereign Investment Grade Corporate MBS Federal Credit Agency ABS
17
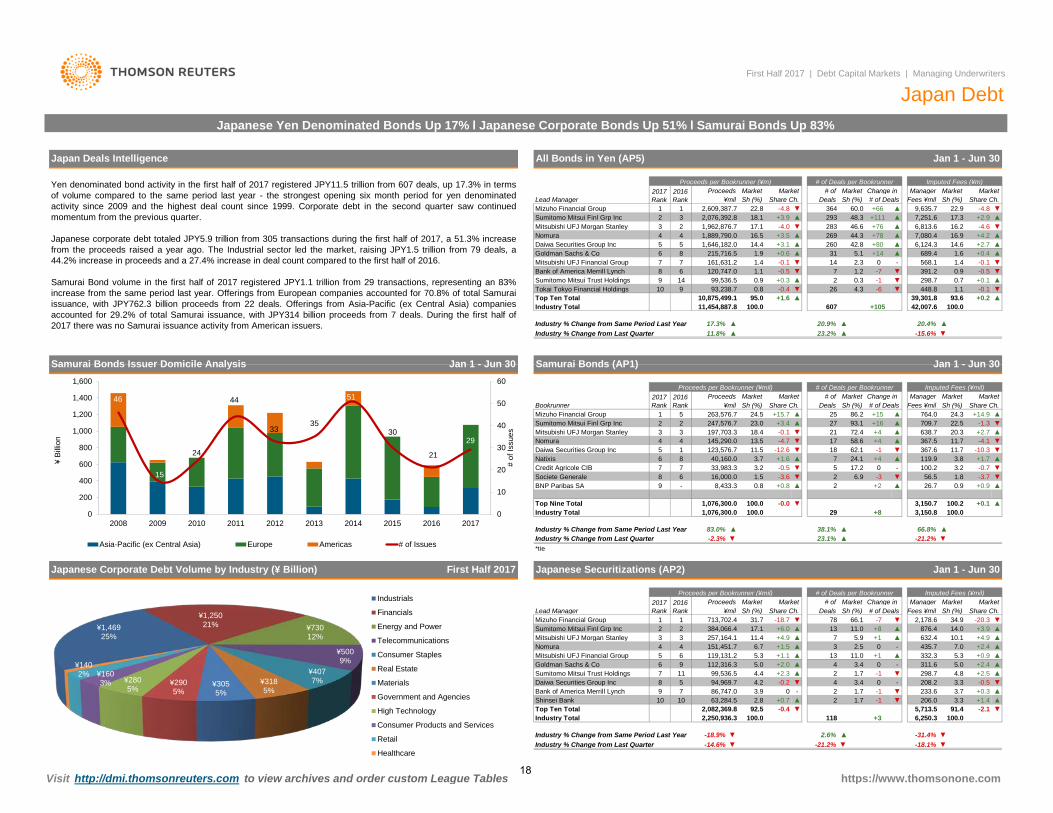
*tie
Samurai Bonds Issuer Domicile Analysis Jan 1 - Jun 30
5 1Natixis
2
2017 Rank
63,284.5
Nomura 4
94,969.79
3
86,747.0Bank of America Merrill Lynch
Nomura 145,290.0
+8
Share Ch.+14.9 ▲
-4.1
▼+2.7
▼▲
-1.3
1,076,300.01,076,300.0 100.0
Industry % Change from Same Period Last Year
Societe Generale
Mizuho Financial Group
Industry Total
Lead Manager
BNP Paribas SA
Top Nine Total
Goldman Sachs & Co
Mitsubishi UFJ Morgan Stanley
Mitsubishi UFJ Financial Group
8
▼▼
Industry Total
-18.9%
2,250,936.3
99,536.55.0
-14.6%
5.3
103.9
5
Industry % Change from Last Quarter
2,082,369.82.8
100.0
-21.2%
https://www.thomsonone.com
92.5 ▼
2.6% ▲
764.0Mizuho Financial GroupSumitomo Mitsui Finl Grp Inc 2
678
Daiwa Securities Group Inc3.78
-
Credit Agricole CIB
1
7
9
4
▲
Proceeds per Bookrunner (¥m)
Lead Manager
119,131.2
384,066.4
+2.0
469
16,000.0+0.8
Proceeds
6
83.0%
2
1
-12.6
13
123,576.7
3.2 ▼+1.6
+1.5
11.5
Sh (%)
2117
112,316.3
151,451.7
+6.0257,164.1
Share Ch.
▲
25
Mitsubishi UFJ Morgan Stanley
▲
Market
24.5Deals # of Deals
Proceeds per Bookrunner (¥mil)
-0.0
▼
0
▼
Sh (%)
100.0
4.24.4
Market
-18.7
6.7+1.1
Sh (%)+15.7
197,703.313.518.4
Share Ch.▲
247,576.7263,576.7
¥mil
4-0.13
4 -4.73
▼
▲
▲23.052
-0.5
▼40,160.0
-3.6
38.1%
31.717.1
6.9
3
Industry % Change from Last Quarter -2.3%
2Sumitomo Mitsui Finl Grp Inc
115
7Daiwa Securities Group Inc
6
Top Ten Total
7
Sumitomo Mitsui Trust Holdings
Industry % Change from Same Period Last Year
▲ 13▲11.4
¥mil
5.9
78
+4.9
713,702.41
2016 Rank
▼
22.520.3
709.7
3.8
11.7638.7367.5
11.7119.9367.6
+2.3
7
11.0-
+13
2 1.7▲ 4
2Shinsei Bank 10 +0.7-
118
2▲
-0.4
0
1.7
-18.1%
-2.1
▲+2.5▼
233.6208.2
+1.4
▼▼
▼
311.6
+0.3▲
3.33.7
▲
▲-0.5
0
1.7 ▼-3.4
-1 ▼
-1
298.7
▲
+2.4+0.9
▲632.4 10.1 +4.9
▲5.0
435.7 +2.47.00 -2.5+1
-7
66.1 -7 ▼ 34.9▲ 876.4+8
3.2
▼
▲+3.9-20.3
Share Ch.
▼
▼
▼
▲1.8
▼
+0.1
▼-3.7
▲-10.3
+0.9
+1.7-0.7
▼
Market
▼
0.9
1.193.6
1.4-0.5
Jan 1 - Jun 30
16.9 ▲
+0.4
0.7▼-0.1▲
▲
22.8
7,080.4
689.4
22.9
▼
+4.2
▼-4.8
▼
-0.1
16.2 -4.6
1.6 ▲
-4.8
▲42.8 +80
+76
+2.7
283 46.6
▲260269
14.65.1 +14
6,124.3
▼
58
▲ +78▲▲
14.444.3
▲+0.6215,716.5 1.9
+3.51,889,790.0 16.5+3.11,646,182.0
First Half 2017 | Debt Capital Markets | Managing Underwriters
Japan DebtJapanese Yen Denominated Bonds Up 17% l Japanese Corporate Bonds Up 51% l Samurai Bonds Up 83%
All Bonds in Yen (AP5) Jan 1 - Jun 30Japan Deals Intelligence
-4.03 2,076,392.8
Mitsubishi UFJ Morgan Stanley 32 +3.918.1
2 17.1
Market
Mitsubishi UFJ Financial Group
Daiwa Securities Group Inc 5
7Goldman Sachs & Co
Nomura
6
4
# of Deals per Bookrunner# of
Mizuho Financial Group 1 1
Change in Market Market
60.0Sh (%)Sh (%)
2,609,387.7
Imputed Fees (¥m)Market Market
# of Deals Fees ¥milDeals Sh (%)Manager
▲+2.917.3▲ 9,635.7
Share Ch.
+111
Share Ch.364▼
7,251.6▲+66
48.3293▲6,813.6▲
391.2
312.3 01.27
568.1-141.46 120,747.0 1.1
▼161,631.2 -0.17-0.5 ▼+0.3 ▲14 99,536.5
▼-0.40.90.8
▲2 0.3 -1 ▼ 298.7
100.0+1.6
Sumitomo Mitsui Trust HoldingsBank of America Merrill Lynch 8
9 93,238.7
11,454,887.8
9
# of Deals per Bookrunner Imputed Fees (¥mil)
Samurai Bonds (AP1)
+0.1
Industry Total +105
Tokai Tokyo Financial Holdings 10▲
26
▲11.8%Industry % Change from Same Period Last YearIndustry % Change from Last Quarter
100.0
▲▲
17.3%-15.6%
2017 Rank
2016 Rank
10,875,499.1Top Ten Total
Proceeds¥mil
Sumitomo Mitsui Finl Grp Inc1,962,876.7
▲
2017 Rank
2016 Rank
Proceeds MarketProceeds per Bookrunner (¥mil)
MarketBookrunner
95.0 +0.2
20.4%
42,007.6
20.9%
607
▲
4.3 -639,301.8
448.8▼
Market
Sh (%)
72.4 ▲+4
100.0
0.9
Jan 1 - Jun 30
+16
Deals
Manager Market
23.2%
# of
24.3
58.6
# of
28,433.3
+3.4▼
▲
17.2
1824.1762.1
Change in
▲93.1
Market
27
33,983.3 -▲▼
5+4-1
056.5
+15Sh (%)
86.2
▼-3
Fees ¥mil
Market
▲23.1% ▲
66.8%
+4 ▲
26.7
100.2
-0.2
Sh (%)Fees ¥mil
▲11.0 14.0
3.4
# of Deals
4.84
3,150.7▼ 100.2
0.81.5
-21.2%▲
29 3,150.8
6.9 ▲
▲
Market
2,178.6
+2
Imputed Fees (¥mil)Manager
# of Deals per BookrunnerChange in
▲
5.3332.3▲
Japanese Securitizations (AP2)
▼▲
91.4100.0
-1 ▼
6,250.35,713.5
206.0 3.3
▼
+3
-31.4%
Yen denominated bond activity in the first half of 2017 registered JPY11.5 trillion from 607 deals, up 17.3% in termsof volume compared to the same period last year - the strongest opening six month period for yen denominatedactivity since 2009 and the highest deal count since 1999. Corporate debt in the second quarter saw continuedmomentum from the previous quarter. Japanese corporate debt totaled JPY5.9 trillion from 305 transactions during the first half of 2017, a 51.3% increasefrom the proceeds raised a year ago. The Industrial sector led the market, raising JPY1.5 trillion from 79 deals, a44.2% increase in proceeds and a 27.4% increase in deal count compared to the first half of 2016. Samurai Bond volume in the first half of 2017 registered JPY1.1 trillion from 29 transactions, representing an 83%increase from the same period last year. Offerings from European companies accounted for 70.8% of total Samuraiissuance, with JPY762.3 billion proceeds from 22 deals. Offerings from Asia-Pacific (ex Central Asia) companiesaccounted for 29.2% of total Samurai issuance, with JPY314 billion proceeds from 7 deals. During the first half of2017 there was no Samurai issuance activity from American issuers.
Japanese Corporate Debt Volume by Industry (¥ Billion) First Half 2017
Visit http://dmi.thomsonreuters.com to view archives and order custom League Tables
46
15
24
44
33 35
51
30
21
29
0
10
20
30
40
50
60
0
200
400
600
800
1,000
1,200
1,400
1,600
2008 2009 2010 2011 2012 2013 2014 2015 2016 2017
# of
Issu
es
¥ B
illio
n
Asia-Pacific (ex Central Asia) Europe Americas # of Issues
¥1,469 25%
¥1,250 21% ¥730
12%
¥500 9%
¥407 7% ¥318
5% ¥305 5%
¥290 5%
¥280 5%
¥160 3%
¥140 2%
¥50 1%
Industrials
Financials
Energy and Power
Telecommunications
Consumer Staples
Real Estate
Materials
Government and Agencies
High Technology
Consumer Products and Services
Retail
Healthcare
18
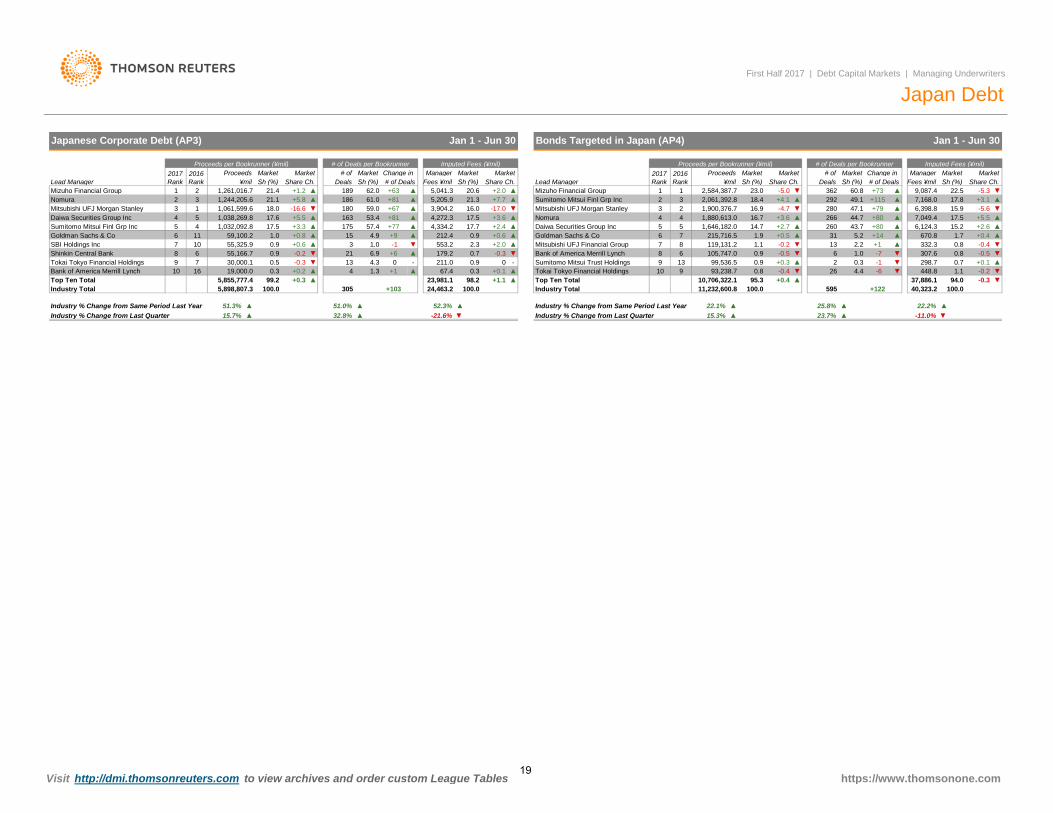
▲3Sumitomo Mitsui Finl Grp Inc
Mitsubishi UFJ Morgan Stanley 3Nomura +81 22
1
# of
Jan 1 - Jun 30
Proceeds per Bookrunner (¥mil)
Sh (%)MarketMarket Manager
Imputed Fees (¥mil)
+80+5.51,038,269.83
17.6 +3.62 ▼ 280
▲1,032,092.8
44.743.7
61.0+63
266 ▲4
3114.71,646,182.0 ▲+2.7
5.2▲260
+14+80
▲ 670.8▲
▲
516.71,880,613.0
1,900,376.7▲
# of Deals per Bookrunner
Sh (%) Lead ManagerMarket
186
# of Deals Fees ¥milMarket
62.0Share Ch.
Change in 2017 Rank
2016 Rank
Proceeds
▲
Lead Manager ¥mil1
1,244,205.6
MarketShare Ch.
20.6 ▼2,584,387.718.4
-5.0Mizuho Financial Group+4.1
¥milSh (%)Market
Sh (%)Proceeds2017
Rank2016 Rank
+3.616.9
2,061,392.8-4.7
Proceeds per Bookrunner (¥mil)
Sh (%)60.8
▲7,168.0
-5.6+115
47.1 15.9292
23.0
Market
▲362
Deals
Bonds Targeted in Japan (AP4)
+0.6
1+7.7
5,041.321.3 ▲
+2.0 ▲5,205.9
+3.3
Shinkin Central Bank 8 6 55,166.7
1155,325.959,100.26
SBI Holdings Inc 7 10
Daiwa Securities Group Inc 4
0.91.0
Sumitomo Mitsui Finl Grp Inc 17.55 4Goldman Sachs & Co
5▼-16.6
1,261,016.7
Japanese Corporate Debt (AP3)
21.12
+5.831 1,061,599.6 18.0
21.4
▲▼-0.4
49.1
Change in
22.5▲
0.8
▼+79
+0.4
+5.56,398.8
+3.1
1.7+2.6
17.8
15.27,049.46,124.3
▲
Market
-5.3Share Ch.Sh (%)
+73 9,087.4
Jan 1 - Jun 30
# of Deals per Bookrunner
▲▲
17.5
Imputed Fees (¥mil)
▼▲
Market Market
▼
# of ManagerShare Ch. Fees ¥mil# of Deals
3 -1
53.4
15175
▼
16359.0
4,334.2▲▲ 57.4
+81+77
+67▲
1804,272.3
▲▲
▲ 517.5 4
+2.4Nomura
189Deals
+1.2 ▲Mizuho Financial Group
Goldman Sachs & Co
Mitsubishi UFJ Morgan Stanley3,904.2 16.0▲
-17.0
Daiwa Securities Group Inc17.7
9Bank of America Merrill Lynch
910
7
Top Ten Total
553.20.7
+0.62.30.9
▲
Industry Total
6
0▲▲
22.1% ▲
13
10,706,322.1
99,536.50.8
100.0
▼
Tokai Tokyo Financial Holdings 94Bank of America Merrill Lynch 0.3
7 30,000.1 -0.3 13 -
+9 212.4 ▲+0.8+2.0
4.91.0
▲▲
▲
10
5,898,807.3
Industry % Change from Last Quarter 15.7%
+0.3100.0
▲5,855,777.419,000.016
99.20.3 +0.2 ▲
Top Ten Total
32.8%Industry % Change from Same Period Last Year 51.3% ▲
▲ -21.6%▲
11,232,600.8
0.9+0.1
▲
93,238.7
15.3%
Industry Total
▼52.3%51.0% ▲
305 +10398.223,981.1
24,463.2+1.1
100.0
▼0.9 -0.2▼
Tokai Tokyo Financial Holdings
-0.3
▲211.067.4
0.5+6
1.34.3
+10
6.921 ▲
-60.3 -1
-0.4 ▼
179.2 8Sumitomo Mitsui Trust Holdings
119,131.28▼
0.9 ▲
Mitsubishi UFJ Financial Group
+0.3-0.5105,747.0
1.1▼0.8
▼0.7
-0.2
▼- ▲
-0.5-7332.3
448.8
307.6298.7
▼
▼6
26
▲
94.0+122
37,886.1100.040,323.2
▼-0.3
+0.121.1
595+0.4
-11.0%23.7% ▲
95.3
25.8% ▲ 22.2%
▲
215,716.57 +0.5▲
▼▼
1.9
6-0.2 13
0.92.21.0
https://www.thomsonone.com
+1
Visit http://dmi.thomsonreuters.com to view archives and order custom League Tables
Industry % Change from Same Period Last YearIndustry % Change from Last Quarter
4.4
First Half 2017 | Debt Capital Markets | Managing Underwriters
Japan Debt
19
-
-
-
-
-
-Asia-Pacific
-
-
-
-
E-mail: [email protected]
E-mail: [email protected]
If you would like to participate in the submission process, receive quarterly press releases, or have questions about our full league table criteria please contact:
Tel: +632 459 1566
JapanAki SatoTel: +813 6441 1120E-mail: [email protected]
First Half 2017 | Debt Capital Markets | Managing Underwriters
Ranking Criteria Summary
Database coverage includes all US public, Euro public and Rule 144a fee-eligible global debt transactions (including Global bonds, Euro/144a transactions, Yankee Bonds, Eurobonds, Foreign Bondsand preferred stock) as well as MBS, ABS & Taxable Munis.
Evgeniya KolesovaUnited States
Tel: +1 646 223 8457
https://www.thomsonone.com
League table volumes for Mitsubishi UFJ Financial Group and Morgan Stanley, included herein, reflect changes after the commencement of their jointly established securities firms in Japan: (1)Mitsubishi UFJ Morgan Stanley Securities and (2) Morgan Stanley MUFG Securities. Credit for the newly established joint ventures rolls up to Morgan Stanley. For Japanese involvement league tablesMorgan Stanley will be represented as "Mitsubishi UFJ Morgan Stanley."
Transactions must be received within 5 business days of pricing for league table accreditation. (Rule 144a transactions sold exclusively in the US market, MBS, ABS transactions in all markets and allFederal Credit Agency transactions must be received within 5 business days of settlement.) Transactions not received by the applicable deadline are entered into the database but classified as rankineligible and are not included in league tables for the current calendar year.
All league tables are based on deal proceeds (total issue amount multiplied by the issue price) unless otherwise stated; and current data and previous year's data is as of 9:00am EDT on June 30 2017.
Full credit is given to the bookrunner, equal if joint books. In cases of underwriter consolidation, credit is given to the surviving/parent firm. Non-US dollar denominated transactions are converted to theUS dollar equivalent at the time of announcement.
Long-term league tables exclude deals with a minimum life of less than 1.5 years (or 18 months), except for Asian local currency denominated bonds and all securitized tranches, which require aminimum life of more than 360 days. Minimum life is defined as the difference between the settlement date and the earliest maturity date or first call/put option.
As concluded following our 2014 DCM Roundtable in Tokyo, Thomson Reuters will begin publishing domestic Japanese rankings on an "Anbun Hoshiki" (Proportional) basis beginning with JapaneseFiscal Year 2014 - 2015 after April 1st, 2014. Please note that the Samurai Bonds ranking (AP1) will be consistent with all other international bonds rankings and will remain on the "Equal-to-Each"allocation basis.
While Thomson Reuters has used reasonable endeavors to ensure that the information provided in this document is accurate and up to date as at the time of issue, neither Thomson Reuters nor its third party content providers shall be liable for any errors, inaccuracies or delays in the information, nor for any actions taken in reliance thereon, nor does it endorse any views or opinions of any third party content provider. Thomson Reuters disclaims all warranties, express or implied, as to the accuracy or completeness of any of the content provided, or as to the fitness of the content for any purpose to the extent permitted by law. The content herein is not appropriate for the purposes of making a decision to carry out a transaction or trade and does not provide any form of advice (investment, tax, legal) amounting to investment advice, nor make any recommendations or solicitations regarding particular financial instruments, investments or products, including the buying or selling of securities. Thomson Reuters has not undertaken any liability or obligation relating to the purchase or sale of securities for or by any person in connection with this document.
© 2017 Thomson Reuters. All rights reserved.
Thomson Reuters and the Thomson Reuters logo are registered trademarks and trademarks of Thomson Reuters and its affiliated companies. Any third party name or mark herein belongs to the relevant third party.
US marketplace league tables include US dollar denominated domestic, Yankee, Global and Euro/144a bond and preferred stock transactions. Global bond league tables include domestic, foreign,Global, Euromarket and Euro/144a bond and preferred stock transactions issued in any currency.
Imputed fees are generated using a proprietary Thomson Reuters algorithm when spreads or fees are not disclosed. Deal fees are on a gross basis before all expenses. Each underwriter or advisor isallocated its share of deal fees using the Thomson Reuters allocation methodology, based on the number of underwriters or advisors on the deal and their role. No fees are allocated to non-lead loansyndicate members. Fee estimates presented in the Quarterly Review for deals updated prior to February 1st, 2017 were generated by Freeman Consulting in partnership with Thomson Reuters.
Visit http://dmi.thomsonreuters.com to view archives and order custom League Tables
Tel: +44 207 542 4376
E-mail: [email protected]
Following our mid-year League Table Inquiry, all 2014 US mortgage-related securitizations have been classified as mortgage backed regardless of risk category or deal structure.
Europe
Carina Causon-Israel
Ian Willmott
20
Thomson Reuters Solutions for the Deal Making Community
FOR STRATEGY AND PLANNING TEAMSFOR INFORMATION PROFESSIONALSSDC Platinum is the world’s foremost financial transactions database, covering new issues, M&A, syndicated loans, private equity, project finance, poison pills, and more.
Solution for:• Market Analysis & Trends (Geography, Sector,Asset Class, Deal Type, Deal Size, etc.)• Deal Origination (Debt Maturity Analysis,Company Lifecycle including Private Equity)• Pitch Creation (Firm Credentials, Representative Acquirors)• M&A Targeting (Active Strategic/SponsorAcquirors, Target Company Screener)• Negotiation (T&C Benchmarking)
Thomson Reuters Deals Business Intelligence enables you to slice and dice our renowned Deals and Fees data to create ad hoc reports, analyze market trends, benchmark your performance and identify opportunities – all within a tool built into your workflow in Excel®, saving you valuable time and giving you a competitive edge.
Solution for:• Conducting market analysis and identifying trends• Benchmarking your performance and monitoring competitors• Targeting clients by wallet size and banking relationship• Allocating resources more effectively by evaluating and analyzing lost deals
FOR INVESTMENT BANKERS
evaluating and analyzing lost deals
Send us a sales enquiry at: financial.thomsonreuters.com/salesRead more about our products at: financial.thomsonreuters.com/products
To purchase individual Thomson reuters Deals or League Table reports, please contact our Thomson Reuters On Demand group:
Email: [email protected]
Access unique analysis for free anytime using Thomson Reuters Deals Intelligence website and receive regular updates, delivered direct to your inbox.
Go to: dmi.thomsonreuters.com/dealsintelligence
Thomson Reuters Eikon is the most intuitive and comprehensive way of staying informed. With natural-language search, you can quickly find global information,news, charts and analytics. Company and industry views provide top-level summaries, and then detailed information is just a click away. Identify new opportunities and gain deep understanding of markets, industries, companies and events.
Thomson Reuters Eikon also includes an Add-In for Microsoft® Office to help you increase your efficiency. From screening and targeting to comparables analysis, building league tables, valuing a company
and developing a client pitch book, you can do all this without leaving Microsoft Office. Search and autosuggest features in Excel make model-building easier.
Solution for:• Managing Client Relationships• Deal Origination• New Issues Pre-Marketing/Roadshows• Financial Modeling• Customized League Tables• Simple Deals screening• Valuation analysis and comparabledeal screening• On-brand pitch book creation
©2017 Thomson ReutersThomson Reuters and the Kinesis logo are trademarks of Thomson Reuters. 21