Embed Size (px)
Citation preview

Debt anD the Family SerieS:rePOrt 3: Debt anD the reGiOnS

REPORT 3: DEBT AND THE REGIONS
CONTENTS
SUMMARY 1
INTRODUCTION AND BACKGROUND 5
1. STATE OF THE REGIONS: TOTAL AND SECURED DEBT 7
2. STATE OF THE REGIONS: UNSECURED DEBT 11
3. ANALYSING PROBLEM DEBT IN THE UK REGIONS 13
4. FINANCIAL VULNERABILITY AND POLICY IMPLICATIONS 17
ANNEXES 22

REPORT 3: DEBT AND THE REGIONS

REPORT 3: DEBT AND THE REGIONS
1
INTRODUCTION • ThisisthethirdandfinalreportintheDebtand
the Family series commissioned by ConsumerCredit Counselling Service (CCCS), the UK’sleadingdebtadvicecharity.ThereportcomparesdebtlevelsinthedifferentUKregions;estimatesthe number of households within each regionwith debt problems; and assesses economicvulnerabilityintheregions.Aswiththeprevious2 reports, the unique comprehensive datacontained in the CCCS database allows us toprovide a more detailed, in-depth analysisof the levels of debt and financial conditionsof UK households – this time at a regionallevel. Readers who may be interested in moreinteractive interrogation of CCCS researchshould investigate CCCS’ DebtView1 whichprovidesanalysisbyregionandpostcodearea.
KEY FINDINGS• Thisreportfindsapronounceddividebetween
NorthernIreland/North/Westregions,andtheSouth/Eastregionswhenitcomestohouseholdsin mortgage difficulty and vulnerability todeteriorating household finances. However,ineconomicterms,wealsoseea‘TaleofTwoCities’ in London - average earnings aremuchhigherthantheUKnormbutthecityalsohasvery large numbers of financially vulnerablehouseholds.
• New analysis from the Financial ServicesAuthority (FSA) demonstrates the vulnerabilityof homeowners who took out mortgagesbetween April 2005 and September 2010.A clear divide exists between Northern andWestern regions (with higher than average
proportions of mortgages in difficulty) andSouthernandEasternregions(withlowerthanaverageproportionsindifficulty).However,theregion with by far the largest proportion ofmortgageswithpaymentproblemsisNorthernIreland.A third (32%)ofmortgages takenoutover theperiod inNIhavepaymentproblems,comparedtotheUKaverageof1in5.
• 8%ofhouseholds inGreatBritain (1.6millionhouseholds)spendmorethanhalftheirincomeson total debt repayments with Londoners themost affected (nearly 1 in 10 of households).CCCS clients from London have the highestsecureddebttoincome(DTI)ratioatmorethan12 times income, followedbyclients fromtheSouthEast(DTI10.1).
• 8.9%ofUKhouseholdsarespendingmorethan25%ofhouseholdincomesonunsecureddebtrepayments.TheLondonregiontopstheleaguetableforthehighestproportionandnumberofhouseholdsdevotingmorethan25%ofincomesonunsecureddebtrepayments(10.2%).
• Analysis of the CCCS database shows thatclients from the South East had the highestlevelsofunsecureddebtatjustunder£23,000,followedbytheSouthWestat£21,250.ClientsfromScotlandat£17,350,and theNorthEastat£18,150had the lowest.Across theUK,onaverage, CCCS clients had unsecured debtswortharound31%morethantheirincomes.
• 10.5% of households in Great Britain (2.1million)areinarrearsonanydebt,with14%(2.8million)reportingthatdebt isaheavyburden.
SUMMARY
1 Seehttp://www.cccs.co.uk/debtview/debtview/atlas.html
REPORT 3: DEBT AND THE REGIONS
2
Nearly 14% of London households reportedbeinginarrearsonanyformofdebt,withover18%ofLondonhouseholdsreportinganydebtisaheavyburden.TheLondonregionranksasthemost‘debtvulnerable’regionbothintermsof totaldebtandunsecureddebtonly.PeopleintheNorthWestarethe2ndmostvulnerablewiththeEastMidlands3rd(thisrankingexcludesNorthern Irelandduetounavailabilityof inputdata).
• ThenumberofclientscounselledbyCCCSmorethandoubledbetween2005and2010.WalesandScotlandsawthelargestincreasewithover150% more clients counselled. More recently,overthepast3yearsNorthernIrelandhasseenthe fastest growth in clients counselled by80%, suggesting that debt problems may beacceleratingthere.
• Research from R3 the insolvency tradeassociation found that the proportion ofhouseholds reporting debt worries has grownby 20% over the past year with the highestnumber in the North East and London. Some45% of households now report that theystruggletomakeittopaydayupfrom20%in2010. People from the North West and NorthEastarethemostlikelytobestruggling.
• Analysis of CCCS clients’ finances shows thatinmostoftheregionsanalysed,clientshadonaverageonly£10-14leftoverattheendofthemonth (before debt repayments) so they arevery vulnerable to even a small deteriorationinfinancialcircumstances. TheLondonregionagain stands out as having large numbers ofvulnerable households. The median budgetsurplusforLondonclientsis£3.Inotherwords,
more or less half of clients from the Londonregionhavenothingleftattheendofthemonthto service their debts. Similarly, the Londonregionhasthelargestdeficits–the1stquartiledeficit is -£144. This means that a quarter ofLondon clients were living with a shortfall intheirincomesofmorethan£150permonth.
• Only half of UK households have some formofbankorbuildingsocietyaccount,with40%having an individual savings account (ISA)2. PeoplefromNorthernIrelandandInnerLondonareleastlikelytohaveanysavings.Thelowlevelsof savings in Northern Ireland could prove aproblemintheeventofaneconomicdownturnintheprovince.
POLICY IMPLICATIONS• A more detailed gap analysis is required
comparing the need for debt advice andcapacityforprovidingindependentdebtadviceataregionalandlocallevel.
• We urge policymakers to designate the mostvulnerableregionsandcommunitiesas‘protectedzones’tobeblitzedwithcoordinated,targetedconsumerprotectionmeasures,publicawarenesscampaigns, and support measures to promoteaccess to fair, affordable credit. Alternativeaccess to affordable credit is critical to protectconsumersfrompredatorylendingandtooffsetthedragonregionalandlocaleconomiesexertedbythelegacyofhouseholddebt.
• Vulnerable households in specific regions andcommunitiesareathigh risk fromthegrowthinhighcost,sub-primelending(suchaspaydaylenders) and commercial debt managementcompanies. Policymakers,debt advice charities
2 OnceaccountssuchasNationalSavingsandInvestmentareincluded,aroundhalfofhouseholdshavesomeformofliquidsavings.

REPORT 3: DEBT AND THE REGIONS
3
andotherconsumerprotectionadvocatesneedto win the race to protect households beforetheyaretargetedtoanevengreaterextentbypredatorypractices.
• Our research implies that the level of UKhouseholds facing potential difficulties withmortgage payments has been seriouslydownplayed.Thereportpointstoveryworrying
levels of mortgage payment problems ina number of regions including those mostvulnerable to the impact of deterioratingeconomicconditionsandgovernmentspendingcuts. Therefore, we urge policymakers, localauthorities, debt advice charities and lenderstomakesuretheyareequippedtodealwithapossible serious increase in mortgage-relateddebtproblems.

REPORT 3: DEBT AND THE REGIONS
4

REPORT 3: DEBT AND THE REGIONS
5
ThisisthethirdandfinalreportintheDebtandtheFamilyseries.Inthefirstreport,wesawsignificantdifferencesinthefinancialvulnerabilitiesoflower,lower-mediumincome,mediumandhigherincomehouseholds. In the second report, we saw clearevidenceofadifferencebetweengenerationswithregards todebts, savingsandassets.Now in thisthirdreport,weseethattherearealsosignificantdifferencesintermsoflevelsofover-indebtednessandeconomicvulnerabilityataregionalandlocallevel.
Thereportisstructuredin4sections:
• Section1analysestotal,securedandmortgagedebtacrosstheUKregions.Theimportanceofmortgage debt and regional property marketson total levels of household debt in thoseregionscannotbeoverstated.
• Section 2 compares and contrasts levels ofunsecureddebtacrossthemainUKregions.
• In Section 3, we look at evidence of arrearsacrosstheregionsandestimatethenumbersofhouseholdswithineachregionwhofinddebtisaseriousburden.
• Section 4 then examines economic conditionsandothermeasuresoffinancialvulnerabilitytoidentifythoseareaswhicharemostexposedtodeteriorating economic conditions, and raisesa number of specific policy implications thatemerge.
• TheAnnexescontainfurtherdetailedinformationon regional debt along with a ‘master’ table
summarisingtheindicatorsavailableoneachoftheregionsanalysed.
Readers should note that many of the policyinterventionsrecommendedinthepreviousreportsin the series apply to problems identified in thisreport. However, the level and nature of debtevidentatregionalandlocallevelmeansthereareanumberofspecificregionalpolicyimplicationstobeaddressed.
The report was researched and written by MickMcAteer,GarethEvans,andAnnaGavurinofTheFinancialInclusionCentrewithadditionalresearchand analysis provided by Joe Surtees and MarkHaslamfromCCCS.
Aswiththefirstreport,wewelcomeanycommentsorqueries.Pleasecontact:[email protected]
INTRODUCTION AND BACKGROUND

REPORT 3: DEBT AND THE REGIONS
6

REPORT 3: DEBT AND THE REGIONS
7
We first consider the levels of total and secureddebt in thedifferent regionsof theUK.AsChart1belowshows,thehighestlevelsofsecureddebtcanbefoundintheLondonandSouthEastregions.ThelowestlevelsofsecureddebtcanbefoundintheNorthEastandScotland.
Chart 1: CCCS clients – average secured debt by region
Source: analysis of CCCS database
Chart 2: Households spending > 50% of income on total debt repayments
Source: Table 7, Over-Indebtedness in Great Britain: An Analysis Using the Wealth and Assets Survey and Household Annual Debtors Survey report to the Department for Business, Innovation and Skills, Bryan, Taylor, Veliziotis, Institute for Social and Economic Research, University of Essex, 2010. Weighted average calculated by FIC
Weareparticularlyinterestedinidentifyingregionswithhighlevelsoffinanciallyvulnerability.Chart2,below,showstheproportionofhouseholdsineach
regionwhich spendmore than50%ofhouseholdincomesontotaldebtrepayments.PeopleinLondonaremostlikelytospendmorethanhalftheirincomesontotaldebtrepayments;theyarecloselyfollowedbyhouseholdsfromthenorthernpartsofEngland(dataforNorthernIrelandisnotavailable).
From the above data and general populationdata, we estimate that in total nearly 1.6 millionhouseholdsinGreatBritainarespendingmorethan50% of household incomes on debt repayment(NorthernIrelanddataisnotavailable).
Table 1: Numbers of households spending >50% of income on total debt repayments
Region Estimate of no. of h’holds
EastAnglia 156,000
EastMidlands 103,000
London 257,000
NorthEast 74,000
NorthWest 205,000
NorthernIreland n/a
Scotland 134,000
SouthEast 199,000
SouthWest 119,000
Wales 64,000
WestMidlands 123,000
Yorkshire 141,000
GBweightedaverage 1,573,000
Source: Table 7, Over-Indebtedness in Great Britain: An Analysis Using the Wealth and Assets Survey and Household Annual Debtors Survey report to the Department for Business, Innovation and Skills, Bryan, Taylor, Veliziotis, Institute for Social and Economic Research, University of Essex. Population estimates and weighted averages calculated by FIC
This figure may be an underestimate as it is notclear on what basis the calculation for mortgagepayments is undertaken – that is, whether
1 STATE OF THE REGIONS: TOTAL AND SECURED DEBT
REPORT 3: DEBT AND THE REGIONS
8
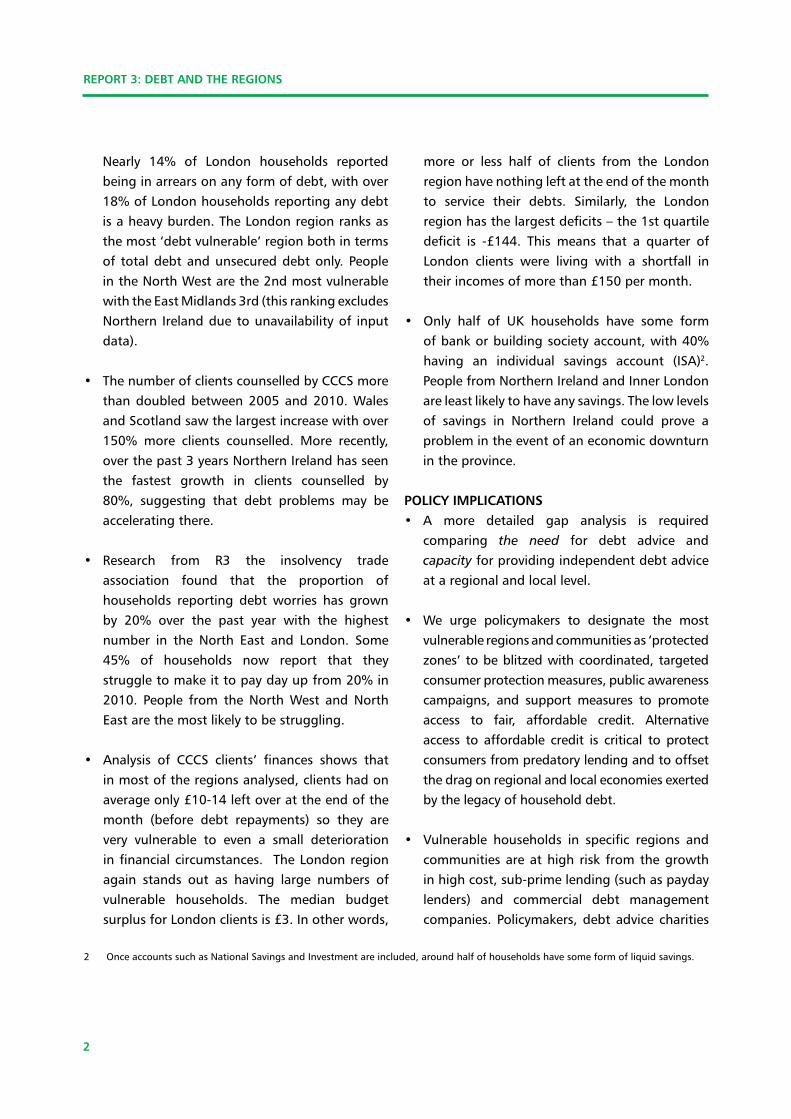
mortgage repayments made by householdsare on a repayment and interest basis or on theactual payments made each month. Looking attheFinancialServicesAuthority’s(FSA’s)MortgageMarket Review (MMR) in more detail shows thatverylargenumbersofhouseholdsareonlypayingtheinterestontheirmortgageanddonothavearepayment vehicle in place. This would have theeffectofreducingthelevelofmortgagepaymentsmadeeachmonthandthereforeartificiallyloweringthe proportion of household income spent onmortgage payments. If that is the case, the totaldebt‘burden’wouldbeunderestimated.
REGIONAL HOUSING MARKET vULNERAbILITY Averystrongthemethatemergesfromthisseriesof reports is the huge role property plays in theaccumulationofdebtandassetsbyUKhouseholds.The link between regional property markets andhousehold vulnerability is demonstrated in newanalysis from the FSA as part of its MMR. Thisanalyses the vulnerability of homeowners with
mortgages taken out between April 2005 andSeptember2010ineachoftheUKregions.TheFSAanalysedthestateofthemortgagemarketaccordingtoanumberoffactorsincludingmortgagepaymentproblems,levelsofrepossessions,negativeequity,andthenumbersofso-called‘mortgageprisoners’ineachregion.
Chart 3: Mortgages with payment problems in each region
Source: FSA, Mortgage Market Review, Datapack, Exhibit 6.15, http://www.fsa.gov.uk/pubs/other/mmr_datapack2011.pdf
Chart 4: Mortgage repossessions by region
Source: FSA Mortgage Market Review, Datapack, Exhibit 6.16, http://www.fsa.gov.uk/pubs/other/mmr_datapack2011.pdf
The FSA estimates that 1 in 5 mortgages in theUK taken out over the period face some sort ofpaymentproblem.But,asChart3shows,despitehigher property prices in London and the SouthEast, fewermortgages facepaymentproblems in
6-7%
7-8%
8-9%
9-10%
Debt repayments more than 50% of household income

REPORT 3: DEBT AND THE REGIONS
Region
East Anglia
Mean £15,608 £142,593 9.1
Median £13,842 £130,000 9.4
East Midlands
Mean £14,981 £113,146 7.6
Median £13,200 £100,000 7.6
London
Mean £14,703 £180,519 12.3
Median £12,564 £164,000 13.1
North East
Mean £14,271 £98,579 6.9
Median £12,684 £87,000 6.9
North West
Mean £14,775 £107,916 7.3
Median £13,176 £94,000 7.1
Northern Ireland
Mean £16,141 £131,981 8.2
Median £14,088 £111,000 7.9
Region
Scotland
Mean £14,244 £95,126 6.7
Median £12,360 £82,353 6.7
South East
Mean £16,193 £163,264 10.1
Median £14,196 £142,000 10.0
South West
Mean £15,214 £141,515 9.3
Median £13,428 £125,000 9.3
Wales
Mean £14,301 £103,317 7.2
Median £12,798 £90,000 7.0
West Midlands
Mean £14,413 £111,847 7.8
Median £12,804 £98,000 7.7
Yorkshire
Mean £14,415 £104,105 7.2
Median £12,960 £92,000 7.1
9
these regions.Northern regionshavehigher thanaverage proportions of mortgages in difficulty. Athird(32%)ofmortgagesinNItakenoutbetween2005and2010havepaymentproblems.
Whilerecordlowinterestratesareprovidingsomedegree of respite, homeowners in some regionsappear particularly vulnerable to deterioration ineconomic conditions. Already northern regionsand Northern Ireland have seen higher thanaverage repossessions. The North East has seenrepossessionsattwicetherateofthoseinLondon,theSouthEast,andtheSouthWest.
COMPARISON OF CCCS CLIENTS’ SECURED DEbTSTheCCCSdatabaseallowsustoanalysethesizeofsecureddebtinrelationtotheincomesofconsumerscontactingCCCS.TheresultsshowthatLondonhasby far thehighestsecureddebt-incomeratios (DTI12.3),followedbyclientsfromtheSouthEast(DTI10.1),whileclients intheNorthEast(DTI6.9)andScotland(6.7)havethelowestdebt/incomeratios.ThehighsecuredDTIratiosevidentamongstclientsfrom the London region is consistent with otherfindingswhichshowthatwhiletheregiontakenasawholemaybewealthyincomparisontotherestoftheUK,therearelargepocketsofseriousover-indebtednessanddisadvantageinLondon.
Secured/ income
ratio
Secured/ income
ratio
Annual net income
Annual net income
Total Secured
debt
Total Secured
debt
Table 2: CCCS secured debt regional comparisons
Source: Analysis of CCCS database

REPORT 3: DEBT AND THE REGIONS
10
NEGATIvE EqUITY AND MORTGAGE ‘PRISONERS’The FSA has also estimated the proportion ofhouseholdswhicharenowmortgage‘prisoners’-householdswhichdonothavesufficientequityintheirhomestomovetoadifferentproperty.Itisclearthatagainnorthernregionsaremostaffected.WhiledataforNorthernIrelandisnotavailablewecanbefairlycertainthattheprovincewouldhaveahigherthanaverageproportionofhomeownerswhoare‘mortgageprisoners’particularlyamongstrecentbuyers.
Established debt advice agencies have tendedto focus on households with unsecured debtproblems. But the full extent of latent unsecureddebtproblemsmayhavebeenconcealedsomewhatbytheamountofdebttransformationamongstUKhouseholds–thatis,householdsobtainingfurtheradvances on mortgages to maintain paymentson,orpayoff,unsecureddebts. The low interest
rates currently charged on mortgages has meantthat this transformation from unsecured debtto secured debt has cushioned many householdsfrom the comparatively high cost of unsecureddebt.However,wethinkthereisaseriousriskthatmajormortgagedebt relatedproblemsmay starttoemerge.
Chart 5: Mortgage ‘prisoners’ in each region
Source: FSA, Mortgage Market Review, Datapack, Exhibit 5.6, http://www.fsa.gov.uk/pubs/other/mmr_datapack2011.pdf

REPORT 3: DEBT AND THE REGIONS
11
Chart6,below, shows thathouseholds in Londonand the South East of England have, on average,the highest levels of unsecured debt at £7,400and£9,300respectively. Incontrast,households innorthernregionsofEnglandandScotlandhave,onaverage,unsecureddebtsofunder£7,000(NorthernIrelandisnotcoveredbythisparticulardataseries).
Chart 6: Unsecured debt by region
Source: ONS, Wealth in GB, 2006/08, Fig 7.9
TheCCCSdatabaseprovidessimilarinformationonlevels of unsecured debt problems in the variousregions. CCCS clients from the South East hadthe highest levels of unsecured debt (just under£23,000), followedby the SouthWest (£21,250).Clients from Scotland (£17,350) and the NorthEast (£18,150)had the lowestaveragedebts.So,clients from the South East had unsecured debtson average worth £5,500 more than those fromScotland.
For the typical CCCS client, total unsecured debtoutstrips annual household incomeby a third. In4 regions – London, the South East, East Anglia,andtheSouthWest–clientshadunsecureddebtsworth 40% more than incomes. The results aresummarisedinTableA2,Annex2.
Chart 7: CCCS clients unsecured debt by region
Source: Analysis of CCCS database
IDENTIFYING HIGH RISK REGIONSOfcourse,theaveragelevelofunsecureddebttellsusonlypartofthestory.Aswithmortgagedebt,itismorerelevanttoconsiderdebtlevelsinrelationtoincomes.Usinggovernmentdata,weestimatethat nearly 1 in 11 (8.9%) households across theUKarespendingmorethanaquarterofhouseholdincomes on meeting unsecured debt repayments(seeTable3,overleaf).
London tops the league table for the highestproportion and number of households devotingmore than 25% of incomes on unsecured debtrepayments (10.2%), followed by the North East(10.1%), and North West (9.5%). Equivalent dataonNorthernIrelandisnotavailable.
TRENDSOne of the problems with publicly availablegovernmentdataisthatitisdifficulttogetagoodpictureof recentdebt trends.However, theCCCSdatabase allows us to track trends over the pastfive years. The number of clients counselled byCCCSmorethandoubledbetween2005and2010
2 STATE OF THE REGIONS: UNSECURED DEBT
REPORT 3: DEBT AND THE REGIONS
12
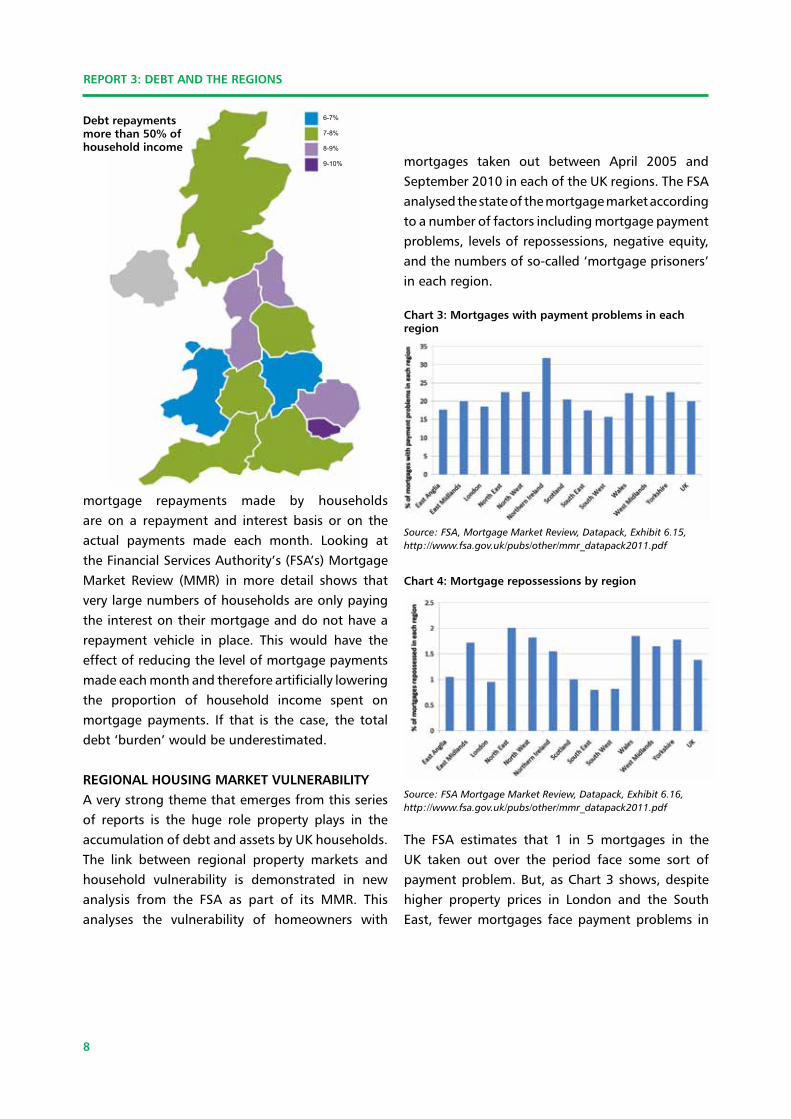
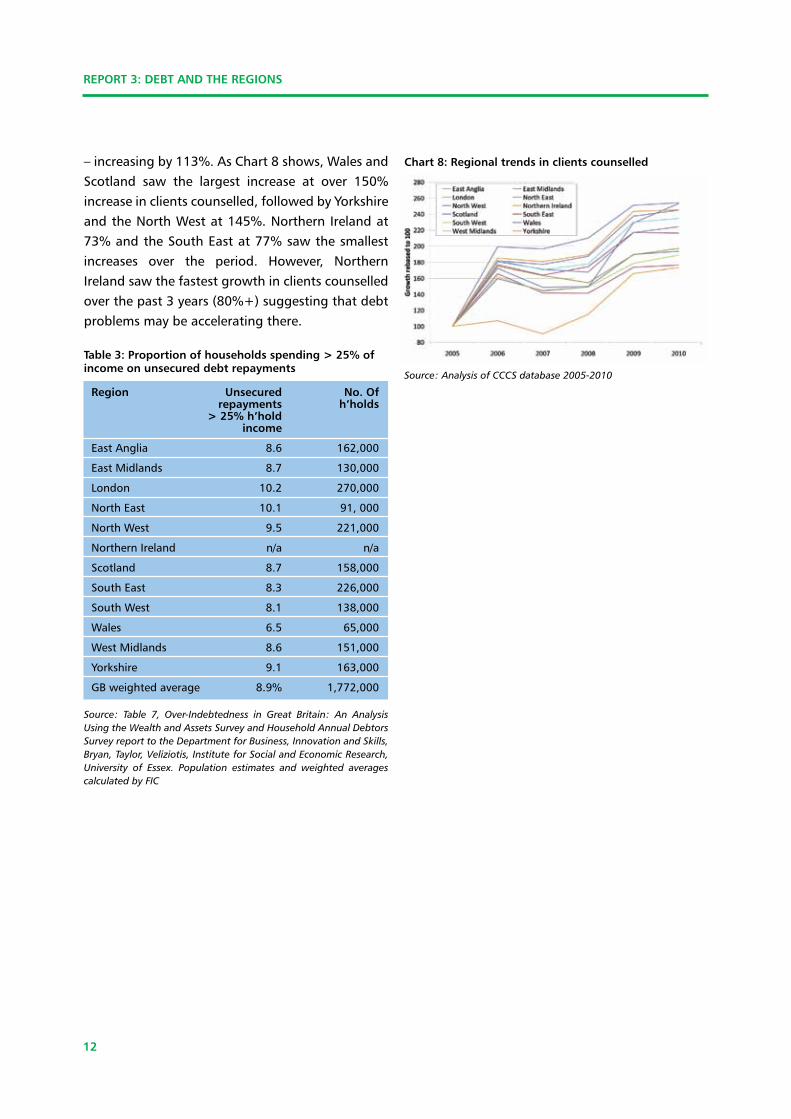
–increasingby113%.AsChart8shows,WalesandScotland saw the largest increase at over 150%increaseinclientscounselled,followedbyYorkshireandtheNorthWestat145%.NorthernIrelandat73%andtheSouthEastat77%sawthesmallestincreases over the period. However, NorthernIrelandsawthefastestgrowthinclientscounselledoverthepast3years(80%+)suggestingthatdebtproblemsmaybeacceleratingthere.
Table 3: Proportion of households spending > 25% of income on unsecured debt repayments
Region Unsecured No. Of repayments h’holds > 25% h’hold income
EastAnglia 8.6 162,000
EastMidlands 8.7 130,000
London 10.2 270,000
NorthEast 10.1 91,000
NorthWest 9.5 221,000
NorthernIreland n/a n/a
Scotland 8.7 158,000
SouthEast 8.3 226,000
SouthWest 8.1 138,000
Wales 6.5 65,000
WestMidlands 8.6 151,000
Yorkshire 9.1 163,000
GBweightedaverage 8.9% 1,772,000
Source: Table 7, Over-Indebtedness in Great Britain: An Analysis Using the Wealth and Assets Survey and Household Annual Debtors Survey report to the Department for Business, Innovation and Skills, Bryan, Taylor, Veliziotis, Institute for Social and Economic Research, University of Essex. Population estimates and weighted averages calculated by FIC
Chart 8: Regional trends in clients counselled
Source: Analysis of CCCS database 2005-2010

REPORT 3: DEBT AND THE REGIONS
13
10.5%ofhouseholdsinGreatBritainareinarrearson any debt, with 14% reporting that debt is aheavyburden.Nearly14%ofhouseholdsinLondonreported being in arrears on some form of debt,with over 18% of London households reportingdebtasaheavyburden.Scotlandscoredthelowestonbothcountswithfewesthouseholdsreportingarrearsanddebtasaburden.
Similarly,analysisofthesamenationalsurveyshowsLondonhasthehighestproportionofhouseholds
which have unsecured debt arrears and whichreportthatdebtisaheavyburden.
Overall,weestimatethatbasedonthisdataaround2.8 million households in Great Britain find debta heavy burden, 2.1 million are in some form ofarrears3.
3 Pleasenotetheseestimatesarenotdirectlycomparablewiththeestimatesfor3.1millionhouseholdsinfinancialdifficultyinthepreviousreports.Thegovernmentdataonwhichthatwasbasedisnotavailableatregionallevel.Moreover,theestimatesaboveareforGreatBritainanddonotincludeNorthernIreland.
3 ANALYSING PROBLEM DEBT IN THE UK REGIONS
Table 4: Households in arrears and facing debt burden by region
Region
EastAnglia 9 10 169,110 14.3 5 268,697 3.5 7 65,765 6.2 3 116,498
EastMidlands 10.5 3 156,030 14.1 6 209,526 4.1 2 60,926 6.4 2 95,104
London 13.9 1 368,350 18.4 1 487,600 4.8 1 127,200 8.1 1 214,650
NorthEast 10.3 4 92,185 10.5 9 93,975 4.1 2 36,695 4.7 10 42,065
NorthWest 11.6 2 269,700 13.4 7 311,550 4.1 2 95,325 5.9 7 137,175
NorthernIreland n/a n/a n/a n/a n/a n/a n/a n/a n/a n/a n/a n/a
Scotland 8.8 11 159,368 10 11 181,100 2.6 11 47,086 5.1 8 92,361
SouthEast 9.5 9 258,495 15.4 2 419,034 3.4 8 92,514 6.2 3 168,702
SouthWest 10.1 6 172,003 14.4 4 245,232 3.9 5 66,417 6.2 3 105,586
Wales 9.7 8 96,709 10.4 10 103,688 3.4 8 33,898 4.6 11 45,862
WestMidlands 10.2 5 178,602 15.1 3 264,401 3.6 6 63,036 6 6 105,060
Yorkshire 9.9 7 176,814 11.8 8 210,748 3.1 10 55,366 4.8 9 85,728
GBweightedaverage 10.5 2,097,366 14.0 2,795,551 3.7 744,228 6.0 1,208,791
Source: Table 6, Over-Indebtedness In Great Britain: An Analysis Using The Wealth And Assets Survey And Household Annual Debtors Survey report to the Department for Business, Innovation and Skills, Bryan, Taylor, Veliziotis, Institute for Social and Economic Research, University of Essex. October 2010, Population data, rankings and weighted averages calculated by FIC
Any arrears (%)
Rank
No. H’holds
Any debt heavy burden
Rank
No. H’holds
Any unsec. arrears (%)
Rank
No. H’holds
Unsec. debt heavy burden(%)
Rank
No. H’holds

REPORT 3: DEBT AND THE REGIONS
14
DEbT WORRIESResearchfromR3theinsolvencytradeassociation,showsthattheproportionofhouseholdsreportingdebtworrieshasgrownby20%overthepastyear.The regions with the highest number reportingdebtworriesare theNorthEastandLondon.TheEast Midlands and North East saw the largestgrowthintheproportionreportingdebtworries.
Chart 9: Households with debt worries
Source: R3 Personal Debt Snapshot 2010 – 2011
Chart 10: Households who struggle to payday
Source: R3 Personal Debt Snapshot 2010 – 2011
The R3 research also examines the degree towhich households are struggling to make endsmeet. Some 45% of households now report that
theystruggletomakeittopayday,upfrom20%in2010.TheregionsthatstandoutashavingthehighestproportionofhouseholdswhosaytheyarestrugglingaretheNorthWestandtheNorthEast.The proportion of households who say they arestruggling has more than doubled according tothissurvey.Thisgivesrisetotheneedforincreasedconsumer protection given the expansion ofpaydaylendersandcommercialdebtmanagementfirmsintheUK.Itisareasonableassumptionthatsuch operators are targeting highly economicallyvulnerableregionsandcommunitiesusingpubliclyavailable data and indeed more sophisticatedintelligencesources.
OvERALL ASSESSMENT OF OvER-INDEbTEDNESSWehavecombinedexistinggovernmentdata(seeAnnex4)toanalysewhichregionsscoreconsistentlypoorly on the key over-indebtedness indicatorspresented in the above tables. To determine theranking,wecalculatedanover-indebtednessratioforeachoftheindicatorsandforeachoftheregions.Theratioistheextenttowhichtheproportionofhouseholds in each region was greater than theweighted average for Great Britain. For example,in the London region the ‘heavy burden’ ratio is18.4/14.0=1.3.WhereastheWestMidlandshasanunsecured‘heavyburden’ratioof1.0meaningtheregionhasthesameproportionofhouseholdsreportingthatdebtisaheavyburdenastheGreatBritainweightedaverage.
Combining the various indicators for each of theregions,weareabletodetermineanoverallover-indebtednessrankingforeachoftheregions.Theresults are then ranked by overall debt and byunsecureddebt.
REPORT 3: DEBT AND THE REGIONS
15
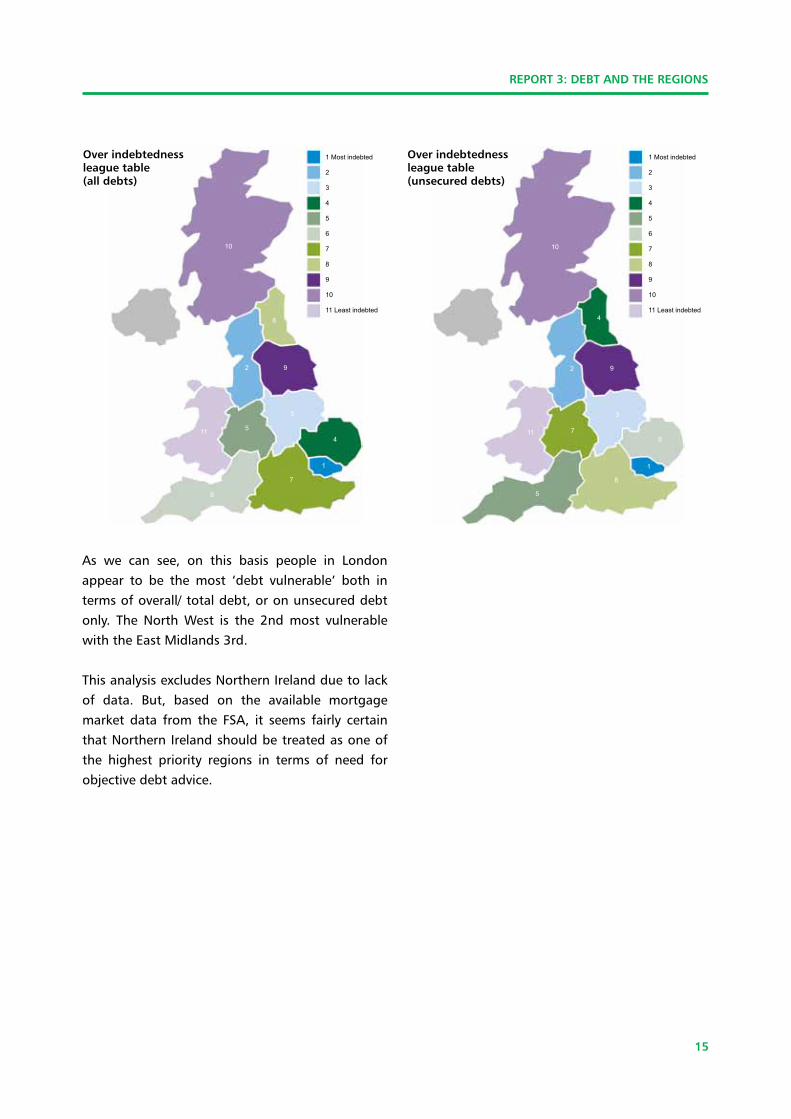
As we can see, on this basis people in Londonappear to be the most ‘debt vulnerable’ both intermsofoverall/totaldebt,oronunsecureddebtonly. The North West is the 2nd most vulnerablewiththeEastMidlands3rd.
ThisanalysisexcludesNorthernIrelandduetolackof data. But, based on the available mortgagemarket data from the FSA, it seems fairly certainthatNorthernIrelandshouldbetreatedasoneofthe highest priority regions in terms of need forobjectivedebtadvice.
Over indebtednessleague table (all debts)
1 Most indebted
2
3
4
5
6
7
8
9
10
11 Least indebted
1 Most indebted
2
3
4
5
6
7
8
9
10
11 Least indebted
1 1
2 2
3 3
4
4
5
5
6
6
7
7
8
8
99
1010
1111
Over indebtedness league table (unsecured debts)

REPORT 3: DEBT AND THE REGIONS
16

REPORT 3: DEBT AND THE REGIONS
17
The analysis in the previous sections provides uswithanindicationofthelegacyofdebtthatneedstobeaddressed.However, it is also important toconsider futureprospectstoidentifywhichregionsare vulnerable to a combination of existing debtandweakeconomicconditions.
CURRENT ECONOMIC CONDITIONSAround a quarter of UK households have weeklyincomes less than £300, with just over 1 in 10earning less than £200. But as Chart 11 shows,againthereisalargevariationacrosstheregions.AthirdofhouseholdsintheNorthEastand30%ofhouseholds inNorthern Irelandhave incomes lessthan£300perweek,comparedto20%inLondonandtheSouthEast.
Chart 11: Households on low incomes by region
Source: Family Resources Survey, DWP, Distribution of Household Incomes
Theregionalpicturebecomesmorecomplexwhenhousingcostsarefactoredin.Onenotablefindingis that although average weekly earnings arehighestinLondon,peoplelivinginthecapitalarethe most squeezed if you look at take-home payafterlivingcosts.
Table 6: % of households below 50%, 60%, 70% of median income by region after housing costs
Region 50% Rank 60% Rank 70%
EastAnglia 14 9 20 10 27 11
EastMidlands 15 8 22 8 29 9
InnerLondon 25 1 32 1 39 1
London 21 2 28 2 34 2
NorthEast 16 4 24 4 33 2
NorthWest 16 4 24 4 31 5
NorthernIreland 14 9 22 8 30 8
OuterLondon 19 2 26 2 32 4
Scotland 13 12 19 12 26 12
SouthEast 12 13 18 13 24 13
SouthWest 14 9 20 10 28 10
Wales 16 4 23 6 31 5
WestMidlands 17 3 25 3 33 2
Yorkshire 16 4 23 6 31 5
UK 15 22 30
Thetableshowsthatfor21%ofLondonhouseholdshousingcostsaccountfor50%ofaverageearningscompared to 15% of households among the UKpopulationasawhole.Furthermore,whenhousingcosts are taken into account 28% of Londonhouseholds have incomes below 60% of medianincome compared to 22% of households acrossthe UK. Other regions with high proportions ofhouseholdsonlowincomesincludetheNorthEast,NorthWest,andWestMidlands.
HOUSEHOLD ExPENDITURE bY REGIONAsTable7overleafshows,Londonhouseholdshavethehighestweeklyhouseholdexpenditure,followedby the South East. This high level of expenditurecanbemostlyexplainedby theamountspentonmortgage payments and rent by households intheseregions.
4 FINANCIAL VULNERABILITY AND POLICY IMPLICATIONS
Rank

REPORT 3: DEBT AND THE REGIONS
18
Togetanideaofhowmuchofacushionhouseholdshaveagainstunforeseenevents,wehaveestimatedhow much of their weekly incomes householdsspend as a proportion of incomes. As we cansee from Table 7, the regions where householdsspendthelargestproportionsofincomesarenowNorthernIrelandandtheNorthWest.
Inseveralregions,evenarelativelysmallreductionin incomewouldpush the typicalhousehold intodeficitunlesshouseholdspendingisalsocut.
As ever, we emphasise that high level analysescan conceal awidedisparity in experienceswithinregions. For instance, although average income ishighestinLondon,thisdisguisesthefactthatLondonhasadisproportionatelyhighnumberofhouseholdsonlowincomesandpeoplelivinginthecapitalaremostlikelytobesqueezedbyhighhousingcosts–thereforeitisnotsurprisingthatitscorespoorlyonoverallindicatorsofover-indebtedness.
The vulnerable position of disadvantagedhouseholds in the London region is reinforced bydetailedanalysisoftheCCCSdatabase.ThemediansurplusforLondonclientsis£3.Inotherwords,halfofclientsfromtheLondonregionhavenothingleftat the end of the month. Similarly, clients in theLondon region have the largest deficits – the 1stquartiledeficitis-£144.ThismeansthatonequarterofLondonclientswerelivingwithashortfallintheirincomesofnearly£150permonth.TheresultsaresetoutinmoredetailinAnnex1:AnalysisofCCCSclients’financialposition.
ThecomparativelypoorpositionofLondonclientsisre-emphasisedbyTable8whichshowstheaveragesurplus/deficitasaproportionofnetincomes.Aswecansee,thebudgetsurplusofthemedianLondonhouseholdasaproportionof incomeisthelowestintheUK(0.29%).Indeed,thedeficitoffirstquartileclientsisproportionallyhighestinLondon,wheretheshortfallamountstomorethan25%ofnetincome.
Table 7: Household expenditure and income by region
Region Average Weekly Rank Average Weekly Expend/ Rank h’hold net income £ net income expend. £
EastAnglia 488 3 572 85% 5
EastMidlands 423 9 488 87% 3
London 552 1 700 79% 9
NorthEast 387 12 466 83% 7
NorthWest 430 8 490 88% 2
NorthernIreland 486 4 503 97% 1
Scotland 439 7 521 84% 6
SouthEast 524 2 637 82% 8
SouthWest 474 5 683 69% 12
Wales 396 11 508 78% 10
WestMidlands 446 6 512 87% 3
Yorkshire 401 10 512 78% 10
UK 462 560 83% Source: Family Resources Survey, Regional Trends, FIC analysis
REPORT 3: DEBT AND THE REGIONS
19
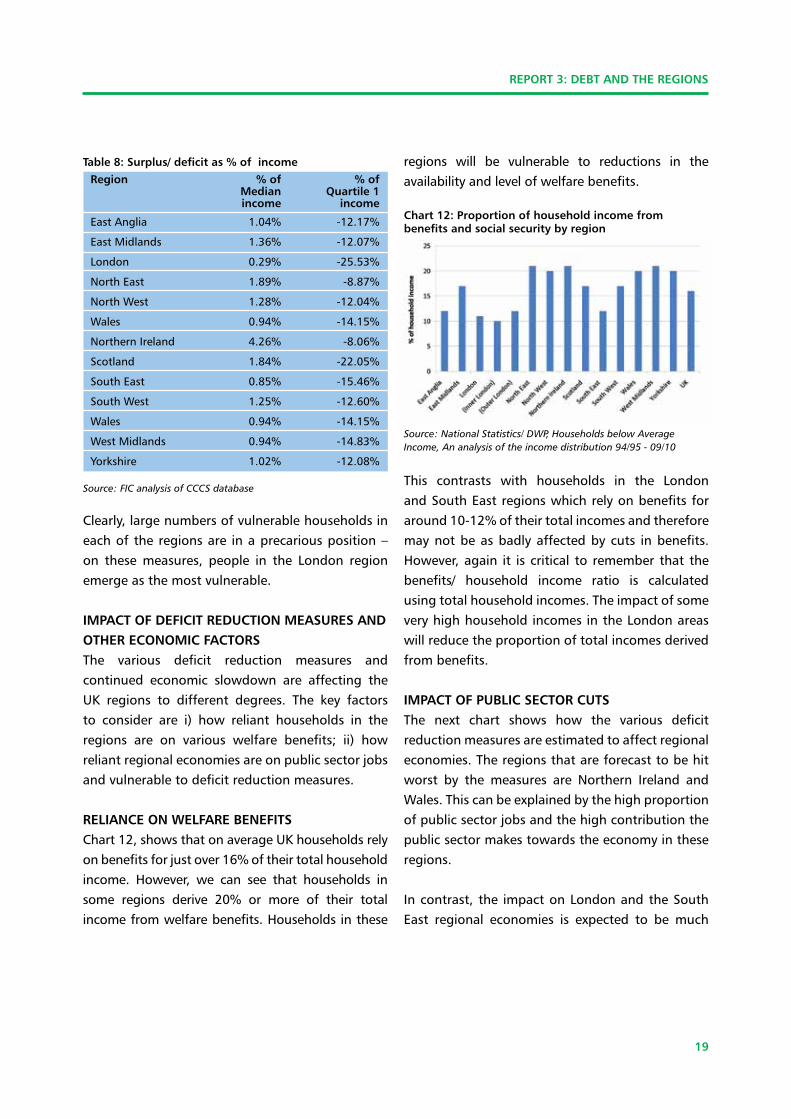
Table 8: Surplus/ deficit as % of income
Region % of % of Median quartile 1 income income
EastAnglia 1.04% -12.17%
EastMidlands 1.36% -12.07%
London 0.29% -25.53%
NorthEast 1.89% -8.87%
NorthWest 1.28% -12.04%
Wales 0.94% -14.15%
NorthernIreland 4.26% -8.06%
Scotland 1.84% -22.05%
SouthEast 0.85% -15.46%
SouthWest 1.25% -12.60%
Wales 0.94% -14.15%
WestMidlands 0.94% -14.83%
Yorkshire 1.02% -12.08%
Source: FIC analysis of CCCS database
Clearly,largenumbersofvulnerablehouseholdsineachoftheregionsare inaprecariousposition–on these measures, people in the London regionemergeasthemostvulnerable.
IMPACT OF DEFICIT REDUCTION MEASURES AND OTHER ECONOMIC FACTORSThe various deficit reduction measures andcontinued economic slowdown are affecting theUK regions to different degrees. The key factorsto consider are i) how reliant households in theregions are on various welfare benefits; ii) howreliantregionaleconomiesareonpublicsectorjobsandvulnerabletodeficitreductionmeasures.
RELIANCE ON WELFARE bENEFITSChart12,showsthatonaverageUKhouseholdsrelyonbenefitsforjustover16%oftheirtotalhouseholdincome. However, we can see that households insome regions derive 20% or more of their totalincomefromwelfarebenefits.Householdsinthese
regions will be vulnerable to reductions in theavailabilityandlevelofwelfarebenefits.
Chart 12: Proportion of household income from benefits and social security by region
Source: National Statistics/ DWP, Households below Average Income, An analysis of the income distribution 94/95 - 09/10
This contrasts with households in the LondonandSouthEastregionswhichrelyonbenefitsforaround10-12%oftheirtotalincomesandthereforemaynotbeasbadlyaffectedbycuts inbenefits.However,again it iscritical to rememberthat thebenefits/ household income ratio is calculatedusingtotalhouseholdincomes.TheimpactofsomeveryhighhouseholdincomesintheLondonareaswillreducetheproportionoftotalincomesderivedfrombenefits.
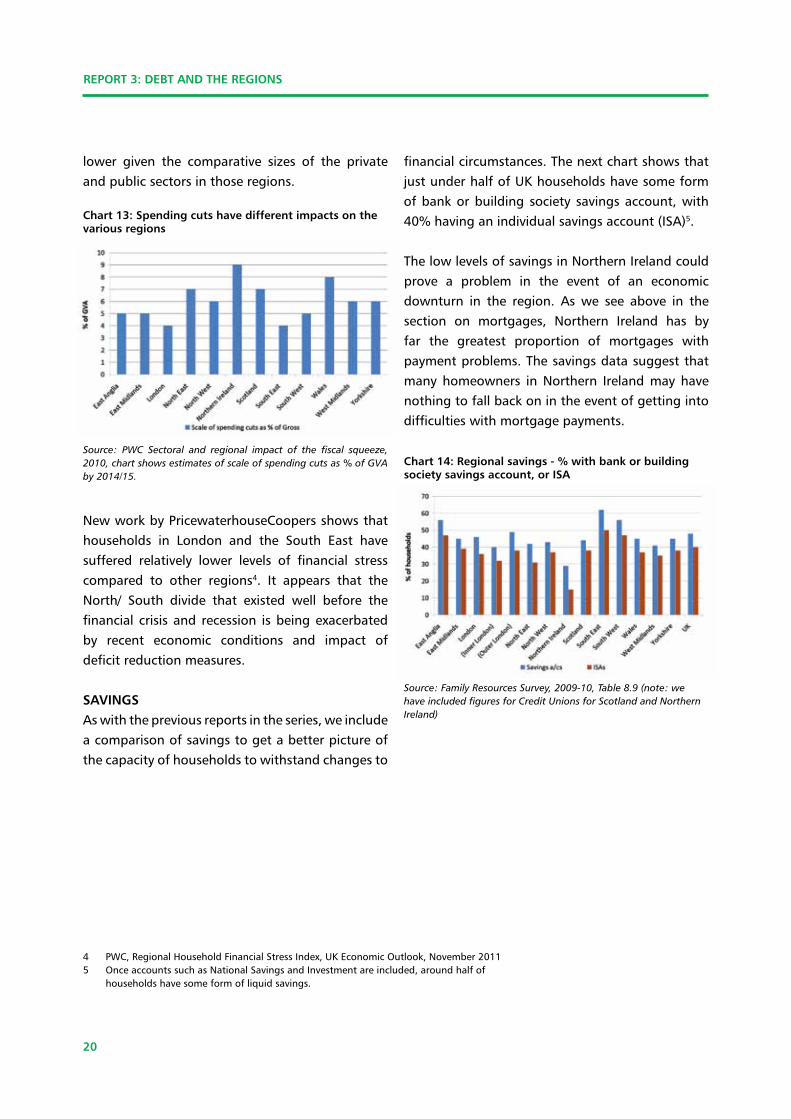
IMPACT OF PUbLIC SECTOR CUTSThe next chart shows how the various deficitreductionmeasuresareestimatedtoaffectregionaleconomies.Theregionsthatareforecasttobehitworst by the measures are Northern Ireland andWales.Thiscanbeexplainedbythehighproportionofpublicsectorjobsandthehighcontributionthepublicsectormakestowardstheeconomyintheseregions.
Incontrast, the impactonLondonandtheSouthEast regional economies is expected to be much
REPORT 3: DEBT AND THE REGIONS
20
lower given the comparative sizes of the privateandpublicsectorsinthoseregions.
Chart 13: Spending cuts have different impacts on the various regions
Source: PWC Sectoral and regional impact of the fiscal squeeze, 2010, chart shows estimates of scale of spending cuts as % of GVA by 2014/15.
NewworkbyPricewaterhouseCoopersshowsthathouseholds in London and the South East havesuffered relatively lower levels of financial stresscompared to other regions4. It appears that theNorth/ South divide that existed well before thefinancial crisisand recession isbeingexacerbatedby recent economic conditions and impact ofdeficitreductionmeasures.
SAvINGSAswiththepreviousreportsintheseries,weincludeacomparisonofsavingstogetabetterpictureofthecapacityofhouseholdstowithstandchangesto
financialcircumstances.ThenextchartshowsthatjustunderhalfofUKhouseholdshavesomeformofbankorbuilding society savingsaccount,with40%havinganindividualsavingsaccount(ISA)5.
ThelowlevelsofsavingsinNorthernIrelandcouldprove a problem in the event of an economicdownturn in the region. As we see above in thesection on mortgages, Northern Ireland has byfar the greatest proportion of mortgages withpaymentproblems.Thesavingsdatasuggestthatmany homeowners in Northern Ireland may havenothingtofallbackonintheeventofgettingintodifficultieswithmortgagepayments.
Chart 14: Regional savings - % with bank or buildingsociety savings account, or ISA
Source: Family Resources Survey, 2009-10, Table 8.9 (note: we have included figures for Credit Unions for Scotland and Northern Ireland)
4 PWC,RegionalHouseholdFinancialStressIndex,UKEconomicOutlook,November20115 OnceaccountssuchasNationalSavingsandInvestmentareincluded,aroundhalfof
householdshavesomeformofliquidsavings.

REPORT 3: DEBT AND THE REGIONS
21
Thisfinalreportraisesanumberofspecificpolicyimplicationsincluding:
1. The requirement formoredetailedgapanalysiscomparing the need for debt advice and capacityfor the provision of independent debt advice at aregional and local level. Linked to this, a detailedanalysisisneededofhowcutsinfundingatregional/community level will affect the provision of debtadvicegiventheprioritiesidentifiedinthisreport.
2. The research and analysis contained in thisreport – in terms of multiple indicators of over-indebtedness and economic vulnerability – raiseserious consumer protection issues due to thevulnerabilityofhouseholdsinspecificregionsandcommunities to continued, substantial growth inhighcost,sub-primelending(suchaspaydaylenders)and commercial debt management companies.Itgoeswithout saying that commercial subprimelendersandserviceproviderswillbeinpossessionof similar and more sophisticated research andanalysis totargeteconomicallyvulnerableregionsand communities. We do not think it is alarmistto warn that policymakers, debt advice charitiesandotherconsumerprotectionadvocatesneedtowintheracetoprotecthouseholdsbeforetheyaretargeted to an even greater extent by predatorypractices.
3. Specifically, we urge relevant governmentdepartments including HMT, BIS, DCLG, the OFTandlocalauthoritiestodeveloptargetedconsumerprotectionpoliciestoprotectat-riskhouseholdsinthemostvulnerableregionsandcommunities.Theestablished indices of multiple deprivation (IMD)areuseful.However,theseshouldbecombinedwith
the rangeof indicatorswehave lookedat in thisreporttoanalyseandidentifyi)themostvulnerableregionsandcommunitiesandii)thecharacteristicsofhouseholdsathighestriskofover-indebtednessand predatory practices. These ‘protected zones’should be blitzed with coordinated, targetedconsumer protection measures, public awarenesscampaigns, and support measures to promoteaccesstofair,affordablecredit.Alternativeaccessto affordable credit could be critical to protectconsumers from predatory lending and to offsetthedragonregionalandlocaleconomiesexertedbythelegacyofhouseholddebt.
4.Aswepointedoutinthepreviousreport,Debtand the Generations, the level of UK householdswhicharefacingpotentialdifficultieswithmortgagepayments has been seriously downplayed. Inparticular,analarmingnumberofmortgagestakenoutinthe5yearsintherunuptothefinancialcrisisandrecessionareshowingsignsofbeinginfinancialdifficulty.Sofar,recordlowlevelsofinterestratesand welcome forbearance by major lenders hasdampened down actual repossessions. Moreover,wethink thatanothereffectof low interest ratesand forbearance has been to reduce the numberofhouseholdsinseriouslyaffectedregionsseekingadvice from independentdebtadvicecharitiesonmortgage-related problems. However, there is noguarantee that interventions such as forbearancecan continue to cushion over-indebted mortgageborrowers in the face of deteriorating regionaleconomic conditions. The analysis presented inSection1pointstoveryworryinglevelsofmortgagepayment problems in a number of regions.Therefore,weurgepolicymakers,localauthorities,debt advice charities and lenders to make suretheyareequippedtodealwithapossibleseriousincreaseinmortgage-relateddebtproblems.
POLICY IMPLICATIONS

REPORT 3: DEBT AND THE REGIONS
22
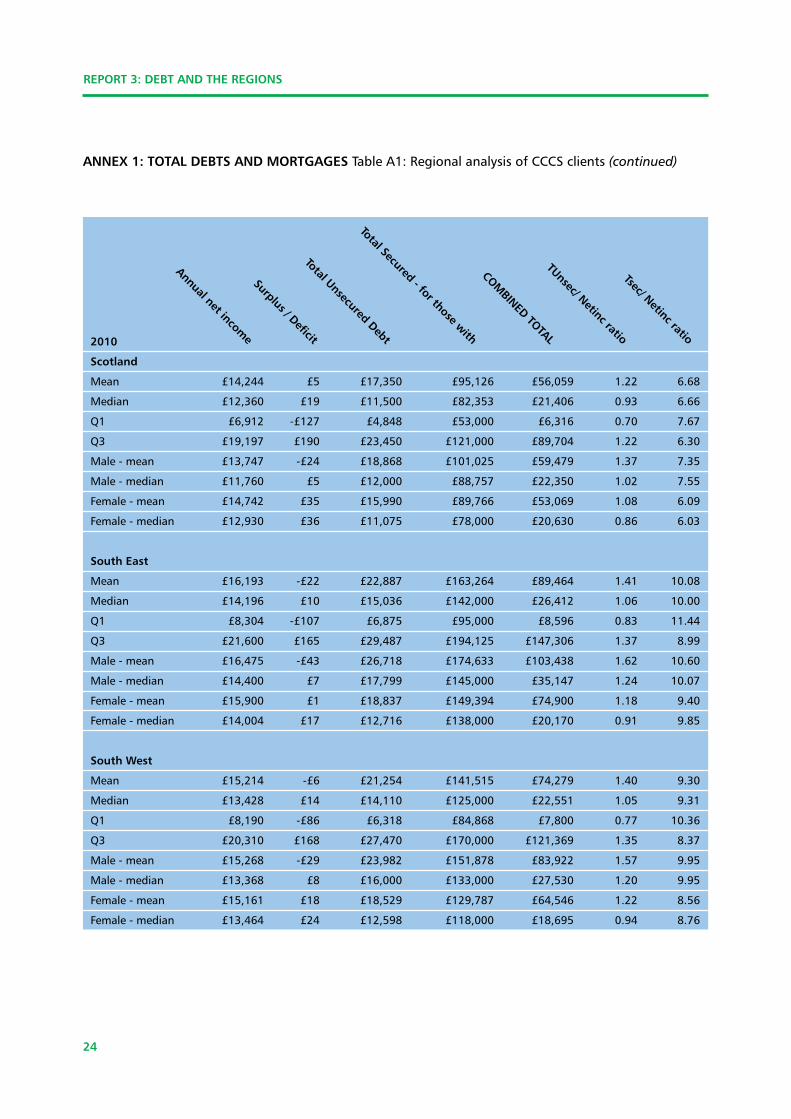
ANNEx 1: TOTAL DEbTS AND MORTGAGES TableA1:RegionalanalysisofCCCSclients
2010
East Anglia
Mean £15,608 -£13 £21,230 £142,593 £78,946 1.36 9.14
Median £13,842 £12 £14,448 £130,000 £24,442 1.04 9.39
Q1 £8,280 -£84 £6,380 £88,000 £7,992 0.77 10.63
Q3 £20,601 £162 £28,060 £178,000 £136,956 1.36 8.64
Male-mean £15,847 -£20 £24,136 £147,968 £88,478 1.52 9.34
Male-median £14,190 £13 £16,977 £134,000 £31,978 1.20 9.44
Female-mean £15,365 -£6 £18,380 £136,030 £69,439 1.20 8.85
Female-median £13,584 £12 £12,377 £127,000 £19,563 0.91 9.35
East Midlands
Mean £14,981 £5 £19,764 £113,146 £69,688 1.32 7.55
Median £13,200 £15 £13,361 £100,000 £28,447 1.01 7.58
Q1 £7,857 -£79 £5,927 £69,105 £7,670 0.75 8.80
Q3 £20,076 £165 £26,967 £140,000 £116,706 1.34 6.97
Male-mean £15,129 -£7 £21,941 £119,148 £76,817 1.45 7.88
Male-median £13,200 £10 £15,387 £105,000 £34,887 1.17 7.95
Female-mean £14,892 £19 £17,606 £106,888 £62,951 1.18 7.18
Female-median £13,200 £21 £11,746 £99,396 £23,258 0.89 7.53
London
Mean £14,703 -£55 £20,528 £180,519 £80,948 1.40 12.28
Median £12,564 £3 £13,636 £164,000 £19,581 1.09 13.05
Q1 £6,768 -£144 £6,001 £105,000 £7,200 0.89 15.51
Q3 £19,944 £132 £26,582 £222,250 £130,000 1.33 11.14
Male-mean £14,927 -£71 £23,633 £190,737 £90,687 1.58 12.78
Male-median £12,600 £2 £15,700 £170,000 £23,025 1.25 13.49
Female-mean £14,502 -£37 £17,514 £170,287 £72,084 1.21 11.74
Female-median £12,480 £5 £11,961 £157,000 £16,829 0.96 12.58
ANNEXES
Annual net income
Surplus / Deficit
Total Unsecured Debt
Total Secured - for those with
COMbINED TOTAL
TUnsec/ Netinc ratio
Tsec/ Netinc ratio

REPORT 3: DEBT AND THE REGIONS
23
2010
North East
Mean £14,271 £24 £18,149 £98,579 £100,386 1.27 6.91
Median £12,684 £20 £12,844 £87,000 £24,713 1.01 6.86
Q1 £7,308 -£54 £5,376 £61,000 £7,330 0.74 8.35
Q3 £19,200 £162 £24,161 £121,000 £174,148 1.26 6.30
Male-mean £13,742 £8 £19,740 £104,411 £107,372 1.44 7.60
Male-median £12,000 £9 £14,100 £92,000 £27,000 1.18 7.67
Female-mean £14,766 £39 £16,613 £93,134 £93,672 1.13 6.31
Female-median £13,176 £30 £11,679 £83,000 £22,986 0.89 6.30
North West
Mean £14,775 £6 £19,088 £107,916 £68,462 1.29 7.30
Median £13,176 £14 £12,871 £94,000 £28,291 0.98 7.13
Q1 £7,776 -£78 £5,537 £62,000 £7,604 0.71 7.97
Q3 £19,668 £160 £24,988 £130,000 £109,652 1.27 6.61
Male-mean £14,587 -£12 £21,516 £115,774 £75,194 1.48 7.94
Male-median £12,954 £8 £14,436 £99,000 £33,000 1.11 7.64
Female-mean £14,921 £27 £16,696 £99,798 £61,521 1.12 6.69
Female-median £13,272 £23 £11,482 £90,000 £23,907 0.87 6.78
Northern Ireland
Mean £16,141 -£108 £19,057 £131,981 £96,288 1.18 8.18
Median £14,088 £50 £13,611 £111,000 £66,241 0.97 7.88
Q1 £8,892 -£60 £6,635 £70,000 £12,495 0.75 7.87
Q3 £21,756 £160 £24,802 £157,940 £145,196 1.14 7.26
Male-mean £15,836 -£242 £21,048 £149,824 £112,463 1.33 9.46
Male-median £13,920 £30 £14,756 £122,000 £83,494 1.06 8.76
Female-mean £16,437 £18 £17,202 £113,880 £81,122 1.05 6.93
Female-median £14,244 £60 £12,567 £100,000 £52,297 0.88 7.02
Annual net income
Surplus / Deficit
Total Unsecured Debt
Total Secured - for those with
COMbINED TOTAL
TUnsec/ Netinc ratio
Tsec/ Netinc ratio
REPORT 3: DEBT AND THE REGIONS
24
2010
Scotland
Mean £14,244 £5 £17,350 £95,126 £56,059 1.22 6.68
Median £12,360 £19 £11,500 £82,353 £21,406 0.93 6.66
Q1 £6,912 -£127 £4,848 £53,000 £6,316 0.70 7.67
Q3 £19,197 £190 £23,450 £121,000 £89,704 1.22 6.30
Male-mean £13,747 -£24 £18,868 £101,025 £59,479 1.37 7.35
Male-median £11,760 £5 £12,000 £88,757 £22,350 1.02 7.55
Female-mean £14,742 £35 £15,990 £89,766 £53,069 1.08 6.09
Female-median £12,930 £36 £11,075 £78,000 £20,630 0.86 6.03
South East
Mean £16,193 -£22 £22,887 £163,264 £89,464 1.41 10.08
Median £14,196 £10 £15,036 £142,000 £26,412 1.06 10.00
Q1 £8,304 -£107 £6,875 £95,000 £8,596 0.83 11.44
Q3 £21,600 £165 £29,487 £194,125 £147,306 1.37 8.99
Male-mean £16,475 -£43 £26,718 £174,633 £103,438 1.62 10.60
Male-median £14,400 £7 £17,799 £145,000 £35,147 1.24 10.07
Female-mean £15,900 £1 £18,837 £149,394 £74,900 1.18 9.40
Female-median £14,004 £17 £12,716 £138,000 £20,170 0.91 9.85
South West
Mean £15,214 -£6 £21,254 £141,515 £74,279 1.40 9.30
Median £13,428 £14 £14,110 £125,000 £22,551 1.05 9.31
Q1 £8,190 -£86 £6,318 £84,868 £7,800 0.77 10.36
Q3 £20,310 £168 £27,470 £170,000 £121,369 1.35 8.37
Male-mean £15,268 -£29 £23,982 £151,878 £83,922 1.57 9.95
Male-median £13,368 £8 £16,000 £133,000 £27,530 1.20 9.95
Female-mean £15,161 £18 £18,529 £129,787 £64,546 1.22 8.56
Female-median £13,464 £24 £12,598 £118,000 £18,695 0.94 8.76
Annual net income
Surplus / Deficit
Total Unsecured Debt
Total Secured - for those with
COMbINED TOTAL
TUnsec/ Netinc ratio
Tsec/ Netinc ratio
ANNEx 1: TOTAL DEbTS AND MORTGAGES TableA1:RegionalanalysisofCCCSclients(continued)

REPORT 3: DEBT AND THE REGIONS
25
2010
Wales
Mean £14,301 £1 £18,837 £103,317 £63,922 1.32 7.22
Median £12,798 £10 £12,476 £90,000 £25,303 0.97 7.03
Q1 £7,632 -£90 £5,657 £59,000 £7,524 0.74 7.73
Q3 £19,167 £155 £24,725 £130,000 £103,569 1.29 6.78
Male-mean £13,905 -£29 £20,926 £113,970 £71,300 1.50 8.20
Male-median £12,384 £4 £13,983 £99,000 £29,712 1.13 7.99
Female-mean £14,718 £32 £16,878 £93,283 £57,336 1.15 6.34
Female-median £13,080 £24 £11,290 £83,000 £21,962 0.86 6.35
West Midlands
Mean £14,413 -£2 £18,544 £111,847 £66,692 1.29 7.76
Median £12,804 £10 £12,290 £98,000 £24,486 0.96 7.65
Q1 £7,284 -£90 £5,500 £68,000 £7,337 0.76 9.34
Q3 £19,404 £149 £24,500 £134,000 £108,006 1.26 6.91
Male-mean £14,234 -£24 £20,809 £117,469 £73,099 1.46 8.25
Male-median £12,504 £6 £14,179 £100,000 £28,970 1.13 8.00
Female-mean £14,558 £21 £16,357 £106,359 £60,389 1.12 7.31
Female-median £13,032 £17 £10,932 £95,000 £20,681 0.84 7.29
Yorkshire
Mean £14,415 £8 £18,499 £104,105 £64,991 1.28 7.22
Median £12,960 £11 £12,456 £92,000 £26,973 0.96 7.10
Q1 £7,548 -£76 £5,574 £63,000 £7,754 0.74 8.35
Q3 £19,368 £152 £24,453 £127,316 £105,700 1.26 6.57
Male-mean £14,134 -£13 £20,331 £108,761 £70,711 1.44 7.69
Male-median £12,564 £6 £13,800 £95,000 £31,084 1.10 7.56
Female-mean £14,731 £29 £16,638 £99,369 £59,450 1.13 6.75
Female-median £13,332 £25 £11,450 £90,000 £23,521 0.86 6.75
Annual net income
Surplus / Deficit
Total Unsecured Debt
Total Secured - for those with
COMbINED TOTAL
TUnsec/ Netinc ratio
Tsec/ Netinc ratio

REPORT 3: DEBT AND THE REGIONS
26
ANNEX 2
Table A2: CCCS clients unsecured debt regional comparison
Annual net income Total Unsecured Debt Unsecured/ income ratio
East Anglia
Mean £15,600 £21,230 1.4
Median £13,840 £14,450 1.0
East Midlands
Mean £14,980 £19,760 1.3
Median £13,200 £13,360 1.0
London
Mean £14,700 £20,530 1.4
Median £12,560 £13,640 1.1
North East
Mean £14,270 £18,150 1.3
Median £12,680 £12,840 1.0
North West
Mean £14,780 £19,090 1.3
Median £13,180 £12,870 1.0
Northern Ireland
Mean £16,140 £19,060 1.2
Median £14,090 £13,610 1.0
Scotland
Mean £14,240 £17,350 1.2
Median £12,360 £11,500 0.9
South East
Mean £16,190 £22,890 1.4
Median £14,200 £15,040 1.1
South West
Mean £15,210 £21,250 1.4
Median £13,430 £14,110 1.1

REPORT 3: DEBT AND THE REGIONS
27
Annual net income Total Unsecured Debt Unsecured/ income ratio
Wales
Mean £14,300 £18,840 1.3
Median £12,800 £12,480 1.0
West Midlands
Mean £14,410 £18,540 1.3
Median £12,800 £12,290 1.0
Yorkshire
Mean £14,420 £18,500 1.3
Median £12,960 £12,460 1.0

REPORT 3: DEBT AND THE REGIONS
28
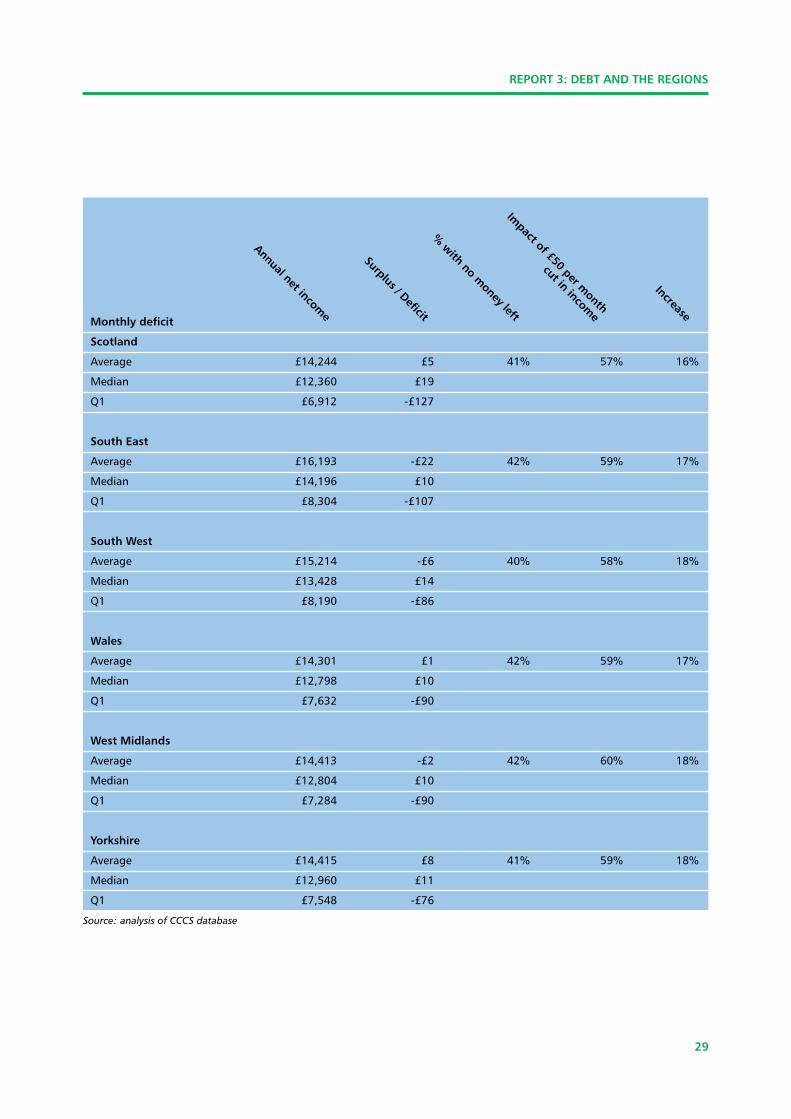
ANNEX 3: ANALYSIS OF CCCS CLIENTS FINANCIAL POSITION
Monthly deficit
East Anglia
Average £15,608 -£13 41% 59% 18%
Median £13,842 £12
Q1 £8,280 -£84
East Midlands
Average £14,981 £5 40% 57% 17%
Median £13,200 £15
Q1 £7,857 -£79
London
Average £14,703 -£55 47% 64% 17%
Median £12,564 £3
Q1 £6,768 -£144
North East
Average £14,271 £24 39% 57% 18%
Median £12,684 £20
Q1 £7,308 -£54
North West
Average £14,775 £6 41% 58% 17%
Median £13,176 £14
Q1 £7,776 -£78
Northern Ireland
Average £16,141 -£108 32% 51% 19%
Median £14,088 £50
Q1 £8,892 -£60
Annual net income
Surplus / Deficit
% w
ith no money left
Impact of £50 per m
onth
cut in income
Increase
REPORT 3: DEBT AND THE REGIONS
29
Monthly deficit
Scotland
Average £14,244 £5 41% 57% 16%
Median £12,360 £19
Q1 £6,912 -£127
South East
Average £16,193 -£22 42% 59% 17%
Median £14,196 £10
Q1 £8,304 -£107
South West
Average £15,214 -£6 40% 58% 18%
Median £13,428 £14
Q1 £8,190 -£86
Wales
Average £14,301 £1 42% 59% 17%
Median £12,798 £10
Q1 £7,632 -£90
West Midlands
Average £14,413 -£2 42% 60% 18%
Median £12,804 £10
Q1 £7,284 -£90
Yorkshire
Average £14,415 £8 41% 59% 18%
Median £12,960 £11
Q1 £7,548 -£76
Source: analysis of CCCS database
Annual net income
Surplus / Deficit
% w
ith no money left
Impact of £50 per m
onth
cut in income
Increase

REPORT 3: DEBT AND THE REGIONS
30
ANNEx 4: MASTER TAbLE
Region
East Anglia 8 10 9 5 10 3 3 7 7 3 11 9 10 8 10
East Midlands 5 8 5 6 3 10 2 2 5 9 5 6 6 8 10
London 10 9 8 1 1 1 1 1 1 1 2 8 9 11 9
North East 1 3 1 9 4 4 10 2 2 9 1 1 3 3 3
North West 3 2 4 7 2 2 7 2 3 7 3 1 4 5 5
Northern Ireland 7 1 n/a n/a n/a n/a n/a n/a n/a 12 n/a n/a 1 1 1
Scotland 9 7 7 11 11 6 8 11 5 9 8 9 5 3 3
South East 12 11 10 2 9 7 3 8 9 3 7 3 12 11 12
South West 11 12 11 4 6 8 3 5 10 7 9 6 10 8 8
Wales 2 5 3 10 8 12 11 8 11 3 9 11 6 2 2
West Midlands 6 6 6 3 5 8 6 6 7 2 4 3 2 5 7
Yorkshire 4 3 2 8 7 5 9 10 4 3 5 5 6 5 6
MortgageReposs.
MortgagesPaym
entProblems
Mortgageprisoners
AnydebtheavyBurden
Anydebtarrears
>50%ofincom
eonrepayments
Unsecuredheavyburden
Unsecureddebtarrears
>25%unsecuredrepaym
ents
CCCS£50monthincom
ereduction
Debtworries
Struggletopayday
H’holdsavings
Economicim
pacts
Joblosses

The Financial Inclusion Centre6th Floor, Lynton House, 7-12 Tavistock Square, London WC1H 9LT
Tel: 0207 391 4586, www.inclusioncentre.org.ukA not-for-profit company limited by guarantee, Reg. No. 6272007