Embed Size (px)
Citation preview

Printed: 2/1/2018
Page 1
ANALYSIS OF DEBT OFNORTH CAROLINA COUNTIES AT 6-30-2017
DEPARTMENT OF STATE TREASURERDIVISION OF STATE AND LOCAL GOVERNMENT FINANCE
Number of Units Number of Units Number of Units Ratios of Total Outstanding General Obligation Debt, Authorized andwith Outstanding with Authorized and with Outstanding Unissued General Obligation Debt and Installment Purchases
General Obligation Unissued General Installment Purchase (Excluding All Enterprise Debt)Debt (Excluding Obligation Debt (Excluding Debt (Excluding Appraised Property Valuation (%) Per Capita ($)
Counties (Population) Enterprise Debt) Enterprise Debt) Enterprise Debt) Low Average High Low Average High
250,000 and Over 7 4 7 0.426 1.610 2.682 306 1,812 2,442
100,000 to 249,999 15 9 20 0.352 1.231 2.656 172 1,177 2,096
50,000 to 99,999 17 3 27 0.265 0.776 1.734 194 716 1,991
25,000 to 49,999 10 2 21 0.035 0.487 1.540 81 598 2,504
10,000 to 24,999 5 0 21 0.007 0.389 1.929 3 406 1,269
Under 10,000 1 0 3 0.183 0.323 0.510 258 482 652
All Counties 55 18 99 0.007 1.211 2.682 3 1,258 2,504
Page 2
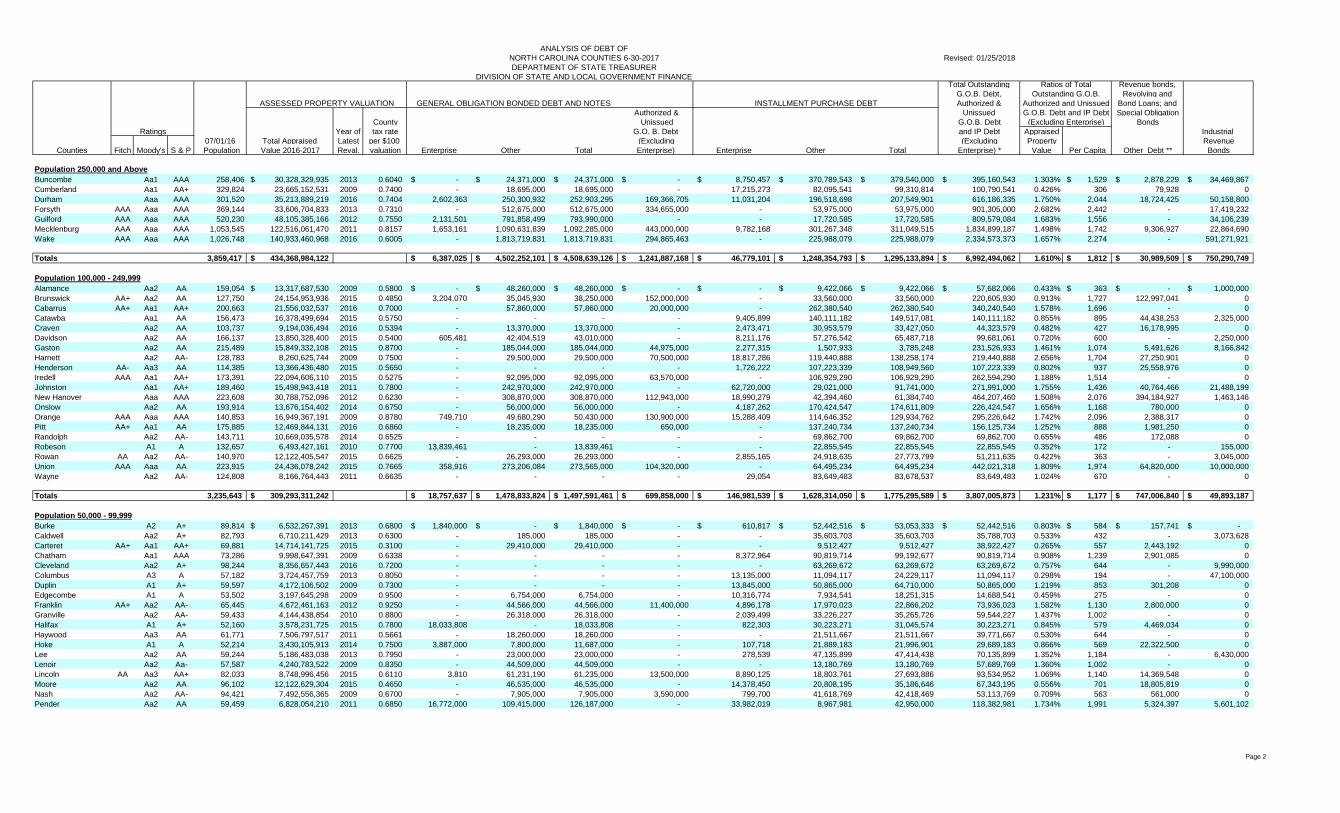
ANALYSIS OF DEBT OFNORTH CAROLINA COUNTIES 6-30-2017 Revised: 01/25/2018DEPARTMENT OF STATE TREASURER
DIVISION OF STATE AND LOCAL GOVERNMENT FINANCETotal Outstanding Ratios of Total Revenue bonds,
G.O.B. Debt, Outstanding G.O.B. Revolving and ASSESSED PROPERTY VALUATION GENERAL OBLIGATION BONDED DEBT AND NOTES INSTALLMENT PURCHASE DEBT Authorized & Authorized and Unissued Bond Loans; and
Authorized & Unissued G.O.B. Debt and IP Debt Special ObligationCounty Unissued G.O.B. Debt (Excluding Enterprise) Bonds
Ratings Year of tax rate G.O. B. Debt and IP Debt Appraised Industrial 07/01/16 Total Appraised Latest per $100 (Excluding (Excluding Property Revenue
Counties Fitch Moody's S & P Population Value 2016-2017 Reval. valuation Enterprise Other Total Enterprise) Enterprise Other Total Enterprise) * Value Per Capita Other Debt ** Bonds
Population 250,000 and AboveBuncombe Aa1 AAA 258,406 30,328,329,935$ 2013 0.6040 -$ 24,371,000$ 24,371,000$ -$ 8,750,457$ 370,789,543$ 379,540,000$ 395,160,543$ 1.303% 1,529$ 2,878,229$ 34,469,867$ Cumberland Aa1 AA+ 329,824 23,665,152,531 2009 0.7400 - 18,695,000 18,695,000 - 17,215,273 82,095,541 99,310,814 100,790,541 0.426% 306 79,928 0Durham Aaa AAA 301,520 35,213,889,219 2016 0.7404 2,602,363 250,300,932 252,903,295 169,366,705 11,031,204 196,518,698 207,549,901 616,186,335 1.750% 2,044 18,724,425 50,158,800Forsyth AAA Aaa AAA 369,144 33,606,704,833 2013 0.7310 - 512,675,000 512,675,000 334,655,000 - 53,975,000 53,975,000 901,305,000 2.682% 2,442 - 17,419,232Guilford AAA Aaa AAA 520,230 48,105,385,166 2012 0.7550 2,131,501 791,858,499 793,990,000 - - 17,720,585 17,720,585 809,579,084 1.683% 1,556 - 34,106,239Mecklenburg AAA Aaa AAA 1,053,545 122,516,061,470 2011 0.8157 1,653,161 1,090,631,839 1,092,285,000 443,000,000 9,782,168 301,267,348 311,049,515 1,834,899,187 1.498% 1,742 9,306,927 22,864,690Wake AAA Aaa AAA 1,026,748 140,933,460,968 2016 0.6005 - 1,813,719,831 1,813,719,831 294,865,463 - 225,988,079 225,988,079 2,334,573,373 1.657% 2,274 - 591,271,921
Totals 3,859,417 434,368,984,122$ 6,387,025$ 4,502,252,101$ 4,508,639,126$ 1,241,887,168$ 46,779,101$ 1,248,354,793$ 1,295,133,894$ 6,992,494,062$ 1.610% 1,812$ 30,989,509$ 750,290,749$
Population 100,000 - 249,999Alamance Aa2 AA 159,054 13,317,687,530$ 2009 0.5800 -$ 48,260,000$ 48,260,000$ -$ -$ 9,422,066$ 9,422,066$ 57,682,066$ 0.433% 363$ -$ 1,000,000$ Brunswick AA+ Aa2 AA 127,750 24,154,953,936 2015 0.4850 3,204,070 35,045,930 38,250,000 152,000,000 - 33,560,000 33,560,000 220,605,930 0.913% 1,727 122,997,041 0Cabarrus AA+ Aa1 AA+ 200,663 21,556,032,537 2016 0.7000 - 57,860,000 57,860,000 20,000,000 - 262,380,540 262,380,540 340,240,540 1.578% 1,696 - 0Catawba Aa1 AA 156,473 16,378,499,694 2015 0.5750 - - - - 9,405,899 140,111,182 149,517,081 140,111,182 0.855% 895 44,438,253 2,325,000Craven Aa2 AA 103,737 9,194,036,494 2016 0.5394 - 13,370,000 13,370,000 - 2,473,471 30,953,579 33,427,050 44,323,579 0.482% 427 16,178,995 0Davidson Aa2 AA 166,137 13,850,328,400 2015 0.5400 605,481 42,404,519 43,010,000 - 8,211,176 57,276,542 65,487,718 99,681,061 0.720% 600 - 2,250,000Gaston Aa2 AA 215,489 15,849,332,108 2015 0.8700 - 185,044,000 185,044,000 44,975,000 2,277,315 1,507,933 3,785,248 231,526,933 1.461% 1,074 5,491,626 8,166,842Harnett Aa2 AA- 128,783 8,260,625,744 2009 0.7500 - 29,500,000 29,500,000 70,500,000 18,817,286 119,440,888 138,258,174 219,440,888 2.656% 1,704 27,250,901 0Henderson AA- Aa3 AA 114,385 13,366,436,480 2015 0.5650 - - - - 1,726,222 107,223,339 108,949,560 107,223,339 0.802% 937 25,558,976 0Iredell AAA Aa1 AA+ 173,391 22,094,606,110 2015 0.5275 - 92,095,000 92,095,000 63,570,000 - 106,929,290 106,929,290 262,594,290 1.188% 1,514 - 0Johnston Aa1 AA+ 189,460 15,498,943,418 2011 0.7800 - 242,970,000 242,970,000 - 62,720,000 29,021,000 91,741,000 271,991,000 1.755% 1,436 40,764,466 21,488,199New Hanover Aaa AAA 223,608 30,788,752,096 2012 0.6230 - 308,870,000 308,870,000 112,943,000 18,990,279 42,394,460 61,384,740 464,207,460 1.508% 2,076 394,184,927 1,463,146Onslow Aa2 AA 193,914 13,676,154,402 2014 0.6750 - 56,000,000 56,000,000 - 4,187,262 170,424,547 174,611,809 226,424,547 1.656% 1,168 780,000 0Orange AAA Aaa AAA 140,853 16,949,367,191 2009 0.8780 749,710 49,680,290 50,430,000 130,900,000 15,288,409 114,646,352 129,934,762 295,226,642 1.742% 2,096 2,388,317 0Pitt AA+ Aa1 AA 175,885 12,469,844,131 2016 0.6860 - 18,235,000 18,235,000 650,000 - 137,240,734 137,240,734 156,125,734 1.252% 888 1,981,250 0Randolph Aa2 AA- 143,711 10,669,035,578 2014 0.6525 - - - - - 69,862,700 69,862,700 69,862,700 0.655% 486 172,088 0Robeson A1 A 132,657 6,493,427,161 2010 0.7700 13,839,461 - 13,839,461 - - 22,855,545 22,855,545 22,855,545 0.352% 172 - 155,000Rowan AA Aa2 AA- 140,970 12,122,405,547 2015 0.6625 - 26,293,000 26,293,000 - 2,855,165 24,918,635 27,773,799 51,211,635 0.422% 363 - 3,045,000Union AAA Aaa AA 223,915 24,436,078,242 2015 0.7665 358,916 273,206,084 273,565,000 104,320,000 - 64,495,234 64,495,234 442,021,318 1.809% 1,974 64,820,000 10,000,000Wayne Aa2 AA- 124,808 8,166,764,443 2011 0.6635 - - - - 29,054 83,649,483 83,678,537 83,649,483 1.024% 670 - 0
Totals 3,235,643 309,293,311,242$ 18,757,637$ 1,478,833,824$ 1,497,591,461$ 699,858,000$ 146,981,539$ 1,628,314,050$ 1,775,295,589$ 3,807,005,873$ 1.231% 1,177$ 747,006,840$ 49,893,187$
Population 50,000 - 99,999Burke A2 A+ 89,814 6,532,267,391$ 2013 0.6800 1,840,000$ -$ 1,840,000$ -$ 610,817$ 52,442,516$ 53,053,333$ 52,442,516$ 0.803% 584$ 157,741$ -$ Caldwell Aa2 A+ 82,793 6,710,211,429 2013 0.6300 - 185,000 185,000 - - 35,603,703 35,603,703 35,788,703 0.533% 432 - 3,073,628Carteret AA+ Aa1 AA+ 69,881 14,714,141,725 2015 0.3100 - 29,410,000 29,410,000 - - 9,512,427 9,512,427 38,922,427 0.265% 557 2,443,192 0Chatham Aa1 AAA 73,286 9,998,647,391 2009 0.6338 - - - - 8,372,964 90,819,714 99,192,677 90,819,714 0.908% 1,239 2,901,085 0Cleveland Aa2 A+ 98,244 8,356,657,443 2016 0.7200 - - - - - 63,269,672 63,269,672 63,269,672 0.757% 644 - 9,990,000Columbus A3 A 57,182 3,724,457,759 2013 0.8050 - - - - 13,135,000 11,094,117 24,229,117 11,094,117 0.298% 194 - 47,100,000Duplin A1 A+ 59,597 4,172,106,502 2009 0.7300 - - - - 13,845,000 50,865,000 64,710,000 50,865,000 1.219% 853 301,208 0Edgecombe A1 A 53,502 3,197,645,298 2009 0.9500 - 6,754,000 6,754,000 - 10,316,774 7,934,541 18,251,315 14,688,541 0.459% 275 - 0Franklin AA+ Aa2 AA- 65,445 4,672,461,163 2012 0.9250 - 44,566,000 44,566,000 11,400,000 4,896,178 17,970,023 22,866,202 73,936,023 1.582% 1,130 2,800,000 0Granville Aa2 AA- 59,433 4,144,438,854 2010 0.8800 - 26,318,000 26,318,000 - 2,039,499 33,226,227 35,265,726 59,544,227 1.437% 1,002 - 0Halifax A1 A+ 52,160 3,578,231,725 2015 0.7800 18,033,808 - 18,033,808 - 822,303 30,223,271 31,045,574 30,223,271 0.845% 579 4,469,034 0Haywood Aa3 AA 61,771 7,506,797,517 2011 0.5661 - 18,260,000 18,260,000 - - 21,511,667 21,511,667 39,771,667 0.530% 644 - 0Hoke A1 A 52,214 3,430,105,913 2014 0.7500 3,887,000 7,800,000 11,687,000 - 107,718 21,889,183 21,996,901 29,689,183 0.866% 569 22,322,500 0Lee Aa2 AA 59,244 5,186,483,038 2013 0.7950 - 23,000,000 23,000,000 - 278,539 47,135,899 47,414,438 70,135,899 1.352% 1,184 - 6,430,000Lenoir Aa2 Aa- 57,587 4,240,783,522 2009 0.8350 - 44,509,000 44,509,000 - - 13,180,769 13,180,769 57,689,769 1.360% 1,002 - 0Lincoln AA Aa3 AA+ 82,033 8,748,996,456 2015 0.6110 3,810 61,231,190 61,235,000 13,500,000 8,890,125 18,803,761 27,693,886 93,534,952 1.069% 1,140 14,369,548 0Moore Aa2 AA 96,102 12,122,629,304 2015 0.4650 - 46,535,000 46,535,000 - 14,378,450 20,808,195 35,186,646 67,343,195 0.556% 701 18,805,819 0Nash Aa2 AA- 94,421 7,492,556,365 2009 0.6700 - 7,905,000 7,905,000 3,590,000 799,700 41,618,769 42,418,469 53,113,769 0.709% 563 561,000 0Pender Aa2 AA 59,459 6,828,054,210 2011 0.6850 16,772,000 109,415,000 126,187,000 - 33,982,019 8,967,981 42,950,000 118,382,981 1.734% 1,991 5,324,397 5,601,102
Page 3
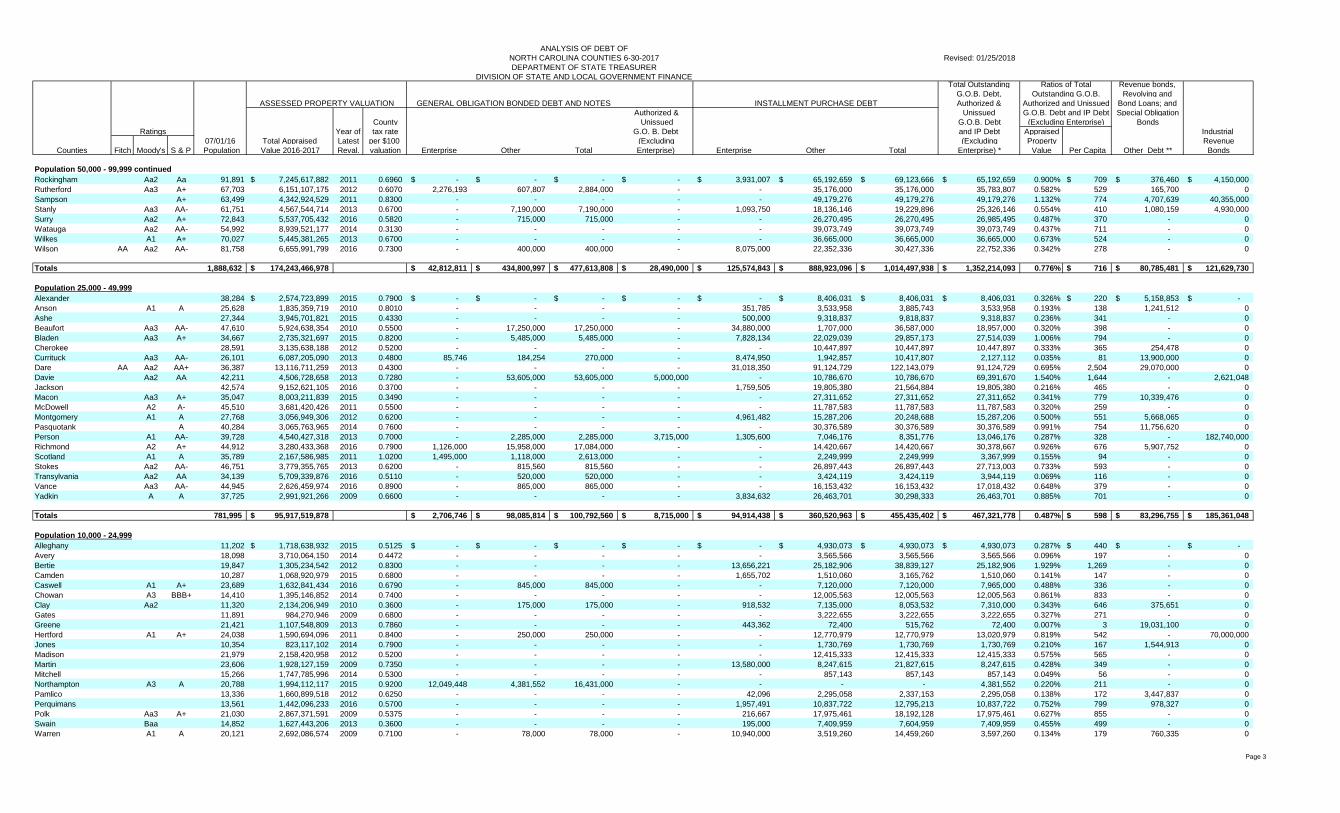
ANALYSIS OF DEBT OFNORTH CAROLINA COUNTIES 6-30-2017 Revised: 01/25/2018DEPARTMENT OF STATE TREASURER
DIVISION OF STATE AND LOCAL GOVERNMENT FINANCETotal Outstanding Ratios of Total Revenue bonds,
G.O.B. Debt, Outstanding G.O.B. Revolving and ASSESSED PROPERTY VALUATION GENERAL OBLIGATION BONDED DEBT AND NOTES INSTALLMENT PURCHASE DEBT Authorized & Authorized and Unissued Bond Loans; and
Authorized & Unissued G.O.B. Debt and IP Debt Special ObligationCounty Unissued G.O.B. Debt (Excluding Enterprise) Bonds
Ratings Year of tax rate G.O. B. Debt and IP Debt Appraised Industrial 07/01/16 Total Appraised Latest per $100 (Excluding (Excluding Property Revenue
Counties Fitch Moody's S & P Population Value 2016-2017 Reval. valuation Enterprise Other Total Enterprise) Enterprise Other Total Enterprise) * Value Per Capita Other Debt ** Bonds
Population 50,000 - 99,999 continuedRockingham Aa2 Aa 91,891 7,245,617,882$ 2011 0.6960 -$ -$ -$ -$ 3,931,007$ 65,192,659$ 69,123,666$ 65,192,659$ 0.900% 709$ 376,460$ 4,150,000$ Rutherford Aa3 A+ 67,703 6,151,107,175 2012 0.6070 2,276,193 607,807 2,884,000 - - 35,176,000 35,176,000 35,783,807 0.582% 529 165,700 0Sampson A+ 63,499 4,342,924,529 2011 0.8300 - - - - - 49,179,276 49,179,276 49,179,276 1.132% 774 4,707,639 40,355,000Stanly Aa3 AA- 61,751 4,567,544,714 2013 0.6700 - 7,190,000 7,190,000 - 1,093,750 18,136,146 19,229,896 25,326,146 0.554% 410 1,080,159 4,930,000Surry Aa2 A+ 72,843 5,537,705,432 2016 0.5820 - 715,000 715,000 - - 26,270,495 26,270,495 26,985,495 0.487% 370 - 0Watauga Aa2 AA- 54,992 8,939,521,177 2014 0.3130 - - - - - 39,073,749 39,073,749 39,073,749 0.437% 711 - 0Wilkes A1 A+ 70,027 5,445,381,265 2013 0.6700 - - - - - 36,665,000 36,665,000 36,665,000 0.673% 524 - 0Wilson AA Aa2 AA- 81,758 6,655,991,799 2016 0.7300 - 400,000 400,000 - 8,075,000 22,352,336 30,427,336 22,752,336 0.342% 278 - 0
Totals 1,888,632 174,243,466,978$ 42,812,811$ 434,800,997$ 477,613,808$ 28,490,000$ 125,574,843$ 888,923,096$ 1,014,497,938$ 1,352,214,093$ 0.776% 716$ 80,785,481$ 121,629,730$
Population 25,000 - 49,999Alexander 38,284 2,574,723,899$ 2015 0.7900 -$ -$ -$ -$ -$ 8,406,031$ 8,406,031$ 8,406,031$ 0.326% 220$ 5,158,853$ -$ Anson A1 A 25,628 1,835,359,719 2010 0.8010 - - - - 351,785 3,533,958 3,885,743 3,533,958 0.193% 138 1,241,512 0Ashe 27,344 3,945,701,821 2015 0.4330 - - - - 500,000 9,318,837 9,818,837 9,318,837 0.236% 341 - 0Beaufort Aa3 AA- 47,610 5,924,638,354 2010 0.5500 - 17,250,000 17,250,000 - 34,880,000 1,707,000 36,587,000 18,957,000 0.320% 398 - 0Bladen Aa3 A+ 34,667 2,735,321,697 2015 0.8200 - 5,485,000 5,485,000 - 7,828,134 22,029,039 29,857,173 27,514,039 1.006% 794 - 0Cherokee 28,591 3,135,638,188 2012 0.5200 - - - - - 10,447,897 10,447,897 10,447,897 0.333% 365 254,478 0Currituck Aa3 AA- 26,101 6,087,205,090 2013 0.4800 85,746 184,254 270,000 - 8,474,950 1,942,857 10,417,807 2,127,112 0.035% 81 13,900,000 0Dare AA Aa2 AA+ 36,387 13,116,711,259 2013 0.4300 - - - - 31,018,350 91,124,729 122,143,079 91,124,729 0.695% 2,504 29,070,000 0Davie Aa2 AA 42,211 4,506,728,658 2013 0.7280 - 53,605,000 53,605,000 5,000,000 - 10,786,670 10,786,670 69,391,670 1.540% 1,644 - 2,621,048Jackson 42,574 9,152,621,105 2016 0.3700 - - - - 1,759,505 19,805,380 21,564,884 19,805,380 0.216% 465 - 0Macon Aa3 A+ 35,047 8,003,211,839 2015 0.3490 - - - - - 27,311,652 27,311,652 27,311,652 0.341% 779 10,339,476 0McDowell A2 A- 45,510 3,681,420,426 2011 0.5500 - - - - - 11,787,583 11,787,583 11,787,583 0.320% 259 - 0Montgomery A1 A 27,768 3,056,949,306 2012 0.6200 - - - - 4,961,482 15,287,206 20,248,688 15,287,206 0.500% 551 5,668,065 0Pasquotank A 40,284 3,065,763,965 2014 0.7600 - - - - - 30,376,589 30,376,589 30,376,589 0.991% 754 11,756,620 0Person A1 AA- 39,728 4,540,427,318 2013 0.7000 - 2,285,000 2,285,000 3,715,000 1,305,600 7,046,176 8,351,776 13,046,176 0.287% 328 - 182,740,000Richmond A2 A+ 44,912 3,280,433,368 2016 0.7900 1,126,000 15,958,000 17,084,000 - - 14,420,667 14,420,667 30,378,667 0.926% 676 5,907,752 0Scotland A1 A 35,789 2,167,586,985 2011 1.0200 1,495,000 1,118,000 2,613,000 - - 2,249,999 2,249,999 3,367,999 0.155% 94 - 0Stokes Aa2 AA- 46,751 3,779,355,765 2013 0.6200 - 815,560 815,560 - - 26,897,443 26,897,443 27,713,003 0.733% 593 - 0Transylvania Aa2 AA 34,139 5,709,339,876 2016 0.5110 - 520,000 520,000 - - 3,424,119 3,424,119 3,944,119 0.069% 116 - 0Vance Aa3 AA- 44,945 2,626,459,974 2016 0.8900 - 865,000 865,000 - - 16,153,432 16,153,432 17,018,432 0.648% 379 - 0Yadkin A A 37,725 2,991,921,266 2009 0.6600 - - - - 3,834,632 26,463,701 30,298,333 26,463,701 0.885% 701 - 0
Totals 781,995 95,917,519,878$ 2,706,746$ 98,085,814$ 100,792,560$ 8,715,000$ 94,914,438$ 360,520,963$ 455,435,402$ 467,321,778$ 0.487% 598$ 83,296,755$ 185,361,048$
Population 10,000 - 24,999Alleghany 11,202 1,718,638,932$ 2015 0.5125 -$ -$ -$ -$ -$ 4,930,073$ 4,930,073$ 4,930,073$ 0.287% 440$ -$ -$ Avery 18,098 3,710,064,150 2014 0.4472 - - - - - 3,565,566 3,565,566 3,565,566 0.096% 197 - 0Bertie 19,847 1,305,234,542 2012 0.8300 - - - - 13,656,221 25,182,906 38,839,127 25,182,906 1.929% 1,269 - 0Camden 10,287 1,068,920,979 2015 0.6800 - - - - 1,655,702 1,510,060 3,165,762 1,510,060 0.141% 147 - 0Caswell A1 A+ 23,689 1,632,841,434 2016 0.6790 - 845,000 845,000 - - 7,120,000 7,120,000 7,965,000 0.488% 336 - 0Chowan A3 BBB+ 14,410 1,395,146,852 2014 0.7400 - - - - - 12,005,563 12,005,563 12,005,563 0.861% 833 - 0Clay Aa2 11,320 2,134,206,949 2010 0.3600 - 175,000 175,000 - 918,532 7,135,000 8,053,532 7,310,000 0.343% 646 375,651 0Gates 11,891 984,270,946 2009 0.6800 - - - - - 3,222,655 3,222,655 3,222,655 0.327% 271 - 0Greene 21,421 1,107,548,809 2013 0.7860 - - - - 443,362 72,400 515,762 72,400 0.007% 3 19,031,100 0Hertford A1 A+ 24,038 1,590,694,096 2011 0.8400 - 250,000 250,000 - - 12,770,979 12,770,979 13,020,979 0.819% 542 - 70,000,000Jones 10,354 823,117,102 2014 0.7900 - - - - - 1,730,769 1,730,769 1,730,769 0.210% 167 1,544,913 0Madison 21,979 2,158,420,958 2012 0.5200 - - - - - 12,415,333 12,415,333 12,415,333 0.575% 565 - 0Martin 23,606 1,928,127,159 2009 0.7350 - - - - 13,580,000 8,247,615 21,827,615 8,247,615 0.428% 349 - 0Mitchell 15,266 1,747,785,996 2014 0.5300 - - - - - 857,143 857,143 857,143 0.049% 56 - 0Northampton A3 A 20,788 1,994,112,117 2015 0.9200 12,049,448 4,381,552 16,431,000 - - - - 4,381,552 0.220% 211 - 0Pamlico 13,336 1,660,899,518 2012 0.6250 - - - - 42,096 2,295,058 2,337,153 2,295,058 0.138% 172 3,447,837 0Perquimans 13,561 1,442,096,233 2016 0.5700 - - - - 1,957,491 10,837,722 12,795,213 10,837,722 0.752% 799 978,327 0Polk Aa3 A+ 21,030 2,867,371,591 2009 0.5375 - - - - 216,667 17,975,461 18,192,128 17,975,461 0.627% 855 - 0Swain Baa 14,852 1,627,443,206 2013 0.3600 - - - - 195,000 7,409,959 7,604,959 7,409,959 0.455% 499 - 0Warren A1 A 20,121 2,692,086,574 2009 0.7100 - 78,000 78,000 - 10,940,000 3,519,260 14,459,260 3,597,260 0.134% 179 760,335 0
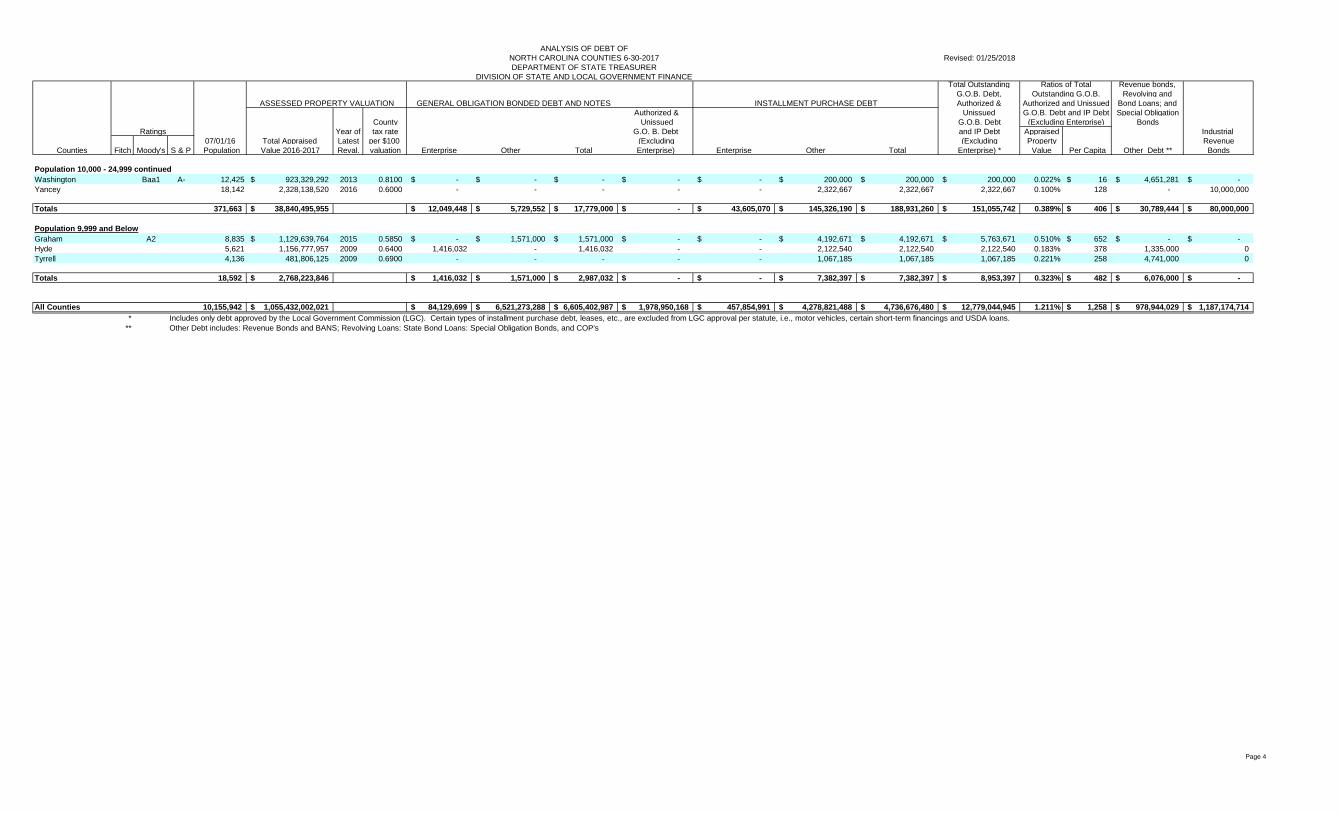
Page 4
ANALYSIS OF DEBT OFNORTH CAROLINA COUNTIES 6-30-2017 Revised: 01/25/2018DEPARTMENT OF STATE TREASURER
DIVISION OF STATE AND LOCAL GOVERNMENT FINANCETotal Outstanding Ratios of Total Revenue bonds,
G.O.B. Debt, Outstanding G.O.B. Revolving and ASSESSED PROPERTY VALUATION GENERAL OBLIGATION BONDED DEBT AND NOTES INSTALLMENT PURCHASE DEBT Authorized & Authorized and Unissued Bond Loans; and
Authorized & Unissued G.O.B. Debt and IP Debt Special ObligationCounty Unissued G.O.B. Debt (Excluding Enterprise) Bonds
Ratings Year of tax rate G.O. B. Debt and IP Debt Appraised Industrial 07/01/16 Total Appraised Latest per $100 (Excluding (Excluding Property Revenue
Counties Fitch Moody's S & P Population Value 2016-2017 Reval. valuation Enterprise Other Total Enterprise) Enterprise Other Total Enterprise) * Value Per Capita Other Debt ** Bonds
Population 10,000 - 24,999 continuedWashington Baa1 A- 12,425 923,329,292$ 2013 0.8100 -$ -$ -$ -$ -$ 200,000$ 200,000$ 200,000$ 0.022% 16$ 4,651,281$ -$ Yancey 18,142 2,328,138,520 2016 0.6000 - - - - - 2,322,667 2,322,667 2,322,667 0.100% 128 - 10,000,000
Totals 371,663 38,840,495,955$ 12,049,448$ 5,729,552$ 17,779,000$ -$ 43,605,070$ 145,326,190$ 188,931,260$ 151,055,742$ 0.389% 406$ 30,789,444$ 80,000,000$
Population 9,999 and BelowGraham A2 8,835 1,129,639,764$ 2015 0.5850 -$ 1,571,000$ 1,571,000$ -$ -$ 4,192,671$ 4,192,671$ 5,763,671$ 0.510% 652$ -$ -$ Hyde 5,621 1,156,777,957 2009 0.6400 1,416,032 - 1,416,032 - - 2,122,540 2,122,540 2,122,540 0.183% 378 1,335,000 0Tyrrell 4,136 481,806,125 2009 0.6900 - - - - - 1,067,185 1,067,185 1,067,185 0.221% 258 4,741,000 0
Totals 18,592 2,768,223,846$ 1,416,032$ 1,571,000$ 2,987,032$ -$ -$ 7,382,397$ 7,382,397$ 8,953,397$ 0.323% 482$ 6,076,000$ -$
All Counties 10,155,942 1,055,432,002,021$ 84,129,699$ 6,521,273,288$ 6,605,402,987$ 1,978,950,168$ 457,854,991$ 4,278,821,488$ 4,736,676,480$ 12,779,044,945$ 1.211% 1,258$ 978,944,029$ 1,187,174,714$ * Includes only debt approved by the Local Government Commission (LGC). Certain types of installment purchase debt, leases, etc., are excluded from LGC approval per statute, i.e., motor vehicles, certain short-term financings and USDA loans.
** Other Debt includes: Revenue Bonds and BANS; Revolving Loans: State Bond Loans: Special Obligation Bonds, and COP's
Printed: 2/1/2018
Page 5
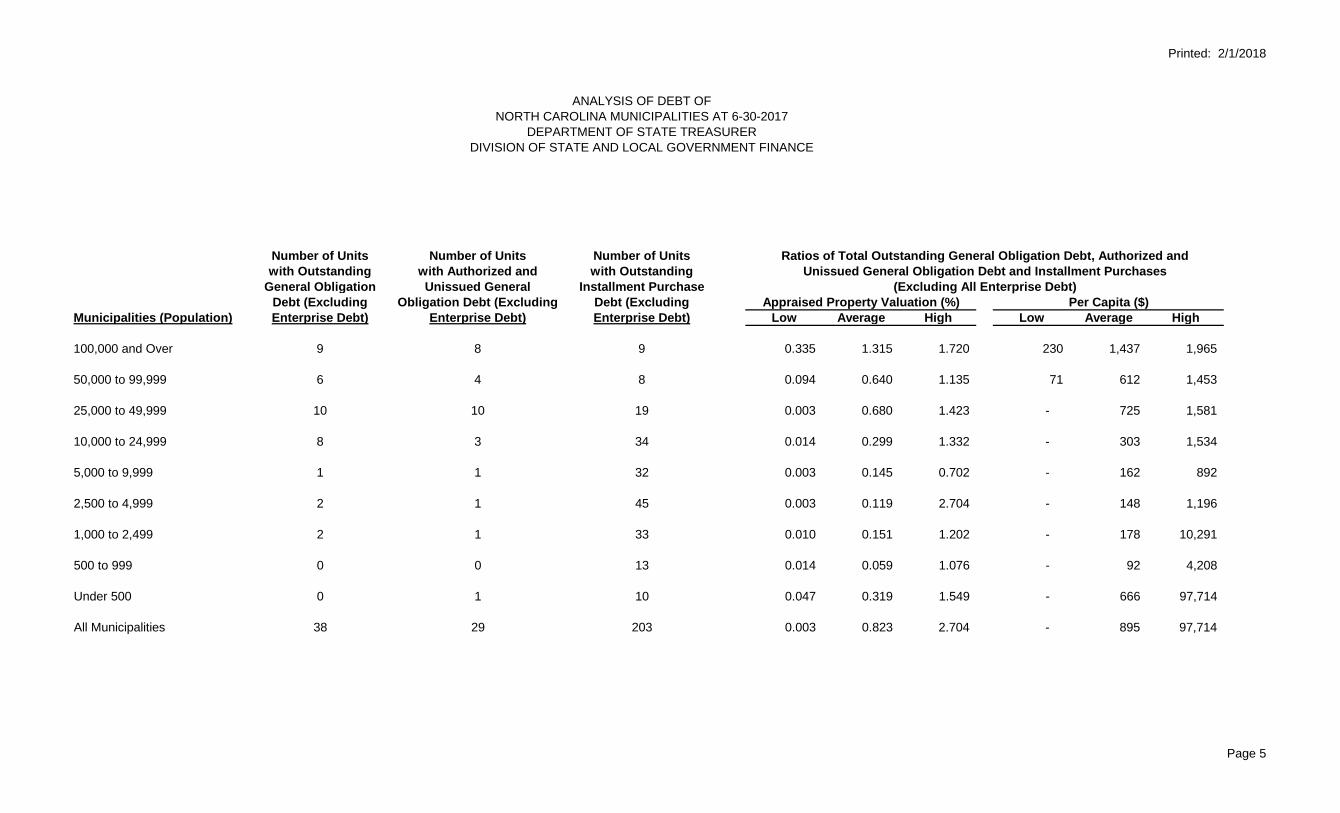
ANALYSIS OF DEBT OFNORTH CAROLINA MUNICIPALITIES AT 6-30-2017
DEPARTMENT OF STATE TREASURERDIVISION OF STATE AND LOCAL GOVERNMENT FINANCE
Number of Units Number of Units Number of Unitswith Outstanding with Authorized and with Outstanding
General Obligation Unissued General Installment PurchaseDebt (Excluding Obligation Debt (Excluding Debt (Excluding
Municipalities (Population) Enterprise Debt) Enterprise Debt) Enterprise Debt) Low Average High Low Average High
100,000 and Over 9 8 9 0.335 1.315 1.720 230 1,437 1,965
50,000 to 99,999 6 4 8 0.094 0.640 1.135 71 612 1,453
25,000 to 49,999 10 10 19 0.003 0.680 1.423 - 725 1,581
10,000 to 24,999 8 3 34 0.014 0.299 1.332 - 303 1,534
5,000 to 9,999 1 1 32 0.003 0.145 0.702 - 162 892
2,500 to 4,999 2 1 45 0.003 0.119 2.704 - 148 1,196
1,000 to 2,499 2 1 33 0.010 0.151 1.202 - 178 10,291
500 to 999 0 0 13 0.014 0.059 1.076 - 92 4,208
Under 500 0 1 10 0.047 0.319 1.549 - 666 97,714
All Municipalities 38 29 203 0.003 0.823 2.704 - 895 97,714
Ratios of Total Outstanding General Obligation Debt, Authorized andUnissued General Obligation Debt and Installment Purchases
(Excluding All Enterprise Debt)Appraised Property Valuation (%) Per Capita ($)
Page 6
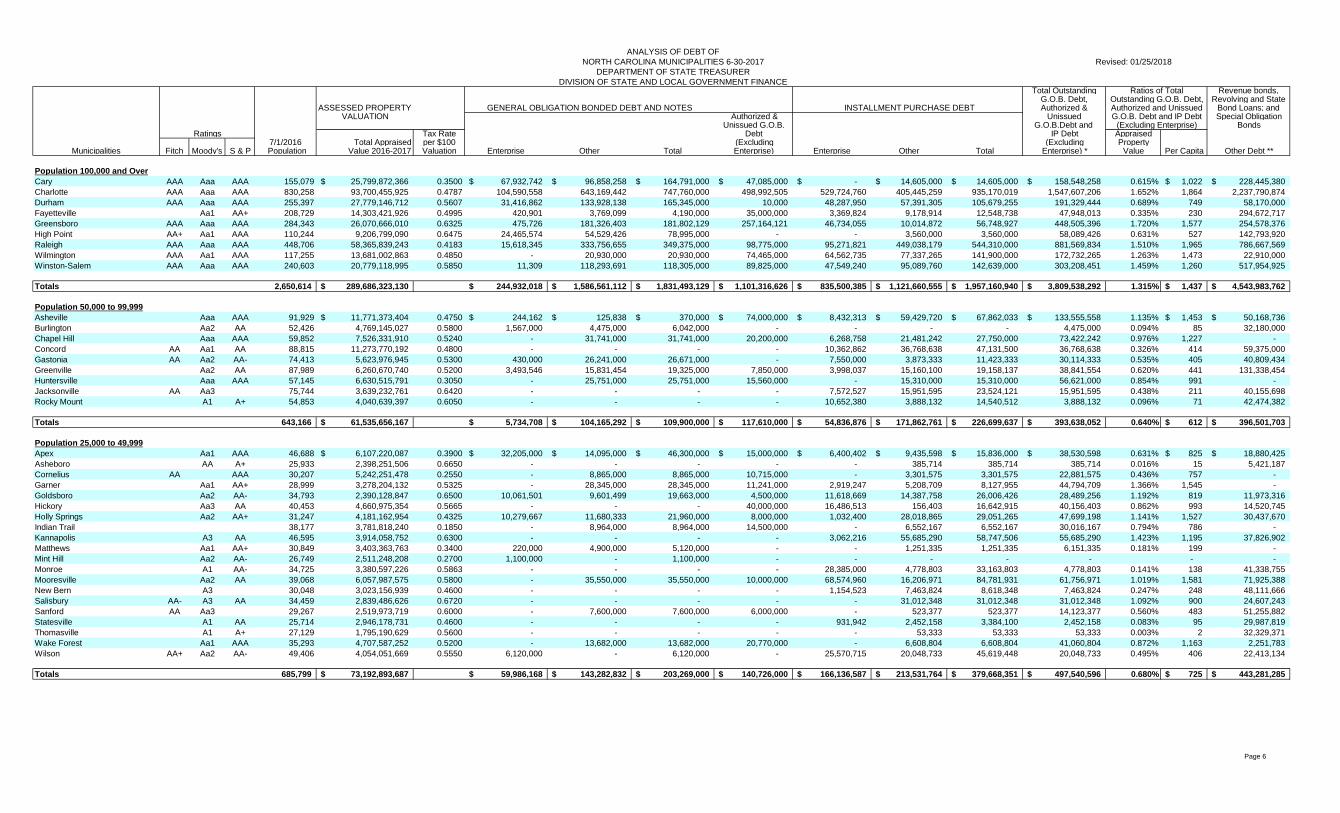
ANALYSIS OF DEBT OFNORTH CAROLINA MUNICIPALITIES 6-30-2017 Revised: 01/25/2018
DEPARTMENT OF STATE TREASURERDIVISION OF STATE AND LOCAL GOVERNMENT FINANCE
Total Outstanding Ratios of Total Revenue bonds,G.O.B. Debt, Outstanding G.O.B. Debt, Revolving and State
ASSESSED PROPERTY GENERAL OBLIGATION BONDED DEBT AND NOTES INSTALLMENT PURCHASE DEBT Authorized & Authorized and Unissued Bond Loans; andVALUATION Authorized & Unissued G.O.B. Debt and IP Debt Special Obligation
Unissued G.O.B. G.O.B.Debt and (Excluding Enterprise) BondsRatings Tax Rate Debt IP Debt Appraised
7/1/2016 Total Appraised per $100 (Excluding (Excluding PropertyMunicipalities Fitch Moody's S & P Population Value 2016-2017 Valuation Enterprise Other Total Enterprise) Enterprise Other Total Enterprise) * Value Per Capita Other Debt **
Population 100,000 and OverCary AAA Aaa AAA 155,079 25,799,872,366$ 0.3500 67,932,742$ 96,858,258$ 164,791,000$ 47,085,000$ -$ 14,605,000$ 14,605,000$ 158,548,258$ 0.615% 1,022$ 228,445,380$ Charlotte AAA Aaa AAA 830,258 93,700,455,925 0.4787 104,590,558 643,169,442 747,760,000 498,992,505 529,724,760 405,445,259 935,170,019 1,547,607,206 1.652% 1,864 2,237,790,874 Durham AAA Aaa AAA 255,397 27,779,146,712 0.5607 31,416,862 133,928,138 165,345,000 10,000 48,287,950 57,391,305 105,679,255 191,329,444 0.689% 749 58,170,000 Fayetteville Aa1 AA+ 208,729 14,303,421,926 0.4995 420,901 3,769,099 4,190,000 35,000,000 3,369,824 9,178,914 12,548,738 47,948,013 0.335% 230 294,672,717 Greensboro AAA Aaa AAA 284,343 26,070,666,010 0.6325 475,726 181,326,403 181,802,129 257,164,121 46,734,055 10,014,872 56,748,927 448,505,396 1.720% 1,577 254,578,376 High Point AA+ Aa1 AAA 110,244 9,206,799,090 0.6475 24,465,574 54,529,426 78,995,000 - - 3,560,000 3,560,000 58,089,426 0.631% 527 142,793,920 Raleigh AAA Aaa AAA 448,706 58,365,839,243 0.4183 15,618,345 333,756,655 349,375,000 98,775,000 95,271,821 449,038,179 544,310,000 881,569,834 1.510% 1,965 786,667,569 Wilmington AAA Aa1 AAA 117,255 13,681,002,863 0.4850 - 20,930,000 20,930,000 74,465,000 64,562,735 77,337,265 141,900,000 172,732,265 1.263% 1,473 22,910,000 Winston-Salem AAA Aaa AAA 240,603 20,779,118,995 0.5850 11,309 118,293,691 118,305,000 89,825,000 47,549,240 95,089,760 142,639,000 303,208,451 1.459% 1,260 517,954,925
Totals 2,650,614 289,686,323,130$ 244,932,018$ 1,586,561,112$ 1,831,493,129$ 1,101,316,626$ 835,500,385$ 1,121,660,555$ 1,957,160,940$ 3,809,538,292$ 1.315% 1,437$ 4,543,983,762$
Population 50,000 to 99,999Asheville Aaa AAA 91,929 11,771,373,404$ 0.4750 244,162$ 125,838$ 370,000$ 74,000,000$ 8,432,313$ 59,429,720$ 67,862,033$ 133,555,558$ 1.135% 1,453$ 50,168,736$ Burlington Aa2 AA 52,426 4,769,145,027 0.5800 1,567,000 4,475,000 6,042,000 - - - - 4,475,000 0.094% 85 32,180,000 Chapel Hill Aaa AAA 59,852 7,526,331,910 0.5240 - 31,741,000 31,741,000 20,200,000 6,268,758 21,481,242 27,750,000 73,422,242 0.976% 1,227 - Concord AA Aa1 AA 88,815 11,273,770,192 0.4800 - - - - 10,362,862 36,768,638 47,131,500 36,768,638 0.326% 414 59,375,000 Gastonia AA Aa2 AA- 74,413 5,623,976,945 0.5300 430,000 26,241,000 26,671,000 - 7,550,000 3,873,333 11,423,333 30,114,333 0.535% 405 40,809,434 Greenville Aa2 AA 87,989 6,260,670,740 0.5200 3,493,546 15,831,454 19,325,000 7,850,000 3,998,037 15,160,100 19,158,137 38,841,554 0.620% 441 131,338,454 Huntersville Aaa AAA 57,145 6,630,515,791 0.3050 - 25,751,000 25,751,000 15,560,000 - 15,310,000 15,310,000 56,621,000 0.854% 991 - Jacksonville AA Aa3 75,744 3,639,232,761 0.6420 - - - - 7,572,527 15,951,595 23,524,121 15,951,595 0.438% 211 40,155,698 Rocky Mount A1 A+ 54,853 4,040,639,397 0.6050 - - - - 10,652,380 3,888,132 14,540,512 3,888,132 0.096% 71 42,474,382
Totals 643,166 61,535,656,167$ 5,734,708$ 104,165,292$ 109,900,000$ 117,610,000$ 54,836,876$ 171,862,761$ 226,699,637$ 393,638,052$ 0.640% 612$ 396,501,703$
Population 25,000 to 49,999Apex Aa1 AAA 46,688 6,107,220,087$ 0.3900 32,205,000$ 14,095,000$ 46,300,000$ 15,000,000$ 6,400,402$ 9,435,598$ 15,836,000$ 38,530,598$ 0.631% 825$ 18,880,425$ Asheboro AA A+ 25,933 2,398,251,506 0.6650 - - - - - 385,714 385,714 385,714 0.016% 15 5,421,187 Cornelius AA AAA 30,207 5,242,251,478 0.2550 - 8,865,000 8,865,000 10,715,000 - 3,301,575 3,301,575 22,881,575 0.436% 757 - Garner Aa1 AA+ 28,999 3,278,204,132 0.5325 - 28,345,000 28,345,000 11,241,000 2,919,247 5,208,709 8,127,955 44,794,709 1.366% 1,545 - Goldsboro Aa2 AA- 34,793 2,390,128,847 0.6500 10,061,501 9,601,499 19,663,000 4,500,000 11,618,669 14,387,758 26,006,426 28,489,256 1.192% 819 11,973,316 Hickory Aa3 AA 40,453 4,660,975,354 0.5665 - - - 40,000,000 16,486,513 156,403 16,642,915 40,156,403 0.862% 993 14,520,745 Holly Springs Aa2 AA+ 31,247 4,181,162,954 0.4325 10,279,667 11,680,333 21,960,000 8,000,000 1,032,400 28,018,865 29,051,265 47,699,198 1.141% 1,527 30,437,670 Indian Trail 38,177 3,781,818,240 0.1850 - 8,964,000 8,964,000 14,500,000 - 6,552,167 6,552,167 30,016,167 0.794% 786 - Kannapolis A3 AA 46,595 3,914,058,752 0.6300 - - - - 3,062,216 55,685,290 58,747,506 55,685,290 1.423% 1,195 37,826,902 Matthews Aa1 AA+ 30,849 3,403,363,763 0.3400 220,000 4,900,000 5,120,000 - - 1,251,335 1,251,335 6,151,335 0.181% 199 - Mint Hill Aa2 AA- 26,749 2,511,248,208 0.2700 1,100,000 - 1,100,000 - - - - - - - Monroe A1 AA- 34,725 3,380,597,226 0.5863 - - - - 28,385,000 4,778,803 33,163,803 4,778,803 0.141% 138 41,338,755 Mooresville Aa2 AA 39,068 6,057,987,575 0.5800 - 35,550,000 35,550,000 10,000,000 68,574,960 16,206,971 84,781,931 61,756,971 1.019% 1,581 71,925,388 New Bern A3 30,048 3,023,156,939 0.4600 - - - - 1,154,523 7,463,824 8,618,348 7,463,824 0.247% 248 48,111,666 Salisbury AA- A3 AA 34,459 2,839,486,626 0.6720 - - - - - 31,012,348 31,012,348 31,012,348 1.092% 900 24,607,243 Sanford AA Aa3 29,267 2,519,973,719 0.6000 - 7,600,000 7,600,000 6,000,000 - 523,377 523,377 14,123,377 0.560% 483 51,255,882 Statesville A1 AA 25,714 2,946,178,731 0.4600 - - - - 931,942 2,452,158 3,384,100 2,452,158 0.083% 95 29,987,819 Thomasville A1 A+ 27,129 1,795,190,629 0.5600 - - - - - 53,333 53,333 53,333 0.003% 2 32,329,371 Wake Forest Aa1 AAA 35,293 4,707,587,252 0.5200 - 13,682,000 13,682,000 20,770,000 - 6,608,804 6,608,804 41,060,804 0.872% 1,163 2,251,783 Wilson AA+ Aa2 AA- 49,406 4,054,051,669 0.5550 6,120,000 - 6,120,000 - 25,570,715 20,048,733 45,619,448 20,048,733 0.495% 406 22,413,134
Totals 685,799 73,192,893,687$ 59,986,168$ 143,282,832$ 203,269,000$ 140,726,000$ 166,136,587$ 213,531,764$ 379,668,351$ 497,540,596$ 0.680% 725$ 443,281,285$
Page 7
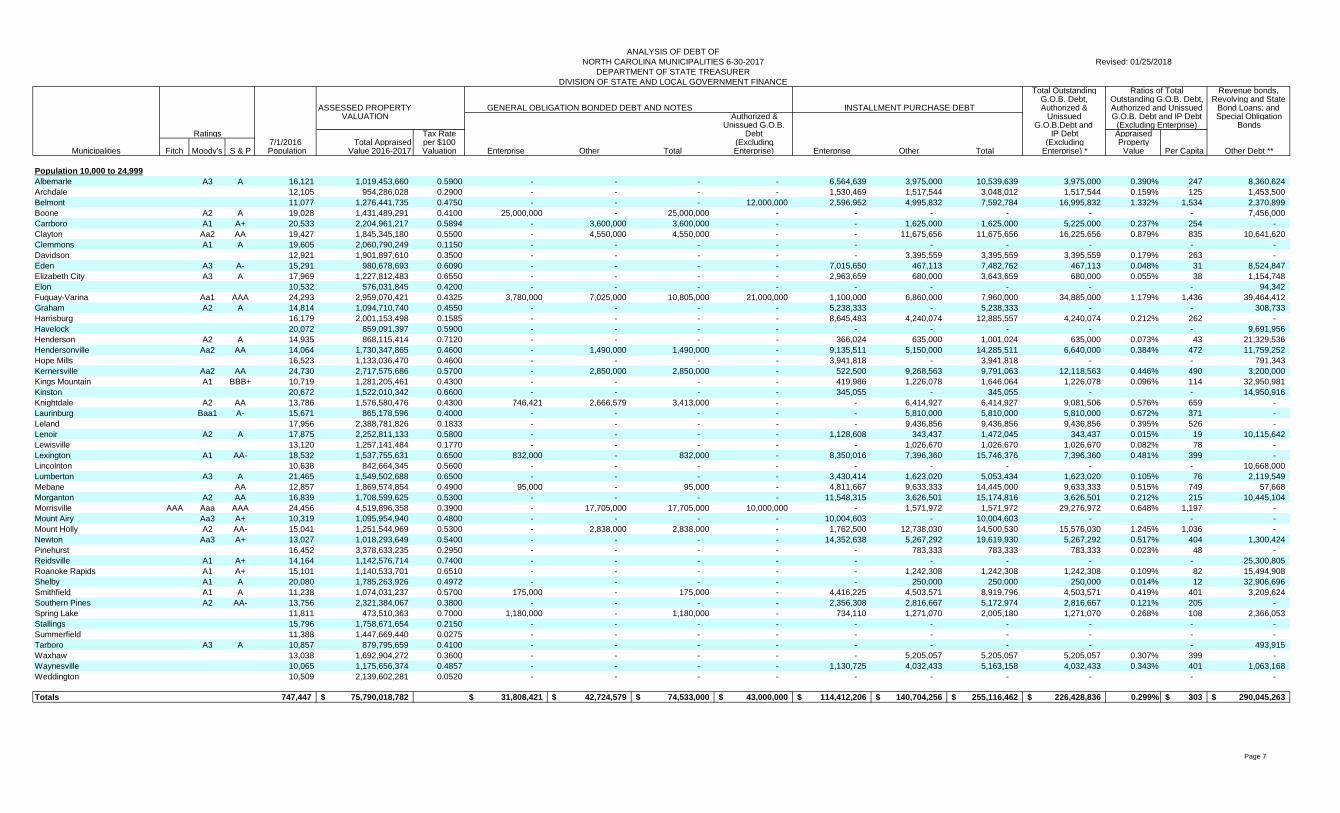
ANALYSIS OF DEBT OFNORTH CAROLINA MUNICIPALITIES 6-30-2017 Revised: 01/25/2018
DEPARTMENT OF STATE TREASURERDIVISION OF STATE AND LOCAL GOVERNMENT FINANCE
Total Outstanding Ratios of Total Revenue bonds,G.O.B. Debt, Outstanding G.O.B. Debt, Revolving and State
ASSESSED PROPERTY GENERAL OBLIGATION BONDED DEBT AND NOTES INSTALLMENT PURCHASE DEBT Authorized & Authorized and Unissued Bond Loans; andVALUATION Authorized & Unissued G.O.B. Debt and IP Debt Special Obligation
Unissued G.O.B. G.O.B.Debt and (Excluding Enterprise) BondsRatings Tax Rate Debt IP Debt Appraised
7/1/2016 Total Appraised per $100 (Excluding (Excluding PropertyMunicipalities Fitch Moody's S & P Population Value 2016-2017 Valuation Enterprise Other Total Enterprise) Enterprise Other Total Enterprise) * Value Per Capita Other Debt **
Population 10,000 to 24,999Albemarle A3 A 16,121 1,019,453,660 0.5900 - - - - 6,564,639 3,975,000 10,539,639 3,975,000 0.390% 247 8,360,624 Archdale 12,105 954,286,028 0.2900 - - - - 1,530,469 1,517,544 3,048,012 1,517,544 0.159% 125 1,453,500 Belmont 11,077 1,276,441,735 0.4750 - - - 12,000,000 2,596,952 4,995,832 7,592,784 16,995,832 1.332% 1,534 2,370,899 Boone A2 A 19,028 1,431,489,291 0.4100 25,000,000 - 25,000,000 - - - - - - 7,456,000 Carrboro A1 A+ 20,533 2,204,961,217 0.5894 - 3,600,000 3,600,000 - - 1,625,000 1,625,000 5,225,000 0.237% 254 - Clayton Aa2 AA 19,427 1,845,345,180 0.5500 - 4,550,000 4,550,000 - - 11,675,656 11,675,656 16,225,656 0.879% 835 10,641,620 Clemmons A1 A 19,605 2,060,790,249 0.1150 - - - - - - - - - - Davidson 12,921 1,901,897,610 0.3500 - - - - - 3,395,559 3,395,559 3,395,559 0.179% 263 - Eden A3 A- 15,291 980,678,693 0.6090 - - - - 7,015,650 467,113 7,482,762 467,113 0.048% 31 8,524,847 Elizabeth City A3 A 17,969 1,227,812,483 0.6550 - - - - 2,963,659 680,000 3,643,659 680,000 0.055% 38 1,154,748 Elon 10,532 576,031,845 0.4200 - - - - - - - - - 94,342 Fuquay-Varina Aa1 AAA 24,293 2,959,070,421 0.4325 3,780,000 7,025,000 10,805,000 21,000,000 1,100,000 6,860,000 7,960,000 34,885,000 1.179% 1,436 39,464,412 Graham A2 A 14,814 1,094,710,740 0.4550 - - - - 5,238,333 - 5,238,333 - - 308,733 Harrisburg 16,179 2,001,153,498 0.1585 - - - - 8,645,483 4,240,074 12,885,557 4,240,074 0.212% 262 - Havelock 20,072 859,091,397 0.5900 - - - - - - - - - 9,691,956 Henderson A2 A 14,935 868,115,414 0.7120 - - - - 366,024 635,000 1,001,024 635,000 0.073% 43 21,329,536 Hendersonville Aa2 AA 14,064 1,730,347,865 0.4600 - 1,490,000 1,490,000 - 9,135,511 5,150,000 14,285,511 6,640,000 0.384% 472 11,759,252 Hope Mills 16,523 1,133,036,470 0.4600 - - - - 3,941,818 - 3,941,818 - - 791,343 Kernersville Aa2 AA 24,730 2,717,575,686 0.5700 - 2,850,000 2,850,000 - 522,500 9,268,563 9,791,063 12,118,563 0.446% 490 3,200,000 Kings Mountain A1 BBB+ 10,719 1,281,205,461 0.4300 - - - - 419,986 1,226,078 1,646,064 1,226,078 0.096% 114 32,950,981 Kinston 20,672 1,522,010,342 0.6600 - - - - 345,055 - 345,055 - - 14,950,916 Knightdale A2 AA 13,786 1,576,580,476 0.4300 746,421 2,666,579 3,413,000 - - 6,414,927 6,414,927 9,081,506 0.576% 659 - Laurinburg Baa1 A- 15,671 865,178,596 0.4000 - - - - - 5,810,000 5,810,000 5,810,000 0.672% 371 - Leland 17,956 2,388,781,826 0.1833 - - - - - 9,436,856 9,436,856 9,436,856 0.395% 526 - Lenoir A2 A 17,875 2,252,811,133 0.5800 - - - - 1,128,608 343,437 1,472,045 343,437 0.015% 19 10,115,642 Lewisville 13,120 1,257,141,484 0.1770 - - - - - 1,026,670 1,026,670 1,026,670 0.082% 78 - Lexington A1 AA- 18,532 1,537,755,631 0.6500 832,000 - 832,000 - 8,350,016 7,396,360 15,746,376 7,396,360 0.481% 399 - Lincolnton 10,638 842,664,345 0.5600 - - - - - - - - - 10,668,000 Lumberton A3 A 21,465 1,549,502,688 0.6500 - - - - 3,430,414 1,623,020 5,053,434 1,623,020 0.105% 76 2,119,549 Mebane AA 12,857 1,869,574,854 0.4900 95,000 - 95,000 - 4,811,667 9,633,333 14,445,000 9,633,333 0.515% 749 57,668 Morganton A2 AA 16,839 1,708,599,625 0.5300 - - - - 11,548,315 3,626,501 15,174,816 3,626,501 0.212% 215 10,445,104 Morrisville AAA Aaa AAA 24,456 4,519,896,358 0.3900 - 17,705,000 17,705,000 10,000,000 - 1,571,972 1,571,972 29,276,972 0.648% 1,197 - Mount Airy Aa3 A+ 10,319 1,095,954,940 0.4800 - - - - 10,004,603 - 10,004,603 - - - Mount Holly A2 AA- 15,041 1,251,544,969 0.5300 - 2,838,000 2,838,000 - 1,762,500 12,738,030 14,500,530 15,576,030 1.245% 1,036 - Newton Aa3 A+ 13,027 1,018,293,649 0.5400 - - - - 14,352,638 5,267,292 19,619,930 5,267,292 0.517% 404 1,300,424 Pinehurst 16,452 3,378,633,235 0.2950 - - - - - 783,333 783,333 783,333 0.023% 48 - Reidsville A1 A+ 14,164 1,142,576,714 0.7400 - - - - - - - - - 25,300,805 Roanoke Rapids A1 A+ 15,101 1,140,533,701 0.6510 - - - - - 1,242,308 1,242,308 1,242,308 0.109% 82 15,494,908 Shelby A1 A 20,080 1,785,263,926 0.4972 - - - - - 250,000 250,000 250,000 0.014% 12 32,906,696 Smithfield A1 A 11,238 1,074,031,237 0.5700 175,000 - 175,000 - 4,416,225 4,503,571 8,919,796 4,503,571 0.419% 401 3,209,624 Southern Pines A2 AA- 13,756 2,321,384,067 0.3800 - - - - 2,356,308 2,816,667 5,172,974 2,816,667 0.121% 205 - Spring Lake 11,811 473,510,363 0.7000 1,180,000 - 1,180,000 - 734,110 1,271,070 2,005,180 1,271,070 0.268% 108 2,366,053 Stallings 15,796 1,758,671,654 0.2150 - - - - - - - - - - Summerfield 11,388 1,447,669,440 0.0275 - - - - - - - - - - Tarboro A3 A 10,857 879,795,659 0.4100 - - - - - - - - - 493,915 Waxhaw 13,038 1,692,904,272 0.3600 - - - - - 5,205,057 5,205,057 5,205,057 0.307% 399 - Waynesville 10,065 1,175,656,374 0.4857 - - - - 1,130,725 4,032,433 5,163,158 4,032,433 0.343% 401 1,063,168 Weddington 10,509 2,139,602,281 0.0520 - - - - - - - - - -
Totals 747,447 75,790,018,782$ 31,808,421$ 42,724,579$ 74,533,000$ 43,000,000$ 114,412,206$ 140,704,256$ 255,116,462$ 226,428,836$ 0.299% 303$ 290,045,263$
Page 8
ANALYSIS OF DEBT OFNORTH CAROLINA MUNICIPALITIES 6-30-2017 Revised: 01/25/2018
DEPARTMENT OF STATE TREASURERDIVISION OF STATE AND LOCAL GOVERNMENT FINANCE
Total Outstanding Ratios of Total Revenue bonds,G.O.B. Debt, Outstanding G.O.B. Debt, Revolving and State
ASSESSED PROPERTY GENERAL OBLIGATION BONDED DEBT AND NOTES INSTALLMENT PURCHASE DEBT Authorized & Authorized and Unissued Bond Loans; andVALUATION Authorized & Unissued G.O.B. Debt and IP Debt Special Obligation
Unissued G.O.B. G.O.B.Debt and (Excluding Enterprise) BondsRatings Tax Rate Debt IP Debt Appraised
7/1/2016 Total Appraised per $100 (Excluding (Excluding PropertyMunicipalities Fitch Moody's S & P Population Value 2016-2017 Valuation Enterprise Other Total Enterprise) Enterprise Other Total Enterprise) * Value Per Capita Other Debt **
Population 5,000 to 9,999Aberdeen 7,564 828,834,911 0.4700 - - - - - 333,333 333,333 333,333 0.040% 44 - Angier 5,041 334,847,087 0.5300 878,780 - 878,780 - - 500,000 500,000 500,000 0.149% 99 2,967,000 Bessemer City A1 A+ 5,439 343,807,721 0.4500 100,000 - 100,000 - - 1,031,317 1,031,317 1,031,317 0.300% 190 1,801,089 Black Mountain 8,125 1,023,683,983 0.3750 - - - - 713,212 1,516,218 2,229,430 1,516,218 0.148% 187 804,594 Boiling Spring Lakes 6,519 504,174,854 0.2100 - - - - - 940,000 940,000 940,000 0.186% 144 - Brevard 8,002 967,538,878 0.4800 - - - - - 332,087 332,087 332,087 0.034% 42 6,821,821 Butner 7,880 615,401,857 0.3650 - - - - - 1,300,000 1,300,000 1,300,000 0.211% 165 - Carolina Beach 6,015 1,716,526,994 0.2350 - - - - 520,000 4,744,073 5,264,073 4,744,073 0.276% 789 28,765,170 Cherryville A1 A- 5,919 363,858,734 0.4600 - - - - 111,680 522,253 633,933 522,253 0.144% 88 322,181 Clinton A3 A+ 8,558 766,479,289 0.4000 - - - - - 810,311 810,311 810,311 0.106% 95 8,896,483 Conover A1 A 8,336 1,069,249,369 0.4700 125,000 - 125,000 - - 408,474 408,474 408,474 0.038% 49 3,215,722 Dunn A1 AA- 9,675 847,898,758 0.5000 1,180,000 - 1,180,000 - 1,328,648 3,747,295 5,075,943 3,747,295 0.442% 387 3,069,580 Fletcher 8,049 1,132,167,275 0.3400 - - - - - 1,697,824 1,697,824 1,697,824 0.150% 211 - Forest City 7,402 1,167,268,219 0.2900 - - - - - 944,445 944,445 944,445 0.081% 128 411,454 Gibsonville Baa1 A- 7,023 567,147,047 0.5100 - - - - - 1,415,000 1,415,000 1,415,000 0.249% 201 39,844 Hamlet A2 A 6,291 326,123,102 0.6600 218,668 11,332 230,000 - - - - 11,332 0.003% 2 - Hillsborough Aa3 A 6,720 854,066,464 0.6800 - - - - 2,228,388 3,272,542 5,500,930 3,272,542 0.383% 487 20,790,965 Kill Devil Hills 7,195 2,099,114,286 0.3809 - - - - - 3,573,407 3,573,407 3,573,407 0.170% 497 5,073,261 King 6,996 585,433,965 0.4220 - - - - 1,241,555 191,416 1,432,971 191,416 0.033% 27 11,897,450 Marion 8,040 469,455,964 0.5100 - - - - 1,301,000 - 1,301,000 - - 811,817 Marvin 6,746 1,130,171,353 0.0500 - - - - - 71,429 71,429 71,429 0.006% 11 - Mills River 7,343 1,035,335,368 0.1800 - - - - - - - - - - Mocksville 5,422 861,827,131 0.2900 - - - - - 900,000 900,000 900,000 0.104% 166 - Morehead City 9,361 1,991,136,904 0.3500 - - - - - 1,042,800 1,042,800 1,042,800 0.052% 111 16,640,180 Nashville 5,231 383,759,885 0.5600 - - - - - - - - - - Oak Island 7,529 2,519,644,893 0.2900 - - - - - 6,714,510 6,714,510 6,714,510 0.266% 892 87,684,744 Oak Ridge 7,209 940,408,178 0.0863 - - - - - - - - - - Oxford A2 A 8,563 558,532,394 0.6400 - - - - - 75,000 75,000 75,000 0.013% 9 7,310,773 Pineville A2 BBB+ 8,873 1,671,748,436 0.3500 - - - - - 2,421,250 2,421,250 2,421,250 0.145% 273 - Rockingham A3 A 9,199 660,075,321 0.4800 - - - - - - - - - - Rolesville 5,723 797,233,121 0.4800 367,000 - 367,000 - - 1,330,000 1,330,000 1,330,000 0.167% 232 - Roxboro 8,238 709,431,983 0.6600 - - - - 5,004,969 - 5,004,969 - - 112,616 Sawmills 5,156 261,205,413 0.2000 - - - - - - - - - 76,448 Selma 6,407 447,336,189 0.5100 - - - - 1,077,792 583,333 1,661,125 583,333 0.130% 91 2,572,185 Siler City 8,635 430,231,411 0.4800 - - - - 10,622,000 - 10,622,000 - - - Stokesdale 5,604 - 0.0000 - - - - - - - - - - Trinity 6,638 559,715,612 0.1000 13,316,083 - 13,316,083 - - - - - - 735,988 Unionville 6,578 548,980,148 0.0200 - - - - - - - - - - Wadesboro 5,503 331,456,219 0.5560 - - - - 555,590 1,100,000 1,655,590 1,100,000 0.332% 200 - Walkertown 5,068 416,149,977 0.2000 - - - - - - - - - 588,000 Washington A1 A+ 9,561 871,281,373 0.5200 - - - - 2,833,348 1,588,708 4,422,055 1,588,708 0.182% 166 1,421,420 Wendell 6,533 529,989,981 0.4900 - - - - 173,649 2,529,296 2,702,945 2,529,296 0.477% 387 2,467,126 Wesley Chapel 8,628 970,714,122 0.0165 - - - - - - - - - - Whiteville 5,344 489,993,091 0.5125 - - - - - 485,333 485,333 485,333 0.099% 91 1,753,496 Williamston 5,542 377,541,319 0.7400 - - - - - 600,000 600,000 600,000 0.159% 108 7,200,390 Winterville 9,368 773,401,686 0.4750 - - - - 4,475,367 3,140,604 7,615,971 3,140,604 0.406% 335 - Woodfin 6,589 641,161,076 0.3050 - - - 4,500,000 - - - 4,500,000 0.702% 683 -
Totals 335,380 37,491,541,341$ 16,185,531$ 11,332$ 16,196,863$ 4,500,000$ 32,187,199$ 49,862,257$ 82,049,456$ 54,373,589$ 0.145% 162$ 224,251,797$
Page 9
ANALYSIS OF DEBT OFNORTH CAROLINA MUNICIPALITIES 6-30-2017 Revised: 01/25/2018
DEPARTMENT OF STATE TREASURERDIVISION OF STATE AND LOCAL GOVERNMENT FINANCE
Total Outstanding Ratios of Total Revenue bonds,G.O.B. Debt, Outstanding G.O.B. Debt, Revolving and State
ASSESSED PROPERTY GENERAL OBLIGATION BONDED DEBT AND NOTES INSTALLMENT PURCHASE DEBT Authorized & Authorized and Unissued Bond Loans; andVALUATION Authorized & Unissued G.O.B. Debt and IP Debt Special Obligation
Unissued G.O.B. G.O.B.Debt and (Excluding Enterprise) BondsRatings Tax Rate Debt IP Debt Appraised
7/1/2016 Total Appraised per $100 (Excluding (Excluding PropertyMunicipalities Fitch Moody's S & P Population Value 2016-2017 Valuation Enterprise Other Total Enterprise) Enterprise Other Total Enterprise) * Value Per Capita Other Debt **
Population 2,500 to 4,999Ahoskie 4,872 352,318,676 0.8100 10,106,000 - 10,106,000 - 70,310 2,986,050 3,056,360 2,986,050 0.848% 613 2,948,447 Archer Lodge 4,829 279,897,759 0.2000 - - - - - 333,333 333,333 333,333 0.119% 69 - Ayden Baa1 A- 4,996 232,629,823 0.5400 - - - - 1,500,000 - 1,500,000 - - 4,123,714 Beaufort 4,230 788,565,287 0.3475 - - - - - 3,800,000 3,800,000 3,800,000 0.482% 898 13,513,525 Benson 3,481 327,802,309 0.5300 - - - - 384,211 - 384,211 - - 5,938,340 Bermuda Run 2,610 535,848,517 0.1500 - - - - - 49,583 49,583 49,583 0.009% 19 - Boiling Springs 4,819 278,328,795 0.3300 - - - - 500,751 840,000 1,340,751 840,000 0.302% 174 563,601 Burgaw 4,102 295,335,698 0.4800 - - - - - - - - - 3,184,397 Cajah's Mountain 2,740 - 0.0000 - - - - - - - - - - Canton 4,359 483,567,970 0.5800 - - - - - 775,000 775,000 775,000 0.160% 178 1,009,323 Carolina Shores 3,577 429,135,811 0.1016 - - - - - - - - - - China Grove 4,245 298,085,810 0.5800 - - - - - - - - - 1,759,269 Cramerton 4,944 479,375,097 0.4750 - - - - - 557,143 557,143 557,143 0.116% 113 - Creedmoor 4,532 305,504,566 0.6650 - - - - - - - - - - Dallas 4,791 286,985,985 0.4000 - - - - 3,067,668 1,189,418 4,257,087 1,189,418 0.414% 248 - Eastover 3,676 312,017,856 0.2050 - - - - - - - - - - Edenton 4,814 473,179,762 0.3850 - - - - 242,000 2,480,000 2,722,000 2,480,000 0.524% 515 132,041 Elizabethtown 3,549 282,293,656 0.6150 - - - - 46,660 - 46,660 - - 1,176,989 Elkin Aa3 A+ 4,024 534,010,505 0.5500 - - - - 1,231,322 190,871 1,422,194 190,871 0.036% 47 - Emerald Isle Aa3 AA 3,791 2,742,535,241 0.1550 - - - - 642,537 1,438,928 2,081,465 1,438,928 0.052% 380 - Erwin 4,674 254,994,655 0.5100 - - - - - - - - - - Fairmont 2,623 111,056,365 0.7300 2,389,500 - 2,389,500 - - - - - - 361,000 Fairview 3,659 413,784,966 0.0200 - - - - - - - - - - Farmville 4,670 334,196,393 0.4900 - - - - 1,368,829 - 1,368,829 - - 11,830,650 Flat Rock 3,316 896,781,844 0.1100 - - - - - - - - - - Franklin 4,097 706,570,624 0.2800 - - - - 3,263,836 931,016 4,194,852 931,016 0.132% 227 4,152,387 Gamewell 4,025 - 0.0000 - - - - - - - - - - Granite Falls 4,652 410,131,767 0.4400 - - - - - 318,027 318,027 318,027 0.078% 68 2,510,000 Granite Quarry 3,086 209,494,737 0.4175 - - - - 300,000 - 300,000 - - - Grifton 2,647 89,126,866 0.6300 - 1,386,000 1,386,000 400,000 - - - 1,786,000 2.004% 675 550,000 Hudson 3,944 288,124,699 0.3900 - - - - - - - - - - Jamestown 4,109 416,668,635 0.4550 - - - - - 1,225,000 1,225,000 1,225,000 0.294% 298 - Kitty Hawk 3,516 1,144,681,323 0.3400 - - - - - 1,284,937 1,284,937 1,284,937 0.112% 365 9,999,000 La Grange 2,774 138,020,148 0.4700 - - - - - - - - - - Lake Park 3,647 275,999,972 0.2300 - - - - - - - - - - Landis 3,148 257,716,911 0.4800 4,718,000 - 4,718,000 - 268,411 - 268,411 - - 202,058 Liberty 2,665 182,337,665 0.5400 - - - - - 331,725 331,725 331,725 0.182% 124 72,771 Lillington 3,361 339,888,195 0.5200 - - - - 12,617 2,600,000 2,612,617 2,600,000 0.765% 774 - Locust 3,283 387,891,032 0.3600 - - - - - - - - - 1,789,585 Long View 4,877 272,999,381 0.5200 - - - - - - - - - 240,697 Louisburg 3,367 250,467,437 0.5150 - - - - 765,991 40,315 806,307 40,315 0.016% 12 3,006,873 Lowell 3,733 270,737,765 0.4300 - - - - 165,563 - 165,563 - - - Maiden 3,399 1,506,364,012 0.3800 - - - - - 2,391,667 2,391,667 2,391,667 0.159% 704 - Midland 3,760 384,287,890 0.2000 - - - - - - - - - 711,405 Midway 4,793 367,430,423 0.0500 - - - - - 65,801 65,801 65,801 0.018% 14 - Mineral Springs 2,971 273,747,777 0.0250 - - - - - - - - - - Mount Olive 4,605 250,176,137 0.6900 4,435,000 - 4,435,000 - 60,000 - 60,000 - - 2,652,649 Murfreesboro 3,210 133,298,734 0.6600 47,000 - 47,000 - - 66,667 66,667 66,667 0.050% 21 2,405,696 Nags Head 2,977 2,375,186,558 0.2970 - - - - 173,333 243,333 416,667 243,333 0.010% 82 -
Page 10
ANALYSIS OF DEBT OFNORTH CAROLINA MUNICIPALITIES 6-30-2017 Revised: 01/25/2018
DEPARTMENT OF STATE TREASURERDIVISION OF STATE AND LOCAL GOVERNMENT FINANCE
Total Outstanding Ratios of Total Revenue bonds,G.O.B. Debt, Outstanding G.O.B. Debt, Revolving and State
ASSESSED PROPERTY GENERAL OBLIGATION BONDED DEBT AND NOTES INSTALLMENT PURCHASE DEBT Authorized & Authorized and Unissued Bond Loans; andVALUATION Authorized & Unissued G.O.B. Debt and IP Debt Special Obligation
Unissued G.O.B. G.O.B.Debt and (Excluding Enterprise) BondsRatings Tax Rate Debt IP Debt Appraised
7/1/2016 Total Appraised per $100 (Excluding (Excluding PropertyMunicipalities Fitch Moody's S & P Population Value 2016-2017 Valuation Enterprise Other Total Enterprise) Enterprise Other Total Enterprise) * Value Per Capita Other Debt **
Population 2,500 to 4,999 continuedNewport 4,829 348,925,463$ 0.3570 2,003,685$ -$ 2,003,685$ -$ -$ 9,333$ 9,333$ 9,333$ 0.003% 2$ 7,697,974$ North Wilkesboro 4,533 422,725,133 0.5200 - - - - 371,975 689,301 1,061,275 689,301 0.163% 152 2,384,574 Pembroke 3,169 186,287,589 0.6400 1,073,500 - 1,073,500 - - - - - - 43,423 Pittsboro 4,581 485,182,046 0.4333 339,000 - 339,000 - - - - - - 1,284,955 Pleasant Garden 4,632 375,720,940 0.0250 - - - - - - - - - - Plymouth 3,661 189,265,021 0.5400 - - - - 29,483 - 29,483 - - 888,158 Polkton 3,173 43,492,625 0.2500 - - - - - - - - - - Raeford A3 A 4,935 486,922,085 0.4800 - - - - 75,000 100,000 175,000 100,000 0.021% 20 638,080 Randleman A BBB+ 4,189 394,514,738 0.6300 - - - - 165,776 913,503 1,079,278 913,503 0.232% 218 696,444 Ranlo 3,549 203,400,605 0.4000 - - - - - - - - - - Red Oak 3,516 - 0.0000 - - - - - - - - - - Red Springs 3,423 184,056,471 0.6400 - - - - 997,636 170,852 1,168,488 170,852 0.093% 50 928,637 River Bend A1 AA- 3,058 298,251,053 0.3105 2,310,000 - 2,310,000 - - - - - - - Rural Hall 3,100 383,508,969 0.3100 - - - - - 20,000 20,000 20,000 0.005% 6 - Rutherfordton 4,169 331,597,865 0.5670 - - - - - - - - - 280,398 Saint James 4,580 1,536,077,319 0.0500 - - - - - 3,112,369 3,112,369 3,112,369 0.203% 680 - Shallotte 4,462 656,303,689 0.3500 - - - - - 1,600,000 1,600,000 1,600,000 0.244% 359 75,160 Southern Shores 2,952 1,343,281,240 0.2200 - - - - - - - - - - Southport Baa1 3,428 782,533,268 0.2456 - - - - - 2,459,600 2,459,600 2,459,600 0.314% 718 1,106,194 Spencer 3,279 204,180,829 0.6550 150,000 - 150,000 - - 115,500 115,500 115,500 0.057% 35 - Spindale 4,322 192,829,337 0.6830 - - - - 240,902 - 240,902 - - 1,200,711 Stanley A1 3,710 268,527,285 0.5400 540,000 - 540,000 - 93,798 499,486 593,284 499,486 0.186% 135 2,779,944 Sunset Beach 4,128 1,557,705,765 0.1600 - - - - - - - - - - Swansboro 2,948 433,374,666 0.3500 - - - - - 1,367,552 1,367,552 1,367,552 0.316% 464 - Sylva 2,743 418,465,679 0.4250 - - - - - 952,899 952,899 952,899 0.228% 347 - Tabor City 4,259 162,517,754 0.6700 1,446,501 - 1,446,501 - - - - - - - Tobaccoville 2,517 190,333,247 0.0500 - - - - - 150,000 150,000 150,000 0.079% 60 - Trent Woods 4,014 578,948,987 0.1700 - - - - - - - - - - Troutman 2,669 398,482,246 0.5200 - - - - 228,878 1,791,220 2,020,098 1,791,220 0.450% 671 2,440,532 Troy 3,222 216,012,641 0.4600 215,000 - 215,000 - 23,085 - 23,085 - - - Valdese 4,471 370,609,869 0.5450 1,140,000 - 1,140,000 - 322,917 - 322,917 - - 877,350 Wallace 3,940 245,028,284 0.5900 - - - - 130,499 35,368 165,867 35,368 0.014% 9 5,039,215 Wallburg 3,125 270,027,728 0.0500 - - - - - - - - - - Warsaw 3,059 187,852,820 0.5500 - - - - - - - - - 2,232,250 Weaverville A2 3,858 678,032,410 0.4400 2,311,000 - 2,311,000 - - 946,933 946,933 946,933 0.140% 245 - Wentworth 2,753 - 0.0000 - - - - - - - - - - Whispering Pines 3,351 490,508,657 0.3700 - - - - - 182,936 182,936 182,936 0.037% 55 - Wilkesboro 3,705 745,101,595 0.4800 - - - - 683,299 - 683,299 - - 5,067,079 Wilson's Mills 2,568 152,754,747 0.4200 - - - - 80,179 160,570 240,749 160,570 0.105% 63 - Windsor 3,414 138,514,300 0.1450 - - - - - - - - - 686,701 Wingate 3,603 130,025,235 0.4200 - - - - 902,427 3,515,777 4,418,205 3,515,777 2.704% 976 1,924,214 Wrightsville Beach 2,509 2,488,130,453 0.1330 - - - - - 3,000,000 3,000,000 3,000,000 0.121% 1,196 - Yadkinville 2,938 274,425,607 0.4200 - - - - - 326,667 326,667 326,667 0.119% 111 - Zebulon Aa2 AA- 4,796 960,197,357 0.5750 69,821 2,590,179 2,660,000 - - 761,381 761,381 3,351,560 0.349% 699 -
Totals 348,409 43,064,215,651$ 33,294,008$ 3,976,179$ 37,270,186$ 400,000$ 18,409,893$ 47,020,062$ 65,429,954$ 51,396,240$ 0.119% 148$ 113,106,407$
Population 1,000 to 2,499Alamance 1,068 101,740,626$ 0.2000 -$ -$ -$ -$ -$ -$ -$ -$ -$ 166,381$ Andrews 1,819 116,628,775 0.5150 - - - - - - - - - 525,395 Atlantic Beach 1,501 1,571,525,159 0.1650 - - - - - 1,066,667 1,066,667 1,066,667 0.068% 711 - Badin 1,979 55,085,626 0.4100 - - - - - - - - - -
Page 11
ANALYSIS OF DEBT OFNORTH CAROLINA MUNICIPALITIES 6-30-2017 Revised: 01/25/2018
DEPARTMENT OF STATE TREASURERDIVISION OF STATE AND LOCAL GOVERNMENT FINANCE
Total Outstanding Ratios of Total Revenue bonds,G.O.B. Debt, Outstanding G.O.B. Debt, Revolving and State
ASSESSED PROPERTY GENERAL OBLIGATION BONDED DEBT AND NOTES INSTALLMENT PURCHASE DEBT Authorized & Authorized and Unissued Bond Loans; andVALUATION Authorized & Unissued G.O.B. Debt and IP Debt Special Obligation
Unissued G.O.B. G.O.B.Debt and (Excluding Enterprise) BondsRatings Tax Rate Debt IP Debt Appraised
7/1/2016 Total Appraised per $100 (Excluding (Excluding PropertyMunicipalities Fitch Moody's S & P Population Value 2016-2017 Valuation Enterprise Other Total Enterprise) Enterprise Other Total Enterprise) * Value Per Capita Other Debt **
Population 1,000 to 2,499 continuedBanner Elk 1,168 204,116,307$ 0.5800 210,000$ -$ 210,000$ -$ -$ 833,333$ 833,333$ 833,333$ 0.408% 713$ -$ Bayboro 1,250 38,122,350 0.2250 - - - - - 127,816 127,816 127,816 0.335% 102 - Belhaven 1,609 117,068,402 0.5200 1,834,500 - 1,834,500 - - - - - - 1,229,587 Belville 2,203 203,680,084 0.0900 - - - - - 950,000 950,000 950,000 0.466% 431 - Bethel 1,560 61,905,746 0.6600 1,121,000 - 1,121,000 - - - - - - 3,349,103 Beulaville 1,336 95,610,670 0.4400 579,815 - 579,815 - - - - - - 2,489,000 Biltmore Forest 1,420 650,780,801 0.3950 - - - - - 210,000 210,000 210,000 0.032% 148 - Biscoe 1,698 135,071,826 0.5600 - - - - - - - - - 1,256,951 Bladenboro 1,739 87,475,542 0.6400 - - - - - - - - - 17,503 Blowing Rock AA+ 1,307 1,119,192,586 0.3400 1,077,454 3,322,546 4,400,000 6,500,000 615,385 3,627,586 4,242,970 13,450,132 1.202% 10,291 958,491 Boonville 1,220 78,497,076 0.4600 - - - - - - - - - 335,194 Broadway 1,276 87,040,720 0.4900 259,000 - 259,000 - - - - - - 665,000 Brunswick 1,126 21,062,516 0.4500 109,000 - 109,000 - - - - - - - Bryson City 1,527 153,281,099 0.3500 963,000 - 963,000 - - - - - - 1,547,200 Burnsville 1,704 172,876,403 0.5050 135,000 - 135,000 - - 300,000 300,000 300,000 0.174% 176 588,898 Calabash 1,972 272,829,782 0.0875 - - - - - - - - - - Cape Carteret 2,180 409,693,261 0.1525 - - - - - - - - - - Carthage 2,341 229,480,363 0.4950 - - - - - 21,951 21,951 21,951 0.010% 9 1,533,000 Cedar Point 1,432 377,268,298 0.0625 - - - - - - - - - - Chadbourn 1,805 83,078,814 0.6200 1,775,500 - 1,775,500 - - - - - - 1,746,000 Claremont 1,457 383,328,134 0.4900 - - - - - 700,000 700,000 700,000 0.183% 480 - Clyde 1,257 83,275,491 0.4300 - - - - - - - - - 286,799 Coats 2,301 101,230,028 0.5900 - - - - - - - - - - Connelly Springs 1,650 11,148,373 *** 0.0500 - - - - - - - - - - Denton 1,612 123,362,743 0.6000 - - - - 585,494 - 585,494 - - 3,135,385 Dobson 1,592 147,726,737 0.3800 130,000 - 130,000 - - 423,077 423,077 423,077 0.286% 266 957,275 Drexel 1,857 94,091,615 0.3800 - - - - - - - - - 423,977 East Spencer 1,520 112,458,107 0.6300 1,550,000 - 1,550,000 - - - - - - - Ellerbe 1,016 41,660,111 0.5500 - - - - - - - - - 1,939,000 Elm City 1,269 65,445,729 0.6300 2,840,000 - 2,840,000 - - - - - - 222,063 Enfield 2,472 82,517,431 0.8380 1,899,000 - 1,899,000 - - 354,167 354,167 354,167 0.429% 143 183,067 Four Oaks 2,039 191,365,586 0.4200 - - - - - - - - - 507,000 Foxfire Village 1,047 163,527,041 0.3800 - - - - 168,682 1,027,021 1,195,702 1,027,021 0.628% 981 - Franklinton 2,045 104,167,779 0.7200 - - - - - 34,667 34,667 34,667 0.033% 17 - Franklinville 1,196 40,752,999 0.4550 - - - - - - - - - 357,258 Fremont 1,224 50,809,438 0.6500 606,000 - 606,000 - 105,393 52,178 157,570 52,178 0.103% 43 125,400 Garysburg 1,007 30,088,598 0.6000 - - - - - 60,000 60,000 60,000 0.199% 60 - Gaston 1,114 44,178,594 0.5000 - - - - - - - - - - Glen Alpine 1,550 90,992,883 0.4050 - - - - - - - - - - Green Level 2,115 69,444,503 0.3600 - - - - - - - - - 2,400,138 Haw River 2,385 151,488,256 0.4800 - - - - - - - - - 1,183,265 Hemby Bridge 1,559 - 0.0000 - - - - - - - - - - Hertford 2,120 128,481,660 0.4700 4,362,000 - 4,362,000 - - - - - - 3,564,611 Hildebran 1,977 156,465,590 0.1500 - - - - - - - - - - Holly Ridge 1,573 282,101,076 0.4150 - 154,000 154,000 - - 385,227 385,227 539,227 0.191% 343 - Jefferson 1,560 150,546,666 0.3600 105,000 - 105,000 - - - - - - - Jonesville 2,253 175,232,501 0.4500 84,000 - 84,000 - - - - - - 2,439,000 Kenly 1,375 129,461,812 0.6100 - - - - 136,319 - 136,319 - - 146,188 Kure Beach 2,193 832,394,819 0.2850 - - - - 1,052,220 1,408,371 2,460,590 1,408,371 0.169% 642 137,224 Lake Lure 1,214 864,061,176 0.2760 - - - - - 742,500 742,500 742,500 0.086% 612 1,399,444 Lake Waccamaw 1,466 272,470,453 0.2000 - - - - - - - - - 1,436,978 Laurel Park 2,241 381,764,155 0.4300 - - - - - - - - - -
Page 12
ANALYSIS OF DEBT OFNORTH CAROLINA MUNICIPALITIES 6-30-2017 Revised: 01/25/2018
DEPARTMENT OF STATE TREASURERDIVISION OF STATE AND LOCAL GOVERNMENT FINANCE
Total Outstanding Ratios of Total Revenue bonds,G.O.B. Debt, Outstanding G.O.B. Debt, Revolving and State
ASSESSED PROPERTY GENERAL OBLIGATION BONDED DEBT AND NOTES INSTALLMENT PURCHASE DEBT Authorized & Authorized and Unissued Bond Loans; andVALUATION Authorized & Unissued G.O.B. Debt and IP Debt Special Obligation
Unissued G.O.B. G.O.B.Debt and (Excluding Enterprise) BondsRatings Tax Rate Debt IP Debt Appraised
7/1/2016 Total Appraised per $100 (Excluding (Excluding PropertyMunicipalities Fitch Moody's S & P Population Value 2016-2017 Valuation Enterprise Other Total Enterprise) Enterprise Other Total Enterprise) * Value Per Capita Other Debt **
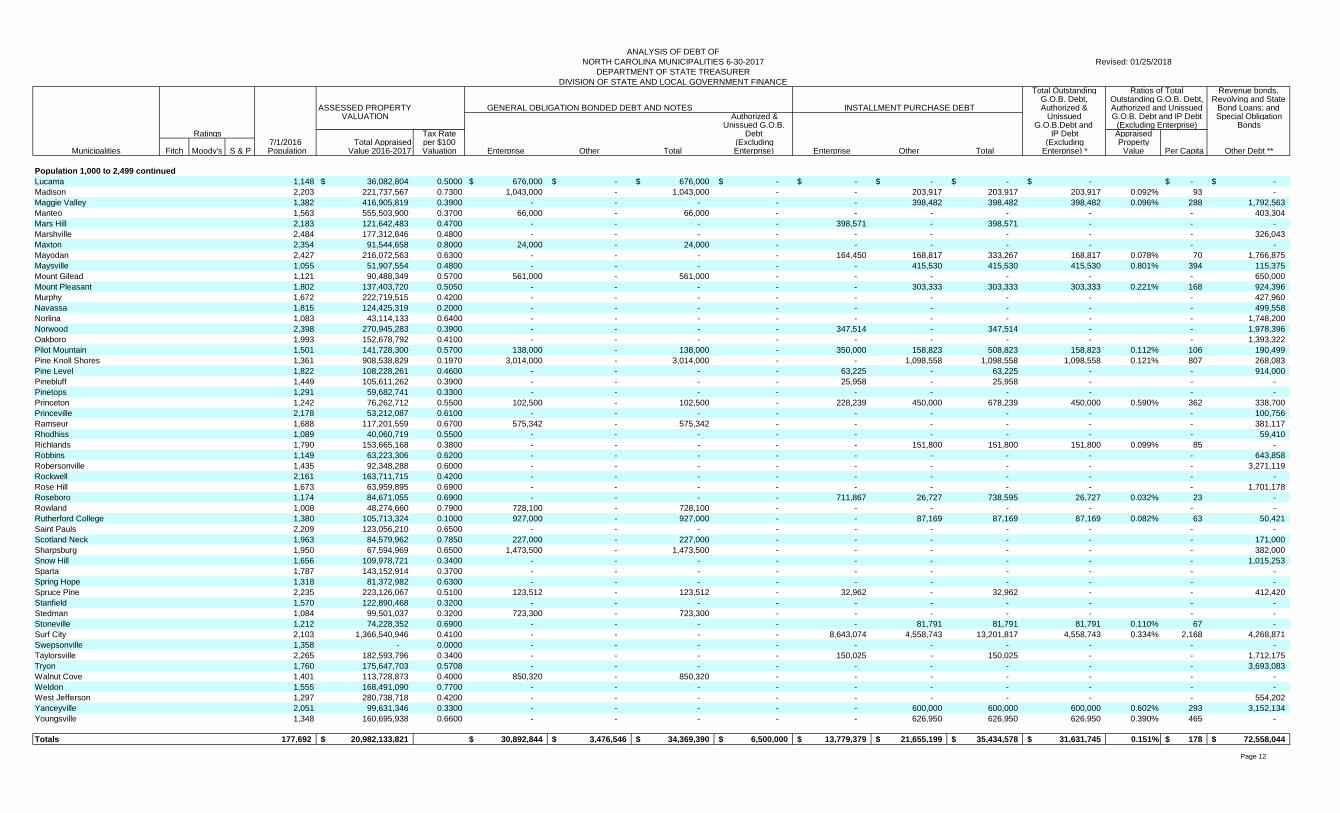
Population 1,000 to 2,499 continuedLucama 1,148 36,082,804$ 0.5000 676,000$ -$ 676,000$ -$ -$ -$ -$ -$ -$ -$ Madison 2,203 221,737,567 0.7300 1,043,000 - 1,043,000 - - 203,917 203,917 203,917 0.092% 93 - Maggie Valley 1,382 416,905,819 0.3900 - - - - - 398,482 398,482 398,482 0.096% 288 1,792,563 Manteo 1,563 555,503,900 0.3700 66,000 - 66,000 - - - - - - 403,304 Mars Hill 2,183 121,642,483 0.4700 - - - - 398,571 - 398,571 - - - Marshville 2,484 177,312,846 0.4800 - - - - - - - - - 326,043 Maxton 2,354 91,544,658 0.8000 24,000 - 24,000 - - - - - - - Mayodan 2,427 216,072,563 0.6300 - - - - 164,450 168,817 333,267 168,817 0.078% 70 1,766,875 Maysville 1,055 51,907,554 0.4800 - - - - - 415,530 415,530 415,530 0.801% 394 115,375 Mount Gilead 1,121 90,488,349 0.5700 561,000 - 561,000 - - - - - - 650,000 Mount Pleasant 1,802 137,403,720 0.5050 - - - - - 303,333 303,333 303,333 0.221% 168 924,396 Murphy 1,672 222,719,515 0.4200 - - - - - - - - - 427,960 Navassa 1,815 124,425,319 0.2000 - - - - - - - - - 499,558 Norlina 1,083 43,114,133 0.6400 - - - - - - - - - 1,748,200 Norwood 2,398 270,945,283 0.3900 - - - - 347,514 - 347,514 - - 1,978,396 Oakboro 1,993 152,678,792 0.4100 - - - - - - - - - 1,393,322 Pilot Mountain 1,501 141,728,300 0.5700 138,000 - 138,000 - 350,000 158,823 508,823 158,823 0.112% 106 190,499 Pine Knoll Shores 1,361 908,538,829 0.1970 3,014,000 - 3,014,000 - - 1,098,558 1,098,558 1,098,558 0.121% 807 268,083 Pine Level 1,822 108,228,261 0.4600 - - - - 63,225 - 63,225 - - 914,000 Pinebluff 1,449 105,611,262 0.3900 - - - - 25,958 - 25,958 - - - Pinetops 1,291 59,682,741 0.3300 - - - - - - - - - - Princeton 1,242 76,262,712 0.5500 102,500 - 102,500 - 228,239 450,000 678,239 450,000 0.590% 362 338,700 Princeville 2,178 53,212,087 0.6100 - - - - - - - - - 100,756 Ramseur 1,688 117,201,559 0.6700 575,342 - 575,342 - - - - - - 381,117 Rhodhiss 1,089 40,060,719 0.5500 - - - - - - - - - 59,410 Richlands 1,790 153,665,168 0.3800 - - - - - 151,800 151,800 151,800 0.099% 85 - Robbins 1,149 63,223,306 0.6200 - - - - - - - - - 643,858 Robersonville 1,435 92,348,288 0.6000 - - - - - - - - - 3,271,119 Rockwell 2,161 163,711,715 0.4200 - - - - - - - - - - Rose Hill 1,673 63,959,895 0.6900 - - - - - - - - - 1,701,178 Roseboro 1,174 84,671,055 0.6900 - - - - 711,867 26,727 738,595 26,727 0.032% 23 - Rowland 1,008 48,274,660 0.7900 728,100 - 728,100 - - - - - - - Rutherford College 1,380 105,713,324 0.1000 927,000 - 927,000 - - 87,169 87,169 87,169 0.082% 63 50,421 Saint Pauls 2,209 123,056,210 0.6500 - - - - - - - - - - Scotland Neck 1,963 84,579,962 0.7850 227,000 - 227,000 - - - - - - 171,000 Sharpsburg 1,950 67,594,969 0.6500 1,473,500 - 1,473,500 - - - - - - 382,000 Snow Hill 1,656 109,978,721 0.3400 - - - - - - - - - 1,015,253 Sparta 1,787 143,152,914 0.3700 - - - - - - - - - - Spring Hope 1,318 81,372,982 0.6300 - - - - - - - - - - Spruce Pine 2,235 223,126,067 0.5100 123,512 - 123,512 - 32,962 - 32,962 - - 412,420 Stanfield 1,570 122,890,468 0.3200 - - - - - - - - - - Stedman 1,084 99,501,037 0.3200 723,300 - 723,300 - - - - - - - Stoneville 1,212 74,228,352 0.6900 - - - - - 81,791 81,791 81,791 0.110% 67 - Surf City 2,103 1,366,540,946 0.4100 - - - - 8,643,074 4,558,743 13,201,817 4,558,743 0.334% 2,168 4,268,871 Swepsonville 1,358 - 0.0000 - - - - - - - - - - Taylorsville 2,265 182,593,796 0.3400 - - - - 150,025 - 150,025 - - 1,712,175 Tryon 1,760 175,647,703 0.5708 - - - - - - - - - 3,693,083 Walnut Cove 1,401 113,728,873 0.4000 850,320 - 850,320 - - - - - - - Weldon 1,555 168,491,090 0.7700 - - - - - - - - - - West Jefferson 1,297 280,738,718 0.4200 - - - - - - - - - 554,202 Yanceyville 2,051 99,631,346 0.3300 - - - - - 600,000 600,000 600,000 0.602% 293 3,152,134 Youngsville 1,348 160,695,938 0.6600 - - - - - 626,950 626,950 626,950 0.390% 465 -
Totals 177,692 20,982,133,821$ 30,892,844$ 3,476,546$ 34,369,390$ 6,500,000$ 13,779,379$ 21,655,199$ 35,434,578$ 31,631,745$ 0.151% 178$ 72,558,044$
Page 13
ANALYSIS OF DEBT OFNORTH CAROLINA MUNICIPALITIES 6-30-2017 Revised: 01/25/2018
DEPARTMENT OF STATE TREASURERDIVISION OF STATE AND LOCAL GOVERNMENT FINANCE
Total Outstanding Ratios of Total Revenue bonds,G.O.B. Debt, Outstanding G.O.B. Debt, Revolving and State
ASSESSED PROPERTY GENERAL OBLIGATION BONDED DEBT AND NOTES INSTALLMENT PURCHASE DEBT Authorized & Authorized and Unissued Bond Loans; andVALUATION Authorized & Unissued G.O.B. Debt and IP Debt Special Obligation
Unissued G.O.B. G.O.B.Debt and (Excluding Enterprise) BondsRatings Tax Rate Debt IP Debt Appraised
7/1/2016 Total Appraised per $100 (Excluding (Excluding PropertyMunicipalities Fitch Moody's S & P Population Value 2016-2017 Valuation Enterprise Other Total Enterprise) Enterprise Other Total Enterprise) * Value Per Capita Other Debt **
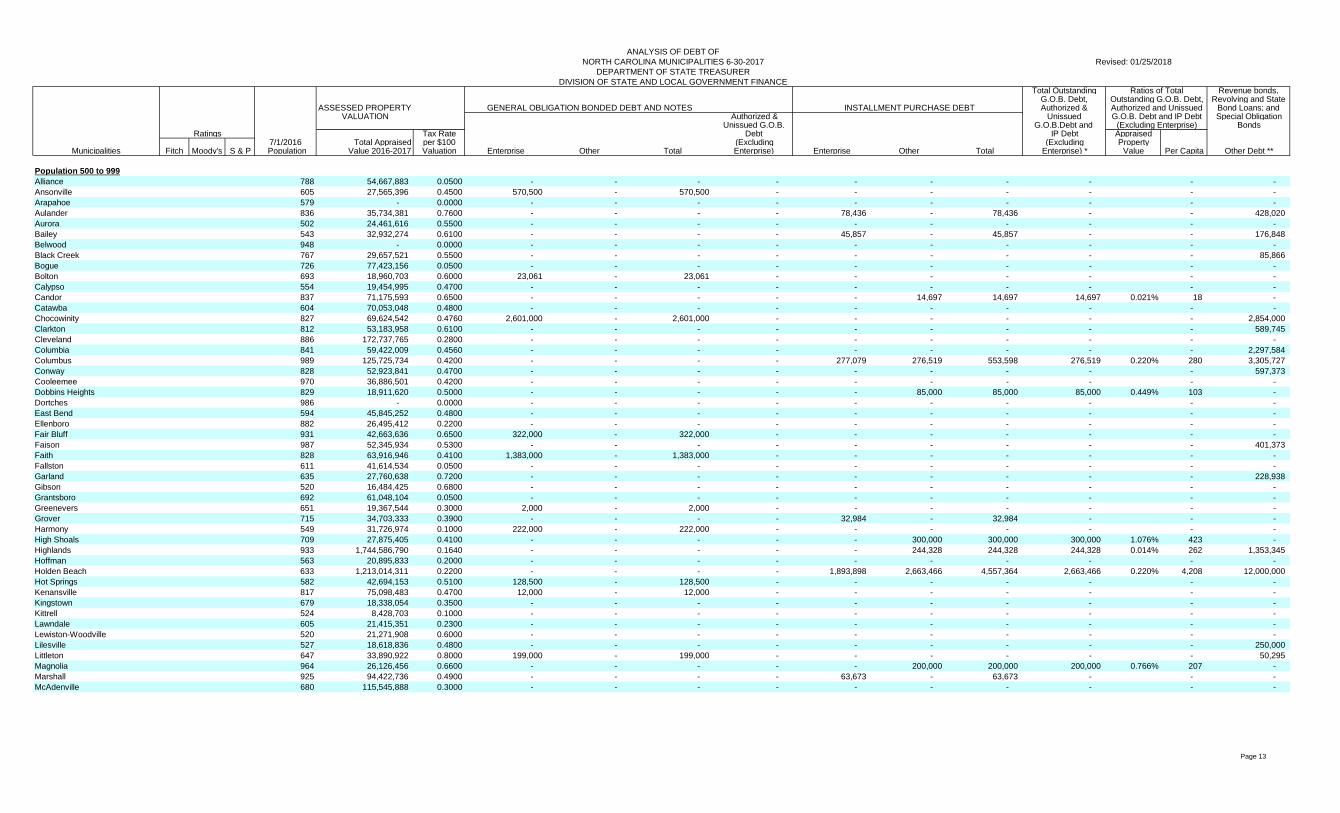
Population 500 to 999Alliance 788 54,667,883 0.0500 - - - - - - - - - - Ansonville 605 27,565,396 0.4500 570,500 - 570,500 - - - - - - - Arapahoe 579 - 0.0000 - - - - - - - - - - Aulander 836 35,734,381 0.7600 - - - - 78,436 - 78,436 - - 428,020 Aurora 502 24,461,616 0.5500 - - - - - - - - - - Bailey 543 32,932,274 0.6100 - - - - 45,857 - 45,857 - - 176,848 Belwood 948 - 0.0000 - - - - - - - - - - Black Creek 767 29,657,521 0.5500 - - - - - - - - - 85,866 Bogue 726 77,423,156 0.0500 - - - - - - - - - - Bolton 693 18,960,703 0.6000 23,061 - 23,061 - - - - - - - Calypso 554 19,454,995 0.4700 - - - - - - - - - - Candor 837 71,175,593 0.6500 - - - - - 14,697 14,697 14,697 0.021% 18 - Catawba 604 70,053,048 0.4800 - - - - - - - - - - Chocowinity 827 69,624,542 0.4760 2,601,000 - 2,601,000 - - - - - - 2,854,000 Clarkton 812 53,183,958 0.6100 - - - - - - - - - 589,745 Cleveland 886 172,737,765 0.2800 - - - - - - - - - - Columbia 841 59,422,009 0.4560 - - - - - - - - - 2,297,584 Columbus 989 125,725,734 0.4200 - - - - 277,079 276,519 553,598 276,519 0.220% 280 3,305,727 Conway 828 52,923,841 0.4700 - - - - - - - - - 597,373 Cooleemee 970 36,886,501 0.4200 - - - - - - - - - - Dobbins Heights 829 18,911,620 0.5000 - - - - - 85,000 85,000 85,000 0.449% 103 - Dortches 986 - 0.0000 - - - - - - - - - - East Bend 594 45,845,252 0.4800 - - - - - - - - - - Ellenboro 882 26,495,412 0.2200 - - - - - - - - - - Fair Bluff 931 42,663,636 0.6500 322,000 - 322,000 - - - - - - - Faison 987 52,345,934 0.5300 - - - - - - - - - 401,373 Faith 828 63,916,946 0.4100 1,383,000 - 1,383,000 - - - - - - - Fallston 611 41,614,534 0.0500 - - - - - - - - - - Garland 635 27,760,638 0.7200 - - - - - - - - - 228,938 Gibson 520 16,484,425 0.6800 - - - - - - - - - - Grantsboro 692 61,048,104 0.0500 - - - - - - - - - - Greenevers 651 19,367,544 0.3000 2,000 - 2,000 - - - - - - - Grover 715 34,703,333 0.3900 - - - - 32,984 - 32,984 - - - Harmony 549 31,726,974 0.1000 222,000 - 222,000 - - - - - - - High Shoals 709 27,875,405 0.4100 - - - - - 300,000 300,000 300,000 1.076% 423 - Highlands 933 1,744,586,790 0.1640 - - - - - 244,328 244,328 244,328 0.014% 262 1,353,345 Hoffman 563 20,895,833 0.2000 - - - - - - - - - - Holden Beach 633 1,213,014,311 0.2200 - - - - 1,893,898 2,663,466 4,557,364 2,663,466 0.220% 4,208 12,000,000 Hot Springs 582 42,694,153 0.5100 128,500 - 128,500 - - - - - - - Kenansville 817 75,098,483 0.4700 12,000 - 12,000 - - - - - - - Kingstown 679 18,338,054 0.3500 - - - - - - - - - - Kittrell 524 8,428,703 0.1000 - - - - - - - - - - Lawndale 605 21,415,351 0.2300 - - - - - - - - - - Lewiston-Woodville 520 21,271,908 0.6000 - - - - - - - - - - Lilesville 527 18,618,836 0.4800 - - - - - - - - - 250,000 Littleton 647 33,890,922 0.8000 199,000 - 199,000 - - - - - - 50,295 Magnolia 964 26,126,456 0.6600 - - - - - 200,000 200,000 200,000 0.766% 207 - Marshall 925 94,422,736 0.4900 - - - - 63,673 - 63,673 - - - McAdenville 680 115,545,888 0.3000 - - - - - - - - - -
Page 14
ANALYSIS OF DEBT OFNORTH CAROLINA MUNICIPALITIES 6-30-2017 Revised: 01/25/2018
DEPARTMENT OF STATE TREASURERDIVISION OF STATE AND LOCAL GOVERNMENT FINANCE
Total Outstanding Ratios of Total Revenue bonds,G.O.B. Debt, Outstanding G.O.B. Debt, Revolving and State
ASSESSED PROPERTY GENERAL OBLIGATION BONDED DEBT AND NOTES INSTALLMENT PURCHASE DEBT Authorized & Authorized and Unissued Bond Loans; andVALUATION Authorized & Unissued G.O.B. Debt and IP Debt Special Obligation
Unissued G.O.B. G.O.B.Debt and (Excluding Enterprise) BondsRatings Tax Rate Debt IP Debt Appraised
7/1/2016 Total Appraised per $100 (Excluding (Excluding PropertyMunicipalities Fitch Moody's S & P Population Value 2016-2017 Valuation Enterprise Other Total Enterprise) Enterprise Other Total Enterprise) * Value Per Capita Other Debt **
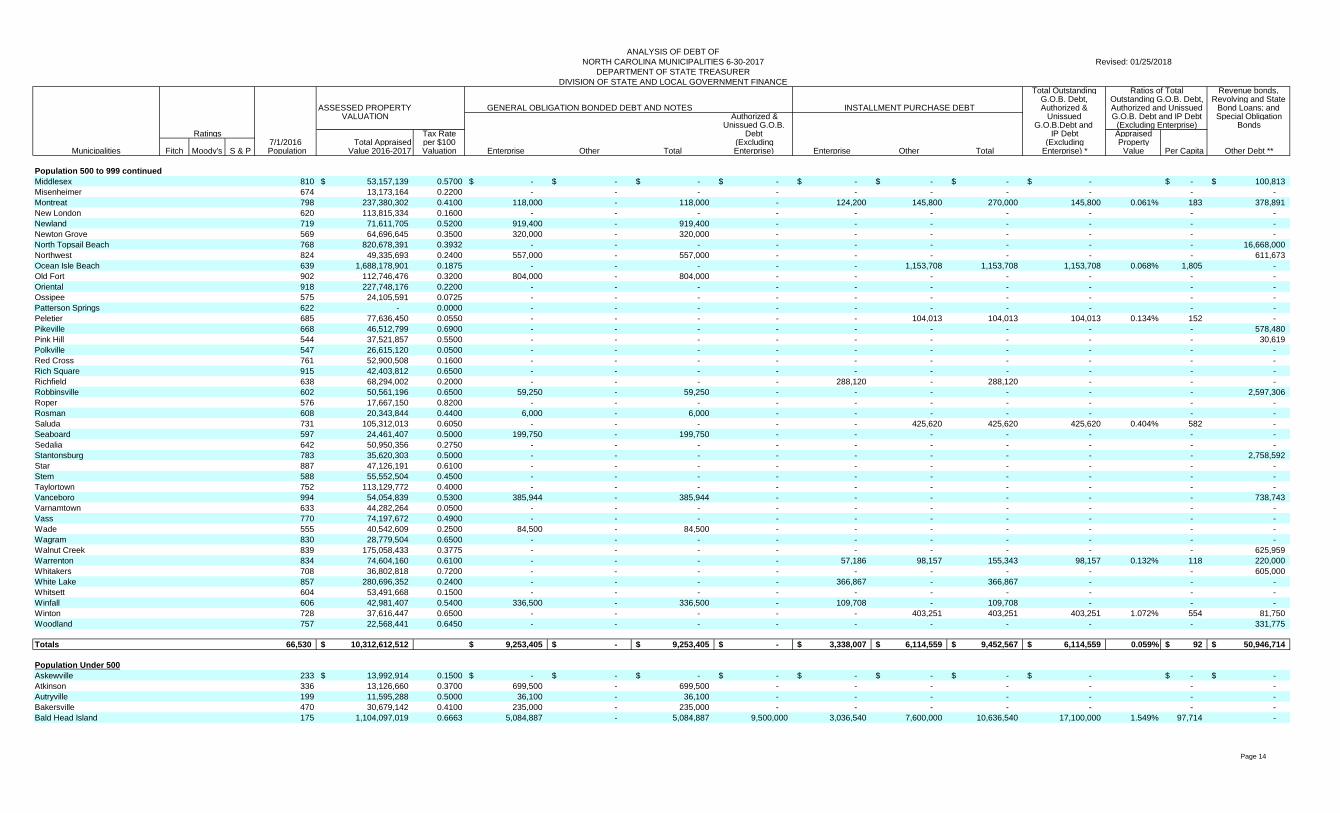
Population 500 to 999 continuedMiddlesex 810 53,157,139$ 0.5700 -$ -$ -$ -$ -$ -$ -$ -$ -$ 100,813$ Misenheimer 674 13,173,164 0.2200 - - - - - - - - - - Montreat 798 237,380,302 0.4100 118,000 - 118,000 - 124,200 145,800 270,000 145,800 0.061% 183 378,891 New London 620 113,815,334 0.1600 - - - - - - - - - - Newland 719 71,611,705 0.5200 919,400 - 919,400 - - - - - - - Newton Grove 569 64,696,645 0.3500 320,000 - 320,000 - - - - - - - North Topsail Beach 768 820,678,391 0.3932 - - - - - - - - - 16,668,000 Northwest 824 49,335,693 0.2400 557,000 - 557,000 - - - - - - 611,673 Ocean Isle Beach 639 1,688,178,901 0.1875 - - - - - 1,153,708 1,153,708 1,153,708 0.068% 1,805 - Old Fort 902 112,746,476 0.3200 804,000 - 804,000 - - - - - - - Oriental 918 227,748,176 0.2200 - - - - - - - - - - Ossipee 575 24,105,591 0.0725 - - - - - - - - - - Patterson Springs 622 - 0.0000 - - - - - - - - - - Peletier 685 77,636,450 0.0550 - - - - - 104,013 104,013 104,013 0.134% 152 - Pikeville 668 46,512,799 0.6900 - - - - - - - - - 578,480 Pink Hill 544 37,521,857 0.5500 - - - - - - - - - 30,619 Polkville 547 26,615,120 0.0500 - - - - - - - - - - Red Cross 761 52,900,508 0.1600 - - - - - - - - - - Rich Square 915 42,403,812 0.6500 - - - - - - - - - - Richfield 638 68,294,002 0.2000 - - - - 288,120 - 288,120 - - - Robbinsville 602 50,561,196 0.6500 59,250 - 59,250 - - - - - - 2,597,306 Roper 576 17,667,150 0.8200 - - - - - - - - - - Rosman 608 20,343,844 0.4400 6,000 - 6,000 - - - - - - - Saluda 731 105,312,013 0.6050 - - - - - 425,620 425,620 425,620 0.404% 582 - Seaboard 597 24,461,407 0.5000 199,750 - 199,750 - - - - - - - Sedalia 642 50,950,356 0.2750 - - - - - - - - - - Stantonsburg 783 35,620,303 0.5000 - - - - - - - - - 2,758,592 Star 887 47,126,191 0.6100 - - - - - - - - - - Stem 588 55,552,504 0.4500 - - - - - - - - - - Taylortown 752 113,129,772 0.4000 - - - - - - - - - - Vanceboro 994 54,054,839 0.5300 385,944 - 385,944 - - - - - - 738,743 Varnamtown 633 44,282,264 0.0500 - - - - - - - - - - Vass 770 74,197,672 0.4900 - - - - - - - - - - Wade 555 40,542,609 0.2500 84,500 - 84,500 - - - - - - - Wagram 830 28,779,504 0.6500 - - - - - - - - - - Walnut Creek 839 175,058,433 0.3775 - - - - - - - - - 625,959 Warrenton 834 74,604,160 0.6100 - - - - 57,186 98,157 155,343 98,157 0.132% 118 220,000 Whitakers 708 36,802,818 0.7200 - - - - - - - - - 605,000 White Lake 857 280,696,352 0.2400 - - - - 366,867 - 366,867 - - - Whitsett 604 53,491,668 0.1500 - - - - - - - - - - Winfall 606 42,981,407 0.5400 336,500 - 336,500 - 109,708 - 109,708 - - - Winton 728 37,616,447 0.6500 - - - - - 403,251 403,251 403,251 1.072% 554 81,750 Woodland 757 22,568,441 0.6450 - - - - - - - - - 331,775
Totals 66,530 10,312,612,512$ 9,253,405$ -$ 9,253,405$ -$ 3,338,007$ 6,114,559$ 9,452,567$ 6,114,559$ 0.059% 92$ 50,946,714$
Population Under 500Askewville 233 13,992,914$ 0.1500 -$ -$ -$ -$ -$ -$ -$ -$ -$ -$ Atkinson 336 13,126,660 0.3700 699,500 - 699,500 - - - - - - - Autryville 199 11,595,288 0.5000 36,100 - 36,100 - - - - - - - Bakersville 470 30,679,142 0.4100 235,000 - 235,000 - - - - - - - Bald Head Island 175 1,104,097,019 0.6663 5,084,887 - 5,084,887 9,500,000 3,036,540 7,600,000 10,636,540 17,100,000 1.549% 97,714 -

Page 15
ANALYSIS OF DEBT OFNORTH CAROLINA MUNICIPALITIES 6-30-2017 Revised: 01/25/2018
DEPARTMENT OF STATE TREASURERDIVISION OF STATE AND LOCAL GOVERNMENT FINANCE
Total Outstanding Ratios of Total Revenue bonds,G.O.B. Debt, Outstanding G.O.B. Debt, Revolving and State
ASSESSED PROPERTY GENERAL OBLIGATION BONDED DEBT AND NOTES INSTALLMENT PURCHASE DEBT Authorized & Authorized and Unissued Bond Loans; andVALUATION Authorized & Unissued G.O.B. Debt and IP Debt Special Obligation
Unissued G.O.B. G.O.B.Debt and (Excluding Enterprise) BondsRatings Tax Rate Debt IP Debt Appraised
7/1/2016 Total Appraised per $100 (Excluding (Excluding PropertyMunicipalities Fitch Moody's S & P Population Value 2016-2017 Valuation Enterprise Other Total Enterprise) Enterprise Other Total Enterprise) * Value Per Capita Other Debt **
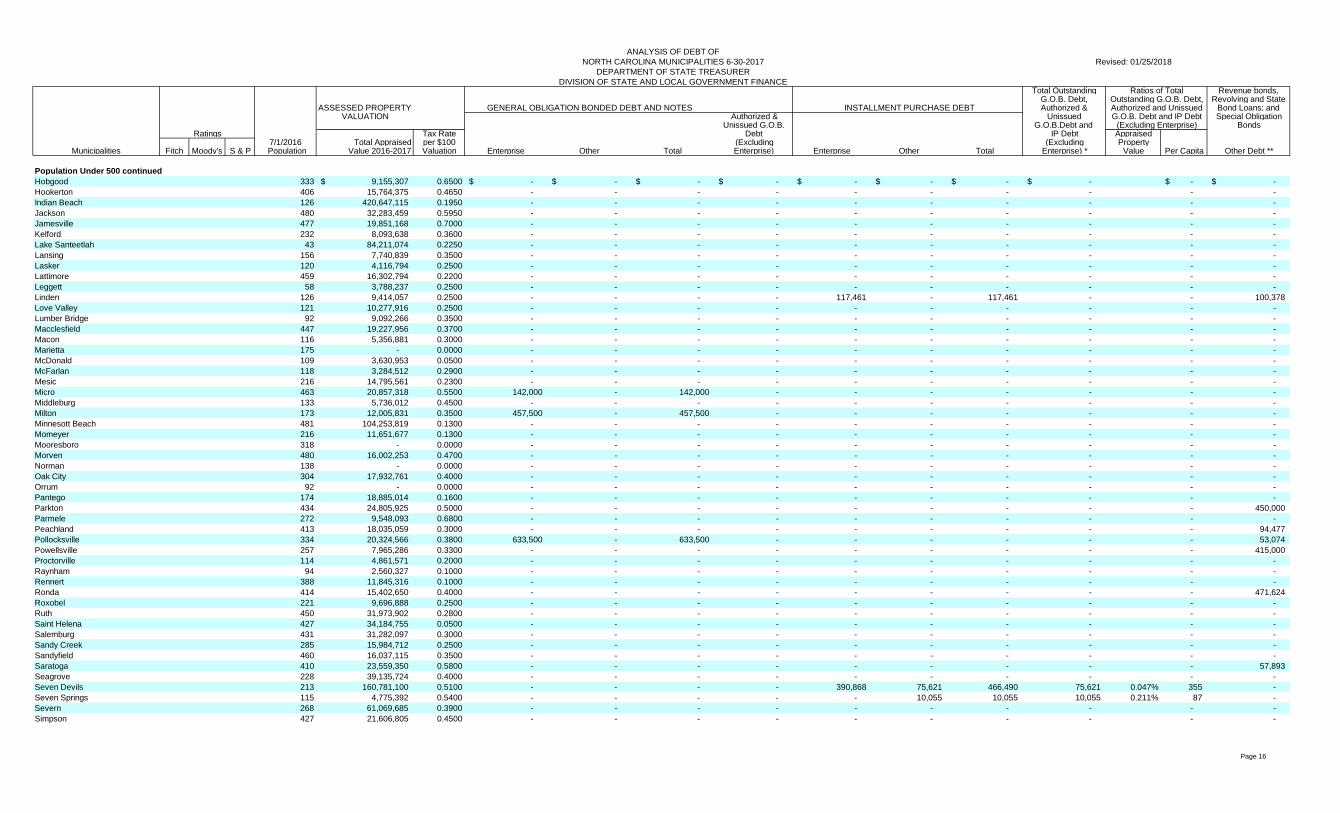
Population Under 500 continuedBath 240 49,911,713$ 0.1800 178,000$ -$ 178,000$ -$ -$ -$ -$ -$ -$ 728,646$ Bear Grass 73 5,652,158 0.2700 - - - - - - - - - - Beech Mountain 332 534,105,127 0.7320 - - - - 642,888 262,044 904,932 262,044 0.049% 789 5,342,625 Bethania 324 34,310,092 0.3000 - - - - - - - - - - Boardman 155 6,824,704 0.0500 - - - - - - - - - - Bolivia 159 13,791,204 0.0500 - - - - - - - - - - Bostic 388 17,002,651 0.2600 - - - - 150,000 223,624 373,624 223,624 1.315% 576 - Bridgeton 463 57,545,577 0.5000 323,755 - 323,755 - - - - - - - Brookford 374 18,095,897 0.5200 - - - - - - - - - - Bunn 347 24,554,102 0.6900 8,000 - 8,000 - - - - - - 868,007 Cameron 331 18,038,954 0.5750 - - - - - - - - - - Casar 298 16,117,055 0.0500 - - - - - - - - - - Castalia 255 9,391,508 0.3000 - - - - - - - - - - Caswell Beach 450 278,868,949 0.2200 - - - - - 652,663 652,663 652,663 0.234% 1,450 - Cedar Rock 291 53,574,169 0.1500 - - - - - - - - - - Centerville 88 - 0.0000 - - - - - - - - - - Cerro Gordo 198 7,940,037 0.2000 - - - - - - - - - - Chimney Rock 111 54,858,904 0.1100 - - - - - - - - - 36,446 Cofield 406 33,247,992 0.4500 141,500 - 141,500 - - - - - - 534,000 Colerain 191 13,480,394 0.4500 - - - - - - - - - - Como 91 5,460,384 0.3000 - - - - - - - - - - Conetoe 276 11,898,679 0.1900 - - - - - - - - - - Cove City 387 16,678,359 0.2678 - - - - - - - - - 148,199 Creswell 264 17,921,260 0.5000 - - - - - - - - - - Crossnore 197 10,992,404 0.2400 - - - - - - - - - - Danbury 184 11,309,796 0.2700 5,000 - 5,000 - - - - - - - Dillsboro 233 42,146,150 0.2100 - - - - - - - - - - Dover 385 16,008,194 0.3500 - - - - - - - - - 296,145 Dublin 349 16,893,015 0.4900 - - - - - - - - - 105,948 Duck 396 1,602,528,798 0.2100 - - - - - 2,000,000 2,000,000 2,000,000 0.125% 5,051 6,963,000 Earl 268 9,687,608 0.1700 - - - - - - - - - - East Arcadia 473 14,243,864 0.3600 - - - - - - - - - - East Laurinburg 293 5,211,093 0.3000 - - - - - - - - - - Elk Park 455 21,225,979 0.3000 220,500 - 220,500 - - - - - - - Eureka 190 10,179,065 0.7500 - - - - - - - - - - Everetts 158 7,677,118 0.4000 - - - - - - - - - - Falcon 321 16,759,018 0.1500 - - - - - - - - - - Falkland 96 4,391,084 0.4500 - - - - - - - - - - Fontana Dam 23 1,503,337 0.5540 - - - - - - - - - - Forest Hills 378 28,680,248 0.1500 - - - - - - - - - - Fountain 427 23,156,219 0.5875 2,000 - 2,000 - - - - - - - Gatesville 317 35,172,847 0.1600 - - - - - - - - - - Godwin 138 8,388,225 0.2400 - - - - - - - - - - Goldston 281 24,461,615 0.1900 2,898,934 - 2,898,934 - - - - - - - Grandfather Village 25 - 0.0000 - - - - - - - - - - Grimesland 446 21,682,887 0.4800 229,500 - 229,500 - - - - - - - Halifax 229 11,983,740 0.6600 - - - - - 20,750 20,750 20,750 0.173% 91 - Hamilton 395 13,421,508 0.5200 - - - - - - - - - 1,135,000 Harrells 203 12,974,798 0.1900 - - - - - - - - - - Harrellsville 104 6,098,300 0.3500 374,000 - 374,000 - - - - - - - Hassell 84 2,547,325 0.2500 - - - - - - - - - - Hayesville 363 37,346,743 0.2650 23,000 - 23,000 - - - - - - -
Page 16
ANALYSIS OF DEBT OFNORTH CAROLINA MUNICIPALITIES 6-30-2017 Revised: 01/25/2018
DEPARTMENT OF STATE TREASURERDIVISION OF STATE AND LOCAL GOVERNMENT FINANCE
Total Outstanding Ratios of Total Revenue bonds,G.O.B. Debt, Outstanding G.O.B. Debt, Revolving and State
ASSESSED PROPERTY GENERAL OBLIGATION BONDED DEBT AND NOTES INSTALLMENT PURCHASE DEBT Authorized & Authorized and Unissued Bond Loans; andVALUATION Authorized & Unissued G.O.B. Debt and IP Debt Special Obligation
Unissued G.O.B. G.O.B.Debt and (Excluding Enterprise) BondsRatings Tax Rate Debt IP Debt Appraised
7/1/2016 Total Appraised per $100 (Excluding (Excluding PropertyMunicipalities Fitch Moody's S & P Population Value 2016-2017 Valuation Enterprise Other Total Enterprise) Enterprise Other Total Enterprise) * Value Per Capita Other Debt **
Population Under 500 continuedHobgood 333 9,155,307$ 0.6500 -$ -$ -$ -$ -$ -$ -$ -$ -$ -$ Hookerton 406 15,764,375 0.4650 - - - - - - - - - - Indian Beach 126 420,647,115 0.1950 - - - - - - - - - - Jackson 480 32,283,459 0.5950 - - - - - - - - - - Jamesville 477 19,851,168 0.7000 - - - - - - - - - - Kelford 232 8,093,638 0.3600 - - - - - - - - - - Lake Santeetlah 43 84,211,074 0.2250 - - - - - - - - - - Lansing 156 7,740,839 0.3500 - - - - - - - - - - Lasker 120 4,116,794 0.2500 - - - - - - - - - - Lattimore 459 16,302,794 0.2200 - - - - - - - - - - Leggett 58 3,788,237 0.2500 - - - - - - - - - - Linden 126 9,414,057 0.2500 - - - - 117,461 - 117,461 - - 100,378 Love Valley 121 10,277,916 0.2500 - - - - - - - - - - Lumber Bridge 92 9,092,266 0.3500 - - - - - - - - - - Macclesfield 447 19,227,956 0.3700 - - - - - - - - - - Macon 116 5,356,881 0.3000 - - - - - - - - - - Marietta 175 - 0.0000 - - - - - - - - - - McDonald 109 3,630,953 0.0500 - - - - - - - - - - McFarlan 118 3,284,512 0.2900 - - - - - - - - - - Mesic 216 14,795,561 0.2300 - - - - - - - - - - Micro 463 20,857,318 0.5500 142,000 - 142,000 - - - - - - - Middleburg 133 5,736,012 0.4500 - - - - - - - - - - Milton 173 12,005,831 0.3500 457,500 - 457,500 - - - - - - - Minnesott Beach 481 104,253,819 0.1300 - - - - - - - - - - Momeyer 216 11,651,677 0.1300 - - - - - - - - - - Mooresboro 318 - 0.0000 - - - - - - - - - - Morven 480 16,002,253 0.4700 - - - - - - - - - - Norman 138 - 0.0000 - - - - - - - - - - Oak City 304 17,932,761 0.4000 - - - - - - - - - - Orrum 92 - 0.0000 - - - - - - - - - - Pantego 174 18,885,014 0.1600 - - - - - - - - - - Parkton 434 24,805,925 0.5000 - - - - - - - - - 450,000 Parmele 272 9,548,093 0.6800 - - - - - - - - - - Peachland 413 18,035,059 0.3000 - - - - - - - - - 94,477 Pollocksville 334 20,324,566 0.3800 633,500 - 633,500 - - - - - - 53,074 Powellsville 257 7,965,286 0.3300 - - - - - - - - - 415,000 Proctorville 114 4,861,571 0.2000 - - - - - - - - - - Raynham 94 2,560,327 0.1000 - - - - - - - - - - Rennert 388 11,845,316 0.1000 - - - - - - - - - - Ronda 414 15,402,650 0.4000 - - - - - - - - - 471,624 Roxobel 221 9,696,888 0.2500 - - - - - - - - - - Ruth 450 31,973,902 0.2800 - - - - - - - - - - Saint Helena 427 34,184,755 0.0500 - - - - - - - - - - Salemburg 431 31,282,097 0.3000 - - - - - - - - - - Sandy Creek 285 15,984,712 0.2500 - - - - - - - - - - Sandyfield 460 16,037,115 0.3500 - - - - - - - - - - Saratoga 410 23,559,350 0.5800 - - - - - - - - - 57,893 Seagrove 228 39,135,724 0.4000 - - - - - - - - - - Seven Devils 213 160,781,100 0.5100 - - - - 390,868 75,621 466,490 75,621 0.047% 355 - Seven Springs 115 4,775,392 0.5400 - - - - - 10,055 10,055 10,055 0.211% 87 - Severn 268 61,069,685 0.3900 - - - - - - - - - - Simpson 427 21,606,805 0.4500 - - - - - - - - - -
Page 17
ANALYSIS OF DEBT OFNORTH CAROLINA MUNICIPALITIES 6-30-2017 Revised: 01/25/2018
DEPARTMENT OF STATE TREASURERDIVISION OF STATE AND LOCAL GOVERNMENT FINANCE
Total Outstanding Ratios of Total Revenue bonds,G.O.B. Debt, Outstanding G.O.B. Debt, Revolving and State
ASSESSED PROPERTY GENERAL OBLIGATION BONDED DEBT AND NOTES INSTALLMENT PURCHASE DEBT Authorized & Authorized and Unissued Bond Loans; andVALUATION Authorized & Unissued G.O.B. Debt and IP Debt Special Obligation
Unissued G.O.B. G.O.B.Debt and (Excluding Enterprise) BondsRatings Tax Rate Debt IP Debt Appraised
7/1/2016 Total Appraised per $100 (Excluding (Excluding PropertyMunicipalities Fitch Moody's S & P Population Value 2016-2017 Valuation Enterprise Other Total Enterprise) Enterprise Other Total Enterprise) * Value Per Capita Other Debt **
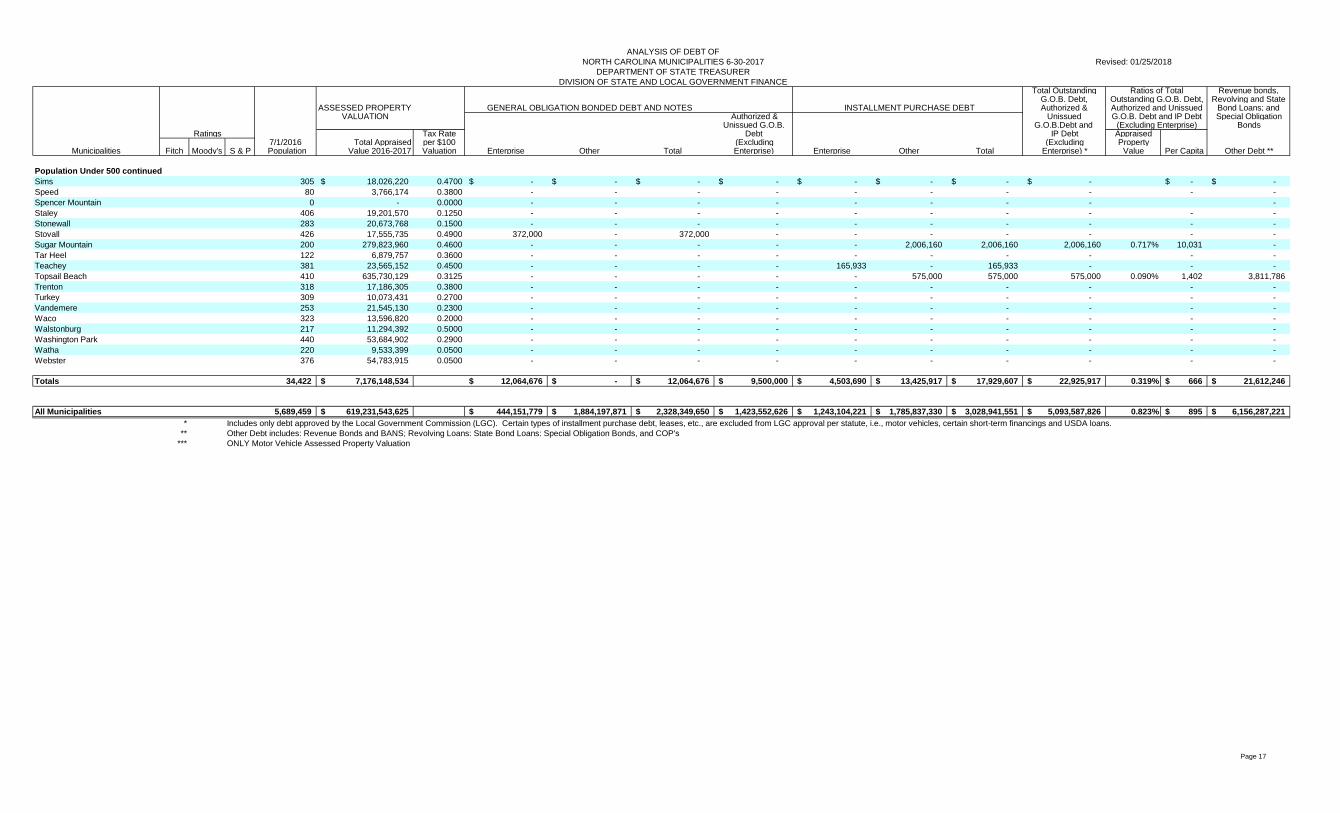
Population Under 500 continuedSims 305 18,026,220$ 0.4700 -$ -$ -$ -$ -$ -$ -$ -$ -$ -$ Speed 80 3,766,174 0.3800 - - - - - - - - - - Spencer Mountain 0 - 0.0000 - - - - - - - - - Staley 406 19,201,570 0.1250 - - - - - - - - - - Stonewall 283 20,673,768 0.1500 - - - - - - - - - - Stovall 426 17,555,735 0.4900 372,000 - 372,000 - - - - - - - Sugar Mountain 200 279,823,960 0.4600 - - - - - 2,006,160 2,006,160 2,006,160 0.717% 10,031 - Tar Heel 122 6,879,757 0.3600 - - - - - - - - - - Teachey 381 23,565,152 0.4500 - - - - 165,933 - 165,933 - - - Topsail Beach 410 635,730,129 0.3125 - - - - - 575,000 575,000 575,000 0.090% 1,402 3,811,786 Trenton 318 17,186,305 0.3800 - - - - - - - - - - Turkey 309 10,073,431 0.2700 - - - - - - - - - - Vandemere 253 21,545,130 0.2300 - - - - - - - - - - Waco 323 13,596,820 0.2000 - - - - - - - - - - Walstonburg 217 11,294,392 0.5000 - - - - - - - - - - Washington Park 440 53,684,902 0.2900 - - - - - - - - - - Watha 220 9,533,399 0.0500 - - - - - - - - - - Webster 376 54,783,915 0.0500 - - - - - - - - - -
Totals 34,422 7,176,148,534$ 12,064,676$ -$ 12,064,676$ 9,500,000$ 4,503,690$ 13,425,917$ 17,929,607$ 22,925,917$ 0.319% 666$ 21,612,246$
All Municipalities 5,689,459 619,231,543,625$ 444,151,779$ 1,884,197,871$ 2,328,349,650$ 1,423,552,626$ 1,243,104,221$ 1,785,837,330$ 3,028,941,551$ 5,093,587,826$ 0.823% 895$ 6,156,287,221$ * Includes only debt approved by the Local Government Commission (LGC). Certain types of installment purchase debt, leases, etc., are excluded from LGC approval per statute, i.e., motor vehicles, certain short-term financings and USDA loans.
** Other Debt includes: Revenue Bonds and BANS; Revolving Loans: State Bond Loans: Special Obligation Bonds, and COP's*** ONLY Motor Vehicle Assessed Property Valuation