Embed Size (px)
Citation preview

Debris-flow velocity and volume estimations based on seismic dataAndreas Schimmel1,2, Velio Coviello1, and Francesco Comiti1
1Free University of Bozen-Bolzano, Faculty of Science and Technology, Italy2Andreas Schimmel - Alpine Monitoring Systems (ALMOSYS), Mkt. Piesting, Austria
Correspondence: Andreas Schimmel ([email protected])
Abstract. The estimation of debris-flow velocity and volume is a fundamental task for the development of early warning
systems, the design of control structures and other mitigation measures. Previous analysis of the seismic energy produced by
debris flows showed that the peak amplitudes are representative of the kinetic energy of each surge and debris-flow discharge
can be therefore estimated based on seismic signals. Also, the debris-flow velocity can be calculated using seismic data recorded
at two spatial separated stations located along the channel by the use of cross-correlation. This work provide a first approach5
for estimating the total volume of debris flows based on the seismic signal detected with simple, low-cost geophones installed
along the debris-flow channel. The developed methods was applied to seismic data collected on three different test sites in the
Alps: Gadria (IT), Lattenbach (AT), and Cancia (IT). An adaptable cross-correlation time window was used, which can offer a
better estimation of the velocity compared to a constant window length. The analyses of the seismic data of 14 debris flows that
occurred from 2014 to 2018 shows the strong control of the sampling rate and the sensor-distance on the velocity estimation.10
A simple approach based on a linear relation between square of the seismic amplitude and the event magnitude is proposed for
a first order estimation of the debris-flow magnitude.
1 Introduction
With the rapid socio-economic development of European mountain areas, the automatic detection and identification of mass
movements like landslides, debris flows, and avalanches become of paramount importance for risk mitigation. Technological15
development has rapidly advanced during the last decade, as well as the conceptual advancements brought by former debris-
flow research, making the implementation of monitoring devices for research, early warning and alarm purposes more and
more effective and feasible (Hürlimann et al., 2019). Past studies showed that such processes induce characteristic seismic and
acoustic signals, the latter mostly in the infrasonic spectrum which can thus be used for event detection. Several investigations
have already addressed signal processing and detection methods based on seismic (e.g., Coviello et al., 2018; Walter et al.,20
2017; Burtin et al., 2016) or infrasound sensors (e.g., Zhang et al., 2004; Ulivieri et al., 2012; Marchetti et al., 2019). However,
for developing an efficient warning system, not only the detection of events is important but also the identification of the event
type (e.g. debris flow vs debris flood) and the estimation of its magnitude and velocity.
An early approach to estimate the process velocity based on seismic data and cross-correlation was proposed by Arattano
and Marchi (2005). Later, Havens et al. (2014) and Marchetti et al. (2015) used arrays of infrasound sensors to estimate the25
velocity of snow avalanches. Whereas Takezawa et al. (2010) developed a method by which flow velocity is estimated based
1
https://doi.org/10.5194/nhess-2020-411Preprint. Discussion started: 4 January 2021c© Author(s) 2021. CC BY 4.0 License.

on the amplification rate of the seismic signals of debris flows. In terms of event volumes, Manconi et al. (2016) presented an
estimation of rockslides volumes based on the ratio between local magnitudes and duration magnitudes detected by broadband
seismic networks. For debris flows, Coviello et al. (2019) investigated the energy radiated by natural debris flow surges de-
ducing a scaling relation between kinetic and seismic energy. Interestingly, Pérez-Guillén et al. (2019) deduced similar scaling30
relationships based on seismic parameters to quantify the size of mass flows at Mt. Fuji, Japan, independently from the type of
flow (avalanches or lahars) and from the flow path.
Given the measured value of flow velocity gathered from a pair of geophones installed along the channel and the seismic
energy detected by one of them, the magnitude of the debris flow mass could be estimated (Coviello et al., 2019). Despite
such recent advances, the estimation of debris flow magnitude from seismic data only is a challenging task in the perspective35
of the real time event characterization, and uncertainties in the volume estimations are still large (Coviello et al., 2019; Pérez-
Guillén et al., 2019; Walsh et al., 2012). Most of the few studies published so far have addressed single catchments and no
universal, simple method to estimate magnitude and flow velocity only on seismic amplitudes without external parameters has
been developed until now.
This paper presents a first attempt to overcome the site-specificity inherent in the previous studies by embracing a multiple40
site analysis, with the aim to test a simple but robust methodology to estimate debris flows and debris floods velocity and
magnitude based on seismic data, without the need to perform site-specific calibration.
2 Methods
Data collected in three small catchments located in the European Alps prone to frequent debris flows are analysed here (Fig-
ure 1): Gadria (South Tyrol, Italy), Lattenbach (Tyrol, Austria), and Cancia (Belluno, Italy).45
2
https://doi.org/10.5194/nhess-2020-411Preprint. Discussion started: 4 January 2021c© Author(s) 2021. CC BY 4.0 License.

Figure 1. Maps showing the three study catchments location
The Gadria basin is located in the Vinschgau-Venosta valley, in the North-eastern Italian Alps. It has a catchment area of
6.3 km2, ranges in elevation from 2,945 m a.s.l down to 1,394 m a.s.l and is characterized by a regular debris-flow activity.
The monitoring system consists of rain gauges, flow stage sensors, geophones, video cameras, piezometers and soil moisture
probes. Debris flow depth is monitored by radar sensors installed at three cross-sections along the main channel. A linear array
of geophones is used for event detection based on a STA/LTA algorithm (Coviello et al., 2019) and this geophone data can50
also be used to calculate the velocity. Figure 2 gives an overview of the catchment and the monitoring setup. The geophones
G1 and G2 used for the calculation of the velocity (marked with a yellow circle) are placed in a distance of 75 m along the
channel. The geophone G4 used for the magnitude estimation is part of a debris flow detection system based on a combination
of infrasound and seismic sensors. This detection system (MAMODIS) consists of one infrasound sensor, one geophone and a
microcontroller, where a specially designed detection algorithm is executed which reliable detects events in real time directly55
at the sensor site (Schimmel and Hübl, 2016; Schimmel et al., 2018).
The Lattenbach Creek (district of Landeck, Tyrol) has a catchment area of 5.3 km2 and is a monitoring site for debris flows
operated by the Institute of Mountain Risk Engineering at the University of Natural Resources and Life Sciences, Vienna (Hübl
and Moser, 2006). Three monitoring stations are installed along the channel (Figure 3), and these are equipped with flow height
(radar gauges), geophones, video cameras, 2D-Laser scanner. The station "Darwinalpe" is a meteorological monitoring station.60
At the middle monitoring station, a debris flow Pulse-Doppler Radar can be used for measuring the surface velocity. Near
this radar, two stations for testing the warning system MAMODIS are installed at a distance of 90 m. The geophone data of
these two stations (G1 and G2) are used to calculate the debris flow velocity and the lower one (G2) is used for the magnitude
estimation in this study.
Finally, the Cancia channel is located in the Dolomites within the Veneto Region (Italy) with the catchment features an65
area of 2.5 km2 on the southwestern slope of Mount Antelao (3264 m a.s.l.) It ranges in elevation between the Salvella Fork
at 2500 m a.s.l. down to a retaining basin at the village of Cancia at 1001 m a.s.l. (Gregoretti et al., 2019). The data used
for the magnitude estimation and velocity calculation are recorded by the geophones installed at station 2 and 3 belonging
3
https://doi.org/10.5194/nhess-2020-411Preprint. Discussion started: 4 January 2021c© Author(s) 2021. CC BY 4.0 License.

Figure 2. (a) Overview of the test site Gadria (red line: catchment area); (b) Closer view of the monitoring station 2 and sensor setup
(background images: ©Google Maps, 2020 (Maxar Technologies)).
Figure 3. (a) Overview of the test site Lattenbach (red line: catchment area); (b) Closer view of the monitoring station 1 and 2 and sensor
setup (background images: ©Google Maps, 2020 (Maxar Technologies)).
to the monitoring and warning system designed by the company CAE (CAE, 2014; Cavalli et al., 2020). Geophone G1 and
G3 are used for the velocity estimation and geophone G2 is used for the magnitude estimation. Beside a monitoring system70
4
https://doi.org/10.5194/nhess-2020-411Preprint. Discussion started: 4 January 2021c© Author(s) 2021. CC BY 4.0 License.

Figure 4. (a) Overview of the test site Cancia (red line: catchment area); (b) Closer view of the monitoring station 2 and sensor setup
(background images: ©Google Maps, 2020 (CNES, Airbus)).
of the company CAE, three monitoring stations have been installed by UNIBZ and the Dipartimento di Scienze Biologiche,
Geologiche e Ambientali, Universitá di Bologna in 2019 (Figure 4a). This monitoring stations include two laser stage sensors,
two rain gauges, several time-lapse cameras, geophones and the infrasound/seismic detection system MAMODIS and integrates
a monitoring network that was operational in the previous years only for scientific purposes (Simoni et al., 2015).
Table 1 gives an overview of the seismic sensors used at the different sites. The seismic amplitudes used for this study are75
calculated every second from the seismic data recorded at the reported sampling rates. At Cancia, an internal sample rate of
500 Hz is used, but the available seismic data are recorded as 0.1 Hz max. amplitude values. For the SG-5 and SM-6 geophones
amplitude values of 1 Hz are calculated from the raw signals sampled at 100 Hz and at Gadria the used data for this study are
0.5 Hz amplitude values.
2.1 Velocity estimation80
The estimation of the velocity is carried out by the time-distance method, whereby velocity is calculated as the distance between
two stations measuring seismic amplitude along the channel divided by the time difference of the two signals calculated from
amplitude maximum values (Coviello et al., 2020; Schimmel et al., 2018), or by cross-correlation of the two seismic signals
(Arattano et al., 2012). The result of this method is a mean surge velocity (celerity). To obtain the time difference based on
amplitude maxima, the signal is manually analysed identifying comparable peaks (i.e., representing the debris flow front or85
subsequent surges) in the signals recoded at the two stations. For the cross-correlation, three different sliding time windows
are used because an adaptation of the time window ensures better results for the cross-correlation during the whole flow (from
turbulent to smooth). For choosing the window length, the relation between maximum amplitude and minimum amplitude is
5
https://doi.org/10.5194/nhess-2020-411Preprint. Discussion started: 4 January 2021c© Author(s) 2021. CC BY 4.0 License.
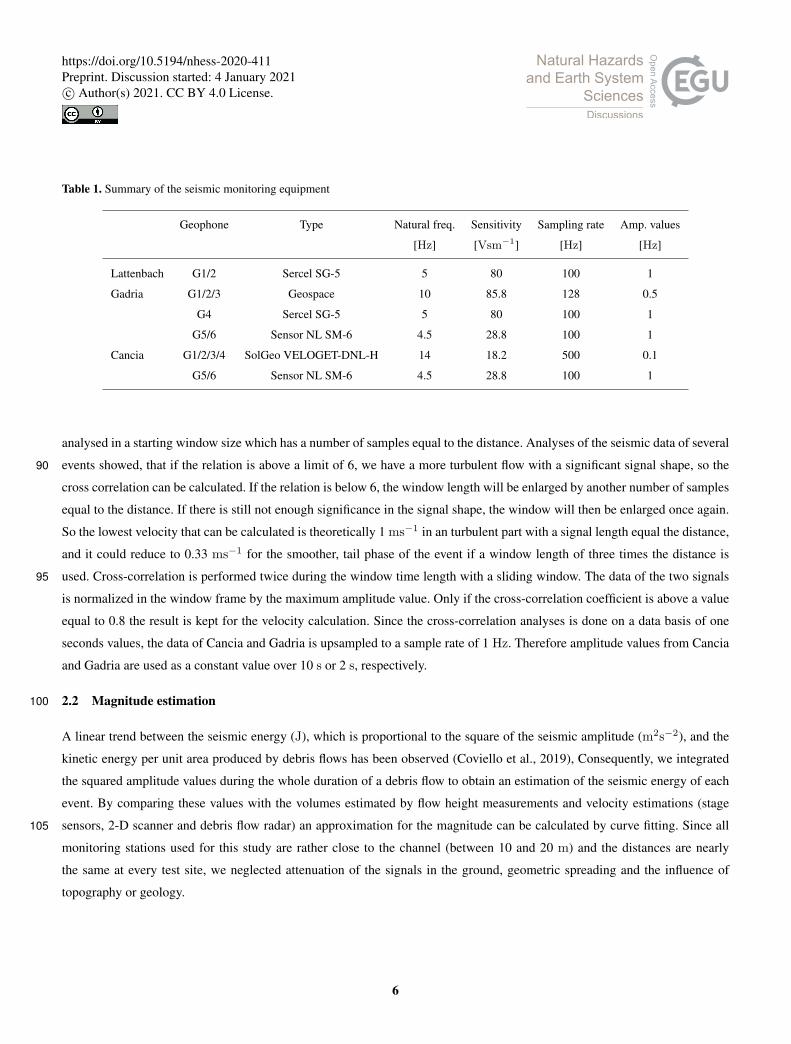
Table 1. Summary of the seismic monitoring equipment
Geophone Type Natural freq. Sensitivity Sampling rate Amp. values
[Hz] [Vsm−1] [Hz] [Hz]
Lattenbach G1/2 Sercel SG-5 5 80 100 1
Gadria G1/2/3 Geospace 10 85.8 128 0.5
G4 Sercel SG-5 5 80 100 1
G5/6 Sensor NL SM-6 4.5 28.8 100 1
Cancia G1/2/3/4 SolGeo VELOGET-DNL-H 14 18.2 500 0.1
G5/6 Sensor NL SM-6 4.5 28.8 100 1
analysed in a starting window size which has a number of samples equal to the distance. Analyses of the seismic data of several
events showed, that if the relation is above a limit of 6, we have a more turbulent flow with a significant signal shape, so the90
cross correlation can be calculated. If the relation is below 6, the window length will be enlarged by another number of samples
equal to the distance. If there is still not enough significance in the signal shape, the window will then be enlarged once again.
So the lowest velocity that can be calculated is theoretically 1 ms−1 in an turbulent part with a signal length equal the distance,
and it could reduce to 0.33 ms−1 for the smoother, tail phase of the event if a window length of three times the distance is
used. Cross-correlation is performed twice during the window time length with a sliding window. The data of the two signals95
is normalized in the window frame by the maximum amplitude value. Only if the cross-correlation coefficient is above a value
equal to 0.8 the result is kept for the velocity calculation. Since the cross-correlation analyses is done on a data basis of one
seconds values, the data of Cancia and Gadria is upsampled to a sample rate of 1 Hz. Therefore amplitude values from Cancia
and Gadria are used as a constant value over 10 s or 2 s, respectively.
2.2 Magnitude estimation100
A linear trend between the seismic energy (J), which is proportional to the square of the seismic amplitude (m2s−2), and the
kinetic energy per unit area produced by debris flows has been observed (Coviello et al., 2019), Consequently, we integrated
the squared amplitude values during the whole duration of a debris flow to obtain an estimation of the seismic energy of each
event. By comparing these values with the volumes estimated by flow height measurements and velocity estimations (stage
sensors, 2-D scanner and debris flow radar) an approximation for the magnitude can be calculated by curve fitting. Since all105
monitoring stations used for this study are rather close to the channel (between 10 and 20 m) and the distances are nearly
the same at every test site, we neglected attenuation of the signals in the ground, geometric spreading and the influence of
topography or geology.
6
https://doi.org/10.5194/nhess-2020-411Preprint. Discussion started: 4 January 2021c© Author(s) 2021. CC BY 4.0 License.

Figure 5. (a) Normalized amplitudes of the two geophones, (b) flow height, (c) velocity estimation based on maximum values and cross-
correlation of the debris flow at Lattenbach on 30. July 2017
3 Results
3.1 Velocity estimation110
Here we present the results obtained about velocity estimation adopting the methods described above, applied to three debris
flows events recorded in different catchments. Figure 5 illustrates velocity estimations applied on the Lattenbach event occurred
on 30. July 2017, which featured a peak discharge of 88 m3s−1, a total volume of 41,100 m3 and an overall duration of around
3500 s.
This debris flow had a front about 1.3 m high, and the velocity (3.5 to 4.7 ms−1) calculated by using the time difference115
between maximum amplitude values results very similar to the velocity calculated by cross-correlation with 4 ms−1. For the
peak discharge (flow height exceeding 3.5 m, the velocity calculated by means of maximum values turns out slightly higher
(10 ms−1) than the one (9 ms−1) determined by cross-correlation. During the following part of the event (i.e., after 2500 s)
no significant surges could be found to calculate flow velocities using maximum values, and the cross-correlation most likely
leads to overestimating velocities.120
Figure 6 displays the seismic signals and the velocity estimation for a debris flow occurred in the Gadria on 08. June 2015,
which was characterized by a total volume of 12,600 m3.
The event is composed of several surges in the range 1-1.5 m flow height. The front velocity and the velocity of the surge
visible at 2000 s seems to be overestimated by the cross-correlation method, because velocities over 9 ms−1 and 7 ms−1
7
https://doi.org/10.5194/nhess-2020-411Preprint. Discussion started: 4 January 2021c© Author(s) 2021. CC BY 4.0 License.

Figure 6. (a) Normalized amplitudes of the two geophones, (b) flow height, (c) velocity estimation based on maximum values and cross-
correlation of the debris flow at Gadria on 08. June 2015
respectively seem unrealistically high based on previous results from the Gadria (Theule et al., 2018; Coviello et al., 2020).125
In contrast, for the other surges, flow velocities calculated based on maximum values and cross-correlation give consistent
estimates, around 5 ms−1.
Finally, Figure 7 shows the case of a debris flow in the Cancia channel. This event was recorded on 01. July 2020. While
the debris flows height reaches 2.4 m, flow velocities for this event appear to be lower (max. 3.2 ms−1) than in the case of
Lattenbach and Gadria.130
8
https://doi.org/10.5194/nhess-2020-411Preprint. Discussion started: 4 January 2021c© Author(s) 2021. CC BY 4.0 License.

Figure 7. (a) Normalized amplitudes of the two geophones, (b) flow height, (c) velocity estimation based on maximum values and cross-
correlation of the debris flow at Cancia on 01. July 2020
9
https://doi.org/10.5194/nhess-2020-411Preprint. Discussion started: 4 January 2021c© Author(s) 2021. CC BY 4.0 License.

Table 2. List of event dates and volumes for all sites
Date tot. Volume [m3] Duration [s]
Lattenbach 09.08.15 11500 1600
10.08.15 18500 2800
16.08.15 5000 1200
10.09.16 46000 3900
29.07.17 14000 1600
30.07.17 41000 3500
Gadria 15.07.14 11600 2000
08.06.15 12600 3300
12.07.16 2400 2500
19.08.17 2300 1400
Cancia 23.07.15 25000 1600
04.08.15 20000 2000
01.08.18 4500 2700
29.10.18 11000 3200
3.2 Volumes estimation
To test the methodology described above for the estimation of debris flow volumes based on seismic signals, a total of 14
events (occurred from 2014 to 2018 ) are available from the three different catchments (Table 2).
To make data analysis comparable among the sites, the lowest sampling rate (10 s for the Cancia dataset) is used, and seismic
data from the other catchments are transformed in terms of maximum values of amplitude over periods of 10 s. Figures 8 shows135
that the use of the squared seismic amplitudes (A2 in mm2s−2) with a linear fitting seems promising to provide a preliminary
estimate of event volumes (Vtot in m3). The best fitting linear equation reads:
Vtot = 164A2 + 1419 (1)
Figure 9 compares the observed values (horizontal axis) for total volume to the predicted values (vertical axis) according to
Eq. 1.140
10
https://doi.org/10.5194/nhess-2020-411Preprint. Discussion started: 4 January 2021c© Author(s) 2021. CC BY 4.0 License.

Figure 8. Relationship between squared integrated seismic amplitude and total volume based of the debris flow events listed in Table 2 (from
Gadria, Lattenbach and Cancia)
Figure 9. Comparison of the predicted volume vs observed volume. The dark blue line represents the one-to-one relationship and the light
blue area indicates a 20% error range.
11
https://doi.org/10.5194/nhess-2020-411Preprint. Discussion started: 4 January 2021c© Author(s) 2021. CC BY 4.0 License.

4 Discussion
Arattano et al. (2012) showed, that the cross-correlation technique applied on seismic signals can be an useful tool to analyze
the flow behaviour of debris flows. Even when no clearly-defined signal features like a well-defined main front in the debris
flow wave is present, the cross-correlation can help to get a good estimation of the velocity. But also for the cross-correlation
some significant signal features are required. Our results suggest that cross-correlation method we used - based on a window145
length adaptable according to the signal waveform - provide solid estimates of debris-flow velocity, as temporal resolution
is high during the most turbulent, fast stage of the flow, while longer window length are applied for smoother flows, thus
permitting to avoid wrong correlation results.
Importantly, our study benefited from three, quite different test sites. The influence of different distances between the geo-
phones is evident. The longitudinal geophone distance in the Gadria (75 m) and Lattenbach (90 m) appear to be appropriate for150
fast debris flows, while the longer distance in Cancia (280 m) makes harder and more unreliable capturing the same surges at
different sensors. However, a longer distance offers the possibility to use higher resolution for the velocity calculation. In any
case, the transversal distance between the channel and the geophones should be much smaller than the longitudinal distance
between the two geophones (Coviello et al., 2019). The distance has to be chosen to get a significant difference in the signals
in an appropriate time, so that the cross-correlation offers useful results for the calculation of the velocity.155
The sampling rate also has an important effect on the reliability of velocity estimations. At Lattenbach and Gadria, one
amplitude value every 1-2 s was available. This seems to be a proper sampling in combination with the sensor distances. At
Cancia, only one sample per 10 s is available, so that the signal shapes can be very different at the two geophones, which can
determine problems for the cross-correlation analysis. In fact, surges can be missed and such a low sampling rate coupled with
the long distance lead to an exaggerated - i.e., not useful - averaging of flow velocity. This might has an effect on the calculated160
velocity values in Cancia, which are much lower compared to the other sites. But velocities estimated on the basis of image
analysis of time-lapse videos on previous events (Simoni et al., 2015) showed similar results ( e.g. 1.5 to 4 ms−1 for a debris
flow on 23. July 2015). So the lower velocities compared to Gadria and Lattenbach seems to be caused by the flow regime of
the events, which are more granular compared to the other sites.
Different sensors other than the geophones can be used to determine debris flow velocity. So instead of geophones two165
separated stage sensors can be used for the time-distance method. The advantage of stage sensors is that they measure the
process directly, so there are no effects of ground damping, channel texture or the viscosity of the process, which have a high
influence on the seismic signal shape. On the other side, stage sensors need a structure above the channel, so they have a
much higher installation effort and are more exposed to the process (Coviello et al., 2019). Alternatively, flow velocity can be
measured by Pus Doppler radar (Koschuch et al., 2015). This method calculates the velocity from the frequency shift of a pulse-170
modulated high-frequency reflected radar signal, which is proportional to the velocity of the moving object (Doppler effect).
The detection area is divided in different range gates and the result is an instantaneous surface velocity distribution (velocity
spectrum) for each range gate. Therefore, a debris flow radar measures the velocity directly, but there is an averaging over the
12
https://doi.org/10.5194/nhess-2020-411Preprint. Discussion started: 4 January 2021c© Author(s) 2021. CC BY 4.0 License.

range gate, so the surge velocity measured by the radar is often lower than the surge velocity measured by the time-distance
method.175
The results of the magnitude estimation show that there is a linear trend between the square of the seismic amplitudes and
the debris flow magnitudes. Both diagrams (Figure 8 and 9) suggest that it may be possible to obtain first-order estimates of
the total volume for debris flows based on the seismic amplitudes, but there is still a large variance, since there are several
factors affecting the seismic signals: distance geophone - channel, damping in the ground or sampling rate. Additionally, the
total volume is estimated by the sum over the event duration, so for an automatic magnitude estimation this duration is defined180
by the detection method. For example, the amplitude thresholds for the detection criteria has also an influence on the event
duration and thus on the total volume estimation.
With such a model, it could be possible to estimate in near real time the volume of a debris-flow surge. However, this volume
estimation becomes available only at the end of the surge. This means that the final volume estimation would be provided too
late to inform civil protection managers about the flow magnitude. Therefore, this method is still quite far from the goal of185
having a real time, accurate magnitude estimation to be implemented in early warning systems. However, the method could
provide a rough estimate on event magnitude to be promptly used by local authorities for managing the debris flow event, e.g.,
by rapidly planning clearing of retention basins and bridges and roads likely to be obstructed and flooded.
Studies of different events also showed a large dependency of the seismic amplitudes and their frequency spectrum on the
velocity of the process. For example, Lai et al. (2018) presents a model where the seismic amplitudes are most sensitive to190
the product of four physical parameters related to the debris flow: length and width of the boulder snout, grain size cubed,
and average speed cubed. This model and also the model presented by Farin et al. (2019) shows that a method including the
estimation of the process velocity and sediment concentration can result in a more accurate calculation of the magnitude. The
influence of the sediment concentration on the seismic data can therefore improve the results of the magnitude estimation, but
there is still no method to automatically estimate the sediment concentration on seismic data, which could be implemented in195
the magnitude estimation. Currently it is only possible to differ between debris flow and debris floods based on the infrasound
or seismic peak frequencies (e.g., Hübl et al., 2013), but this has still high uncertainties and is far off from an useful estimation
of the sediment concentration.
5 Conclusions
This work shows that important differences can be observed in the debris flow velocity estimation among the different methods200
deployed and the different catchments. The optimal distance between the sensors, the best sample rate for cross-correlation,
or the analysed frequency range has an important influence of the quality of the results. The presented approach with a cross-
correlation window size adopted to the signal shape shows promising results, but still further research on different events and
sites are necessary to get a robust velocity estimation method.
The results of the magnitude estimation showed, that it is possible to estimate the total volume of events based on the205
seismic data but it still shows high uncertainties and improvements of this method are necessary for an automatic magnitude
13
https://doi.org/10.5194/nhess-2020-411Preprint. Discussion started: 4 January 2021c© Author(s) 2021. CC BY 4.0 License.

identification usable for a warning system. Beside the magnitude, the flow velocity and the sediment concentration has also a
large influence on the seismic amplitudes of a debris flow, so including this in the magnitude estimation could offer a more
accurate approach.
Data availability. For access to the dataset please contact [email protected]
Appendix A: Events from 2014 to 2018
This appendix gives an overview of the seismic signals recorded of debris flows which occurred at the catchments Lattenbach,
Gadria and Cancia from 2014 to 2018.
14
https://doi.org/10.5194/nhess-2020-411Preprint. Discussion started: 4 January 2021c© Author(s) 2021. CC BY 4.0 License.

Figure A1. Seismic amplitudes of debris flows at Lattenbach (2015 - 2016)
15
https://doi.org/10.5194/nhess-2020-411Preprint. Discussion started: 4 January 2021c© Author(s) 2021. CC BY 4.0 License.

Figure A2. Seismic amplitudes of debris flows at Lattenbach (2017)
16
https://doi.org/10.5194/nhess-2020-411Preprint. Discussion started: 4 January 2021c© Author(s) 2021. CC BY 4.0 License.

Figure A3. Seismic amplitudes of debris flows at Gadria (2014 - 2017)
17
https://doi.org/10.5194/nhess-2020-411Preprint. Discussion started: 4 January 2021c© Author(s) 2021. CC BY 4.0 License.

Figure A4. Seismic amplitudes of debris flows at Cancia (2015 - 2018)
18
https://doi.org/10.5194/nhess-2020-411Preprint. Discussion started: 4 January 2021c© Author(s) 2021. CC BY 4.0 License.

Author contributions. A.S. proposed the idea and analyzed the data. V.C. contributed data from the Gadria test site. F.C. supervised the
research work. A.S. wrote the paper and all authors participated in the organization of the paper.215
Competing interests. The authors declare no conflict of interest.
Acknowledgements. We thank Johannes Hübl (Institute of Mountain Risk Engineering, University of Natural Resources and Life Sci-
ences, Vienna) for contributing data from the Lattenbach test site, Pierpaolo Macconi (Civil Protection Agency, Autonomous Province
of Bozen/Bolzano) for providing data collected by the Gadria station, and Matteo Cesca (Regional Department for Land Safety, Hydrogeo-
logical Services Center, ARPA Veneto) for data relative to the Cancia site. Lorenzo Marchi, Marco Cavalli and Stefano Crema (CNR IRPI220
Padova) are acknowledged for debris flow volumes estimations in the Gadria basin. Andreas Schimmel was funded thanks to the research
contract between ARPA Veneto and the Free University of Bozen-Bolzano. Article processing charges were supported by the Free University
of Bozen-Bolzano.
19
https://doi.org/10.5194/nhess-2020-411Preprint. Discussion started: 4 January 2021c© Author(s) 2021. CC BY 4.0 License.

References
Arattano, M., Marchi, L.: Measurements of debris flow velocity through cross-correlation of instrumentation data, Natural Hazards and Earth225
System Science, Copernicus Publications on behalf of the European Geosciences Union, 5 (1), pp.137-142. hal-00299133, 2005.
Arattano, M., Marchi, L., and Cavalli, M.: Analysis of debris-flow recordings in an instrumented basin: confirmations and new findings,
Natural Hazards and Earth System Science, 12, 679-686, https://doi.org/10.5194/nhess-12-679-2012, 2012
Burtin, A., Hovius, N., Turowski, J. M.: Seismic monitoring of torrential and fluvial processes, Earth Surface Dynamics, 4(2), 285-307, 2016.
CAE: Manuale del sistema di monitoraggio e allarme della colata detritica di Cancia, 9940038100T, 2014.230
Cavalli, M., Crema, S., Marchi, M., Pasuto, A., Gregoretti, C., Coviello, V., Schimmel, A., Comiti, F.: Accordo di Collaborazione Tecnico-
Scientifica Ex Art. 15 Della L.241/90 E S.M.I. Per la definizione delle soglie di allarme e le conseguenti logiche di funzionamento del
sistema di monitoraggio e allarme della colata detritica di Cancia in Borca di Cadore.- Relazione Tecnica, 2020.
Coviello, V., Capra, L., Vázquez, R., Márquez-Ramìrez, V.H.: Seismic characterization of hyperconcentrated flows in a volcanic environment.
Earth Surface Processes and Landforms, 43(10), 2219-2231. https://doi.org/10.1002/esp.4387, 2018.235
Coviello, V., Arattano, M., Comiti, F., Macconi, P., Marchi, L.: Seismic characterization of debris Flows: Insights into energy radiation and
implications for warning. Journal of Geophysical Research: Earth Surface, 124, 1440-1463. https://doi.org/ 10.1029/2018JF004683, 2019.
Coviello, V., Theule, J. I., Crema, S., Arattano, M., Comiti, F., Cavalli, M., Lucia, A., Macconi, P, and Marchi, L.: Combining instrumental
monitoring and high-resolution topography for estimating sediment yield in a debris-flow catchment, Environmental and Engineering
Geoscience, in press, 2020.240
Farin, M., Tsai, V.C., Lamb, M.P. and Allstadt, K.E.: A physical model of the high-frequency seismic signal generated by debris flows. Earth
Surface Processes and Landforms, 44(13), pp.2529-2543, 2019.
Gregoretti, C., Stancanelli, L.M., Bernard, M., Boreggio, M., Degetto, M., Lanzoni, S.: Relevance of erosion processes when modelling
in-channel gravel debris flows for efficient hazard assessment; Journal of Hydrology, Volume 568, 2019, Pages 575-591, issn 0022-1694,
https://Doi.Org/10.1016/J.Jhydrol.2018.10.001, 2019.245
Havens, S., Marshall, H.-P., Johnson, J.B., Nicholson, B.: Calculating the velocity of a fast-moving snow avalanche using an infrasound
array, Geophys. Res. Lett., 41, 6191-6198, doi:10.1002/2014GL061254, 2014.
Hsu, L., Finnegan, N.J., Brodsky, E.E.: A seismic signature of river bedload transport during storm events, Geophys. Res. Lett. 2011, 38,
L13407, 2011.
Hürlimann, M., Coviello, V., Bel, C., Guo, X., Berti, M., Graf, C., Hübl, J., Miyata, S., Smith, J.B. and Yin, H.Y.,; Debris-flow monitoring250
and warning: Review and examples. Earth-Science Reviews, 199, p.102981, 2019.
Hübl, J., Moser, M.: Risk Management in Lattenbach: a case study from Austria, Lorenzini, G., Brebbia, C.A, Emmanouloudis, D.E. (Eds.),
Monitoring, Simulation, Prevention and Remediation of Dense and Debris Flows, 333-342; WIT Press, Southampton; ISBN 1-84564-
169-8, 2006.
Hübl, J., Schimmel, A., Kogelnig, A., Suriñach, E., Vilajosana, I., McArdell, B.W.: A review on acoustic monitoring of debris flow, Interna-255
tional Journal of Safety and Security Engineering, Vol. 3, No. 2, 105-115; ISSN 2041-9031 URL: http://www.witpress.com/elibrary/sse-
volumes/3/2/716, 2013.
Koschuch, R., Jocham, P., Hübl, J.: One Year Use of High-Frequency RADAR Technology in Alpine Mass Movement Monitoring, Principles
and Performance for Torrential Activities, Engineering Geology for Society and Territory, Volume 3, Edition: 1st, Chapter: 14, 69-72,
2015.260
20
https://doi.org/10.5194/nhess-2020-411Preprint. Discussion started: 4 January 2021c© Author(s) 2021. CC BY 4.0 License.

Lai, V. H., Tsai, V. C., Lamb, M. P., Ulizio, T. P., Beer, A. R.: The seismic signature of debris flows: Flow mechanics and early warning at
Montecito, California. Geophysical Research Letters, 45. https://doi.org/10.1029/2018GL077683, 2018.
MAMODIS, Available online: http://mamodis.ddns.net/
Manconi, A., Picozzi, M., Coviello, V., De Santis, F., Elia, L.: Real-time detection, location, and characterization of rockslides using broad-
band regional seismic networks, Geophys. Res. Lett., 43, 6960-6967, doi:10.1002/2016GL069572, 2016.265
Marchetti, E., Ripepe, M., Ulivieri, G. Kogelnig, A.: Infrasound array criteria for automatic detection and front velocity estimation of snow
avalanches: towards a real-time early-warning system, Natural Hazards and Earth System Sciences, 15, 2545-2555, 2015.
Marchetti, E., Walter, F., Barfucci, G., Genco, R., Wenner, M., Ripepe, M., McArdell, B., Price, C.: Infrasound array analysis of debris flow
activity and implication for early warning. Journal of Geophysical Research: Earth Surface, 124(2), pp.567-587, 2019.
Pérez-Guillén, C., Tsunematsu, K., Nishimura, K., and Issler, D.: Seismic location and tracking of snow avalanches and slush flows on Mt.270
Fuji, Japan, Earth Surf. Dynam., 7, 989-1007, https://doi.org/10.5194/esurf-7-989-2019, 2019, 2019.
Simoni, A., Bernard, M., Berti, M., Boreggio, M., Lanzoni, S., Stancanelli, L. M., and Gregoretti, C.: Runoff-generated debris flows: Obser-
vation of initiation conditions and erosion-deposition dynamics along the channel at Cancia (Eastern Italian Alps). Earth Surf. Process.
Landforms, https://doi.org/10.1002/esp.4981, 2020.
Schimmel, A., Hübl, J.: Automatic detection of debris flows and debris floods based on a combination of infrasound and seismic signals,275
Landslides Vol. 13(5), 1181–1196, ISSN 1612-510X, doi: 10.1007/s10346-015-0640-z, 2016.
Schimmel, A., Hübl, J., McArdell, B., Walter, F.: Automatic identification of alpine mass movements by a combination of seismic and
infrasound sensors, Sensors, 18(5), 1658 (19 pp.), https://doi.org/10.3390/s18051658, 2018.
Takezawa, N., Yanagimachi, T., Yamakoshi, T., Tamura, K., Suwa, H., Kanno T.: Estimation of frontal velocity of debris flows by monitoring
the amplification rate of seismic wave, Congress Interpraevement, 2010.280
Theule, J.I., Crema, S., Marchi, L., Cavalli, M., and Comiti, F.: Exploiting LSPIV to assess debris-flow velocities in the field, Nat. Hazards
Earth Syst. Sci., 18, 1-13, https://doi.org/10.5194/nhess-18-1-2018, 2018.
Ulivieri, G., Marchetti, E., Ripepe, M., Chiambretti, I., Segor, V.: Infrasonic monitoring of snow avalanches in the Alps, Proceedings Inter-
national Snow Science Workshop 2012, Anchorage, Alaska, pp.723-728, 2012.
Walsh, B., Jolly, A., and Procter, J.: Seismic analysis of the 13 October 2012 Te Maari, New Zealand, lake breakout la-285
har: Insights into flow dynamics and the implications on mass flow monitoring, J. Volcanol. Geoth. Res., 324, 144-155,
https://doi.org/10.1016/j.jvolgeores.2016.06.004, 2016.
Walter, F., Burtin, A., McArdell, B. W., Hovius, N., Weder, B., Turowski, J. M.: Testing seismic amplitude source location for fast debris-flow
detection at Illgraben, Switzerland, Nat. Hazards Earth Syst. Sci., 17, 939-955, https://doi.org/10.5194/nhess-17-939-2017, 2017.
Zhang, S., Hong, Y., Yu, B.: Detecting infrasound emission of debris flow for warning purpose, 10. Congress Interpraevement, 2004.290
21
https://doi.org/10.5194/nhess-2020-411Preprint. Discussion started: 4 January 2021c© Author(s) 2021. CC BY 4.0 License.
![Fiches catalogue Estimations 1 [ALMANACHS]. Almanach ...media.interencheres.com/251/2017/03/22/152316_12f1c3f14de42e66dbb9ab... · Fiches catalogue Estimations 1 [ALMANACHS]. Almanach](https://img.pdfslide.us/doc/110x75/5e3e53c4efb520272121ec1b/fiches-catalogue-estimations-1-almanachs-almanach-media-fiches-catalogue.jpg)