Embed Size (px)
Citation preview

DEB theory for poopulatins, communities and ecosystems -
lecture III
(Background for sections 9.1 and 9.4 of DEB3)
Roger Nisbet
April 2015

Remember my pet

Carbon flow and phosphorus cycling in a lake
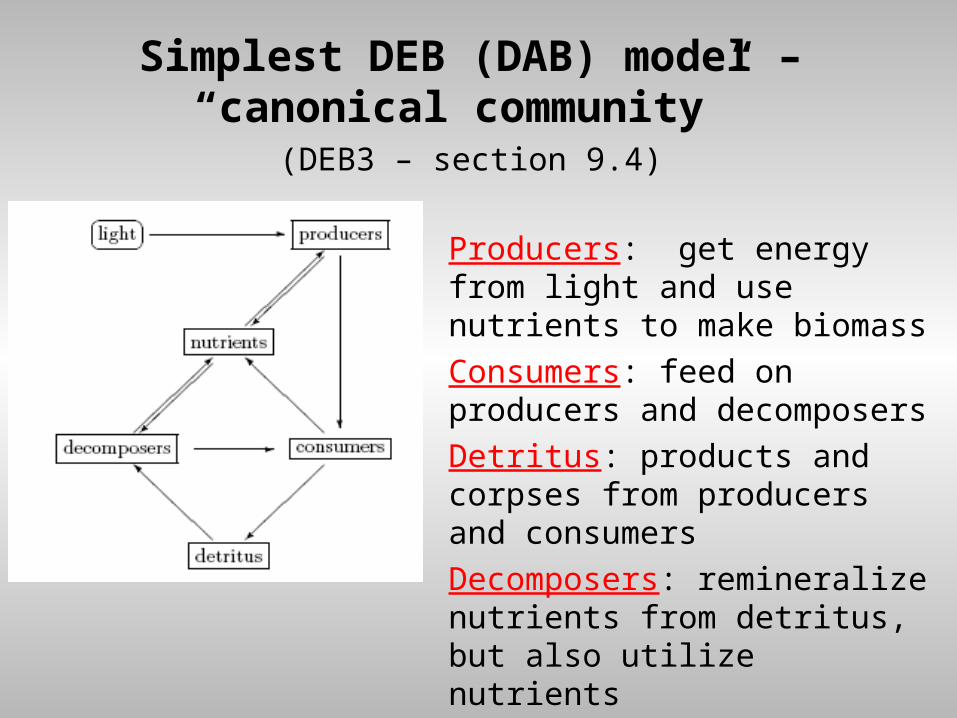
Simplest DEB (DAB) model – “canonical community”
(DEB3 – section 9.4)
Producers: get energy from light and use nutrients to make biomass
Consumers: feed on producers and decomposers
Detritus: products and corpses from producers and consumers
Decomposers: remineralize nutrients from detritus, but also utilize nutrients

Chemical transformations in canonical community

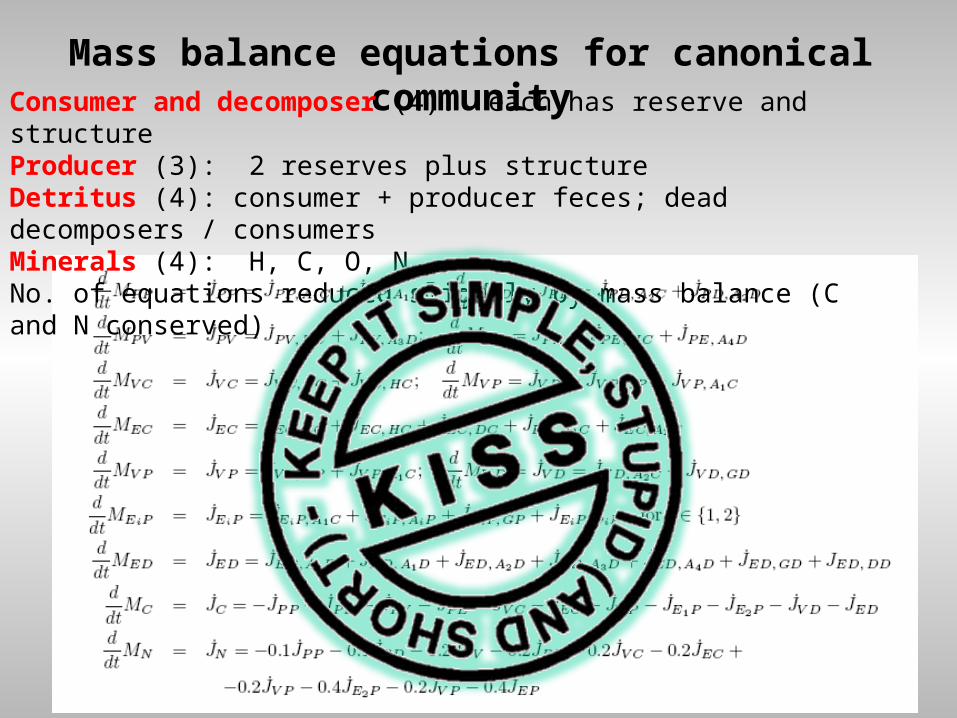
Mass balance equations for canonical communityConsumer and decomposer (4): each has reserve and structureProducer (3): 2 reserves plus structureDetritus (4): consumer + producer feces; dead decomposers / consumersMinerals (4): H, C, O, N.No. of equations reduced slightly by mass balance (C and N conserved)
Mass balance equations for canonical communityConsumer and decomposer (4): each has reserve and structureProducer (3): 2 reserves plus structureDetritus (4): consumer + producer feces; dead decomposers / consumersMinerals (4): H, C, O, N.No. of equations reduced slightly by mass balance (C and N conserved)

Precursor – book chapter
In: Jorgensen, S. E. 2000 Thermodynamics and ecological modelling. CRC Publ., Boca Raton, FL,USA, pages 19{60

Precursor – book chapter
In: Jorgensen, S. E. 2000 Thermodynamics and ecological modelling. CRC Publ., Boca Raton, FL,USA, pages 19{60
How to KISS? DEB-inspired and DEB-related
models1) Recognize key strengths of DEB theory- Strict mass balance for elemental matter- Strong homeostasis- Some organisms need two state variables- Use “nonlinear mechanistic regression” relating environment to performance and products
2) Simplify DEB representation of individuals
3) Plagiarize key ideas from DEB theory- Products from weighted sum of fluxes- Synthesizing unit (SU)
4) Choose simplifications matching modeling objectives

Model Simplification for C and P flows in a lake

Fast remineralization/uptake approximation(Andersen 1998; Loladze et al., 2000; Muller et al 2001; Andersen et al 2004;

Large amp. Cycles
No cycles(consistent with other studies)
Classic consumer-resource cycles may occur
McCauley et al. Nature, 402:653-656, 1999
Lab populations (with rapid P recycling) may cycle
MAGNITUDE OF REMINERALIZATION RATES MATTERS

Slow remineralization approximation(P inputs from decoupled “junk” pool)
Low populations, stable equilibrium, “donor control” from junk pool. Most P resides in junk pool

DEB view of mass flow in V1 consumer
AnimalGrowth
DevelopmentReproduction
Survival
Food (X) Metabolic Products

21
)1(
QQCaa
*
* E.B. Muller, R.M. Nisbet, S.A.L.M. Kooijman, J.J. Elser, E. McCauley, Ecology Letters 4: 519-529 (2001)

Option 1 Rosenzweig-MacArthur model
Add food (producer) dynamics
hFF
FCI
K
FrF
dt
dF
max1
Per capita growth rate of phytoplankton =
where Q = Phosphorus quota (units mol P/mgC)
1. Let T = total phosphorus in system and assume all bound in food
Then with K = T/kq
2. Take account of P bound in consumer
1 Qkr
Q
qk
CqTK

Muller et al. 2001

Muller et al. 2001

Muller et al. 2001


Nelson, W.A., McCauley, E & Wrona, F.J. (2001). Multiple dynamics in a single predator–prey system: experimental effects of food quality. Proc. R. Soc. Lond. B, 268, 1223–1230.
Discussed by:
Andersen, T., Elser, J.J. and Hessen, D. (2004)Stoichiometry and population dynamics. Ecology Letters 7: 884–900
Evidence for multiple attractors*?
(“HBD” = Herbivore biomass dynamics)

BIODIVERSITY AND ECOSYSTEM FUNCTION
A challenge for DEBologists

25
Species- abundance distributions
Plots of abundance of species in collections as frequency distributions have charcteristic form commonly well described by log-normal distribution

26
Why Lognormal-like Distribution?
• May (1975) proposed a purely statistical explanation, and lognormal distribution is the product of many random variables acting on the population of many species.
• Sugihara suggested lognormal distribution is a consequence of the species within a community subdividing niche space.
• Hubbell and others recently developed neutral theory. Differences between species are irrelevant. All individuals of all species have same birth and death probabilities (Controversial – see special feature in Ecology June 2006).

27
Neutral theory “tested”?(21457 trees from 224 species)
Source: J. Harte: Nature 424: 1006-7 (2003)

28
Adding niches*
Carroll, I.T., Cardinale, B.J. and Nisbet, R.M. (2011). Niche and fitness differences relate the maintenance of diversity to ecosystem function, Ecology, 92: 1157-1165.
With simple (non-DEB) bioenergetic model:
• Defined niche differences (ND) and relative fitness differences (RFD) in terms of invasibility (related to Chesson’s stabilizing and equalizing mechanisms)
• Show that high ND promotes coexistence and high RFD promotes competitve exclusion
• Calculated the relative yield total,’a measure of diversity’s effect on the biomass of competitors.

29
Relative yield – 2 species model
Analytic Numerical

30
Relative yield – 3 and 4 species

31
• Define a neutral community in DEB
• Use DEB to explore biodiversity-ecosystem function relations
CHALLENGES


![STATE OF MAINE JOSHUA R. NISBET HJELM, J....STATE OF MAINE v. JOSHUA R. NISBET HJELM, J. [¶1] Joshua R. Nisbet was convicted of robbery (Class A), 17-A M.R.S. ... Robert LeBrasseur](https://img.pdfslide.us/doc/110x75/5ea5d73b50c73b2fd1472609/state-of-maine-joshua-r-nisbet-hjelm-j-state-of-maine-v-joshua-r-nisbet.jpg)