Embed Size (px)
Citation preview
NBER WORKING PAPER SERIES
DEATH BY POKÉMON GO:THE ECONOMIC AND HUMAN COST OF USING APPS WHILE DRIVING
Mara FaccioJohn J. McConnell
Working Paper 24308http://www.nber.org/papers/w24308
NATIONAL BUREAU OF ECONOMIC RESEARCH1050 Massachusetts Avenue
Cambridge, MA 02138February 2018
We thank Chief Jason Dombkowski of the West Lafayette Police Department, Captain Brad Bishop of the City of Lafayette, Chief John Cox of the Purdue Police, and Sheriff Barry Richard of the Tippecanoe County Sheriff’s Department for permitting access to the police accident reports. We are especially thankful to Lafayette Police Department crime analyst Steve Hawthorne who provided the police accident reports data and patiently answered our questions. We thank Stuart Graham of CyanSub for providing the latitude, longitude, and the names of all PokéStops and Gyms in Tippecanoe County. We thank John Barrios, Michael Brennan, Jillian Carr, Logan Emery, Steve Hawthorne, Susan Lu, Maria-Teresa Marchica, Steve Martin, David Parsley, and Donald Teder for helpful comments and suggestions. We also thank Adam Lawson and Nate Hitze of Purdue University for developing the parsing program used to extract street intersections data used in the online appendix. The views expressed herein are those of the authors and do not necessarily reflect the views of the National Bureau of Economic Research.
NBER working papers are circulated for discussion and comment purposes. They have not been peer-reviewed or been subject to the review by the NBER Board of Directors that accompanies official NBER publications.
© 2018 by Mara Faccio and John J. McConnell. All rights reserved. Short sections of text, not to exceed two paragraphs, may be quoted without explicit permission provided that full credit, including © notice, is given to the source.
Death by Pokémon GO: The Economic and Human Cost of Using Apps While DrivingMara Faccio and John J. McConnellNBER Working Paper No. 24308February 2018JEL No. O33,R40
ABSTRACT
Using police accident reports for Tippecanoe County, Indiana, and exploiting the introduction of the augmented reality game Pokémon GO as a natural experiment, we document a disproportionate increase in crashes and associated vehicular damage, injuries, and fatalities in the vicinity of locations where users can play the game while driving. We estimate the incremental county-wide cost of users playing Pokémon GO while driving to be in the range of $5.2 to $25.5 million over the 148 days following the introduction of the game. Extrapolating these estimates to nation-wide levels yields a total ranging from $2.0 to $7.3 billion.
Mara FaccioKrannert School of ManagementPurdue University403 W. State StreetWest Lafayette, IN 47907and [email protected]
John J. McConnell403 West State StreetWest Lafayette, [email protected]
1
In the recent decade, smartphones and their applications or “apps,” as they
are popularly known, have become ubiquitous. No doubt this technology has
improved the quality and productivity of human lives. As with many
technological advances, though, smartphones have been taken to task for their
alleged “dark sides.”1 For example, smartphones and their apps have been
accused of attributing to an increase in teen suicide, a deterioration in human
interpersonal skills, and an increase in cybersecurity breaches.2 A further
example, and the one that we investigate in this study, is the concern that the use
of smartphone apps while driving has given rise to an increase in vehicular
crashes with associated increases in deaths, injuries and property damage.
As reported in the Wall Street Journal, insurers cite a possible connection
between smartphone usage and vehicular crashes as one explanation for the 16%
increase in US automobile insurance premiums between 2011 and 2016.3 If that
explanation were to account for, let’s say, 25% of the aggregate dollar increase in
insurance premiums over that time period, the amount attributable to smartphone
usage would be $37.3 billion.
1 Perhaps the most famous (or infamous) example of concern with the dark side of technological advances is the displacement of weavers by mechanical looms that led to riots and property destruction in Lancashire, England, in 1826 (Aspin, 1995). 2 The Economist, January 13, 2018, “Teens and Screens,” p. 14. BBC, August 29, 2013, “The Crucial Skill New Hires Lack,” Forbes, December 20, 2017, “What Cybersecurity Chiefs Can Learn From Warren Buffett.” 3 Wall Street Journal, February 21, 2017, “Smartphone Addicts Behind the Wheel Drive Car Insurance Rates Higher. Insurers increasingly blame distracted drivers as costs related to crashes outpace premium increases.”
2
Certain circumstantial evidence supports such a connection. To wit,
following a steady, though not uninterrupted, 25-year decline, vehicular fatality
crashes in the US reversed course in 2011. In 1988, fatality crashes totaled
42,130. In 2011, that number reached a low of 29,867. By 2015, the total had
increased to 32,166 (NHTSA, various years.) That reversal has been widely
reported and commented upon. Less well reported is that total vehicular crashes
followed a similar course with 6.887 million reported in 1988 falling to a low of
5.338 million in 2011, and reversing course to reach 6.296 million in 2015.
The supporting circumstantial evidence is that diffusion of smartphone
apps has increased in parallel with the incidence of vehicular fatalities and
crashes. According to Wikipedia, in 2008, Apple’s App Store had available 800
smartphone apps with 10 million downloads. By 2011, those numbers were
500,000 apps and 18 billion downloads, and by 2017, they were 2.2 million apps
and 130 billion downloads.4 Of course, attributing any increase in crashes and
fatalities to smartphone usage and app availability is extraordinarily difficult
given that many other factors also changed over the years in which both
increased. The same WSJ article cited above notes that “[t]he rise in traffic deaths
is the result of many factors. Low gas prices and a U.S. economic recovery
combined to put more drivers on the road...”
4 https://en.wikipedia.org/wiki/App_Store_(iOS). A similar trend is documented for the other large digital distribution platform, Google Play (https://en.wikipedia.org/wiki/Google_Play).
3
In this study, we circumvent this difficulty by examining the introduction
of a specific app that can be associated with specific geographic locations. The
app is the highly popular Pokémon GO augmented reality game. The game was
introduced on July 6, 2016. Within one month, worldwide, the game was
downloaded more than 100 million times. For our purposes, the virtue of this app
is that the stockpile of a user’s “weapons” used to play the game can be
replenished in the vicinity of specific well-identified “PokéStops” many of which
are located near public thoroughfares. If the game is played while a player is
driving and if playing the game while driving increases the likelihood of crashes
occurring, locations near PokéStops should experience a disproportionate increase
in crashes following introduction of the game.5
We examine nearly 12,000 police accident reports for Tippecanoe County,
Indiana, for the period of March 1, 2015, through November 30, 2016. We find a
disproportionate increase in crashes near PokéStops from before to after July 6,
2016. In the aggregate, these crashes are associated with increases in the dollar
amount of vehicular damage, the number of personal injuries, and the number of
fatalities. 5 Anecdotally, a link between the introduction of Pokémon Go and crashes has been reported in media outlets including the Wall Street Journal, “Pokémon Go’-Related Car Crash Kills Woman in Japan”, August 25, 2016; USA Today, “Pokémon Go player crashes his car into a tree”, July 14, 2016; Fox News, “Death by Pokemon? Public safety fears mount as Pokemon GO craze continues”; The Guardian, “Pokémon Go player crashes car into university while playing game,” July 18, 2016. A study by Ayers, Leas, Dredze, Allem, Grabowski and Hill (2016) reports that a nontrivial number of users are characterized in tweets as playing the game while driving.
4
Specifically, a difference-in-differences analysis indicates that 134
incremental crashes that occurred at locations in the proximity of PokéStops over
the 148 days following the introduction of the game can be attributed to the
introduction of Pokémon GO. This incremental increase in crashes accounts for
47% of the increase in the total number of county-wide crashes. Based on the
assessments of damage in the police reports, this increase in crashes in the vicinity
of PokéStops results in $498,567 of incremental vehicular damage, or 22% of the
increase in the total dollar amount of vehicular damage experienced county-wide
over the 148 days following the introduction of the game.
The 134 incremental crashes give rise to 31 incremental personal injuries
in the vicinity of PokéStops. These account for 25% of the aggregate increase in
the number of personal injuries experienced county-wide over the same time
period. Based on data from the Insurance Information Institute and the Centers
for Disease Control and Prevention, the incremental claims for bodily injuries and
the estimated loss of lifetime income imply a county-wide total incremental cost
of $988,621.
On a sadder note, our analyses point to two incremental vehicular fatalities
in the vicinity of Pokéstops following the introduction of the game. Based on
estimates of lifetime income lost from the American Community Survey Public
Use Microdata Sample files produced by the Census Bureau, a conservative
estimate of the value of lives lost is $3.8 million.
5
Thus, a conservative estimate of the total incremental county-wide cost of
users playing Pokémon GO in the vicinity of Pokéstops is $5.2 million over the
148 days following the introduction of the game. The great majority of this total
is the value of lives lost. Regardless of whether that number is included, the
incremental cost of users playing Pokémon GO while driving is significant.
Indeed, even ignoring the value of lives lost, the incremental cost associated with
users playing the game while driving implies a 3.34% increase in auto insurance
premiums for the 148 days following the introduction of the game.
Ours is not the first study to investigate the connection between mobile
phone usage while driving and vehicular crashes. Bhargava and Pathania (2013)
and McCartt, Kidd and Teoh (2014) survey this literature.6 Both report that the
results of prior studies are inconclusive as to whether the use of mobile phones
while driving is associated with an increase in vehicular crashes. The prior study
most closely related to ours is Bhargava and Pathania (2013) who also consider a
natural experiment. They investigate whether mobile phone usage and vehicular
crashes increased in California around 9:00pm during 2002–2005. During those
years, mobile phone providers had a policy in effect whereby the per-minute price
of mobile phone usage dropped precipitously at 9:00pm. The authors report a
6 Prior studies include, among others, Cohen and Graham (2003), Hahn and Prieger (2006), Kolko (2009), and the classic study of Redelmeir and Tibshirani (1997). A number of authors have questioned the effectiveness of regulations aimed at improving automobile safety (Peltzman, 1975) and regulations restricting the use of cell phones while driving (Lim and Chi, 2013). Abouk and Adams (2013) study the effectiveness of bans on texting while driving and conclude that the effect, if any, is short-lived.
6
significant increase in mobile phone usage while driving from just before to just
after 9:00pm, but report no increase in crashes. This evidence implies that mobile
phone usage is not associated with an increase in vehicular crashes. As the
authors note, the lack of an effect of mobile phone usage on the incidence of
crashes could, like the lack of a finding in certain earlier studies, be due to drivers
merely substituting one form of “risky” behavior for another.
In comparison with Bhargava and Pathania, the results of our study cannot
be due to substitution of one form of distraction for another as we document an
increase in crashes relative to the level that would have occurred absent the
introduction of the game. Our interpretation of the results, however, may give
rise to two broad concerns. First, it could be that the observed increase in crashes
is not due to the introduction of Pokémon GO but to another shock that correlates
with the introduction of the game and vehicular crashes. In that regard, one
concern specific to our analysis is that Tippecanoe County is the home of Purdue
University, a 40,000-student body university in a county with a “fulltime”
population of 188,000. The concern is that Pokémon GO was introduced during
the university summer “break” and that the student population fluctuated widely
in that time period. That phenomenon coupled with the possibility that students
might drive more in areas in the vicinity of PokéStops could give rise to our
results - - though the results would not be due to the introduction of Pokémon GO.
We address this concern directly by including in all regressions an interaction
7
between PokéStop and university breaks. Our results, thus, reflect the impact of
the introduction of the game after explicitly accounting for university breaks and
related fluctuations in the population of Tippecanoe County.
We also account for the possibility that some other unspecified omitted
factor might give rise to the increase in crashes that we document in the vicinity
of PokéStops following the introduction of Pokémon GO. We do so by narrowing
the time interval of our analysis in certain regressions. This greatly reduces the
number of unobserved shocks that might spuriously give rise to our results since
by narrowing the time interval employed, we exclude, by construction, any
confounding events that occur outside the time interval. Contrary to the
possibility that such unspecified shocks might spuriously give rise to our results,
the key coefficient is largest when a narrow time interval is employed.
A second concern is that, although the increase in crashes is due to the
introduction of Pokémon GO, it is not due to drivers playing the game.7 It is, for
example, possible that the introduction of Pokémon GO increased driving near
Pokémon GO-related points of play as players drove to these locations for the
purpose of playing the game, but did not play the game until after parking their
cars. In Section 5, and in the internet appendix, we undertake tests to address this
and related concerns. To give a flavor of these tests, we briefly describe one here:
7 In the state of Indiana, texting while driving is banned, but usage of mobile phones to play games while driving is not (Indiana Code Title 9. Motor Vehicles § 9-21-8-59).
8
we use other Pokémon GO-related points of play, specifically “Gyms” (where it is
basically impossible for a user to play the game while driving) as placebos.
Assuming that both types of locations experience similar increases in traffic, and
assuming that players do not use their smartphones while driving, there should be
no difference in the change in the number of crashes between the two types of
locations. We compare the change in the number of crashes surrounding the
introduction of Pokémon GO in locations in the vicinity of Gyms with the change
in the number of crashes in locations in the vicinity of PokéStops. Consistent
with the use of smartphones to play the game while driving, we find a
significantly greater increase in the number of crashes in the vicinity of PokéStops
than in the vicinity of Gyms.
In sum, our analyses indicate that the concern by insurers and others that
the use of smartphone apps by drivers did contribute to increases in vehicular
crashes, injuries, and fatalities is legitimate. In this instance at least, there is an
economic dark side to technological advancement.
1. Pokémon GO
Pokémon GO is a location-based augmented reality game, i.e., a
videogame that is played in a real world environment. The game was launched in
the U.S., Australia, and New Zealand, on July 6, 2016, and soon became available
in several other countries. The game was an immediate success, exceeding 100
million worldwide downloads by July 31, 2016, and more than 750 million
9
downloads by June 2017.8 According to Wandera, the median number of daily
“active users” was 24.7 million in July 2016. A fact that we exploit later is that
the number of daily active users dropped to 17.6 million in August 2016 and fell
further to 9.5 million during September through November of the same year.9
The objective of the game is to capture one of each type of virtual
creature, called Pokémons, of which there were 151 types when the game was
introduced. A Pokémon type is identified by an icon of a virtual creature and a
catchy name such as Bulbasaur, Omanyte, Rhyhorn, Vaporeon, and so on.
To play the game, a player opens an account, then selects and customizes
her avatar. As the player moves within her real world surroundings (e.g., walks or
drives along a street), her avatar travels along a virtual map that parallels the
actual route being traveled by the game player. The virtual map appears on the
player’s mobile device. The game employs the GPS radio navigation system that
is built into the player’s mobile device to locate the player and to position the
player’s avatar on the virtual map.
Pokémons can “pop up” at any time and at any location on the player’s
virtual map. Capture of a Pokémon is accomplished by “throwing” a Poké Ball at
the “popped up” icon. Capturing the creature often requires multiple “throws” as
the Pokémon can escape even after being hit with a Poké Ball. Throwing Poké
Balls reduces a player’s stock of ammunition. A game player can reload her 8 https://en.wikipedia.org/wiki/Pok%C3%A9mon_Go 9 https://www.wandera.com/blog/Pokemon-go-data-analysis-popular-game
10
stockpile of Poké Balls without a fee only in the vicinity of specific locations
called PokéStops.10 As a player approaches a PokéStop, in order to reload, the
player must tap the icon of the PokéStop on the mobile device’s screen, then
swipe the screen. Thus, collecting Poké Balls can be accomplished as a player
drives within the circle encompassed by the PokéStops. (Of course, a player need
not be driving to collect Poké Balls.) The circle has a radius of roughly 50
meters. Driving at a moderate speed, for example at 50 kilometers
(approximately 30 miles) per hour, a driver would pass through the area in which
Poké Balls can be collected in approximately 7 seconds.
To play the game, a player must first activate the app. Activation requires
approximately 30 seconds. Thus, driving at a speed of 50 kilometers per hour, a
player who had not previously activated the app must begin to activate the game
when she is at least 415 meters from the PokéStop. If the game has been
previously activated, the player needs to unlock her phone to play the game.
Unlocking the phone requires approximately 6 seconds. Ergo, a player who had
previously activated the app must unlock her phone when she is approximately 85
or more meters from the PokéStop. In sum, the activity associated with playing
the game is likely to be concentrated within a circle of approximately 100 meters
around the PokéStops. Activation of the game can extend beyond that perimeter
but activity is likely to become more intense as the player approaches this circle. 10 Poké Balls can be purchased anywhere. PokéStops also enable players to collect, also for free, other items such as incense to lure Pokémons or berries to cure wounded Pokémons.
11
In addition to PokéStops, the game features a second set of locations
called Gyms in which battles between Pokémons take place. Victory in battle
gives the player Gym Badges and PokéCoins that can be used to purchase Poké
Balls and other items used in the game. To complete a battle, a player must
remain in the vicinity of the Gym for the entirety of the fight. The vicinity of a
Gym encompasses a territory of the same dimensions as that of a PokéStop.
Completion of a battle typically requires several minutes. Thus, it is virtually
impossible for a player to complete a battle while driving, even while driving at
an extremely moderate speed.
To address the question of whether the introduction of Pokémon GO
resulted in a disproportionate increase in crashes, damage to vehicles, injuries to
vehicle occupants, and fatalities in the vicinity of PokéStops, we employ data on
vehicular crashes from police reports and data on the location of PokéStops from
CyanSub. The next section describes these and other data sources in detail.
2. Data
2.1. Police Accident Reports
The Lafayette Police Department, the West Lafayette Police Department,
the Purdue University Police Department, and the Tippecanoe County Sheriff’s
Office provided to us data on all vehicular crashes reported to the police that
occurred in Tippecanoe County, Indiana, during March 1, 2015, through
November 30, 2016. In general, police accident reports are available upon
12
request. The person filing a request must specify the date and location of the
crash and the names of the parties involved in the crash and pay a fee of $8-$12
per crash. For our study, the reports were provided free of charge.
The data include the date and time of each crash, the location of each
crash by projected x,y coordinates and by street name and municipality, an
estimated range of the dollar value of damage to the vehicles, the number of
people injured, the number of fatalities, the condition of the roads, and the
primary and secondary cause of the crash.
Various descriptive statistics are given in Table 1. The database includes
12,267 crashes of which x,y coordinates (that locate the crashes within
Tippecanoe County) are available for 11,355. We employ the x,y coordinates to
characterize the geographic location of each crash. Henceforth, the terms
“geographic location” or “location” refer to a pair of x,y coordinates at which a
crash occurred. We conduct our primary analysis with this set of crashes. Of
these, 8,505 crashes occurred before July 6, 2016, and 2,850 crashes occurred
between July 6, 2016, and November 30, 2016. Prior to July 6, 2016, the number
of crashes per day was 17.25. Commencing with July 6, 2016, and afterward, the
number of crashes per day was 19.26. Table 1 also shows that the average
estimated damage to the vehicles involved in a crash increased from $4,370 prior
to July 6, 2016, to $4,726 on or after that date and the number of persons injured
per crash increased from 0.196 to 0.217. What fractions, if any, of these increases
13
are attributable to the introduction of Pokémon GO are the questions that we
address in this study.
The 11,355 crashes in the sample can be traced to 4,708 distinct
geographic locations. In our analyses, the unit of observation is a geographic
location/date pair where the geographic location is the location of at least one
crash that occurred during the 641 day sample period. The dates are every day in
the sample period. This results in 3,017,828 observations.
2.2. PokéStops and Gyms
Data on the latitude, longitude, and the names of all PokéStops and Gyms
in Tippecanoe County were provided by Stuart Graham, the web director of
CyanSub, an Edinburgh, Scotland, based website developer who developed and
maintains the website www.pokemongomap.info.11 As of October 18, 2017, the
website covered 5,160,767 PokéStop and Gym locations worldwide. As of July
21, 2017, the sample encompassed 615 PokéStops and 147 Gyms spread across
503 square miles in Tippecanoe County.
We use Earth Point’s (http://www.earthpoint.us/StatePlane.aspx) “State
Plane” Indiana West (i.e., FIPS 1302) coordinate system to convert latitudes and
longitudes into projected x,y coordinates. We use these data to measure the
distance of each geographic location of a crash to the nearest PokéStop and Gym.
11 The www.pokemongomap.info website is, according to their web page, an unofficial website that is not affiliated with either Niantic (i.e. the developer of Pokémon GO) or Nintendo. We thank Stuart Graham for providing the data free of charge.
14
19.75% of the locations of crashes are within 100 meters of a PokéStop, and
7.29% are within 100 meters of a Gym.
3. Empirical Analyses
3.1. Overview
To examine whether the number of vehicular crashes increased
disproportionately in the vicinity of PokéStops after the introduction of Pokémon
GO, we estimate OLS panel regressions as
y , ∙ PokéStop ∙ Post ∙ Controls , ∙ Location
∙ Date ,
(1)
where y , is the outcome of interest (e.g., the Number of Crashes that occurred at
location L during day T). PokéStopL is an indicator that takes the value of 1 for
location L if location L is within a given number of meters of a PokéStop, and 0
otherwise. Post is an indicator that takes the value of 1 for the period starting on
July 6, 2016 and ending on November 30, 2016, and 0 for the period that precedes
the introduction of Pokémon GO (i.e., March 1, 2015, through July 5, 2016).12
The interaction term PokéStop ∙ Post is the independent variable of interest. Its
coefficient is the incremental change (i.e., the difference in differences) in the
outcome variable (e.g., the number of crashes at a given location on a given day)
12 Using a relatively lengthy time period prior to July 6, 2016, offers two major benefits. First, doing so increases the precision of our estimations since the weight of each single day-location decreases as more days are added to the sample. Second, it allows capturing more locations that have experienced crashes (including locations that have experienced crashes only prior to the introduction of the game.)
15
at locations in the vicinity of PokéStops relative to locations not in the vicinity of
PokéStops following the introduction of Pokémon GO.
Controls , are a set of time-varying location-specific control variables.
The location fixed effects, Location , account for any time-invariant
characteristics that are location specific. The location fixed effects account for
whether the location is in the vicinity of a PokéStop or any other location-specific
time-invariant characteristic that may correlate with the frequency or severity of
the crashes. For example, in Tippecanoe County the most common locations for
PokéStops are cemeteries, churches, memorials, and parks. If these happen to be
high traffic areas, the location fixed effects account for that pattern. The date
fixed effects, Date , account for any location-invariant characteristics that
correlate with the frequency or severity of crashes. For example, a date might
follow the introduction of Pokémon GO, coincide with adverse weather
conditions, or coincide with high traffic. The virtue of the fixed effects is that
they preclude the necessity of specifying and quantifying these or any other time-
or location-invariant sources of confounding variation.
One of the control variables in each regression is the interaction of
University Break and PokéStop . This variable accounts for the possibility that
vehicular traffic is lower during university breaks with a consequential decline in
crashes. This shift in traffic might be especially pronounced in the vicinity of
16
PokéStops if university students tend to drive, for any reason, in those areas.
University Breaks are identified from the Purdue University calendars.
In each of the regression estimations that follow, the standard errors are
double clustered at the geographic location and date levels to account for serial
and cross-sectional correlations (Bertrand, Duflo, and Mullainathan (2004),
Petersen (2009)).13
3.2. Number of Crashes
Our discussion of the results that follow focuses on the point estimates of
the coefficients, each of which is encompassed by an unstated confidence interval.
The results of the first regression are given in the first column of Table 2. The
dependent variable is the total number of crashes at a given location on a given
day. The independent variable of interest is the interaction of Post and
PokéStop100 where PokéStop100 denotes locations that are within 100 meters of
a PokéStop. The coefficient of this interaction term, 0.00097, is positive and
statistically significant (p-value < 0.001). The coefficient is the point estimate of
the differential increase in the number of crashes per day within 100 meters of a
PokéStop relative to locations that are not within 100 meters of a PokéStop.
The second column of Table 2 shows the results of a regression in which
the date fixed effects are replaced with Post and University Break. The regression
13 As an alternative to account for serial correlation, Bertrand et al. propose collapsing the data for the pre and post time periods. We also collapse the data and replicate the analysis of the first column of Table 2. The coefficient of the PokeStop100 x Post is 0.00099 with a p-value of 0.009.
17
does not include any interactions of PokéStop100 with Post or PokéStop100 with
University Break. The purpose of this regression is to determine the county-wide
change in the number of crashes from before to after the introduction of the game
taking into account the occurrence of university breaks. As shown in the second
column, the coefficient of Post is 0.00041 with a p-value of 0.002 indicating that
the number of crashes per location per day increased significantly in the period
that followed the introduction of Pokémon GO. This equates to a county-wide
increase of 286 crashes over the 148 days from July 6 to November 30, 2016 after
taking into account the occurrence of university breaks (i.e., 0.00041 crashes per
day per location x 4,708 geographic locations x 148 days = 286 crashes).
According to our analysis, 134 of these crashes are incremental crashes
attributable to Pokémon GO users playing the game while driving in the vicinity
of PokéStops (i.e., 0.00097 crashes per location per day x 930 locations within
100 meters of a PokéStop x 148 days = 134 crashes). Based on our analysis,
these 134 crashes would not have occurred had Pokémon GO not been
introduced.
As we noted above, the daily number of active users peaked in July 2016,
dropped off a bit in August, and fell further in September at which point the
median number of active users stabilized at 9.5 million per day for the following
two months. The third column of Table 2 exploits this discontinuity in the
intensity of play to explore whether the number of crashes varies with the number
18
of game players by splitting the post-July 6 interval into the subperiods of July 6–
July 31, August 1–August 31, and September 1–November 30. To do this, the
regression includes interactions between PokéStop100 and indicator variables
denoting the three subperiods. The coefficients of the interaction terms decrease
as time proceeds from July to August to September–November with values of
0.00164, 0.00117, and 0.00069 with associated p-values increasing from 0.004 to
0.033 to 0.047. These results further support our interpretation of Pokémon GO
being the cause of the incremental change in the number of crashes.
To refine our identification strategy, we focus on the weeks immediately
following the introduction of the game, July 6–July 31, 2016, in comparison with
the same time period in the prior year.14 The benefit of doing so is that by
narrowing the time interval of analysis, we reduce the possibility that a
confounding event gives rise to the results. Two deficiencies of this approach are
(1) a small number of crashes and/or confounding events could have a
disproportionate impact on the coefficient estimates and (2) the small number of
days (i.e., 52) in the sample period substantially reduces the power of the test.
Nevertheless, as shown in the fourth column of Table 2, the coefficient of the
14 As we discuss in Section 5.4, beta testing of the game started as early as May 2016. Using the same time period in the prior year eliminates the possibility that the beta testing gave rise to an increase in crashes prior to the official introduction of the game. Such an increase would downward bias the estimate of the incremental impact of the introduction of Pokémon GO on vehicular crashes.
19
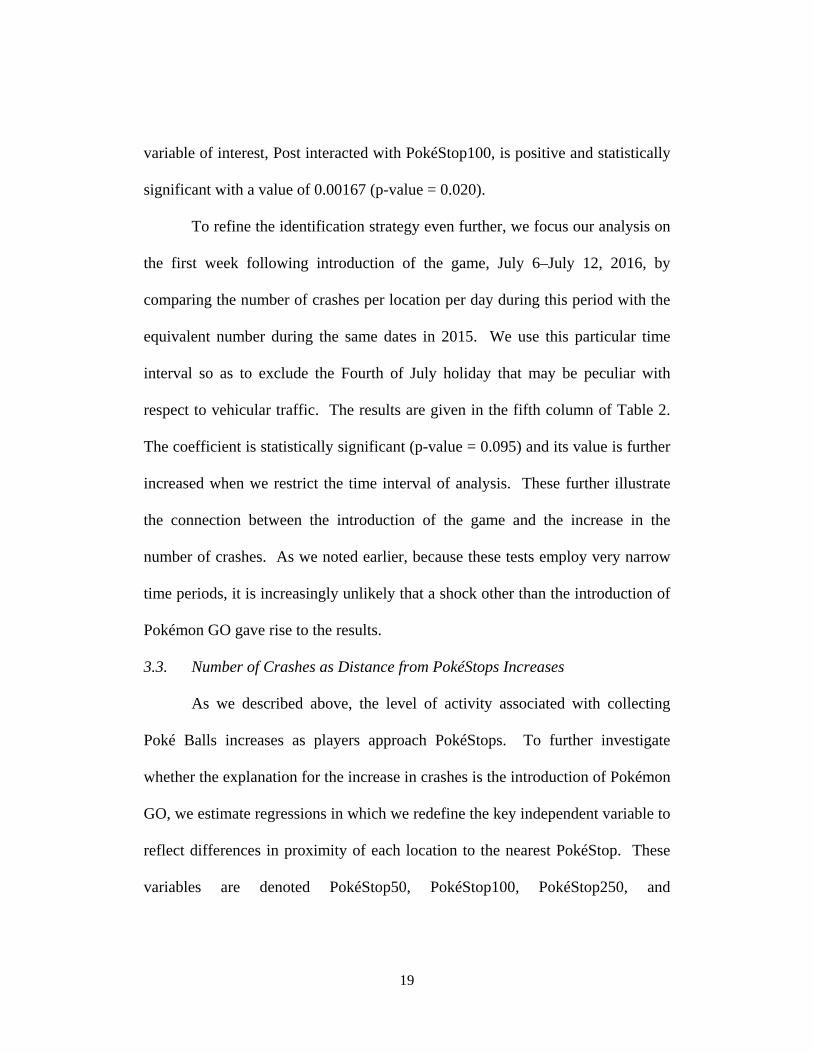
variable of interest, Post interacted with PokéStop100, is positive and statistically
significant with a value of 0.00167 (p-value = 0.020).
To refine the identification strategy even further, we focus our analysis on
the first week following introduction of the game, July 6–July 12, 2016, by
comparing the number of crashes per location per day during this period with the
equivalent number during the same dates in 2015. We use this particular time
interval so as to exclude the Fourth of July holiday that may be peculiar with
respect to vehicular traffic. The results are given in the fifth column of Table 2.
The coefficient is statistically significant (p-value = 0.095) and its value is further
increased when we restrict the time interval of analysis. These further illustrate
the connection between the introduction of the game and the increase in the
number of crashes. As we noted earlier, because these tests employ very narrow
time periods, it is increasingly unlikely that a shock other than the introduction of
Pokémon GO gave rise to the results.
3.3. Number of Crashes as Distance from PokéStops Increases
As we described above, the level of activity associated with collecting
Poké Balls increases as players approach PokéStops. To further investigate
whether the explanation for the increase in crashes is the introduction of Pokémon
GO, we estimate regressions in which we redefine the key independent variable to
reflect differences in proximity of each location to the nearest PokéStop. These
variables are denoted PokéStop50, PokéStop100, PokéStop250, and
20
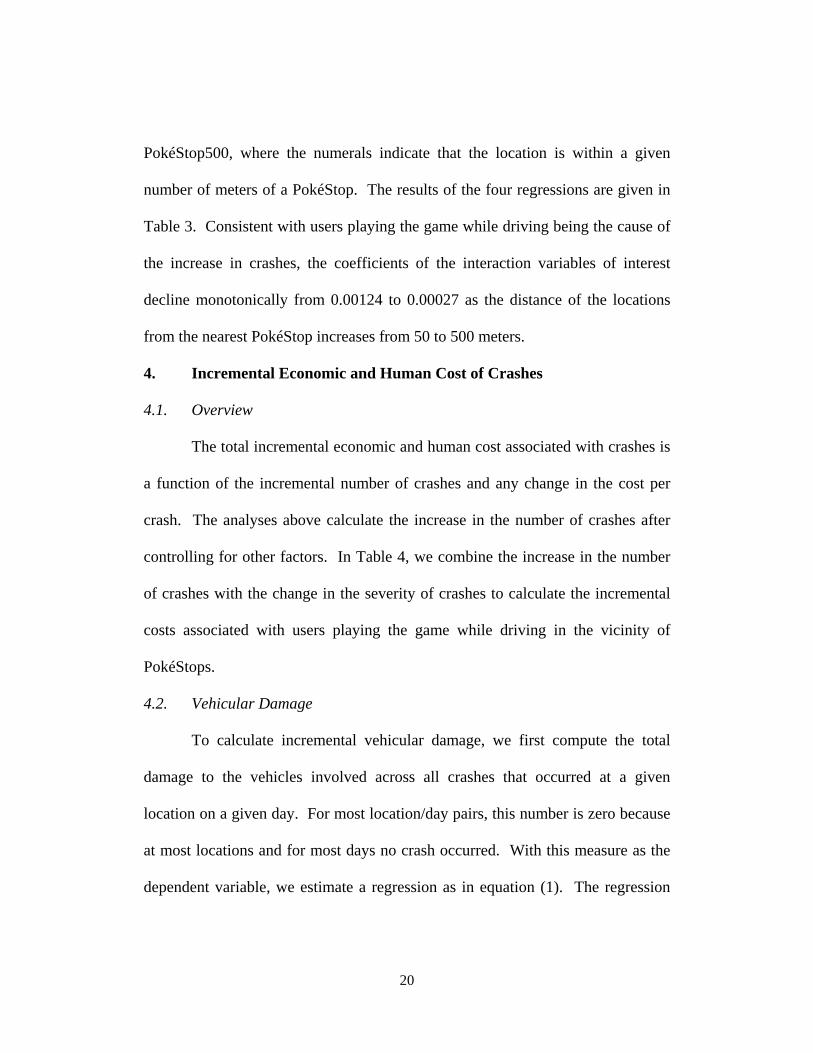
PokéStop500, where the numerals indicate that the location is within a given
number of meters of a PokéStop. The results of the four regressions are given in
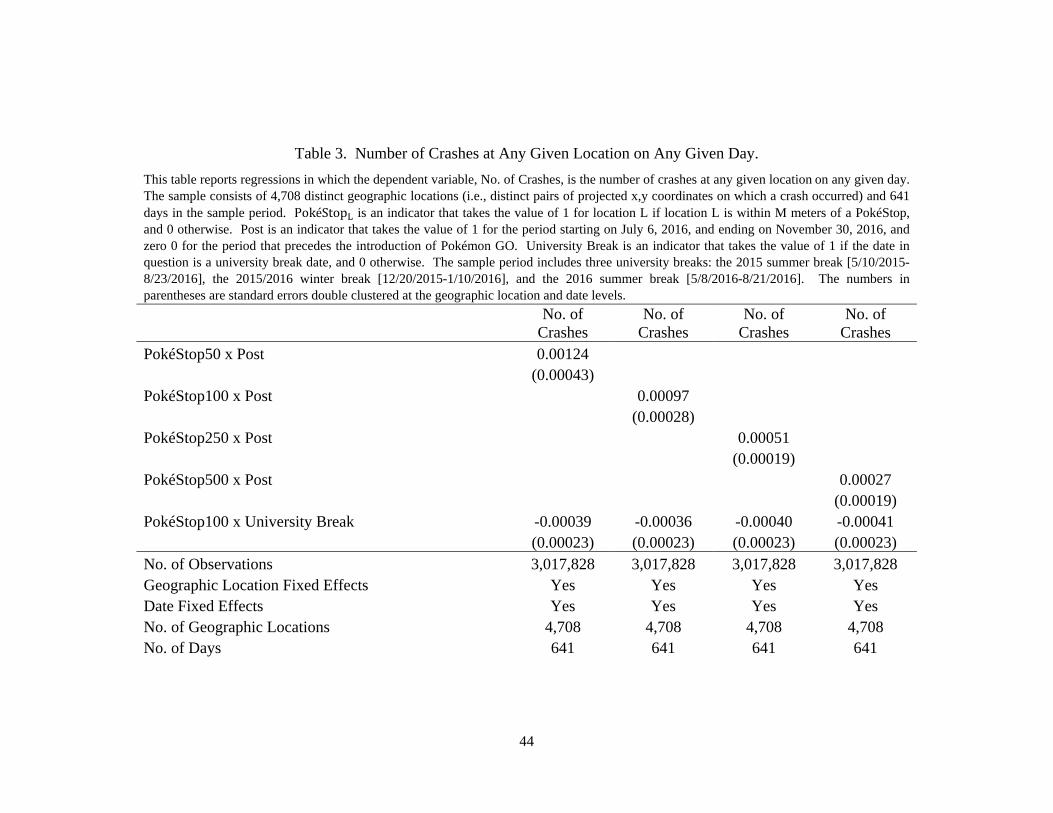
Table 3. Consistent with users playing the game while driving being the cause of
the increase in crashes, the coefficients of the interaction variables of interest
decline monotonically from 0.00124 to 0.00027 as the distance of the locations
from the nearest PokéStop increases from 50 to 500 meters.
4. Incremental Economic and Human Cost of Crashes
4.1. Overview
The total incremental economic and human cost associated with crashes is
a function of the incremental number of crashes and any change in the cost per
crash. The analyses above calculate the increase in the number of crashes after
controlling for other factors. In Table 4, we combine the increase in the number
of crashes with the change in the severity of crashes to calculate the incremental
costs associated with users playing the game while driving in the vicinity of
PokéStops.
4.2. Vehicular Damage
To calculate incremental vehicular damage, we first compute the total
damage to the vehicles involved across all crashes that occurred at a given
location on a given day. For most location/day pairs, this number is zero because
at most locations and for most days no crash occurred. With this measure as the
dependent variable, we estimate a regression as in equation (1). The regression
21
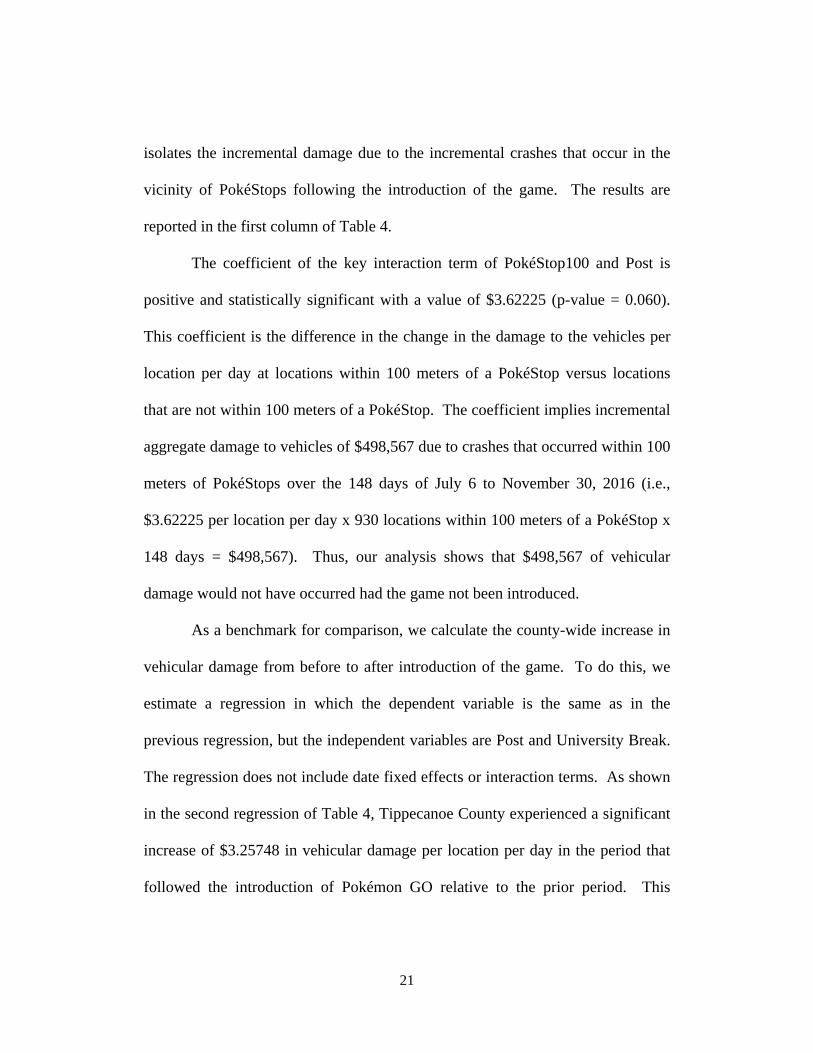
isolates the incremental damage due to the incremental crashes that occur in the
vicinity of PokéStops following the introduction of the game. The results are
reported in the first column of Table 4.
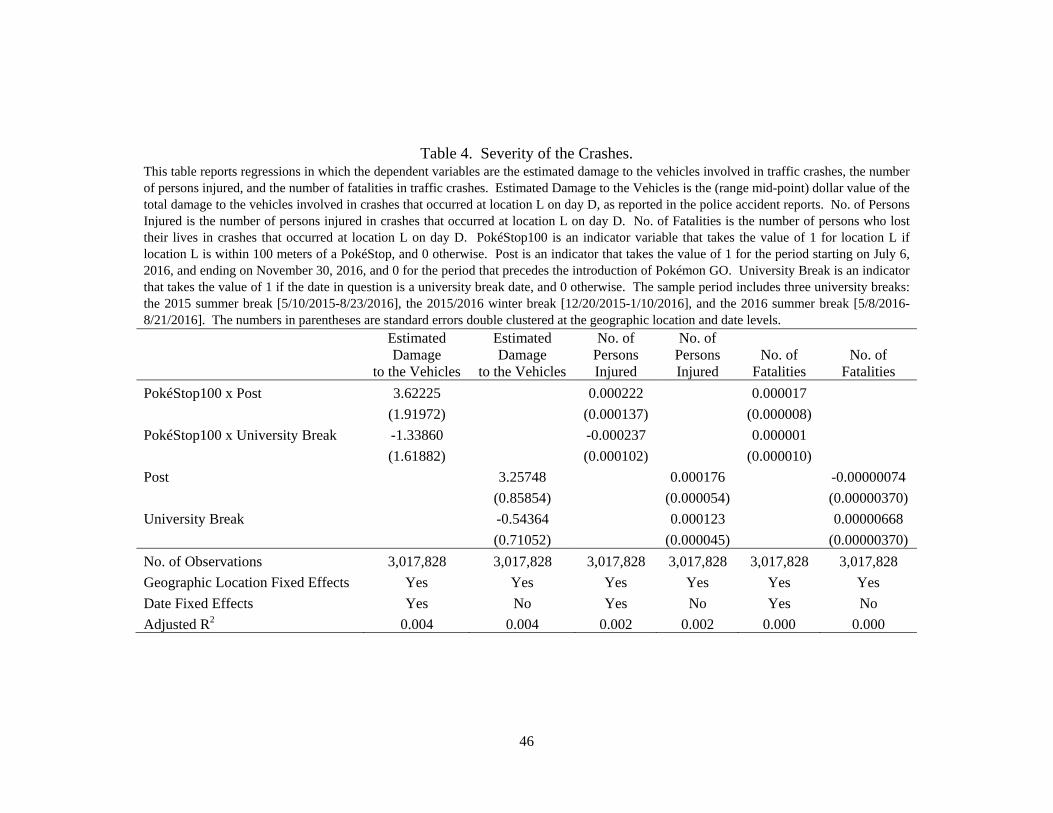
The coefficient of the key interaction term of PokéStop100 and Post is
positive and statistically significant with a value of $3.62225 (p-value = 0.060).
This coefficient is the difference in the change in the damage to the vehicles per
location per day at locations within 100 meters of a PokéStop versus locations
that are not within 100 meters of a PokéStop. The coefficient implies incremental
aggregate damage to vehicles of $498,567 due to crashes that occurred within 100
meters of PokéStops over the 148 days of July 6 to November 30, 2016 (i.e.,
$3.62225 per location per day x 930 locations within 100 meters of a PokéStop x
148 days = $498,567). Thus, our analysis shows that $498,567 of vehicular
damage would not have occurred had the game not been introduced.
As a benchmark for comparison, we calculate the county-wide increase in
vehicular damage from before to after introduction of the game. To do this, we
estimate a regression in which the dependent variable is the same as in the
previous regression, but the independent variables are Post and University Break.
The regression does not include date fixed effects or interaction terms. As shown
in the second regression of Table 4, Tippecanoe County experienced a significant
increase of $3.25748 in vehicular damage per location per day in the period that
followed the introduction of Pokémon GO relative to the prior period. This
22
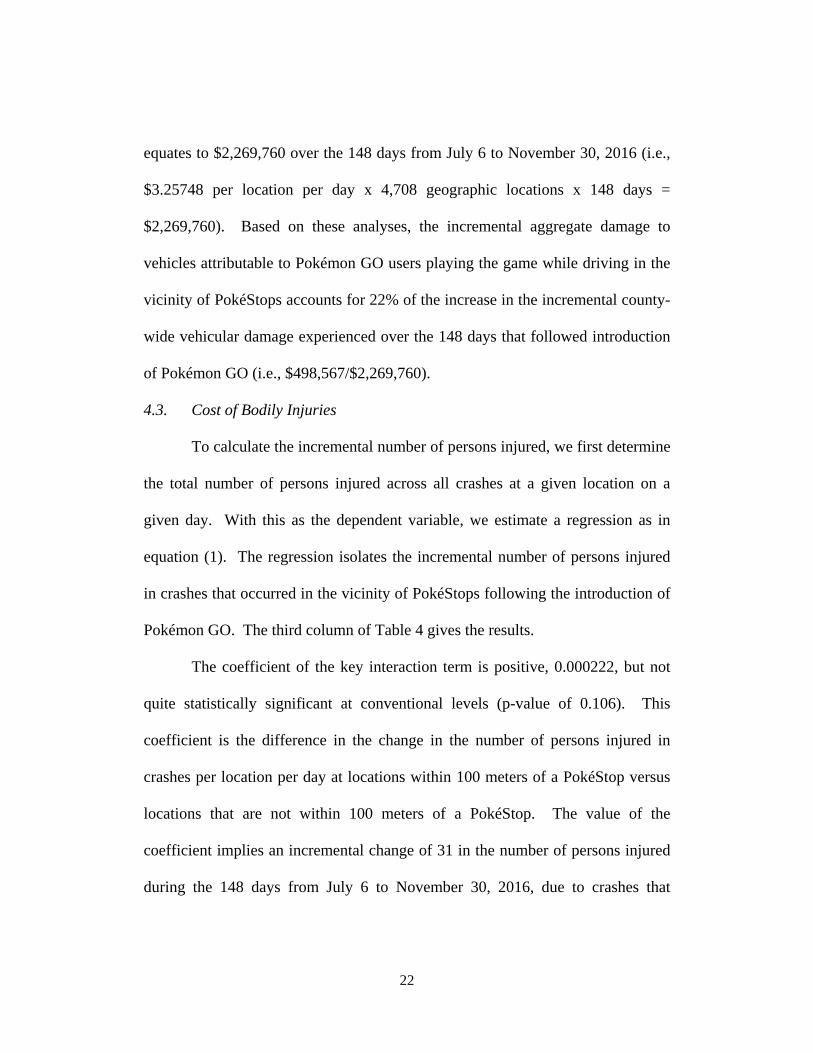
equates to $2,269,760 over the 148 days from July 6 to November 30, 2016 (i.e.,
$3.25748 per location per day x 4,708 geographic locations x 148 days =
$2,269,760). Based on these analyses, the incremental aggregate damage to
vehicles attributable to Pokémon GO users playing the game while driving in the
vicinity of PokéStops accounts for 22% of the increase in the incremental county-
wide vehicular damage experienced over the 148 days that followed introduction
of Pokémon GO (i.e., $498,567/$2,269,760).
4.3. Cost of Bodily Injuries
To calculate the incremental number of persons injured, we first determine
the total number of persons injured across all crashes at a given location on a
given day. With this as the dependent variable, we estimate a regression as in
equation (1). The regression isolates the incremental number of persons injured
in crashes that occurred in the vicinity of PokéStops following the introduction of
Pokémon GO. The third column of Table 4 gives the results.
The coefficient of the key interaction term is positive, 0.000222, but not
quite statistically significant at conventional levels (p-value of 0.106). This
coefficient is the difference in the change in the number of persons injured in
crashes per location per day at locations within 100 meters of a PokéStop versus
locations that are not within 100 meters of a PokéStop. The value of the
coefficient implies an incremental change of 31 in the number of persons injured
during the 148 days from July 6 to November 30, 2016, due to crashes that
23
occurred within 100 meters of PokéStops (i.e., 0.000222 incremental persons
injured per location per day x 930 locations x 148 days). Based on our analysis,
31 fewer persons would have been injured over this period in vehicular crashes
had Pokémon GO not been introduced.
To provide a basis for comparison, the fourth regression isolates the
change in the number of county-wide injuries in the period that followed the
introduction of the game. The coefficient of Post shows a statistically significant
increase of 0.000176 (p-value < 0.001) in the number of persons injured in
vehicular crashes per geographic location per day in the period that followed the
introduction of Pokémon GO. This implies that 123 additional persons were
injured over the 148 days from July 6 to November 30, 2016, relative to the
period prior to the introduction of the game (i.e., 0.000176 persons injured per
location per day x 4,708 geographic locations x 148 days). The incremental
number of people injured attributable to Pokémon GO users playing the game
while driving in the vicinity of PokéStops accounts for 25% of the county-wide
increase in the number of persons injured over the 148 days that followed the
introduction of the game (i.e., 31/123 persons injured).
We use two approaches to assess the incremental cost of injuries to drivers
and passengers. In the first, we use the dollar value of insurance claims. In the
second, we use the value of a statistical injury from Viscusi and Gentry (2015).
24
The dollar value of insurance claims comprises two components: the claim
for bodily injuries and the claim for lost lifetime income. According to the
Insurance Information Institute (https://www.iii.org/fact-statistic/facts-statistics-
auto-insurance), the average claim for bodily injuries due to vehicular crashes in
the U.S. during 2015–2016 was $16,427. To calculate the lifetime income loss
due to lost time at work, we use data from the Centers for Disease Control and
Prevention (CDC, https://www.cdc.gov/vitalsigns/crash-injuries/index.html).
According to the CDC, total lifetime work lost in the U.S. in 2012 due to
vehicular crash injuries was $33 billion. According to the NHTSA (2013), there
were 2.134 million traffic crash injuries in 2012.15 These statistics imply an
average lifetime income loss of $15,464 per injury. Given the 31 incremental
injuries in Tippecanoe County due to Pokémon GO users playing the game while
driving in the vicinity of PokéStops, the estimated total incremental insurance
claims for injuries is $988,621 (i.e., ($16,427 + $15,464) x 31 incremental
injuries).
According to Viscusi and Gentry (2015), the value of a statistical injury
for transportation-related events ranges from $70,000 to $210,000. Using the
mid-point of this range as the cost per injured person, the total incremental cost of
injuries is $4.34 million due to users playing the game while driving in the
vicinity of PokéStops in Tippecanoe County over the 148 days following the
15 https://crashstats.nhtsa.dot.gov/Api/Public/ViewPublication/812032
25
introduction of the game (i.e., 31 injured persons x $140,000 per injury). Table 5
summarizes the estimated incremental costs of human injuries.
The more conservative calculations imply an incremental cost of $9.86 per
year-round county resident of age 15 or older over the 148 days following
introduction of Pokémon GO (i.e., ($498,567 + $988,621)/150,825 Tippecanoe
County year-round residents of age 15 or older.)16 According to the National
Association of Insurance Commissioners (2017), the average annual automobile
insurance premium for the state of Indiana was $728.93 for the year 2014. Pro
rating the $728.93 to a 148 day period, the implied increase in the insurance
premium is 3.34% assuming that every year-round resident of the county of age
15 or older is an insured driver.
4.4. Value of Human Lives Lost
To calculate the incremental number of human lives lost, we first
determine the total number of lives lost across all crashes that occurred at a given
location on a given day. The fifth regression in Table 4 uses this as the dependent
variable. The coefficient of the key interaction term, PokéStop100 x Post, is
positive and statistically significant with a value of 0.000017 (p-value = 0.041).
The value of the coefficient implies an incremental increase of two fatalities
during the 148 days from July 6 to November 30, 2016, due to crashes that
16 We use the cut-off of 15 years or older because the census does not give a category of 16 years of age or older.
26
occurred within 100 meters of PokéStops (i.e., 0.000017 fatalities per location per
day x 930 locations x 148 days = 2.3 fatalities).
The sixth regression provides a benchmark by showing that Tippecanoe
County experienced a decline of one fatality related to vehicular crashes per
geographic location per day in the period that followed the introduction of the
game (coefficient = -0.00000074) relative to the pre-Pokémon GO period. Thus,
our analyses indicate that in the absence of the introduction of Pokémon GO,
fatalities would have declined by three rather than one, for a net of two lives that
would not have been lost.
Attaching a value to a human life is always problematic. We use two
approaches. In the first, we compute lifetime income lost. In the second we use
the value of a statistical life from Viscusi and Gentry (2015).
To calculate lifetime income lost per fatality, we multiply the annual
income per capita of full-time employees in the cities of Lafayette and West
Lafayette, Indiana, from the American Community Survey Public Use Microdata
Sample files produced by the Census Bureau17 by the difference between average
life expectancy in the US and the median age of persons who died in vehicular
crashes in our sample. To calculate the total lost income, we multiply the loss of
income per fatality by the number of fatalities. The calculation yields a total of
$3,760,000 in lost income due to drivers playing Pokémon GO in the vicinity of
17 https://datausa.io/profile/geo/tippecanoe-county-in/
27
PokéStops (2 fatalities x $47,000 per fatality x (80 years - 40 years)). This
number aligns with the estimate from Ashenfelter and Greenstone (2004) who
calculate an upper bound of $1.54 million as the value of a statistical life based on
hours of work saved due to a change in the speed limits on rural interstate roads.
Viscusi and Gentry (2015) report an estimated range of $6.9 to $13.8
million for the value of a statistical life based on transportation related fatalities.
Using the mid-point of the range reported by Viscusi and Gentry, the incremental
value of lives lost due to users playing the game while driving in the proximity of
PokéStops is $20.7 million ($10.35 million x 2 lives lost). Table 5 summarizes
the estimated value of the incremental lives lost.
Using the more conservative estimate of the value of incremental lives
lost, and assuming that every year-round resident of the county of age 15 or older
is an insured driver, the implied increase in insurance premiums is 11.77% for the
148 days that follow the introduction of the game.
4.5. Commentary
Clearly, regardless of how the number is calculated, the value of human
lives lost swamps all other costs. Holding aside that cost, our estimate of other
costs is likely to be downward biased in that we do not include such items as the
costs of police, firefighters, ambulances, road assistance, rental cars, and damage
to other property. Additionally, our total reflects only the incremental cost of
users playing Pokémon GO while driving in the proximity of PokéStops. It does
28
not include any cost due to crashes related to players attempting to capture
Pokémons while driving not in the vicinity of PokéStops. It also does not include
the costs of crashes not reported to the police that are attributable to the drivers
playing the game.
Regardless of how they are calculated, the incremental economic and
human costs of users playing Pokémon GO while driving are significant.
5. Robustness Tests
5.1. Alternative Interpretations: Traffic
A possible alternative explanation of the results is that the increase in
crashes near PokéStops reflects an increase in traffic due to players driving to
PokéStops, parking their vehicles then playing the game. Thus, while the increase
in crashes near PokéStops is attributable to the introduction of Pokémon GO, it is
not due to users playing the game while driving. To address that possibility, we
conduct three tests, the third of which is reported in an internet appendix.
First, we use Gyms as a placebo. As we noted, Gyms are locations in
which Pokémon GO related activities take place, but these activities cannot take
place while the player is driving. If the alternative explanation, that the increase
in crashes near PokéStops is the result of an increase in traffic is correct, it
follows that an increase in crashes should also occur in the vicinity of Gyms. To
investigate that possibility, we estimate a regression similar to the baseline
regression in the first column of Table 2, with the only difference being that
29
instead of comparing locations in the proximity of PokéStops to locations not in
the proximity of PokéStops, we compare locations in the proximity of PokéStops
with locations in the proximity of Gyms that are not in the proximity of
PokéStops. The number of locations included in this regression is 1,053. Those
1,053 locations include 930 locations that are within 100 meters of a PokéStop
while 123 are within 100 meters of a Gym and not also within 100 meters of a
PokéStop.
The results of the regression are given in first column of Table 6. If the
alternative explanation is correct, the coefficient of the interaction between
PokéStop100 and Post would be statistically indistinguishable from zero. Instead,
the coefficient is positive and statistically significant (p-value = 0.026) and even
greater in magnitude than the coefficient in the baseline regression. These results
are inconsistent with the alternative explanation.
In the second test, we estimate a regression similar to the baseline
regression except that we add the change in the number crashes in the circle (of a
500 meters radius) that surrounds each geographic location as an additional
control variable. By doing so, we recognize that if traffic increased in the circle
surrounding a location, crashes would also increase in that circle. Importantly, we
assume that for traffic to increase at locations in the proximity of PokéStops (as
players drive to those locations), traffic also must increase along the route that
takes players to such locations - - if players were walking to locations in the
30
proximity of PokéStops, vehicular traffic and traffic-related crashes would not
increase.
To compute the change in the number of daily crashes within the circle
surrounding each location, we exclude crashes at the location in question and
crashes (within the circle) that are within 100 meters of a PokéStop. The first are
excluded because they are the dependent variable; the second are excluded
because those crashes may be attributable to users playing the game while
driving. To capture changes in traffic, we compute the average daily total number
of crashes in the 500 meter circle for the period that follows the introduction of
Pokémon GO, as well as for the period that precedes the introduction of the game.
Because of the inclusion of location fixed effects in the regression, the variable
No. of Crashes within 500 Meters of Location L captures the change in vehicular
crashes in the period that follows the introduction of Pokémon GO relative to the
period that precedes the introduction of the game.
Contrary to the notion that an increase in traffic gives rise to our results,
the proxy for the change in traffic in the area surrounding a location is
insignificantly related to the change in crashes at the location in question (p-value
= 0.620). More importantly, the coefficient of the key interaction between
PokéStop100 and Post remains statistically significant (p-value < 0.001).
31
5.2. Alternative Interpretations: Pedestrians
Our sample includes 42 instances in which an action(s) by pedestrians is
given in the police report as being the primary cause of the crash. Of these, four
occurred after the introduction of Pokémon GO. To rule out the possibility that
the increase in crashes is due to pedestrians playing the game, we omit these
observations from the sample and re-estimate the baseline regression. The results
are shown in the third column of Table 6. The coefficient of PokéStop100 x Post
is 0.00095 (p-value < 0.001). Thus, the increase in crashes in the proximity of
PokéStops following the introduction of the game is not due to pedestrians.
5.3. Cause of Crashes Given in the Police Reports
The sample includes 213 crashes where the “primary cause” given in the
police accident reports is either “Cell Phone Usage” (N=24), “Driver Asleep or
Fatigued” (N=54), or “Driver Distracted” (N=135). We label these “distracted
driver” crashes. It is commonly believed that police accident reports understate
(perhaps by a great margin) the number of crashes due to driver distraction (e.g.,
NHTSA (2009), National Safety Council (2013)). We re-estimate the baseline
regression of Table 2 using the number of distracted driver crashes as the
dependent variable. The results of this regression are reported in the fourth
column of Table 6. The coefficient of PokéStop100 x Post indicates that
distracted driver crashes as given in the police reports increase disproportionately
in the vicinity of PokéStops following the introduction of Pokémon GO.
32
Although these results are based on a relatively small sample of crashes involving
(presumably) self-reported driver distraction, they do corroborate a link between
PokéStop locations and crashes attributed to distracted drivers.
5.4. Other Confounding Events
On November 15, 2012, Niantic launched the augmented reality game
Ingress. The game was also location based, but was much less popular, even at its
peak of popularity, than Pokémon GO. Nevertheless, many of the points of play
of the two games overlap. It is possible that some of the users of Pokémon GO
were not new users of a location-based game. If so, it is possible that some of the
Pokémon GO players were merely substituting one game for the other. In any
event, our estimates of the incremental effect of playing Pokémon GO while
driving are still unbiased.
Further, on May 16, 2016, Niantic began field testing Pokémon GO in the
U.S. Game-players could apply to enroll in the beta testing and begin playing the
game prior to its official launch. To the extent that such activity increased crashes
in the vicinity of PokéStops prior to July 6, 2016, certain of our estimates of the
incremental increase in crashes due to introduction of the game would be
downward biased. However, the tests in which the frequency of crashes in the
vicinity of PokéStops in the week or month after the introduction of the game is
compared with the frequency of crashes in the vicinity of PokéStops in the same
week or month of the prior year cannot suffer from this bias.
33
5.5. Identifying Assumptions
The results in the paper are based on a difference-in-differences
methodology. A clear benefit of this approach is its simplicity and, thus,
transparency. It is, however, important to recognize that the methodology
crucially relies on two assumptions: (1) the exogeneity of the timing of the
introduction of Pokémon GO and (2) the comparability of the locations in the
proximity of PokéStops and of locations not in the proximity of PokéStops.
5.5.1. Exogeneity of the Timing of the Introduction of Pokémon GO
A number of tests in the earlier sections validate the exogeneity of the
timing of the introduction of Pokémon GO. Importantly, we show that the results
are robust to using a short time interval that includes a sharp discontinuity
represented by the introduction of the game. We also document that, following
the introduction of the game, the magnitude of the results varied as the number of
players changed over time. Thus, the results are concentrated around the
introduction of the game and vary depending on the intensity of play. These
results support the presumption that the date of the introduction of the game is
exogenous.
5.5.2. Comparability of the Locations
The comparability of locations in the proximity of PokéStops and
locations not in the proximity of PokéStops relies on the assumption that, absent
the introduction of the game, the average change in the number of crashes over
34
time would have been the same for the two sets of locations. We refer to this as
the parallel trends assumption.
To test whether the data satisfy the parallel trends assumption, we estimate
a regression in which the dependent variable is the number of crashes per location
per day. The key independent variables are interactions between PokéStop100
and an indicator for each month over the sample period excluding the months of
October and November 2015. We exclude two months so as to have a benchmark
for comparison. We exclude October and November 2015 as they are the
midpoint of the pre-Pokémon GO time period. Further, these months are not an
unreasonable benchmark because the difference in the number of crashes at
locations in the vicinity of PokéStops in these months and locations not in the
vicinity of PokéStops during these months is representative of the typical
difference during the pre-Pokémon GO period. The other independent variables
are date and location fixed effects and the interaction between University Break
and PokéStop100.
The parallel trends assumption is supported if the coefficients of the
month and PokéStop100 interaction variables do not indicate a trend through time
prior to July 6, 2016. Figure 1 is a plot of the coefficients by month over the
entire sample period. As the figure shows, there is no trend in the coefficients
over the months that precede the introduction of the game, thereby, supporting the
parallel trends assumption. Equally important, the figure evidences a sharp
35
discontinuity starting the month of the introduction of Pokémon GO. The
coefficient of the interaction term is positive in each of the following months and
statistically significant for the intervals of July 6, 2016, through July 31, 2016,
and the months of August and October. In line with Table 2, the coefficient of the
interaction term declines in the months that follow the introduction of the game,
in line with the decline in the number of active players. These results confirm the
connection between the introduction of the game and the increase in crashes in the
proximity of PokéStops. These results validate the use of the difference-in-
differences methodology.
6. Conclusion
Based on detailed police accident reports for Tippecanoe County, Indiana,
we determine that users playing the augmented reality game Pokémon GO while
driving gave rise to a disproportionate increase in vehicular crashes, injuries, and
fatalities in the vicinity of PokéStops over the 148 days following the introduction
of the game. In total, the estimated incremental costs associated with these
crashes range from $5.2 million to $25.5 million with the variability in the range
being largely attributable to the value assigned to the two incremental lives lost.
Regardless of how they are measured, the costs are significant, as are the implied
increases in vehicular insurance premiums.
Extrapolation of our results to a state-wide or nation-wide total is
speculative, and may be especially so given that the playing of games on mobile
36
phones while driving is legal in in the state of Indiana but not in all other states.
With that in mind, as a point of reference, if the increases in crashes associated
with Tippecanoe County are applied to the national totals, the increase in crashes
attributable to the introduction of Pokémon GO is 145,632 with an associated
increase in the number of injuries of 29,370 and an associated increase in the
number of fatalities of 256 over the period of July 6, 2016, through November 30,
2016.18 The implied nation-wide economic cost of users playing the game while
driving in the vicinity of PokéStops ranges from $2 billion to $7.3 billion over the
148 days following introduction of the game with equally large implied increases
in insurance premiums.
Using these numbers as a basis for policy recommendations is tempting.
The immediate impulse is to recommend further bans on the use of smartphones
while driving. The cautions associated with such a recommendation are three-
fold. First, in response to concerns about potential crashes due to users playing
the game while driving, in an update of the game, Niantic added a pop up
message saying “You’re going too fast! Pokémon GO should not be played while
18 The increase in the number of crashes nation-wide, 145,632, is calculated as 6,296,000 crashes x 134/5,793, where 6,296,000 is the total number of vehicular crashes in the U.S. in 2015 (NHTSA, 2016), 134 is the number of incremental crashes attributable to Pokémon GO during the time interval of July 6, 2016, through November 30, 2016 (from Table 2), and 5,793 is the county-wide number of vehicular crashes in Tippecanoe Country in 2015 (http://bikewalkgreaterlafayette.org/wp-content/uploads/2017/05/2015_Tippecanoe-County_Crash-Report.pdf). The increase in the number of nation-wide injuries, 29,370, is computed as 145,632 x 0.20167 persons injured per crash (from Table 1). The increase in the number of nation-wide fatalities, 256, is computed as 145,632 x 0.00176 fatalities per crash (from Table 1).
37
driving.” This message pops up when the game detects the player to be in a
rapidly moving vehicle. A message further asks the player to confirm that she is a
passenger. Thus, in an effort at self-regulation, the game cautions users against
playing the game while driving. Second, policy recommendations require a
consideration of both costs and benefits and we have made no attempt to calculate
the economic benefits of using mobile devices while driving. We acknowledge,
though, that identifying any economic benefits of playing Pokémon GO while
driving stretches our imaginations. Third, as concluded by Abouk and Adams
(2013), the Highway Loss Data Institute (2010), and Lim and Chi (2013), the
effect, if any, of bans on the usage of mobile phones (including texting) while
driving appears to be short-lived or limited to specific subsets of drivers.
38
References Abouk, Rahi, and Scott Adams, 2013, Texting and Fatal Accidents on Roadways:
Do they Work? Or do Drivers Just React to Announcements of Bans, American
Economic Journal: Applied Economics, Vol. 5(2), 179-199.
Ashenfelter, Orley, and Michael Greenstone, 2004, Using Mandated Speed Limits
to Measure the Value of a Statistical Life, Journal of Political Economy, Vol.
112(1), 226-267.
Aspin, Chris, 1995, The First Industrial Society: Lancashire 1750–1850,
Carnegie Publishing.
Ayers, John W., Eric C. Leas, Mark Dredze, Jon-Patrick Allem, Jurek G.
Grabowski, and Linda Hill, 2016, Pokémon GO—A New Distraction for
Drivers and Pedestrians, JAMA Internal Medicine, Vol. 176 (12), 1865-1866.
Bertrand, Marianne, Esther Duflo, and Sendhil Mullainathan, 2004, How Much
Should We Trust Differences-In-Differences Estimates? The Quarterly Journal
of Economics, Vol. 119 (1), 249-275.
Bhargava, Saurabh, and Vikram S. Pathania, 2013, Driving under the (Cellular)
Influence, American Economic Journal: Economic Policy, Vol. 5(3), 92-125.
Cohen, Joshua T., and John D. Graham, 2003, A Revised Economic Analysis of
Restrictions on the Use of Cell Phones While Driving, Risk Analysis, Vol.
23(1), 5-17.
Hahn, Robert W., and James E. Prieger, 2014, The Impact of Driver Cell Phone
Use on Accidents, AEI-Brookings Joint Center for Regulatory Studies,
Working paper 04-14.
Highway Loss Data Institute, 2010, Texting Laws and Collision Claim
Frequencies. Highway Loss Data Institute Bulletin, Vol. 27(11). Arlington,
Virginia
Kolko, Jed D., 2009, The Effects of Mobile Phone and Hands-Free Laws on
Traffic Fatalities, B. E. Journal of Economic Analysis and & Policy, Vol. 9(1),
39
Article 10.
Lim, Siew Hoon, and Junwook Chi, 2013, Cellphone Bans and Fatal Motor
Vehicle Crash Rates in the United States, Journal of Public Health Policy, Vol.
34(2), 197-212.
McCartt, Anne T., David G. Kidd, and Eric R. Teoh, 2014, Driver Cellphone and
Texting Bans in the United States: Evidence of Effectiveness, Annals of
Advances in Automotive Medicine, Vol. 58, 99-114.
National Association of Insurance Commissioners, 2017, Auto Insurance
Database Report 2013/2014.
National Safety Council, 2013, Crashes Involving Cell Phones. Challenges of
Collecting and Reporting Reliable Crash Data. Itasca, Illinois.
NHTSA, 2009, An Examination of Driver Distraction as Recorded in NHTSA
Databases, U.S. Department of Transportation.
NHTSA, 2010, Traffic Safety Facts 2008, U.S. Department of Transportation.
NHTSA, various years, Motor Vehicle Crashes: Overview, U.S. Department of
Transportation.
Peltzman, Sam, 1975, The Effects of Automobile Safety Regulation, Journal of
Political Economy, Vol. 83(4), 677-726.
Petersen, Mitchell A., 2009, Estimating Standard Errors in Finance Panel Data
Sets: Comparing Approaches, The Review of Financial Studies, Vol. 22(1),
435-480.
Redelmeir, Donald A, and Robert J. Tibshirani, 1997, Association between
Cellular-Telephone Calls and Motor Vehicle Collisions, The New England
Journal of Medicine, Vol. 336(7), 453-458.
Viscusi, W. Kip, and Elissa Philip Gentry, 2015, The Value of a Statistical Life
for Transportation Regulations: A Test of the Benefits Transfer Methodology,
The Journal of Risk and Uncertainty, Vol. 51(1), 53-77.
40
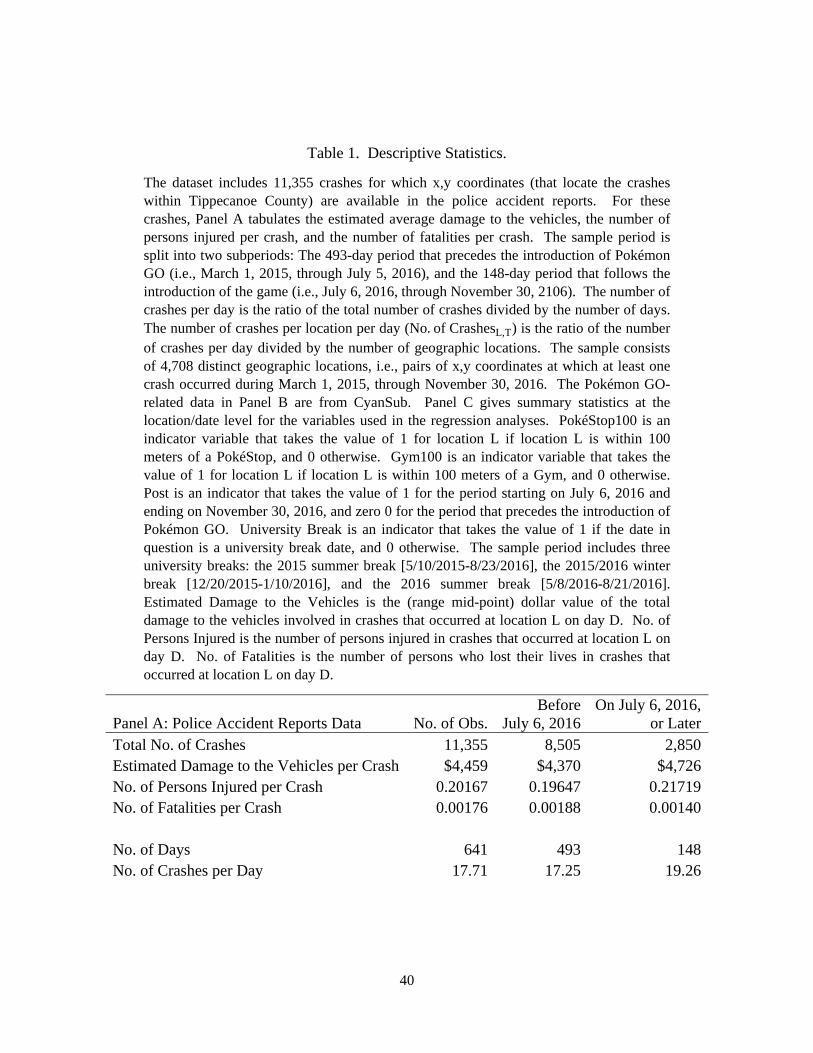
Table 1. Descriptive Statistics.
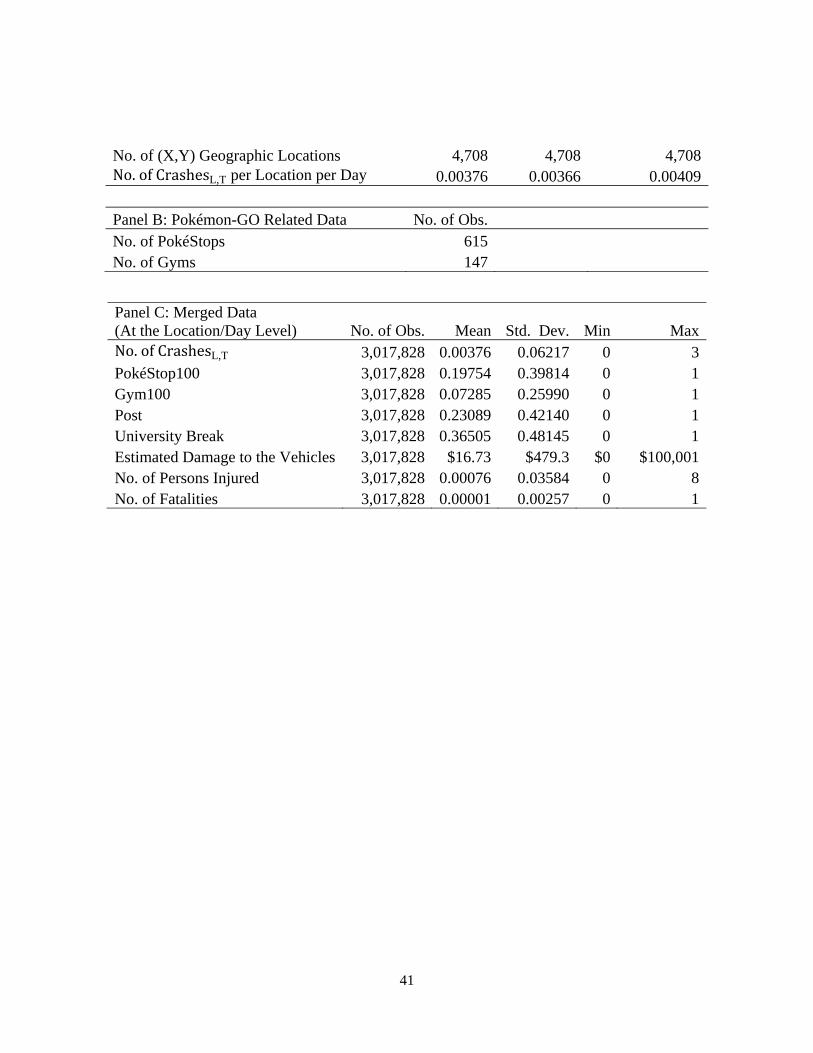
The dataset includes 11,355 crashes for which x,y coordinates (that locate the crashes within Tippecanoe County) are available in the police accident reports. For these crashes, Panel A tabulates the estimated average damage to the vehicles, the number of persons injured per crash, and the number of fatalities per crash. The sample period is split into two subperiods: The 493-day period that precedes the introduction of Pokémon GO (i.e., March 1, 2015, through July 5, 2016), and the 148-day period that follows the introduction of the game (i.e., July 6, 2016, through November 30, 2106). The number of crashes per day is the ratio of the total number of crashes divided by the number of days. The number of crashes per location per day (No.of CrashesL,T) is the ratio of the number of crashes per day divided by the number of geographic locations. The sample consists of 4,708 distinct geographic locations, i.e., pairs of x,y coordinates at which at least one crash occurred during March 1, 2015, through November 30, 2016. The Pokémon GO-related data in Panel B are from CyanSub. Panel C gives summary statistics at the location/date level for the variables used in the regression analyses. PokéStop100 is an indicator variable that takes the value of 1 for location L if location L is within 100 meters of a PokéStop, and 0 otherwise. Gym100 is an indicator variable that takes the value of 1 for location L if location L is within 100 meters of a Gym, and 0 otherwise. Post is an indicator that takes the value of 1 for the period starting on July 6, 2016 and ending on November 30, 2016, and zero 0 for the period that precedes the introduction of Pokémon GO. University Break is an indicator that takes the value of 1 if the date in question is a university break date, and 0 otherwise. The sample period includes three university breaks: the 2015 summer break [5/10/2015-8/23/2016], the 2015/2016 winter break [12/20/2015-1/10/2016], and the 2016 summer break [5/8/2016-8/21/2016]. Estimated Damage to the Vehicles is the (range mid-point) dollar value of the total damage to the vehicles involved in crashes that occurred at location L on day D. No. of Persons Injured is the number of persons injured in crashes that occurred at location L on day D. No. of Fatalities is the number of persons who lost their lives in crashes that occurred at location L on day D.
Panel A: Police Accident Reports Data No. of Obs.Before
July 6, 2016 On July 6, 2016,
or LaterTotal No. of Crashes 11,355 8,505 2,850Estimated Damage to the Vehicles per Crash $4,459 $4,370 $4,726No. of Persons Injured per Crash 0.20167 0.19647 0.21719No. of Fatalities per Crash 0.00176 0.00188 0.00140 No. of Days 641 493 148No. of Crashes per Day 17.71 17.25 19.26
41
No. of (X,Y) Geographic Locations 4,708 4,708 4,708No.ofCrashesL,T per Location per Day 0.00376 0.00366 0.00409 Panel B: Pokémon-GO Related Data No. of Obs. No. of PokéStops 615 No. of Gyms 147
Panel C: Merged Data (At the Location/Day Level) No. of Obs. Mean Std. Dev. Min MaxNo.ofCrashesL,T 3,017,828 0.00376 0.06217 0 3PokéStop100 3,017,828 0.19754 0.39814 0 1Gym100 3,017,828 0.07285 0.25990 0 1Post 3,017,828 0.23089 0.42140 0 1University Break 3,017,828 0.36505 0.48145 0 1Estimated Damage to the Vehicles 3,017,828 $16.73 $479.3 $0 $100,001No. of Persons Injured 3,017,828 0.00076 0.03584 0 8No. of Fatalities 3,017,828 0.00001 0.00257 0 1
42
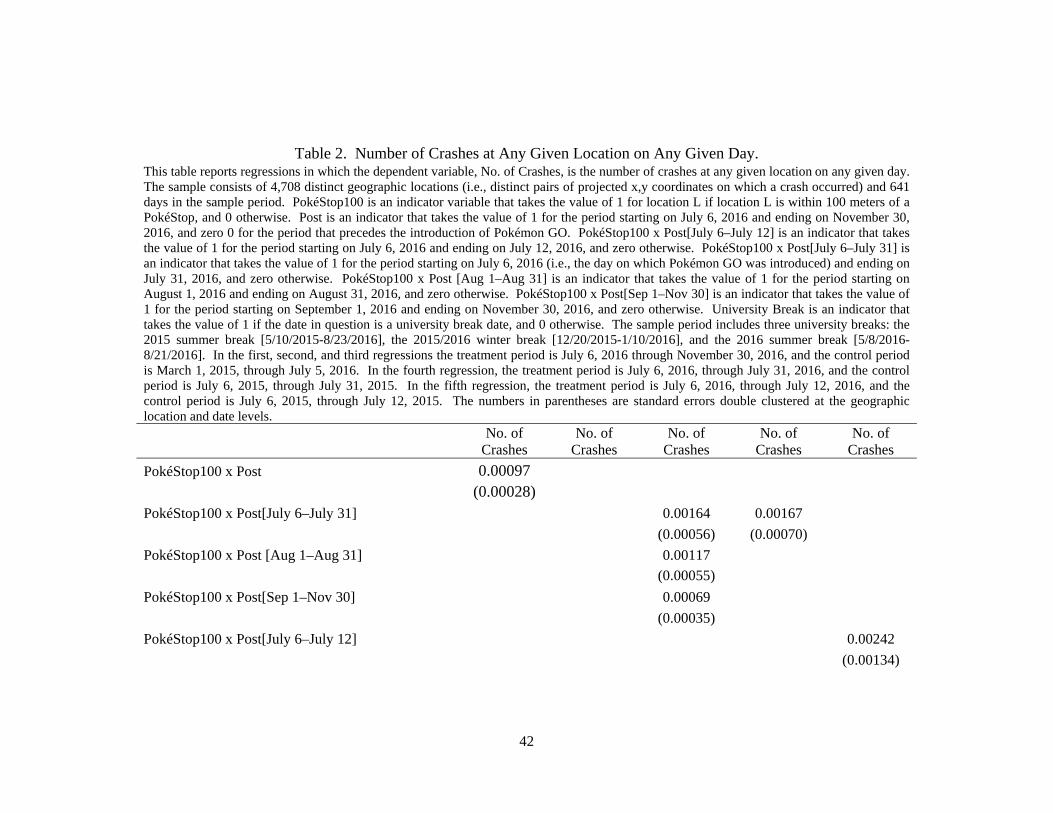
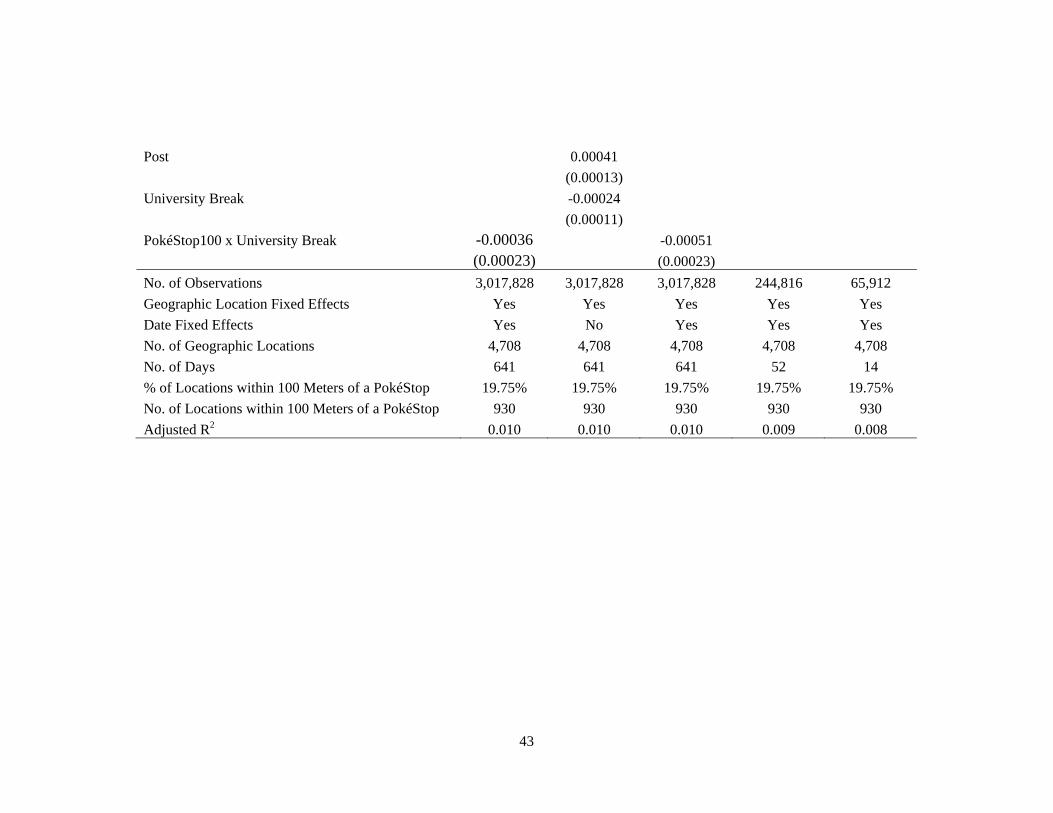
Table 2. Number of Crashes at Any Given Location on Any Given Day. This table reports regressions in which the dependent variable, No. of Crashes, is the number of crashes at any given location on any given day. The sample consists of 4,708 distinct geographic locations (i.e., distinct pairs of projected x,y coordinates on which a crash occurred) and 641 days in the sample period. PokéStop100 is an indicator variable that takes the value of 1 for location L if location L is within 100 meters of a PokéStop, and 0 otherwise. Post is an indicator that takes the value of 1 for the period starting on July 6, 2016 and ending on November 30, 2016, and zero 0 for the period that precedes the introduction of Pokémon GO. PokéStop100 x Post[July 6–July 12] is an indicator that takes the value of 1 for the period starting on July 6, 2016 and ending on July 12, 2016, and zero otherwise. PokéStop100 x Post[July 6–July 31] is an indicator that takes the value of 1 for the period starting on July 6, 2016 (i.e., the day on which Pokémon GO was introduced) and ending on July 31, 2016, and zero otherwise. PokéStop100 x Post [Aug 1–Aug 31] is an indicator that takes the value of 1 for the period starting on August 1, 2016 and ending on August 31, 2016, and zero otherwise. PokéStop100 x Post[Sep 1–Nov 30] is an indicator that takes the value of 1 for the period starting on September 1, 2016 and ending on November 30, 2016, and zero otherwise. University Break is an indicator that takes the value of 1 if the date in question is a university break date, and 0 otherwise. The sample period includes three university breaks: the 2015 summer break [5/10/2015-8/23/2016], the 2015/2016 winter break [12/20/2015-1/10/2016], and the 2016 summer break [5/8/2016-8/21/2016]. In the first, second, and third regressions the treatment period is July 6, 2016 through November 30, 2016, and the control period is March 1, 2015, through July 5, 2016. In the fourth regression, the treatment period is July 6, 2016, through July 31, 2016, and the control period is July 6, 2015, through July 31, 2015. In the fifth regression, the treatment period is July 6, 2016, through July 12, 2016, and the control period is July 6, 2015, through July 12, 2015. The numbers in parentheses are standard errors double clustered at the geographic location and date levels.
No. of
Crashes No. of
Crashes No. of
Crashes No. of
Crashes No. of
Crashes
PokéStop100 x Post 0.00097
(0.00028)
PokéStop100 x Post[July 6–July 31] 0.00164 0.00167
(0.00056) (0.00070)
PokéStop100 x Post [Aug 1–Aug 31] 0.00117
(0.00055)
PokéStop100 x Post[Sep 1–Nov 30] 0.00069
(0.00035)
PokéStop100 x Post[July 6–July 12] 0.00242
(0.00134)
43
Post 0.00041
(0.00013)
University Break -0.00024
(0.00011)
PokéStop100 x University Break -0.00036 -0.00051
(0.00023) (0.00023)
No. of Observations 3,017,828 3,017,828 3,017,828 244,816 65,912
Geographic Location Fixed Effects Yes Yes Yes Yes Yes
Date Fixed Effects Yes No Yes Yes Yes
No. of Geographic Locations 4,708 4,708 4,708 4,708 4,708
No. of Days 641 641 641 52 14
% of Locations within 100 Meters of a PokéStop 19.75% 19.75% 19.75% 19.75% 19.75%
No. of Locations within 100 Meters of a PokéStop 930 930 930 930 930
Adjusted R2 0.010 0.010 0.010 0.009 0.008
44
Table 3. Number of Crashes at Any Given Location on Any Given Day.
This table reports regressions in which the dependent variable, No. of Crashes, is the number of crashes at any given location on any given day. The sample consists of 4,708 distinct geographic locations (i.e., distinct pairs of projected x,y coordinates on which a crash occurred) and 641 days in the sample period. PokéStop is an indicator that takes the value of 1 for location L if location L is within M meters of a PokéStop, and 0 otherwise. Post is an indicator that takes the value of 1 for the period starting on July 6, 2016, and ending on November 30, 2016, and zero 0 for the period that precedes the introduction of Pokémon GO. University Break is an indicator that takes the value of 1 if the date in question is a university break date, and 0 otherwise. The sample period includes three university breaks: the 2015 summer break [5/10/2015-8/23/2016], the 2015/2016 winter break [12/20/2015-1/10/2016], and the 2016 summer break [5/8/2016-8/21/2016]. The numbers in parentheses are standard errors double clustered at the geographic location and date levels.
No. of
Crashes No. of
Crashes No. of
Crashes No. of
Crashes PokéStop50 x Post 0.00124
(0.00043) PokéStop100 x Post 0.00097
(0.00028) PokéStop250 x Post 0.00051
(0.00019) PokéStop500 x Post 0.00027
(0.00019) PokéStop100 x University Break -0.00039 -0.00036 -0.00040 -0.00041
(0.00023) (0.00023) (0.00023) (0.00023) No. of Observations 3,017,828 3,017,828 3,017,828 3,017,828 Geographic Location Fixed Effects Yes Yes Yes Yes Date Fixed Effects Yes Yes Yes Yes No. of Geographic Locations 4,708 4,708 4,708 4,708 No. of Days 641 641 641 641
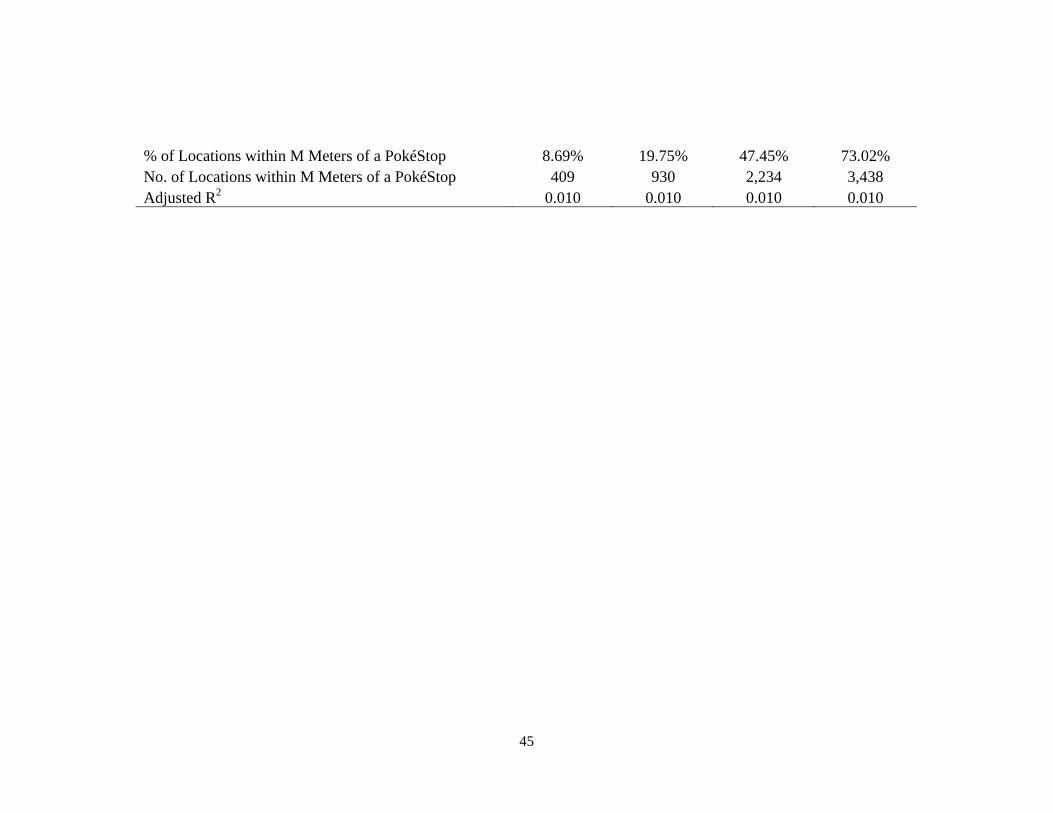
45
% of Locations within M Meters of a PokéStop 8.69% 19.75% 47.45% 73.02% No. of Locations within M Meters of a PokéStop 409 930 2,234 3,438 Adjusted R2 0.010 0.010 0.010 0.010
46
Table 4. Severity of the Crashes. This table reports regressions in which the dependent variables are the estimated damage to the vehicles involved in traffic crashes, the number of persons injured, and the number of fatalities in traffic crashes. Estimated Damage to the Vehicles is the (range mid-point) dollar value of the total damage to the vehicles involved in crashes that occurred at location L on day D, as reported in the police accident reports. No. of Persons Injured is the number of persons injured in crashes that occurred at location L on day D. No. of Fatalities is the number of persons who lost their lives in crashes that occurred at location L on day D. PokéStop100 is an indicator variable that takes the value of 1 for location L if location L is within 100 meters of a PokéStop, and 0 otherwise. Post is an indicator that takes the value of 1 for the period starting on July 6, 2016, and ending on November 30, 2016, and 0 for the period that precedes the introduction of Pokémon GO. University Break is an indicator that takes the value of 1 if the date in question is a university break date, and 0 otherwise. The sample period includes three university breaks: the 2015 summer break [5/10/2015-8/23/2016], the 2015/2016 winter break [12/20/2015-1/10/2016], and the 2016 summer break [5/8/2016-8/21/2016]. The numbers in parentheses are standard errors double clustered at the geographic location and date levels.
Estimated Damage
to the Vehicles
Estimated Damage
to the Vehicles
No. of Persons Injured
No. of Persons Injured
No. of Fatalities
No. of Fatalities
PokéStop100 x Post 3.62225 0.000222 0.000017
(1.91972) (0.000137) (0.000008)
PokéStop100 x University Break -1.33860 -0.000237 0.000001
(1.61882) (0.000102) (0.000010)
Post 3.25748 0.000176 -0.00000074
(0.85854) (0.000054) (0.00000370)
University Break -0.54364 0.000123 0.00000668
(0.71052) (0.000045) (0.00000370)
No. of Observations 3,017,828 3,017,828 3,017,828 3,017,828 3,017,828 3,017,828
Geographic Location Fixed Effects Yes Yes Yes Yes Yes Yes
Date Fixed Effects Yes No Yes No Yes No
Adjusted R2 0.004 0.004 0.002 0.002 0.000 0.000
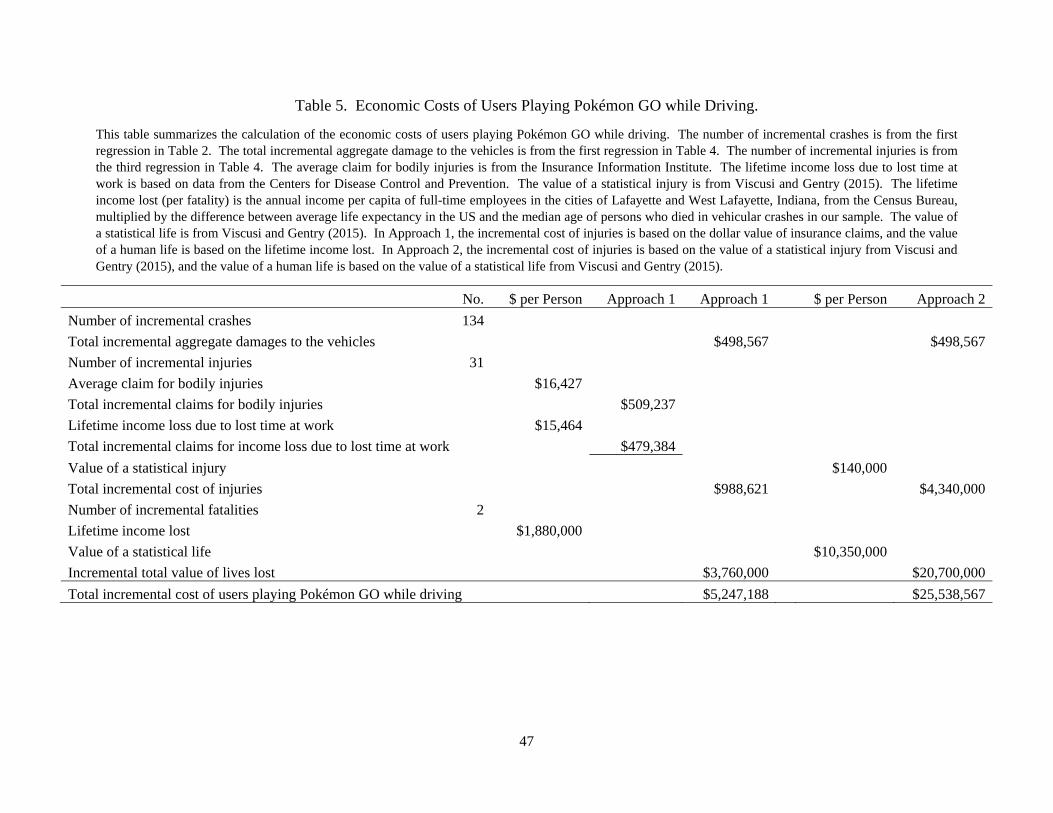
47
Table 5. Economic Costs of Users Playing Pokémon GO while Driving.
This table summarizes the calculation of the economic costs of users playing Pokémon GO while driving. The number of incremental crashes is from the first regression in Table 2. The total incremental aggregate damage to the vehicles is from the first regression in Table 4. The number of incremental injuries is from the third regression in Table 4. The average claim for bodily injuries is from the Insurance Information Institute. The lifetime income loss due to lost time at work is based on data from the Centers for Disease Control and Prevention. The value of a statistical injury is from Viscusi and Gentry (2015). The lifetime income lost (per fatality) is the annual income per capita of full-time employees in the cities of Lafayette and West Lafayette, Indiana, from the Census Bureau, multiplied by the difference between average life expectancy in the US and the median age of persons who died in vehicular crashes in our sample. The value of a statistical life is from Viscusi and Gentry (2015). In Approach 1, the incremental cost of injuries is based on the dollar value of insurance claims, and the value of a human life is based on the lifetime income lost. In Approach 2, the incremental cost of injuries is based on the value of a statistical injury from Viscusi and Gentry (2015), and the value of a human life is based on the value of a statistical life from Viscusi and Gentry (2015).
No. $ per Person Approach 1 Approach 1 $ per Person Approach 2
Number of incremental crashes 134
Total incremental aggregate damages to the vehicles $498,567 $498,567
Number of incremental injuries 31
Average claim for bodily injuries $16,427
Total incremental claims for bodily injuries $509,237
Lifetime income loss due to lost time at work $15,464
Total incremental claims for income loss due to lost time at work $479,384
Value of a statistical injury $140,000
Total incremental cost of injuries $988,621 $4,340,000
Number of incremental fatalities 2
Lifetime income lost $1,880,000
Value of a statistical life $10,350,000
Incremental total value of lives lost $3,760,000 $20,700,000
Total incremental cost of users playing Pokémon GO while driving $5,247,188 $25,538,567
48
Table 6. Placebo Tests and Alternative Explanations.
This table reports regressions in which the dependent variable, No. of Crashes, is the number of crashes at any given location on any given day. The sample consists of 4,708 distinct geographic locations (i.e., distinct pairs of projected x,y coordinates on which a crash occurred) and 641 days in the sample period. PokéStop100 is an indicator variable that takes the value of 1 for location L if location L is within 100 meters of a PokéStop, and 0 otherwise. Post is an indicator that takes the value of 1 for the period starting on July 6, 2016, and ending on November 30, 2016, and zero 0 for the period that precedes the introduction of Pokémon GO. University Break is an indicator that takes the value of 1 if the date in question is a university break date, and 0 otherwise. The sample period includes three university breaks: the 2015 summer break [5/10/2015-8/23/2016], the 2015/2016 winter break [12/20/2015-1/10/2016], and the 2016 summer break [5/8/2016-8/21/2016]. No. of Crashes within 500 Meters of Location L is the average number of crashes across all locations within the 500 meter radius circle that surrounds location L, excluding location L itself and any other location in the circle that is within 100 meters of a PokéStop. The average is computed during July 6, 2016, through November 30, 2016, for dates in the post-Pokémon period, and during March 1, 2015, through July 5, 2016, for dates in the pre-Pokémon period. No. of Crashes (Excluding Crashes Involving Pedestrians) is the number of crashes at any given location on any given day, excluding instances in which an action(s) by pedestrians is given in the police report as being the primary cause of the crash. No. of Distracted Driver Crashes is the number of crashes at any given location on any given day where the “primary cause” listed in the police accident report is either “Cell Phone Usage,” “Driver Asleep or Fatigued,” or “Driver Distracted.” The numbers in parentheses are standard errors double clustered at the geographic location and date levels.
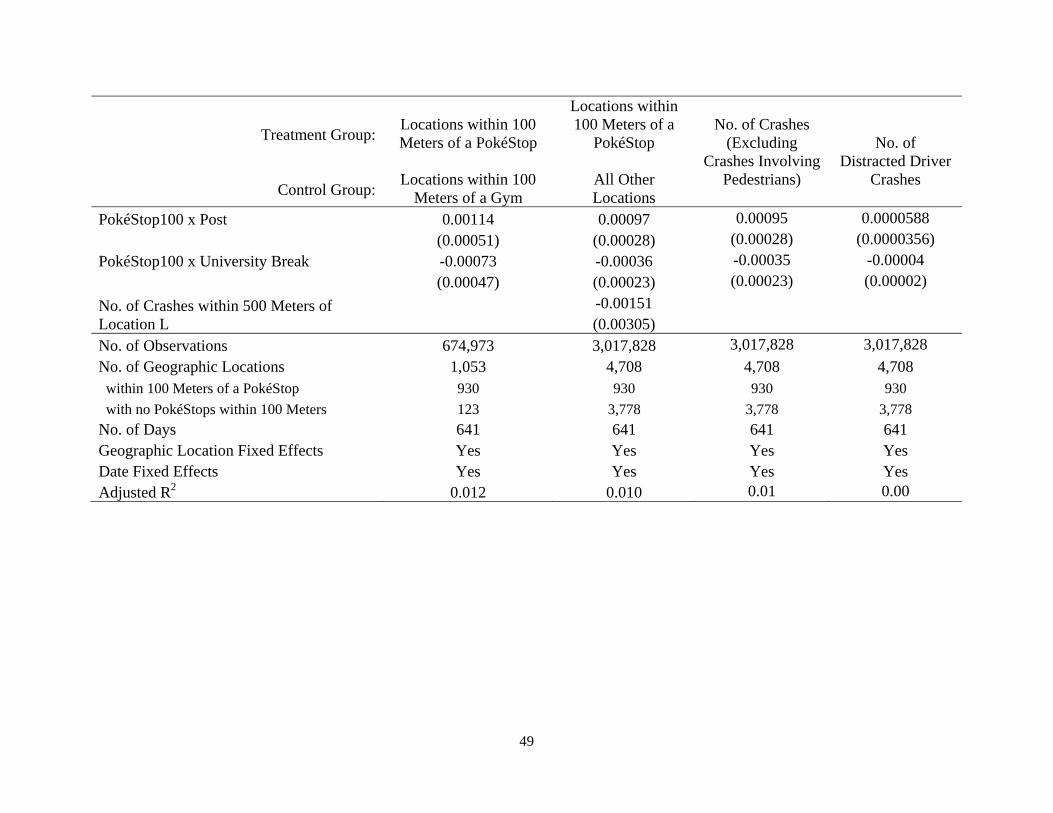
49
Treatment Group:Locations within 100 Meters of a PokéStop
Locations within 100 Meters of a
PokéStop No. of Crashes
(Excluding Crashes Involving
Pedestrians)
No. of Distracted Driver
Crashes Control Group:
Locations within 100
Meters of a Gym All Other Locations
PokéStop100 x Post 0.00114 0.00097 0.00095 0.0000588
(0.00051) (0.00028) (0.00028) (0.0000356)
PokéStop100 x University Break -0.00073 -0.00036 -0.00035 -0.00004
(0.00047) (0.00023) (0.00023) (0.00002)
No. of Crashes within 500 Meters of Location L
-0.00151 (0.00305)
No. of Observations 674,973 3,017,828 3,017,828 3,017,828
No. of Geographic Locations 1,053 4,708 4,708 4,708 within 100 Meters of a PokéStop 930 930 930 930
with no PokéStops within 100 Meters 123 3,778 3,778 3,778
No. of Days 641 641 641 641 Geographic Location Fixed Effects Yes Yes Yes Yes Date Fixed Effects Yes Yes Yes Yes Adjusted R2 0.012 0.010 0.01 0.00
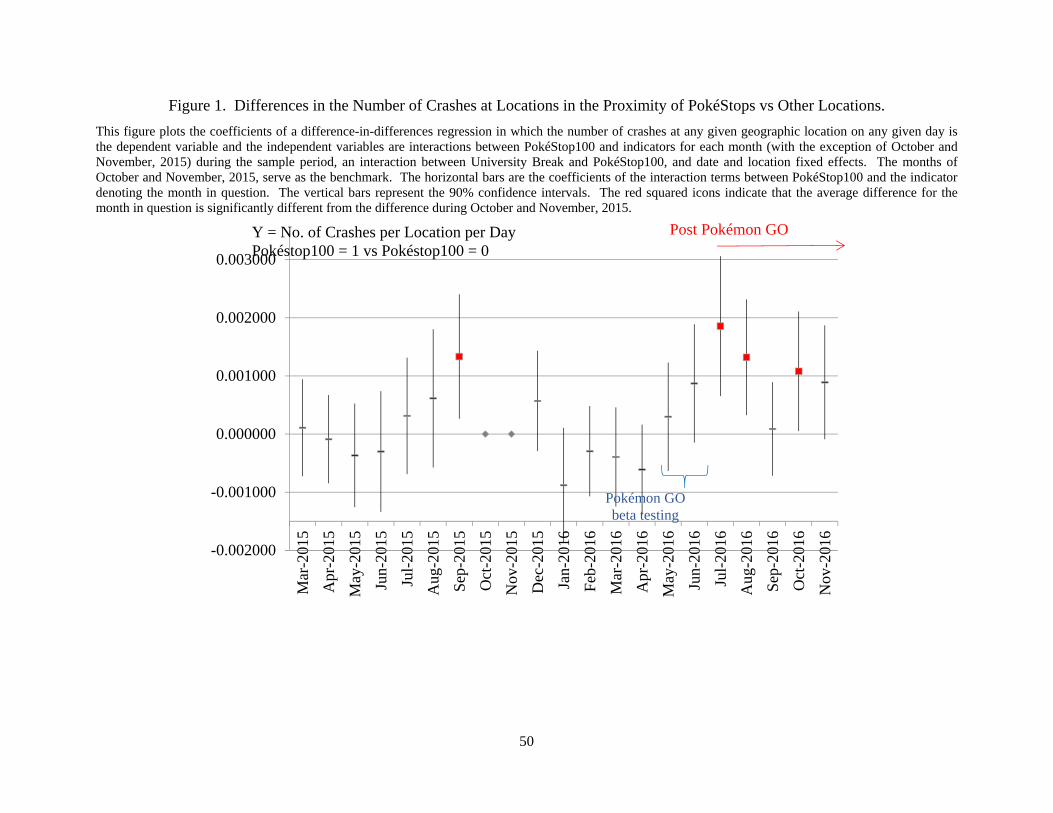
50
Figure 1. Differences in the Number of Crashes at Locations in the Proximity of PokéStops vs Other Locations.
This figure plots the coefficients of a difference-in-differences regression in which the number of crashes at any given geographic location on any given day is the dependent variable and the independent variables are interactions between PokéStop100 and indicators for each month (with the exception of October and November, 2015) during the sample period, an interaction between University Break and PokéStop100, and date and location fixed effects. The months of October and November, 2015, serve as the benchmark. The horizontal bars are the coefficients of the interaction terms between PokéStop100 and the indicator denoting the month in question. The vertical bars represent the 90% confidence intervals. The red squared icons indicate that the average difference for the month in question is significantly different from the difference during October and November, 2015.
-0.002000
-0.001000
0.000000
0.001000
0.002000
0.003000
Mar
-201
5
Apr
-201
5
May
-201
5
Jun-
2015
Jul-
2015
Aug
-201
5
Sep
-201
5
Oct
-201
5
Nov
-201
5
Dec
-201
5
Jan-
2016
Feb
-201
6
Mar
-201
6
Apr
-201
6
May
-201
6
Jun-
2016
Jul-
2016
Aug
-201
6
Sep
-201
6
Oct
-201
6
Nov
-201
6
Y = No. of Crashes per Location per Day Pokéstop100 = 1 vs Pokéstop100 = 0
Post Pokémon GO
Pokémon GO beta testing
51
DEATH BY POKÉMON GO:
THE ECONOMIC AND HUMAN COST OF USING APPS WHILE DRIVING
Internet Appendix
This appendix presents additional robustness tests.
A.1. Alternative Interpretations: Traffic
In Section 5.1. we present two tests of the alternative hypothesis that the increase in
crashes is due to an increase in traffic as opposed to users playing Pokémon GO while driving.
In a third test of this alternative hypothesis that we present here, we estimate a regression similar
to the baseline regression in Table 2 (first column) except that we add an interaction variable to
account for the possibility that locations with a different number of crashes prior to the
introduction of Pokémon GO are differently affected by the introduction of the game. The
underlying premise is that the number of crashes prior to the introduction of the game is a proxy
for the level of traffic.19 If the alternative explanation is correct, the coefficient of the interaction
of No. of Crashes at Location L before Pokémon GO with Post would be statistically significant.
As shown in the first column of Table A1, it is not. Additionally, the key interaction of interest,
PokéStop100 x Post, is, as before, positive and statistically significant (p-value < 0.001). These
results are also inconsistent with the alternative explanation.
A.2. Alternative Interpretations: Passengers
Another possibility is that some crashes in the vicinity of PokéStops are attributable to
distraction associated with the game, but it is a passenger rather than the driver who is playing
19 Ideally, of course, we would use actual traffic levels. Unfortunately such data are not available.
52
the game. To rule out those cases, we omit from the sample observations in which the police
reports indicate that the vehicle of the driver causing the crash had more than one occupant. We
then re-estimate the baseline regression. The results are reported in the second column of Table
A1. The coefficient of PokéStop100 x Post is 0.00087 with a p-value of 0.001 implying that 120
of the 134 incremental crashes are certainly not due to a passenger playing the game (i.e.,
0.00087 incremental crashes per location per day x 930 locations x 148 days = 120 incremental
crashes).
A.3. Censoring of Locations: Analyses Based on Intersections
The units of analysis in the tests in the paper are the geographic locations that
experienced at least one crash during March 1, 2015, through November 30, 2016. We impose
no requirement as to whether the crashes occurred prior to or subsequent to the introduction of
Pokémon GO. The sample is nevertheless censored in that locations that did not experience
crashes are not included. Mathematically, there is an infinity of such locations, e.g., points in a
road.
In this section, we address the concern that such censoring may introduce a bias in our
estimation. We address this concern by identifying locations in an alternative way. Specifically,
we conduct the tests using street intersections in Tippecanoe County as the unit of analysis. We
identify 4,745 intersections from OpenStreetMap. Importantly, as we noted earlier, the majority
of these intersections experienced no crashes during the sample period.
Intersections are identified from OpenStreetMap
(https://www.openstreetmap.org/#map=14/40.4239/-86.8928) using a parsing program. The
boundaries of Tippecanoe County and the various cities’ limits are identified from
https://osm.wno-edv-service.de/boundaries. Each intersection is defined by the intersecting
53
street names, latitude and longitude. The parsing program identifies 4,745 intersections. We use
the street names and municipalities to merge the data. Of the 8,951 crashes that occurred at
intersections, we are able to match 85.22% with an intersection identified from the maps.
36.38% of the intersections experienced at least one crash and 63.62% of the intersections
experienced no crashes during the sample period.
The unit of observation is each intersection/date pair of which there are 3,041,545. We
use these data to address questions of whether the frequency and severity of crashes increased
disproportionately at intersections in the vicinity of PokéStops following the introduction of
Pokémon GO. At intersections in the vicinity of PokéStops, the number of crashes per day
increased from 0.005989 before to 0.007667 after the introduction of the game. In comparison,
at intersections that are not in the vicinity of PokéStops, the number of crashes per day increased
from 0.002015 to 0.002155.
Table A2 presents the results of regression analyses of the number and severity of crashes
using the intersection/day pair as the unit of analysis. The coefficients of the key interaction
term PokéStop100 x Post are positive in all four regressions and are statistically significant in
three of the four with p-values of 0.002, 0.032, 0.054, and 0.180, respectively. Furthermore,
contrary to the concern that the coefficients in the regressions based on geographic locations are
inflated due to censoring of locations, in all four regressions reported in Table A2, the
coefficients are larger than their equivalents in Tables 2 and 4.
These results are consistent with our prior findings and with our interpretation that the
significant increase in crashes in the vicinity of PokéStops is due to Pokémon GO participants
playing the game while driving.
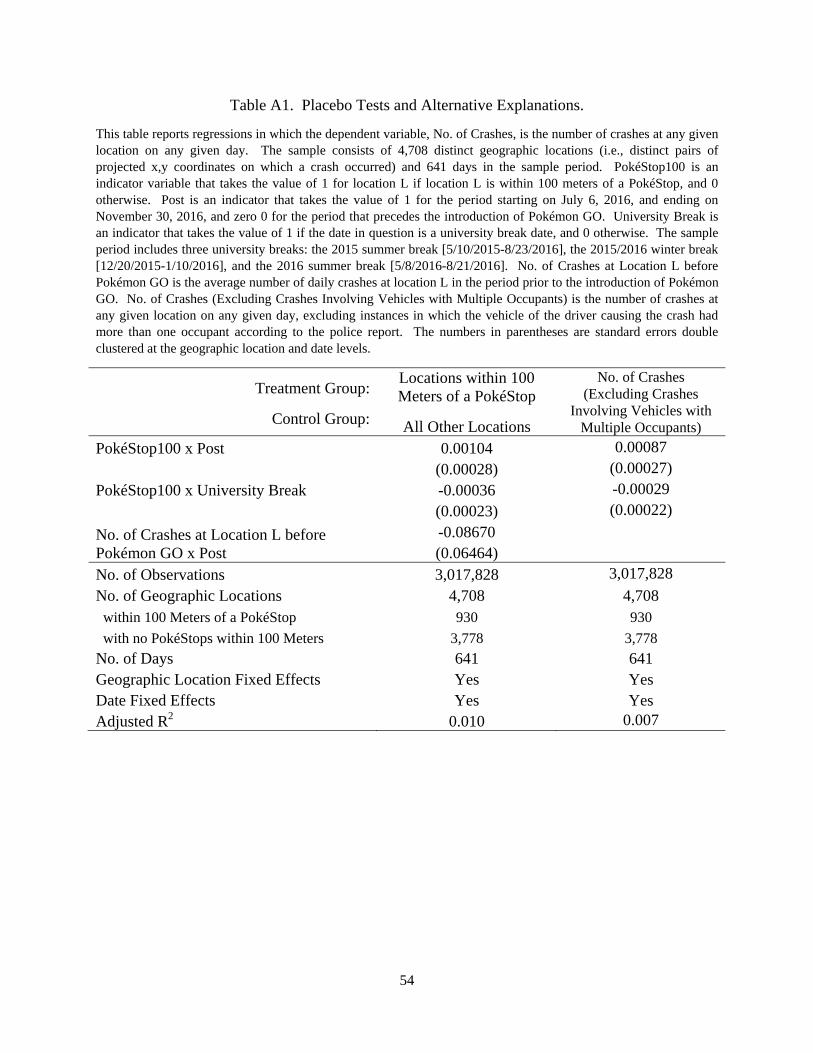
54
Table A1. Placebo Tests and Alternative Explanations.
This table reports regressions in which the dependent variable, No. of Crashes, is the number of crashes at any given location on any given day. The sample consists of 4,708 distinct geographic locations (i.e., distinct pairs of projected x,y coordinates on which a crash occurred) and 641 days in the sample period. PokéStop100 is an indicator variable that takes the value of 1 for location L if location L is within 100 meters of a PokéStop, and 0 otherwise. Post is an indicator that takes the value of 1 for the period starting on July 6, 2016, and ending on November 30, 2016, and zero 0 for the period that precedes the introduction of Pokémon GO. University Break is an indicator that takes the value of 1 if the date in question is a university break date, and 0 otherwise. The sample period includes three university breaks: the 2015 summer break [5/10/2015-8/23/2016], the 2015/2016 winter break [12/20/2015-1/10/2016], and the 2016 summer break [5/8/2016-8/21/2016]. No. of Crashes at Location L before Pokémon GO is the average number of daily crashes at location L in the period prior to the introduction of Pokémon GO. No. of Crashes (Excluding Crashes Involving Vehicles with Multiple Occupants) is the number of crashes at any given location on any given day, excluding instances in which the vehicle of the driver causing the crash had more than one occupant according to the police report. The numbers in parentheses are standard errors double clustered at the geographic location and date levels.
Treatment Group:Locations within 100 Meters of a PokéStop
No. of Crashes (Excluding Crashes
Involving Vehicles with Multiple Occupants)
Control Group: All Other Locations PokéStop100 x Post 0.00104 0.00087
(0.00028) (0.00027)
PokéStop100 x University Break -0.00036 -0.00029
(0.00023) (0.00022)
No. of Crashes at Location L before Pokémon GO x Post
-0.08670
(0.06464)
No. of Observations 3,017,828 3,017,828
No. of Geographic Locations 4,708 4,708 within 100 Meters of a PokéStop 930 930
with no PokéStops within 100 Meters 3,778 3,778
No. of Days 641 641 Geographic Location Fixed Effects Yes Yes Date Fixed Effects Yes Yes Adjusted R2 0.010 0.007
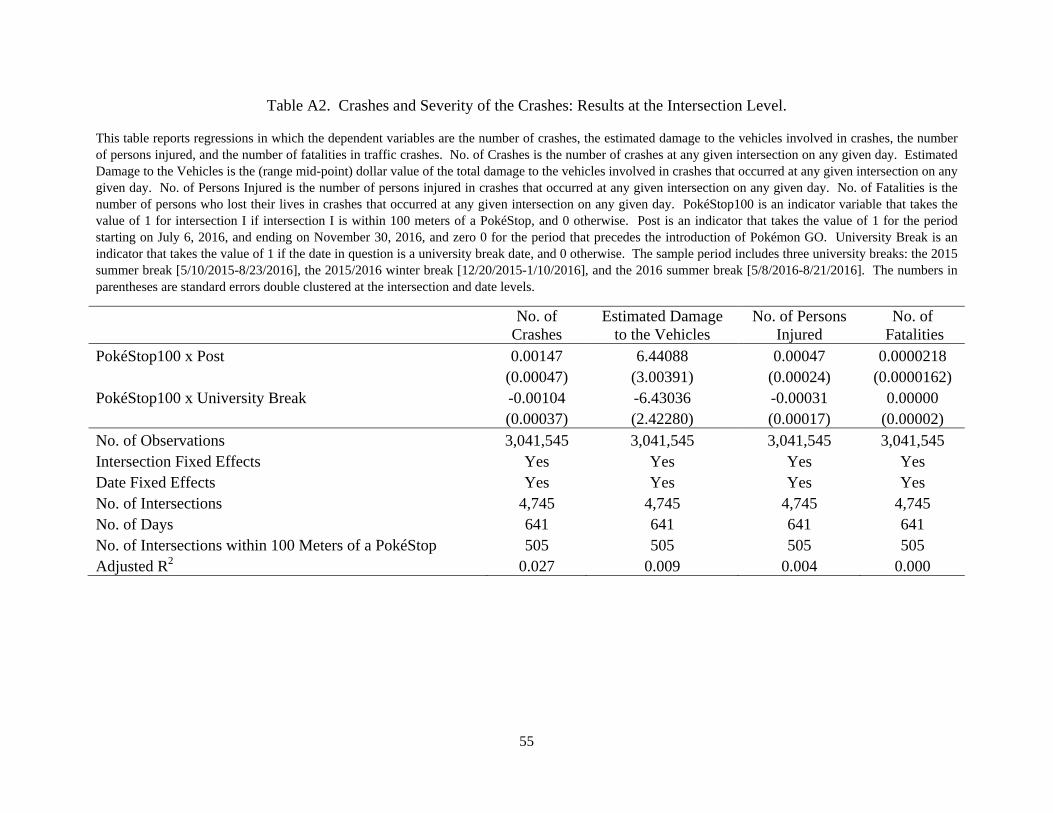
55
Table A2. Crashes and Severity of the Crashes: Results at the Intersection Level.
This table reports regressions in which the dependent variables are the number of crashes, the estimated damage to the vehicles involved in crashes, the number of persons injured, and the number of fatalities in traffic crashes. No. of Crashes is the number of crashes at any given intersection on any given day. Estimated Damage to the Vehicles is the (range mid-point) dollar value of the total damage to the vehicles involved in crashes that occurred at any given intersection on any given day. No. of Persons Injured is the number of persons injured in crashes that occurred at any given intersection on any given day. No. of Fatalities is the number of persons who lost their lives in crashes that occurred at any given intersection on any given day. PokéStop100 is an indicator variable that takes the value of 1 for intersection I if intersection I is within 100 meters of a PokéStop, and 0 otherwise. Post is an indicator that takes the value of 1 for the period starting on July 6, 2016, and ending on November 30, 2016, and zero 0 for the period that precedes the introduction of Pokémon GO. University Break is an indicator that takes the value of 1 if the date in question is a university break date, and 0 otherwise. The sample period includes three university breaks: the 2015 summer break [5/10/2015-8/23/2016], the 2015/2016 winter break [12/20/2015-1/10/2016], and the 2016 summer break [5/8/2016-8/21/2016]. The numbers in parentheses are standard errors double clustered at the intersection and date levels.
No. of
Crashes Estimated Damage
to the Vehicles No. of Persons
Injured No. of
Fatalities PokéStop100 x Post 0.00147 6.44088 0.00047 0.0000218
(0.00047) (3.00391) (0.00024) (0.0000162) PokéStop100 x University Break -0.00104 -6.43036 -0.00031 0.00000
(0.00037) (2.42280) (0.00017) (0.00002) No. of Observations 3,041,545 3,041,545 3,041,545 3,041,545 Intersection Fixed Effects Yes Yes Yes Yes Date Fixed Effects Yes Yes Yes Yes No. of Intersections 4,745 4,745 4,745 4,745 No. of Days 641 641 641 641 No. of Intersections within 100 Meters of a PokéStop 505 505 505 505 Adjusted R2 0.027 0.009 0.004 0.000


![TM u samplel Pokémon GO PIUS x x Pokémon GO Pokémon … · TM u samplel Pokémon GO PIUS x x Pokémon GO Pokémon GO (CR2032ÆJf'FEdÆ) 35 m h, Go rPokémon GO Plus] OS 3DS Wii](https://img.pdfslide.us/doc/110x75/5bffaeb309d3f2641b8c5a80/tm-u-samplel-pokemon-go-pius-x-x-pokemon-go-pokemon-tm-u-samplel-pokemon.jpg)