Embed Size (px)
Citation preview
GENERAL–AnalysisofReportNo.GRI–00/0189on“AModelforSizingHighConsequenceAreasAssociatedwithNaturalGasPipelines” Page1
DEATECH Consulting Company 203 Sarasota Circle South Montgomery, TX 77356-8418 PHONE 1-936-449-6937 FAX 1-936-449-5317 October 16, 2008 Ref: Analysis of Report No. GRI – 00/0189 on “A Model for Sizing High Consequence Areas Associated with Natural Gas Pipelines” To: File From: R. D. Deaver Introduction The subject report was prepared by C-FER Technologies (C-FT) in Edmonton, Alberta, Canada for the Gas Research Institute. The report was dated October 2000 and the report’s recommended equation for determining potential impact radius (PIR) of a natural gas pipeline rupture is included in 49 CFR 192.903. This PIR equation is given as:
( )5.0
269.0 Pdr = (1)
where: r = PIR, ft.; P = pipeline pressure, psig; and d = pipeline diameter, in. The above equation is also included in ASME B31.8S and is given for any gas as follows:
GENERAL–AnalysisofReportNo.GRI–00/0189on“AModelforSizingHighConsequenceAreasAssociatedwithNaturalGasPipelines” Page2
5.0
2
8
920,115
!!"
#$$%
&=
I
pdFHCFer
s
fcdd'
µ (2)
where: µ = combustion efficiency factor; e = emissivity factor; Fd = release rate decay factor; Cd = discharge coefficient; Hc = heat of combustion; Ff = flow factor; � s = speed of sound in gas; I = heat flux; p = pipeline pressure, psi; and d = pipe diameter, in.
( )!
!"
#$$%
&
'
+
!!"
#$$%
&
+=
12
1
1
2 k
k
fk
kF (3)
where: k = ratio of specific heats. The velocity of sound in the gas is given by C-FT as:
5.0
!!"
#$$%
&=
m
TRk
s' (4)
GENERAL–AnalysisofReportNo.GRI–00/0189on“AModelforSizingHighConsequenceAreasAssociatedwithNaturalGasPipelines” Page3
where: R = gas constant, T = gas temperature, and m = gas mole weight. Unfortunately, ASME B31.8S does include all the units in the equations, but it appears that English units are used. The recommended values of Hc, Fd, Ff, e, and µ are not given. If the recommended values for the PIR equation in the C-FT report and English units are used, the calculated PIR, r, using the ASME B31.8S equation for the example of 24 inch pipe at 1000 psi:
.4.520
145050008
241000764.0500,2162.033.02.035.0920,1155.0
2
ftr
xx
xxxxxxxxr
=
!!"
#$$%
&=
The above calculation is close to the calculated PIR of 524 ft. determined from equation (1), therefore, the B31.8S equation (2) requires the use of English units. Bases for PIR Equation A radiation heat intensity of 5000 BTU/ft.2-hr. was used as I for the C-FT PIR equation, based on the following stated criteria:
1. One percent change of mortality for a person with 30 seconds of exposure to find a shelter.
2. Requires 1162 seconds (about 20 minutes) of exposure for wood shelter to ignite with piloted (spark) ignition.
GENERAL–AnalysisofReportNo.GRI–00/0189on“AModelforSizingHighConsequenceAreasAssociatedwithNaturalGasPipelines” Page4
The C-FT PIR model assumes that a person would take five (5) seconds after a fire to analyze the situation and run for 25 seconds at 2.5 m/s and find shelter. The PIR equation used a gas flow rate decay release factor (Fd) of 0.33 even though the report indicates the Fd may be as high as 0.5. This indicates that the PIR is not based on the initial flow rate when the pipeline ruptured, but a flow rate at some extended time after the rupture. This time period is not included in the calculations and will vary with different pipelines. The discharge coefficient in the PIR equation is for an orifice meter type of discharge to indicate the restricted flow pattern downstream of a restricted opening. With a severed pipeline, you don’t have a restricted hole. The PIR equation should not have used an orifice meter equation and a discharge coefficient of 0.62. The PIR equation also contains the flow factor, Ff, defined earlier as equation (3). For a value of k = 1.306 for methane, as given in the report, the value of Ff is:
612.0
306.2
306.2
2306.1 !
"
#$%
&=fF
764.05848.0306.1 == xFf The speed of sound, � s, is calculated for methane at 15°C (59°F), the temperature used for PIR, with equation (4) as follows:
5.0
16
2888310306.1
!!"
#$$%
&=
xx
s'
.sec.1450.sec440 perftpermeterss ==! The Crane Technical Paper No. 410 (Crane 410) indicates that � s can also be determined for methane at 15°C (59°F) and 1000 psig as follows:
GENERAL–AnalysisofReportNo.GRI–00/0189on“AModelforSizingHighConsequenceAreasAssociatedwithNaturalGasPipelines” Page5
5.0
1.68 !!"
#$$%
&=
'( as
pk (5)
where: pa = gas pressure, psia and ρ = gas density at given pressure, lbs. per ft.3
.sec.135535.3
7.1014306.11.68
5.0
perftx
s =!!"
#$$%
&='
At 90°F and 1000 psig, the speed of sound in methane is:
.sec.1402125.3
7.1014306.11.68
5.0
perftx
s =!!"
#$$%
&='
For methane at 59°F and 14.7 psia, the density is 0.04228 pcf and the speed of sound using equation (5) is:
.1450
04228.0
7.14306.11.68
5.0
fps
x
s
s
=
!!"
#$$%
&=
'
'
Equation (4) used in the PIR is for low pressure gas without the effect of pressure. Equation (5) appears to be more appropriate for high pressure gas. A temperature of 59°F is low for a gas transmission line, because significant compression heat is added at each compression station. A temperature range of 80°F to 140°F is more appropriate for gas pipelines depending on the proximity to compression facilities and geographic location. Natural gas is not pure methane, but is usually a mixture of 95 to 99% methane with ethane and heavier fluids. The effective k is often taken as 1.4 and the effective molecular weight is higher than 16. The mole weight of
GENERAL–AnalysisofReportNo.GRI–00/0189on“AModelforSizingHighConsequenceAreasAssociatedwithNaturalGasPipelines” Page6
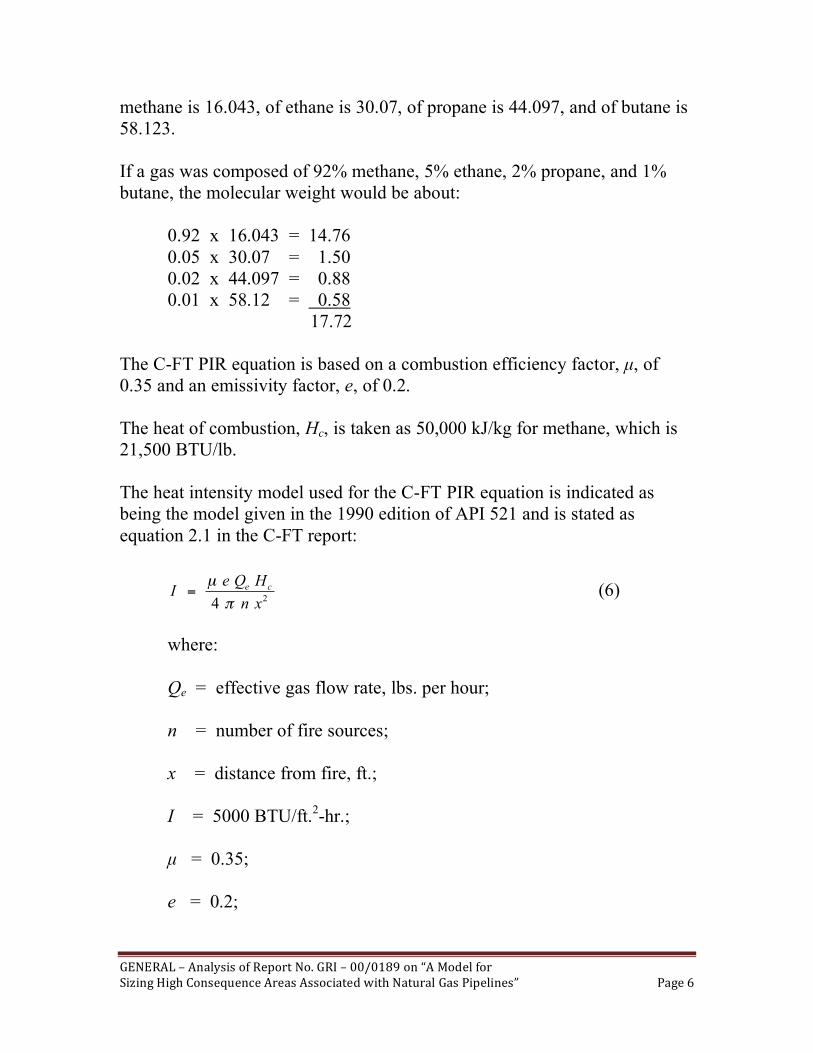
methane is 16.043, of ethane is 30.07, of propane is 44.097, and of butane is 58.123. If a gas was composed of 92% methane, 5% ethane, 2% propane, and 1% butane, the molecular weight would be about: 0.92 x 16.043 = 14.76 0.05 x 30.07 = 1.50 0.02 x 44.097 = 0.88 0.01 x 58.12 = 0.58 17.72 The C-FT PIR equation is based on a combustion efficiency factor, µ, of 0.35 and an emissivity factor, e, of 0.2. The heat of combustion, Hc, is taken as 50,000 kJ/kg for methane, which is 21,500 BTU/lb. The heat intensity model used for the C-FT PIR equation is indicated as being the model given in the 1990 edition of API 521 and is stated as equation 2.1 in the C-FT report:
2
4 xn
HQeI ce
!
µ= (6)
where: Qe = effective gas flow rate, lbs. per hour; n = number of fire sources; x = distance from fire, ft.; I = 5000 BTU/ft.2-hr.; µ = 0.35; e = 0.2;
GENERAL–AnalysisofReportNo.GRI–00/0189on“AModelforSizingHighConsequenceAreasAssociatedwithNaturalGasPipelines” Page7
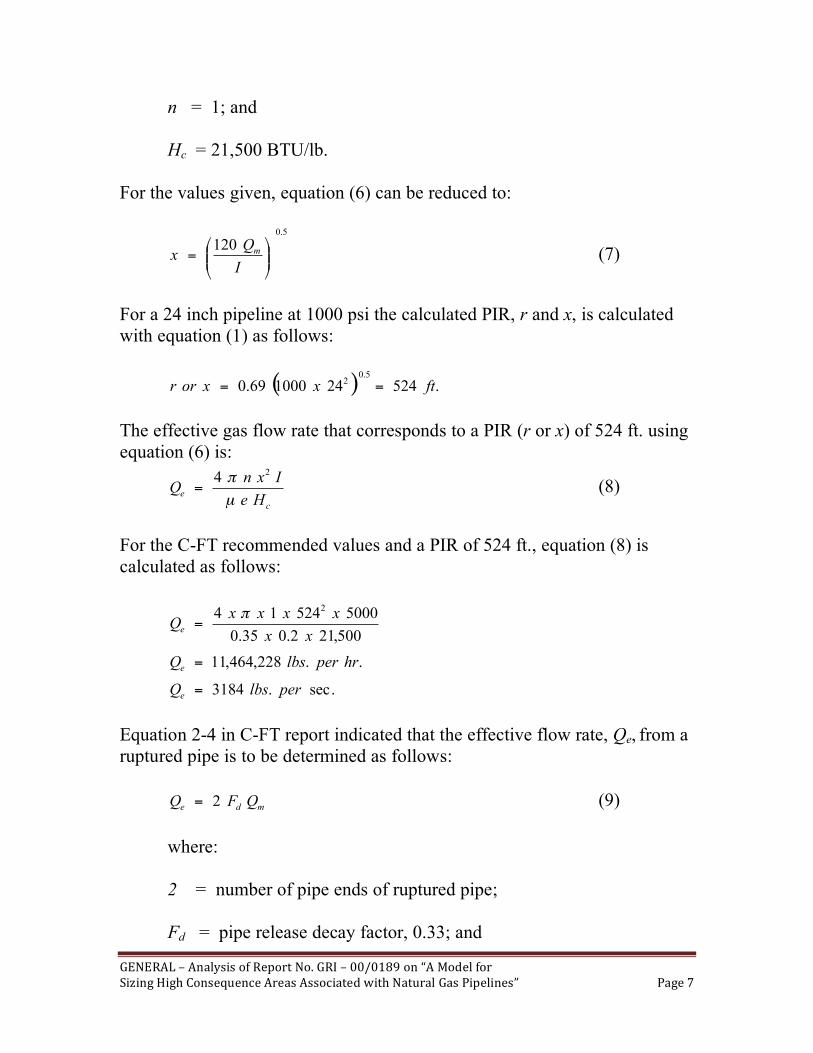
n = 1; and Hc = 21,500 BTU/lb. For the values given, equation (6) can be reduced to:
5.0
120
!!"
#$$%
&=
I
Qx m (7)
For a 24 inch pipeline at 1000 psi the calculated PIR, r and x, is calculated with equation (1) as follows: ( ) .52424100069.0
5.02 ftxxorr ==
The effective gas flow rate that corresponds to a PIR (r or x) of 524 ft. using equation (6) is:
c
eHe
IxnQ
µ
! 24
= (8)
For the C-FT recommended values and a PIR of 524 ft., equation (8) is calculated as follows:
.sec.3184
..228,464,11
500,212.035.0
5000524142
perlbsQ
hrperlbsQ
xx
xxxxQ
e
e
e
=
=
=!
Equation 2-4 in C-FT report indicated that the effective flow rate, Qe, from a ruptured pipe is to be determined as follows: mde QFQ 2= (9) where: 2 = number of pipe ends of ruptured pipe; Fd = pipe release decay factor, 0.33; and
GENERAL–AnalysisofReportNo.GRI–00/0189on“AModelforSizingHighConsequenceAreasAssociatedwithNaturalGasPipelines” Page8
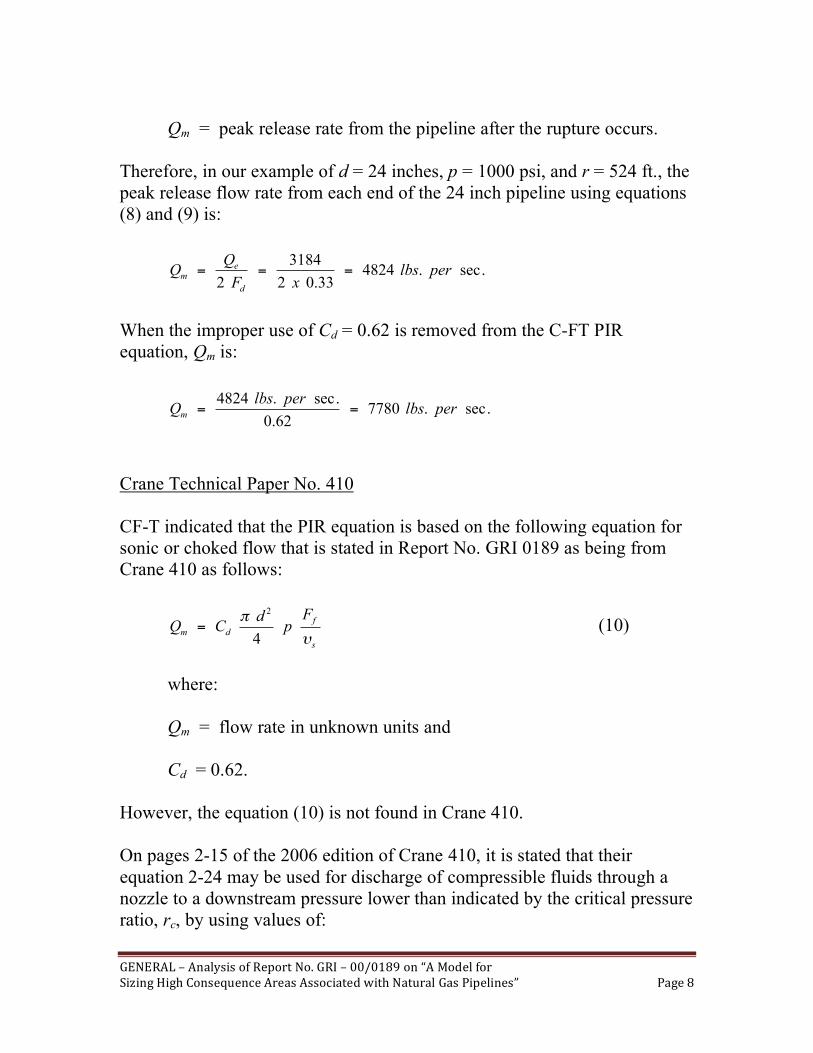
Qm = peak release rate from the pipeline after the rupture occurs. Therefore, in our example of d = 24 inches, p = 1000 psi, and r = 524 ft., the peak release flow rate from each end of the 24 inch pipeline using equations (8) and (9) is:
.sec.482433.02
3184
2perlbs
xF
d
em ===
When the improper use of Cd = 0.62 is removed from the C-FT PIR equation, Qm is:
.sec.778062.0
.sec.4824perlbs
perlbsQm ==
Crane Technical Paper No. 410 CF-T indicated that the PIR equation is based on the following equation for sonic or choked flow that is stated in Report No. GRI 0189 as being from Crane 410 as follows:
s
f
dm
Fp
dCQ
!
"
4
2
= (10)
where: Qm = flow rate in unknown units and Cd = 0.62. However, the equation (10) is not found in Crane 410. On pages 2-15 of the 2006 edition of Crane 410, it is stated that their equation 2-24 may be used for discharge of compressible fluids through a nozzle to a downstream pressure lower than indicated by the critical pressure ratio, rc, by using values of:
GENERAL–AnalysisofReportNo.GRI–00/0189on“AModelforSizingHighConsequenceAreasAssociatedwithNaturalGasPipelines” Page9
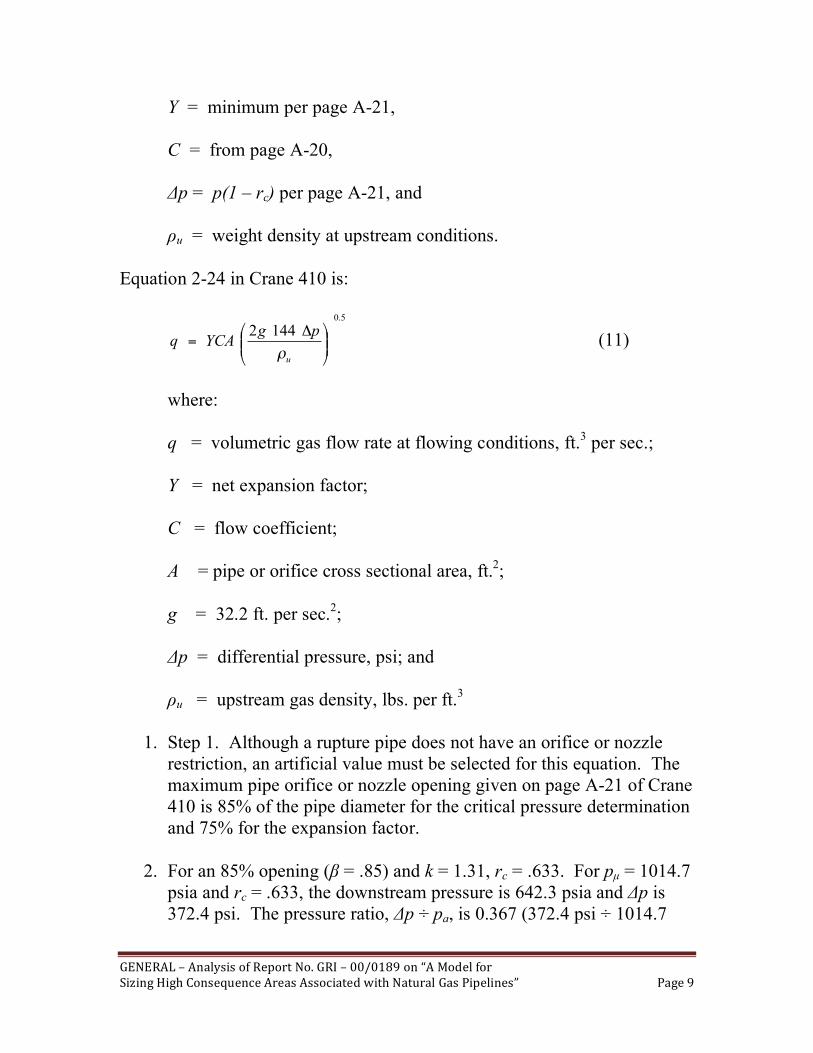
Y = minimum per page A-21, C = from page A-20, Δp = p(1 – rc) per page A-21, and ρu = weight density at upstream conditions. Equation 2-24 in Crane 410 is:
5.0
1442
!!"
#$$%
& '=
u
pgYCAq
( (11)
where: q = volumetric gas flow rate at flowing conditions, ft.3 per sec.; Y = net expansion factor; C = flow coefficient; A = pipe or orifice cross sectional area, ft.2; g = 32.2 ft. per sec.2; Δp = differential pressure, psi; and ρu = upstream gas density, lbs. per ft.3
1. Step 1. Although a rupture pipe does not have an orifice or nozzle restriction, an artificial value must be selected for this equation. The maximum pipe orifice or nozzle opening given on page A-21 of Crane 410 is 85% of the pipe diameter for the critical pressure determination and 75% for the expansion factor.
2. For an 85% opening (β = .85) and k = 1.31, rc = .633. For pµ = 1014.7 psia and rc = .633, the downstream pressure is 642.3 psia and Δp is 372.4 psi. The pressure ratio, Δp ÷ pa, is 0.367 (372.4 psi ÷ 1014.7
GENERAL–AnalysisofReportNo.GRI–00/0189on“AModelforSizingHighConsequenceAreasAssociatedwithNaturalGasPipelines” Page10
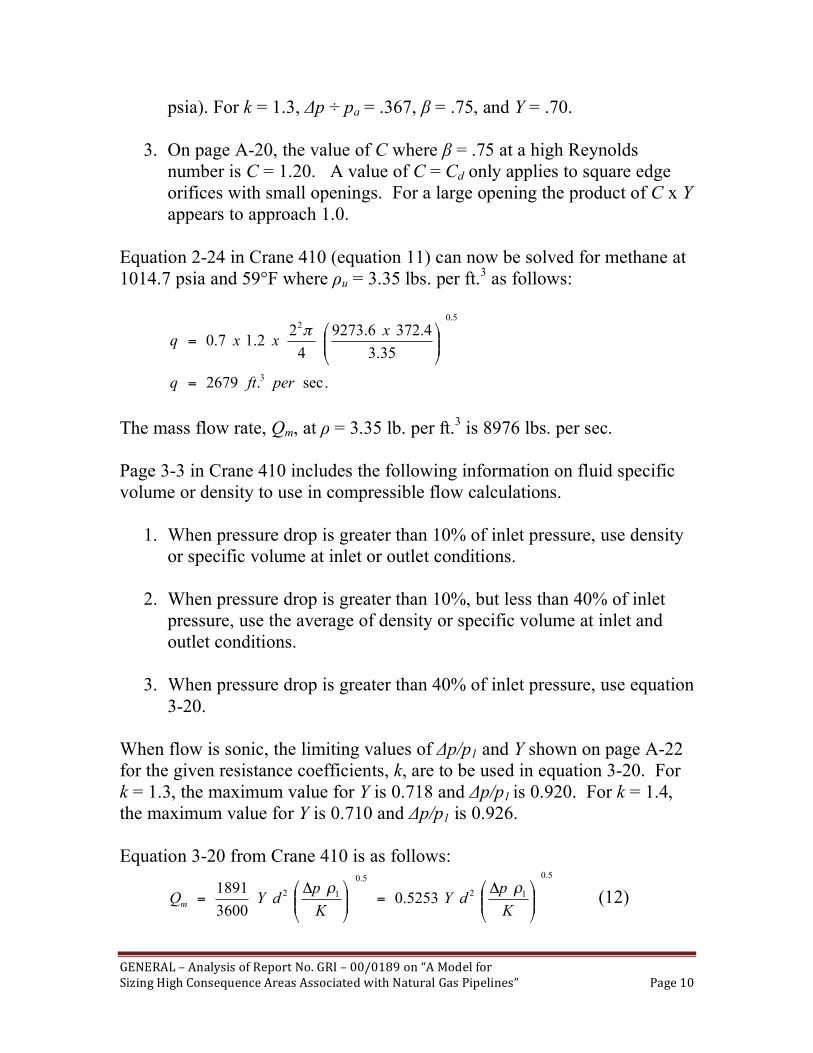
psia). For k = 1.3, Δp ÷ pa = .367, β = .75, and Y = .70.
3. On page A-20, the value of C where β = .75 at a high Reynolds number is C = 1.20. A value of C = Cd only applies to square edge orifices with small openings. For a large opening the product of C x Y appears to approach 1.0.
Equation 2-24 in Crane 410 (equation 11) can now be solved for methane at 1014.7 psia and 59°F where ρu = 3.35 lbs. per ft.3 as follows:
.sec.2679
35.3
4.3726.9273
4
22.17.0
3
5.02
perftq
xxxq
=
!!"
#$$%
&=
'
The mass flow rate, Qm, at ρ = 3.35 lb. per ft.3 is 8976 lbs. per sec. Page 3-3 in Crane 410 includes the following information on fluid specific volume or density to use in compressible flow calculations.
1. When pressure drop is greater than 10% of inlet pressure, use density or specific volume at inlet or outlet conditions.
2. When pressure drop is greater than 10%, but less than 40% of inlet pressure, use the average of density or specific volume at inlet and outlet conditions.
3. When pressure drop is greater than 40% of inlet pressure, use equation 3-20.
When flow is sonic, the limiting values of Δp/p1 and Y shown on page A-22 for the given resistance coefficients, k, are to be used in equation 3-20. For k = 1.3, the maximum value for Y is 0.718 and Δp/p1 is 0.920. For k = 1.4, the maximum value for Y is 0.710 and Δp/p1 is 0.926. Equation 3-20 from Crane 410 is as follows:
5.0
12
5.0
125253.0
3600
1891
!!"
#$$%
& '=!!
"
#$$%
& '=
K
pdY
K
pdYQm
(( (12)
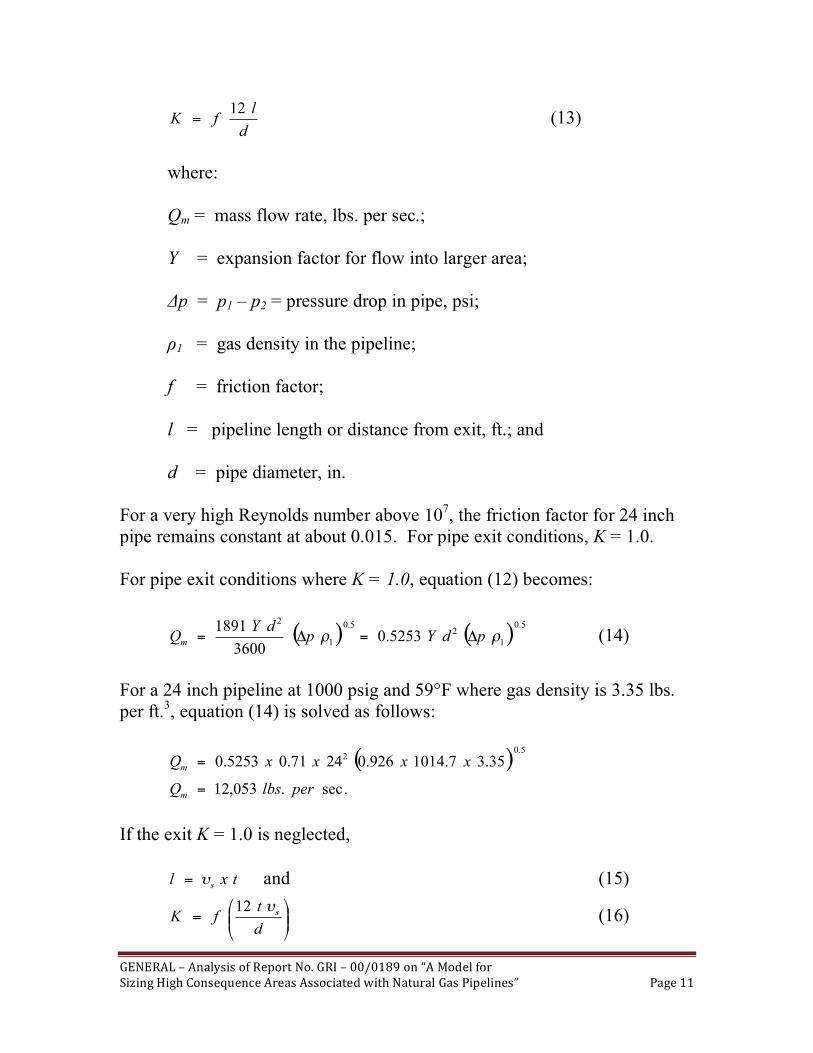
GENERAL–AnalysisofReportNo.GRI–00/0189on“AModelforSizingHighConsequenceAreasAssociatedwithNaturalGasPipelines” Page11
d
lfK12
= (13)
where: Qm = mass flow rate, lbs. per sec.;
Y = expansion factor for flow into larger area; Δp = p1 – p2 = pressure drop in pipe, psi; ρ1 = gas density in the pipeline; f = friction factor; l = pipeline length or distance from exit, ft.; and d = pipe diameter, in. For a very high Reynolds number above 107, the friction factor for 24 inch pipe remains constant at about 0.015. For pipe exit conditions, K = 1.0. For pipe exit conditions where K = 1.0, equation (12) becomes:
( ) ( )5.0
1
25.0
1
2
5253.03600
1891!! pdYp
dYQm "="= (14)
For a 24 inch pipeline at 1000 psig and 59°F where gas density is 3.35 lbs. per ft.3, equation (14) is solved as follows:
( ).sec.053,12
35.37.1014926.02471.05253.05.0
2
perlbsQ
xxxxQ
m
m
=
=
If the exit K = 1.0 is neglected, txl
s!= and (15)
!!"
#$$%
&=
d
tfK s'12 (16)
GENERAL–AnalysisofReportNo.GRI–00/0189on“AModelforSizingHighConsequenceAreasAssociatedwithNaturalGasPipelines” Page12
where:
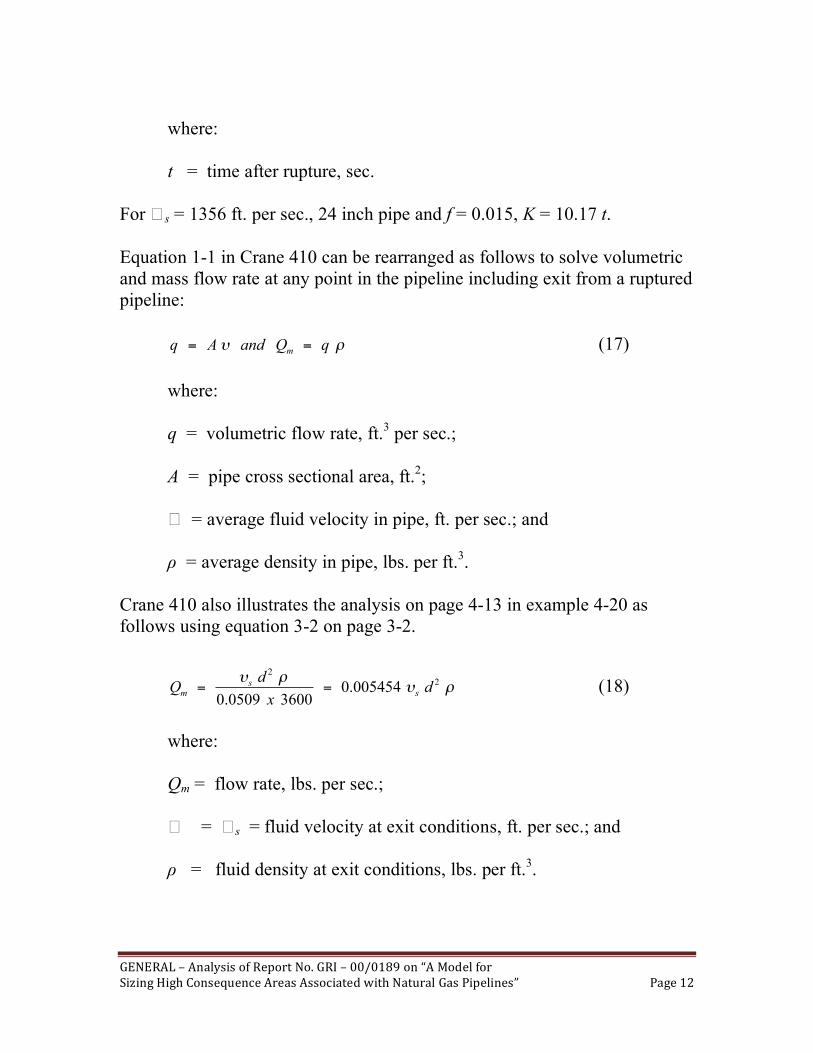
t = time after rupture, sec. For � s = 1356 ft. per sec., 24 inch pipe and f = 0.015, K = 10.17 t. Equation 1-1 in Crane 410 can be rearranged as follows to solve volumetric and mass flow rate at any point in the pipeline including exit from a ruptured pipeline: !" qQandAq m == (17) where: q = volumetric flow rate, ft.3 per sec.; A = pipe cross sectional area, ft.2; � = average fluid velocity in pipe, ft. per sec.; and ρ = average density in pipe, lbs. per ft.3. Crane 410 also illustrates the analysis on page 4-13 in example 4-20 as follows using equation 3-2 on page 3-2.
!"!" 2
2
005454.036000509.0
dx
dQ s
sm == (18)
where: Qm = flow rate, lbs. per sec.; � = � s = fluid velocity at exit conditions, ft. per sec.; and ρ = fluid density at exit conditions, lbs. per ft.3.
GENERAL–AnalysisofReportNo.GRI–00/0189on“AModelforSizingHighConsequenceAreasAssociatedwithNaturalGasPipelines” Page13
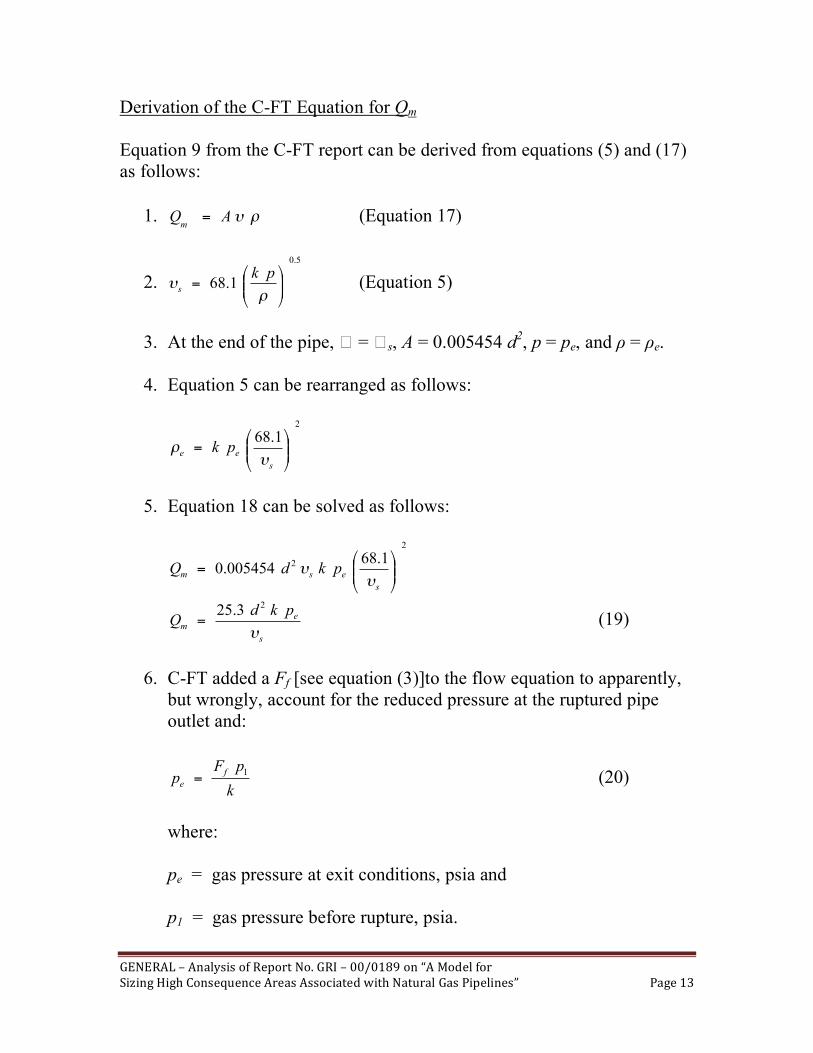
Derivation of the C-FT Equation for Qm Equation 9 from the C-FT report can be derived from equations (5) and (17) as follows:
1. !"AQm
= (Equation 17)
2. 5.0
1.68 !!"
#$$%
&=
'(
pks (Equation 5)
3. At the end of the pipe, � = � s, A = 0.005454 d2, p = pe, and ρ = ρe.
4. Equation 5 can be rearranged as follows:
2
1.68
!!"
#$$%
&=
s
ee pk'
(
5. Equation 18 can be solved as follows:
2
2 1.68005454.0 !!
"
#$$%
&=
s
esm pkdQ'
'
s
em
pkdQ
!
23.25
= (19)
6. C-FT added a Ff [see equation (3)]to the flow equation to apparently,
but wrongly, account for the reduced pressure at the ruptured pipe outlet and:
k
pFp
f
e
1
= (20)
where: pe = gas pressure at exit conditions, psia and p1 = gas pressure before rupture, psia.
GENERAL–AnalysisofReportNo.GRI–00/0189on“AModelforSizingHighConsequenceAreasAssociatedwithNaturalGasPipelines” Page14
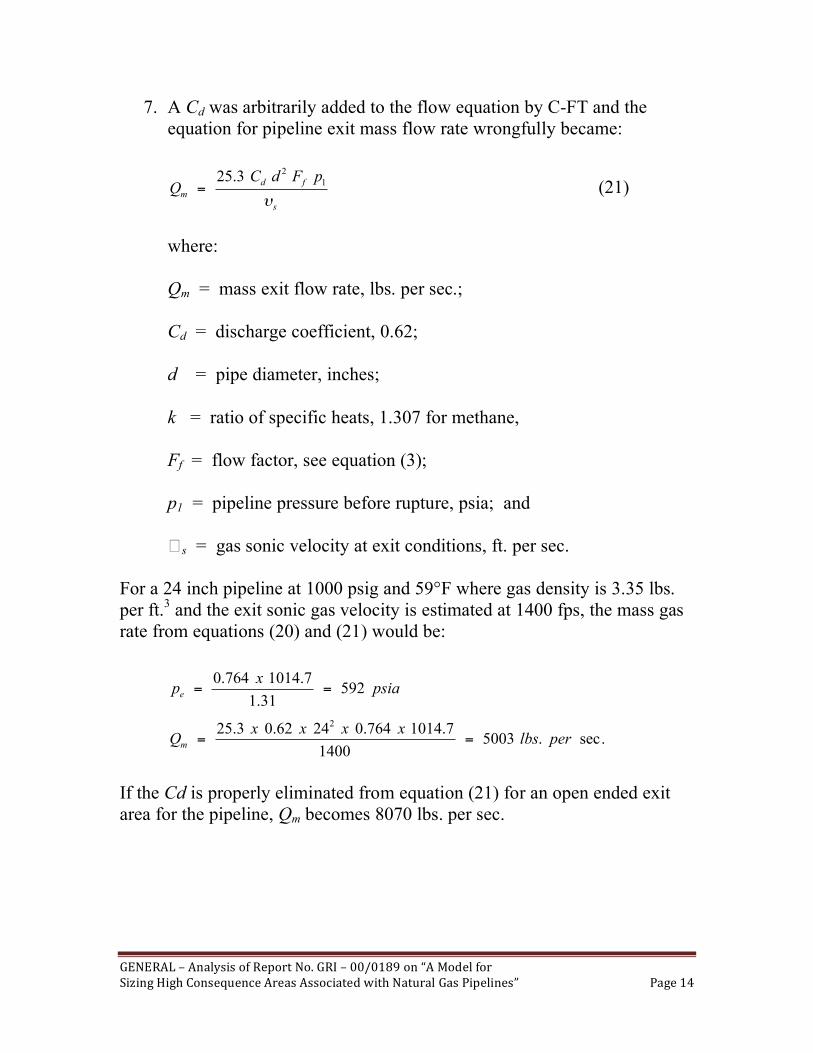
7. A Cd was arbitrarily added to the flow equation by C-FT and the equation for pipeline exit mass flow rate wrongfully became:
s
fd
m
pFdCQ
!
1
23.25
= (21)
where: Qm = mass exit flow rate, lbs. per sec.; Cd = discharge coefficient, 0.62; d = pipe diameter, inches; k = ratio of specific heats, 1.307 for methane, Ff = flow factor, see equation (3); p1 = pipeline pressure before rupture, psia; and � s = gas sonic velocity at exit conditions, ft. per sec.
For a 24 inch pipeline at 1000 psig and 59°F where gas density is 3.35 lbs. per ft.3 and the exit sonic gas velocity is estimated at 1400 fps, the mass gas rate from equations (20) and (21) would be:
psiax
pe
59231.1
7.1014764.0==
.sec.50031400
7.1014764.02462.03.252
perlbsxxxx
Qm ==
If the Cd is properly eliminated from equation (21) for an open ended exit area for the pipeline, Qm becomes 8070 lbs. per sec.
GENERAL–AnalysisofReportNo.GRI–00/0189on“AModelforSizingHighConsequenceAreasAssociatedwithNaturalGasPipelines” Page15
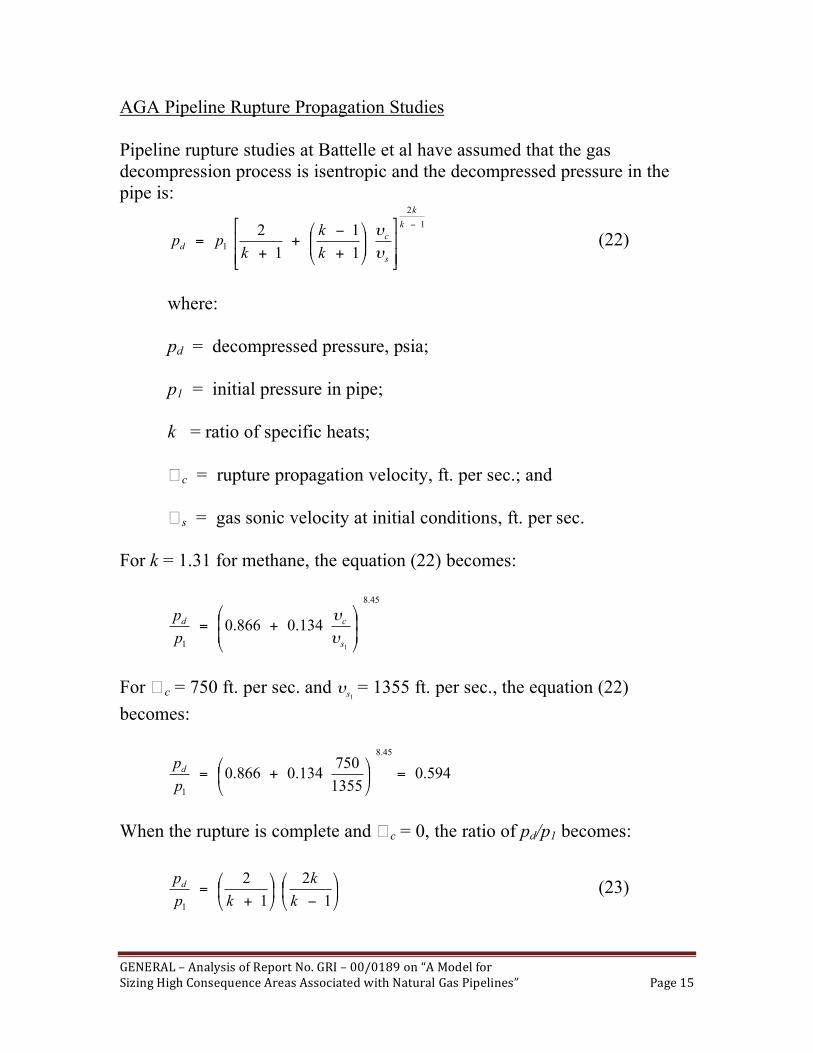
AGA Pipeline Rupture Propagation Studies Pipeline rupture studies at Battelle et al have assumed that the gas decompression process is isentropic and the decompressed pressure in the pipe is:
1
2
1
1
1
1
2!
""
#
$
%%
&
'
(()
*++,
-
+
!+
+=
k
k
s
cd
k
k
kpp
.
. (22)
where: pd = decompressed pressure, psia; p1 = initial pressure in pipe; k = ratio of specific heats; � c = rupture propagation velocity, ft. per sec.; and � s = gas sonic velocity at initial conditions, ft. per sec. For k = 1.31 for methane, the equation (22) becomes:
45.8
11
134.0866.0!!
"
#
$$
%
&+=
s
cd
p
p
'
'
For � c = 750 ft. per sec. and
1s
! = 1355 ft. per sec., the equation (22) becomes:
594.01355
750134.0866.0
45.8
1
=!"
#$%
&+=
p
pd
When the rupture is complete and � c = 0, the ratio of pd/p1 becomes:
!"
#$%
&
'!"
#$%
&
+=
1
2
1
2
1k
k
kp
pd (23)
GENERAL–AnalysisofReportNo.GRI–00/0189on“AModelforSizingHighConsequenceAreasAssociatedwithNaturalGasPipelines” Page16
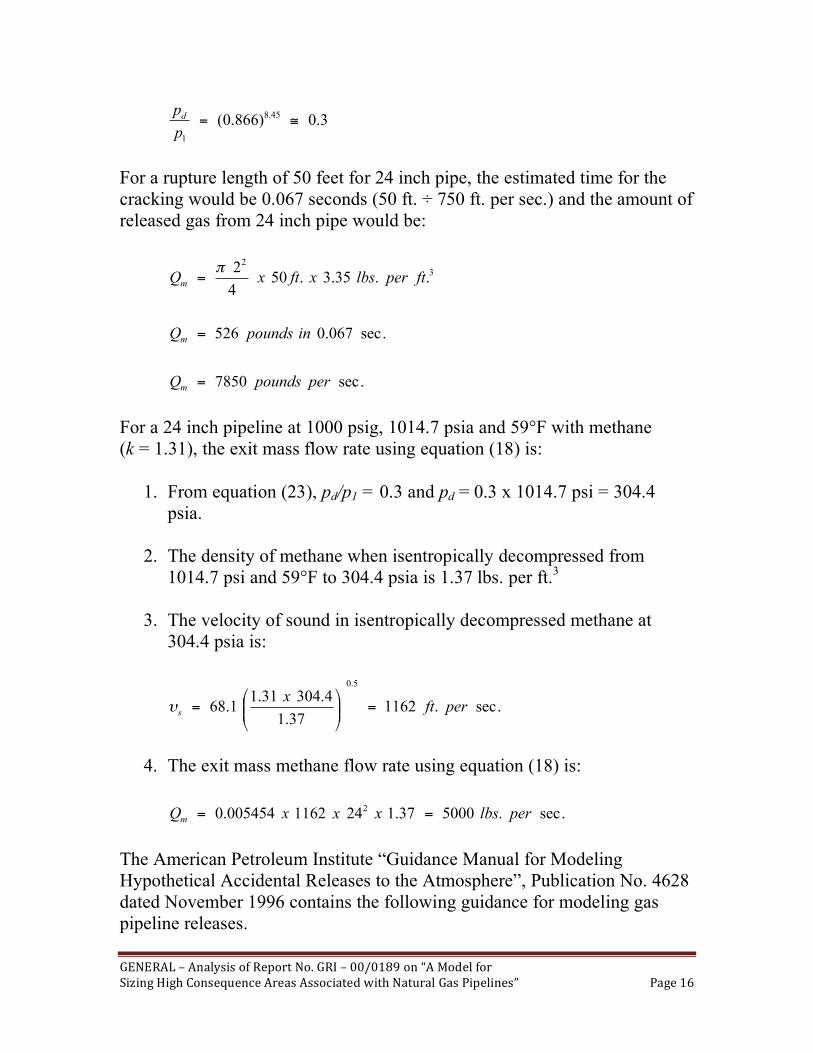
3.0)866.0( 45.8
1
!=p
pd
For a rupture length of 50 feet for 24 inch pipe, the estimated time for the cracking would be 0.067 seconds (50 ft. ÷ 750 ft. per sec.) and the amount of released gas from 24 inch pipe would be:
3
2
..35.3.504
2ftperlbsxftxQm
!=
.sec067.0526 inpoundsQm = .sec7850 perpoundsQm = For a 24 inch pipeline at 1000 psig, 1014.7 psia and 59°F with methane (k = 1.31), the exit mass flow rate using equation (18) is:
1. From equation (23), pd/p1 = 0.3 and pd = 0.3 x 1014.7 psi = 304.4 psia.
2. The density of methane when isentropically decompressed from 1014.7 psi and 59°F to 304.4 psia is 1.37 lbs. per ft.3
3. The velocity of sound in isentropically decompressed methane at 304.4 psia is:
.sec.116237.1
4.30431.11.68
5.0
perftx
s =!!"
#$$%
&='
4. The exit mass methane flow rate using equation (18) is:
.sec.500037.1241162005454.0
2 perlbsxxxQm == The American Petroleum Institute “Guidance Manual for Modeling Hypothetical Accidental Releases to the Atmosphere”, Publication No. 4628 dated November 1996 contains the following guidance for modeling gas pipeline releases.
GENERAL–AnalysisofReportNo.GRI–00/0189on“AModelforSizingHighConsequenceAreasAssociatedwithNaturalGasPipelines” Page17
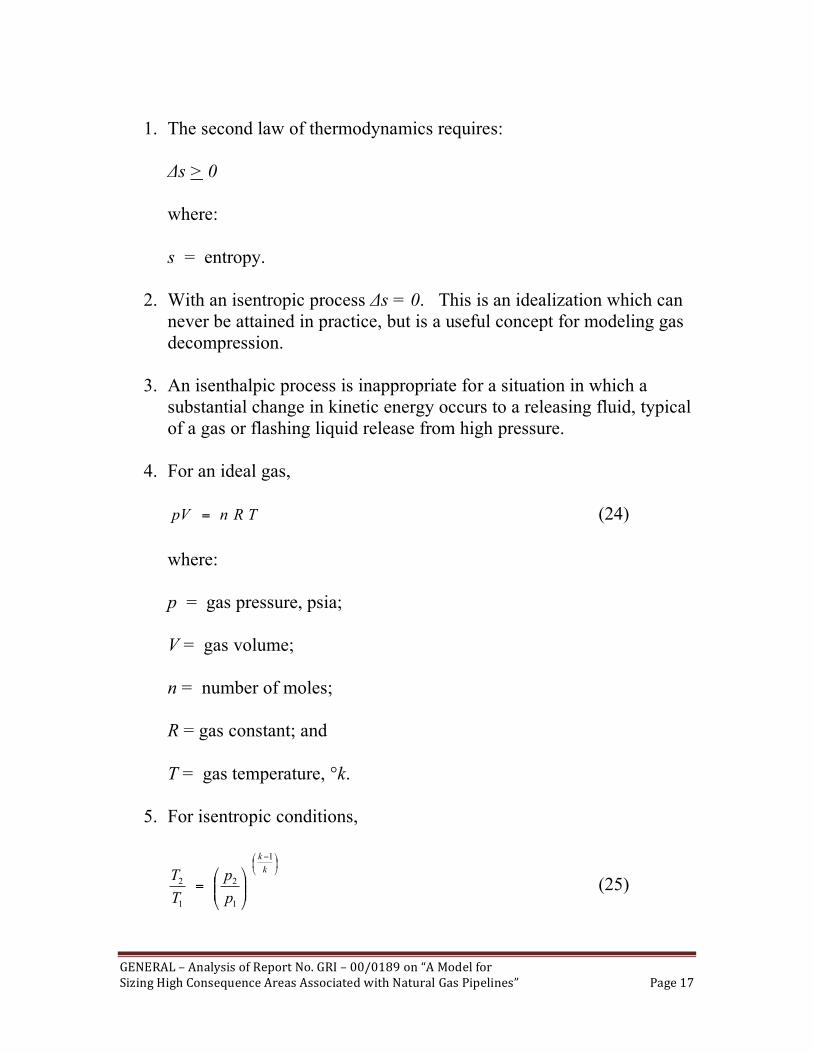
1. The second law of thermodynamics requires:
Δs > 0 where: s = entropy.
2. With an isentropic process Δs = 0. This is an idealization which can never be attained in practice, but is a useful concept for modeling gas decompression.
3. An isenthalpic process is inappropriate for a situation in which a substantial change in kinetic energy occurs to a releasing fluid, typical of a gas or flashing liquid release from high pressure.
4. For an ideal gas,
TRnpV = (24) where: p = gas pressure, psia; V = gas volume; n = number of moles; R = gas constant; and T = gas temperature, °k.
5. For isentropic conditions,
!"
#$%
& '
!!"
#$$%
&=
k
k
p
p
T
T
1
1
2
1
2 (25)
GENERAL–AnalysisofReportNo.GRI–00/0189on“AModelforSizingHighConsequenceAreasAssociatedwithNaturalGasPipelines” Page18
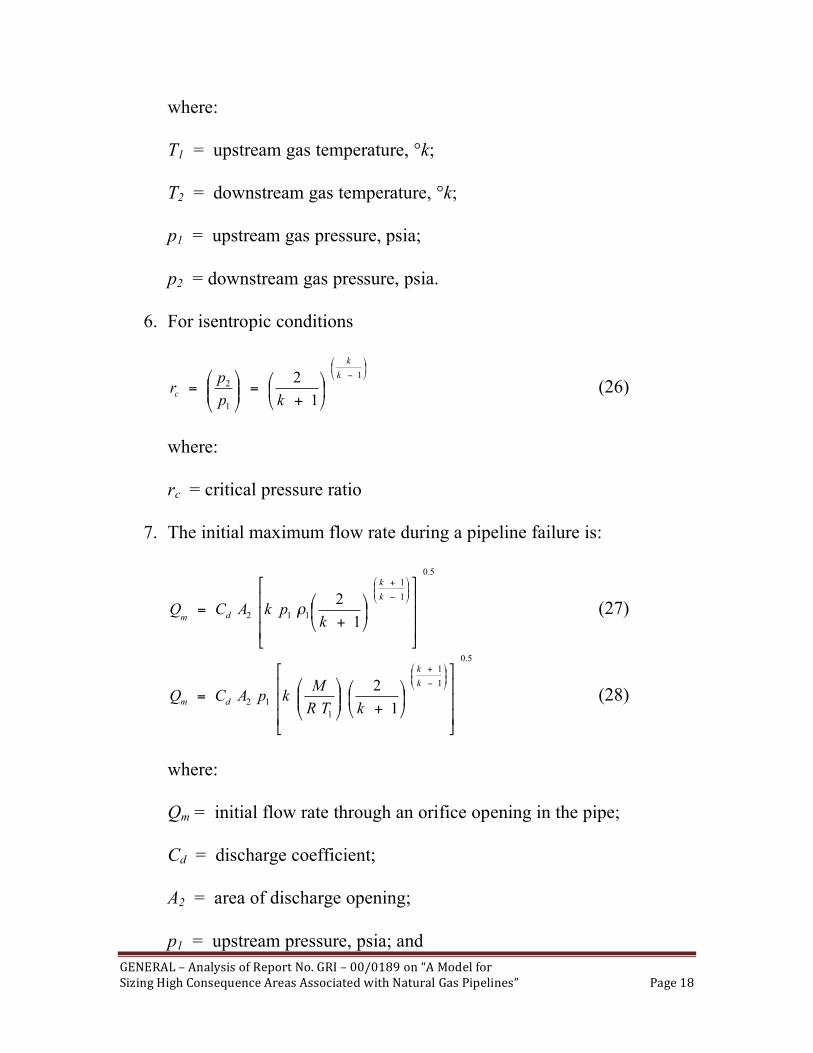
where: T1 = upstream gas temperature, °k; T2 = downstream gas temperature, °k; p1 = upstream gas pressure, psia; p2 = downstream gas pressure, psia.
6. For isentropic conditions
!"
#$%
&
'
!"
#$%
&
+=!!
"
#$$%
&=
1
1
2
1
2 k
k
ckp
pr (26)
where: rc = critical pressure ratio
7. The initial maximum flow rate during a pipeline failure is:
5.0
1
1
112
1
2
!!!
"
#
$$$
%
&
'(
)*+
,
+=
''(
)**+
,
-
+
k
k
dm kpkACQ . (27)
5.0
1
1
1
12
1
2
!!!
"
#
$$$
%
&
'(
)*+
,
+''(
)**+
,=
''(
)**+
,
-
+
k
k
dmkTR
MkpACQ (28)
where: Qm = initial flow rate through an orifice opening in the pipe; Cd = discharge coefficient; A2 = area of discharge opening; p1 = upstream pressure, psia; and
GENERAL–AnalysisofReportNo.GRI–00/0189on“AModelforSizingHighConsequenceAreasAssociatedwithNaturalGasPipelines” Page19
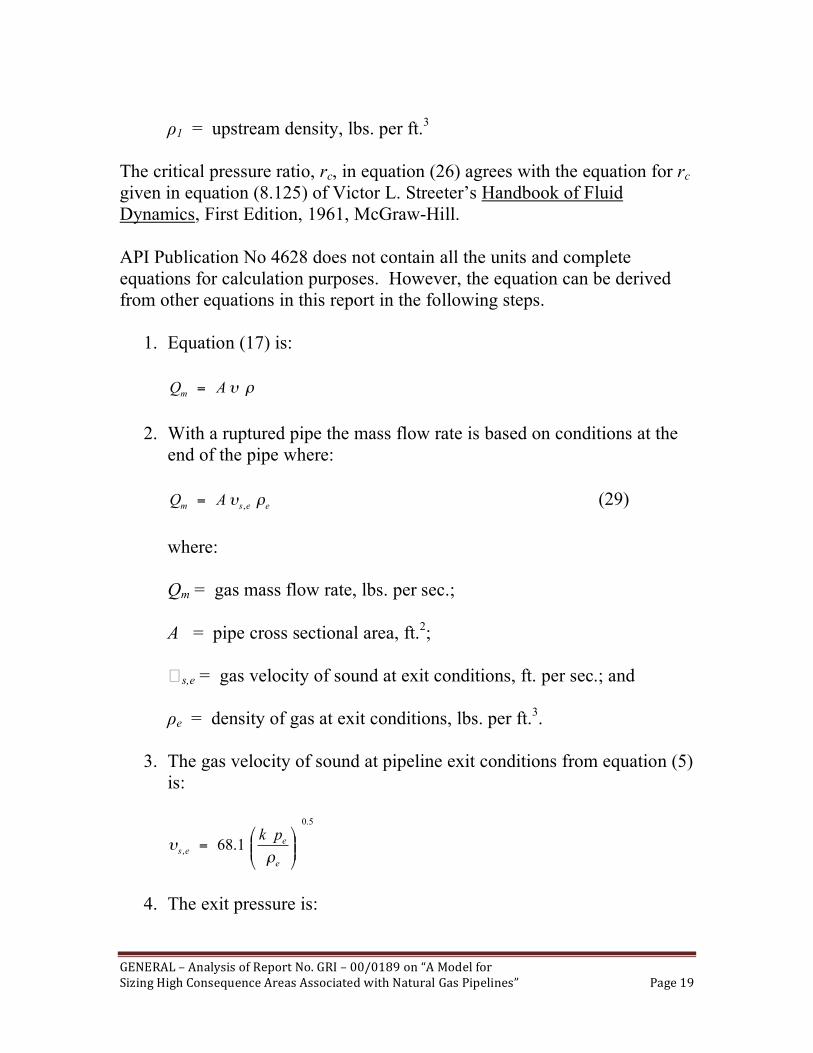
ρ1 = upstream density, lbs. per ft.3
The critical pressure ratio, rc, in equation (26) agrees with the equation for rc given in equation (8.125) of Victor L. Streeter’s Handbook of Fluid Dynamics, First Edition, 1961, McGraw-Hill. API Publication No 4628 does not contain all the units and complete equations for calculation purposes. However, the equation can be derived from other equations in this report in the following steps.
1. Equation (17) is:
!"AQm =
2. With a ruptured pipe the mass flow rate is based on conditions at the end of the pipe where:
eesm AQ !"
,= (29)
where: Qm = gas mass flow rate, lbs. per sec.; A = pipe cross sectional area, ft.2; � s,e = gas velocity of sound at exit conditions, ft. per sec.; and ρe = density of gas at exit conditions, lbs. per ft.3.
3. The gas velocity of sound at pipeline exit conditions from equation (5) is:
5.0
,1.68 !!
"
#$$%
&=
e
ees
pk
'(
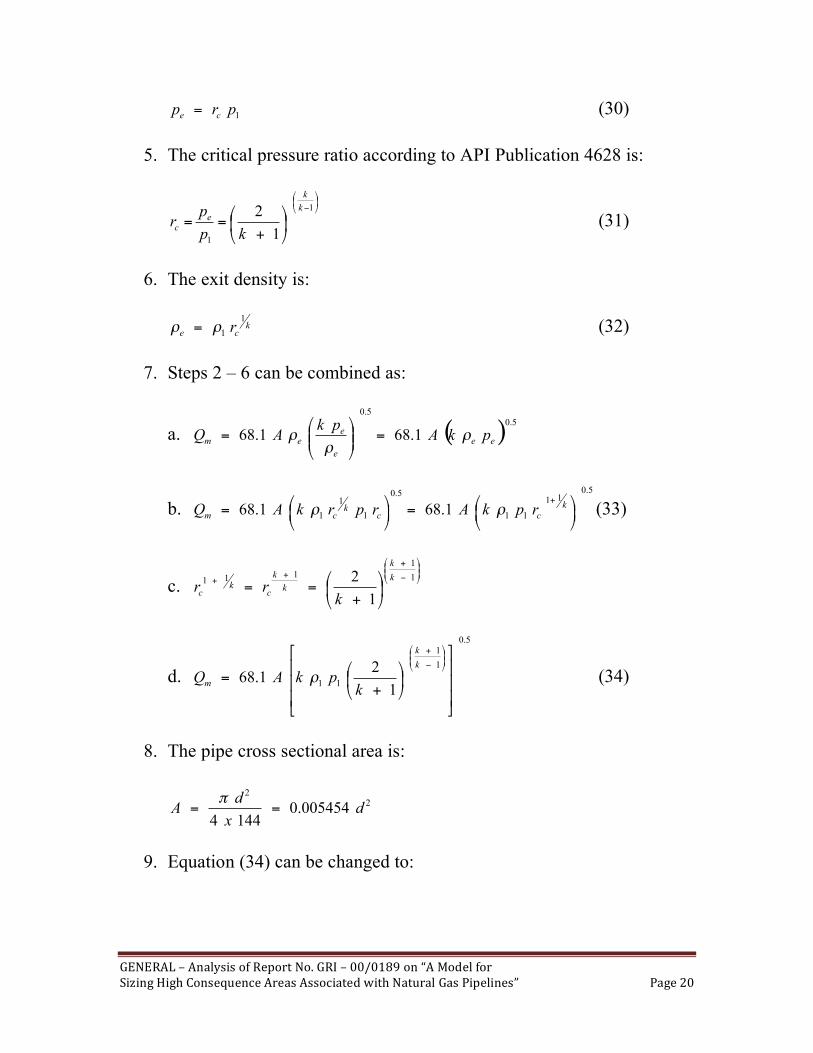
4. The exit pressure is:
GENERAL–AnalysisofReportNo.GRI–00/0189on“AModelforSizingHighConsequenceAreasAssociatedwithNaturalGasPipelines” Page20
1prp
ce= (30)
5. The critical pressure ratio according to API Publication 4628 is:
!"
#$%
&
'
!"
#$%
&
+==
1
11
2k
k
ec
kp
pr (31)
6. The exit density is:
kcer1
1!! = (32)
7. Steps 2 – 6 can be combined as:
a. ( )5.0
5.0
1.681.68 ee
e
eem pkA
pkAQ !
!! =""
#
$%%&
'=
b. 5.0
11
11
5.0
1
1
11.681.68 !
"
#$%
&=!
"
#$%
&=
+k
cck
cm rpkArprkAQ '' (33)
c. !!"
#$$%
&
'
+
++
!"
#$%
&
+==
1
1
111
1
2 k
k
k
k
ck
c
krr
d.
5.0
1
1
11
1
21.68
!!!
"
#
$$$
%
&
'(
)*+
,
+=
''(
)**+
,
-
+
k
k
mk
pkAQ . (34)
8. The pipe cross sectional area is:
2
2
005454.01444
dx
dA ==
!
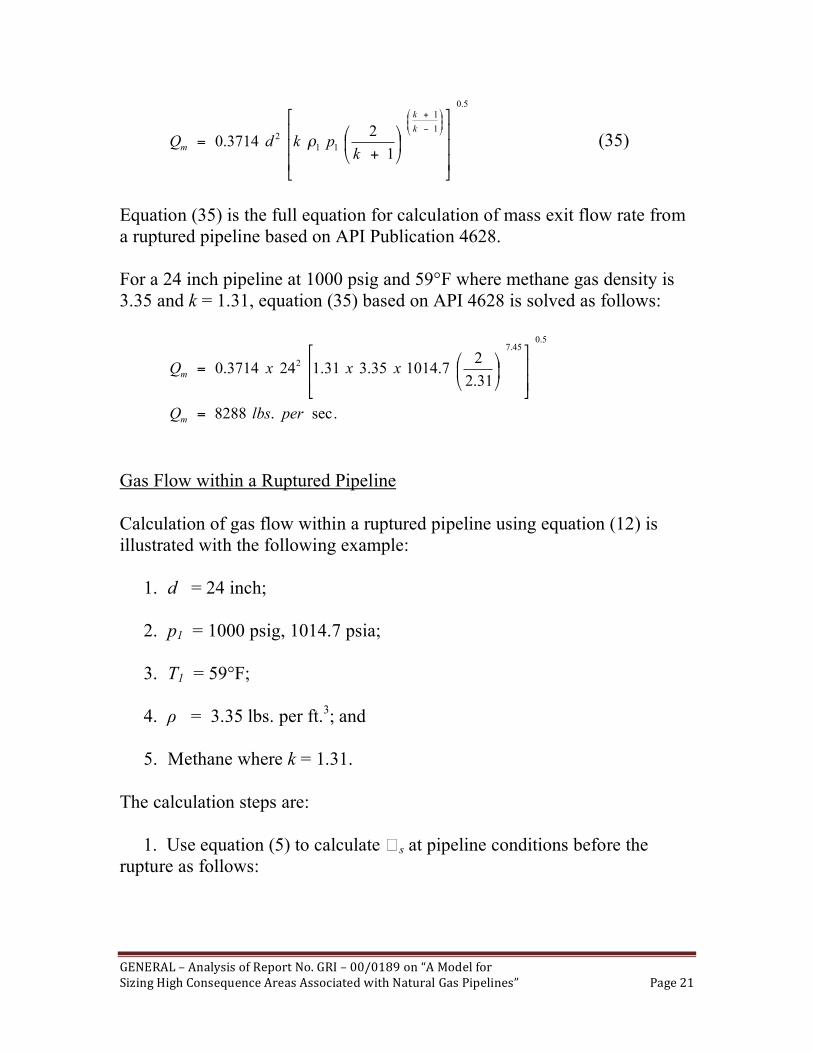
9. Equation (34) can be changed to:
GENERAL–AnalysisofReportNo.GRI–00/0189on“AModelforSizingHighConsequenceAreasAssociatedwithNaturalGasPipelines” Page21
5.0
1
1
11
2
1
23714.0
!!!
"
#
$$$
%
&
'(
)*+
,
+=
''(
)**+
,
-
+
k
k
mk
pkdQ . (35)
Equation (35) is the full equation for calculation of mass exit flow rate from a ruptured pipeline based on API Publication 4628. For a 24 inch pipeline at 1000 psig and 59°F where methane gas density is 3.35 and k = 1.31, equation (35) based on API 4628 is solved as follows:
5.045.7
2
31.2
27.101435.331.1243714.0
!!
"
#
$$
%
&'(
)*+
,= xxxQm
.sec.8288 perlbsQm = Gas Flow within a Ruptured Pipeline Calculation of gas flow within a ruptured pipeline using equation (12) is illustrated with the following example:
1. d = 24 inch;
2. p1 = 1000 psig, 1014.7 psia;
3. T1 = 59°F;
4. ρ = 3.35 lbs. per ft.3; and
5. Methane where k = 1.31. The calculation steps are: 1. Use equation (5) to calculate � s at pipeline conditions before the rupture as follows:
GENERAL–AnalysisofReportNo.GRI–00/0189on“AModelforSizingHighConsequenceAreasAssociatedwithNaturalGasPipelines” Page22
5.0
35.3
7.101431.11.68 !!
"
#$$%
&=
x
S'
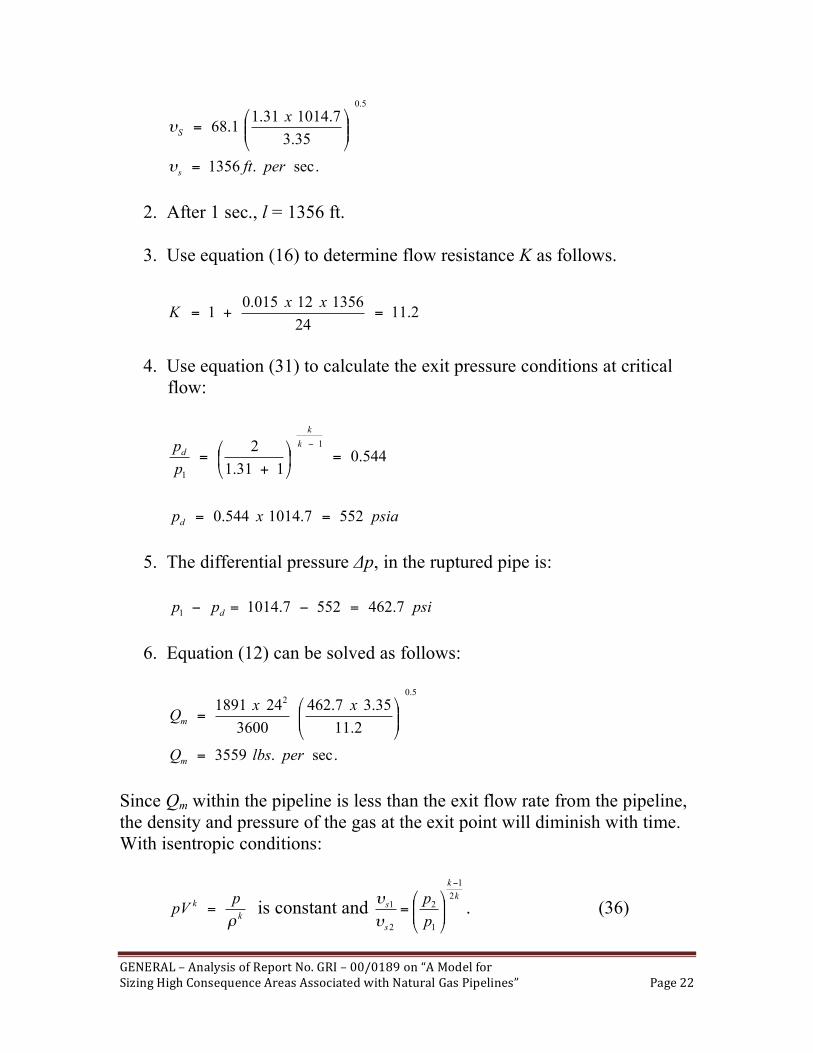
.sec.1356 perfts =! 2. After 1 sec., l = 1356 ft. 3. Use equation (16) to determine flow resistance K as follows.
2.1124
135612015.01 =+=
xxK
4. Use equation (31) to calculate the exit pressure conditions at critical flow:
544.0131.1
2 1
1
=!"
#$%
&
+=
'k
k
d
p
p
psiaxpd 5527.1014544.0 == 5. The differential pressure Δp, in the ruptured pipe is: psipp d 7.4625527.1014
1=!=!
6. Equation (12) can be solved as follows:
5.0
2
2.11
35.37.462
3600
241891
!!"
#$$%
&=
xxQm
.sec.3559 perlbsQm = Since Qm within the pipeline is less than the exit flow rate from the pipeline, the density and pressure of the gas at the exit point will diminish with time. With isentropic conditions:
k
k ppV
!= is constant and
k
k
s
s
p
p 2
1
1
2
2
1
!
""#
$%%&
'=
(
( . (36)
GENERAL–AnalysisofReportNo.GRI–00/0189on“AModelforSizingHighConsequenceAreasAssociatedwithNaturalGasPipelines” Page23
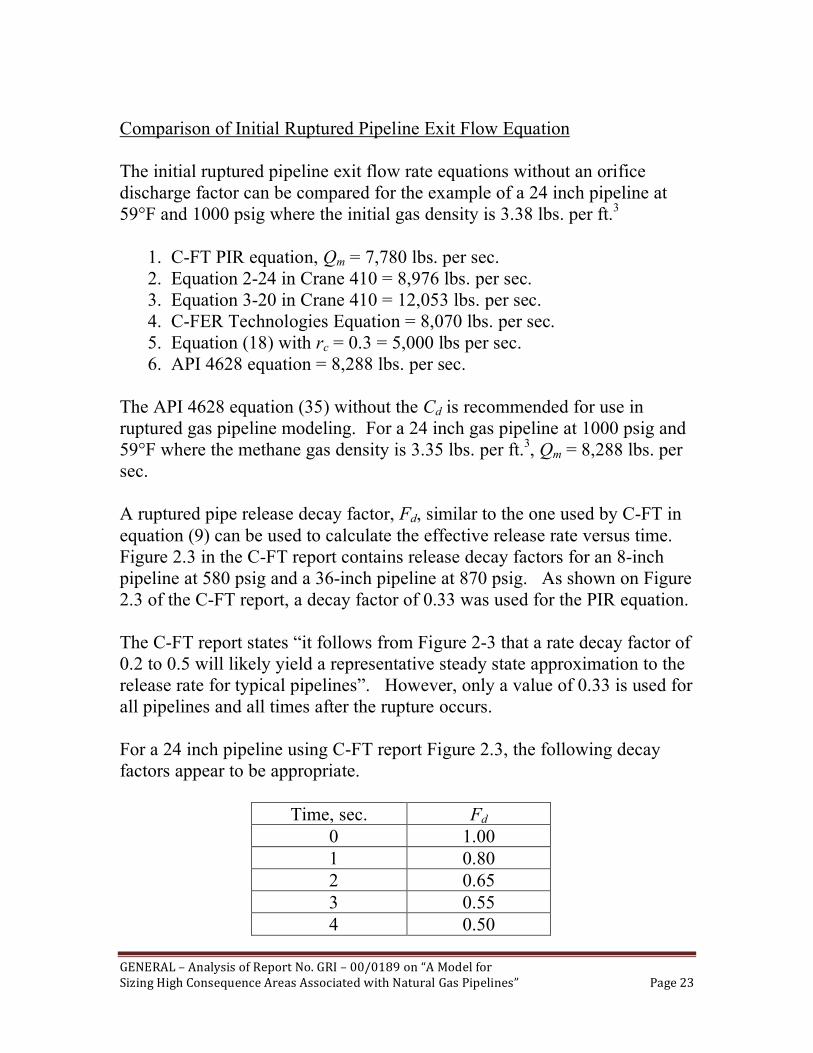
Comparison of Initial Ruptured Pipeline Exit Flow Equation The initial ruptured pipeline exit flow rate equations without an orifice discharge factor can be compared for the example of a 24 inch pipeline at 59°F and 1000 psig where the initial gas density is 3.38 lbs. per ft.3 1. C-FT PIR equation, Qm = 7,780 lbs. per sec. 2. Equation 2-24 in Crane 410 = 8,976 lbs. per sec. 3. Equation 3-20 in Crane 410 = 12,053 lbs. per sec. 4. C-FER Technologies Equation = 8,070 lbs. per sec. 5. Equation (18) with rc = 0.3 = 5,000 lbs per sec. 6. API 4628 equation = 8,288 lbs. per sec. The API 4628 equation (35) without the Cd is recommended for use in ruptured gas pipeline modeling. For a 24 inch gas pipeline at 1000 psig and 59°F where the methane gas density is 3.35 lbs. per ft.3, Qm = 8,288 lbs. per sec. A ruptured pipe release decay factor, Fd, similar to the one used by C-FT in equation (9) can be used to calculate the effective release rate versus time. Figure 2.3 in the C-FT report contains release decay factors for an 8-inch pipeline at 580 psig and a 36-inch pipeline at 870 psig. As shown on Figure 2.3 of the C-FT report, a decay factor of 0.33 was used for the PIR equation. The C-FT report states “it follows from Figure 2-3 that a rate decay factor of 0.2 to 0.5 will likely yield a representative steady state approximation to the release rate for typical pipelines”. However, only a value of 0.33 is used for all pipelines and all times after the rupture occurs. For a 24 inch pipeline using C-FT report Figure 2.3, the following decay factors appear to be appropriate.
Time, sec. Fd 0 1.00 1 0.80 2 0.65 3 0.55 4 0.50
GENERAL–AnalysisofReportNo.GRI–00/0189on“AModelforSizingHighConsequenceAreasAssociatedwithNaturalGasPipelines” Page24
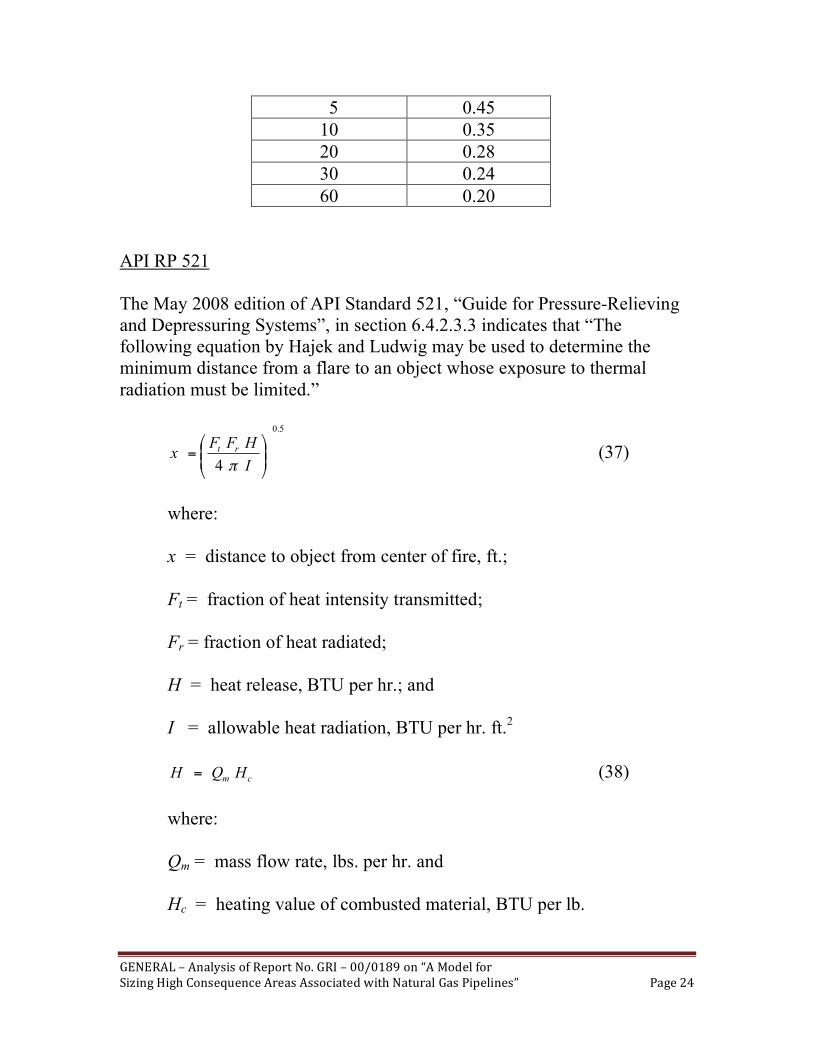
5 0.45 10 0.35 20 0.28 30 0.24 60 0.20
API RP 521 The May 2008 edition of API Standard 521, “Guide for Pressure-Relieving and Depressuring Systems”, in section 6.4.2.3.3 indicates that “The following equation by Hajek and Ludwig may be used to determine the minimum distance from a flare to an object whose exposure to thermal radiation must be limited.”
5.0
4 !!"
#$$%
&=
I
HFFx
rt
' (37)
where: x = distance to object from center of fire, ft.; Ft = fraction of heat intensity transmitted; Fr = fraction of heat radiated; H = heat release, BTU per hr.; and I = allowable heat radiation, BTU per hr. ft.2 cm HQH = (38) where: Qm = mass flow rate, lbs. per hr. and Hc = heating value of combusted material, BTU per lb.
GENERAL–AnalysisofReportNo.GRI–00/0189on“AModelforSizingHighConsequenceAreasAssociatedwithNaturalGasPipelines” Page25
16
1
16
1
10010079.0 !
"
#$%
&!!"
#$$%
&=
xRF
H
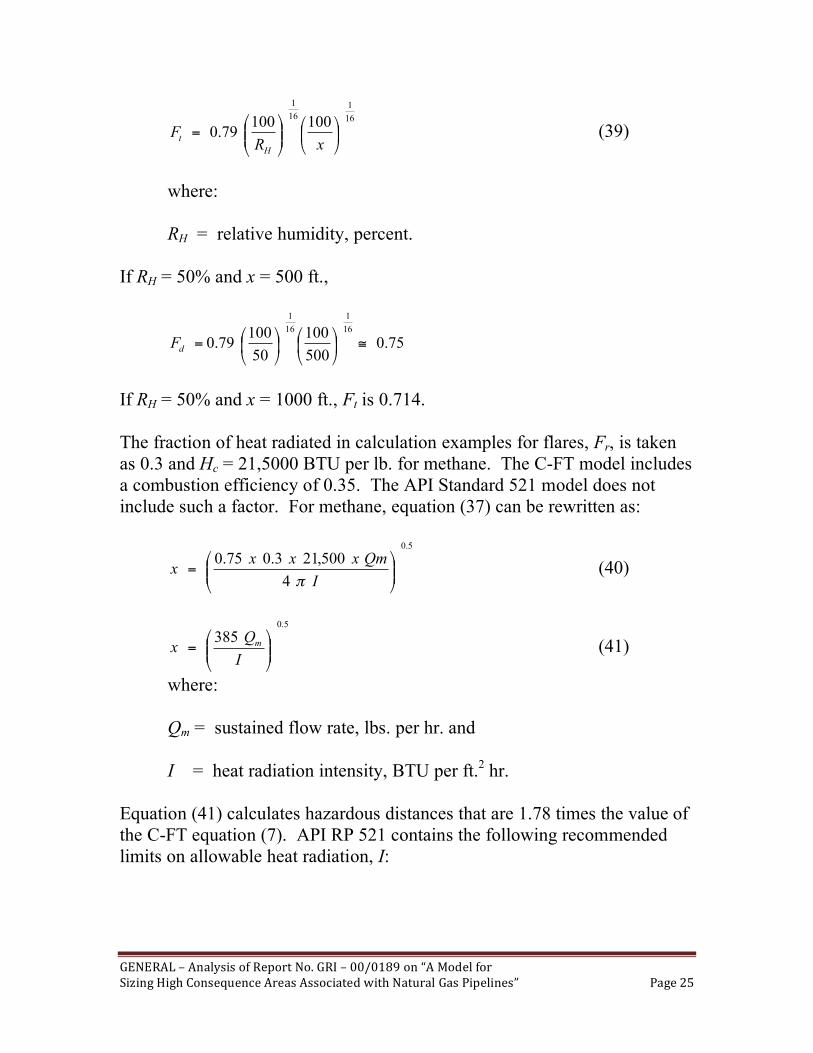
t (39)
where: RH = relative humidity, percent. If RH = 50% and x = 500 ft.,
75.0500
100
50
10079.0
16
1
16
1
!"#
$%&
'"#
$%&
'=
dF
If RH = 50% and x = 1000 ft., Ft is 0.714. The fraction of heat radiated in calculation examples for flares, Fr, is taken as 0.3 and Hc = 21,5000 BTU per lb. for methane. The C-FT model includes a combustion efficiency of 0.35. The API Standard 521 model does not include such a factor. For methane, equation (37) can be rewritten as:
5.0
4
500,213.075.0!!"
#$$%
&=
I
Qmxxxx
' (40)
5.0
385
!!"
#$$%
&=
I
Qx m (41)
where: Qm = sustained flow rate, lbs. per hr. and I = heat radiation intensity, BTU per ft.2 hr.
Equation (41) calculates hazardous distances that are 1.78 times the value of the C-FT equation (7). API RP 521 contains the following recommended limits on allowable heat radiation, I:
GENERAL–AnalysisofReportNo.GRI–00/0189on“AModelforSizingHighConsequenceAreasAssociatedwithNaturalGasPipelines” Page26
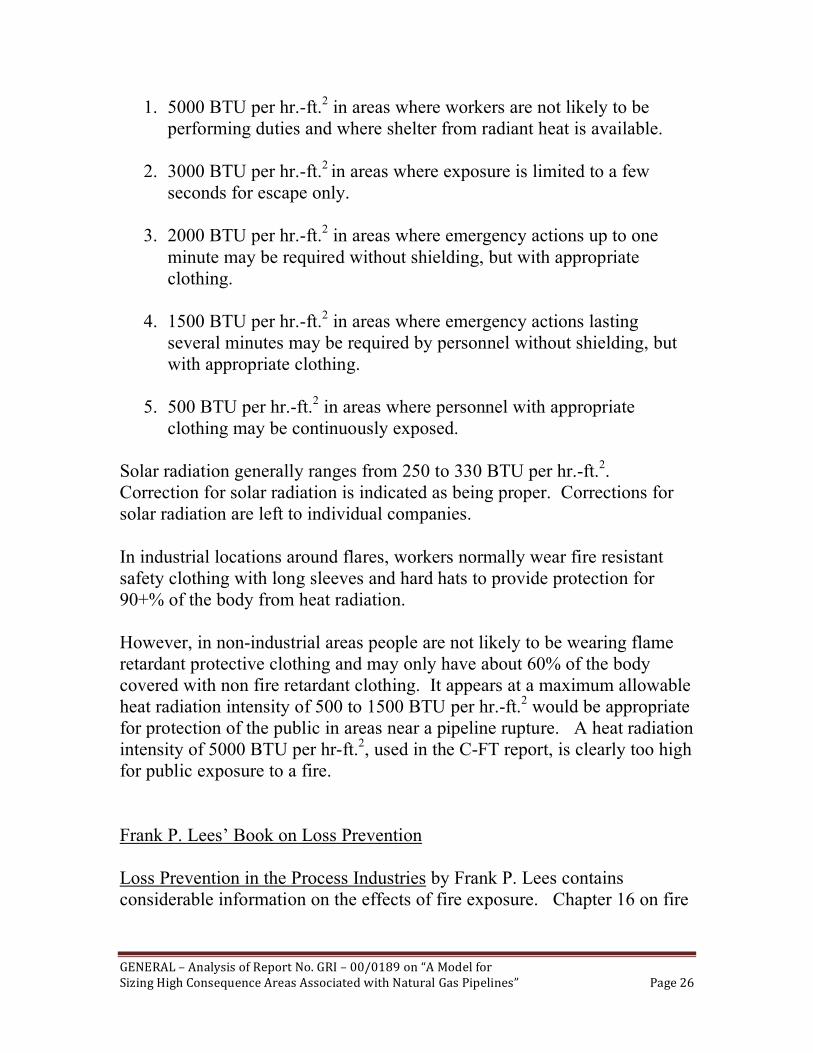
1. 5000 BTU per hr.-ft.2 in areas where workers are not likely to be performing duties and where shelter from radiant heat is available.
2. 3000 BTU per hr.-ft.2 in areas where exposure is limited to a few seconds for escape only.
3. 2000 BTU per hr.-ft.2 in areas where emergency actions up to one minute may be required without shielding, but with appropriate clothing.
4. 1500 BTU per hr.-ft.2 in areas where emergency actions lasting several minutes may be required by personnel without shielding, but with appropriate clothing.
5. 500 BTU per hr.-ft.2 in areas where personnel with appropriate clothing may be continuously exposed.
Solar radiation generally ranges from 250 to 330 BTU per hr.-ft.2. Correction for solar radiation is indicated as being proper. Corrections for solar radiation are left to individual companies. In industrial locations around flares, workers normally wear fire resistant safety clothing with long sleeves and hard hats to provide protection for 90+% of the body from heat radiation. However, in non-industrial areas people are not likely to be wearing flame retardant protective clothing and may only have about 60% of the body covered with non fire retardant clothing. It appears at a maximum allowable heat radiation intensity of 500 to 1500 BTU per hr.-ft.2 would be appropriate for protection of the public in areas near a pipeline rupture. A heat radiation intensity of 5000 BTU per hr-ft.2, used in the C-FT report, is clearly too high for public exposure to a fire. Frank P. Lees’ Book on Loss Prevention Loss Prevention in the Process Industries by Frank P. Lees contains considerable information on the effects of fire exposure. Chapter 16 on fire
GENERAL–AnalysisofReportNo.GRI–00/0189on“AModelforSizingHighConsequenceAreasAssociatedwithNaturalGasPipelines” Page27
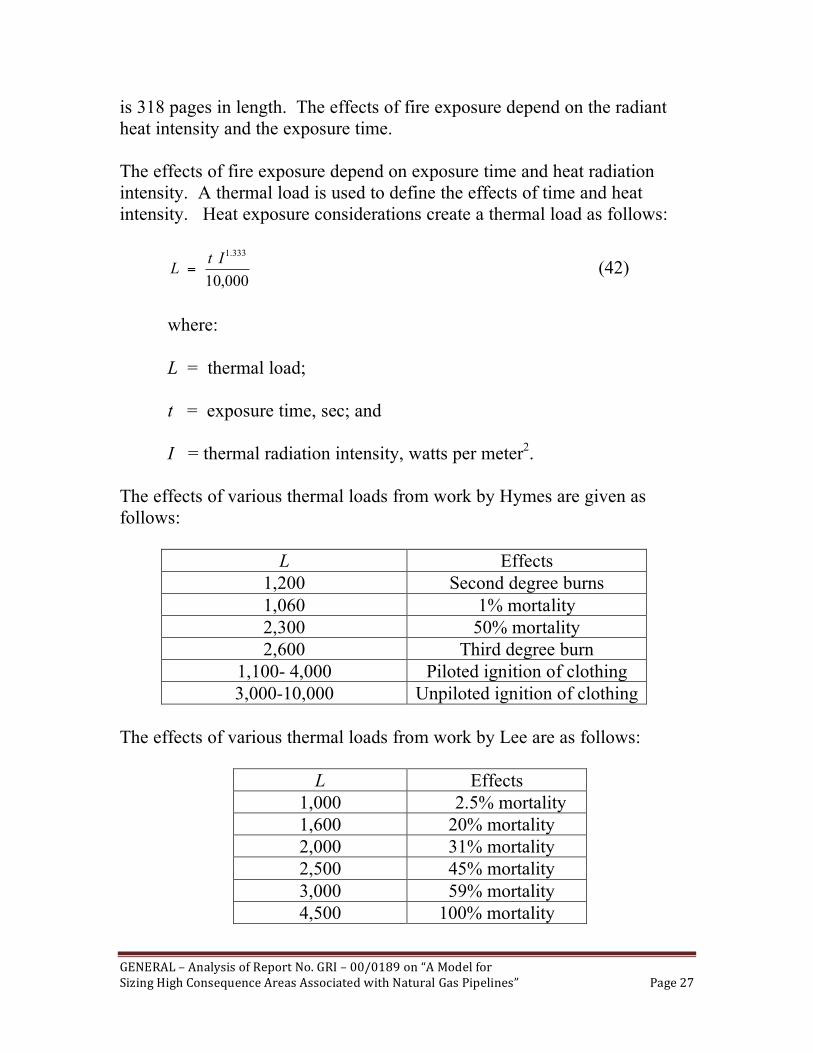
is 318 pages in length. The effects of fire exposure depend on the radiant heat intensity and the exposure time. The effects of fire exposure depend on exposure time and heat radiation intensity. A thermal load is used to define the effects of time and heat intensity. Heat exposure considerations create a thermal load as follows:
000,10
333.1It
L = (42)
where: L = thermal load; t = exposure time, sec; and I = thermal radiation intensity, watts per meter2. The effects of various thermal loads from work by Hymes are given as follows:
L Effects 1,200 Second degree burns 1,060 1% mortality 2,300 50% mortality 2,600 Third degree burn
1,100- 4,000 Piloted ignition of clothing 3,000-10,000 Unpiloted ignition of clothing
The effects of various thermal loads from work by Lee are as follows:
L Effects
1,000 2.5% mortality 1,600 20% mortality 2,000 31% mortality 2,500 45% mortality 3,000 59% mortality 4,500 100% mortality
GENERAL–AnalysisofReportNo.GRI–00/0189on“AModelforSizingHighConsequenceAreasAssociatedwithNaturalGasPipelines” Page28
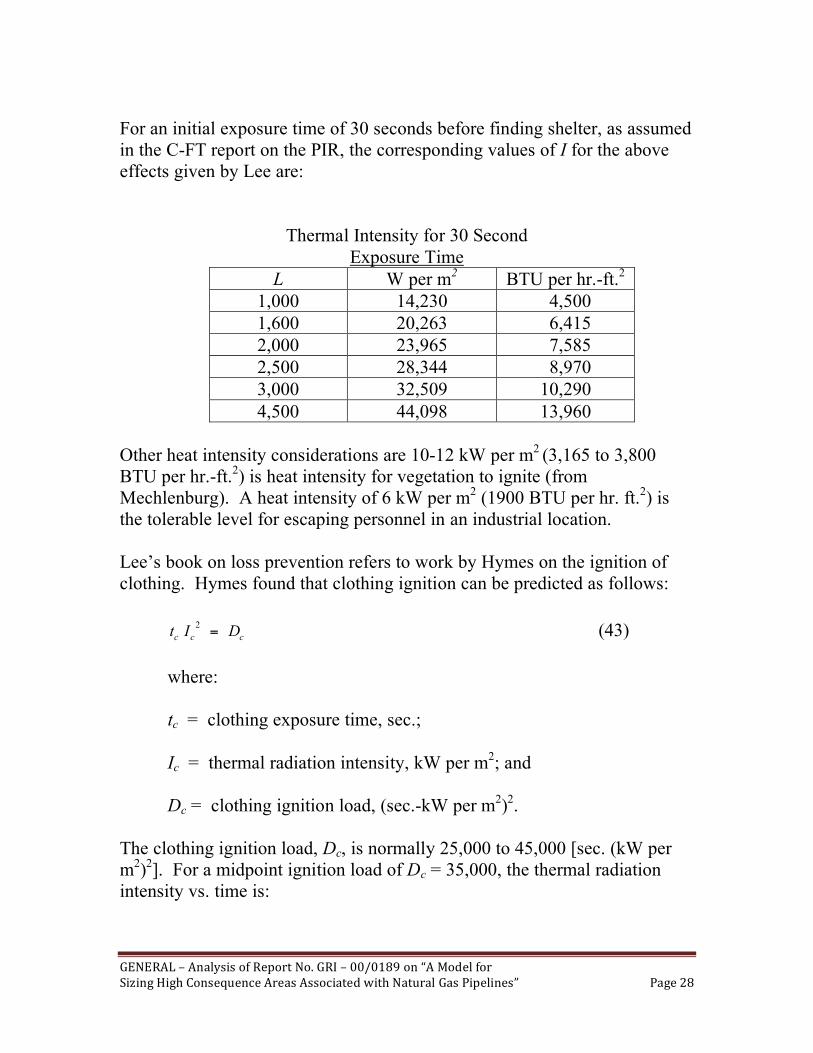
For an initial exposure time of 30 seconds before finding shelter, as assumed in the C-FT report on the PIR, the corresponding values of I for the above effects given by Lee are:
Thermal Intensity for 30 Second Exposure Time
L W per m2 BTU per hr.-ft.2
1,000 14,230 4,500 1,600 20,263 6,415 2,000 23,965 7,585 2,500 28,344 8,970 3,000 32,509 10,290 4,500 44,098 13,960
Other heat intensity considerations are 10-12 kW per m2 (3,165 to 3,800 BTU per hr.-ft.2) is heat intensity for vegetation to ignite (from Mechlenburg). A heat intensity of 6 kW per m2 (1900 BTU per hr. ft.2) is the tolerable level for escaping personnel in an industrial location. Lee’s book on loss prevention refers to work by Hymes on the ignition of clothing. Hymes found that clothing ignition can be predicted as follows:
cccDIt =
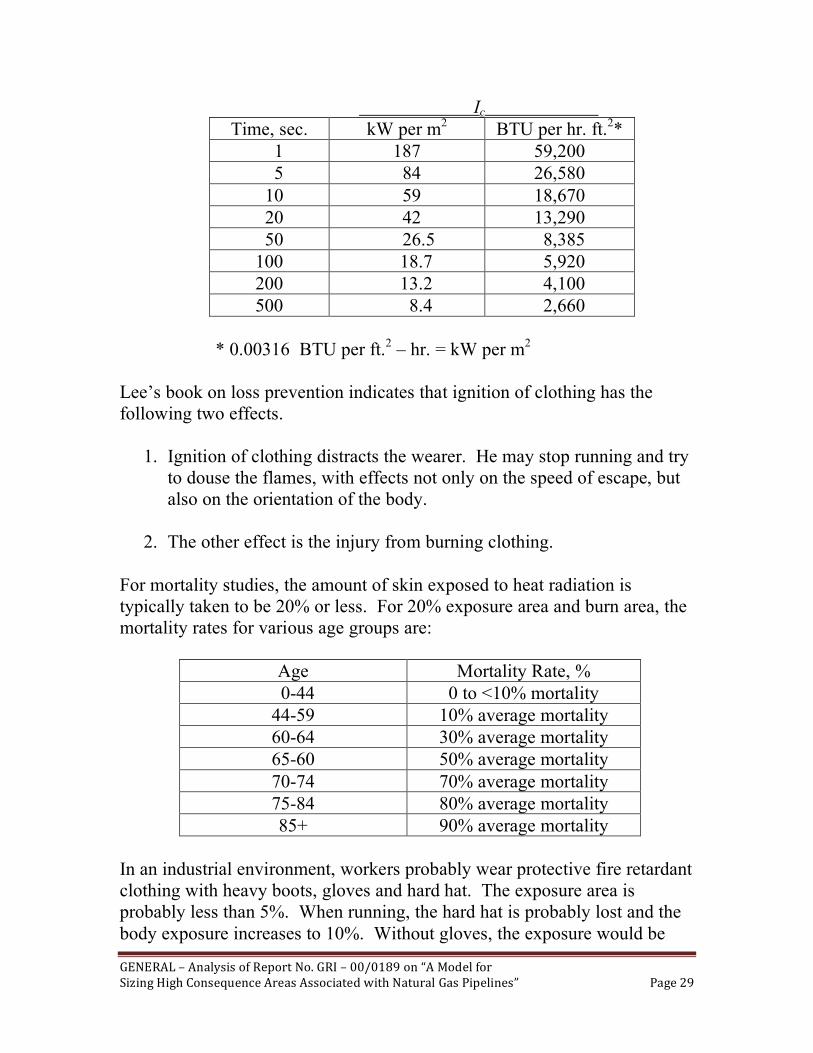
2 (43) where: tc = clothing exposure time, sec.; Ic = thermal radiation intensity, kW per m2; and Dc = clothing ignition load, (sec.-kW per m2)2. The clothing ignition load, Dc, is normally 25,000 to 45,000 [sec. (kW per m2)2]. For a midpoint ignition load of Dc = 35,000, the thermal radiation intensity vs. time is:
GENERAL–AnalysisofReportNo.GRI–00/0189on“AModelforSizingHighConsequenceAreasAssociatedwithNaturalGasPipelines” Page29
Ic
Time, sec. kW per m2 BTU per hr. ft.2* 1 187 59,200 5 84 26,580 10 59 18,670 20 42 13,290 50 26.5 8,385 100 18.7 5,920 200 13.2 4,100 500 8.4 2,660
* 0.00316 BTU per ft.2 – hr. = kW per m2
Lee’s book on loss prevention indicates that ignition of clothing has the following two effects.
1. Ignition of clothing distracts the wearer. He may stop running and try to douse the flames, with effects not only on the speed of escape, but also on the orientation of the body.
2. The other effect is the injury from burning clothing. For mortality studies, the amount of skin exposed to heat radiation is typically taken to be 20% or less. For 20% exposure area and burn area, the mortality rates for various age groups are:
Age Mortality Rate, % 0-44 0 to <10% mortality 44-59 10% average mortality 60-64 30% average mortality 65-60 50% average mortality 70-74 70% average mortality 75-84 80% average mortality 85+ 90% average mortality
In an industrial environment, workers probably wear protective fire retardant clothing with heavy boots, gloves and hard hat. The exposure area is probably less than 5%. When running, the hard hat is probably lost and the body exposure increases to 10%. Without gloves, the exposure would be
GENERAL–AnalysisofReportNo.GRI–00/0189on“AModelforSizingHighConsequenceAreasAssociatedwithNaturalGasPipelines” Page30
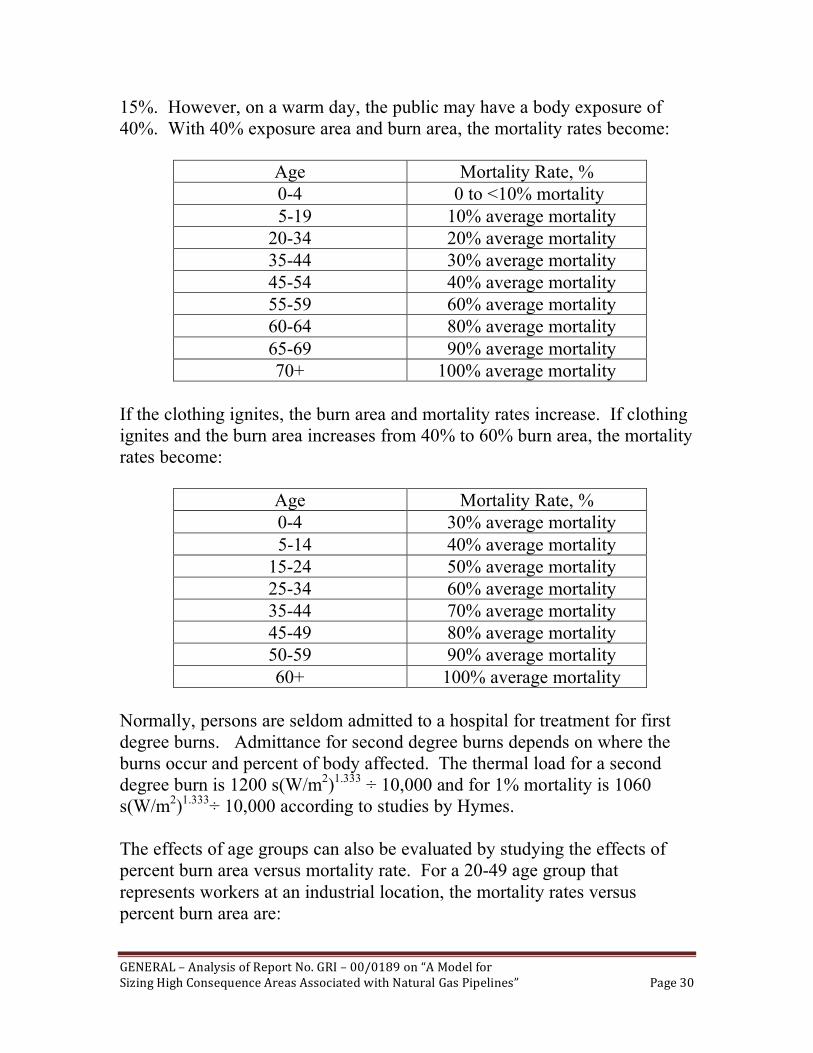
15%. However, on a warm day, the public may have a body exposure of 40%. With 40% exposure area and burn area, the mortality rates become:
Age Mortality Rate, % 0-4 0 to <10% mortality
5-19 10% average mortality 20-34 20% average mortality 35-44 30% average mortality 45-54 40% average mortality 55-59 60% average mortality 60-64 80% average mortality 65-69 90% average mortality 70+ 100% average mortality
If the clothing ignites, the burn area and mortality rates increase. If clothing ignites and the burn area increases from 40% to 60% burn area, the mortality rates become:
Age Mortality Rate, % 0-4 30% average mortality
5-14 40% average mortality 15-24 50% average mortality 25-34 60% average mortality 35-44 70% average mortality 45-49 80% average mortality 50-59 90% average mortality 60+ 100% average mortality
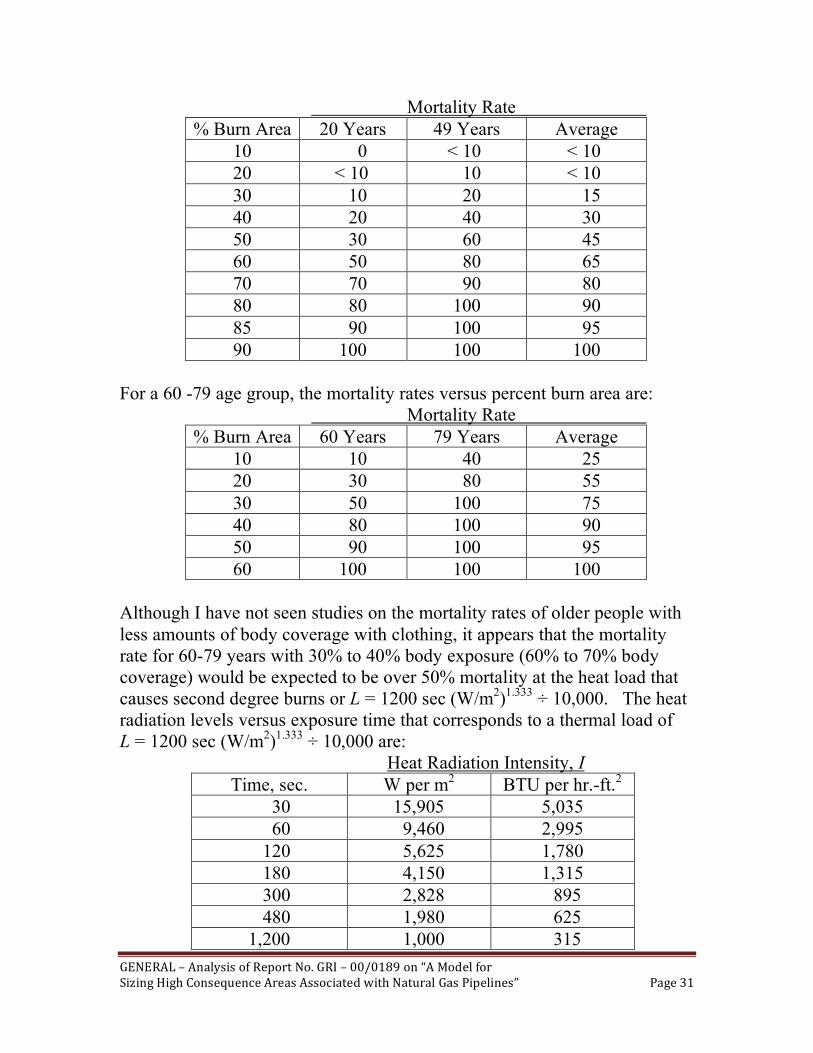
Normally, persons are seldom admitted to a hospital for treatment for first degree burns. Admittance for second degree burns depends on where the burns occur and percent of body affected. The thermal load for a second degree burn is 1200 s(W/m2)1.333 ÷ 10,000 and for 1% mortality is 1060 s(W/m2)1.333÷ 10,000 according to studies by Hymes. The effects of age groups can also be evaluated by studying the effects of percent burn area versus mortality rate. For a 20-49 age group that represents workers at an industrial location, the mortality rates versus percent burn area are:
GENERAL–AnalysisofReportNo.GRI–00/0189on“AModelforSizingHighConsequenceAreasAssociatedwithNaturalGasPipelines” Page31
Mortality Rate % Burn Area 20 Years 49 Years Average
10 0 < 10 < 10 20 < 10 10 < 10 30 10 20 15 40 20 40 30 50 30 60 45 60 50 80 65 70 70 90 80 80 80 100 90 85 90 100 95 90 100 100 100
For a 60 -79 age group, the mortality rates versus percent burn area are: Mortality Rate
% Burn Area 60 Years 79 Years Average 10 10 40 25 20 30 80 55 30 50 100 75 40 80 100 90 50 90 100 95 60 100 100 100
Although I have not seen studies on the mortality rates of older people with less amounts of body coverage with clothing, it appears that the mortality rate for 60-79 years with 30% to 40% body exposure (60% to 70% body coverage) would be expected to be over 50% mortality at the heat load that causes second degree burns or L = 1200 sec (W/m2)1.333 ÷ 10,000. The heat radiation levels versus exposure time that corresponds to a thermal load of L = 1200 sec (W/m2)1.333 ÷ 10,000 are: Heat Radiation Intensity, I
Time, sec. W per m2 BTU per hr.-ft.2
30 15,905 5,035 60 9,460 2,995 120 5,625 1,780 180 4,150 1,315 300 2,828 895 480 1,980 625 1,200 1,000 315
GENERAL–AnalysisofReportNo.GRI–00/0189on“AModelforSizingHighConsequenceAreasAssociatedwithNaturalGasPipelines” Page32
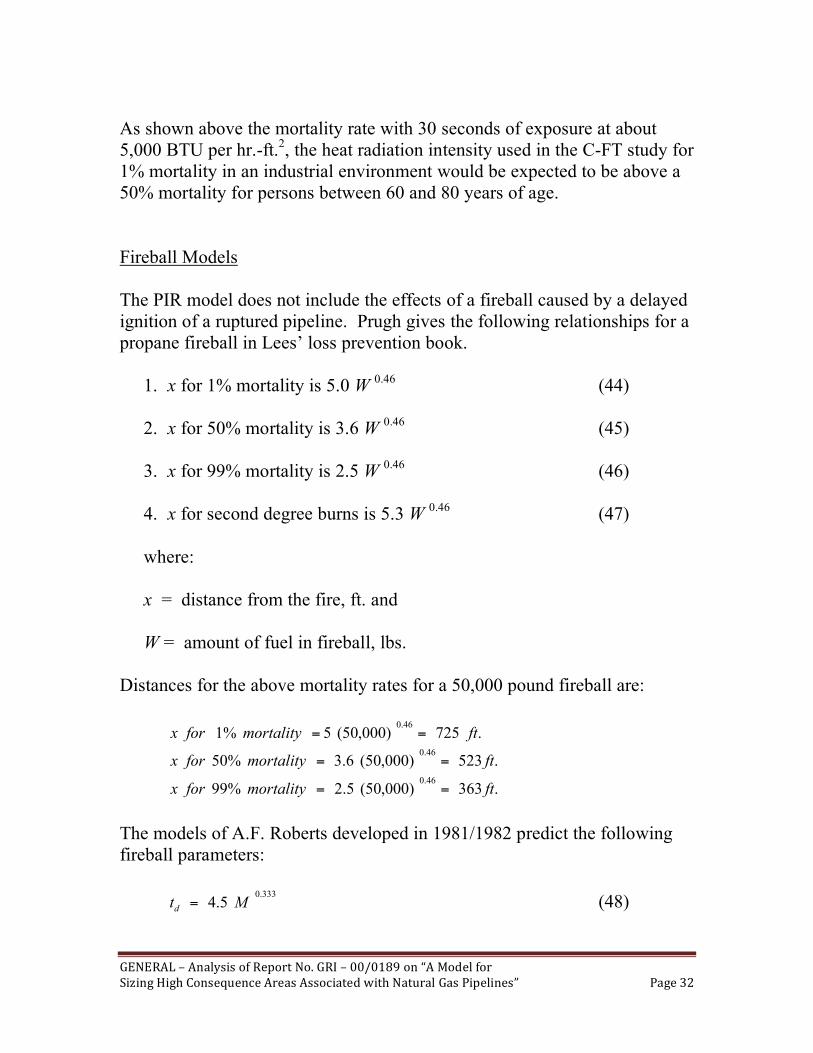
As shown above the mortality rate with 30 seconds of exposure at about 5,000 BTU per hr.-ft.2, the heat radiation intensity used in the C-FT study for 1% mortality in an industrial environment would be expected to be above a 50% mortality for persons between 60 and 80 years of age. Fireball Models The PIR model does not include the effects of a fireball caused by a delayed ignition of a ruptured pipeline. Prugh gives the following relationships for a propane fireball in Lees’ loss prevention book.
1. x for 1% mortality is 5.0 W 0.46 (44)
2. x for 50% mortality is 3.6 W 0.46 (45)
3. x for 99% mortality is 2.5 W 0.46 (46)
4. x for second degree burns is 5.3 W 0.46 (47)
where: x = distance from the fire, ft. and W = amount of fuel in fireball, lbs.
Distances for the above mortality rates for a 50,000 pound fireball are: .725)000,50(5%1
46.0ftmortalityforx ==
.523)000,50(6.3%5046.0
ftmortalityforx == .363)000,50(5.2%99
46.0ftmortalityforx ==
The models of A.F. Roberts developed in 1981/1982 predict the following fireball parameters: 333.0
5.4 Mtd= (48)
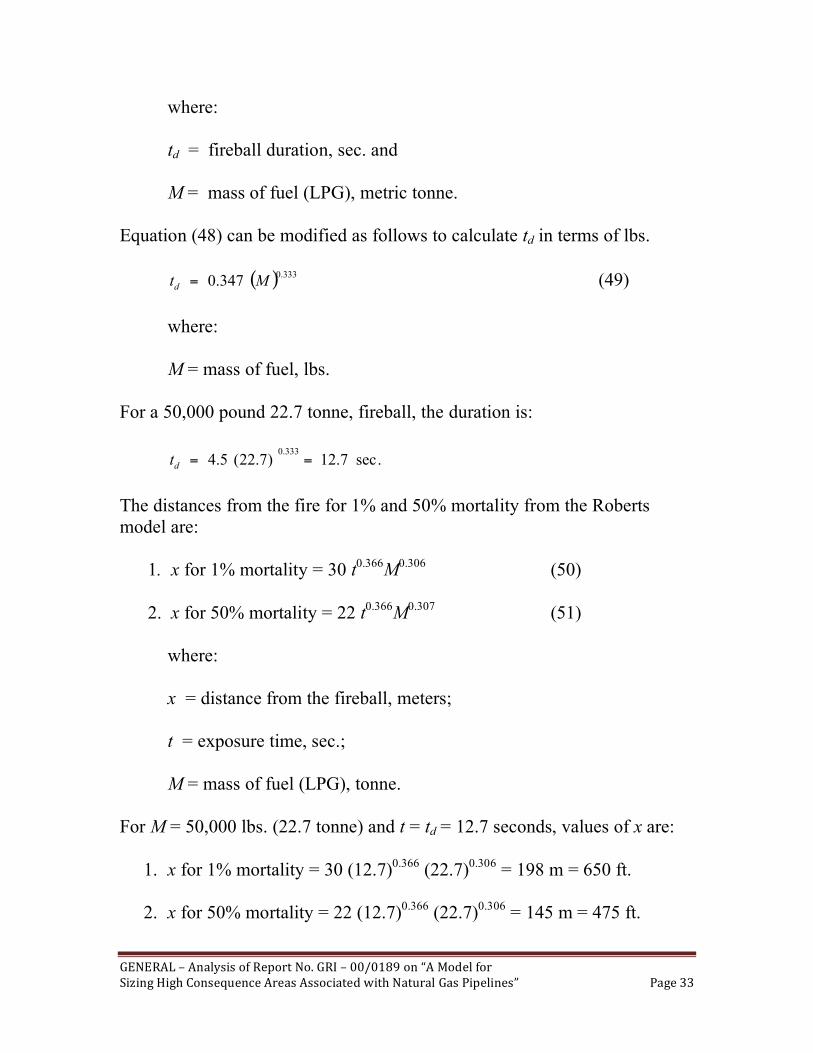
GENERAL–AnalysisofReportNo.GRI–00/0189on“AModelforSizingHighConsequenceAreasAssociatedwithNaturalGasPipelines” Page33
where: td = fireball duration, sec. and M = mass of fuel (LPG), metric tonne. Equation (48) can be modified as follows to calculate td in terms of lbs. ( ) 333.0
347.0 Mtd= (49)
where: M = mass of fuel, lbs. For a 50,000 pound 22.7 tonne, fireball, the duration is: .sec7.12)7.22(5.4
333.0==
dt
The distances from the fire for 1% and 50% mortality from the Roberts model are: 1. x for 1% mortality = 30 t0.366M0.306 (50)
2. x for 50% mortality = 22 t0.366M0.307 (51)
where: x = distance from the fireball, meters; t = exposure time, sec.; M = mass of fuel (LPG), tonne.
For M = 50,000 lbs. (22.7 tonne) and t = td = 12.7 seconds, values of x are:
1. x for 1% mortality = 30 (12.7)0.366 (22.7)0.306 = 198 m = 650 ft.
2. x for 50% mortality = 22 (12.7)0.366 (22.7)0.306 = 145 m = 475 ft.
GENERAL–AnalysisofReportNo.GRI–00/0189on“AModelforSizingHighConsequenceAreasAssociatedwithNaturalGasPipelines” Page34
The above model of Roberts applies to 10<M<3000 tonne and 10<t<300 seconds. Another model by Prugh for a propane fireball is: x for 50% mortality = 38 M 0.46 (52) where: x = distance from fireball, m and M = mass of fuel, tons. For 25 tons of fuel, x for 50% mortality is: x for 50% mortality = 38 (25)0.46 = 167 m (548 ft.) Hardee and Lees developed the following model for a propane fireball as follows: D = 5.55 M 0.333 (53) where: D = fireball diameter, m. M = propane mass, kg. In English units, equation (53) becomes: 333.0
14 MD = where: D = fireball diameter, ft. and M = propane mass, lbs.
GENERAL–AnalysisofReportNo.GRI–00/0189on“AModelforSizingHighConsequenceAreasAssociatedwithNaturalGasPipelines” Page35
Hardee, Lees and Benedick later in (1978) developed the following model for LNG (methane) fireballs. R = 3.12 M 0.333 (54) D = 6.24 M 0.333 (55) td = 1.11 M 0.167 (56) where: R = radius of fireball, m; D = fireball diameter, m; M = fuel mass, kg; and td = fireball duration, sec. Roberts developed the following model for hydrocarbon fireballs: D = 5.8 M 0.333 (57) The models of Roberts [equations (48) and (51)] can be compared to the API 521 model indicated as equation (41) in this report in the following steps:
1. LPG fuel released for fireball = 50,000 lbs, 25 tons, 22.7 tonnes.
2. Distance criterion is for 50% mortality.
3. Fireball duration [equation (48)], td, is = 4.5 M 0.333 = 12.7 sec.
4. For td = 12.7 sec. and M = 50,000, the average fireball fuel consumption rate, Qm, is 3937 lbs. per sec. = 14,170, 000 lbs per hr.
5. For 50% mortality, the required thermal load, L [equation (40)], is 2300 to 2600, according to Hymes and Lee.
GENERAL–AnalysisofReportNo.GRI–00/0189on“AModelforSizingHighConsequenceAreasAssociatedwithNaturalGasPipelines” Page36
6. For L = 2300, equation (42) can be used to calculate the required radiation intensity, I, for t = td = 12.7 sec.
22
333.1
..700,15510,49
2300000,10
7.12
fthrperBTUmperWI
IL
!==
==
7. For I = 15,700 BTU per hr.-ft.2 using equation (41), the hazardous
distance is:
.589700,15
000,170,143855.0
ftx
x =!!"
#$$%
&=
8. For L = 2600 and t = 12.7 sec., equation (42) is used to calculate I as
54,280 W per m2 = 17,185 BTU per hr.-ft.2.
9. For I = 17,185 BTU per hr.-ft.2 using equation (41), the hazardous distance is:
.563185,17
000,170,143855.0
ftx
x =!!"
#$$%
&=
10. Equation (45) can be used to calculate the distance from the fire
where the radiation intensity will cause a 50% mortality rate as follows:
( ) .522000,506.36.3
46.046.0
ftWx ===
11. Equation (51) can also be used to calculate the distance from the fire where the radiation intensity and duration time will cause a 50% mortality rate as follows:
.475)7.22()7.12(22
306.0366.0ftx ==
GENERAL–AnalysisofReportNo.GRI–00/0189on“AModelforSizingHighConsequenceAreasAssociatedwithNaturalGasPipelines” Page37
12. Two fireball models and two thermal loads and the calculated hazardous distances were within 24% of each other.
Recommended Models for Pipeline Ruptures The potential hazards of a pipeline rupture should be based on the following criteria:
1. Fireball from delayed ignition. 2. Heat intensity that would impede escape from the area of the fire. 3. Heat intensity that would cause clothing to ignite. 4. Heat intensity that causes buildings to ignite. 5. Heat intensity for 1% mortality. 6. Heat intensity for 50% chance of mortality. 7. Heat intensity for 100% chance of mortality. 8. Heat intensity for second degree burns.
The hazards of initial high heat intensity for short periods need to be compared to lesser sustained heat for long periods. The models should also cover the effects of age groups and clothing protection of the public exposed to gas pipeline ruptures. Use of Fireball Model for Ruptured Pipelines The fireball model should consider the mass of gas lost during the initial rupture and the amount of gas initially released from each end of the pipeline until the gas is ignited. A reasonable estimate is needed for delayed ignition of the escaping gas. C-FT dismissed the hazard of a flash fire or fireball with the following rationale:
1. The possibility of a significant flash fire resulting from delayed remote ignition is extremely low due to the buoyant nature of the vapor, which generally precludes the formation of a persistent
GENERAL–AnalysisofReportNo.GRI–00/0189on“AModelforSizingHighConsequenceAreasAssociatedwithNaturalGasPipelines” Page38
flammable vapor cloud.
2. In the event of line rupture, a mushroom-shaped gas cloud will form and then grow in size and rise due to discharge momentum and buoyancy.
3. If ignition occurs before the initial fireball disperses, the flammable vapor will burn as a rising and expanding fireball before it decays into a sustained jet or trench fire.
4. If ignition is slightly delayed, only a jet or trench fire will develop.
5. The added effect on people and property of an initial transient fireball can be accounted for by overestimating the intensity of the sustained jet or trench fire that remains following the dissipation of the fireball.
6. A trench fire is essentially a jet fire in which the discharging gas jet impinges upon an opposing jet and/or the side of the crater formed in the ground.
7. Impingement dissipates some of the momentum in the escaping gas and directs the jet upward, thereby producing a fire with a horizontal profile that is generally wider, shorter and more vertical in orientation, than would be the case for a directed and unobstructed jet.
8. The total ground area affected can, therefore, be greater for a trench fire than an unobstructed jet fire, because more of the heat-radiating flame surface will typically be concentrated near the ground.
9. An estimate of the ground area affected by a credible worst-case failure event can, therefore, be obtained from a model that characterizes the heat intensity associated with a rupture failure of the pipe, where the escaping gas is assumed to feed a sustained trench fire that ignites very soon after line failure.
10. Because the size of the fire will depend on the rate at which fuel is fed to the fire, it follows that the fire intensity and the corresponding size of the affected area will depend on the effective rate of the gas
GENERAL–AnalysisofReportNo.GRI–00/0189on“AModelforSizingHighConsequenceAreasAssociatedwithNaturalGasPipelines” Page39
release.
11. The release rate can be shown to depend on the pressure differential and the hole size.
12. For guillotine-type failures where the effective hole size is equal to the line diameter, the governing parameters are, therefore, the line diameter and the pressure at the time of failure.
13. Given the wide range of actual pipeline sizes and operating pressures, a meaningful fire hazard model should explicitly acknowledge the impact of these parameters on the area affected.
Analyses of the above comments in the C-FT report are:
1. The buoyant nature of the natural gas vapor should not be a factor unless there is vertical momentum of the gas such as with a vertical flare. However, with a trench fire and two opposing jets in a trench, there should be little initial vertical momentum to the escaping gas. However, there will be significant turbulence and mixing with the air near the ground level.
2. A cloud of some shape, not necessarily “mushroom-shaped” will form and grow in size as indicated by the C-FT.
3. The C-FT report indicates that a fireball can ignite before the gas disperses, and will rise and expand as a fireball.
4. It is assumed in the C-FT report that ignition will only be slightly delayed after the rupture and only a trench or jet fire will develop.
5. The C-FT model did not over estimate the intensity of the fire to account for an initial transient fireball.
6. Although a trench fire is discussed in the C-FT report, only an unlikely vertical jet fire was modeled.
GENERAL–AnalysisofReportNo.GRI–00/0189on“AModelforSizingHighConsequenceAreasAssociatedwithNaturalGasPipelines” Page40
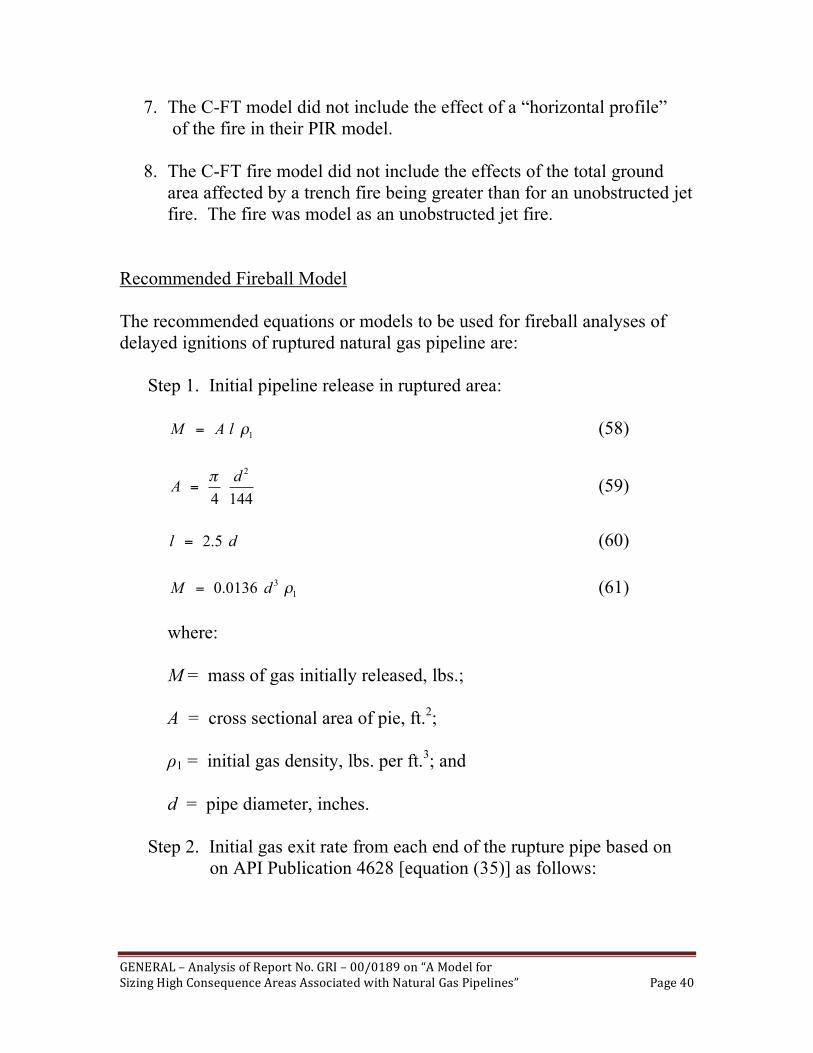
7. The C-FT model did not include the effect of a “horizontal profile” of the fire in their PIR model.
8. The C-FT fire model did not include the effects of the total ground area affected by a trench fire being greater than for an unobstructed jet fire. The fire was model as an unobstructed jet fire.
Recommended Fireball Model The recommended equations or models to be used for fireball analyses of delayed ignitions of ruptured natural gas pipeline are: Step 1. Initial pipeline release in ruptured area:
1!lAM = (58)
1444
2d
A!
= (59)
dl 5.2= (60)
1
30136.0 !dM = (61)
where: M = mass of gas initially released, lbs.; A = cross sectional area of pie, ft.2; ρ1 = initial gas density, lbs. per ft.3; and d = pipe diameter, inches. Step 2. Initial gas exit rate from each end of the rupture pipe based on on API Publication 4628 [equation (35)] as follows:
GENERAL–AnalysisofReportNo.GRI–00/0189on“AModelforSizingHighConsequenceAreasAssociatedwithNaturalGasPipelines” Page41
5.0
1
1
11
2
1
23714.0
!!!
"
#
$$$
%
&
'(
)*+
,
+=
''(
)**+
,
-
+
k
k
mk
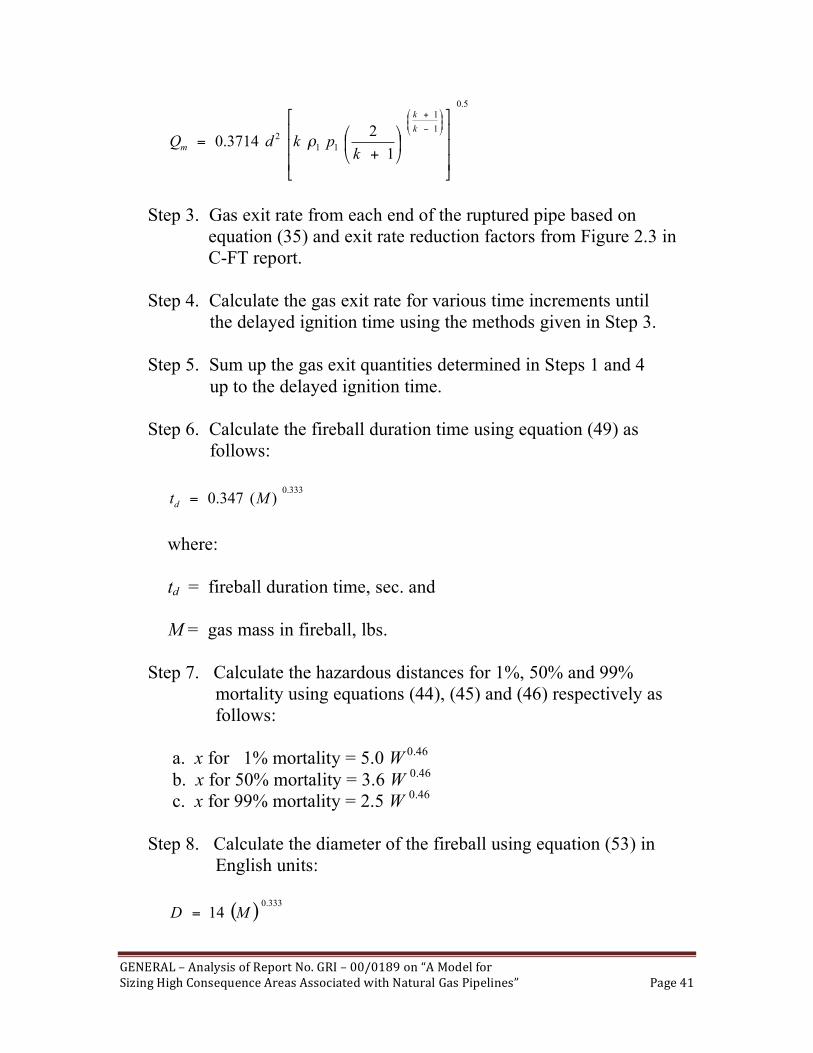
pkdQ .
Step 3. Gas exit rate from each end of the ruptured pipe based on
equation (35) and exit rate reduction factors from Figure 2.3 in C-FT report.
Step 4. Calculate the gas exit rate for various time increments until the delayed ignition time using the methods given in Step 3. Step 5. Sum up the gas exit quantities determined in Steps 1 and 4 up to the delayed ignition time. Step 6. Calculate the fireball duration time using equation (49) as follows: 333.0
)(347.0 Mtd=
where: td = fireball duration time, sec. and M = gas mass in fireball, lbs. Step 7. Calculate the hazardous distances for 1%, 50% and 99% mortality using equations (44), (45) and (46) respectively as follows: a. x for 1% mortality = 5.0 W 0.46 b. x for 50% mortality = 3.6 W 0.46 c. x for 99% mortality = 2.5 W 0.46 Step 8. Calculate the diameter of the fireball using equation (53) in English units: ( )
333.0
14 MD =
GENERAL–AnalysisofReportNo.GRI–00/0189on“AModelforSizingHighConsequenceAreasAssociatedwithNaturalGasPipelines” Page42
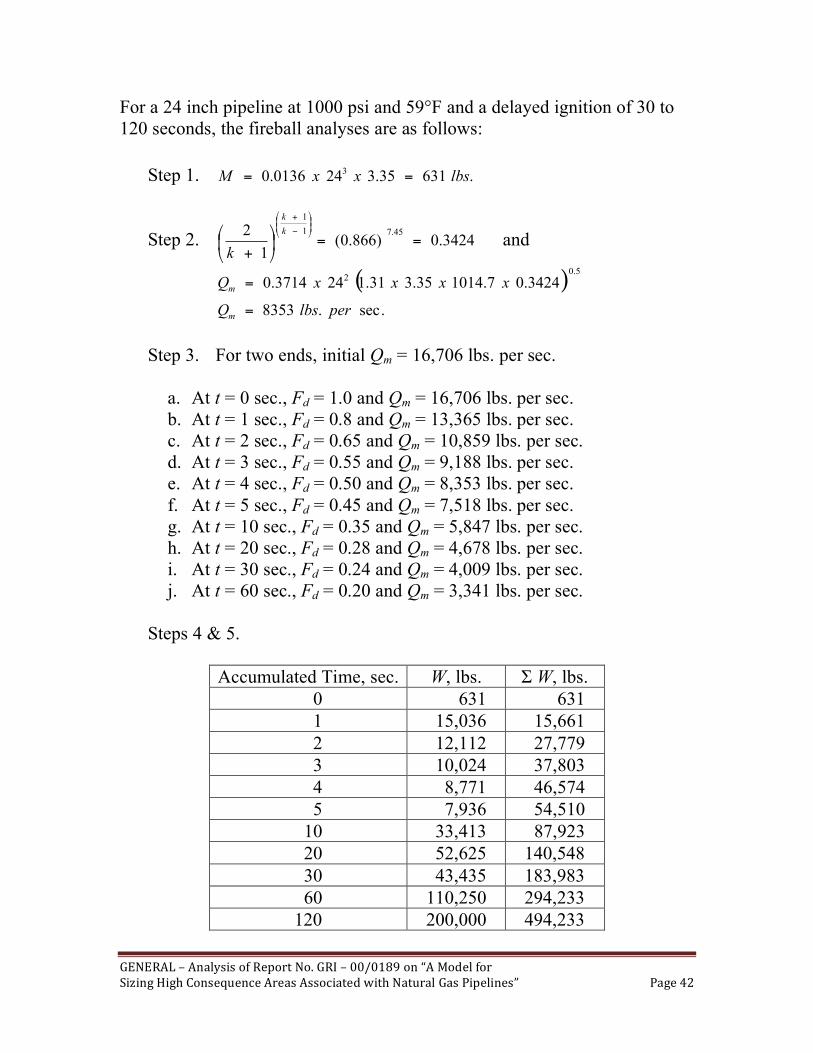
For a 24 inch pipeline at 1000 psi and 59°F and a delayed ignition of 30 to 120 seconds, the fireball analyses are as follows: Step 1. .63135.3240136.0
3lbsxxM ==
Step 2. 3424.0)866.0(1
2 45.71
1
==!"
#$%
&
+
!!"
#$$%
&
'
+
k
k
k and
( ).sec.8353
3424.07.101435.331.1243714.05.0
2
perlbsQ
xxxxQ
m
m
=
=
Step 3. For two ends, initial Qm = 16,706 lbs. per sec.
a. At t = 0 sec., Fd = 1.0 and Qm = 16,706 lbs. per sec. b. At t = 1 sec., Fd = 0.8 and Qm = 13,365 lbs. per sec. c. At t = 2 sec., Fd = 0.65 and Qm = 10,859 lbs. per sec. d. At t = 3 sec., Fd = 0.55 and Qm = 9,188 lbs. per sec. e. At t = 4 sec., Fd = 0.50 and Qm = 8,353 lbs. per sec. f. At t = 5 sec., Fd = 0.45 and Qm = 7,518 lbs. per sec. g. At t = 10 sec., Fd = 0.35 and Qm = 5,847 lbs. per sec. h. At t = 20 sec., Fd = 0.28 and Qm = 4,678 lbs. per sec. i. At t = 30 sec., Fd = 0.24 and Qm = 4,009 lbs. per sec. j. At t = 60 sec., Fd = 0.20 and Qm = 3,341 lbs. per sec.
Steps 4 & 5.
Accumulated Time, sec. W, lbs. Σ W, lbs. 0 631 631 1 15,036 15,661 2 12,112 27,779 3 10,024 37,803 4 8,771 46,574 5 7,936 54,510 10 33,413 87,923 20 52,625 140,548 30 43,435 183,983 60 110,250 294,233 120 200,000 494,233
GENERAL–AnalysisofReportNo.GRI–00/0189on“AModelforSizingHighConsequenceAreasAssociatedwithNaturalGasPipelines” Page43
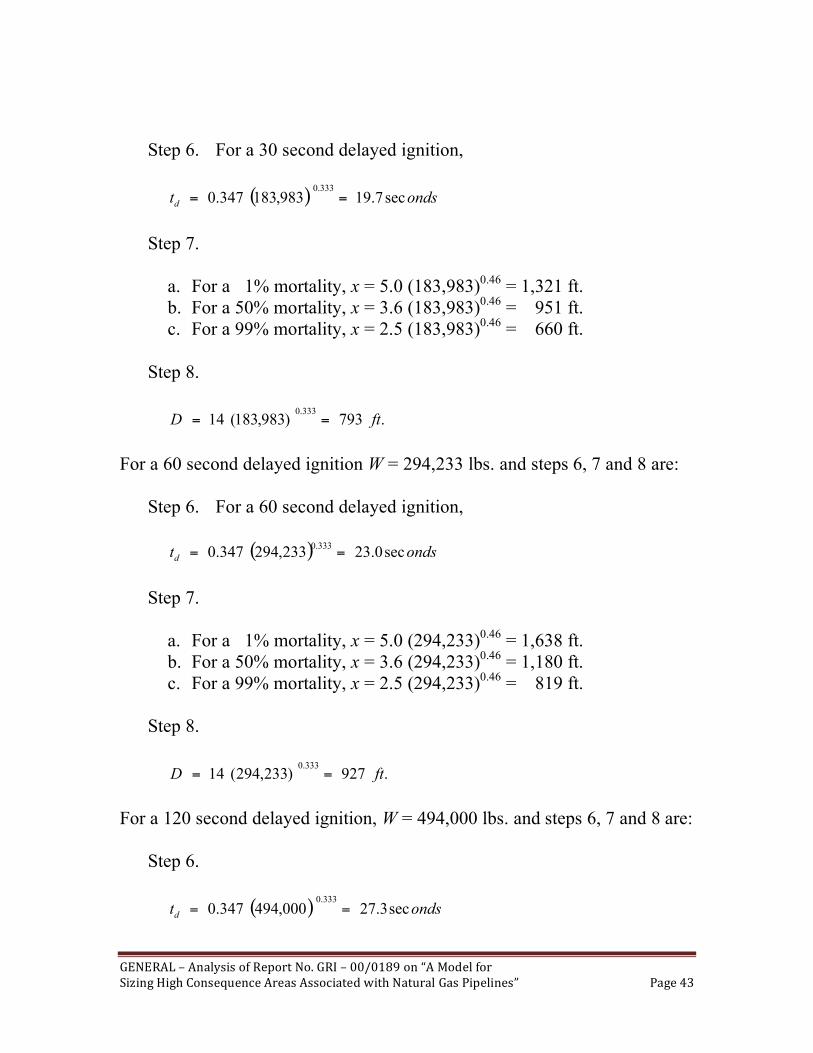
Step 6. For a 30 second delayed ignition, ( ) ondst
dsec7.19983,183347.0
333.0
== Step 7.
a. For a 1% mortality, x = 5.0 (183,983)0.46 = 1,321 ft. b. For a 50% mortality, x = 3.6 (183,983)0.46 = 951 ft. c. For a 99% mortality, x = 2.5 (183,983)0.46 = 660 ft.
Step 8. .793)983,183(14
333.0ftD ==
For a 60 second delayed ignition W = 294,233 lbs. and steps 6, 7 and 8 are: Step 6. For a 60 second delayed ignition, ( ) ondst
dsec0.23233,294347.0
333.0==
Step 7.
a. For a 1% mortality, x = 5.0 (294,233)0.46 = 1,638 ft. b. For a 50% mortality, x = 3.6 (294,233)0.46 = 1,180 ft. c. For a 99% mortality, x = 2.5 (294,233)0.46 = 819 ft.
Step 8. .927)233,294(14
333.0ftD ==
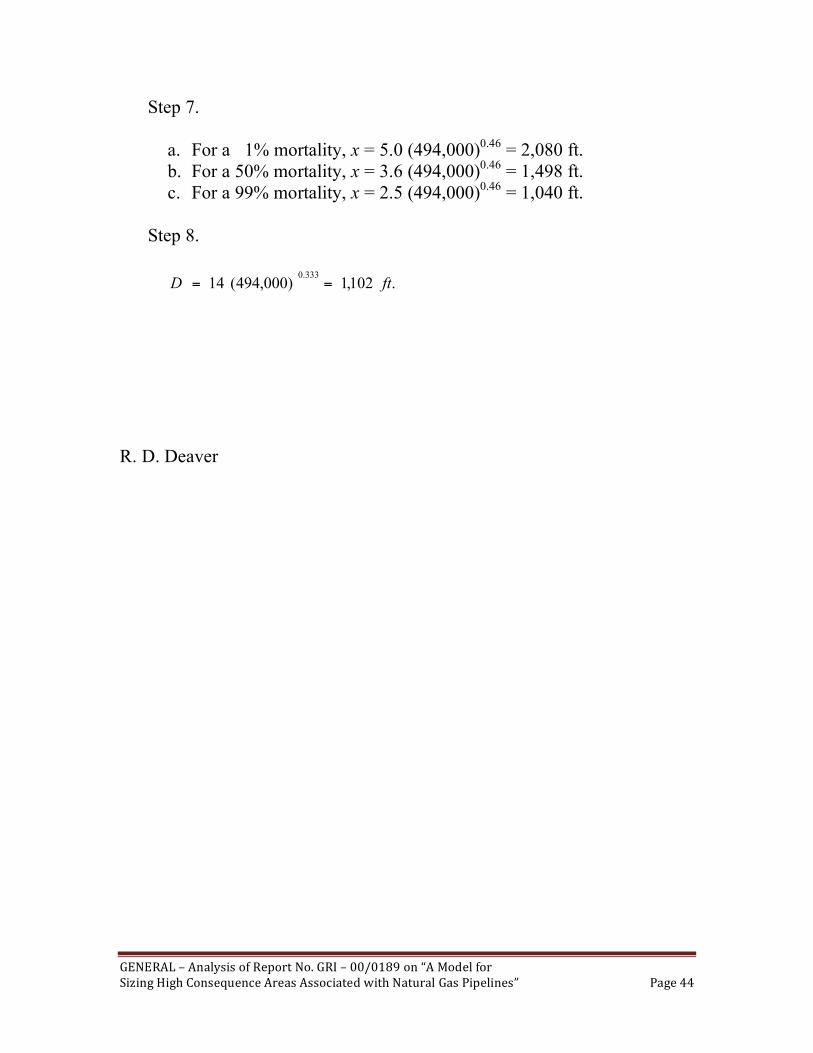
For a 120 second delayed ignition, W = 494,000 lbs. and steps 6, 7 and 8 are: Step 6. ( ) ondst
dsec3.27000,494347.0
333.0
==
GENERAL–AnalysisofReportNo.GRI–00/0189on“AModelforSizingHighConsequenceAreasAssociatedwithNaturalGasPipelines” Page44
Step 7.
a. For a 1% mortality, x = 5.0 (494,000)0.46 = 2,080 ft. b. For a 50% mortality, x = 3.6 (494,000)0.46 = 1,498 ft. c. For a 99% mortality, x = 2.5 (494,000)0.46 = 1,040 ft.
Step 8. .102,1)000,494(14
333.0ftD ==
R. D. Deaver