Embed Size (px)
Citation preview

Dear Clients and Colleagues,
Every year, Bancography publishes an Outlook for the financial services industry, examining deposit, demographic, and economic trends across the U.S.
This year as we were preparing to publish the 2020 iteration of our Outlook, the COVID-19 crisis arose, upending all projections for the U.S. economy, including the banking sector.
The seismic changes wrought by the crisis will impact deposit and loan demand, credit quality, and channel use; and amidst the uncertainty, one prediction seems inarguable: 2020 will look starkly different than the past few years. Thus, the 2020 Outlook discusses the industry’s recent performance, but also poses some hypotheses as to what the future holds and how bankers can prepare (starting on page 34).
As you review the report, contact us with any questions. Thanks, as always, for your confidence in Bancography.

33
• Most data are presented in two groups:
– For the 30 largest metropolitan areas in the U.S.– For the 30 top-ranking markets on the specific attribute, among all U.S.
metros with at least 500,000 residents; this threshold impounds 107 metros
• The top 30 metros encompass:
– 45% of U.S. residents and 50% of U.S. deposits
• The 110 metros with population > 500,000 encompass:
– 69% of U.S. residents and 72% of U.S. deposits
• Need information on a market that’s not in the study or a measure that’s not included? Let us know, and we’ll send the statistics you need.
INDUSTRY OUTLOOK: ANALYTIC FRAMEWORK

44
• Data include both banks and credit unions.
• Note that substantial corporate and public funds deposits at large main offices can skew deposit statistics. To counter this, all calculations truncate individual branch deposits at $250M; i.e., any branch that owns more than $250M in deposits is given credit for only $250M in the deposit summary calculations. The resulting statistics offer a plausible estimate of retail and small business deposits.
• Note also that large office balance variances tend to smooth over time, so the four-year trend graphs may be more useful than the one-year graphs.
• Deposit and branch statistics reflect the June 30, 2019 FDIC and NCUA releases. Product demand data are from the Federal Reserve Board’s December, 2019 Flow of Funds Accounts report. All demographics are from EASI Demographics, June 2019. Other data sources are noted on the specific slides.
SOURCES, NOTES, ETC.

5

66
NATIONAL DEPOSIT GROWTH TRENDS
Retail and small business deposits grew by 3.0% in the past year, the second consecutive year in which the growth rate declined, and the slowest pace since 2014. Total deposits grew by 4.3%, eking past 2018’s pace but still the second-lowest level since the recession. The lagging deposit growth may reflect competition from a robust stock market, fatigue at rates that have hovered at historic lows for years, unusually tepid real wage growth given the low unemployment rate, and businesses drawing down cash supplies for investment during a strong economic period.
60%
1%
2%
3%
4%
5%
6%
7%
8%
9%
2009 2010 2011 2012 2013 2014 2015 2016 2017 2018 2019
% Deposit change, total
% Deposit change, retail / small business

77
0%
1%
2%
3%
4%
5%
6%
7%
8%
9%
10%W
ashi
ngto
nAu
stin
Char
lotte
Orla
ndo
Las
Vega
sSa
n An
toni
oPh
oeni
xTa
mpa
Cinc
inna
tiSt
. Lou
isSe
attle
Bost
onDe
nver
Sacr
amen
toDa
llas
Mia
mi
Min
neap
olis
Phila
delp
hia
Rive
rsid
eAt
lant
aSa
n Fr
anci
sco
Chic
ago
Los
Ange
les
Portl
and
San
Dieg
oBa
ltim
ore
Detro
itPi
ttsbu
rgh
New
Yor
kHo
usto
n
2018 - 2019
2017 - 2018
Washington DC, Austin, Chicago and Orlando posted deposit growth of more than 5% over the past year, but Houston, New York and Pittsburgh languished at 2% or less. Las Vegas joined Orlando and Washington in ranking among the top-five deposit growth markets in both 2018 and 2019. Only six of the top-30 metros posted greater deposit growth in 2019 than in the year prior. 7
DEPOSIT CHANGE (%), TWO-YEAR COMPARISONTop-30 MSAs
88
$0
$2
$4
$6
$8
$10
$12
$14
$16W
ashi
ngto
nLo
s An
gele
sN
ew Y
ork
Bost
onCh
icag
oM
iam
iDa
llas
San
Fran
cisc
oPh
ilade
lphi
aSe
attle
Phoe
nix
Atla
nta
Tam
paAu
stin
St. L
ouis
Denv
erOr
land
oM
inne
apol
isCh
arlo
tteSa
n An
toni
oDe
troit
Sacr
amen
toCi
ncin
nati
San
Dieg
oLa
s Ve
gas
Rive
rsid
eBa
ltim
ore
Portl
and
Pitts
burg
hHo
usto
n
$ Bi
llion
s
2018 - 2019
2017 - 2018
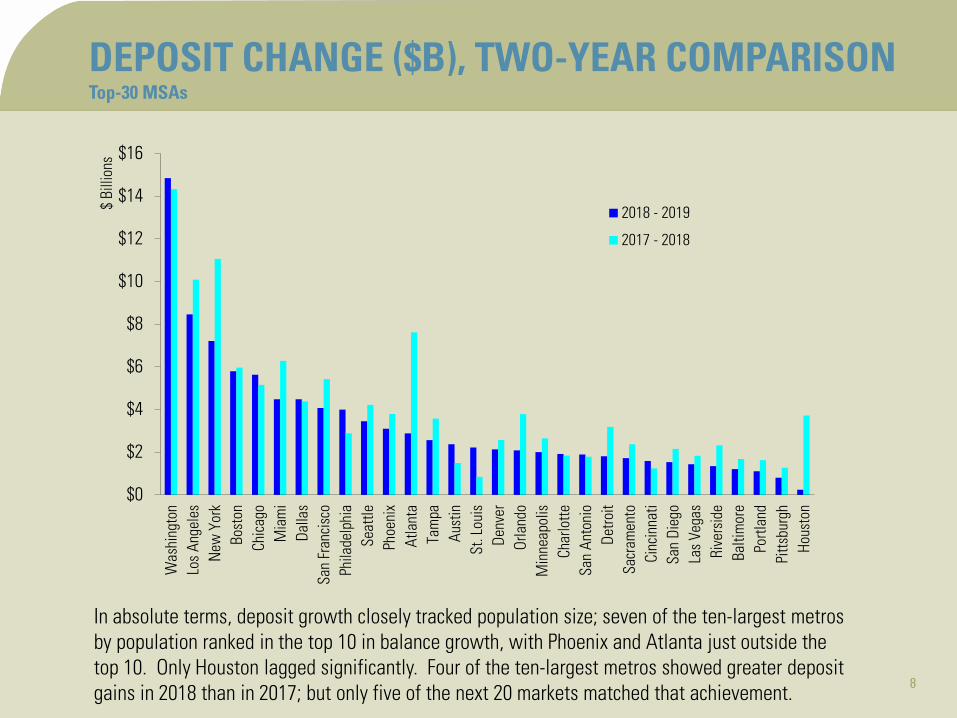
DEPOSIT CHANGE ($B), TWO-YEAR COMPARISONTop-30 MSAs
In absolute terms, deposit growth closely tracked population size; seven of the ten-largest metros by population ranked in the top 10 in balance growth, with Phoenix and Atlanta just outside the top 10. Only Houston lagged significantly. Four of the ten-largest metros showed greater deposit gains in 2018 than in 2017; but only five of the next 20 markets matched that achievement. 8

99
$0
$2
$4
$6
$8
$10
$12
$14
$16
0%
1%
2%
3%
4%
5%
6%
7%
8%Ja
ckso
nvill
e, F
LSa
lt La
ke C
ity, U
TOg
den,
UT
Delto
na, F
LBo
ise,
IDAl
bany
, NY
Prov
o, U
TW
ashi
ngto
nAu
stin
Chat
tano
oga,
TN
Win
ston
-Sal
em, N
CPo
ughk
eeps
ie, N
YLe
ton,
KY
Durh
am, N
CAk
ron,
OH
Lans
ing,
MI
Spok
ane,
WA
Lanc
aste
r, PA
Albu
quer
que,
NM
Rale
igh,
NC
Nas
hvill
e, T
NM
cAlle
n, T
XCh
arlo
tteLa
kela
nd, F
LOr
land
oCo
lora
do S
prin
gsFa
yette
ville
, AR
Okla
hom
a Ci
tyPo
rtlan
d, M
EPr
ovid
ence
, RI
% Deposit growth
Deposit change ($B)
DEPOSIT CHANGE (%), 2018 - 2019Top-30 MSAs among all metros with population > 500,000
Of the 30 fastest-growing deposit markets among all large and mid-sized U.S. metros, four are in Florida, four are in North Carolina, and three are in Utah. Although the Southeast hosts the greatest number of top-ranking metros, all regions of the country are represented on the list of top-growth markets, e.g., Portland ME, Boise ID, Lansing MI, Albuquerque NM. 9
1010
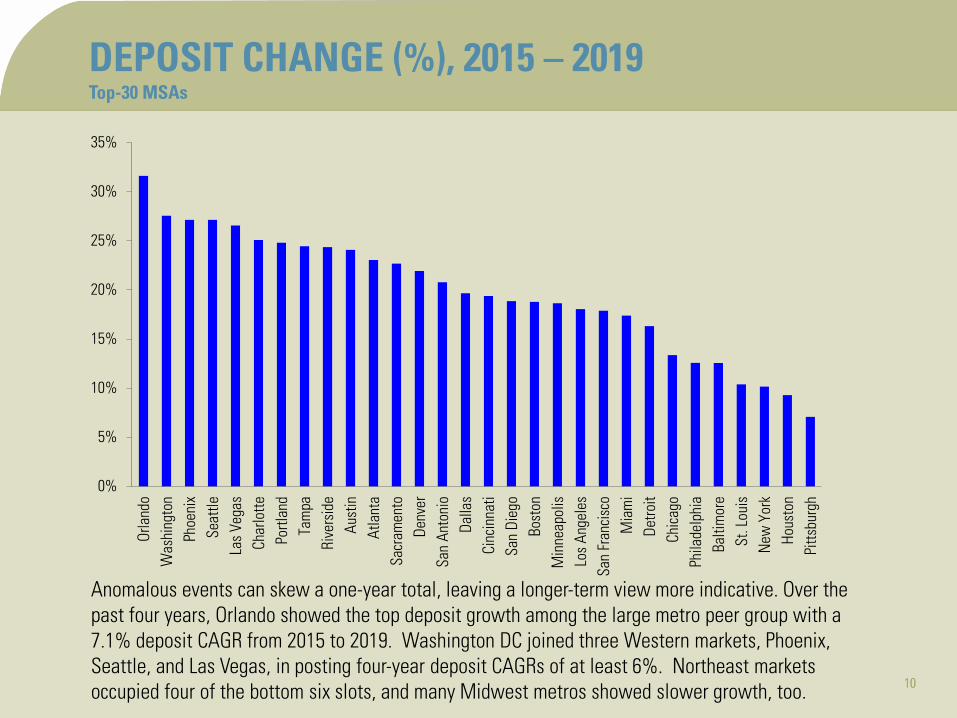
DEPOSIT CHANGE (%), 2015 – 2019Top-30 MSAs
Anomalous events can skew a one-year total, leaving a longer-term view more indicative. Over the past four years, Orlando showed the top deposit growth among the large metro peer group with a 7.1% deposit CAGR from 2015 to 2019. Washington DC joined three Western markets, Phoenix, Seattle, and Las Vegas, in posting four-year deposit CAGRs of at least 6%. Northeast markets occupied four of the bottom six slots, and many Midwest metros showed slower growth, too.
0%
5%
10%
15%
20%
25%
30%
35%Or
land
oW
ashi
ngto
nPh
oeni
xSe
attle
Las
Vega
sCh
arlo
ttePo
rtlan
dTa
mpa
Rive
rsid
eAu
stin
Atla
nta
Sacr
amen
toDe
nver
San
Anto
nio
Dalla
sCi
ncin
nati
San
Dieg
oBo
ston
Min
neap
olis
Los
Ange
les
San
Fran
cisc
oM
iam
iDe
troit
Chic
ago
Phila
delp
hia
Balti
mor
eSt
. Lou
isN
ew Y
ork
Hous
ton
Pitts
burg
h
10

1111
$0
$10
$20
$30
$40
$50
$60Lo
s An
gele
sN
ew Y
ork
Was
hing
ton
Chic
ago
Bost
onM
iam
iSa
n Fr
anci
sco
Dalla
sSe
attle
Atla
nta
Phila
delp
hia
Phoe
nix
Detro
itTa
mpa
San
Dieg
oM
inne
apol
isDe
nver
Hous
ton
Orla
ndo
Rive
rsid
ePo
rtlan
dSa
cram
ento
Char
lotte
Aust
inSa
n An
toni
oLa
s Ve
gas
Cinc
inna
tiBa
ltim
ore
St. L
ouis
Pitts
burg
h
$ Bi
llion
s
DEPOSIT CHANGE ($B), 2015 – 2019Top-30 MSAs
The largest metros by population also showed the top absolute gains, with every top-ten metro by population except Houston ranking among the top 12 by deposit change. Note the two-fold disparity between the top-three markets and the next-ranking tier. Each of the top-30 metros showed net positive deposit growth from four years prior, with every market but Pittsburgh reporting deposits at least $6B greater in 2019 than in 2015. 11

1212
DEPOSIT CHANGE (%), 2015 – 2019Top-30 MSAs among all metros with population > 500,000
The 30 top deposit growth markets (among all mid-sized and large U.S. metros) includes five markets in Florida and three each in California, North Carolina, and Utah. Southern and Western markets dominate the list, with only Portland ME representing the Northeast region and only Grand Rapids MI and Indianapolis the Midwest.
10%
15%
20%
25%
30%
35%
40%Og
den,
UT
Prov
o, U
TSa
nta
Rosa
, CA
Orla
ndo
Bois
e, ID
Durh
am, N
CPo
rtlan
d, M
ELa
kela
nd, F
LCo
lora
do S
prin
gsRa
leig
h, N
CW
ashi
ngto
nPh
oeni
xSe
attle
Las
Vega
sSp
okan
e, W
AGr
and
Rapi
ds, M
ISt
ockt
on, C
AFa
yette
ville
, AR
Jack
sonv
ille,
FL
Poug
hkee
psie
, NY
Char
lotte
Indi
anap
olis
Char
lest
on, S
CPo
rtlan
d, O
RTa
mpa
Rive
rsid
eSa
lt La
ke C
ity, U
TAu
stin
Palm
Bay
, FL
Atla
nta
12

1313
CONSUMER BALANCE SHEET TRENDS
In 2008 consumers held 38% of their bank deposits in CDs. But the recession ushered in a precipitous decline in CD preferences, and by 2016 consumers had reallocated their balance sheets such that only 14% of their deposits were in CDs. The trend away from CDs finally reversed in 2017, inching upward to 15% that year and toward 16% in 2018 and 2019, but the product mix of U.S. banks still remains vastly different than in the pre-recession years.
13
0%
5%
10%
15%
20%
25%
30%
35%
40%
45%
2000
2001
2002
2003
2004
2005
2006
2007
2008
2009
2010
2011
2012
2013
2014
2015
2016
2017
2018
2019
CDs
as a
% o
f tot
al d
epos
its

1414
CONSUMER BALANCE SHEET TRENDS
The economic recovery that started in 2011 quickly brought auto loans back to pre-recession levels, with borrowings surpassing prior peak levels in 2013. But credit card borrowing did not surpass pre-recession lows until 2017. Both product types have shown steady year-over-year gains since 2015.
14
0
200
400
600
800
1,000
1,200
1,400
2000
2001
2002
2003
2004
2005
2006
2007
2008
2009
2010
2011
2012
2013
2014
2015
2016
2017
2018
2019
Loan
bal
ance
s ($B
)
Auto loans
Credit card loans

1515
CONSUMER BALANCE SHEET TRENDS
Home equity borrowing continued a pattern of erosion that started during the recession and has yet to abate, and aggregate home equity balances are less than half the level of 2008. The decline in home equity borrowing more than offset the combined increase in credit card and equity borrowing, so non-mortgage consumer borrowing remains below pre-recession levels. Home equity line utilization has also declined in recent years, and the average U.S. home equity line now carries balances representing 43% of its credit line, versus a peak of 57% in 2010 and 2011.
15
0
200
400
600
800
1,000
1,200
0%
10%
20%
30%
40%
50%
60%
2000
2001
2002
2003
2004
2005
2006
2007
2008
2009
2010
2011
2012
2013
2014
2015
2016
2017
2018
2019
Equi
ty b
alan
ces (
$B)
% U
tiliza
tion
% utilization of equity lines
Equity loans and lines
1616
CONSUMER BALANCE SHEET TRENDS
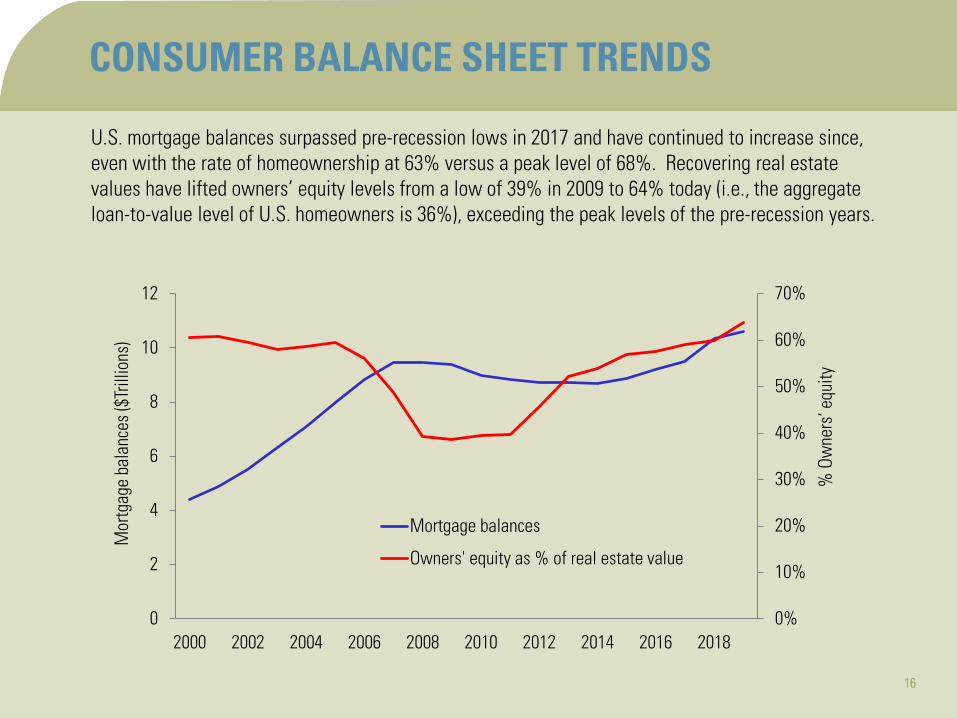
U.S. mortgage balances surpassed pre-recession lows in 2017 and have continued to increase since, even with the rate of homeownership at 63% versus a peak level of 68%. Recovering real estate values have lifted owners’ equity levels from a low of 39% in 2009 to 64% today (i.e., the aggregate loan-to-value level of U.S. homeowners is 36%), exceeding the peak levels of the pre-recession years.
16
0%
10%
20%
30%
40%
50%
60%
70%
2000 2002 2004 2006 2008 2010 2012 2014 2016 20180
2
4
6
8
10
12
% O
wne
rs’ e
quity
Mor
tgag
e ba
lanc
es ($
Trill
ions
)
Mortgage balances
Owners' equity as % of real estate value

1717
BRANCH DEPOSIT GROWTH
17
Over the past four years and in the last year specifically, credit unions showed greater growth in retail and small business deposits than any tier of commercial banks. Among the banks, community banks with assets less than $1B outpaced all other tiers of the industry in the past year. But over a four-year horizon, most tiers showed similar 3% - 4% CAGRs, with only the $20B - $100B lagging. The lesser performance in that regional-dominant tier could reflect the challenges of operating in a middle ground, lagging national banks on branch breadth but outflanked by smaller banks on personal service levels.
0%
1%
2%
3%
4%
5%
6%
7%
< $1B $1B - $20B $20B - $100B > $100B Credit Unions
Deposit growth, 2018 - 2019Four year deposit CAGR, 2015 - 2019
Banks, by total assets

1818
BRANCH DEPOSIT GROWTH
The median deposit change among mature (open at least five years) freestanding branches last year was $1.3M. That statistic has hovered between $700m and $1.8M over the past eight years, confirming the difficulty of generating deposit growth once a branch leaves its startup phase. The $3M point offers a good boundary for demarcating top-tier performance, as in recent years only about one in three branches have surpassed that level in deposit growth.
18
0%
5%
10%
15%
20%
25%
30%
35%
40%
45%
$0
$200
$400
$600
$800
$1,000
$1,200
$1,400
$1,600
$1,800
$2,000
2007 2008 2009 2010 2011 2012 2013 2014 2015 2016 2017 2018 2019
Median deposit change, mature branches ($000s)
% Branches with deposit change > $3M

1919
BRANCH DEPOSIT GROWTH
Of all branches that opened in 2013 – 2016, the latest three-year cohort (i.e., the most recent such group with a full five-year deposit reporting history) showed median deposits of $23M on their fifth anniversary; with 23% exceeding $40M in deposits by the five-year point. Note the upward slope of the top decile group, as compared to the concave-down shape of the median; the absolute most successful branches continue to thrive at the five-year point, even as the median branches appear to reach a plateau. 19
-
10
20
30
40
50
60
70
1 2 3 4 5
Depo
sits
($ m
illio
ns)
Years open
90th percentile75th percentileMedian

2020
BRANCHING ACTIVITY OF U.S. BANKS
2019 was the sixth consecutive year in which aggregate U.S. branch counts declined, and the ninth such year in the past 10. The net changes understate the magnitude of branch closures, but also do not imply a cessation of new-branch development. Rather, the 1,240 branch decline in the past year represents the net impact of about 2,400 branch closures, offset by more than 1,100 new-branch openings; and each of the past five years has seen 800 to 1,100 new branches open nationwide.
20(3,000)
(2,000)
(1,000)
0
1,000
2,000
3,000
4,000
5,000
6,000
2005 2006 2007 2008 2009 2010 2011 2012 2013 2014 2015 2016 2017 2018 2019
Total opens
Total closes
Net opens

2121
BRANCHING ACTIVITY OF U.S. BANKS
Banks and credit unions combined to shed a net 1,240 branches over the past year, and 6,100 branches over the past four years. The four-year decline represents 6% contraction from 2014 levels, and the count of 103,000 branches nationwide sits 9% below the peak levels of 2010.
21
60,000
70,000
80,000
90,000
100,000
110,000
120,00020
05
2006
2007
2008
2009
2010
2011
2012
2013
2014
2015
2016
2017
2018
2019
Tota
l US
bran
ches

2222
BRANCHING ACTIVITY OF U.S. BANKS
• The bank side of the industry remains more concentrated than the credit union side, due to the greater geographic reach of the largest banks. The ten-largest branch networks now hold one-third of all U.S. bank branches; and concentration continues through the next tier of institutions, as the 50 largest branch networks account for more than half of all U.S. bank branches. Just 250 of the nation’s 5,300 banks own nearly 70% of the industry’s total branches.
• The credit union side of the industry remains much less concentrated, as the ten-largest credit union networks hold only 6% of credit union branches, and even the 250 largest networks impound only 35% of credit union branches.

2323
BRANCHING ACTIVITY OF U.S. BANKS
0
5
10
15
20
25
30
35
40
45
1 2 3 4 5 6 7 8 9 10 10+
Dep
osits
$M
Within ‘X’ miles of nearest surviving branch 2018
2019
Branch closures continue to focus on ‘easy wins’: the farther removed from a surviving branch, the smaller the closed branches, as bankers will risk only small deposit bases without a nearby option to ensure retention. The average deposits of branches closed in 2019 within 2 miles of a surviving branch approached $45M. But that average declines in lockstep with distance; for example, branches closed within 2 – 3 miles of a surviving branch averaged $37M in deposits; at 4 – 5 miles, $27M; by 10 miles or more, only $22M. Note though, the average deposits of closed branches ticked upward from 2019 in the closest tiers, so banks are in effect taking on more risk in their close-proximity closures.

2424
BRANCH CONCENTRATION
The closures have yielded a less concentrated branch environment. Across the U.S., there is now one branch for every 1,210 households, compared to one for every 1,030 households five years ago. Branch concentration remains higher in long-established Midwest and Northeast metros: Pittsburgh, St. Louis, Boston and Cincinnati all contain one branch for every 1,000 households. In contrast, Riverside and Las Vegas show ratios near 2,000 households per branch. Most large metros remain less concentrated than the national median, offset by smaller metros and rural markets that are considerably more concentrated.
U.S. overall
0
200
400
600
800
1,000
1,200
1,400
1,600
1,800
2,000
2,200Ri
vers
ide
Las
Vega
s
Phoe
nix
Sacr
amen
to
San
Anto
nio
Atla
nta
Tam
pa
Los
Ange
les
San
Dieg
o
Orla
ndo
Denv
er
Char
lotte
San
Fran
cisc
o
Min
neap
olis
Seat
tle
Aust
in
Dalla
s
Portl
and
Mia
mi
Hous
ton
Balti
mor
e
Detro
it
New
Yor
k
Was
hing
ton
Phila
delp
hia
Chic
ago
Cinc
inna
ti
Bost
on
St. L
ouis
Pitts
burg
h
24

2525
DEPOSITS PER HOUSEHOLDTop-30 MSAs
The larger metros show greater deposits per household, with seven of the ten-largest metros by population also ranking in the top 10 on this measure. This likely reflects the greater concentration of business deposits in those large-market branches, in addition to a general correlation between market size and affluence.
$0
$20,000
$40,000
$60,000
$80,000
$100,000
$120,000Au
stin
New
Yor
kM
iam
iW
ashi
ngto
nLo
s An
gele
sCh
icag
oSa
n Fr
anci
sco
Phoe
nix
Balti
mor
eCh
arlo
tteAt
lant
aSe
attle
Min
neap
olis
Las
Vega
sDe
troit
Rive
rsid
eBo
ston
Sacr
amen
toSa
n An
toni
oSt
. Lou
isDe
nver
Dalla
sPo
rtlan
dTa
mpa
Cinc
inna
tiPi
ttsbu
rgh
Hous
ton
Orla
ndo
San
Dieg
oPh
ilade
lphi
a
25

2626
MEDIAN HOUSEHOLD INCOMETop-30 MSAs among all metros with population > 500,000
Three U.S. metros show median income of more than $100,000: Washington DC, San Jose and Bridgeport (CT). The 10 most affluent metros are all in coastal regions, with the top interior market, Minneapolis, ranking 12th.
$0
$20,000
$40,000
$60,000
$80,000
$100,000
$120,000W
ashi
ngto
nSa
n Jo
se, C
ABr
idge
port,
CT
San
Fran
cisc
oOx
nard
, CA
Bost
onPo
ughk
eeps
ie, N
YBa
ltim
ore
Hartf
ord,
CT
Hono
lulu
, HI
Seat
tleM
inne
apol
isN
ew Y
ork
Wor
cest
er, M
ARa
leig
h, N
CPh
ilade
lphi
aN
ew H
aven
, CT
Denv
erOg
den,
UT
Alba
ny, N
YM
adis
on, W
ISa
n Di
ego
Chic
ago
Sant
a Ro
sa, C
ADe
s M
oine
s, IA
Rich
mon
d, V
AVi
rgin
ia B
each
Prov
o, U
TAu
stin
Atla
nta
26

2727
DEPOSITS PER HOUSEHOLDTop-30 MSAs among all metros with population > 500,000
Income translates directly into deposits; note the high overlap between the highest-income markets on the previous graph of median household income and the top deposits-per-household markets in the graph above. Six markets rank in the top 10 on both measures, and nine of the top 10 in deposits per household rank among the top 30 in median income (Los Angeles is the exception).
$0
$20,000
$40,000
$60,000
$80,000
$100,000
$120,000Ra
leig
h, N
C
San
Jose
, CA
Was
hing
ton
Brid
gepo
rt, C
T
San
Fran
cisc
o
Bost
on
New
Yor
k
Los
Ange
les
Hono
lulu
, HI
Sant
a Ro
sa, C
A
Ogde
n, U
T
Poug
hkee
psie
, NY
Salt
Lake
City
, UT
Mad
ison
, WI
Mia
mi
Hartf
ord,
CT
Alba
ny, N
Y
Chic
ago
Oxna
rd, C
A
Phila
delp
hia
San
Dieg
o
Portl
and,
ME
Sprin
gfie
ld, M
A
New
Hav
en, C
T
Seat
tle
Prov
iden
ce, R
I
Gran
d Ra
pids
, MI
Wor
cest
er, M
A
Sacr
amen
to
27

2828
Affluence is concentrated in major metros, especially along the Northeast corridor from Richmond, VA to Boston; and in the major West coast metros in California, and the Pacific Northwest. Chicago, Minneapolis, Denver and large metros in Texas rank highly, too; while the South and Appalachian regions and parts of the southwest (New Mexico, Texas border counties) remain among the least affluent areas. 28
INCOME DISTRIBUTIONMedian Household Income
2929
HOUSEHOLD CHANGE, 2014 - 2019
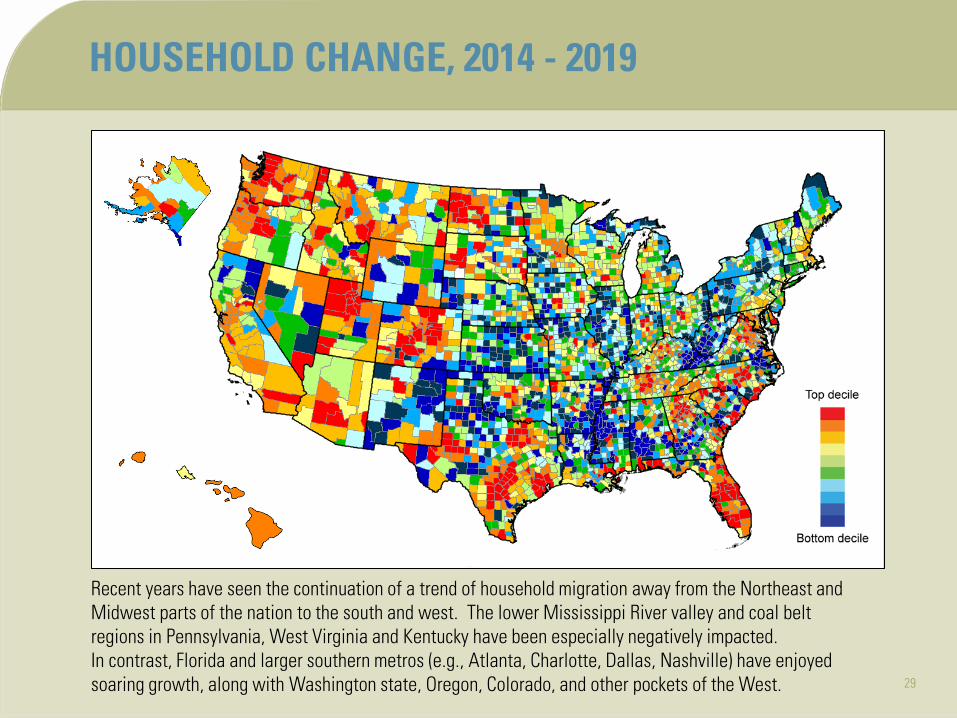
Recent years have seen the continuation of a trend of household migration away from the Northeast and Midwest parts of the nation to the south and west. The lower Mississippi River valley and coal belt regions in Pennsylvania, West Virginia and Kentucky have been especially negatively impacted. In contrast, Florida and larger southern metros (e.g., Atlanta, Charlotte, Dallas, Nashville) have enjoyed soaring growth, along with Washington state, Oregon, Colorado, and other pockets of the West. 29

3030
California and much of the Rocky Mountain region feature younger household bases, as do the major metros of the Northeast corridor and Great Lakes regions. The household base skews older in the upper Midwest and Plains states, and in most markets along the nation’s northern border. Coastal retirement areas in Florida, the Carolinas, Maine, northern Michigan, and the Washington and Oregon coasts show the oldest household bases.
30
AGE DISTRIBUTIONMedian Age (Head of Household)

3131
DEPOSITS PER BRANCHTop-30 MSAs
The top markets in terms of deposits per branch reach that status through a combination of high affluence (in terms of median income and/or deposits per household) or low-to-moderate branch concentration. The largest average branch size is thus found in markets that rank highly on both attributes (San Francisco, Los Angeles, San Diego). In Washington, New York and Boston affluence is high enough to offset greater branch concentration.
$0
$25
$50
$75
$100
$125
$150
Was
hing
ton
San
Fran
cisc
o
Los
Ange
les
New
Yor
k
Sacr
amen
to
San
Dieg
o
Mia
mi
Bost
on
Seat
tle
Las
Vega
s
Tam
pa
San
Anto
nio
Atla
nta
Denv
er
Rive
rsid
e
Phoe
nix
Chic
ago
Dalla
s
Min
neap
olis
Phila
delp
hia
Balti
mor
e
Hous
ton
Detro
it
Portl
and
Aust
in
Orla
ndo
Char
lotte
St. L
ouis
Pitts
burg
h
Cinc
inna
ti
$M
31

3232
DEPOSITS PER BRANCHTop-30 MSAs among all metros with population > 500,000
With their greater aggregate wealth, large markets capture most of the top spots in a ranking of deposits per branch. The 15 highest-ranking markets are in coastal states, and California hosts 11 of the top-30 markets in California, reflecting a combination of affluence and modest branch concentration. A small group of interior markets reach the top-tier list, including smaller markets such as Ogden and Tucson, and larger markets such as Los Angeles, San Antonio and Denver.
32
$0
$20
$40
$60
$80
$100
$120
$140
$160
$180
San
Jose
, CA
Rale
igh,
NC
Was
hing
ton
San
Fran
cisc
o
Los
Ange
les
Sant
a Ro
sa, C
A
New
Yor
k
Hono
lulu
, HI
Sacr
amen
to
San
Dieg
o
Mia
mi
Palm
Bay
, FL
Bost
on
Fres
no, C
A
Oxna
rd, C
A
Ogde
n, U
T
Seat
tle
Harri
sbur
g, P
A
Las
Vega
s
Brid
gepo
rt, C
T
Tam
pa
San
Anto
nio
Tucs
on, A
Z
Mod
esto
, CA
Stoc
kton
, CA
Atla
nta
Denv
er
Rive
rsid
e
Poug
hkee
psie
Phoe
nix
$M

3333
MINORITY POPULATION
Minority population distribution in the U.S. is highly skewed, with the greatest concentrations of minority households across the Southwest (mostly Hispanic) and the Southeast (mostly African-American). Several metros in Texas and California are now ‘majority minority,’ mandating bilingual branch staff, marketing collateral, web, ATM and mobile banking tools, and call center staff. 33

34

3535
In the three weeks ending on April 4, 2020, 17 million Americans filed first-time unemployment claims, representing 10% of the total U.S. workforce. The 6.9 million claims in the middle week of that period were more than ten-times the peak level of the financial crisis (in March 2009); and massive levels of filings will likely continue for several weeks. Even with enhanced unemployment benefits and other governmental stimulus programs, these developments, coupled with the closure of much of the retail and service sectors, will bring pervasive damage not only to consumers, but to banks and credit unions, too.
35Jan-
06
Jan-
07
Jan-
08
Jan-
09
Jan-
10
Jan-
11
Dec-
11
Dec-
12
Dec-
13
Dec-
14
Dec-
15
Dec-
16
Dec-
17
Dec-
18
Dec-
19
0
1
2
3
4
5
6
7
Wee
kly f
irst-t
ime
unem
ploy
men
t cla
ims
Milli
ons
AN UNPRECEDENTED DISRUPTION
Sour
ce: F
eder
al R
eser
ve B
ank
of S
t. Lo
uis

3636
Even before the COVID-19 outbreak, the 10-year economic expansion showed signs of waning, with GDP growth barely eclipsing 2% in the last three quarters of 2019 and wage growth remaining tepid for years. More concerning, delinquencies in credit cards and auto loans – the loan products most used by the low-income workers most vulnerable from layoffs – have accelerated in recent years, even as mortgage delinquencies remained stable. In sum, the industry entered this crisis period already on the cusp of some credit challenges that the severe employment losses will greatly magnify.
362003
2004
2005
2006
2007
2008
2009
2010
2011
2012
2013
2014
2015
2016
2017
2018
2019
0%
2%
4%
6%
8%
10%
12%
14%
% B
alan
ces 9
0+ d
ays o
verd
ue
Credit cardAutoMortgageHELOC
THERE WERE PROBLEMS LOOMING ALREADY
Sour
ce: F
eder
al R
eser
ve B
ank
of N
ew Y
ork

3737
• In a more normal time, this part of the Outlook would recommend some incremental strategic changes for banks and credit unions and their branch networks. Absent a pandemic, we would have warned about an economic expansion seemingly teetering on its last legs, with stagnant growth in GDP and real wages, and an increase in loan delinquencies.
• For the branch network, that would imply remaining conservative with expansion investments and reducing emphasis on deposit growth to align with moderating loan demand.
• But the seismic events of recent months may dictate more severe reorientation of branch strategies and operations; and keep in mind, there are two significant economic upheavals ongoing. Even as the COVID-19 crisis was emerging in full force in the U.S. in early March, the OPEC – Russia oil alliance disintegrated, sending crude oil prices plummeting. The oil and gas sector had propelled many states through 2008 – 2009; but with plunging oil prices rendering domestic production uncompetitive, that sector will now contribute to the virus-driven economic and employment losses.
THE CHALLENGES AHEAD

3838
• Still, the mandatory business closures and personal distancing requirements will create a raft of severe immediate impacts:
Most acutely, lost wages will increase consumer delinquencies across all loan product types, from credit cards to mortgages. Further, governmental actions that strive to mitigate consumer consequences may push the credit problem upstream.
For example, rent deferments help consumers remain in their homes; but most multi-family properties are themselves under mortgage, and the loss of rental streams will cause defaults among those investment-property owners. Similarly, mortgage forbearances will adversely impact servicing firms still accountable for delivering payments to holders of mortgage-backed securities.
THE CHALLENGES AHEAD

3939
• Note also, some homeowners will move into default more quickly, as the CARES Act (the federal COVID-19 relief program) provides mortgage forbearance only for government-backed mortgages (e.g., Fannie Mae, Freddie Mac, FHA, VA); private-backed loans such as nonconforming loans and others banks carry in-portfolio, which account for 37% of U.S. residential mortgage balances, remain under no such relief directive.
• Business delinquencies will rise rapidly, too, as even government programs designed to avert layoffs and (for larger firms) to forestall bond defaults can not create consumer demand. Absent direct payments to businesses for expenses beyond salaries, firms will default on loans, and will fail.
• Business failures in the retail sector will also bring a secondary effect. Already under pressure from online providers, retail firms have shuttered thousands of stores in recent years, impacting commercial real estate cash flows. Additional bankruptcies in the retail sector will further strain shopping center owners, with frightful impacts for bank commercial real estate portfolios.
THE CHALLENGES AHEAD

4040
• In addition to an increase in credit losses, financial institutions will also face an erosion in interest revenue. Loan demand will erode from multiple factors: lost consumer spending will discourage new business formation; business owners of firms damaged or destroyed by the crisis may lack the emotional capital to try again, even if financial capital remains available; and most critically, consumers chastened by life-altering events such as layoffs, foreclosures or bankruptcies will be reticent to borrow again.
• For that lattermost concern, the recession of 2008 – 2009 provides cautionary guidance: even as the economy revived, consumer borrowing lagged, as consumers had no desire to revive the leverage levels that left them on (or in some cases beyond) the precipice of insolvency. And even for those wishing to borrow, the more conservative lending standards that emerge in any recession will reduce the pool of qualifiable borrowers.
THE CHALLENGES AHEAD
4141
• Just as declining loan demand will reduce interest revenue, other factors will dilute noninterest revenue. The loan slowdown will affect origination fees; but deposit-side fee revenue will suffer as banks will face significant Congressional and public relations pressure to reduce or waive overdraft fees at a time of national financial crisis. Further, a significant proportion of credit-side late fees will turn moot, as consumers unable to muster monthly payments will of course also be unable to pay late fees, either (and at least one U.S. senator has called for a moratorium on such fees in any future relief legislation).
• To the positive (ever so mildly), the abatement waning loan demand will obviate the need for aggressive deposit pursuit, perhaps a relief in a zero-rate environment that renders it difficult to create effective deposit-gathering campaigns. Reviving another lesson from 2008 – 2009, financial institutions will likely see a one-time spike in deposits from consumers withdrawing funds from a volatile equities market. However, the imperative for many consumers to tap savings to offset lost wages may counter such gains. Still, liquidity is likely to remain less of an issue than eroding loan demand.
THE CHALLENGES AHEAD

4242
• With this profusion of threats looming, one true positive holds in contrast to the events of 2008: in this crisis, the industry enters well capitalized and prepared for adverse shocks. For all the grumbling about Basel, stress tests, Dodd-Frank, and other capital-adequacy discussions that pervaded the industry post-2009, bankers should be grateful for the capital cushions the industry now enjoys, and the preparations stress tests and similar exercises provided for events now unfolding.
THE CHALLENGES AHEAD

4343
• So how to address this environment? First, understand and accept the disruption will not be temporary. There is no ‘light switch’ that will instantly restart the economy at the point where it entered the crisis. Even as the CARES Act’s Paycheck Protection Program will finance salaries for firms that retain their employees, that assistance arrives too late for many. As noted previously, 17 million Americans filed unemployment claims in a three-week span of late-March / early-April, and millions more will file in the subsequent weeks; and federal assistance will likely not arrive in time to save the majority of these jobs.
• For firms that already dismissed or furloughed workers due to forced closures and/or demand reductions, restarts will likely be tentative; e.g., “we furloughed 10 employees, we’ll start back with five and see how it goes.” And the demand side remains largely out of the business’ control. If consumers remain reluctant to shop, or if the nation’s quarantine actually changes preferences (for example, toward cooking at home versus dining out), how many businesses can withstand even a 10% decline in sales volume and still remain solvent? The hospitality industry, including airlines, hotels and restaurants, may see one of the slower paths back to normalcy, and that sector employed 10% of all U.S. workers pre-crisis.
ADVICE FOR THE LOOMING CHALLENGES

4444
• Thus, if revenues remain in decline, banks and credit unions will have to maintain earnings levels through corresponding expense reductions. And even as the economy begins to recover, it will bring two key questions for branch networks:
First, will the behavioral changes forced by the COVID-19 outbreak persist, accelerating a migration to digital channels; or will consumers starved for human contact rediscover the benefits of face-to-face interactions?
Second, even if preferences for branch use return to pre-crisis levels, in a recessionary period of reduced loan demand and increased charge-offs, can financial institutions find economies within their branch networks while maintaining historic service levels?
ADVICE FOR THE LOOMING CHALLENGES

4545
• The first question affects not only banks and credit unions, but the entire retail and services sectors. Consumer spending accounts for about 70% of U.S. GDP; and ultimately all spending is a function of consumer spending (General Motors doesn’t need more robots in its factory unless people buy more cars; and companies don’t need to buy GM’s delivery trucks unless consumers are purchasing the furniture those trucks would deliver). So to the extent that altered consumer preferences keep people more tethered to home and less out shopping and spending, it will prolong the retail sector’s troubles.
• But for banks and credit unions specifically, will a months-long closure of branch lobbies prove to consumers that they have no need for those services anymore? Could branches join the ranks of vacated retailers that consumers no longer visit in sufficient numbers to justify continued operation?
ADVICE FOR THE LOOMING CHALLENGES

4646
• Any answers to those questions remain speculative, dictating financial institutions plan for scenarios across a continuum of potential outcomes. It seems plausible to presume that the longer the outbreak persists, the more ingrained new habits become, and the less likely consumers would then revert to pre-crisis behaviors. That noted, if there is one area where consumers and small business owners alike will likely embrace personalized, customized assistance from a trusted advisor, it would be with their finances, which may now suffer from adverse credit ratings, battered 401(k) plans and other troubles.
• In that context, it will be critical for bankers to reacquaint customers with the value they can provide. As the economy begins to reopen in full, bankers freed from immediate transaction and service demands should leverage that time for prioritized calls to customers, inviting them for discussions of how to meet their financial objectives from a revised current position.
ADVICE FOR THE LOOMING CHALLENGES

4747
• Further, bankers can provide tremendous benefit to their customers in helping them navigate the array of governmental programs that emerge to combat the crisis. Beyond the initial provisions of the CARES Act, there may be changes to tax code treatments of business investment and depreciation, changes in IRA withdrawal rules, or SBA lending options that knowledgeable bankers can shepherd their customers through. And toward that end, bankers may wish to launch collaborations with CPAs and attorneys who can help them maximize their value to customers.
• Still, even if the crisis does not accelerate migration to digital channels, in the least it demonstrates the imperative of delivering a consistent service experience across all channels. Accordingly, bankers should view the duration of the viral outbreak as a stress test for their institutions’ channels, and most critically, take observations for improvement along the way. Granted, some consumers may prefer to bank with a branch – but if they had to bank otherwise, can we deliver a similarly satisfactory experience? And in evaluating channels, don’t neglect the call center, a bridge between the in-person branch and the fully automated online channel, especially since many call center inquiries now involve how-to questions about the online channel, versus direct service inquiries.
ADVICE FOR THE LOOMING CHALLENGES

4848
• At the far end of the continuum, suppose the COVID-19 crisis converts a gradual shift from branch to remote channels to a sudden, acute shift. In this case, bankers may need to accelerate branch contractions – and even if not, revenue declines may demand reductions in branch-network costs. In that environment, bankers should be prioritizing branches and markets by value, parsing the expendable from the indispensable.
• Such radical reconfiguration plans may involve exiting markets with low market share, retrenching around a few strongholds; and even in those strongholds, downsizing some branches to ATM / ITM / drive-in only configurations, in an exaggerated hub-and-spoke model. Of course, real estate considerations such as leases and book values can impede closures, but at a time of soaring charge-offs and battered earnings, there may be benefit in ‘hiding’ those facility disposition write-downs in earnings reports that shareholders have already written off with expectations of catastrophe.
ADVICE FOR THE LOOMING CHALLENGES

4949
• Within surviving branches, there may be an immediate need to revisit staffing levels, as operating efficiency will become paramount for as long as revenues remain impaired. Such efficiencies may require physical investment, for example, in dialog banking stations, teller cash recyclers and ITMs that can facilitate reduced-staff operations; others may involve pure personnel actions, such as the operation of multiple close-by branches under a single manager.
• That noted, judicious expansion can still prove beneficial. Keep in mind a recessionary economy will afford lower land, lease and construction costs to opportunistic buyers – presuming they maintain sufficient capital to absorb such costs. And given the long lead time for branch openings, often spanning a year from board approval to site procurement, to zoning and permitting, to design to construction, to ultimate opening, new-branch pursuits launched today may still find their grand openings in a vastly improved, if not fully recovered, economy. Finally, expansion in a down economy can bring reputational acclaim, both for the immediate economic impact construction creates and for the confidence in a community’s long-term health such investments signify.
ADVICE FOR THE LOOMING CHALLENGES

5050
• Regardless of how branch networks evolve, at some point the revival of bank and credit union revenue streams and of the nation’s economy overall will require a return to pre-crisis lending levels. In the wake of the 2008 financial crisis, many institutions sharply retrenched new lending in order to focus resources on credit workouts from overflowing distressed asset portfolios. This time, there may be benefit in quick write-downs of unsalvageable assets while emphasizing a faster return to normal lending activities.
• The recessionary environment may dictate elevating risk premiums, but financial institutions should avail themselves of mitigating facilities, such as SBA backstops, to keep rates reasonable for commercial applicants. Bankers should also confer with their regulators to determine whether they will indulge some level of deviation from typical lending practices for the good of the nation; e.g., relaxing certain covenants to avoid downgrading or calling a loan, reducing consumer credit-score thresholds, temporarily altering classification procedures.
ADVICE FOR THE LOOMING CHALLENGES

5151
• Recessions in general and the COVID-19 crisis in particular bring disproportionate impact to the lowest-income households, and banks should take note of not only the letter of the Community Reinvestment Act but also its spirit, while credit unions should remember their guiding mission of “People Helping People.” The crisis has ravaged low-income households through actual infection rates, as many lower-income individuals work in more exposed professions (bus drivers, hospital maintenance workers, sanitation, etc.), and many others worked in retail and service sector businesses that were among the first to close.
• Disparities in health care access and insurance coverage as well as a lack of backup savings amplified the crisis in lower-income households, confirming a need for bankers to marshal any resources possible to mitigate adverse impacts in the working-class market segments. This may include providing education about available support programs, deferral of certain payments and fees, and assistance with reestablishing credit. Unfortunately, in the midst of the crisis, several large U.S. banks have raised credit score and down payment requirements for new mortgages and HELOCs. Smaller institutions should seek to compensate for such actions, keeping credit available to all market segments, with proper risk management.
ADVICE FOR THE LOOMING CHALLENGES
5252
• As noted previously, the emerging recession differs from the prior recession in that the industry enters this period well capitalized. That noted, spikes in loan defaults, combined with declining new revenues, will bring some institutions to failure, and a greater number to consider merger or sale in the best interests of its stakeholders. This will create opportunity for smaller institutions to amass the scale critical for success, especially within larger markets, and bankers should seek in-market merger partners that would offer a combination of cost-efficiencies from consolidation of overlapping branches and complementary branches to help build branch density in core markets. Correspondingly, bankers should eschew mergers that would bring only toehold presences in new markets, as absent a growing underlying economy, it will be difficult to add sufficient profitable branches to leverage the benefits of the network effect.
ADVICE FOR THE LOOMING CHALLENGES
5353
• Finally, keep in mind the business cycle is exactly that – a cycle – and while the COVID-19 crisis accelerated the decline from a growth phase to a contracting phase of the economy (and greatly amplified the depth of the plunge), the cycle would have likely entered a contraction or trough phase soon anyway. But that will set the stage for the next expansion, almost certainly not in 2020 but perhaps in 2021. So bankers should not discard their deposit-gathering playbooks, but rather set them aside on a nearby shelf. As after the last recession, economic revival will eventually boost loan demand, and that plus accompanying interest-rate increases will render our deposit-capture skills essential once again.
ADVICE FOR THE LOOMING CHALLENGES

5454
• In sum, prepare for recession, as we’re almost certainly in one, even if not formally confirmed by GDP readings. Immediate implications will include heightened loan losses, increased repossessions and foreclosures, and a sharp decline in new-account activity, especially in loan applications. Expect a decline also in disposition values of foreclosed assets, as rampant unemployment will temper demand for autos, houses, and nearly everything else, depressing prices.
• Recovery will not occur immediately, there will be no magic ‘light switch’ that flips to instantly return the economy to its pre-crisis state. Keep in mind also that even as a return to greater economic activity will increase oil demand, other structural issues in that sector will continue to cast grave economic impacts on states as diverse as Pennsylvania, North Dakota, Arkansas, Wyoming, and of course Texas, all of which enjoyed significant employment in that sector at the height of the fracking boom.
ADVICE FOR THE LOOMING CHALLENGES
5555
• With earnings under pressure from both decreased charge-offs and reduced revenues, many bankers will find no recourse but to aggressively contract expenses, and branch closures and/or staff reductions offer an obvious target. But any such contractions should occur thoughtfully, retrenching around established strongholds while paring new-market forays yet to manifest benefits; and considering real estate disposition implications that may offset apparent noninterest expense savings.
• Finally, maintain close contact with customers and members to advise financially stressed consumers of their best options. And as the crisis abates and demand returns, keep credit available, even if under revised standards, as that more than anything represents the primary means by which bankers can abet the nation’s economic recovery.
ADVICE FOR THE LOOMING CHALLENGES

5656
• As bankers consider the impacts of the COVID-19 crisis and necessary actions to ensure survival, Bancography can provide:
Branch Performance Evaluations, to determine how selected branches are performing relative to industry benchmarks and market opportunity, to assist in keep / close decisions.
Branch Network Optimization services, to determine an overarching branching strategy, including close candidates, reconfiguration and hub-and-spoke opportunities, long-term expansion targets, and prospective merger partners to create the most efficient branch network possible.
Branch Staffing Reviews, to ensure staff levels at every branch align with demand, and every branch is leveraging the proper operating model (e.g., equipment, universal banker vs. teller / CSR divide) to maximize efficiency.
Marketing Research, to confirm that all channels continue to provide top-tier customer service, and to measure changes in consumer preferences.
HOW BANCOGRAPHY CAN HELP