Embed Size (px)
Citation preview

Dealing with Messy Data
October 22 2019
Office of Risk Assessment and Cost-Benefit Analysis (ORACBA)Office of Chief Economist (OCE)
Science Policy and Risk Forum
Jeff Bailey, ChiefSummary, Estimation, and Disclosure Methodology Branch
Methodology DivisionUSDA/NASS
1

National Agriculture Statistics Service (NASS)
The NASS Mission:
The NASS mission is to provide timely, accurate, and useful statistics in service to U. S. agriculture.
2

Messy Data Outline
• Survey Quality• Finding Data Errors
– Edit– Analysis
• Handling Nonresponse– Item Nonresponse– Unit Nonresponse
3

NASS Survey Process FlowSurvey Design
• Frame Construction
• Sampling
Data Collection
• Survey responses collected from multiple modes
Data Edit/Analysis
• Edit/Analyze survey responses for reasonability.
• Impute item nonresponse
Weighting
• Unit nonresponse
• Coverage• Misclassification
Calibration
• Adjust weights using published commodity targets
Summary
• Publish estimates: nass.usda.gov
4

Survey QualityQuality Dimension* Description
Comparability Are data source comparable to each other?
Coherence Do the data form a coherent body of information that can be combined with other data?
Relevance Do the data answer the questions you are asking?
Accuracy Are the data describing what they were designed to measure?
Timeliness How much time has elapsed since the data were collected?
Accessibility Can user easily obtain and analyze the data?
Interpretability Do the data make sense in terms of users' hypotheses?
*Survey Quality by Sue Ellen Hansen, Et.al.
5

Accuracy
Accuracyor
Total Survey Error
Measurement
Construct Validity
Measurement Error
Processing Error
Representation
Sampling
Coverage Error
Nonresponse Error
Adjustment Error
6

Accuracyor
Total Survey Error
Measurement
Construct Validity
Measurement Error
Processing Error
Representation
Sampling
Coverage Error
Nonresponse Error
Adjustment Error
Accuracy
Finding Errors
Nonresponse
7

Messy Data Outline
• Survey Quality• Finding Data Errors
– Edit– Analysis
• Handling Nonresponse– Item Nonresponse - Imputation– Unit Nonresponse - Reweighting
8
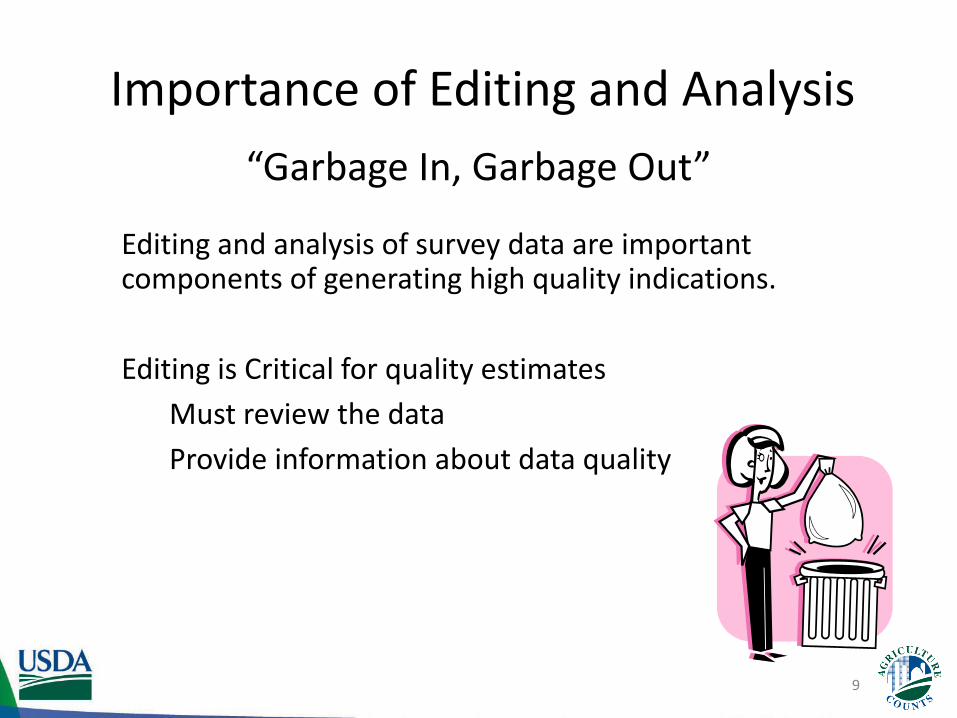
Importance of Editing and Analysis“Garbage In, Garbage Out”
9
Editing and analysis of survey data are important components of generating high quality indications.
Editing is Critical for quality estimatesMust review the data Provide information about data quality

Non-Sampling Errors
Measurement Error Respondent reports incorrectly Hard to understand questions Memory recall Unit of measures errors Reference period Overlooked questions
10

Non-Sampling Errors
Processing Data capture (key entry or OCR) Coding of responses Editing Programming errors
11

What is Editing?
• Rules or Logic: Edits for items on the questionnaire– Univariate or Range Restrictions
C1 < Y < C2 (number of cows between 1 and 1,000) – Bivariate
C1 < Y1 /Y2 < C2 (calculated yield 10 and 100)– Balance Edits
Y1 + Y2 + Y3 <= Y4 (Cows + Bulls + Calves = Total) – Statistical Edits
Y > 2(SE) from the mean
12

How to Edit?• Iterative:
• Computer flagged and Manual correction, data entry correction, re-edit
• Interactive: • Computer assisted (Blaise, CSPro etc.)
• Influential: • Selective Edit, editing of only Influential or Significant
records• Automatic:
• Programmatic fixing of errors• Macro Editing/Analysis:
• Across records, aggregate or distributional
13

NASS Editing/Analysis
• Some simple edits incorporated into the computer interviews
• Work is distributed among Regional Field Offices (RFOs) and HQ
• Done by subject matter specialists – Know the commodity– Know the sample– Know the questionnaire and edit– Know the estimators and the indications produced
14
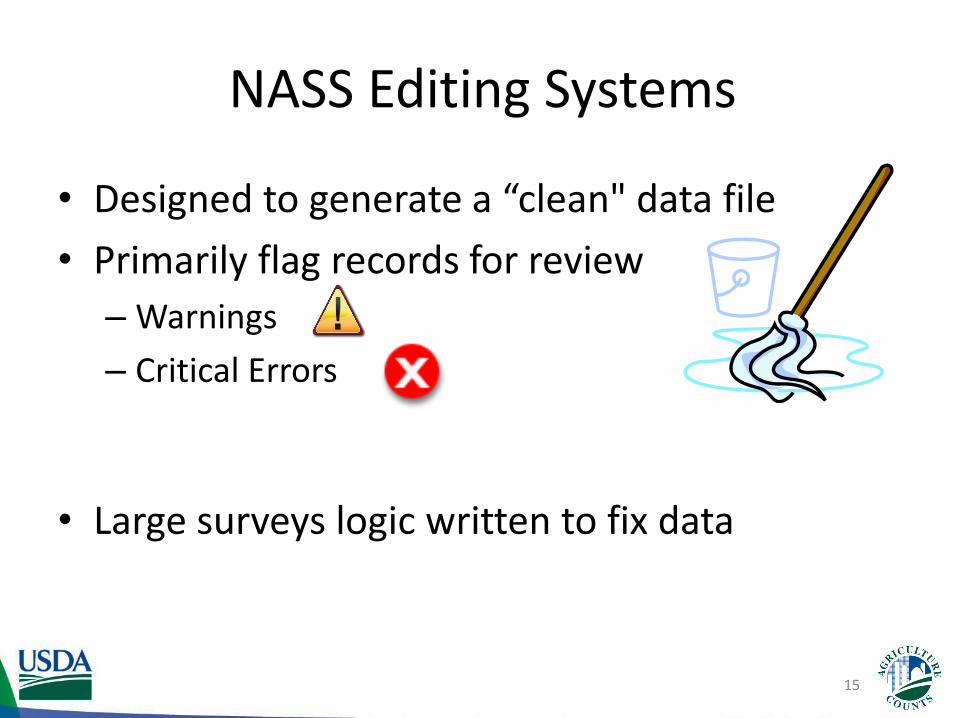
NASS Editing Systems
• Designed to generate a “clean" data file • Primarily flag records for review
– Warnings– Critical Errors
• Large surveys logic written to fix data
15
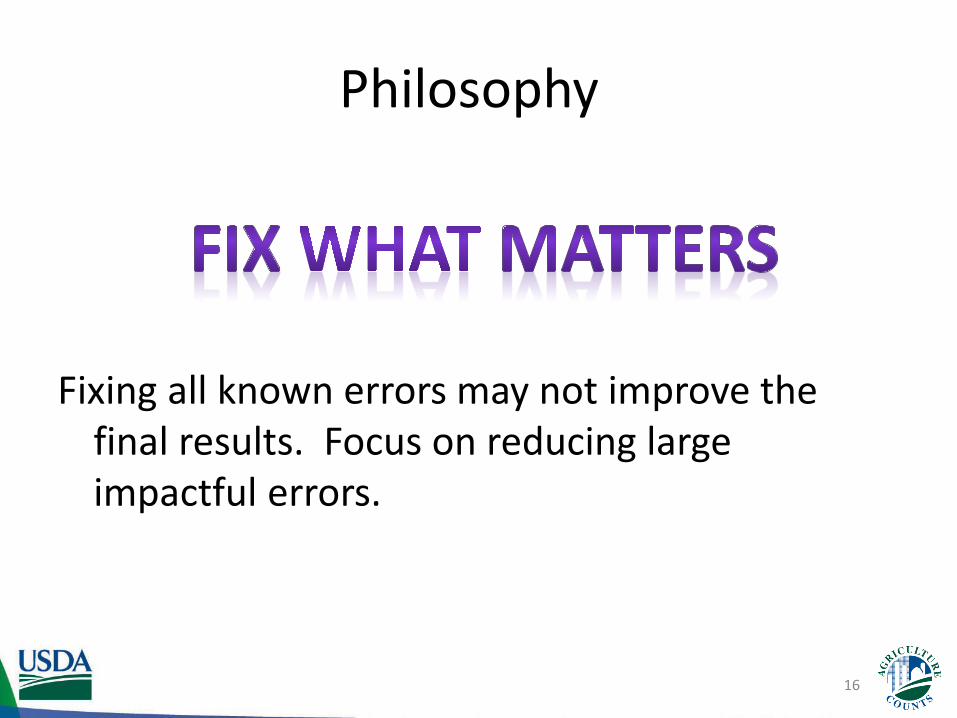
Philosophy
Fixing all known errors may not improve the final results. Focus on reducing large impactful errors.
16

What is Data Analysis?
• Data analysis is the process of reviewing survey data with analytical tools– To understand the current
data – Find outliers.
17

What is an outlier?
• A data value that is markedly different than the rest of the data
• An outlier may be correct• Reasonable to expect
outliers in the population
Outlier
18

Identifying Outliers• Graphical Identification
• Subjective• NASS Interactive Data Analysis System (IDAS)
19

Review survey data’s expanded values
20

Review survey data’s expanded values
21

Review differences from prior survey
22

Review differences from prior survey
23

Review data ratios within current survey
24

Review data ratios within current survey
25

Review data geographically
26

Aggregates Review
27

What to do with an outlier?Verify the Reported Data
• Verify the Reported Data– If an error is found: correct it!
• Otherwise– Adjust weights– Remove from models– Adjust estimates
28

Impacts of Outliers• Survey Indications
• In what direction• To what degree
• Measures of Precision• Standard Error (SE)• Coefficient of Variation (CV)
• Nonresponse Adjustment
29

Messy Data Outline
• Survey Quality• Finding Data Errors
– Edit– Analysis
• Handling Nonresponse– Item Nonresponse - Imputation– Unit Nonresponse – Imputation or Reweighting
30

What is Item Imputation?
ID Variable 1 Variable 2
1 10 33
2 ? 74
3 25 ?
4 15 ?
BEFOREClean dataset with missing data
ID Variable 1 Variable 2
1 10 33
2 27 74
3 25 70
4 15 52
AFTERClean dataset with imputed values
The process of replacing missing data with substituted values.
Imputation
31

Why is there missing data?Refusal to answer the item in question• Too personal• Too sensitive
Too difficult to answer• Poor memory or inadequate records• Too difficult to calculate
Accidentally skipped
Other unknown reasons?
32
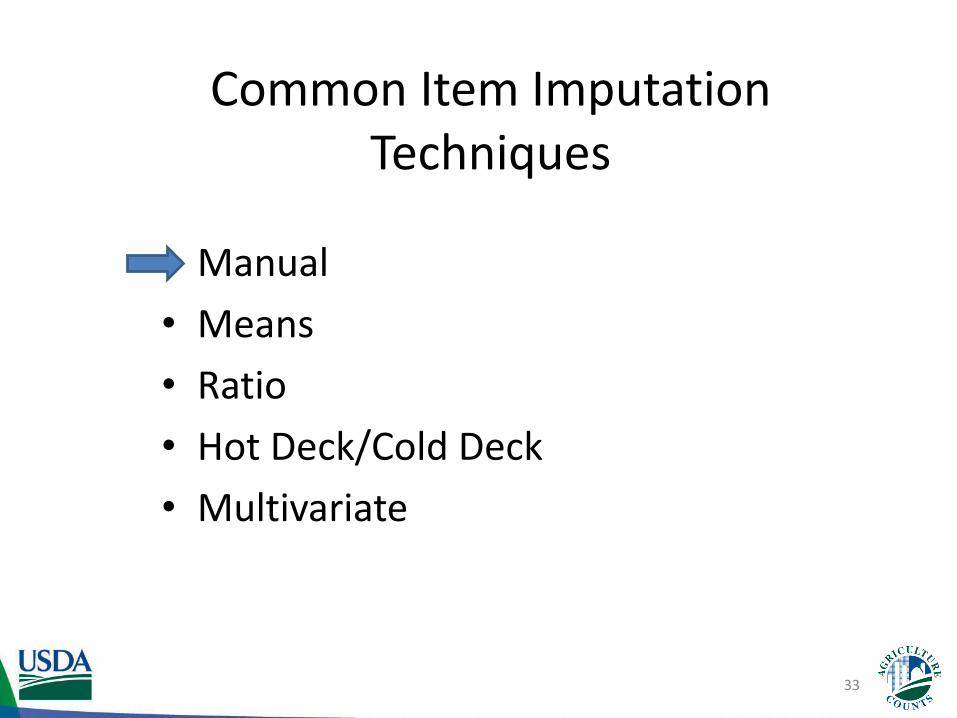
Common Item Imputation Techniques
• Manual• Means• Ratio• Hot Deck/Cold Deck• Multivariate
33

Manual Imputation
• May be used when data are known at least approximately.
• Generally a simple process but not always statistically defensible.
• May be the easiest way to estimate extreme operators
Replacing missing data with external information or historical data
34

Common Item Imputation Techniques
• Manual• Means• Ratio• Hot Deck/Cold Deck• Multivariate
35

Mean Imputation
• Un-weighted means is the most common• Best practice is to group the records with
similar attributes
Replacing missing data with the mean of clean reported data
36

Mean Imputation GroupingWhich to use?!
Location•Region•State•County
Farm Type•Grain•Fruit/Vegetable •Cattle/Hog •Dairy•Poultry
Sales class• Less than $100,000• $100,000 -
$500,000• More than
$500,000
�̅�𝑥𝐿𝐿
�̅�𝑥𝑆𝑆 �̅�𝑥𝐹𝐹
�̅�𝑥𝐿𝐿𝑆𝑆 �̅�𝑥𝐿𝐿𝐹𝐹
�̅�𝑥𝑆𝑆𝐹𝐹
�̅�𝑥𝐿𝐿𝑆𝑆𝐹𝐹
�̅�𝑥Typical Grouping Hierarchy1. Location, Sales Class, Farm Type2. Sales Class, Farm Type3. Location, Sales Class4. Location, Farm Type 5. Farm Type6. Sales Class7. Location8. National
�̅�𝑥𝐿𝐿𝑆𝑆𝐹𝐹�̅�𝑥𝑆𝑆𝐹𝐹�̅�𝑥𝐿𝐿𝑆𝑆�̅�𝑥𝐿𝐿𝐹𝐹�̅�𝑥𝐹𝐹�̅�𝑥𝑆𝑆�̅�𝑥𝐿𝐿�̅�𝑥
• Picking the best often depends on if enough records exist.
• Combining subgroups into broader categories is an option to get enough records
�̅�𝑥
37

Mean ImputationAn Example:
Grain Farms with less than $10,000 sales in Western Region
Farm 1 Farm 2 Farm 3 Farm 4 Farm 5 Farm 6
Taxes $10 $15 ? $27 $33 $20
Expenses $89 $74 $13 ? $36 $100
Wages ? $50 $44 $150 $102 $170
Grain Farms with less than $10,000 sales in Western Region
Farm 1 Farm 2 Farm 3 Farm 4 Farm 5 Farm 6
Taxes $10 $15 $21 $27 $33 $20
Expenses $89 $74 $13 $62 $36 $100
Wages $103 $50 $44 $150 $102 $170
Mean Taxes = $21
10+15+27+33+205
Mean Expenses = $62
89+74+13+36+1005
Mean Wages = $103
50+44+150+102+1705
38

Common Item Imputation Techniques
• Manual• Means• Ratio• Hot Deck/Cold Deck • Multivariate
39

Ratio Imputation
• Used in monthly surveys using a ratio of current to previous month
• Assumes similar relationship among different operations.
Replacing missing data with values calculated from ratio of data from different reports
40

Ratio ImputationMonthly Survey Results
Current Month Previous MonthFarm 1 Farm 2 Farm 3 Farm 1 Farm 2 Farm 3
Production ? 120 190 130 110 170Yield 40 ? 50 60 45 55
Production Ratio120+190110+170
= 1.10
Yield Ratio40+5060+55
= 0.78
Monthly Survey ResultsCurrent Month Previous Month
Farm 1 Farm 2 Farm 3 Farm 1 Farm 2 Farm 3Production 143 120 190 130 110 170
Yield 40 35.1 50 60 45 55
Apply Ratios to Previous Reports
Farm 1 Production130 ∗ 1.10 = 143
Farm 2 Yield45 ∗ 0.78 = 35.1
41

Mean & Ratio ImputationAdvantages/Disadvantages
Advantages Disadvantages
Easy to implement Artificially lowers variance
Easy to debug More statistically sound methods available
Flexible One record can really drive imputation
Creates imputations within edit limits
42

Common Item Imputation Techniques
• Manual• Means• Ratio• Hot Deck/Cold Deck• Multivariate
43

Hot Deck / Cold DeckNearest Neighbor Selection
Hot Deck Imputation Replacing missing data with values from a similar
record in the same dataset
Cold Deck Imputation Replacing missing data with values from a similar
record in a different dataset
44

Hot Deck/Cold DeckSelecting a “similar” record from a donor pool
Location
Farm Type
Other factors?
Sales Class
DONOR POOL is a group of complete records that have similar characteristics as the record requiring imputation.
Different algorithms (like Nearest Neighbor) can be used to find a similar record.
Different variables can potentially use different scoring algorithms.
45

Hot Deck ImputationAn Example:
Grain Farms with less than $10,000 sales in Western Region
Farm 1 Farm 2 Farm 3 Farm 4 Farm 5 Farm 6
Taxes $10 $15 ? $27 $33 $20
Expenses $89 $74 $13 ? $36 $100
Wages ? $50 $44 $150 $102 $170
Grain Farms with less than $10,000 sales in Western Region
Farm 1 Farm 2 Farm 3 Farm 4 Farm 5 Farm 6
Taxes $10 $15 $33 $27 $33 $20
Expenses $89 $74 $13 $100 $36 $100
Wages $50 $50 $44 $150 $102 $170
Farm 1 similar to Farm 2- Use $50 wages from Farm 2 in Farm 1
Farm 3 similar to Farm 5- Use $33 taxes from Farm 5 in Farm 3
Farm 4 similar to Farm 6- Use $100 expense from Farm 5 in Farm 4
46

Common Item Imputation Techniques
• Manual• Means• Ratio• Hot Deck/Cold Deck• Multivariate
47

Multivariate Imputation
• Typically uses linear regression to fit data to missing values
• Uses both complete and incomplete cases to help predict the missing values.
Replacing missing data with values calculated from regression models
48

The Basic Form of Multivariate Imputation
TYPEFARMCROPLAND OWNED ACRENTED AC.......LAND VALUEASSETS
PRODUCTIONEXPENSES
ASSETS...
FUEL COSTTAXESYIELD
.
.
.
Imputed variables and covariates
Imputed variables
Iterative Sequential Regression• Each variable run thru
unique regression model
49

Why Multivariate Imputation?Before Imputation
After Mean Imputation After Multivariate Imputation
50

Unit Nonresponse
Primarily Refusal and Inaccessibles
• Can be done by Imputation (whole record)• Commonly done by reweighting
51

ReweightingA very simple example:• If we sent 100 questionnaires where 90 were completed and
10 were nonrespondents then the nonresponse weight = 100/90 = 1.11.
• To summarize the data multiply all the record’s data by 1.11.
In Production:• Group records into homogeneous groups since nonresponse
can be dependent on different attributes.• Adjusting weights of good reports.
𝑆𝑆𝑆𝑆𝑆𝑆𝑆𝑆𝑆𝑆𝑆𝑆 𝐸𝐸𝐸𝐸𝐸𝐸𝐸𝐸𝐸𝐸𝐸𝐸𝐸𝐸𝑆𝑆 = �𝑖𝑖=1
𝑐𝑐𝑐𝑐𝑐𝑐𝑐𝑐𝑐𝑐𝑐𝑐𝑐𝑐𝑐𝑐𝑐𝑐𝑟𝑟𝑐𝑐𝑐𝑐𝑐𝑐𝑟𝑟𝑐𝑐𝑟𝑟
𝑛𝑛𝑛𝑛𝑛𝑛𝑆𝑆𝑆𝑆𝐸𝐸𝑛𝑛𝑛𝑛𝑛𝑛𝐸𝐸𝑆𝑆 𝑤𝑤𝑆𝑆𝐸𝐸𝑤𝑤𝑤𝐸𝐸𝑖𝑖 ∗ 𝐸𝐸𝐸𝐸𝑆𝑆𝐸𝐸_𝑑𝑑𝐸𝐸𝐸𝐸𝐸𝐸𝑖𝑖
52

Complex Reweighting
N = number of units in the populationn = number of units in the sampleAc = post stratification weight for post stratana = number of known ag operations in the sample nna= number of known non-ag operations in the sample nh = number of known commodity operations in the sample nah = number of known non-commodity ag operations in the sample ngh = number of positive responding commodity operations in the sample ygh = value of the positive responding commodity operation
ghgh
h
aha
a
naac y
n n
nn n
nn nA
n NDE •
+•
+=∑
*Business Status*Presence of item
53

CalibrationA re-weighting algorithm that minimizes the change in the sampling weights so that several important weighted survey items match official published totals. (Bench marking)• Input weights to the calibration routine are the
sampling weights• Unit non-response adjustment can be done prior to
calibration or incorporated. • Calibration helps correct for any disproportionate
response from a particular farm type or sales class
54

Census of Agriculture Weights
• Composed of three adjustments– Nonresponse (nr)– Misclassification (m)– Coverage (c)
• Integerized• For COA, max weight is 6
𝑤𝑤𝑖𝑖 = 𝑛𝑛𝑆𝑆𝑖𝑖𝐸𝐸𝑖𝑖𝑐𝑐𝑖𝑖Fully adjusted weight
55

Questions?
56