Embed Size (px)
Citation preview
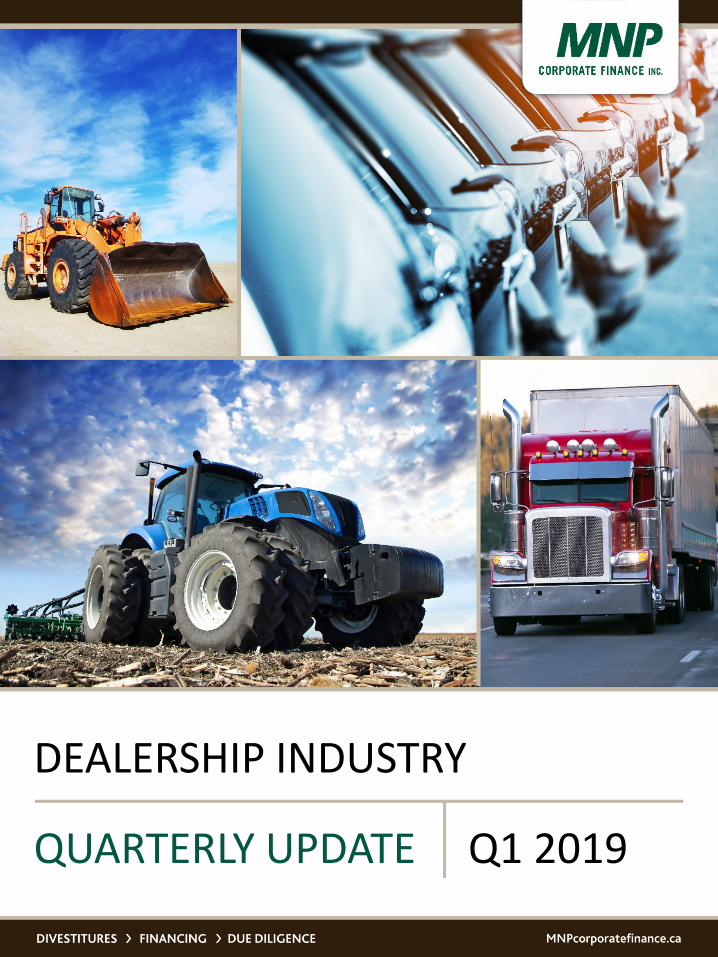
QUARTERLY UPDATE Q1 2019
DEALERSHIP INDUSTRY
Page 2
977 M
2,207 M
1,126 M913 M
1,350 M 1,066 M
33 M-
10
20
30
40
50
60
70
80
-
500 M
1,000 M
1,500 M
2,000 M
2013 2014 2015 2016 2017 2018 Q1 2019
Tra
nsa
ctio
n V
olu
me
(Nu
mb
er o
f D
eals
)
Tra
ns
acti
on
Va
lue
($CA
D M
illio
ns)
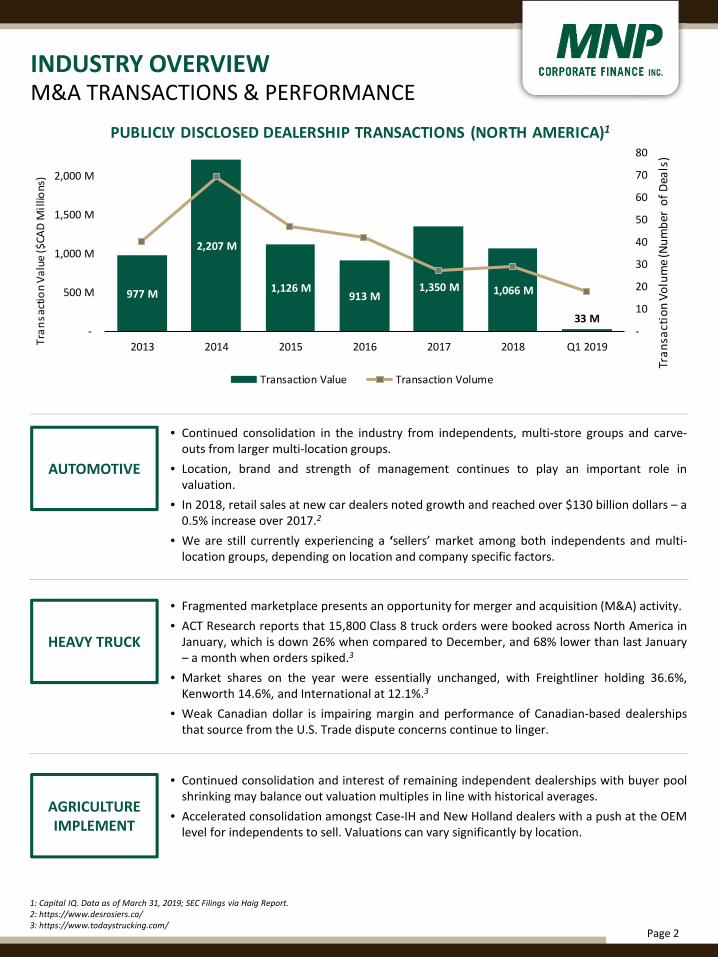
PUBLICLY DISCLOSED DEALERSHIP TRANSACTIONS (NORTH AMERICA)1
Transaction Value Transaction Volume
INDUSTRY OVERVIEW
1: Capital IQ. Data as of March 31, 2019; SEC Filings via Haig Report.2: https://www.desrosiers.ca/3: https://www.todaystrucking.com/
• Continued consolidation in the industry from independents, multi-store groups and carve-outs from larger multi-location groups.
• Location, brand and strength of management continues to play an important role invaluation.
• In 2018, retail sales at new car dealers noted growth and reached over $130 billion dollars – a0.5% increase over 2017.2
• We are still currently experiencing a ‘sellers’ market among both independents and multi-location groups, depending on location and company specific factors.
• Fragmented marketplace presents an opportunity for merger and acquisition (M&A) activity.
• ACT Research reports that 15,800 Class 8 truck orders were booked across North America inJanuary, which is down 26% when compared to December, and 68% lower than last January– a month when orders spiked.3
• Market shares on the year were essentially unchanged, with Freightliner holding 36.6%,Kenworth 14.6%, and International at 12.1%.3
• Weak Canadian dollar is impairing margin and performance of Canadian-based dealershipsthat source from the U.S. Trade dispute concerns continue to linger.
• Continued consolidation and interest of remaining independent dealerships with buyer poolshrinking may balance out valuation multiples in line with historical averages.
• Accelerated consolidation amongst Case-IH and New Holland dealers with a push at the OEMlevel for independents to sell. Valuations can vary significantly by location.
AUTOMOTIVE
HEAVY TRUCK
AGRICULTURE IMPLEMENT
M&A TRANSACTIONS & PERFORMANCE
Page 3
-41.4%
-1.3%
-1.1%4.7%
19.3%
37.6%
-60%
-40%
-20%
-
20%
40%
60%
Q1 2016 Q1 2017 Q1 2018 Q1 2019
3 YEAR INDEX PERFORMANCE2
AutoCanada Inc. US Dealership Peers Domestic OEM Peers
Foreign OEM Peers TSX S&P 500
-
10%
20%
30%
40%
50%
60%
70%
Q1 Q2 Q3 Q4 Q1 Q2 Q3 Q4 Q1 Q2 Q3 Q4 Q1 Q2 Q3 Q4 Q1
-
100,000
200,000
300,000
400,000
500,000
600,000
700,000
800,000
Pa
ssen
ger
Veh
icle
Sa
les
(Un
its)
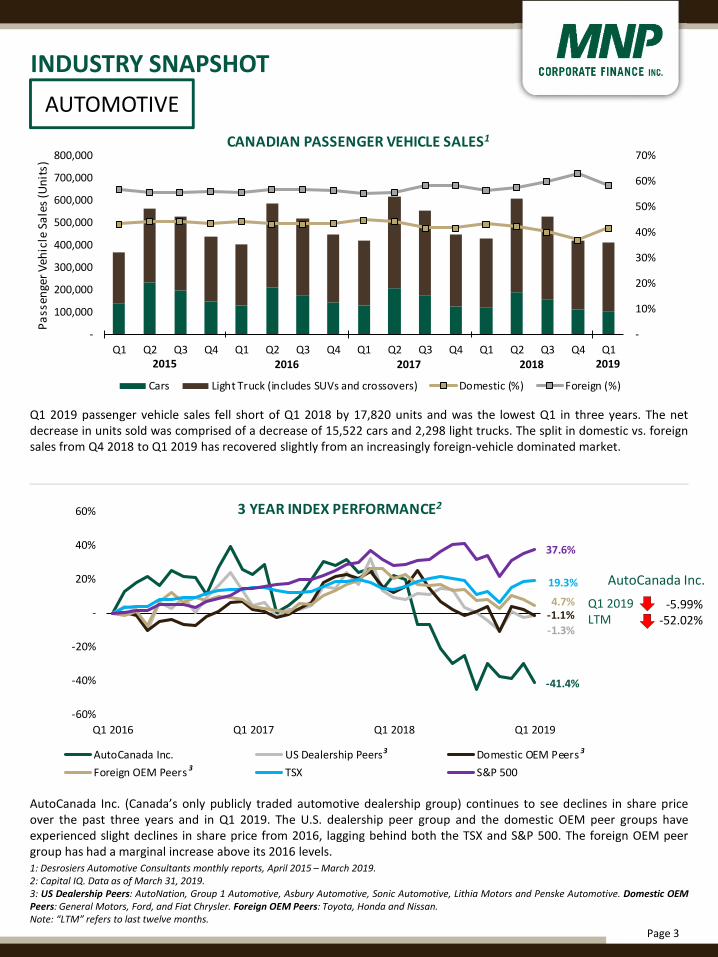
CANADIAN PASSENGER VEHICLE SALES1
Cars Light Truck (includes SUVs and crossovers) Domestic (%) Foreign (%)
Q1 2019 passenger vehicle sales fell short of Q1 2018 by 17,820 units and was the lowest Q1 in three years. The netdecrease in units sold was comprised of a decrease of 15,522 cars and 2,298 light trucks. The split in domestic vs. foreignsales from Q4 2018 to Q1 2019 has recovered slightly from an increasingly foreign-vehicle dominated market.
INDUSTRY SNAPSHOT
1: Desrosiers Automotive Consultants monthly reports, April 2015 – March 2019.2: Capital IQ. Data as of March 31, 2019.3: US Dealership Peers: AutoNation, Group 1 Automotive, Asbury Automotive, Sonic Automotive, Lithia Motors and Penske Automotive. Domestic OEMPeers: General Motors, Ford, and Fiat Chrysler. Foreign OEM Peers: Toyota, Honda and Nissan.Note: “LTM” refers to last twelve months.
2018201720162015
AUTOMOTIVE
Q1 2019LTM
-5.99%-52.02%
AutoCanada Inc. (Canada’s only publicly traded automotive dealership group) continues to see declines in share priceover the past three years and in Q1 2019. The U.S. dealership peer group and the domestic OEM peer groups haveexperienced slight declines in share price from 2016, lagging behind both the TSX and S&P 500. The foreign OEM peergroup has had a marginal increase above its 2016 levels.
AutoCanada Inc.
3 3
3
2019

Page 4
5 Year AutoCanada
Disclosed
M&A Glance1
Total Deal Value ($CAD)
399.0MTotal Number of Transactions
22Average Transaction Value
18.1M
133.6m
63.8m
24.9m 17.0m
159.7m
--
25 M
50 M
75 M
100 M
125 M
150 M
175 M
200 M
2014 2015 2016 2017 2018 Q1 2019
Tra
nsa
ctio
n V
alu
e ($
CA
D M
illi
on
s)
AUTOCANADA INC. DISCLOSED ACQUISITION VALUES1
Publicly Disclosed Transaction Values
AUTOCANADA INC. M&A REVIEW1
• The only publicly traded automotive dealership in Canada isAutoCanada Inc., and is, therefore, the closest publicly availablecomparable to a privately owned car dealership group.
• AutoCanada is one of Canada’s largest multi-location automobiledealership groups, currently operating 66 franchised dealerships inCanada and the U.S. AutoCanada offers 27 brands of vehicles.
• AutoCanada had a large $111 million transaction in March 2018where they acquired a dealership group of 8 locations in the U.S.,making up the bulk of their deal activity in 2018.
• With the recent expansion into the U.S., aggregate transaction valuesfor AutoCanada Inc. surpassed the last high seen in 2014.
• AutoCanada has completed the sale and leaseback of several of itsdealership properties over the past year.
1: Capital IQ. Data as of March 31, 2019. M&A summary data is based on publicly disclosed transactions. Not all transactions have disclosed financialinformation. Currency in CAD.
AUTOMOTIVE
INDUSTRY SNAPSHOT
Page 5
-6%
-4%
-2%
-
2%
4%
6%
Q1 Q2 Q3 Q4 Q1 Q2 Q3 Q4 Q1 Q2 Q3 Q4
-
100 M
200 M
300 M
400 M
500 M
Net
Pro
fit B
efo
re T
ax
(% o
f R
even
ue)
Hea
vy T
ruck
Sa
les
($C
AD
Mil
lio
ns)
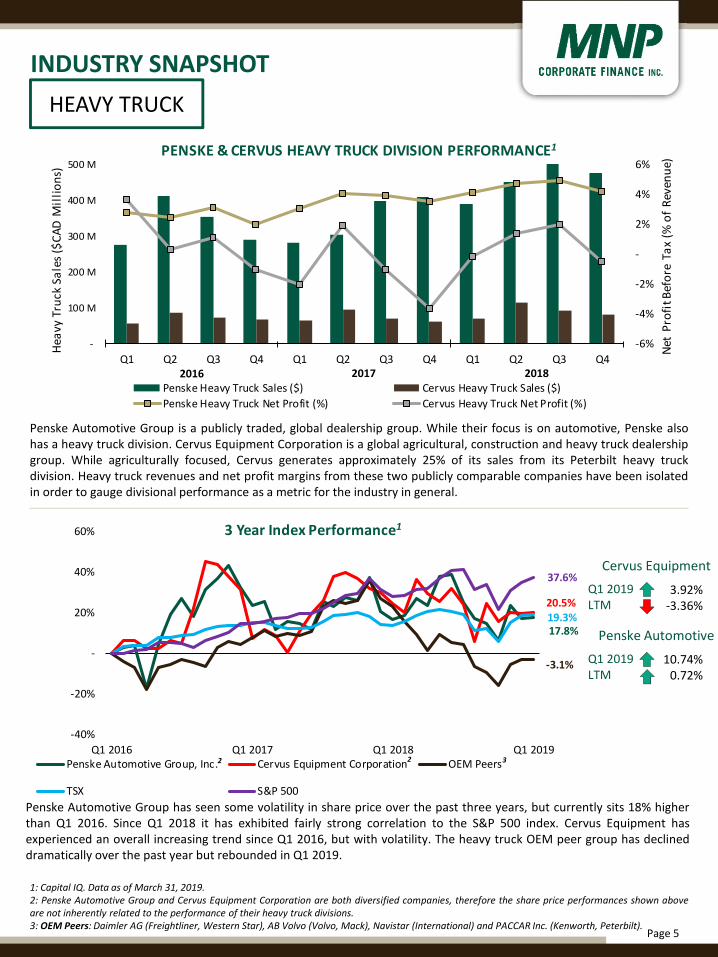
PENSKE & CERVUS HEAVY TRUCK DIVISION PERFORMANCE1
Penske Heavy Truck Sales ($) Cervus Heavy Truck Sales ($)
Penske Heavy Truck Net Profit (%) Cervus Heavy Truck Net Profit (%)
17.8%
20.5%
-3.1%
19.3%
37.6%
-40%
-20%
-
20%
40%
60%
Q1 2016 Q1 2017 Q1 2018 Q1 2019
3 Year Index Performance1
Penske Automotive Group, Inc. Cervus Equipment Corporation OEM Peers
TSX S&P 500
Q1 2019LTM
3.92%-3.36%
2
Penske Automotive Group is a publicly traded, global dealership group. While their focus is on automotive, Penske alsohas a heavy truck division. Cervus Equipment Corporation is a global agricultural, construction and heavy truck dealershipgroup. While agriculturally focused, Cervus generates approximately 25% of its sales from its Peterbilt heavy truckdivision. Heavy truck revenues and net profit margins from these two publicly comparable companies have been isolatedin order to gauge divisional performance as a metric for the industry in general.
1: Capital IQ. Data as of March 31, 2019.2: Penske Automotive Group and Cervus Equipment Corporation are both diversified companies, therefore the share price performances shown aboveare not inherently related to the performance of their heavy truck divisions.3: OEM Peers: Daimler AG (Freightliner, Western Star), AB Volvo (Volvo, Mack), Navistar (International) and PACCAR Inc. (Kenworth, Peterbilt).
Penske Automotive Group has seen some volatility in share price over the past three years, but currently sits 18% higherthan Q1 2016. Since Q1 2018 it has exhibited fairly strong correlation to the S&P 500 index. Cervus Equipment hasexperienced an overall increasing trend since Q1 2016, but with volatility. The heavy truck OEM peer group has declineddramatically over the past year but rebounded in Q1 2019.
HEAVY TRUCK
INDUSTRY SNAPSHOT
20172016
3
Cervus Equipment
Q1 2019LTM
10.74%0.72%
Penske Automotive
2
2018

Page 6
-
2 B
4 B
6 B
8 B
10 B
12 B
100 M
150 M
200 M
250 M
300 M
350 M
400 M
450 M
Q1 Q2 Q3 Q4 Q1 Q2 Q3 Q4 Q1 Q2 Q3 Q4 Q1 Q2 Q3 Q4 Q1 Q2 Q3 Q4
Farm
Ca
sh R
ecei
pts
($
CA
D B
illi
on
s)
Rev
enu
e ($
CA
D M
illi
on
s)
REVENUE1 VS. FARM CASH RECEIPTS2 PER QUARTER
Rocky Mountain Equipment Cervus Equipment Farm Cash Receipts (AB, SK, MB)
32.3%
68.3%
19.3%
37.6%
-20%
-
20%
40%
60%
80%
100%
120%
Q1 2016 Q1 2017 Q1 2018 Q1 2019
3 Year Index Performance1
Dealership Peers OEM Peers TSX S&P 500
Farm cash receipts display a defined pattern of drastic annual fluctuations as cash receipts are a lagging indicator ofagriculture equipment sales. Farm cash receipts have been relatively steady this past year, with the first three quarters of2018 being just below 2017 levels. Similarly, Q3 2018 results have come in just short of Q3 2017.
The dealership peer group has underperformed the OEM peer group from Q1 2016 to Q1 2019. While cumulative shareprice performance was more or less equal in Q4 2017, the dealership peer group declined by over 27% to the end of Q12019 compared to 12% by the OEM peer group. The agricultural implement/construction OEM peer group has seensignificant index out-performance over the past two years.
1: Capital IQ. Data as of March 31, 2019.2: Farm product prices, crops and livestock – Statistics Canada.3: Dealership Peers: Rocky Mountain Equipment, Cervus and Titan Machinery. OEM Peers: Deere & Company (John Deere), CNH Industrial (Case IH, NewHolland), Kuboto Corp., Caterpillar Inc. (CAT) and AGCO Corporation (Massey Ferguson).
2017201620152014
AGRICULTURAL IMPLEMENT
INDUSTRY SNAPSHOT
Q1 2019LTM
11.89%-27.60%
Dealership Peers
Q1 2019LTM
6.62%-6.64%
OEM Peers
3 3
2018
Page 7
MACROECONOMIC INDICATORS
1.75
1.80
1.85
1.90
1.95
2.00
2.05
2.10
2.15
$C
AD
Mil
lio
ns
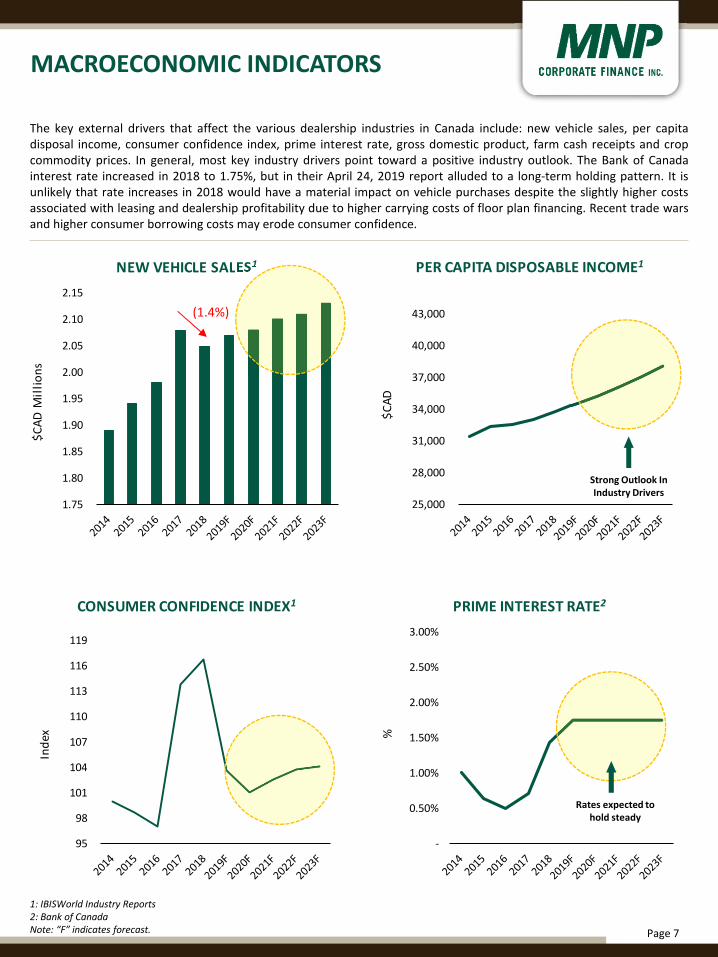
NEW VEHICLE SALES1
25,000
28,000
31,000
34,000
37,000
40,000
43,000
$C
AD
PER CAPITA DISPOSABLE INCOME1
-
0.50%
1.00%
1.50%
2.00%
2.50%
3.00%
%
PRIME INTEREST RATE2
95
98
101
104
107
110
113
116
119
Ind
ex
CONSUMER CONFIDENCE INDEX1
The key external drivers that affect the various dealership industries in Canada include: new vehicle sales, per capitadisposal income, consumer confidence index, prime interest rate, gross domestic product, farm cash receipts and cropcommodity prices. In general, most key industry drivers point toward a positive industry outlook. The Bank of Canadainterest rate increased in 2018 to 1.75%, but in their April 24, 2019 report alluded to a long-term holding pattern. It isunlikely that rate increases in 2018 would have a material impact on vehicle purchases despite the slightly higher costsassociated with leasing and dealership profitability due to higher carrying costs of floor plan financing. Recent trade warsand higher consumer borrowing costs may erode consumer confidence.
1: IBISWorld Industry Reports2: Bank of CanadaNote: “F” indicates forecast.
Rates expected to hold steady
Strong Outlook In Industry Drivers
(1.4%)

Page 8
MACROECONOMIC INDICATORS
104
106
108
110
112
114
116
-
100
200
300
400
500
600
700
800
900
Feb-17 Aug-17 Feb-18 Aug-18 Feb-19
Farm
In
pu
t P
rice
In
de
x
CA
D$
/me
tric
to
nn
e
CROP COMMODITY PRICES2
Wheat - excl. durum Durum Barley Soybeans Grain corn
Flaxseed Canola Lentils Dry peas Farm input price index
1.3 T
1.6 T
1.9 T
2.2 T
2.5 T
CA
D$
Tri
llio
ns
GDP - CANADA1
-
2 B
4 B
6 B
8 B
10 B
12 B
14 B
16 B
CA
D$
Bil
lio
ns
FARM CASH RECEIPTS (AB, SK, MB)2
1: IBISWorld Industry Reports2: Farm product prices, crops and livestock – Statistics Canada.
Farm
Inp
ut
Pri
ce In
dex
Page 9
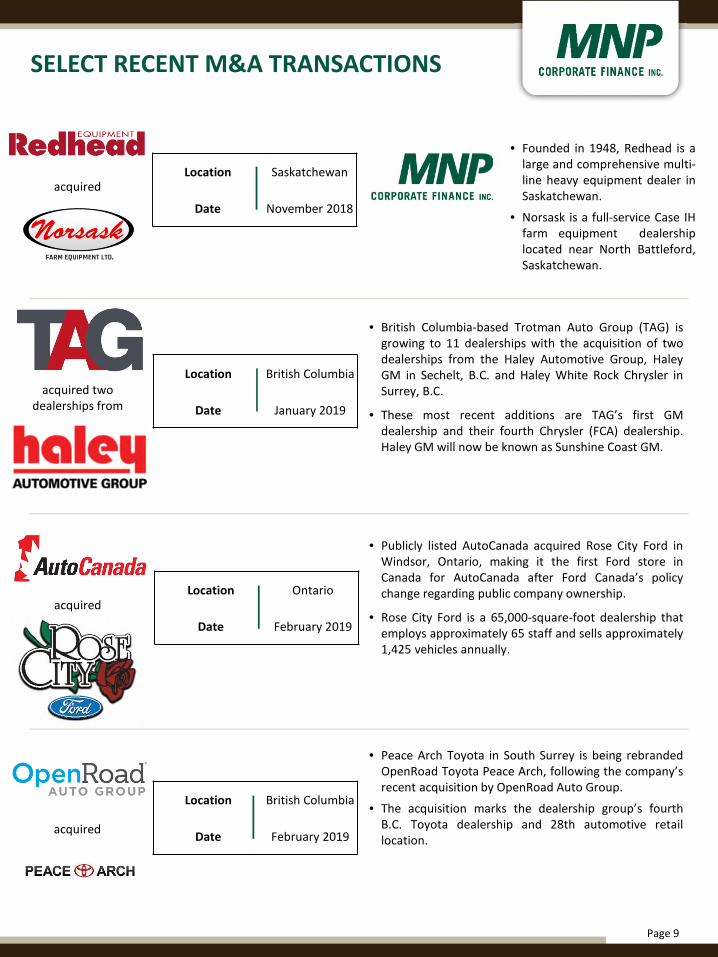
SELECT RECENT M&A TRANSACTIONS
Location British Columbia
Date February 2019
• British Columbia-based Trotman Auto Group (TAG) isgrowing to 11 dealerships with the acquisition of twodealerships from the Haley Automotive Group, HaleyGM in Sechelt, B.C. and Haley White Rock Chrysler inSurrey, B.C.
• These most recent additions are TAG’s first GMdealership and their fourth Chrysler (FCA) dealership.Haley GM will now be known as Sunshine Coast GM.
• Publicly listed AutoCanada acquired Rose City Ford inWindsor, Ontario, making it the first Ford store inCanada for AutoCanada after Ford Canada’s policychange regarding public company ownership.
• Rose City Ford is a 65,000-square-foot dealership thatemploys approximately 65 staff and sells approximately1,425 vehicles annually.
acquired two dealerships from
acquired
Location British Columbia
Date January 2019
Location Ontario
Date February 2019
• Peace Arch Toyota in South Surrey is being rebrandedOpenRoad Toyota Peace Arch, following the company’srecent acquisition by OpenRoad Auto Group.
• The acquisition marks the dealership group’s fourthB.C. Toyota dealership and 28th automotive retaillocation.
acquired
• Founded in 1948, Redhead is alarge and comprehensive multi-line heavy equipment dealer inSaskatchewan.
• Norsask is a full-service Case IHfarm equipment dealershiplocated near North Battleford,Saskatchewan.
acquiredLocation Saskatchewan
Date November 2018

Page 10
SELECT RECENT M&A TRANSACTIONS
Location Ontario
Date March 2019
• Downtown Automotive Group of Toronto, Canada, hasacquired the Toronto Chrysler Dodge Jeep Ramdealership from publicly-listed AutoCanada andchanged the name to Downtown Chrysler.
• Downtown AutoGroup is a collection of 11 automobilesales and service facilities representing 12 of the mostrespected brands in the automotive world.
Location Ontario
Date March 2019
acquired a dealership from
• Automotive Properties Real Estate Investment Trustannounced that it has entered into agreements topurchase two automotive dealership properties inWinnipeg, Manitoba from AutoCanada Inc. forapproximately $23.95 million.
• The two dealership properties are the McNaughtCadillac Buick GMC and the St. James Volkswagenautomotive dealership property.
acquired the property of
Page 11
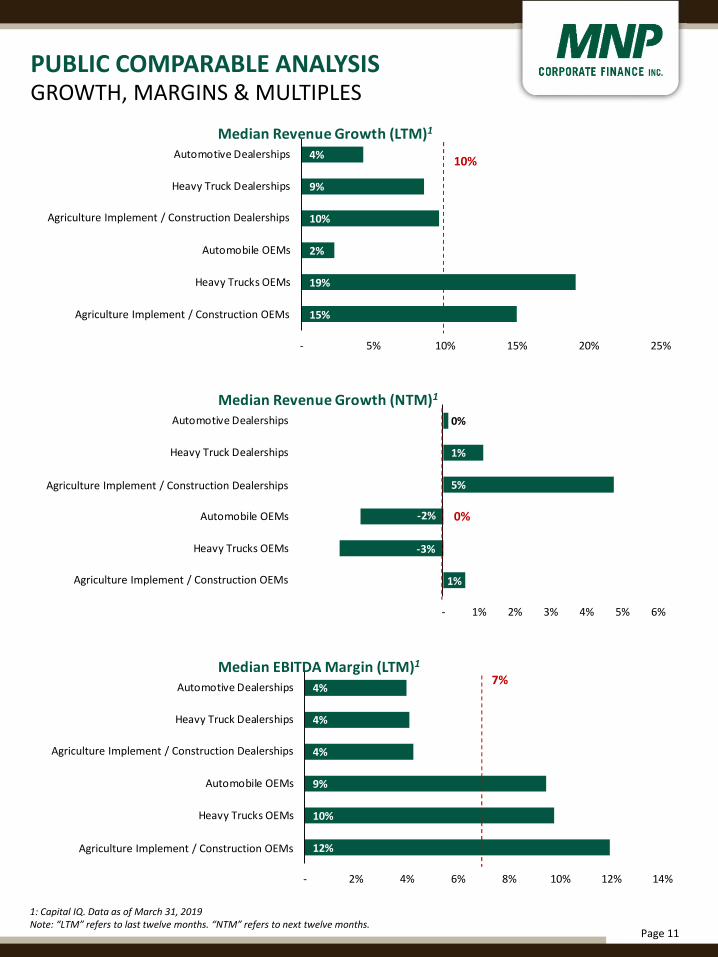
PUBLIC COMPARABLE ANALYSISGROWTH, MARGINS & MULTIPLES
12%
10%
9%
4%
4%
4%
- 2% 4% 6% 8% 10% 12% 14%
Agriculture Implement/Construction OEMs
Heavy Trucks OEMs
Automobile OEMs
Agriculture Implement/Construction Dealerships
Heavy Truck Dealerships
Automotive Dealerships
Median EBITDA Margin (LTM)1
1%
-3%
-2%
5%
1%
0%
- 1% 2% 3% 4% 5% 6%
Agriculture Implement/Construction OEMs
Heavy Trucks OEMs
Automobile OEMs
Agriculture Implement/Construction Dealerships
Heavy Truck Dealerships
Automotive Dealerships
Median Revenue Growth (NTM)1
15%
19%
2%
10%
9%
4%
- 5% 10% 15% 20% 25%
Agriculture Implement/Construction OEMs
Heavy Trucks OEMs
Automobile OEMs
Agriculture Implement/Construction Dealerships
Heavy Truck Dealerships
Automotive Dealerships
Median Revenue Growth (LTM)1
10%
0%
7%
1: Capital IQ. Data as of March 31, 2019Note: “LTM” refers to last twelve months. “NTM” refers to next twelve months.
Agriculture Implement / Construction Dealerships
Agriculture Implement / Construction Dealerships
Agriculture Implement / Construction Dealerships
Agriculture Implement / Construction OEMs
Agriculture Implement / Construction OEMs
Agriculture Implement / Construction OEMs

Page 12
PUBLIC COMPARABLE ANALYSISGROWTH, MARGINS & MULTIPLES
9.8x
9.2x
9.6x
11.7x
8.9x
11.4x
- 2.0x 4.0x 6.0x 8.0x 10.0x 12.0x 14.0x
Agriculture Implement/Construction OEMs
Heavy Trucks OEMs
Automobile OEMs
Agriculture Implement/Construction Dealerships
Heavy Truck Dealerships
Automotive Dealerships
Median EV/EBITDA (NTM)1
10.2x
9.3x
7.2x
11.7x
9.0x
10.5x
- 2.0x 4.0x 6.0x 8.0x 10.0x 12.0x 14.0x
Agriculture Implement/Construction OEMs
Heavy Trucks OEMs
Automobile OEMs
Agriculture Implement/Construction Dealerships
Heavy Truck Dealerships
Automotive Dealerships
Median EV/EBITDA (LTM)1
14%
11%
10%
4%
4%
4%
- 2% 4% 6% 8% 10% 12% 14% 16%
Agriculture Implement/Construction OEMs
Heavy Trucks OEMs
Automobile OEMs
Agriculture Implement/Construction Dealerships
Heavy Truck Dealerships
Automotive Dealerships
Median EBITDA Margin (NTM)1
8%
9.6x
10.1x
1: Capital IQ. Data as of March 31st, 2019.Note: “LTM” refers to last twelve months. “NTM” refers to next twelve months. EV/EBITDA multiples may include real estate.
Agriculture Implement / Construction Dealerships
Agriculture Implement/Construction Dealerships
Agriculture Implement / Construction Dealerships
Agriculture Implement / Construction OEMs
Agriculture Implement / Construction OEMs
Agriculture Implement / Construction OEMs
Page 13
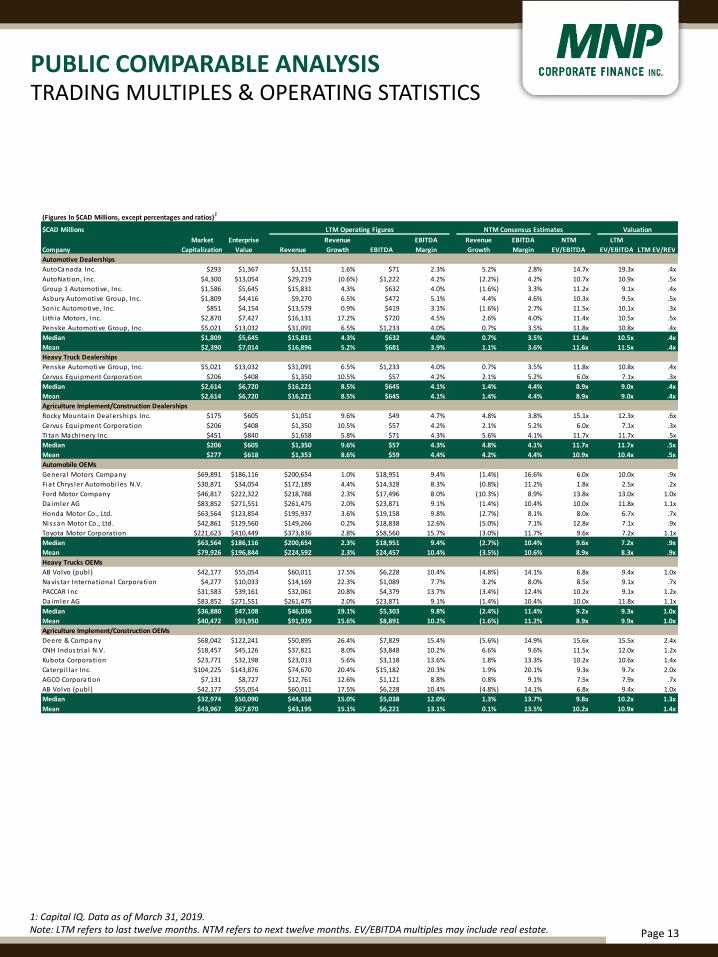
PUBLIC COMPARABLE ANALYSISTRADING MULTIPLES & OPERATING STATISTICS
$CAD Millions
Company
Market
Capitalization
Enterprise
Value Revenue
Revenue
Growth EBITDA
EBITDA
Margin
Revenue
Growth
EBITDA
Margin
NTM
EV/EBITDA
LTM
EV/EBITDA LTM EV/REV
Automotive Dealerships
AutoCanada Inc. $293 $1,367 $3,151 1.6% $71 2.3% 5.2% 2.8% 14.7x 19.3x .4x
AutoNation, Inc. $4,300 $13,054 $29,219 (0.6%) $1,222 4.2% (2.2%) 4.2% 10.7x 10.9x .5x
Group 1 Automotive, Inc. $1,586 $5,645 $15,831 4.3% $632 4.0% (1.6%) 3.3% 11.2x 9.1x .4x
Asbury Automotive Group, Inc. $1,809 $4,416 $9,270 6.5% $472 5.1% 4.4% 4.6% 10.3x 9.5x .5x
Sonic Automotive, Inc. $851 $4,154 $13,579 0.9% $419 3.1% (1.6%) 2.7% 11.5x 10.1x .3x
Lithia Motors , Inc. $2,870 $7,427 $16,131 17.2% $720 4.5% 2.6% 4.0% 11.4x 10.5x .5x
Penske Automoti ve Group, Inc. $5,021 $13,032 $31,091 6.5% $1,233 4.0% 0.7% 3.5% 11.8x 10.8x .4x
Median $1,809 $5,645 $15,831 4.3% $632 4.0% 0.7% 3.5% 11.4x 10.5x .4x
Mean $2,390 $7,014 $16,896 5.2% $681 3.9% 1.1% 3.6% 11.6x 11.5x .4x
Heavy Truck Dealerships
Penske Automoti ve Group, Inc. $5,021 $13,032 $31,091 6.5% $1,233 4.0% 0.7% 3.5% 11.8x 10.8x .4x
Cervus Equi pment Corporati on $206 $408 $1,350 10.5% $57 4.2% 2.1% 5.2% 6.0x 7.1x .3x
Median $2,614 $6,720 $16,221 8.5% $645 4.1% 1.4% 4.4% 8.9x 9.0x .4x
Mean $2,614 $6,720 $16,221 8.5% $645 4.1% 1.4% 4.4% 8.9x 9.0x .4x
Agriculture Implement/Construction Dealerships
Rocky Mounta in Dea l ershi ps Inc. $175 $605 $1,051 9.6% $49 4.7% 4.8% 3.8% 15.1x 12.3x .6x
Cervus Equi pment Corporati on $206 $408 $1,350 10.5% $57 4.2% 2.1% 5.2% 6.0x 7.1x .3x
Ti tan Machinery Inc. $451 $840 $1,658 5.8% $71 4.3% 5.6% 4.1% 11.7x 11.7x .5x
Median $206 $605 $1,350 9.6% $57 4.3% 4.8% 4.1% 11.7x 11.7x .5x
Mean $277 $618 $1,353 8.6% $59 4.4% 4.2% 4.4% 10.9x 10.4x .5x
Automobile OEMs
Genera l Motors Company $69,891 $186,116 $200,654 1.0% $18,951 9.4% (1.4%) 16.6% 6.0x 10.0x .9x
Fi a t Chrys ler Automobi l es N.V. $30,871 $34,054 $172,189 4.4% $14,328 8.3% (0.8%) 11.2% 1.8x 2.5x .2x
Ford Motor Company $46,817 $222,322 $218,788 2.3% $17,496 8.0% (10.3%) 8.9% 13.8x 13.0x 1.0x
Da imler AG $83,852 $271,551 $261,475 2.0% $23,871 9.1% (1.4%) 10.4% 10.0x 11.8x 1.1x
Honda Motor Co., Ltd. $63,564 $123,854 $195,937 3.6% $19,158 9.8% (2.7%) 8.1% 8.0x 6.7x .7x
Nissan Motor Co., Ltd. $42,861 $129,560 $149,266 0.2% $18,838 12.6% (5.0%) 7.1% 12.8x 7.1x .9x
Toyota Motor Corporation $221,623 $410,449 $373,836 2.8% $58,560 15.7% (3.0%) 11.7% 9.6x 7.2x 1.1x
Median $63,564 $186,116 $200,654 2.3% $18,951 9.4% (2.7%) 10.4% 9.6x 7.2x .9x
Mean $79,926 $196,844 $224,592 2.3% $24,457 10.4% (3.5%) 10.6% 8.9x 8.3x .9x
Heavy Trucks OEMs
AB Volvo (publ) $42,177 $55,054 $60,011 17.5% $6,228 10.4% (4.8%) 14.1% 6.8x 9.4x 1.0x
Navis tar Internationa l Corporation $4,277 $10,033 $14,169 22.3% $1,089 7.7% 3.2% 8.0% 8.5x 9.1x .7x
PACCAR Inc $31,583 $39,161 $32,061 20.8% $4,379 13.7% (3.4%) 12.4% 10.2x 9.1x 1.2x
Da imler AG $83,852 $271,551 $261,475 2.0% $23,871 9.1% (1.4%) 10.4% 10.0x 11.8x 1.1x
Median $36,880 $47,108 $46,036 19.1% $5,303 9.8% (2.4%) 11.4% 9.2x 9.3x 1.0x
Mean $40,472 $93,950 $91,929 15.6% $8,891 10.2% (1.6%) 11.2% 8.9x 9.9x 1.0x
Agriculture Implement/Construction OEMs
Deere & Company $68,042 $122,241 $50,895 26.4% $7,829 15.4% (5.6%) 14.9% 15.6x 15.5x 2.4x
CNH Industri a l N.V. $18,457 $45,126 $37,821 8.0% $3,848 10.2% 6.6% 9.6% 11.5x 12.0x 1.2x
Kubota Corporati on $23,771 $32,198 $23,013 5.6% $3,118 13.6% 1.8% 13.3% 10.2x 10.6x 1.4x
Caterpi l la r Inc. $104,225 $143,876 $74,670 20.4% $15,182 20.3% 1.9% 20.1% 9.3x 9.7x 2.0x
AGCO Corporation $7,131 $8,727 $12,761 12.6% $1,121 8.8% 0.8% 9.1% 7.5x 7.9x .7x
AB Volvo (publ) $42,177 $55,054 $60,011 17.5% $6,228 10.4% (4.8%) 14.1% 6.8x 9.4x 1.0x
Median $32,974 $50,090 $44,358 15.0% $5,038 12.0% 1.3% 13.7% 9.8x 10.2x 1.3x
Mean $43,967 $67,870 $43,195 15.1% $6,221 13.1% 0.1% 13.5% 10.2x 10.9x 1.4x
(Figures In $CAD Millions, except percentages and ratios)1
LTM Operating Figures NTM Consensus Estimates Valuation
1: Capital IQ. Data as of March 31, 2019.Note: LTM refers to last twelve months. NTM refers to next twelve months. EV/EBITDA multiples may include real estate.
Page 14
MNPCF – LEADERSHIP TEAM
DUE DILIGENCE LEADERSHIP
TRANSACTION LEADERSHIP
Aleem BandaliManaging Director
Dale AntonsenManaging Director
John CaggianielloManaging Director
[email protected] 416.513.4177
Brett FranklinPresident
Mike ReynoldsManaging Director
Johnny EarlManaging Director
[email protected] 604.637.1514
Dan PorterManaging Director
Stephen ShawManaging Director
Jason BurgessManaging Director
Mark RegehrManaging Director
Craig MaloneyManaging Director
Patrick KhouzamManaging Director
Page 15
MNPCF – RECENTLY CLOSED DEALS
NATIONAL