Embed Size (px)
Citation preview

Dealership Financial Statement Analysis: The Advanced Course
WithRon Sompels, CPAstrong
Moderated byMike Bowers, Executive Editor at DealersEdge

Ron Sompels, CPAstrongRon Sompels, CPA: Ronald Sompels is a partner at Crowe Horwath LLP, a top 10 public accounting and consulting firm. Mr. Sompels, a CPA and CPIM, is the Partner-in-Charge of Crowe’s Retail Dealer industry horizontal and has more than 30 years experience in providing assurance, tax, risk management, financial advisory, and performance consulting services to more than 600 retail dealerships.
He has conducted courses on many subjects, including inventory control, and is a published writer, with articles featured in trade magazines, periodicals, and business journals.
Mr. Sompels holds a Bachelor of Business Administration in Accounting from Western Michigan University.

The Unique Alternative to the Big Four®
How to Read and Analyze the DealershipFinancial Statement
Ron Sompels, PartnerCrowe Horwath LLP

The Unique Alternative to the Big Four®
Audit | Tax | Advisory | Risk | Performance © 2014 Crowe Horwath LLP 4
Operating Statement
�Before reviewing the operating statement you should understand that under “Dealership Accounting” many items get buried in “Other Income”
�Often this line in the operating statement contains the majority of the dealer income!
� Need to understand what is in here
� Packs
� Incentives
� Doc fees
� Other items
�Also understand the Dealership’s policy of Accounting for manufacturing assistance

The Unique Alternative to the Big Four®
Audit | Tax | Advisory | Risk | Performance © 2014 Crowe Horwath LLP 5
Other Income ReclassificationsOther Income/Other Deduction BalancesDealership: Sample Toyota Store
Account # Account Name Line on Fin Stmt YTD Balance Reclass to:5121New Vehicle Pack Other Income (150,700) New Vehicle Gross5221Used Vehicle Pack Other Income (236,290) Used Vehicle Gross9140Doc Fees-New Other Income (300,196) New Vehicle Gross9145Rental Income Rental Income (4,940) Leave Other Income9150Misc Income Other Income (292,195) New Vehicle Gross9151DT Holdback Other Income - New Vehicle Gross9152Bad Debt Writeoff Other Income 8,853 Bad Debt Expense9155Haz Mat Shop Supply Other Income (3,099) Service Gross9240Doc Fees-Used Other Income (176,709) Used Vehicle Gross
9420Credit Card Discounts Other Deductions 7,991 Misc Expense9440Cash Discount Other Deductions - Leave Other Income9450Misc Income-Svc Other Deductions (1,410) Service Gross9470Rental Vehicles Other Deductions 15 Leave Other Deductions9480Misc Deductions Other Deductions 7 Leave Other Deductions
Total Other income/deductions (1,148,673)
New Vehicle Gross (743,091)Used Vehicle Gross (412,999)Service Gross (4,509)
Total (1,160,599)
Other 11,926
Total Other income/deductions (1,148,673)

The Unique Alternative to the Big Four®
Audit | Tax | Advisory | Risk | Performance © 2014 Crowe Horwath LLP 6
Departmental Operating Analysis
� There are several ways that the Manufacturer’s statements present this.
� Most show a “Total Dealership” column which includes� Sales� Gross Profit� Itemized List of Expenses
� Expenses are listed in various categories� Selling Expenses� Personnel Expenses� Variable Expenses� Departmental Operating Expenses� Semi Fixed Expenses� Overhead Expenses� Fixed Expenses
� Expenses are also measured as percent to total gross, per new vehicle sold, or percent to total sales
� The same format is used to show each department’s expense which adds to the total

The Unique Alternative to the Big Four®
Audit | Tax | Advisory | Risk | Performance © 2014 Crowe Horwath LLP 7
Departmental Operating Analysis
�Problems
� No common format makes it difficult to compare stores
� No comparative data or benchmarks
�Many of the expenses (mostly fixed in nature such as insurance, rent, or others such as employee benefits or payroll taxes) are difficult for department managers to control. They are allocated to the departments based on square footage or personnel cost.
� Need a better way to manage
�Many Dealers have a tool they use to analyze their statements. Ask them for it!!

The Unique Alternative to the Big Four®
Audit | Tax | Advisory | Risk | Performance © 2014 Crowe Horwath LLP 8
�A good analysis tool will. . .
� Contain comparative data
� Analyze contribution margin by department
� Analyze controllable expense as a percent to gross
� Segregate fixed costs
� Compare to benchmarks
�Suggest separating expenses into two categories
� Controllable Expenses
� Non Controllable Expenses
Departmental Operating Analysis

The Unique Alternative to the Big Four®
Audit | Tax | Advisory | Risk | Performance © 2014 Crowe Horwath LLP 9
CONTROLLABLE EXPENSES
Commissions
Advertising & Promotion
Supervision
Interest - Floorplan
F&I Compensation and Expense
Demos/Company Vehicles
Other Salaries
Prep, Deliver & Policy
Other Controllable Expenses *
Total Controllable Expenses
* Includes Equipment, Other Supplies and Training
New and Used Vehicle Departments - Controllable
Departmental Operating Analysis

The Unique Alternative to the Big Four®
Audit | Tax | Advisory | Risk | Performance © 2014 Crowe Horwath LLP 10
* Includes Equipment, Other Supplies and Training
New and Used Vehicle – Establish Benchmarks as a % to Gross Profit
% of Total Gross
CONTROLLABLE EXPENSES New Used
Commissions 24.0% 23.0%
Advertising & Promotion 12.5% 13.0%
Supervision 10.0% 10.0%
Interest - Floorplan 0.0% 1.0%
F&I Compensation and Expense
Demos/Company Vehicles 2.0% 1.0%
Other Salaries 3.5% 3.5%
Prep, Deliver & Policy 2.0% 2.0%
Other Controllable Expenses * 1.5% 1.5%
Total Controllable Expenses 55.5% 55.0%
Departmental Operating Analysis

The Unique Alternative to the Big Four®
Audit | Tax | Advisory | Risk | Performance © 2014 Crowe Horwath LLP 11
* Includes Equipment, Other Supplies and Training
Fixed Operations Departments - Controllable
CONTROLLABLE EXPENSES
Salaries & Wages
Advertising
Demos/Company Vehicles
Policy Adjustment
Tools & Supplies
Other Controllable Expenses *
Total Controllable Expenses
Departmental Operating Analysis

The Unique Alternative to the Big Four®
Audit | Tax | Advisory | Risk | Performance © 2014 Crowe Horwath LLP 12
* Includes Equipment, Other Supplies and Training
Fixed Operations Departments - Controllable
% of Total Gross
CONTROLLABLE EXPENSES Serv. Parts Body
Salaries & Wages 34.0% 28.0% 34.0%
Advertising 2.5% 4.0% 2.0%
Demos/Company Vehicles 1.0% 2.0% 1.0%
Policy Adjustment 2.0% 0.5% 2.0%
Tools & Supplies 7.0% 1.5% 3.0%
Other Controllable Expenses * 2.0% 2.6% 1.5%
Total Controllable Expenses 48.5% 38.6% 43.5%
Departmental Operating Analysis

The Unique Alternative to the Big Four®
Audit | Tax | Advisory | Risk | Performance © 2014 Crowe Horwath LLP 13
Other Non Controllable Expenses
% of Total Gross
EMPLOYEE EXPENSES
Salary Administrative 3.0%
Employee Benefits 3.0%
Payroll Taxes 4.0%
Total Employee Expenses 10.0%
INSTITUTIONAL EXPENSES
Institutional Advertising 0.0%
Insurance 2.0%
Office Supplies 0.7%
Taxes - Other 3.0%
Total Institutional Expenses 5.7%
SERVICES
Data Processing 1.7%
Outside Services 2.9%
Professional Services 1.0%
Total Services 5.6%
Departmental Operating Analysis

The Unique Alternative to the Big Four®
Audit | Tax | Advisory | Risk | Performance © 2014 Crowe Horwath LLP 14
Other Non Controllable Expenses
% of Total GrossFACILITY
Telephone 1.0%
Utilities 2.5%
Insurance - Building 0.0%
Repairs and Maintenance 0.0%
Taxes - Real Estate 0.0%
Total Facility 3.5%
MISCELLANEOUS EXPENSES
Depreciation 1.5%
Interest 1.0%
Miscellaneous 0.5%
Travel & Entertainment 0.5%
Other General & Administrative 0.0%
Total Miscellaneous Expenses 3.5%
Total Before Rent 28.3%
Rent & Equivalent 7.0%
Total Non-Controllable Expenses 35.3%
Departmental Operating Analysis

The Unique Alternative to the Big Four®
Audit | Tax | Advisory | Risk | Performance © 2014 Crowe Horwath LLP 15
CONTROLLABLE EXPENSESBench
% of GrossMarch April May
Commissions 23.0% 320,062 14.7% 435,663 13.8% 410,304 13.3%
Advertising & Promotion 13.0% 177,428 8.1% 172,795 5.5% 154,581 5.0%
Supervision 10.0% 275,461 12.6% 428,139 13.5% 456,745 14.8%
Interest - Floorplan 1.0% 128 0.0% 0 0.0% 2,428 0.1%
F&I Compensation and Exp 58,861 2.7% 82,567 2.6% 73,374 2.4%
Demos/Company Vehicles 1.0% 20,640 0.9% 21,511 0.7% 28,492 0.9%
Other Salaries 3.5% 8,500 0.4% 9,750 0.3% 11,587 0.4%
Prep, Delivery & Policy 2.0% 35,876 1.6% 52,941 1.7% 56,277 1.8%
Other Controllable Expenses * 1.5% 8,992 0.4% 3,476 0.1% 11,056 0.4%
Total Controllable Expenses 55.0% 905,949 41.5% 1,206,842 38.1% 1,204,844 39.1%
Make Comparable
Departmental Operating Analysis

The Unique Alternative to the Big Four®
Audit | Tax | Advisory | Risk | Performance © 2014 Crowe Horwath LLP 16
Benchmark Dec 2011 (YTD) Per unit Dec 2012 (YTD) Per Unit Dec 2013 (YTD)
SALES - UNITS
New Car - Retail 463 554 545
New Truck - Retail 419 167 209
Total New Units 882 721 754
GROSS
New Car - Retail 1700 4,401,260 9,506 3,030,597 5,470 4,333,460 7,951
New Car Incentives (Memo Only) 4,179,152 (0) 2,775,825 (0) 3,969,179 0
New Truck - Retail 1550 183,598 438 (140,785) (843) 120,734 578
New Truck Incentives (Memo Only) 0 0 0 0 1 0
New F&I 700 418,861 475 464,250 644 748,653 993
Fleet & Other New 400 41,144 5,005 25,110
Total New Gross 5,044,864 5,720 3,359,067 4,659 5,227957 6,933
NewGross Profit Analysis

The Unique Alternative to the Big Four®
Audit | Tax | Advisory | Risk | Performance © 2014 Crowe Horwath LLP 17
Benchmark Dec 2011 (YTD) Dec 2012 (YTD) Dec 2013 (YTD)SALES - UNITSUsed Car Retail 161 238 175 Used Car Retail - Certified 253 469 502
Used Truck - Retail 0 0 0 Used Truck - Retail - Certified 0 0 0
Wholesale 314 444 559 Total Used Units 728 1,151 1,236
GROSSUsed Car - Retail 1,600 736,403 4,574 752,968 3,164 378,321 2,162 Used Car - Retail - Certified - 949,615 3,753 1,496,346 3,191 1,459,827 2,908
-Used Truck - Retail 1,600 0 0 0 0 0 0 Used Truck - Retail - Certified - 0 0 0 0 0 0
Wholesale - 214,988 685 356,554 803 745,663 1,334
Used F&I 700 282,892 687 559,578 791 496,388 733
Other Used - 0 0 0 Total Used Gross 2,183,898 5,301 3,165,446 4,477 3,080,199 4,550
UsedGross Profit Analysis

The Unique Alternative to the Big Four®
Audit | Tax | Advisory | Risk | Performance © 2014 Crowe Horwath LLP 18
Gross Profit Analysis
BenchmarkDec 2008
(YTD)Dec 2009
(YTD)Dec 2010
(YTD)
SERVICE SALES
Customer Pay 2,647,869 52.1% 3,151,689 61.2% 3,401,948 64.0%
Warranty 1,438,500 28.3% 1,005,306 19.5% 900,096 16.9%
Internal 421,193 8.3% 528,489 10.3% 515,657 9.7%
Sublet 330,582 6.5% 216,177 4.2% 245,418 4.6%
Other 245,453 4.8% 251,105 4.9% 255,341 4.8%
Total Service Sales 5,083,595 100.0% 5,152,765 100.0% 5,318,460 100.0%
GROSS PROFIT
Customer Pay 72.0% 2,066,958 78.1% 2,515,586 79.8% 2,758,045 81.1%
Warranty 72.0% 1,093,373 76.0% 783,420 77.9% 701,715 78.0%
Internal 69.0% 307,206 72.9% 379,309 71.8% 377,448 73.2%
Sublet 7.0% 78,200 23.7% 67,928 31.4% 66,435 27.1%
Other 0.0% 126,906 51.7% 125,822 50.1% 113,172 44.3%
Unapplied (-) 0.0% (3,747) -0.1% 0 0.0% 0 0.0%
Total Service Gross 3,668,896 72.2% 3,872,065 75.1% 4,016,815 75.5%
Service

The Unique Alternative to the Big Four®
Audit | Tax | Advisory | Risk | Performance © 2014 Crowe Horwath LLP 19
BenchmarkDec 2008
(YTD)Dec 2009
(YTD)Dec 2010
(YTD)PARTS SALES
Customer Pay 2,344,063 39.0% 2,814,888 45.2% 2,748,845 44.3%Warranty 1,918,002 31.9% 1,339,613 21.5% 1,347,757 21.7%
Internal 208,673 3.5% 335,592 5.4% 288,164 4.6%Wholesale 631,223 10.5% 700,869 11.3% 674,144 10.9%Counter 192,443 3.2% 169,916 2.7% 153,268 2.5%
Other 717,731 11.9% 862,202 13.9% 994,932 16.0%Total Parts Sales 6,012,135 100.0% 6,223,080 100.0% 6,207,110 100.0%
GROSS PROFIT
Customer Pay 40.0% 959,112 40.9% 1,165,989 41.4% 1,119,883 40.7%Warranty 27.0% 540,382 28.2% 394,095 29.4% 416,410 30.9%
Internal 20.0% 35,599 17.1% 66,528 19.8% 54,621 19.0%Wholesale 23.0% 147,341 23.3% 166,536 23.8% 176,663 26.2%Counter 34.0% 70,033 36.4% 59,589 35.1% 61,464 40.1%
Other 20.0% 122,753 17.1% 131,464 15.2% 162,214 16.3%Parts Adjustment 0.0% 313 0.0% (66,820) -1.1% (100,735) -1.6%
Total Parts Gross 30.0% 1,875,533 31.2% 1,917,382 30.8% 1,890,520 30.5%
Parts
Gross Profit Analysis

The Unique Alternative to the Big Four®
Audit | Tax | Advisory | Risk | Performance © 2014 Crowe Horwath LLP 20
� Sometimes it is helpful to look at controllable expenses on a per unit basis
� Commissions (new and used)
� Advertising (new and used)
� Supervision (new and used)
� Also make sure periods being analyzed are comparable. (Annualize results if necessary)
� Other measures that are helpful
� New and used vehicle and parts inventory days supply
� Floorplan to Inventory Ratio
� CIT/VR days supply; P&S receivable days supply; Warranty receivable days supply; Finance Receivables days supply
� Avg. Cost of used retail units sold to Avg. (FIFO) cost of units in inventory
Other Metrics That Are Helpful

The Unique Alternative to the Big Four®
Audit | Tax | Advisory | Risk | Performance © 2014 Crowe Horwath LLP 21
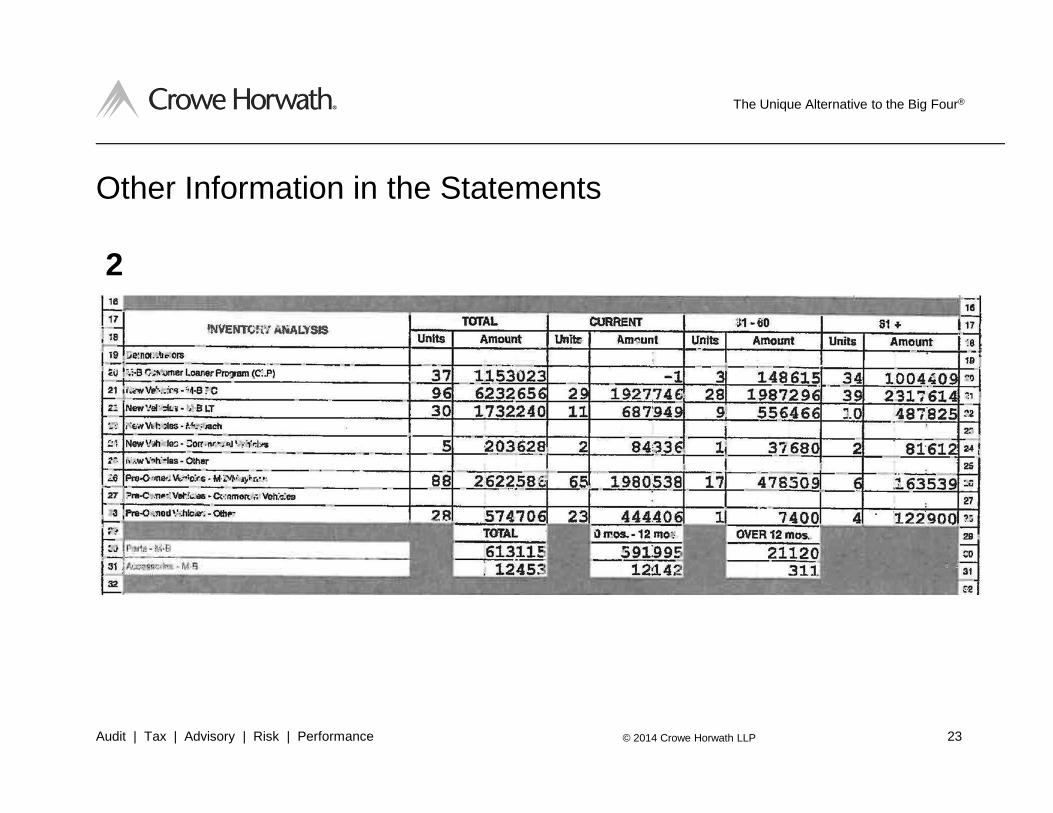
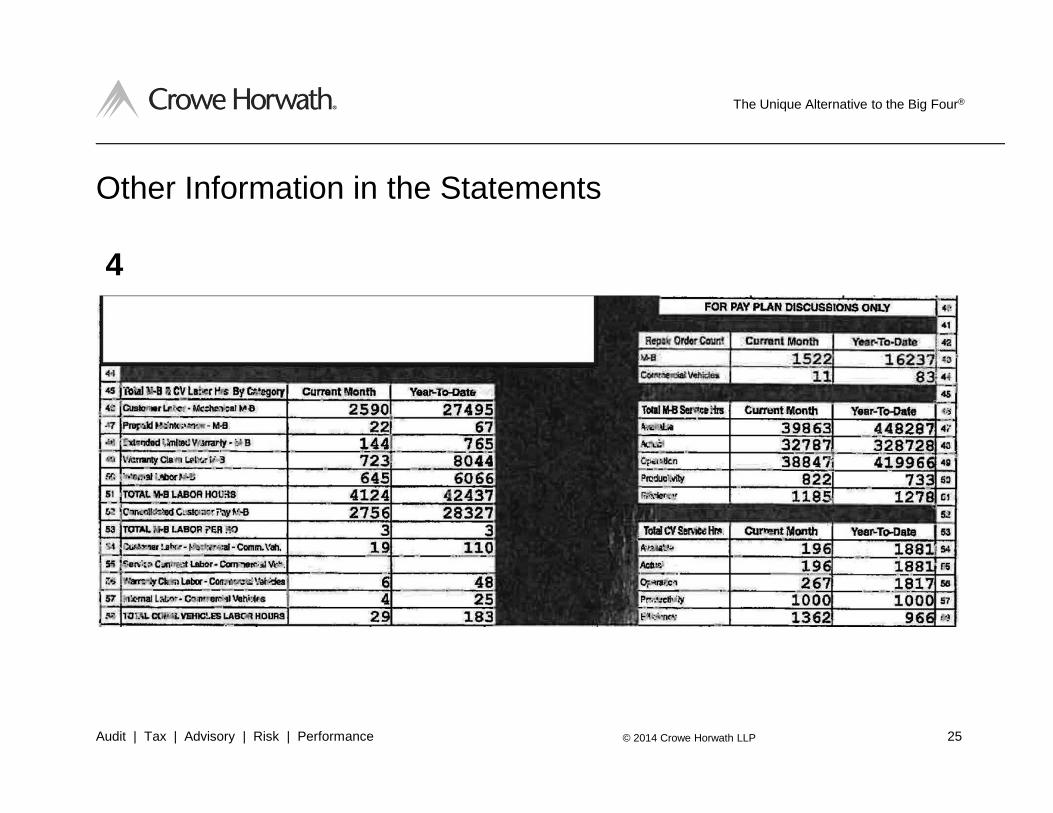
� Be careful because much of the information is based on “Memo Accounts” which are inputted monthly
� Receivable Analysis
� Inventory Analysis
� Hourly Labor Rates for Technicians
� Labor Hours
� Repair Order Counts
Other Information in the Statements

The Unique Alternative to the Big Four®
Audit | Tax | Advisory | Risk | Performance © 2014 Crowe Horwath LLP 22
Other Information in the Statements
1
The Unique Alternative to the Big Four®
Audit | Tax | Advisory | Risk | Performance © 2014 Crowe Horwath LLP 23
Other Information in the Statements
2

The Unique Alternative to the Big Four®
Audit | Tax | Advisory | Risk | Performance © 2014 Crowe Horwath LLP 24
Other Information in the Statements
3
The Unique Alternative to the Big Four®
Audit | Tax | Advisory | Risk | Performance © 2014 Crowe Horwath LLP 25
Other Information in the Statements
4

The Unique Alternative to the Big Four®
Audit | Tax | Advisory | Risk | Performance © 2014 Crowe Horwath LLP 26
Other Information in the Statements
5

The Unique Alternative to the Big Four®
Audit | Tax | Advisory | Risk | Performance © 2014 Crowe Horwath LLP 27
Key Benchmarks by Department

The Unique Alternative to the Big Four®
Audit | Tax | Advisory | Risk | Performance © 2014 Crowe Horwath LLP 28
Key Benchmarks by Department

D
EA
LE
RS
HIP
OP
ER
AT
ION
AL
GU
IDE
S

OP
ER
AT
ION
AL
GU
IDE
S
The 5
0 O
pera
tional G
uid
es lis
t the c
ritical ite
ms u
nder th
e d
irect c
ontro
l and in
flue
nce o
f the d
ea
lers
hip
m
anagers
. The
y c
an b
e m
easure
d m
onth
ly a
nd a
ll will e
ve
ntu
ally
be in
corp
ora
ted in
to th
e q
uarte
rly b
ud
get
revie
w p
rocess.
These g
uid
es a
re e
sta
blis
hed b
oth
for th
e d
eale
rship
and b
y d
epartm
ent, a
nd w
ill be re
vie
wed
on a
reg
ula
r basis
to m
ake s
ure
the
y re
main
rele
vant.
Deale
rship
s s
hould
measure
the
ir pro
gre
ss to
ward
s th
ese ta
rge
ts. O
nce a
sp
ecific
targ
et h
as b
een m
et th
en
oth
er a
reas c
an b
e a
ddre
ssed.
The c
ontro
ller, c
om
parin
g a
ctu
al re
su
lts to
these g
uid
es, s
hould
investig
ate
and
report m
onth
ly o
n s
ign
ificant
varia
nces. D
epartm
ent m
anagers
, in c
onju
nctio
n w
ith th
e m
anagem
ent s
taff, s
hould
initia
te a
ny c
ha
nges
necessary
. D
EA
LE
RS
HIP
MA
NA
GE
ME
NT
GU
IDE
S
2012
2013
T
arg
et
Actu
al
A
ctu
al Y
TD
1 C
ash in
bank p
lus s
ecu
rities
60 d
ays o
f exp.
2 R
etu
rn o
n C
ontro
llable
Assets
35%
3 N
et P
rofit a
s a
% o
f Gro
ss P
rofit
20%
4 N
et P
rofit a
s a
% o
f Sale
s
2%
+
5 F
ixed C
overa
ge - (F
rom
GM
Sta
tem
ent)
D
eale
rship
s w
/o B
od
y S
ho
ps
70%
Deale
rship
s w
/ Bod
y S
hops
85%
6 T
ota
l Gro
ss p
er e
mplo
ye
e –
Deale
rship
$7,5
00
D
EA
LE
RS
HIP
EX
PE
NS
ES
7 V
aria
ble
Expe
nse a
s a
% o
f Varia
ble
G/P
26%
8 P
ers
onne
l Expense a
s a
% o
f Tota
l G/P
33%
9 S
em
i Fix
ed E
xpe
nse a
s a
% o
f Tota
l G/P
20%
10 F
ixe
d E
xp
ense a
s a
% o
f Tota
l G/P
16%
N
EW
& U
SE
D V
EH
ICL
E
11 V
eh
icle
Sa
les p
er s
ale
spers
on p
er m
onth
10
12 C
.S.I. S
core
s
E
q. to
reg
ion
13 N
ew
Veh
icle
Invento
ry D
ays S
up
ply
45
14 U
sed
Ve
hic
le In
ve
nto
ry D
ays S
up
ply
45
15 M
ana
ger to
sale
s p
ers
on ra
tio
1:6
16 G
ross P
rofit p
er e
mplo
yee –
Sh
ow
room
$8,5
00
17 U
sed
Cars
reta
iled a
s a
% o
f tota
l reta
il sa
les 5
0%
18 U
sed
Cars
wh
ole
sa
led a
s a
% o
f tota
l use
d c
ar s
ale
s
(w
hole
sale
plu
s re
tail)
50%

FIN
AN
CE
& IN
SU
RA
NC
E
2012
2013
YT
D
Targ
et
Actu
al
A
ctu
al
19 G
ross F
&I In
com
e p
er re
tail u
nit s
old
$600
20 N
et F
&I In
com
e p
er re
tail u
nit s
old
$400
21 F
inance R
eserv
e $
to T
ota
l F &
I Inc. a
s a
%
60%
22 C
om
bin
ed E
xte
nd
ed W
arra
nty
Pen
etra
tion
60%
23 R
eta
il units
so
ld p
er F
&I M
an
ager
75
S
ER
VIC
E D
EP
AR
TM
EN
T
24 G
ross a
s a
% o
f Labor (A
dj. C
ost o
f Lb
r) 73%
25 R
eta
ined
Incom
e a
fter C
ontro
llable
Exp
ense 4
5%
26 S
erv
ice W
riter C
om
p. a
s a
% o
f Gro
ss P
rofit
less th
an 1
0%
27 S
upp
ort P
ers
onn
el to
Technic
ian R
atio
1:3
28 T
echnic
ian p
roductiv
ity -
Import
120%
D
om
estic
110%
29 C
.P. H
ours
per R
.O.
2
30 S
erv
ice G
ross p
er e
mplo
ye
e
$6,0
00
31 C
.S.I. S
core
s
E
q. R
eg
ion
32 P
olic
y E
xpe
nse a
s a
% o
f Serv
ice G
ross
2%
or le
ss
33 S
upp
ly E
xp
ense a
s a
% o
f Serv
ice G
ross
3%
or le
ss

DE
AL
ER
SH
IP M
AN
AG
EM
EN
T G
UID
ES
T
arg
et
C
alc
ula
tion M
eth
od
1 C
ash In
Bank p
lus S
ecuritie
s
60 d
ays o
f expe
nses
1) Y
TD
Expenses.
2) D
ivid
e b
y #
of c
ale
ndar
da
ys Y
TD
to g
et a
daily
expense ra
te.
3) D
ivid
e c
ash in
bank
am
ount b
y re
su
lt of s
tep
#2
2 R
etu
rn o
n C
ontro
llable
Assets
35%
1) T
ota
l Assets
, less N
ote
s
Pa
yab
le-V
eh
icle
s, le
ss
Oth
er A
ssets
, less C
ash
and S
ecuritie
s.
2) A
nnua
lize N
et In
com
e
YT
D
3) D
ivid
e re
su
lt in s
tep
#2
by #
1
3 N
et P
rofit a
s a
% o
f Gro
ss P
rofit
20%
Div
ide T
ota
l Net P
rofit b
y
Tota
l Gro
ss P
rofit.
4 N
et P
rofit a
s a
% o
f Sale
s
2%
Div
ide T
ota
l Net P
rofit b
y
Tota
l Sa
les
5 F
ixed C
overa
ge - (F
rom
GM
Sta
tem
ent)
D
eale
rship
s w
/o B
od
y S
ho
ps
70%
Deale
rship
s w
/ Bod
y S
hops
85%
6 T
ota
l Gro
ss p
er e
mplo
ye
e - D
ea
lers
hip
$7,5
00
1) U
se Y
TD
Gro
ss P
rofit.
Div
ide b
y n
um
ber o
f
m
onth
s Y
TD
.
2) D
ivid
e b
y th
e n
um
ber o
f
fu
ll time (o
r equ
ivale
nt)
em
plo
yees in
the
Deale
rship
. D
EA
LE
RS
HIP
EX
PE
NS
ES
7 V
aria
ble
Expe
nse a
s a
% o
f Varia
ble
G/P
26%
Div
ide V
aria
ble
Exp
enses
(w/o
F&
I).
b
y V
aria
ble
Gro
ss P
rofit
8 P
ers
onne
l Expense a
s a
% o
f Tota
l G/P
33%
Div
ide P
ers
onne
l Expense
b
y T
ota
l Gro
ss P
rofit.
9 S
em
i Fix
ed E
xpe
nse a
s a
% o
f Tota
l G/P
20%
Div
ide S
em
i Fix
ed
Expense b
y T
ota
l Gro
ss
Pro
fit. 10 F
ixe
d E
xp
ense a
s a
% o
f Tota
l G/P
16%
Div
ide F
ixe
d E
xp
ense b
y
Tota
l Gro
ss P
rofit.

NE
W &
US
ED
VE
HIC
LE
T
arg
et
C
alc
ula
tion M
eth
od
11 V
eh
icle
sa
les p
er s
ale
s re
p p
er m
onth
10
Div
ide A
ctu
al R
eta
il un
its
by #
of S
ale
sp
eop
le o
n
Fin
ancia
l Stm
t. 12 C
SI s
core
s
Equ
al to
reg
ional s
core
s
3 M
onth
s R
ollin
g
13 N
ew
Veh. In
v. D
ays S
up
ply
45
1) N
um
ber o
f New
V
eh
icle
s re
taile
d o
ver th
e
last 3
month
s
2) D
ivid
e b
y 9
0, to
get a
n
avera
ge s
ale
per d
ay.
3) D
ivid
ed n
um
ber o
f
V
eh
icle
s in
inven
tory
by
the re
su
lt of s
tep #
2.
14 U
sed
. Veh. In
v D
ays S
upply
45
1) N
um
ber o
f Used
Veh
icle
s re
taile
d o
ver th
e
last 3
month
s
2) D
ivid
e b
y 9
0, to
get a
n
avera
ge s
ale
per d
ay.
3) D
ivid
ed n
um
ber o
f
V
eh
icle
s in
inven
tory
by
the re
su
lt of s
tep #
2.
15 M
ana
ger to
sale
s re
p ra
tio
1:6
16 G
ross p
rofit p
er e
mplo
yee -S
ho
wro
om
$8,5
00
1) U
se Y
TD
Gro
ss P
rofit.
Div
ide b
y n
um
ber o
f
m
onth
s Y
TD
.
2) D
ivid
e b
y th
e n
um
ber o
f
fu
ll time (o
r equ
ivale
nt)
em
plo
yees in
the S
ale
s
Departm
ent.
17 U
sed
cars
reta
il as %
of to
tal re
tail u
nits
50%
1) N
um
ber o
f Used
Veh
icle
s re
taile
d o
ver th
e
last 3
month
s
2) D
ivid
e b
y T
ota
l num
ber
of R
eta
il Sale
s (N
ew
&
Used)
18 U
sed
cars
who
lesale
% o
f used c
ar s
ale
s
50%
1) N
um
ber o
f Used
(w
hole
sale
plu
s re
tails
)
V
eh
icle
s w
ho
lesale
d o
ver
the la
st 3
month
s
2) D
ivid
e b
y T
ota
l num
ber
of U
sed S
ale
s (w
hole
sale
plu
s re
tail)

FIN
AN
CE
& IN
SU
RA
NC
E
Targ
et
C
alc
ula
tion m
eth
od
19 G
ross F
&I In
com
e/re
tail u
nit s
old
$600
All re
tail u
nits
plu
s le
ases
20 N
et F
&I In
com
e p
er re
tail u
nit s
old
$400
All re
tail u
nits
plu
s le
ases
21 F
inance R
eserv
e $
as %
of F
& I In
com
e
60
%
22 C
om
bin
ed E
xte
nd
ed W
arra
nty
Pen
etra
tion
60%
23 R
eta
il units
so
ld p
er F
&I M
an
ager
75
S
ER
VIC
E D
EP
AR
TM
EN
T
24 G
ross p
rofit a
s a
% o
f Labo
r
73%
Afte
r adj. c
ost o
f labor
25 R
eta
ined
Inc. a
fter C
ontro
llable
Exp
.
45%
1) S
erv
ice g
ross (w
ith
parts
transfe
r)
Less: P
ers
on
ne
l, Com
pan
y
veh
icle
exp., o
ther
supplie
s, a
dvertis
ing,
polic
y, d
ata
pro
cessin
g,
outs
ide s
erv
ices, tra
inin
g,
bad d
ebts
26 S
erv
ice A
dv. C
om
p. a
s a
% o
f Gro
ss
less th
an 1
0%
S
erv
ice g
ross w
ith p
arts
tra
nsfe
r 27 S
upp
ort P
ers
onn
el to
Technic
ian R
atio
1:3
28 T
echnic
ian p
roductiv
ity -
Import
120%
Hours
flagg
ed d
ivid
ed b
y
hours
ava
ilable
D
om
estic
110%
29 C
.P. H
ours
per R
.O.
2
30 S
erv
ice G
ross p
er e
mplo
ye
e
$6,0
00
Use Y
TD
gro
ss p
r. (with
out
parts
transfe
r)
31 C
.S.I. S
core
s
E
qu
al to
reg
ion
3 m
onth
avera
ge
32 P
olic
y E
xp. a
s %
of S
erv
ice G
ross
2%
or le
ss
With
out p
arts
transfe
r 33 S
upp
ly E
xp
. as a
% o
f Serv
ice G
ross
3%
or le
ss
With
out p
arts
transfe
r

PA
RT
S D
EP
AR
TM
EN
T
34 P
arts
sale
s p
er e
mplo
ye
e (o
r eq
uiv
ale
nt)
1) U
se m
onth
ly Y
TD
sa
les
w/o
wh
ole
sale
$37,5
00
2) D
ivid
ed b
y #
of fu
ll time
or e
qu
ivale
nt P
arts
w
/ who
lesa
le
$47,5
00
em
plo
yees
35 P
arts
Gro
ss p
er e
mplo
yee (o
r equiv
ale
nt)
$12,5
00
1) Y
TD
parts
gro
ss (n
o
transfe
r) div
ide b
y #
m
onth
s Y
TD
2) D
ivid
e b
y #
parts
em
plo
yees p
er th
e
financia
l sta
tem
ent
36 R
eta
ined
Incom
e a
fter C
ontro
llable
Exp.
w
/o w
hole
sale
40%
Less: s
am
e e
xpenses a
s
serv
ice p
lus fre
ight
w
/ who
lesa
le
30%
37 In
ve
nto
ry D
ays S
upp
ly
less th
an 4
5 d
ays
U
se G
.L. in
vento
ry fo
r
parts
com
pare
d to
3
month
s a
vera
ge c
ost o
f
sale
s fo
r parts
on
ly
38 S
ix m
onth
s n
o s
ale
inve
nto
ry
le
ss th
an 1
0%
39 T
rue tu
rns (F
rom
Parts
Mana
gem
ent R
ep
t) 6
BO
DY
SH
OP
T
arg
et
C
alc
ula
tion m
eth
od
40 G
ross p
rofit a
s a
% o
f Labo
r
65%
Afte
r adj. c
ost o
f labor
41 N
et p
rofit a
s a
% o
f Gro
ss P
rofit
30%
With
parts
transfe
r inc. in
gro
ss
42 S
ale
s p
er S
up
port P
ers
onne
l
$25,0
00
43 B
od
y S
ho
p G
ross p
er e
mplo
yee
$5,5
00
Month
ly b
ased o
n Y
TD
sale
s
44 R
eta
ined
Incom
e a
fter C
ontro
llable
Exp.
35%
Less s
am
e e
xpenses a
s p
arts
45 T
echnic
ian p
roductiv
ity
185%
46 P
ain
t/Mate
rial S
ale
s/C
usto
mer L
abor
17%
47 P
ain
t/Mate
rial C
ost p
lus S
plie
s to
Custo
mer L
br S
ale
s
14%
48 C
aptu
re R
atio
on e
stim
ate
s w
ritten
85%
A
DM
INIS
TR
AT
IVE
49 T
ota
l Gro
ss p
er e
mplo
yee
– O
ffice
$50,0
00
50 M
ana
ger to
Offic
e E
mplo
ye
e R
atio
1:7

DE
TE
RM
INE
IDE
AL
ST
AF
FIN
G L
EV
EL
S U
SIN
G G
RO
SS
P
ER
EM
PL
OY
EE
TA
RG
ET
ST
AF
FIN
G L
EV
EL
S B
Y D
EP
AR
TM
EN
T U
SIN
G M
AN
AG
EM
EN
T G
UID
ES
S
HO
WR
OO
M
GR
OS
S P
RO
FIT
- AV
ER
AG
E M
ON
TH
- NE
W
$154
,00
0
GR
OS
S P
RO
FIT
- AV
ER
AG
E M
ON
TH
- US
ED
$99,0
00
G
UID
E - G
RO
SS
PE
R E
MP
LO
YE
E
$8,5
00
C
ALC
ULA
TIO
N
30
S
ER
VIC
E D
EP
AR
TM
EN
T
GR
OS
S P
RO
FIT
- AV
ER
AG
E M
ON
TH
$184
,32
2
GU
IDE
- GR
OS
S P
ER
EM
PLO
YE
E
$6,0
00
C
ALC
ULA
TIO
N
31
B
OD
Y S
HO
P D
EP
AR
TM
EN
T
GR
OS
S P
RO
FIT
- AV
ER
AG
E M
ON
TH
$76,2
74
G
UID
E - G
RO
SS
PE
R E
MP
LO
YE
E
$5,5
00
C
ALC
ULA
TIO
N
14
P
AR
TS
DE
PA
RT
ME
NT
G
RO
SS
PR
OF
IT - A
VE
RA
GE
MO
NT
H
$61,5
42
G
UID
E - G
RO
SS
PE
R E
MP
LO
YE
E
$12,5
00
C
ALC
ULA
TIO
N
5
TO
TA
L D
EA
LE
RS
HIP
G
RO
SS
PR
OF
IT - A
VE
RA
GE
MO
NT
H
$605
,46
0
GU
IDE
- GR
OS
S P
ER
EM
PLO
YE
E
$7,5
00
C
ALC
LU
LA
TIO
N
82