Embed Size (px)
Citation preview
Dealer Performance Management System
Torque IT Solutions
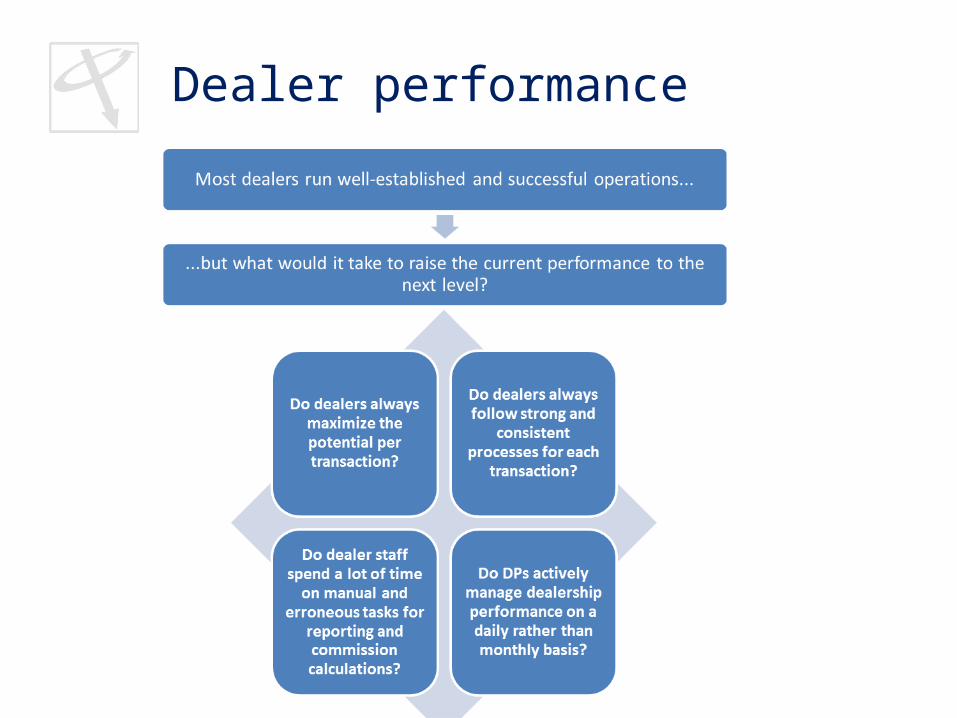
Dealer performance
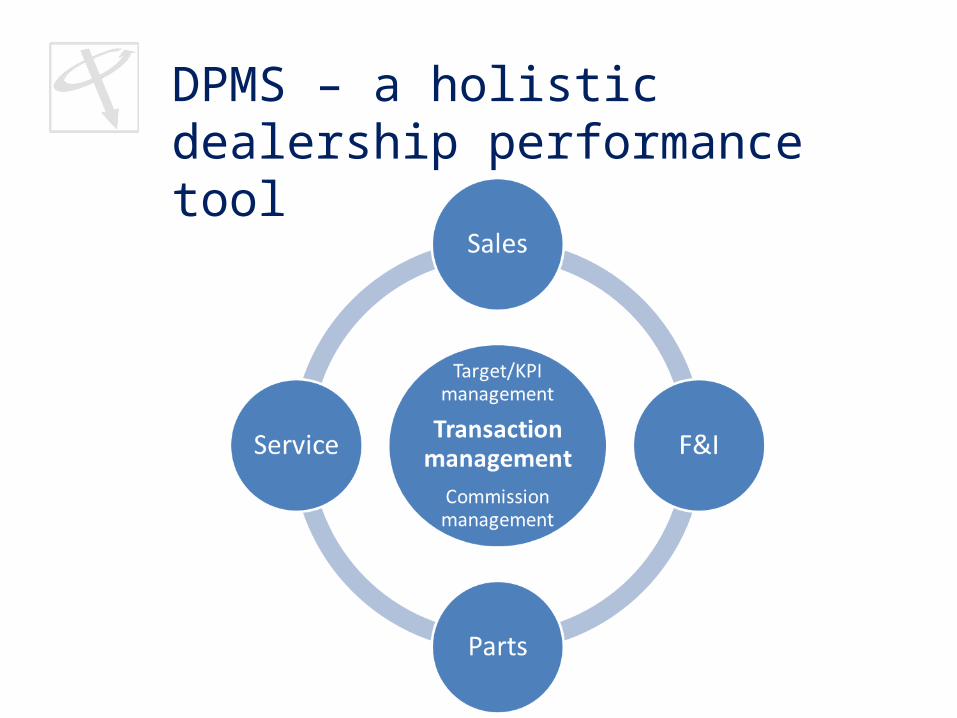
DPMS – a holistic dealership performance tool
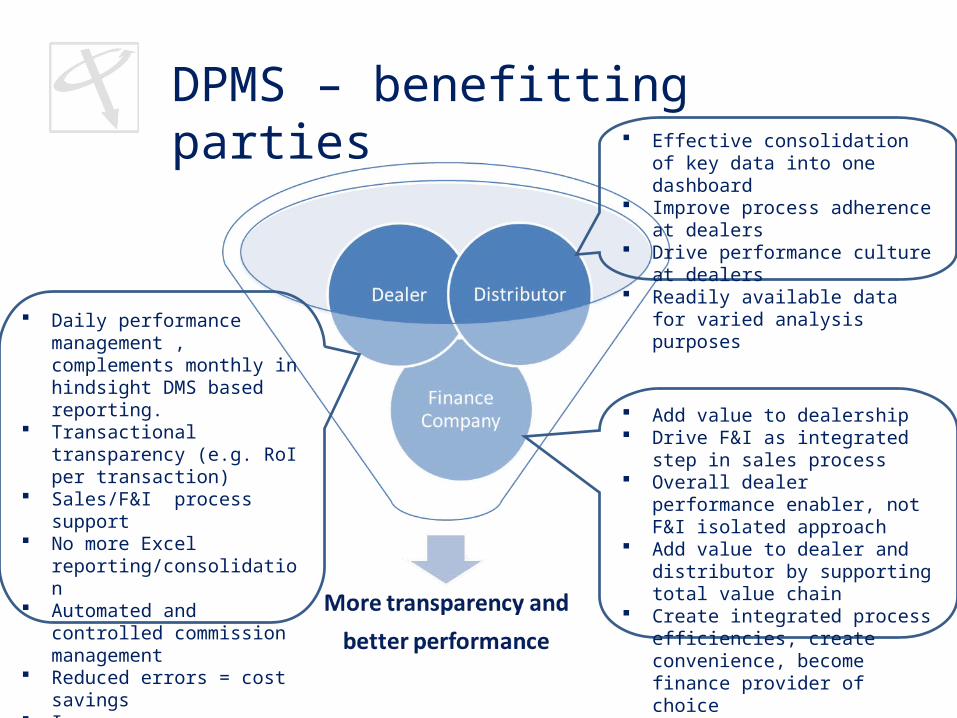
DPMS – benefitting parties
Daily performance management , complements monthly in hindsight DMS based reporting.
Transactional transparency (e.g. RoI per transaction)
Sales/F&I process support No more Excel
reporting/consolidation Automated and controlled
commission management Reduced errors = cost savings Improve process = profit
increase
Add value to dealership Drive F&I as integrated step in sales
process Overall dealer performance enabler,
not F&I isolated approach Add value to dealer and distributor
by supporting total value chain Create integrated process
efficiencies, create convenience, become finance provider of choice
Effective consolidation of key data into one dashboard
Improve process adherence at dealers
Drive performance culture at dealers Readily available data for varied
analysis purposes
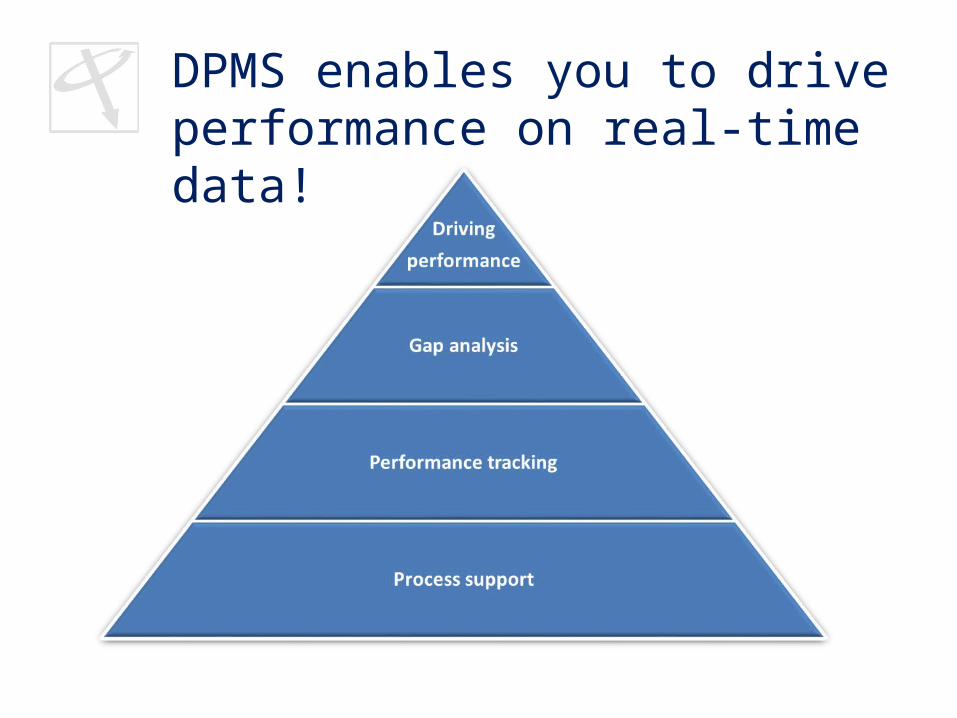
DPMS enables you to drive performance on real-time data!
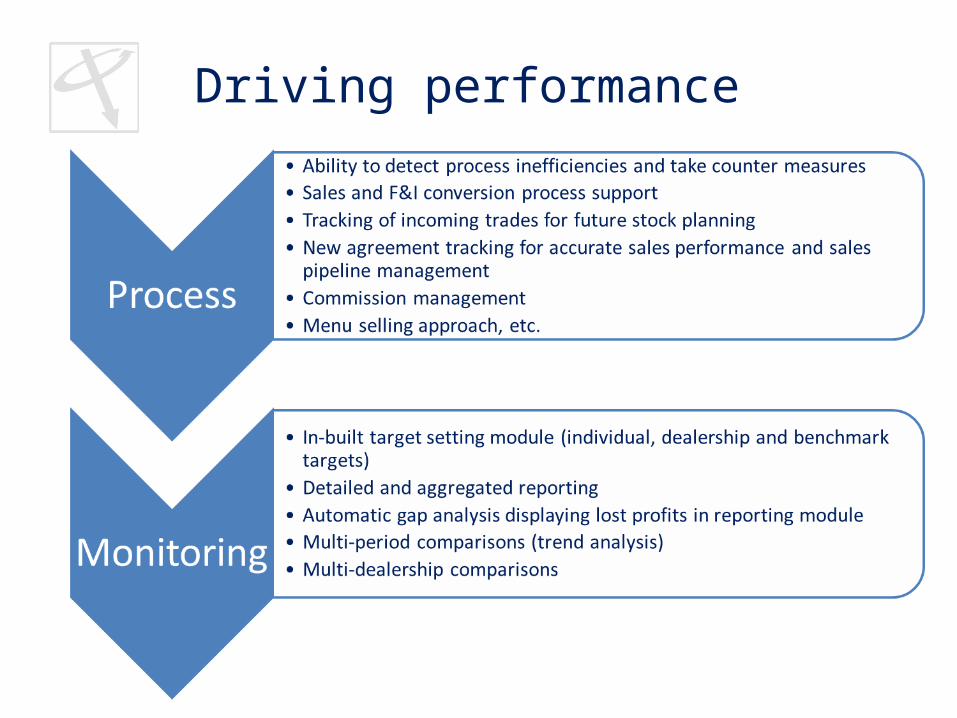
Driving performance
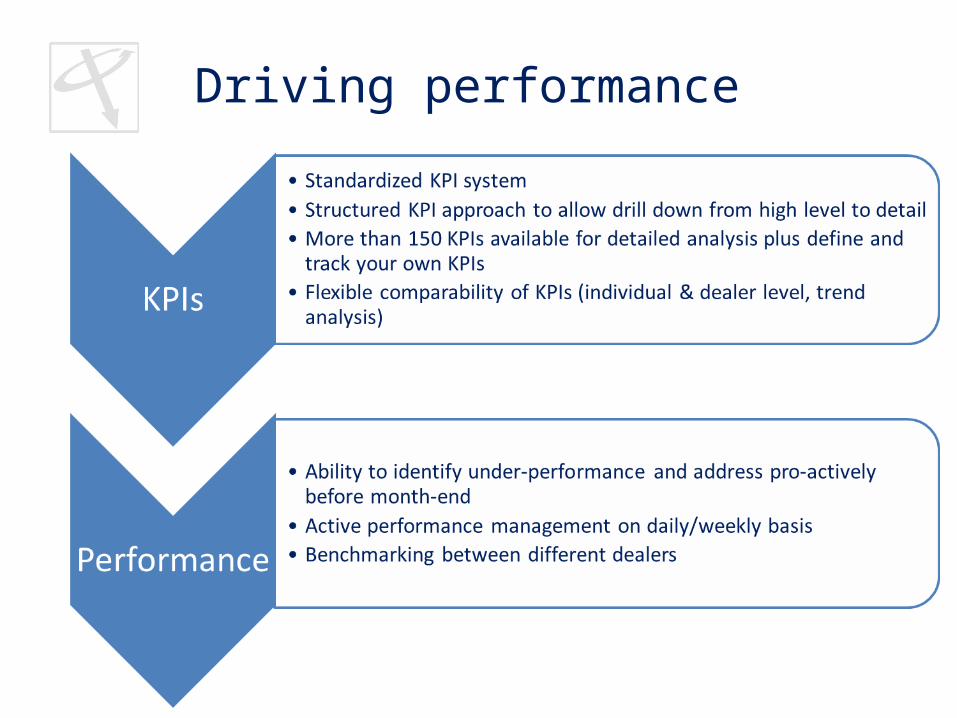
Driving performance
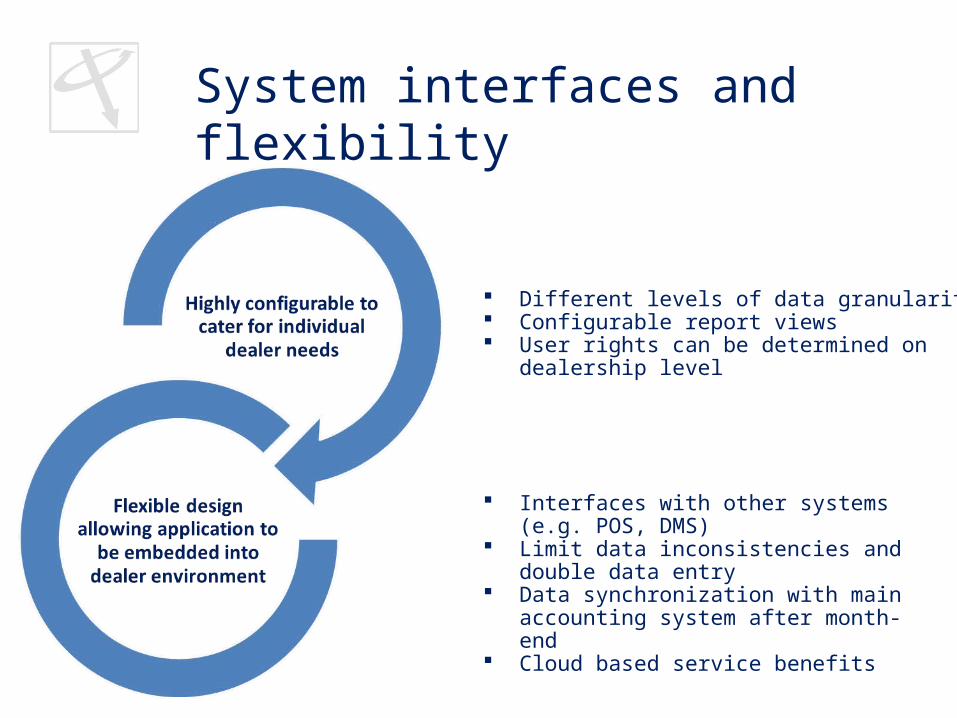
Different levels of data granularity Configurable report views User rights can be determined on dealership level
Interfaces with other systems (e.g. POS, DMS) Limit data inconsistencies and double data
entry Data synchronization with main accounting
system after month-end Cloud based service benefits
System interfaces and flexibility
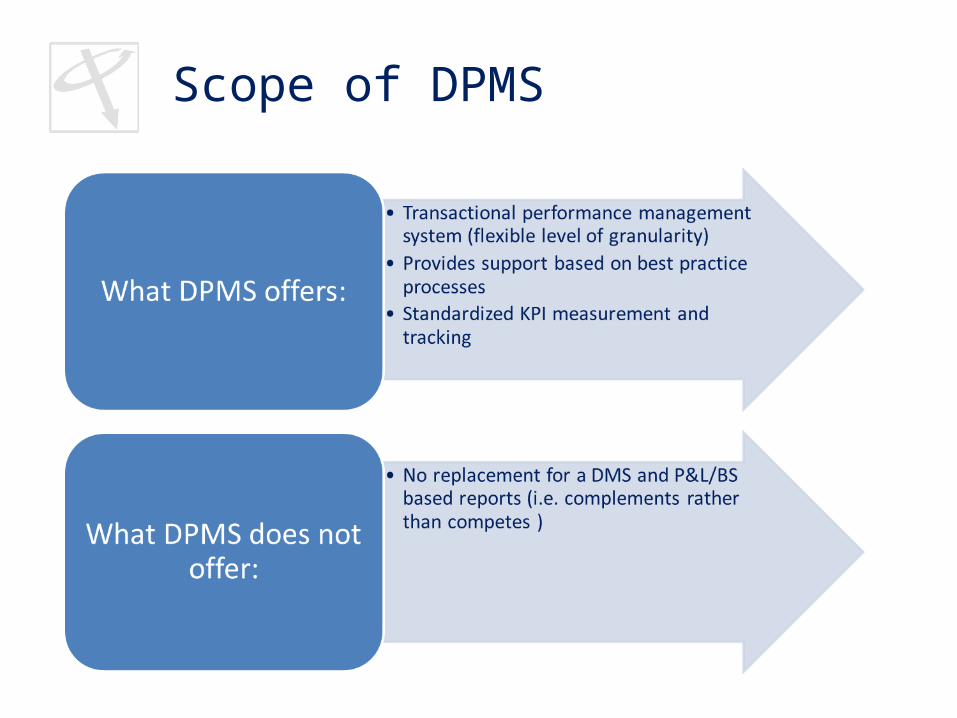
Scope of DPMS
DPMS - Illustration Example
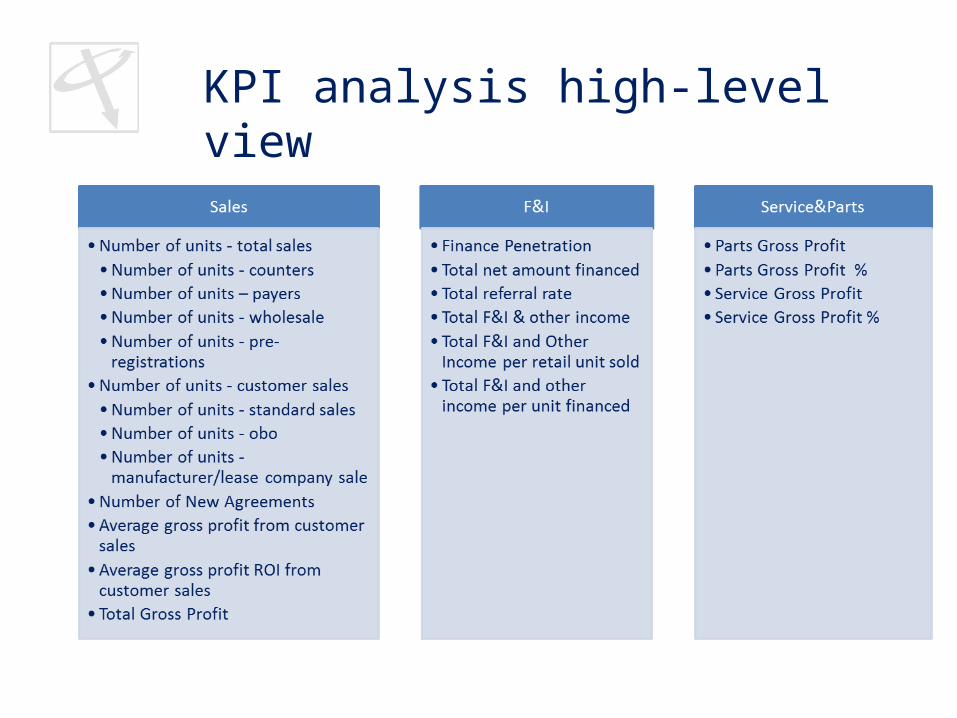
KPI analysis high-level view
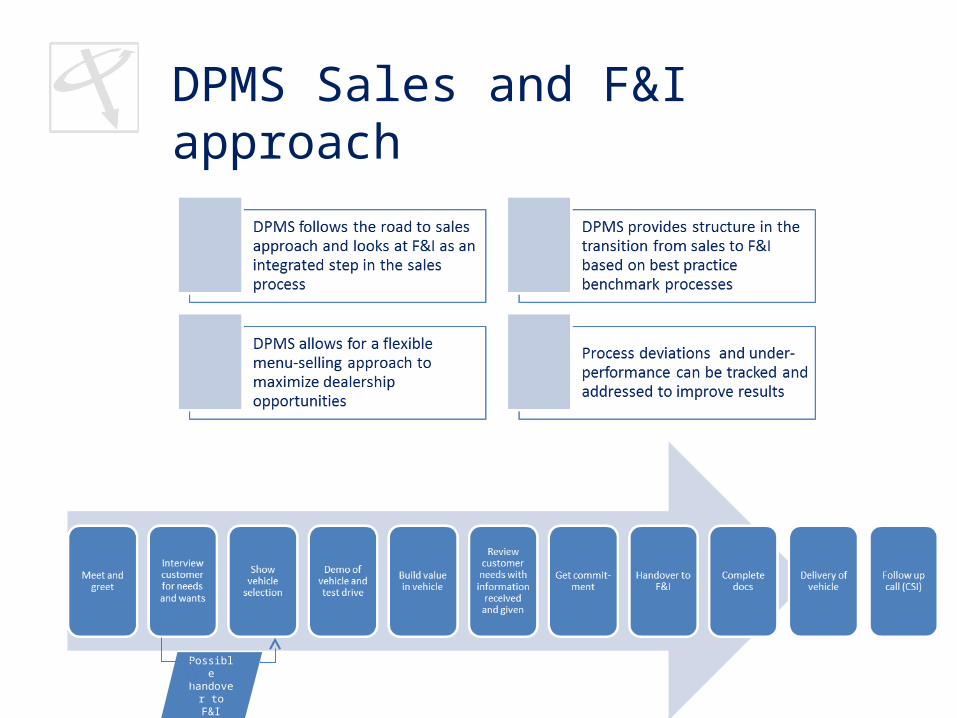
DPMS Sales and F&I approach
Possible handover
to F&I
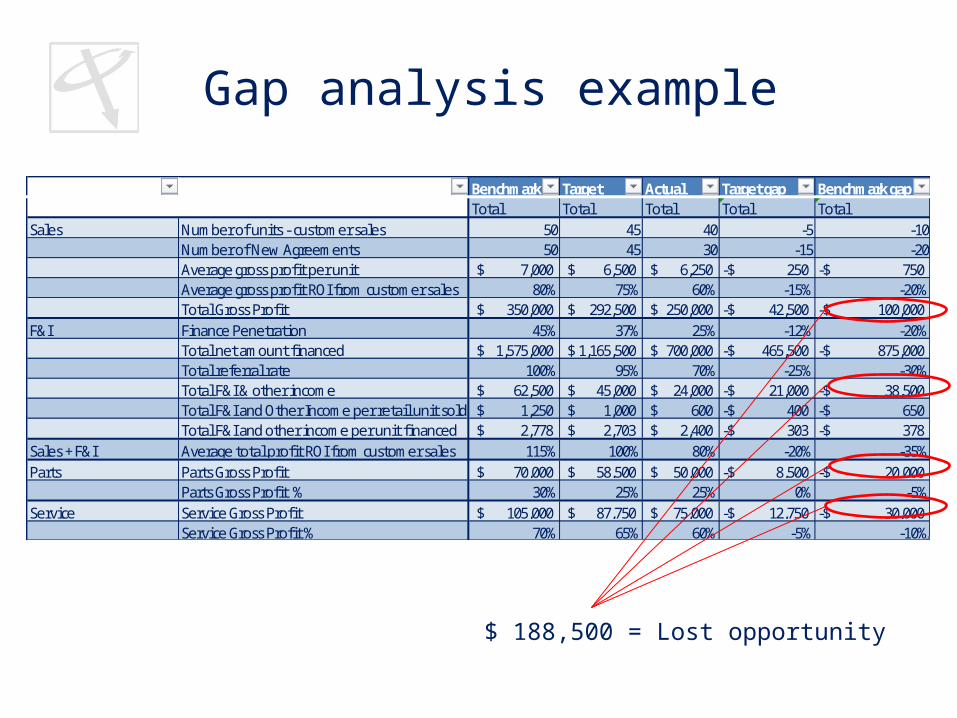
Gap analysis example
Column1 Column2 Benchmark Target Actual Target gap Benchmark gapTotal Total Total Total Total
Sales Number of units - customer sales 50 45 40 -5 -10Number of New Agreements 50 45 30 -15 -20Average gross profit per unit 7,000$ 6,500$ 6,250$ 250-$ 750-$ Average gross profit ROI from customer sales 80% 75% 60% -15% -20%Total Gross Profit 350,000$ 292,500$ 250,000$ 42,500-$ 100,000-$
F&I Finance Penetration 45% 37% 25% -12% -20%Total net amount financed 1,575,000$ 1,165,500$ 700,000$ 465,500-$ 875,000-$ Total referral rate 100% 95% 70% -25% -30%Total F&I & other income 62,500$ 45,000$ 24,000$ 21,000-$ 38,500-$ Total F&I and Other Income per retail unit sold 1,250$ 1,000$ 600$ 400-$ 650-$ Total F&I and other income per unit financed 2,778$ 2,703$ 2,400$ 303-$ 378-$
Sales + F&I Average total profit ROI from customer sales 115% 100% 80% -20% -35%Parts Parts Gross Profit 70,000$ 58,500$ 50,000$ 8,500-$ 20,000-$
Parts Gross Profit % 30% 25% 25% 0% -5%Service Service Gross Profit 105,000$ 87,750$ 75,000$ 12,750-$ 30,000-$
Service Gross Profit % 70% 65% 60% -5% -10%
$ 188,500 = Lost opportunity
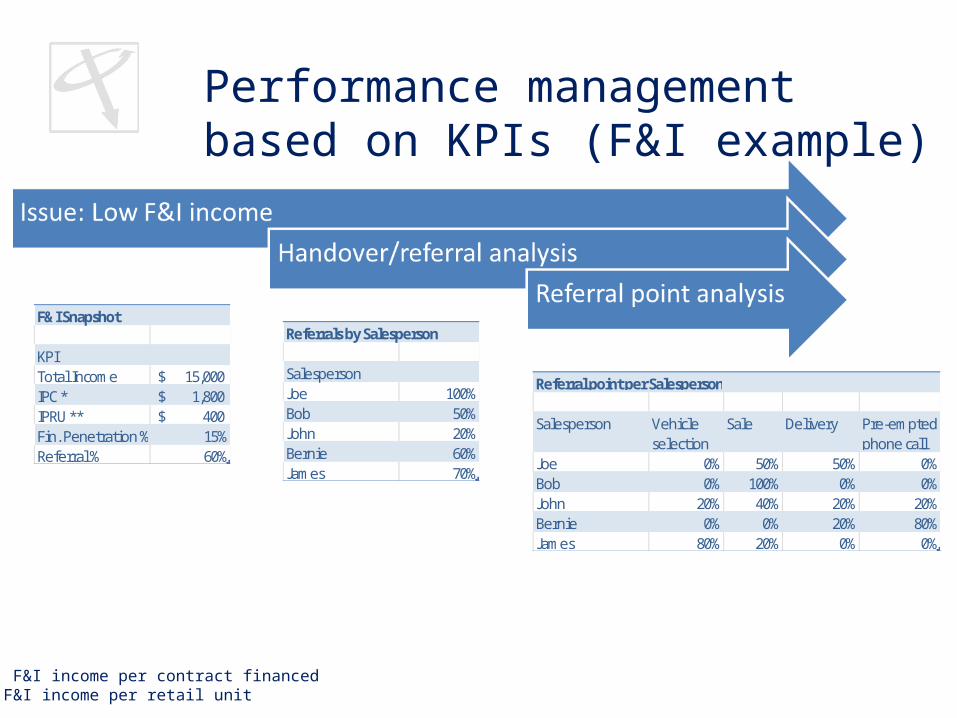
Performance management based on KPIs (F&I example)
F&I Snapshot
KPITotal Income 15,000$ IPC * 1,800$ IPRU ** 400$ Fin. Penetration % 15%Referral % 60%
Referrals by Salesperson
SalespersonJoe 100%Bob 50%John 20%Bernie 60%James 70%
Referral point per Salesperson
Salesperson Vehicleselection
Sale Delivery Pre-emptedphone call
Joe 0% 50% 50% 0%Bob 0% 100% 0% 0%John 20% 40% 20% 20%Bernie 0% 0% 20% 80%James 80% 20% 0% 0%
* F&I income per contract financed** F&I income per retail unit
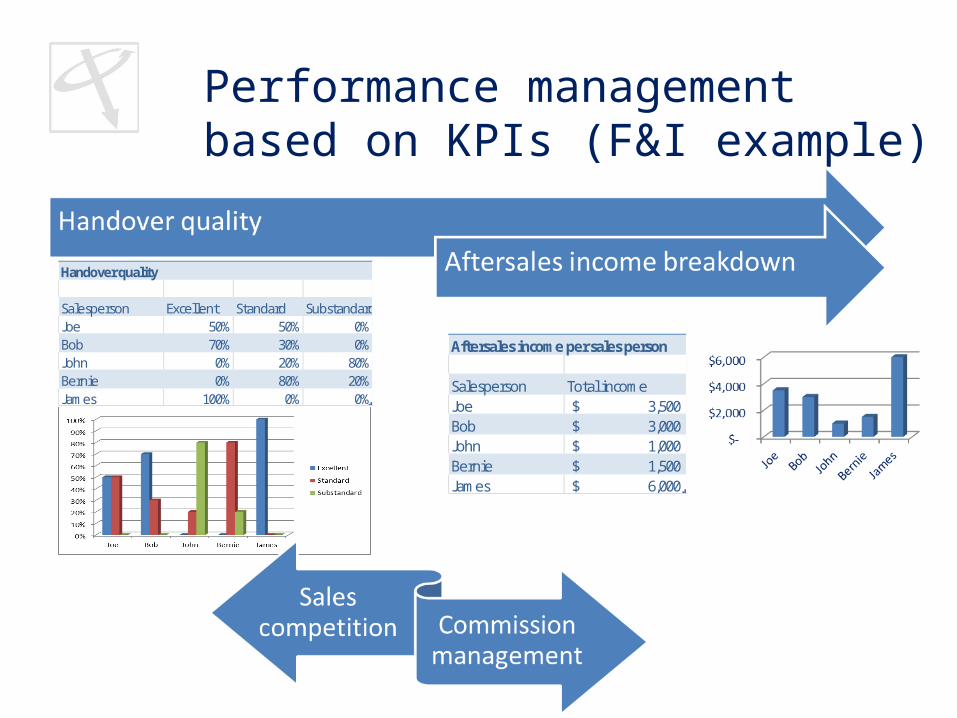
Performance management based on KPIs (F&I example)
Handover quality
Salesperson Excellent Standard SubstandardJoe 50% 50% 0%Bob 70% 30% 0%John 0% 20% 80%Bernie 0% 80% 20%James 100% 0% 0%
Aftersales income per sales person
Salesperson Total incomeJoe 3,500$ Bob 3,000$ John 1,000$ Bernie 1,500$ James 6,000$
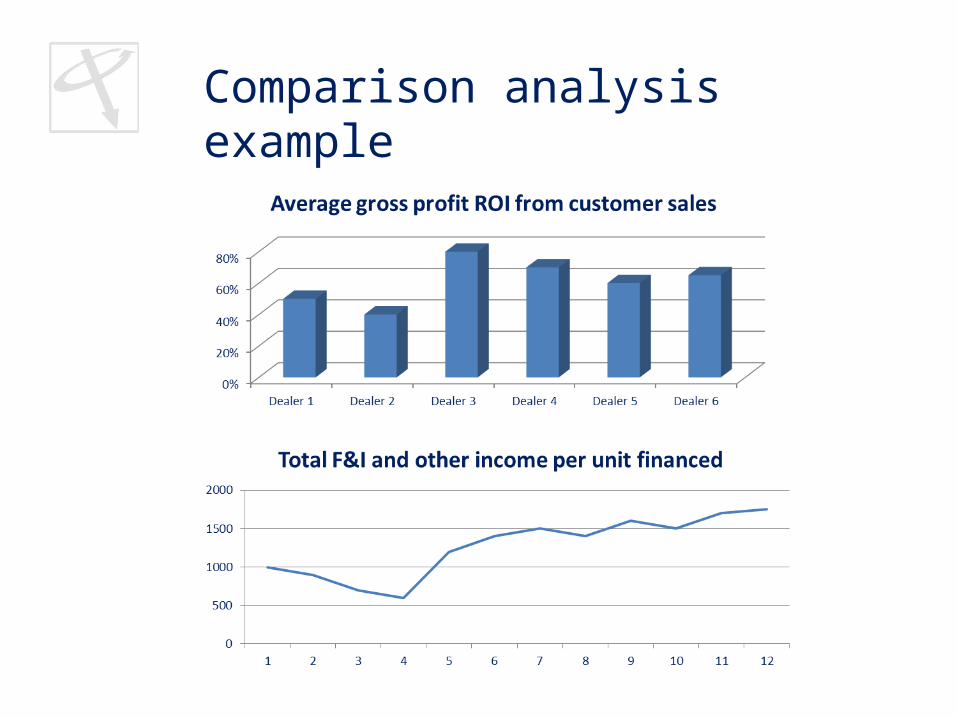
Comparison analysis example

Thank You!


![DEALER SPECIFICATION GUIDE MARCH 2018. - BMW … · the new bmw x1. dealer specification guide march 2018. [1] important information about our data. ... power/torque: 141kw / 280nm](https://img.pdfslide.us/doc/110x75/5b0456407f8b9a6c0b8da751/dealer-specification-guide-march-2018-bmw-new-bmw-x1-dealer-specification.jpg)