Embed Size (px)
Citation preview

sU 03 3 0 DEAIE FLOW MEASUREMENTS IN CASING BOUNDARY LAYER OF429-ME ER-PER-SECO..UT NATIONAL AERONAUTICS AND SPACEADMINISTRATION C LEVELAND OR LE. W TGORREL JAN 84UNC ASS A - E 29NS-P2052 FG2 0 4

IAL
11111~ ~ II A' _
MICROCOPY RESOLUTION TEST CHART
Na"~AL BUREAU OF SyANDARDS 196'3 A
S-sif
4o

0
'-.4

NASATechnicalPaper2052
AVRADCOMTechnical Detailed Flow MeasurementsReport in Casing Boundary Layer81 -C-28 of 429-Meter-per-Second-
1984 Tip-Speed Two-Stage Fan
Wiliam T. Gorrell
Propulsion Laboratory
A VRADCOM Research and Technology Laboratories
Lewis Research Center
Cleveland, Ohio
Accession ForrNTIS BGrA&I
11 win~uneod 0
and Spae ~Aministration D~tlula
S h U S a d T~ e m~sa:A vailj ana/or1~~~~~ a a-o 1"1;special
1964 e

SThe data resulting from these measurements areSummarypresented in this report in both tabular and plotted form.
.- Detailed flow measurements made in the casing boun- Design-speed data were recorded at three flowdary layer of a two-stage transonic fan are summarized, conditions. The symbols and equations are defined inThese measurements were taken at stations upstream of appendixes A and B.the fan, between all blade rows, and downstream of thelast blade row. At the design tip speed (429 m/sec) the fanachieved a peak efficiency of 0.846 at a pressure ratio of Apparatus and Procedure2.471. The boundary layer data were obtained at threeweight flows at the design speed: one near choke flow,one near peak efficiency, and one near stall. The data Two-Stage Fanpresented show steep axial velocity profiles at the fan in- The low-aspect-ratio two-stage fan was designed tolet and at both rotor exits. The axial velocity profiles at produce a 2.40:1 pressure ratio at 427-meter-per-secondthe stator exits were not as steep as those at the rotor ex- tip speed. The two-stage fan was designed with aits. The data also show overturning of the flow at the tip computer program described in reference 6. A measuredat the stator exits. The effect of mixing is shown by the inlet-radial total-pressure distribution in the casingredistribution of the first-stage rotor-exit total boundary layer (ref. 3) was used to model the total-temperature profile as it passes through the following pressure profile in the inlet end-wall region in the designstator. of the low-aspect-ratio first-stage rotor described in
-/ reference 1. The computer program used in the designwas unable to handle the steep total-pressure gradient
Introduction from the measurements. To alleviate this problem, thetotal-pressure distribution was modified and combined
The Lewis Research Center has been investigating the with an end-wall blockage of 0.01. It was hoped that thisaerodynamic performance of a two-stage fan with a would aline the blade with the flow entering the rotor atdesign pressure ratio of 2.40 (refs. I to 5). This the tip, resulting in reduced losses. At the other stationsinvestigation is part of a program to demonstrate in the two-stage fan, blockage allowances were the onlyimproved performance of highly loaded, multistage, method used to account for the hub and casing boundaryaxial-flow compressors. Analysis of the results from layers. The blockage allowances at the tip were 0.013 atreferences 2 to 5 indicated that the first-stage stator and the first-stage rotor exit, 0.017 at the first-stage statorthe second stage had potential for good performance but inlet, and 0.020 at all other stations. Blockage allowanceswere hampered mainly by the dampered first-stage rotor. at the hub were the same as at the tip at each station.In an effort to improve performance of the first stage, as Design diffusion factors at the tip of the first- andwell as to improve stage matching, the first-stage rotor second-stage rotors are 0.451 and 0.410, respectively, andwas redesigned. Lower-aspect-ratio blading was selected at the first- and second-stage stators, 0.472 and 0.464,for the rotor to eliminate the part-span damper and its respectively. The flow path and axial locations of theadverse effect on performance. An inlet-tip boundary- measuring stations are shown in figure 1. Figure 2 showslayer total pressure, based on unreported boundary-layer the fan with casing treatment over the rotors. However,survey data taken with the configuration of reference 3, when taking the boundary layer data, solid inserts wereand an end-wall blockage allowance, was incorporated installed over the rotor tips.into the new design, resulting in the rotor blading havingleading-edge end-wall bend. It was anticipated that theleading edge of the rotor blade would be alined to the Compressor Test Facility
flow in the casing boundary layer. The performance of The two-stage fan was tested in the multistagethe low-aspect-ratio fan is reported in reference I. Results compressor facility (ref. 2). A schematic diagram of theshow that the flow in the tip region of the first-stage rotor facility is shown in figure 3. Atmospheric air enters thewas not well alined with the blade and losses remained test facility at an inlet located on the roof of the buildinghigh. and flows through the flow measuring orifice, through
More detailed information than is currently available the inlet butterfly throttle valves, and into the plenumabout the flow in the end-wall regions, particularly in the chamber upstream of the test fan. The air then passesmultistage environment, is needed to develop improved through the test fan into the collector and is exhaustedend-wall designs. The wide blade-row spacing of this two- either to the atmosphere or to an altitude exhaust system.stage fan afforded the opportunity to measure the flow Mass flow is controlled with a sleeve valve in thefield in the outer-wall region behind each blade row. collector. For this series of tests the large inlet butterfly

valve remained fully open with the small valve fully total temperature, and flow angle were measured at eachclosed, and the air was exhausted to the atmosphere. circumferential position.
Instrumentation Data Reduction
Radial surveys of the flow conditions between I and 30 Redundant measurements at each measuring stationpercent of passage height were made at the fan inlet, (two at stations 1, 2, 3, and 4) were arithmeticallybehind each rotor, and behind the two stator-blade rows averaged. Indicated total pressures, static pressures, and(see fig. 1). Total pressure, total temperature, and flow total temperatures were corrected for Mach number andangle were measured with combination probes (fig. 4). streamline slope (ref. 7). All data were corrected toStatic pressure was measured with the combination standard-day conditions based on values at 30 percent ofprobes and wall static taps at each measuring station. the passage height at the first-stage rotor inlet. To getEach probe was positioned with a null-balancing, stream- representative radial distributions in addition to thedirection-sensitive control system. The thermocouple circumferential distributions at the stator exits, thematerial was Chromel-constantan. All pressures were circumferential distributions of total t.mperature weremeasured with calibrated transducers. Two combination mass averaged; total pressure was energy averaged; andprobes were used at the compressor inlet, behind each flow angle was arithmetically averaged at each radialrotor, and behind the first-stage stator. Four position. The Mach number at each radial positioncombination probes were used behind the second-stage behind a rotor and at each radial and circumferentialstator. The circumferential locations of the probes and position behind a stator is calculated from the measuredwall static taps at each measuring station are shown in total pressure at each radial and circumferential positionfigure 5. The probes behind the stators were and the static pressure at each radial position. Absolutecircumferentially traversed one stator-blade passage velocity was calculated from the Mach number andclockwise from the nominal values shown. The fan mass measured total temperature. Absolute velocity andflow was determined with a calibrated thin-plate orifice measured flow angle were used to calculate axial andlocated in the inlet line. An electronic speed counter, in tangential velocity components.conjunction with a magnetic pickup, was used to measurerotative speed (rpm).
The estimated errors of the data, based on inherent Determination of Static Pressureaccuracies of the recording system, are as follows:
Total pressure, total temperature, and flow anglemeasurements were taken at 10 radial positions between 1
Mass flow, ks/sec ................................................. *-0.3 m a u e e t eetk na 0rda o iin ew eMassflo. k/se................0.3and 30 percent of passage height from the casing.
Rotative speed, rpm ................................................ *-30an 30 p re t o p sag h iht f m te c sn .
Flow angle, deg .......................................................* Because measurements were not taken across the full
Temperature, K .................................................... *0.6 passage height, static pressure could not be calculated asTotal pressure (stations I and 2), N/cm2 .................... *0.07 was done in reference I. To acquire static pressures forTotal pressure (station 3), N/cm2 ............................. *0.10 the boundary-layer surveys, the side balancing holes onTotal pressure (stations 4and 5), N/cm2 .................... *0.17 the combination probes (fig. 4) were manifolded to readIndicated static pressure (stations 1, 2, and 3), N/cm2
... -0.07 an indicated static pressure. Figure 6 is a comparison ofIndicated static pressure (stations 4 and 5), N/cm2 ....... *0.17 the measured static pressures at station I from theRadial position, cm ............................................. *0.003 boundary-layer surveys at a mass flow of 34.23 kg/sec
and calculated static pressures from earlier, unreported
Test Procedure full-passage-height surveys, also at 34.23 kg/sec. At 30percent of passage height, the measured static pressure is
The data for the boundary-layer surveys were taken at significantly lower than the calculated static pressure.three mass flows from maximum flow to near stall, at an The static pressures were calculated using design end-equivalent rotative speed of 100 percent of design speed. wall blockage values. It would appear that, if theAt each selected flow, data were recorded at 10 radial blockage value were adjusted until the calculated value at
4 positions at each of the five measuring stations. At the 5 percent of passage height matched the wall static value,fan-inlet and rotor-exit stations (stations 1, 2, and 4) the calculated value at 30 percent of passage height wouldradial traverses were made to measure total pressure, nearly equal the measured value as well.static pressure, total temperature, and flow angle at each Since the accuracy of the static-pressure measurementradial position. At each radial position the combination is uncertain newr the casing, it was arbitrarily decided thatprobes behind the stators (stations 3 and 5) were a linear distribution of static pressure between the wallcircumferentially traversed to 10 equally spaced locations static and the measurement at 30 percom of paam eacross a stator-blade gap. Total pressure, static pressure, height would be used to reduce the boundary-layer survey
~" 4, 1 _ _ _ _ __ _ - . ...-

data. However, all measured static pressures are I I and 13) is much less than at the rotor-exit measuringpresented in table 1. stations (figs. 10 and 12). A comparison of figures 10 and
S1I shows that the total-temperature profile that left thefirst-stage rotor was redistributed as it passed through thefollowing stator. Measured total temperatures between 1
Results and Discussion and 8 percent of passage height at the stator exit are lowerthan the corresponding values at the rotor exit.
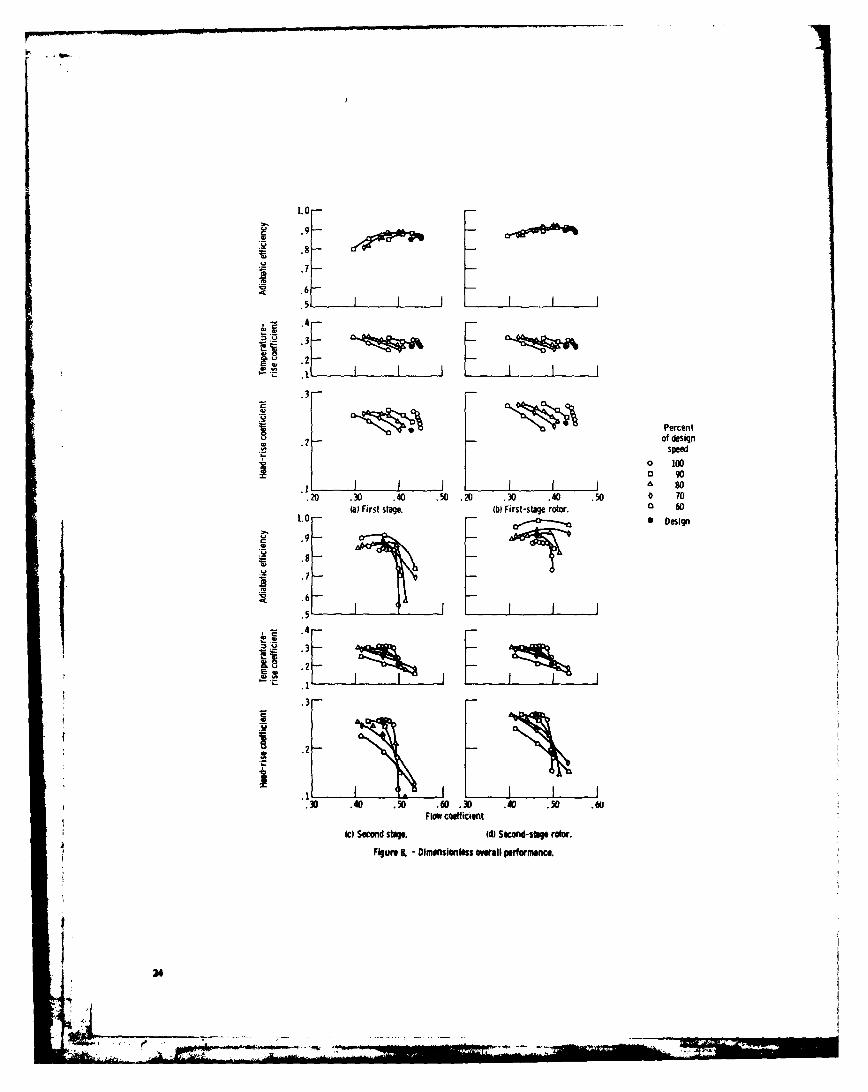
The overall and stage performance of the two-stage fan Conversely, total temperatures between 8 and 30 percentare presented in figures 7 and 8. Figures 9 to 13 are radial of passage height are higher at the first-stage stator exitdistributions of various flow parameters between I and than at the first-stage rotor exit. This redistribution of30 percent of passage height at each measuring station. total temperature is a result of mixing. The plots ofFigure 14 presents radial and circumferential absolute flow angle show overturning of the flow near thedistributions of axial velocity at the stator exits. The data casing of 6* at the first-stage stator exit and 4 at thein these figures are presented in tables I1 to VIII. second-stage stator exit.
Overall and Stage Performance Circumferential Distributions at Stator Exit Stations
The overall performance of the two-stage fan with the The radial and circumferential distributions of axiallow-aspect-ratio first-stage rotor is presented in figure 7. velocity behind the first- and second-stage statorsAt the design tip speed of 429 m/sec the fan achieved a (stations 3 and 5) are plotted in figure 14. The datapeak efficiency of 0.846 at a pressure ratio of 2.471. plotted in this figure are at a mass flow of 34.23 kg/sec.Arrows pointing to the design speed line indicate the For clarity, only 5 of the 10 radial positions at eachlocations where the boundary layer data were obtained, station are plotted. The wakes behind both stators areThe stage performance is given in figure 8. The first stage less pronounced at 30 percent of the passage height thanachieved a peak efficiency of 0.870 at a pressure at 3 or 4 percent of the passage height. The wake alsocoefficient of 0.257 (pressure ratio= 1.655). The second appears to shift circumferentially toward the pressurestage achieved a peak efficiency of 0.842 at a pressure side of the blade near the tip of both stators. The axialcoefficient of 0.260 (pressure ratio = 1.494). velocity at he edge of the wake on the suction side of the
blade is significantly lower than the correspondingvelocity on the pressure side at the tip. This velocity
Radial DIstributions at Measuring Stations imbalance exists at 1 and 2 percent of passage height andThe results presented in figures 9 to 13 are presented at is nearly gone at 3 or 4 percent of passage height.
three mass flows at design speed, 34.63 kg/sec (choke),34.23 kg/sec (peak efficiency), and 34.01 kg/sec (nearstall). The solid lines in the figures are design values, andthe symbols are measured values. Concluding Remarks
First-stage rotor inlet (station 1). - The axial velocity ishigher than design over most of the outer 30 percent of Secondary flows in compressor blade rows arise fromthe passage height (fig. 9). This velocity difference is due, the inability of the end-wall boundary layers to sustainin part, to the mass flow being higher than design and in the blade-to-blade static-pressure gradient. Severalpart to the selection of static pressure. However, the aspects of the data discussed earlier suggest the presencemeasured velocity decreases much more rapidly from 4 to of strong secondary flows in both stator-blade rows. TheI percent of the passage height than the design values, velocity imbalance across the stator wakes is the result ofThe total-pressure gradient along with the 0.010 outer an accumulation of low-energy boundary-layer fluid nearwall blockage used in the design at the rotor inlet did not the suction surface caused by secondary flows. Theaccurately model the casing boundary layer. redistribution of total temperature is also a result of
Fbit- aid second-sv roor exits (stkm 2 aid 4). - secondary flows as well as of turbulence. It is this mixingThe axial velocity distributions at the exits of the first- that accounts for the stator-exit axial velocity profilesand second-stage rotors are very similar (figs. 10 and 12). being much flatter than the rotor-exit profiles.The absolute flow angle is much higher than design in the This suggests that casing blockage effects in multistageouter 10 percent of passage height which increases compressors are reduced by mixing. The high statorincidence angles on the following stators. incidence angles that will result from the highly skewedF,- d second-mtape stater aib (Wtlens 3 and 5). - flow in the casing boundary layer exiting the rotors
The decrease in axial velocity from 10 to I percent of reinforces the secondary flows generated in the stators.passage height at the stator-exit measuring stations (figs. This reinforcement is a result of the low pressure (lower
3

than at lower incidence angles) that occurs on the suction the passage height to the casing than the design values.surface as a result of the high incidence angles. The 2. The absolute flow angle distribution at the exit ofoverturning, as well, is the result of secondary flows, both stators shows approximately 4 of overturning near
the tip. This overturning is most likely the result of.ondary flows.
Summary of Results 3. The decrease in axial velocity from 10 percent to 1percent of passage height at the stator-exit measuring
This report presents detailed measurements of the stations is much less than at the rotor exit measuringcasing boundary layer in a 429-meter-per-second-tip- stations.speed, two-stage fan. The fan achieved a peak adiabaticefficiency of 0.846 at a pressure ratio of 2.471 at designspeed. The following principal results were obtained: Lewis Research Center
I. Axial velocities at the first-stage rotor inlet and at National Aeronautics and Space Administration,both rotor exits decreased more rapidly from 4 percent of Cleveland, Ohio, May 7, 1982
4

Appendix ASymbols
Cp specific heat at constant pressure, 1004 J/kg.K a solidity; ratio of chord to spacingD diffusion factor Subscripts:N rotative speed, rpm ad adiabatic (temperature rise)P total pressure, N/cm2 LE blade leading edgep static pressure, N/cm 2 p polytropicr radius, cm TE blade trailing edgeT total temperature, K t tipU wheel speed, m/sec z axial directionV air velocity, m/sec 0 tangential directionW weight flow, kg/sec 1 instrumentation plane upstream of first rotorZ axial distance referenced from rotor-blade-hub 2 instrumentation plane downstream of first rotor
leading edge, cm 3 instrumentation plane downstream of first stator' relative air angle (angle between air velocity and 4 instrumentation plane downstream of second
axial direction), deg rotor-y ratio of specific heats 5 instrumentation plane downstream of second6 ratio of rotor-inlet total pressure to standard stator
pressure of 10.13 N/cm 2 Superscript:q efficiency ' relative to blade9 ratio of rotor-inlet total temperature to standard
temperature of 288.2 K
i j
JIf
.1 S

Appendix B
Equations
Diffusion factor- Head-rise coefficient-
D=I iEF+ (r Vh (r VLE () 4,=CpTTLE/Pm\ ('y- ')'y86VLE (rE + FOO ( LE) Ctip L
Percent of passage height- Flow coefficient-
(ri - r) 10
Adiabatic (temperature rise) efficiency- Polytropic efficiency-
__ _ In TTE
TLE TLE
Equivalent mass flow- Temperature-rise coefficient-
W~~i(B4) O=Cy (TT - TLE) (139)U2Equivalent rotative speed- ip
N Relative flow angle-(B5)
6
References
1. Urasek, Donald C.; Gorreil. William T.; and Cunnan, Walter S.: presence of a Part-Span Damper. NASA TP-1483, AVRADCOMPerformance of a Two-Stage Fan Having Low-Aspect-Ratio First- TR 79-10, 1979.Stage Rotor Blading. NASA TP-1493; AVRADCOM TR 78-49, 5. Urasek, Donald C.: Effect of Casing Treatment on Performance of1979. a Two-Stage High-Pressure Ratio Fan. NASA TP-1409, 1979.
2. Cunnam. Walter S.; Stevans, William; and Urasek, Donald C.: 6. Ball, Calvin L.; Janetzke, David C.; and Reid, Lonnie: PerformanceDesign and Performance of a 427-Meters-per-Second-Tip-Speed of 1380-Foot-Per-Second-Tip-Speed Axial Flow Compressor RotorTwo-Stage Fan Having a 2.40 Pressure Ratio. NASA TP-1314, with Blade Tip Solidity of 1.1. NASA TM X-2449, 1972.1978. 7. Glawe, George E.; Krause, Lloyd N.; and Dudzinski, Thomas J.: A
3. Urasek, Donald C.; Cunnan, Walter S.; and Stevans, William: Small Combination Sensing Probe for Measurement ofPerformance of Two-Stage Fan with Larger Dampers on First-Stage Temperature, Pressure, and Flow Direction. NASA TN D-4816,Rotor. NASA TP-1399, 1979. 1968.
4. Gorrel, William T.; and Urasek, Donald C.: Performance of Two-Stage Fan with a First-Stage Rotor Redesigned to Account for the
7
4f
.. .. i " ' :-:-- - -.:":

I77TABLE 1. - MEASURED STATIC PRESSURES
(a) First-stage Rotor inlet. (d) Second-Stage Rotor Exit.
MASS FLOW MASS FLOWICGISEC 34.63 34.23 34.01 KGISEC 34.63 34.23 34.01
PERCE NT PERCENTPASSAGE PASSAGE'EIGH1T HEIGHT
0.00 8.15 9.21 8.22 fMALL STATIC) 0.00 19.04 20.77 20.92 IWALL STATIC)
1.00 8.42 9.45 8.46 1.00 19.31 21.04 21.20
2.00 8.41 6.43 8.47 2.00 19.22 20.815 20.99
3.00 8.41 9.43 9.46 3.00 19l.15 20.71 20.899
4.00 8.42 8.43 8.4 4.00 11.11 20.681 20.94
6.00 8.40 8.41 9.46 6.00 11.10 20.67 20.80
9.00 8.34 8.37 8.42 8.00 19.08 20.460 20.76
10.00 9.30 8.31 9.36 10.00 19.04 20.62 20.81
15.00 8.13 8.16 8.20 15.00 18.95 20.51 20.64
20.00 9.00 8.01 0.06 20.00 t8.67 20.15 Z0.26
30.00 7.02 7.82 7.86 30.00 '8.22 19.74 19.90
(b) First-Stage Rotor Inlet.(eScodtaettrEx."ASS FLOW MASS FLOWKGISEC 34.63 34.23 34.01 KGISEC 34.63 34.23 34.01
PERCENT PERCENTPASSAGE PASSAGEHEIGH4T HEIG6HT
0.00 12.40 13.08 13.21 SMALL STATICS 0.00 20.09 22.10 22.25 IWALL STATICS
1.00 12.462 13.33 13.7 1.00 20.22 22.23 22.39
2.00 12.54 13.24 13.40 2.00 20.18 22.18 22.3S
3.00 12.52 13.22 13.30 3.00 20.17 22.1S 22.29)
4.00 12.50 13.20 13.36 4.00 20.15 22.13 22.28
6.00 12.44 13.12 13.21 6.00 20.16 22.16 22.29
8.00 12.43 13.09 13.24 8.00 20.18 22.14 22.28
10.00 12.40 13.02 13.16 10.00 20.17 22.13 22.26
15.00 12.21 12.77 12.101 15.00 20.15 22.07 22.23
20.00 11.92 12.44 12.11 20.00 20.08 22.04 22.18
30.00 11.55 12.12 12.26 30.00 19.86 21.84 21.11S
(c) First-Stage Stator Exit.
MAISS FLOW1(615CC 34.63 34.23 34.01
PERCENTPASSAGE'EIGHT
0.00 13.47 14.27 14.41 IWALL STATICS
1.00 13.1 S 14.4S 14.612
2.00 1362 14.41 14.58
*3.00 13.S9 14.39 14.516
4.00 13.99 14.39 14.1
6.00 13.57 14.36 14.2
8.00 13.14 14.31 14.49
10.00 13.11 14.29 14.4%
11.00 13.43 14.16 14. I
20.00 13.33 4 ft g
20.00 13.01 13 10, 1S.17

TABLE lI. - RADIAL DISTRIBUTIONS FOR FIRST-STAGE ROTOR INLET
MASS FLOW 34.63 KGISEC
PERCENT RADIUS AXIAL TANG. TOTAL TOTAL ABS. REL. STATICPASSAGE CM VEL. VEL. TEMP. PRESS. FLOW FLOW PRESS.HEIGHT MISEC M/SEC DEG. NICMS*2 ANG. ANG. N/CMS*2
K DEG. DEG.
1.0 25.49 146.75 0.00 289.38 9.29 0.00 71.09 8.142.0 25.33 160.42 0.00 289.32 9.53 0.00 69.34 8.133.0 25.17 169.80 0.00 289.36 9.70 0.00 68.12 8.124.0 25.01 177.08 0.00 289.21 9.85 0.00 67.15 8.116.0 24.69 185.57 0.00 289.33 10.01 0.00 65.89 8.098.0 24.36 189.41 0.00 288.93 10.08 0.00 65.17 8.0610.0 24.04 191.41 0.00 288.78 10.10 0.00 64.64 8.0415.0 23.24 195.01 0.00 288.51 10.13 0.00 63.45 7.9920.0 22.43 197.98 0.00 288.28 10.13 0.00 62.28 7.9330.0 20.82 203.36 0.00 288.17 10.13 0.00 59.82 7.82
MASS FLOW : 34.23 KGISEC
PERCENT RADIUS AXIAL TAN;.. TOTAL TOTAL ABS. REL. STATICPASSAGE CM VEL. VEL. TEMP. PRESS. FLOW FLOW PRESS.HEIGHT M/SEC M/SEC DEG. N/CMS*2 ANG. ANG. NICM*s2
K DEG. DEG.
1.0 25.49 143.56 0.00 291.01 9.30 0.00 71.47 8.202.0 25.33 157.13 0.00 290.38 9.53 0.00 69.73 8.193.0 25.17 166.76 0.00 290.14 9.70 0.00 68.48 8.184.0 25.01 173.98 0.00 290.13 9.84 0.00 67.51 8.166.0 24.69 182.65 0.00 289.67 10.01 0.00 66.23 8.148.0 24.36 186.77 0.00 289.35 10.07 0.00 65.47 8.1110.0 24.04 189.33 0.00 289.30 10.10 0.00 64.88 8.0915.0 23.24 193.77 0.00 289.23 10.13 0.00 63.60 8.0220.0 22.43 196.80 0.00 288.72 10.13 0.00 L2.42 7.9630.0 20.82 202.91 0.00 288.17 10.13 0.00 59.88 7.83
MASS FLOW 34.01 KG/SEC
PERCENT RADIUS AXIAL TANG. TOTAL TOTAL ABS. REL. STATICPASSAGE CM VEL. VEL. TEMP. PRESS. FLOW FLOW PRESS.HEIGHT M/SEC M/SEC DEG. N/CM**2 ANG. ANG. N'CM**2
K DEG. DEG.
1.0 25.49 143.45 0.00 289.49 9.31 0.00 71.48 8.212.0 25.33 156.18 0.00 289.31 9.52 0.00 69.85 0.193.0 25.17 166.58 0.00 289.31 9.71 0.00 68.50 8.184.0 25.01 174.50 0.00 289.62 9.86 0.00 67.44 8.176.0 24.69 182.10 0.00 289.41 10.01 0.00 66.29 8.158.0 24.36 186.78 0.00 289.17 10.09 0.00 65.47 8.1210.0 24.04 188.25 0.00 289.01 10.10 0.00 65.01 8.1015.0 23.24 192.69 0.00 280.72 10.13 0.00 63.73 8.0420.0 22.43 195.61 0.00 288.61 10.13 0.00 62.56 7.9830.0 20.82 201.28 0.00 288.17 10.13 0.00 60.00 7.86
Ii
!I
ii94iiiiismo ~ ~ momls
.. ~-.--.-- _. Jim" -
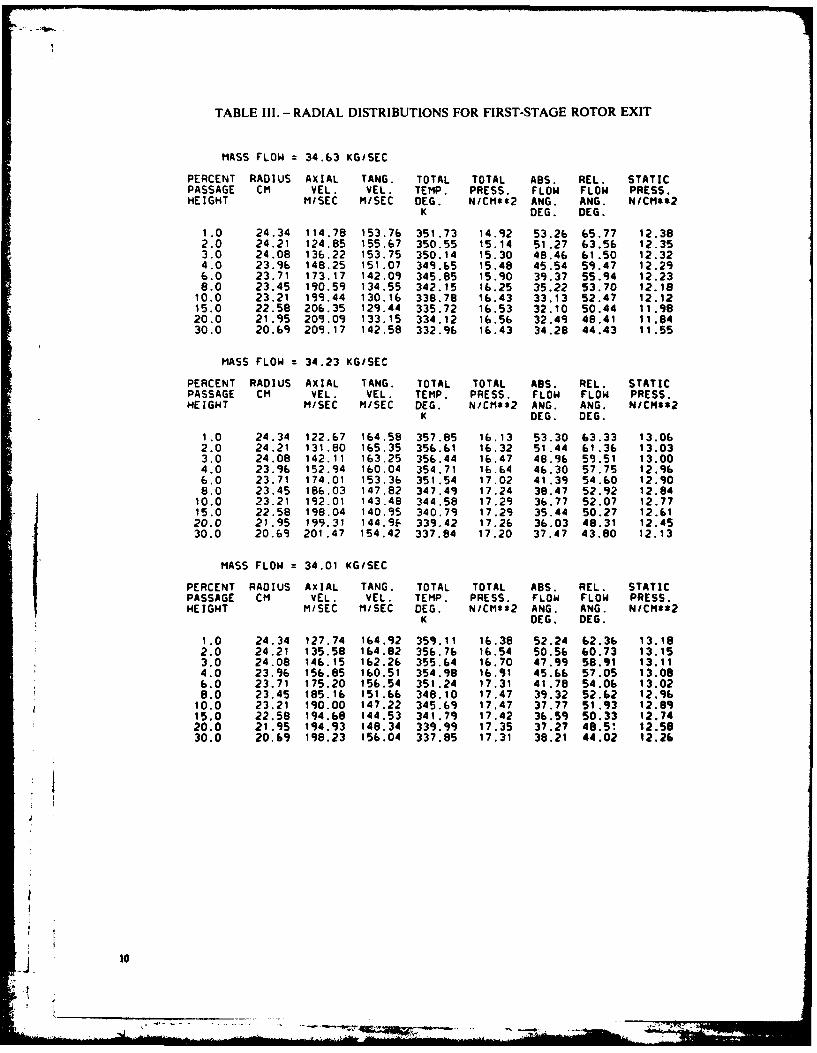
TABLE Ill.- RADIAL DISTRIBUTIONS FOR FIRST-STAGE ROTOR EXIT
MASS FLOW 34.63 KG/SEC
PERCENT RADIUS AXIAL TANG. TOTAL TOTAL ABS. REL. STATICPASSAGE CM VEL. VEL. TEMP. PRESS. FLOW FLOW PRESS.HEIGHT M/SEC M/SEC DEG. N/CM**2 ANG. ANG. NICM*S2
K DEG. DEG.
1.0 24.34 114.78 153.76 351.73 14.92 53.26 65.77 12.382.0 24.21 124.85 155.67 350.55 15.14 51.27 63.56 12.353.0 24.08 136.22 153.75 350.14 15.30 48.46 61.50 12.324.0 23.96 148.25 151.07 349.65 15.48 45.54 59.47 12.296.0 23.71 173.17 142.09 345.85 15.90 39.37 55.94 12.238.0 23.45 190.59 134.55 342.15 16.25 35.22 53.70 12.1810.0 23.21 199.44 130.16 338.78 16.43 33.13 52.47 12.1215.0 22.58 206.35 129.44 335.72 16.53 32.10 50.44 11.9820.0 21.95 209.09 133.15 334.12 16.56 32.49 48.41 11.8430.0 20.69 209.17 142.58 332.96 16.43 34.28 44.43 11.55
MASS FLOW 34.23 KGISEC
PERCENT RADIUS AXIAL TANG. TOTAL TOTAL ABS. REL. STATICPASSAGE CM VEL. VEL. TEMP. PRESS. FLOW FLOW PRESS.HEIGHT M/SEC M/SEC DEG. NICM**2 ANG. ANG. NICNS*2
K DEG. DEG.
1.0 24.34 122.67 164.58 357.85 16.13 53.30 63.33 13.062.0 24.21 131.80 165.35 356.61 16.32 51.44 61.36 13.033.0 24.08 142.11 163.25 356.44 16.47 48.96 59.51 13.004.0 23.96 152.94 160.04 354.71 16.64 46.30 57.75 12.966.0 23.71 174.01 153.36 351.54 17.02 41.39 54.60 12.908.0 23.45 186.03 147.82 347.49 17.24 38.47 52.92 12.8410.0 23.21 192.01 143.48 344.58 17.29 36.77 52.07 12.7715.0 22.58 198.04 140.95 340.79 17.29 35.44 50.27 12.6120.0 21.95 199.31 144-9f1 339.42 17.26 36.03 48.31 12.4530.0 20.69 201.47 154.42 337.84 17.20 37.47 43.80 12.13
MASS FLOW 34.01 KGISECPERCENT RADIUS AXIAL TANG. TOTAL TOTAL ABS. REL. STATICPASSAGE CM VEL. VEL. TEMP. PRESS. FLOW FLOW PRESS.HEIGHT M/SEC M/SEC DEG. N/CMS*2 ANG. ANG. NICM**2
K DEG. DEG.
1.0 24.34 127.74 164.92 359.11 16.38 52.24 62.36 13.182.0 24.21 135.58 164.82 356.76 16.54 50.56 60.73 13.153.0 24.08 146.15 162.26 355.64 16.70 47.99 58.91 13.114.0 23.96 156.85 160.51 354.98 16.91 45.66 57.05 13.086.0 23.71 175.20 156.54 351.24 17.31 41.78 54.06 13.028.0 23.45 185.16 151.66 348.10 17.47 39.32 52.62 12.9610.0 23.21 190.00 147.22 345.69 17.47 37.77 51.93 12.8915.0 22.58 194.68 144.53 341.79 17.42 36.59 50.33 12.7420.0 21.95 194.93 148.34 339.99 17.35 37.27 48.5! 12.5830.0 20.69 198.23 156.04 337.85 17.31 38.21 44.02 12.26
.ttL.-

TABLE IV.- RADIAL DISTRIBUTIONS FOR FIRST-STAGE STATOR EXIT
MASS FLOW 2 34.63 KGISEC
PERCENT RADIUS AXIAL TANG. TOTAL TOTAL ADS. REL. STATICPASSAGE CM VEL. VEL. TEMP. PRESS. FLOW FLOW PRESS.HEIGHT M/SEC M/SEC DEG. N/CM**2 ANG. ANG. NICMS*2
K DEG. DEG.
1.0 24.27 143.01 -13.83 345.29 14.95 -5.52 71.26 13.452.0 24.16 150.99 -11.00 345.04 15.12 -4.17 70.09 13.443.0 24.04 157.89 -6.51 345.24 15.27 -2.36 68.96 13.434.0 23.93 163.05 -5.24 344.43 15.39 -1.84 68.18 13.426.0 23.70 170.69 -0.55 343.99 15.57 -0.18 66.83 13.398.0 23.47 176.01 -1.51 342.60 15.70 -0.49 66.03 13.36
10.0 23.25 180.44 -0.52 340.77 15.82 -0.17 65.23 13.3415.0 22.68 191.71 -3.11 337.83 16.13 -0.93 63.48 13.2820.0 22.11 196.47 -1.87 336.34 16.23 -0.55 62.25 13.2130.0 20.98 199.90 -S14 334.81 16.22 -1.47 60.79 13.09
MASS FLOW 34.23 KGISEC
PERCENT RADIUS AXIAL TANG. TOTAL TOTAL ABS. REL. STATICPASSAGE CM VEL. VEL. TEMP. PRESS. FLOW FLOW PRESS.HEIGHT N/SEC MISEC DEG. NICMS2 ANG. ANG. N/CM*S2
K DEG. DEG.
1.0 24.27 147.74 -14.86 354.42 15.92 -5.75 70.73 14.262.0 24.16 156.38 -11.98 353.02 16.12 -4.38 69.48 14.243.0 24.04 163.00 -5.71 352.37 16.27 -2.00 68.30 14.234.0 23.93 167.89 -5.43 351.71 16.39 -1.85 67.60 14.216.0 23.70 174.44 1.16 350.31 16.55 0.38 66.28 14.188.0 23.47 178.06 -0.51 348.51 16.64 -0.16 65.73 14.1510.0 23.25 181.09 1.01 347.07 16.71 0.32 65.07 14.1215.0 22.68 188.53 -2.10 344.03 16.90 -0.64 63.00 14.0520.0 22.11 193.19 -1.54 341.61 16.99 -0.46 62.62 13.9730.0 20.98 196.95 -4.40 339.13 16.97 -1.28 61.10 13.82
MASS FLOW = 34.01 KGISEC
PERCENT RADIUS AXIAL TANG. TOTAL TOTAL ABS. REL. STATICPASSAGE CM VEL. VEL. TEMP. PRESS. FLOW FLOW PRESS.HEIGHT M/SEC M/SEC DEG. N/CM*22 ANG. ANG. N/CMSS2
K DEG. DEG.
1.0 24.27 149.95 -14.89 353.67 16.13 -5.67 70.46 14.402.0 24.16 150.23 -11.85 352.81 16.32 -4.28 69.25 14.383.0 24.04 165.08 -5.35 352.33 16.49 -1.86 68.03 14.374.0 23.93 170.39 -4.74 352.48 16.62 -1.59 67.27 14.356.0 23.70 176.72 2.27 350.95 16.79 0.74 65.95 14.328.0 23.47 180.03 0.92 349.33 16.87 0,29 65.41 14.2910.0 23.25 102.53 2.42 347.68 16.93 0.7 64.81 14.2615.0 22.68 198.15 -0.93 344.69 17.05 -0.28 63.78 14.1920.0 22.11 192.07 -0.43 342.78 17.12 -0.13 62.6T 14.1230.0 20.98 i95.57 -3.45 340.11 17.09 -1.01 61.21 13.97
4
f / i

TABLE V. - RADIAL DISTRIBUTIONS FOR SECOND-STAGE ROTOR EXIT
MASS FLOW 34.63 KG/SEC
PERCENT RADIUS AXIAL TANG. TOTAL TOTAL ABS. REL. STATICPASSAGE CM vEL. VEL. TEMP. PRESS. FLOW FLOW PRESS.HEIGHT HISEC HISEC DEG. NICMS*2 ANG. ANG. NICM:'2
K DEG. DEG.
1.0 23.53 111.79 124.64 395.30 21.56 48.11 67.56 19.012.0 23.44 119.01 129.83 397.20 21.81 47.49 65.74 18.983.0 23.36 127.54 134.21 398.91 22.09 46.46 63.71 18.964.0 23.26 135.64 137.55 400.04 22.36 45.40 61.83 18.936.0 23.09 153.32 141.83 399.15 22.96 42.77 58.07 18.878.0 22.91 169.74 143.04 399.83 23.49 40.12 54.93 18.32
10.0 22.73 180.94 144.39 398.11 23.92 38.59 52.69 18.7715.0 22.28 190.10 136.25 392.04 23.S6 35.63 51.40 18.6320.0 21.84 193.98 132.82 387.10 23.93 34.40 50.34 18.4930.0 20.94 195.59 138.03 383.26 23.88 35.21 47.55 18.22
MASS FLOW = 34.23 KGISEC
PERCENT RADIUS AXIAL TANG. TOTAL TOTAL ABS. REL. STATICPASSAGE CM VEL. VEL. TEMP. PRESS. FLOW FLOW PRESS.HEIGHT HISEC H/SEC DEG. NICMes2 ANG. ANG. NICes*2
K DEG. DEG.
1.0 23.53 111.30 162.79 410.65 24.57 55.64 64.42 20.752.0 23.44 119.19 162.08 411.11 24.70 53.67 62.78 20.723.0 23.36 127.20 163.10 411.88 24.90 52.05 60.98 20.684.0 23.26 135.14 164.17 410.89 25.15 50.54 59.19 20.656.0 23.09 153.64 164.70 412.47 25.67 46.99 55.45 20.588.0 22.91 170.41 162.73 411.71 26.15 43.68 52.50 20.51
10.0 22.73 180.23 160.70 410.48 26.42 41.72 50.82 20.4415.0 22.28 183.68 150.61 403.21 26.09 39.35 50.62 20.2720.0 21.84 186.28 146.75 397.83 25.94 38.23 49.75 20.1030.0 20.94 191.20 152.47 392.78 26.03 38.57 46.20 19.75
MASS FLOW = 34.01 KG/SEC
PERCENT RADIUS AXIAL TANG. TOTAL TOTAL ABS. REL. STATICPASSAGE CM VEL. VEL. TEMP. PRESS. FLOW FLOW PRESS.HEIGHT M/SEC H/SEC DEG. N/CM'S2 ANG. ANG. NICM'S2
K DEG. DEG.
1.0 23.53 111.32 160.23 411.53 24.63 55.21 64.66 20.892.0 23.44 122.07 163.11 411.37 24.97 53.19 62.12 20.853.0 23.36 127.67 162.76 410.42 25.09 51.89 60.92 20.824.0 23.26 137.00 163.85 412.06 25.34 50.10 58.88 20.786.0 23.09 155.24 163.93 412.18 25.87 46.56 55.26 20.728.0 22.91 169.95 163.32 412.15 26.33 43.86 52.50 20.6510.0 22.73 178.57 160.84 410.48 26.53 42.01 51.06 20.5015.0 22.28 182.92 149.93 403.75 26.21 39.34 50.82 20.41
20.0 21.84 184.66 147.04 398.22 26.06 38.53 49.9E 20.2430.0 20.94 189.28 153.17 393.50 26.14 38.98 46.39 19.90
J 12
.4.Z

TABLE VI. -RADIAL DISTRIBUTIONS FOR SECOND-STAGE STATOR EXIT
MASS FLOW S 34.63 KGISEC
PERCENT RADIUS AXIAL TANG. TOTAL TOTAL ASS. REL. STATICPASSAGE CM VEL. VEL. TEMP. PRESS. FLOW FLOW PRESS.HEIGHT MISEC MISEC DEG. N/CM*52 ANG. ANG. NICM"*2
K DEG. DEG.
1.0 23.54 145.82 -12.09 394.24 22.10 -4.74 70.31 20.082.0 23.45 152.93 -8.25 394.33 22.30 -3.09 69.18 20.073.0 23.37 158.76 -4.55 395.84 22.46 -1.64 68.21 20.064.0 23.29 161.90 -2.40 392.66 22.57 -0.85 67.64 20.056.0 23.12 167.86 1.77 393.65 22.75 0.60 66.53 20.048.0 22.95 172.68 3.65 392.94 22.91 1.21 65.67 20.0210.0 22.78 176.06 5.38 391.99 23.03 1.75 64.99 20.0115.0 22.36 182.51 6.27 389.39 23.26 1.97 63.71 19.9720.0 21.95 186.03 5.16 386.60 23.38 1.59 62.90 19.9330.0 21.11 190.32 1.65 382.52 23.51 0.50 61.66 19.86
MASS FLOW 34.23 KGISEC
PERCENT RADIUS AXIAL TANG. TOTAL TOTAL ABS. REL. STATICPASSAGE CM VEL. VEL. TEMP. PRESS. FLOW FLOW PRESS.HEIGHT M/SEC M/SEC DEG. NICM*82 ANG. ANG. N/CME2
K DEG. DEG.
1.0 23.54 149.36 -9.91 407.31 24.34 -3.79 69.77 22.092.0 23.45 155.18 -5.17 406.24 24.52 -1.91 68.76 22.083.0 23.37 158.96 -0.74 405.41 24.64 -0.26 67.99 22.074.0 23.29 162.61 2.28 405.38 24.76 0.80 67.31 22.066.0 23.12 167.73 7.90 404.69 24.94 2.70 66.21 22.048.0 22.95 170.69 9.09 403.96 25.04 3.05 65.61 22.0310.0 22.78 173.15 10.82 403.17 25.13 3.58 65.04 22.0115.0 22.36 177.54 10.12 400.68 25.27 3.26 64.10 21.9720.0 21.95 180.91 7.88 397.29 25.39 2.49 63.37 21.9230.0 21.11 183.40 5.12 390.35 25.46 1.60 62.31 21.84
MASS FLOW 34.01 KGISEC
PERCENT RADIUS AXIAL TANG. TOTAL TOTAL ABS. REL. STATICPASSAGE CM VEL. VEL. TEMP. PRESS. FLOW FLOW PRESS.HEIGHT MI/SEC MI/SEC DEG. N/CM"*2 ANG. ANG. N/CMS2
K DEG. DEG.
1.0 23.54 150.62 -10.50 405.64 24.56 -3.99 69.64 22.242.0 23.45 156.27 -5.80 405.28 24.74 -2.13 68.65 22.233.0 23.37 158.97 -1.18 404.83 24.82 -0.43 66.02 22.224.0 25.32 162.92 1.71 404.46 24.95 0.60 68.96 22.216.0 23.12 167.61 7.20 404.05 25.11 2.46 66.26 22.198.0 22.95 171.01 8.73 404.11 25.22 2.92 65.59 22.1710.0 22.78 173.06 10.40 403.31 25.29 3.44 65.07 22.1515.0 22.36 178.29 10.06 400.69 25.46 3.23 64.01 22.1020.0 21.95 181.06 7.57 397.59 25.54 2.39 63.37 22.0530.0 21.11 183.17 5.01 391.62 25.57 1.57 62.35 21.95
Ana
[ -
TABLE VII. -CIRCUMFERENTIAL DISTRIBUTIONS AT FIRST-STAGE STATOR EXIT
(a) Mass flow, 34.63 kg/sec
PERCENT GAP
0. 10. 20. 30. 40. 50. 60. 70. 80. 90.RADIUS PERCENT
CM PASSAGEHEIGHT TOTAL PRESSURE - N/CM*2
24.27 1. 15.15 15.25 15.29 14.68 14.51 14.82 14.82 14.81 14.90 15.0724.16 2. 15.29 15.35 15.39 14.75 14.64 15.09 15.12 15.05 15.09 15.2224.04 3. 15.40 15.43 15.51 15.05 14.57 15.18 15.36 15.28 15.27 15.3723.93 4. 15.52 15.54 15.57 15.08 14.62 15.31 15.57 15.46 15.45 15.5023.70 6. 15.70 15.69 15.70 15.40 14.70 15.15 15.82 15.77 15.71 15.7123.47 8. 15.83 15.82 15.78 15.39 14.81 15.38 15.97 15.95 15.89 15.8723.25 10. 15.96 15.93 15.90 15.59 14.93 15.33 16.05 16.12 16.04 16.0222.68 15. 16.26 16.24 16.20 15.77 15.36 15.90 16.33 16.37 16.34 16.3322.11 20. 16.36 16.34 16.33 15.98 15.64 15.98 16.36 16.38 16.40 16.4020.98 30. 16.41 16.41 16.40 15.88 15.80 16.05 16.27 16.25 16.29 16.27
TOTAL TEMPERATURE - DEG. K
24.27 1. 344.87 346.69 346.73 346.34 341.67 343.36 343.72 343.76 346.50 348.2424.16 2. 345.13 345.75 346.49 345.81 342.82 343.57 343.96 344.44 345.61 346.3324.04 3. 345.73 345.36 346.88 345.66 343.88 344.00 344.63 345.53 345.34 345.0123.93 4. 345.05 344.25 345.44 345.78 343.10 343.31 343.55 344.27 344.30 345.0023.70 6. 343.82 344.76 344.97 345.55 342.63 341.93 342.97 343.96 344.50 344.3423.47 8. 342.82 343.01 343.66 344.30 342.16 340.98 341.32 342.25 342.63 342.8123.25 10. 337.08 341.36 342.23 342.96 340.76 339.76 340.58 341.04 340.85 341.1622.68 15. 332.85 338.90 339.24 339.42 337.87 337.55 337.46 338.21 338.20 338.7722.11 20. 336.11 336.82 336.97 336.90 336.45 335.76 335.68 335.91 336.28 336.5120.98 30. 335.15 335.56 335.84 335.14 335.01 334.54 334.15 334.20 333.98 334.47
ABSOLUTE FLOW ANGLE - DEG.
24.27 1. -4.36 -4.63 -3.46 -2.37 -6.91 -8.64 -7.07 -6.21 -6.16 -5.4324.16 2. -3.06 -2.63 -0.64 -3.04 -8.70 -7.30 -4.44 -3.80 -4.18 -3.8824.04 3. -2.20 -1.88 -0.60 1.83 -2.91 -5.18 -4.29 -2.68 -2.88 -2.8123.93 4. -1.38 -0.82 1.12 1.89 -5.62 -6.06 -2.69 -1.41 -1.74 -1.7123.70 6. -0.68 -0.49 0.48 4.29 1.58 -1.75 -2.52 -0.92 -1.03 -0.8023.47 8. -0.62 -0.33 1.20 4.51 -1.30 -4.30 -2.05 -0.59 -0.67 -0.7523.25 10. -0.96 -0.67 0.17 3.37 1.96 -1.08 -2.23 -0.87 -0.74 -0.6122.68 15. -0.97 -0.92 0.36 2.96 -1.95 -3.53 -2.12 -1.17 -0.98 -0.9622.11 20. -0.61 -0.76 -0.12 2.50 0.03 -1.48 -2.00 -1.19 -1.03 -0.7920.98 30. -0.71 -0.67 -0.48 0.48 -2.59 -3.76 -2.39 -1.75 -1.55 -1.30
AXIAL VELOCITY - MISEC
24.27 1. 151.66 156.02 157.77 130.81 120.02 135.81 136.04 135.93 140.71 148.6324.16 2. 158.04 160.61 162.40 134.70 127.17 148.65 150.77 147.79 149.91 155.4524.04 3. 163.24 164.34 167.60 149.23 125.86 153.69 161.21 158.45 157.78 161.8523.93 4. 167.93 168.59 169.96 150.82 128.71 158.97 169.34 165.79 165.49 167.3423.70 6. 175.14 175.13 175.44 164.50 134.70 154.30 1788f 177.74 175.82 175.7923.47 8. 180.47 180.02 178.90 164.96 140.92 163.65 184.36 183.99 182.14 181.7023.25 10. 183.77 184.23 183 51 173.01 147.21 163.17 187.45 189.78 187.41 186.8022.68 15. 193.95 195.05 194.06 180.78 166.18 189.A8 I97.13 198.74 197.67 197.6322.11 20. 199.90 199.68 199.32 188.96 178.46 188.76 199.66 200.44 200.98 201.2720.98 30. 205.35 205.48 205.16 190.28 187.52 194.85 200.97 200.65 201.65 201.40
14

TABLE VII. -Continued.
(b) Mass flow, 34.23 kg/sec
PERCENT GAP
0. 10. 20. 30. 40. 50. 60. 70. 80. 90.RADIUS PERCENTCm PASSAGE
HEIGHT TOTAL PRESSURE - N/CP**2
24.27 1. 16.17 16.26 16.27 15.45 15.34 15.78 15.86 5.84 15.83 16.0224.16 2. 16.33 16.38 16.41 15.51 15.49 16.08 16.21 16.12 16.08 6.2124.04 3. 16.47 16.50 16.52 15.89 15.29 16.09 16.47 16.38 16.27 16.3723.93 4. 16.61 16.62 16.60 15.90 15.25 16.17 16.65 16.55 16.49 16.5323.70 6. 16.77 16.74 16.75 16.33 15.29 f5.92 16.81 16.80 16.75 16.7723.47 8. 16.87 16.87 16.80 16.26 15.39 16.08 16.89 16.92 16.90 16.8723.25 10. 16.96 16.93 16.87 16.40 15.52 15.95 16.90 17.05 16.99 17.0122.68 15. 17.12 17.11 17.03 16.!5 15.87 16.48 17.06 17.12 17.12 17.1422.11 20. 17.19 17.19 17.15 16.79 16.24 16.70 17.10 17.09 17.10 17.1220.98 30. 17.13 17.15 17.18 16.59 16.40 16.83 17.11 17.05 17.05 16.99
TOTAL TEMPERATURE - OEG. K
24.27 1. 353.01 356.29 355.57 355.74 355.34 352.87 352.80 354.40 353.46 354.8224.16 2. 353.15 354.21 354.40 354.26 352.40 351.76 351.73 352.64 352.48 353.1224.04 3. 353.71 352.96 353.95 353.57 349.87 351.54 351.53 351.76 352.03 352.0623.93 4. 352.96 352.16 353.01 353.57 350.35 349.41 350.55 351.20 351.87 351.6623.70 6. 351.26 351.81 351.93 352.71 348.78 347.75 348.07 349.20 349.95 350.9423.47 8. 349.32 350.00 350.46 351.50 348.17 345.90 346.23 346.77 348.01 348.7023.25 10. 347.29 348.46 349.25 350.32 347.07 344.44 344.93 345.36 346.41 347.0522.68 15. 344.13 344.75 345.82 346.69 344.06 342.94 342.53 342.52 343.02 344.0422.11 20. 341.80 341.99 342.90 343.60 341.90 341.08 340.56 340.42 340.78 341.1420.98 30. 339.09 339.47 339.89 339.72 339.45 339.28 338.93 338.67 338.48 338.37
ABSOLUTE FLOW ANGLE - DEG.
24.27 1. -4.05 -4.45 -2.90 -2.84 -8.61 -10.25 -8.03 -5.73 -5.55 -5.0424.16 2. -1.79 -2.04 0.05 -4.55 -11.50 -9.05 -5.26 -3.37 -3.28 -3.0124.04 3. -0.83 -0.54 1.01 2.41 -3.78 -6.83 -5.14 -2.59 -1.90 -1.8623.93 4. -0.42 0.51 2.77 1.65 -7.55 -8.15 -3.69 -1.43 -1.17 -1.0423.70 6. 0.36 0.72 2.13 6.57 2.50 -3.33 -3.36 -1.18 -0.33 -0.2623.47 8. 0.04 0.68 2.91 6.64 -1.54 -5.95 -2.84 -0.93 -0.48 -0.1623.25 10. -0.48 -0.08 1.09 5.13 3.23 -1.42 -2.47 -1.01 -0.54 -0.2522.68 15. -0.96 -0.29 1.06 4.34 -1.20 -3.91 -2.40 -1.26 -1.01 -0.7622.11 20. -0.75 -0.38 0.20 2.93 0.21 -1.60 -1.94 -1.12 -1.03 -1.1020.98 30. -0.45 -0.47 -0.04 1.17 -3.34 -4.32 -2.01 -1.16 -1.04 -1.13
AXIAL VELOCITY - MISEC
24.27 1. 157.80 161.88 162.56 127.06 120.24 140.10 144.52 144.58 144.11 152.0524.16 2. 164.71 166.84 168.07 130.38 126.74 153.42 159.32 156.46 155.26 160.0924.04 3. 170.63 171.50 172.50 148.35 119.32 155.16 169.43 166.82 163.14 166.7023.93 4. 175.68 175.98 175.24 149.76 117.47 157.72 176.21 173.42 171.29 172.7923.70 6. 181.79 180.97 181.13 166.36 121.88 150.32 181.8' 181.94 180.74 181.4823.47 8. 185.46 185.39 183.19 164.60 128.90 157.14 184.87 186.13 86.02 185.2923.25 10. 188.72 188.15 86.51 170.76 135.85 153.71 185.89 190.61 189.15 190.0022.68 15. 194.82 194.81 192.93 178.24 154.02 174.13 192.74 194.56 194.51 195.4422.11 20. 198.80 198.87 198.11 187.71 169.95 184.48 195.87 195.69 196.01 196.7420.98 30. 201.41 202.12 203.06 186.41 180.27 192.61 200.64 199.02 198.7 197.50
ris

TABLE VII1. -Concluded.
(c) Mass flow, 34.01 kg/sec
PERCENT GAP
0. 10. 20. 30. 40. so. 60. 70. 80. 90.RADIUS PERCENT
CM PASSAGEHEIGHT TOTAL PRESSURE - N/CM832
24.27 1. 16.39 16.52 16.51 15.63 15.53 15.99 16.11 16.03 16.03 16.2124.16 2. 16.56 16.65 16.65 15.69 15.63 16.27 16.44 16.31 16.27 16.4024.04 3. 16.72 16.75 16.80 16.08 15.41 16.25 16.70 16.62 16.49 16.5723.93 4. 16.86 16.88 16.88 16.11 15.35 16.34 16.88 1F6.82 16.72 16.7523.70 6. 17.05 17.02 17.00 16.60 15.42 15.98 17.02 17.06 17.00 16.9923.47 8. 17.15 17.11 17.06 16.53 15.50 16.10 17.10 17.17 17.13 17.1123.25 10. 17.22 17.19 17.13 16.66 15.68 16.01 17.08 17.25 17.22 17.1922.68 15. 17.32 17.31 17.23 16.74 16.01 16.52 17.22 17.25 17.25 17.2722.11 20. 17.33 17.35 17.33 16.96 16.35 16.71 17.22 17.23 17.22 17.2220.98 30. 17.25 17.25 17.29 16.72 16.50 16.94 17.25 17.21 17.16 17.13
TOTAL TEMPERATURE - DEG. K
24.27 1. 353.30 355.06 353.98 354.69 353.60 352.95 353.59 351.87 352.66 354.9024.16 2. 352.99 354.17 354.06 3S3.62 351.74 351.86 351.79 351.67 352.39 353.5224.04 3. 352.67 353.93 354.65 352.61 350.06 351.30 350.44 351.75 352.45 352.6223.93 4. 353.84 352.84 353.18 3S4.78 350.38 350.47 351.23 352.16 352.44 352.8223.70 6. 351.65 352.19 353.05 353.45 349.29 348.05 348.81 349.89 350.81 351.3S23.47 8. 350.28 349.53 351.35 352.91 348.66 346.71 347.15 347.95 348.192 349.5823.25 10. 348.51 346.66 350.03 351.38 347.58 345.60 345.79 346.35 347.26 347.5522.68 15. 345.08 345.13 346.10 347.40 345.47 343.39 343.17 343.49 343.73 344.2322.11 20. 342.89 343.18 343.99 345.12 343.30 341.82 341.75 341.71 341.78 342.4120.98 30. 340.04 340.20 341.06 340.43 340.49 339.32 339.71 340.08 340.13 339.70
ABSOLUTE FLOW ANGLE -DEG.
24.27 1. -3.79 -4.45 -2.84 -2.90 -8.93 -10.17 -7.95 -5.42 -5.18 -5.0824.16 2. -1.72 -1.81 0.39 -4.43 -11.64 -9.17 -5.16 -3.18 -3.19 -2.9124.04 3. -0.64 -0.47 1.00 2.67 -3.79 -6.71 -5.08 -2.29 -1.60 -1.6523.93 4. 0.22 0.64 3.11 2.27 -7.38 -8.42 -3.61 -1.23 -0.83 -0.7123.70 6. 0.95 1.50 2.49 7.16 3.24 -3.37 -3.49 -1.24 -0.07 0.2023.47 8. 0.68 1.24 3.10 7.51 -0.86 -6.03 -2.72 -0.62 0.23 0.4023.25 10. 0.17 0.44 1.73 5.87 4.01 -1.24 -2.29 -1.05 -0.11 0.0822.68 15. -0.79 -0.23 1.26 4.85 -0.45 -3.49 -2.02 -0.85 -0.59 -0.5122.11 20. -0.73 -0.18 0.50 3.53 0.79 -1.12 -1.90 -0.89 -0.79 -0.4820.98 30. -0.45 -0.46 0.12 2.08 -2.88 -4.22 -1.75 -0.97 -0.89 -0.68
AXIAL VELOCITY - HISEC
24.27 1. 160.26 165.21 164.98 128.49 121.98 142.33 148.34 145.33 145.86 153.4024.16 2. 167.36 170.53 170.58 131.79 125.89 154.35 161.90 157.51 156.23 161.3624.04 3. 173.38 174.46 176.37 149.54 117.89 154.93 171.41 169.44 165.17 168.1423.93 4. 178.73 178.95 179.03 151.94 114.80 158.16 178.44 177.04 173.65 174.7523.70 6. 185.17 184.34 183.99 169.91 120.79 146.49 183.18 184.91 183.58 183.2623.47 8. 188.83 187.47 186.37 168.50 126.39 151.82 186.44 188.87 188.03 187.5323.25 10. 191.61 190.22 189.07 173.94 136.06 150.12 186.52 191.63 191.04 190.2S22.68 15. 195.94 195.56 193.67 178.73 153.43 170.?0 192.56 193.39 193.47 194.2422.11 20. 198.01 198.73 198.34 187.83 168.21 179.70 194.70 194.9 194.58 194.7620.98 30. 199.88 200.13 201.39 185.1? 178.03 190.82 199.70 198.86 197.44 196.50
.14
II

TABLE VIII.- CIRCUMFERENTIAL DISTRIBUTIONS AT SECOND-STAGE STATOR EXIT
(a) Mass flow, 34.63 kg/sec
PERCENT GAP
0. 10. 20. 30. 40. 50. 60. 70. 80. 90.RADIUS PERCENT
Cm PASSAGEHEIGHT TOTAL PRESSURE - N/CM*S2
23.54 1. 22.15 22.35 22.48 22.57 22.63 22.04 21.32 21.60 21.57 21.6023.45 2. 22.29 22.51 22.66 22.76 22.79 22.20 21.42 21.10 21.98 21.8823.37 3. 22.39 22.61 22.81 22.89 22.92 22.49 21.54 21.9b 22.31 22.1323.29 4. 22.48 22.70 22.90 22.97 22.99 22.64 21.50 22.09 22.52 22.3923.12 6. 22.66 22.87 23.02 23.10 23.11 22.89 21.79 21.95 22.81 22.8022.95 8. 22.88 23.05 23.21 23.30 23.24 22.98 21.76 22.08 23.01 23.0422.78 10. 23.07 23.17 23.30 23.36 23.37 23.15 22.13 22.01 23.03 23.1622.36 15. 23.46 23.52 23.56 23.56 23.52 23.41 22.37 22.14 23.13 23.3721.95 20. 23.64 23.67 23.68 23.64 23.59 23.52 22.80 22.36 22.98 23.5021.11 30. 23.72 23.74 23.74 23.70 23.71 23.65 22.96 22.68 23.26 23.61
TOTAL TEMPERATURE - DEG. K
23.54 1. 392.96 394.30 393.58 314.36 392.52 398.87 393.73 392.83 394.26 395.1623.45 2. 393.45 393.95 393.79 343.95 393.23 399.68 393.20 393.49 394.13 394.4423.37 3. 394.41 393.91 394.67 313.91 394.52 407.19 392.67 355.05 398.20 393.6023.29 4. 393.74 392.60 393.51 353.26 393.67 394.41 392.96 392.92 385.81 393.6523.12 6. 393.46 394.07 393.38 3S3.13 393.27 394.47 392.57 393.12 394.26 394.5522.95 8. 353.25 393.28 392.99 392.62 392.71 393.41 392.05 391.84 393.24 393.6222.78 10. 392.72 392.34 392.04 3S1.73 391.68 392.71 391.99 390.03 391.49 392.1922.36 15. 390.13 390.13 389.54 385.16 389.01 390.24 389.32 387.78 388.72 389.4921.95 20. 387.22 387.27 386.85 386.11 386.30 387.32 386.82 385.16 385.98 386.6621.11 30. 382.42 382.59 382.49 382.30 382.36 383.27 383.07 381.81 382.24 382.58
ABSOLUTE FLOW ANGLE - DEG.
23.54 1. -7.24 -6.28 -5.05 -4.03 -2.02 0.76 -5.95 -7.50 -5.00 -5.0823.45 2. -5.36 -4.39 -3.24 -2.11 -0.17 2.62 -5.21 -6.58 -3.39 -3.0323.37 3. -3.88 -3.25 -2.01 -0.98 0.72 3.97 -1.41 -5.94 -2.45 -1.1823.29 4. -2.97 -3.27 -1.41 -0.47 1.25 5.40 -0.36 -5.25 -1.39 -0.0323.12 6. -1.24 -1.14 -0.40 0.43 1.81 5.80 4.54 -3.80 -1.24 1.2822.95 8. -0.08 -0.05 0.42 1.16 2.32 6.28 5.15 -3.84 -0.84 1.5822.78 10. 0.98 0.94 1.22 1.78 2.62 5.56 6.86 -2.56 -1.36 1.4622.36 15. 1.87 2.02 2.29 2.46 2.82 5.48 6.62 -2.45 -1.88 0.4421.95 20. 1.59 1.79 2.06 2.16 2.34 4.37 5.27 -0.50 -2.62 -0.5821.11 30. 0.21 0.42 0.69 0.83 1.15 3.11 2.86 -0.40 -2.75 -1.16
AXIAL VELOCITY - HISEC
23.54 1. 146.64 153.59 158.02 160.93 162.66 145.27 115.14 126.75 126.06 127.4223.45 2. 152.00 159.20 163.91 167.17 167.78 150.98 120.21 138.58 142.07 138.6523.37 3. 155.91 162.62 168.88 171.13 171.91 161.73 125.68 141.48 154.46 147.1623.29 4. 159.00 165.48 171.47 173.34 173.01 163.40 124.54 145.99 156.93 156.6223.12 6. 165.07 171.25 175.28 177.24 177.59 170.91 135.96 141.53 169.58 161.2222.9S . 171.80 176.54 180.45 182.66 181.22 173.48 135.23 146.95 175.29 176.1422.78 10. 177.25 179.95 183.16 184.57 184.64 178.62 148.56 144.54 175.95 179.4922.36 15. 187.51 189.14 189.87 189.76 188.76 185.67 156.88 150.31 179.00 185.4121.95 20. 192.22 192.92 193.14 191.89 190.85 189.09 170.43 157.91 175.48 188.9321.11 30. 195.07 195.62 195.42 194.51 194.68 193.45 176.67 169.09 183.94 192.46
1
!-J'

TABLE VIII. -Continued.
(b) Mass flow, 34.23 kg/sec
PERCENT GAP
0. 10. 20. 30. 40. 50. 60. 70. 80. 90.RADIUS PERCENTCM PASSAGE
HEIGHT TOTAL PRESSURE - NICM**2
23.54 1. 24.07 24.21 24.45 24.69 24.92 24.57 23.36 23.98 24.28 24.2923.45 2. 24.29 24.35 24.51 24.78 25.04 24.71 23.45 24.12 24.67 24.7123.37 3. 24.55 24.51 24.57 24.74 25.01 25.00 23.57 23.92 24.89 25.0123.29 4. 24.81 24.67 24.66 24.81 25.07 25.07 23.56 23.88 25.08 25.2823.12 6. 25.20 25.08 24.92 24.92 25.14 25.20 24.09 23.48 25.04 25.5322.95 8. 25.37 25.17 25.07 25.08 25.19 25.28 24.23 23.54 25.12 25.5622.78 10. 25.41 25.30 25.24 25.23 25.28 25.40 24.65 23.56 24.90 25.5622.36 15. 25.54 25.47 25.42 25.52 25.61 25.64 24.81 23.71 24.74 25.5321.95 20. 25.44 25.64 25.65 25.67 25.73 25.73 25.08 24.32 24.66 25.4521.11 30. 25.67 25.66 25.66 25.69 25.70 25.71 25.01 24.62 24.91 25.5
TOTAL TEMPERATURE - DEG. K
23.54 1. 404.63 407.13 406.30 408.06 409.39 407.62 406.38 408.64 407.06 407.3223.45 2. 405.37 406.40 405.87 406.83 407.36 407.04 404.87 406.23 405.85 406.0123.37 3. 406.60 405.62 405.25 405.82 404.94 407.54 403.09 404.46 404.89 405.1423.29 4. 406.40 405.77 406.18 405.48 406.18 405.90 404.37 403.45 405.31 404.2523.12 6. 405.67 406.22 405.43 405.04 404.96 405.59 403.24 401.66 403.38 404.5522.95 8. 404.70 405.48 405.32 404.71 404.14 404.67 404.30 400.50 402.28 402.6222.78 10. 403.26 404.81 404.70 404.36 403.59 403.83 404.04 399.52 401.10 401.4722.36 15. 400.53 401.57 402.14 402.19 401.30 401.83 401.66 397.66 397.81 399.0621.95 20. 396.94 397.67 398.56 398.55 397.75 398.62 398.25 395.42 394.69 395.7721.11 30. 382.62 391.48 391.56 391.52 391.41 392.25 391.91 390.28 389.82 390.84
ABSOLUTE FLOW ANGLE - DEG.
23.54 1. -3.28 -4.09 -5.29 -5.27 -3.31 1.90 -3.71 -8.57 -4.57 -1.7623.45 2. -0.84 -1.61 -2.66 -2.92 -1.38 3.91 -2.57 -7.51 -3.16 -0.3623.37 3. 0.96 0.63 -0.37 -1.50 -0.35 4.55 1.85 -6.00 -3.10 0.6023.29 4. 2.34 1.92 0.76 -0.44 0.56 5.84 3.64 -5.52 -2.33 1.2523.12 6. 3.73 3.9P 3.64 2.42 2.04 5.74 8.31 -1.66 -2.83 1.6022.95 8. 3.96 4.39 4.15 3.33 2.95 6.22 8.65 -2.02 -2.48 1.3522.78 10. 3.74 4.28 4.56 4.11 3.58 5.69 10.12 1.69 -3.06 1.0622.3 "15. 2.88 3.23 3.51 3.75 3.97 5.95 10.06 2.32 -2.81 -0.2321.95 20. 1.88 2.07 2.40 2.73 3.16 4.96 7.41 2.66 -1.45 -0.8821.11 30. 1.32 1.35 1.36 1.47 1.80 3.51 5.58 1.71 -1.17 -0.95
AXIAL VELOCITY - MISEC
23.54 1. 140.10 145.14 152.29 159.53 166.76 1S6.51 113.70 136.37 147.21 148.1423.45 2. 147.90 150.18 154.58 162.60 169.89 16O.S6 117.83 141.46 159.16 10.7223.37 3. 156.49 155.20 156.92 161.76 169.09 168.70 122.86 135.27 165.56 169.1223.29 4. 163.97 160.06 159.78 163.92 171.00 170.06 122.64 133.95 171.08 176.0023.12 6. 174.56 171.51 167,00 167.11 172.92 173.84 140.90 119.84 170.13 182.b422.95 8. 178.94 174.10 171.59 171.82 174.48 176.07 145.92 123.06 172.41 183.4122.78 10. 180.07 177.70 176.11 17,76 177.02 179.51 158.30 124.23 166.84 183.6422.36 is. 183.86 182.43 181.24 183.72 185.59 185.L8 163.50 131.21 163.21 183.5821.95 20. 182.03 186.74 187.25 187.54 188.82 188.61 172.28 152.27 161.76 182.1921.11 30. 186.14 188.12 180.14 188.71 188.90 189.17 172.28 162.43 169.93 185.95
Is.18

TABLE VIII. -Concluded.
(c) Mass flow, 34.01 kg/sec
PERCENT GAP
0. 10. 20. 30. 40. 50. 60. 70. 80. 90.RADIUS PERCENTCI PASSAGE
HEIGHT TOTAL PRESSURE - NICMSS2
23.54 1. 24.26 24.39 24.65 24.93 25.22 24.78 23.62 24.24 24.50 24.4723.45 2. 24.49 24.53 24.72 25.04 25.28 24.90 23.71 24.39 24.87 24.6723.37 3. 24.65 24.68 24.74 24.92 25.27 25.15 23.76 24.10 25.06 25.2025.32 4. 24.96 24.78 24.82 25.02 25.33 25.27 23.78 24.07 25.30 25.4423.12 6. 25.29 25.17 25.06 25.06 25.35 25.43 24.33 23.70 25.24 2S.6822.95 8. 25.46 25.31 25.18 25.20 25.47 25.51 24.39 23.77 25.38 25.7222.78 10. 25.49 25.42 25.33 25.34 25.52 25.59 24.81 23.69 25.11 25.7722.36 15. 25.72 25.68 25.65 25.71 25.77 25.84 24.98 23.90 24.91 25.6821.95 20. 25.76 25.76 25.77 25.78 25.86 25.86 25.14 24.49 24.84 25.6221.11 30. 25.80 25.78 25.74 25.78 2S.79 25.82 25.12 24.77 25.01 25.66
TOTAL TEMPERATURE - DEG. K
23.54 1. 402.44 405.79 405.10 406.52 406.65 405.64 405.82 405.03 405.97 407.0823.45 2. 403.84 405.66 405.22 405.66 405.86 40S.91 404.34 404.48 405.35 406.0323.37 3. 404.67 40S.71 405.37 403.86 404.99 406.88 401.90 404.08 404.75 40S.2225.32 4. 404.94 405.71 405.59 404.56 404.96 405.23 403.12 401.97 403.80 404.0423.12 6. 404.93 404.86 405.20 405.00 404.08 404.69 404.25 400.80 402.71 403.2122.95 8. 405.06 404.89 405.27 40S.16 404.12 404.71 404.37 400.79 402.73 403.1822.78 10. 403.64 404.22 404-53 404.11 403.19 404.30 404.22 400.12 401.78 402.1022.36 15. 401.01 401.49 402.08 402.00 401.60 401.42 401.31 397.69 398.20 399.0121.95 20. 397.59 398.28 398.92 398.57 398.13 398.09 398.34 395.80 395.13 396.4821.11 30. 391.55 391.89 392.37 391.67 391.38 391.69 391.90 390.94 390.99 391.60
ABSOLUTE FLOW ANGLE - DEG.
23.54 1. -3.72 -4.62 -5.36 -5.44 -3.40 1.74 -4.09 -8.69 -4.53 -1.7823.45 2. -1.27 -2.41 -3.05 -3.13 -1.41 3.72 -2.72 -7.50 -3.12 -0.3623.37 3. 0.86 -0.05 -0.04 -1.64 -0.45 4.57 1.53 -6.05 -2.90 0.7025.32 4. 1.97 1.46 0.07 -0.80 0.41 5.78 3.41 -5.32 -2.25 1.2723.12 6. 3.48 3.75 2.81 1.72 1.69 5.63 3.34 -1.76 -2.65 1.5922.95 8. 3.79 4.17 3.85 3.07 2.91 6.19 8.se -2.14 -2.46 1.3822.78 10. 3.67 4.09 4.21 3.70 3.39 S.63 9.99 1.54 -2.83 1.0022.36 1s. 2.88 3.20 3.50 3.73 3.94 6.OS 9.96 2.05 -2.90 -0.2221.95 20. 1.89 2.07 2.36 2.70 3.11 4.91 7.17 2.30 -1.63 -0.9421.11 30. 1.37 1.47 1.46 1.53 1.73 3.45 5.46 1.59 -1.41 -1.01
AXIAL VELOCITY - MISEC
23.54 1. 140.45 145.04 152.67 161.21 169.47 157.16 117.65 138.83 148.66 148.3123.45 2. 148.81 150.22 155.72 164.76 171.43 160.73 121.68 144.39 159.07 160.2523.37 3. 154.14 15S.03 156.94 161.SS 171.20 166.08 123.60 13S.64 16S5.3 169.4625.32 4. 163.10 158.39 159.S0 164.77 173.05 170.87 124.61 134.79 171.90 17S.6823.12 6. 172.35 169.14 166.36 166.64 173.9S 175.40 143.54 122.32 170.84 161.7522.95 8. 177.27 173.36 170.01 170.71 177.42 177.66 146.06 125.73 174.92 193.3922.78 10. 178.29 176.47 174.24 174.64 178.80 180.14 1S8.50 123.61 168.26 184.9S22.36 15. 184.63 183.63 183.00 184.35 lS.76 196.!2 163.96 132.96 163.00 163.5221.95 20. 186.19 186.33 186.79 186.83 188.36 187.94 170.16 153.03 162.99 162.6921.11 30. 188.30 186.04 187.15 167.98 188.06 138.5 171.84 163.16 169.51 185.31
19
p *. it

Flow pat" 'oordinatesAxial Radius, r, cm
distance, Outer InnerZ.cm
-13.093 25.654 8.994-8. 016 25.654 8.903-2. 936 25.654 9.0931a.203 25.651 9.5432.144 25. 570 10.1604.694 25.128 10.973
30-2 37.224 24.651 11.565STATIN I89.764 24.460 11.902
14.*844 12.438E 20 i 17.364 12.8922
Al7/O 2.6 24.328 13.152a25.004 23.993 13.627S10-2.4 3651.1'30.0O4 23.622 14.699
-20 -10 0 10 20 30 40 ax 850 15.240AXAL DISTANCE (FROM ROTOR-BLADE-HUB LEADING EDGE), Z. cm 42. 784 9 15.240
Figure 1.- Flow path of two-stage low-aspect-ratio fan. isrmnsuvypae
44
Figur 01-- - w-, -u wit loapdral4istspn

F-Air inlet (atmOscherel
r- Atmosphere exhaust
r-Buterfy vave T M ic plButVa e l al ve
Ldi motighenr scscree
FL~ gutrlyve 3.-Mlitg oer test fanty
TWO NULL BALANC INGTHERMOCOUPLE-\ \ I PRESSURE TAPS FOR
FLOW -ANGLE ANDSTATIC-PRESSUREAAASUREWNTS
TOTAL-PRESSURE TUBE(Most cm dlam)
Figure 4 -Combnatli lftl-prssur., stilc-pressur. total-
bWq~.ul~ad flW-.fl prb Idoube Were)
21

1800
@03
StlwAStation 2 Station 3
Station 4 Station 5(a)
470
q8 ~1 30
Station 1 Station 2 Station 3
1190
Station 4 Station 5
4A) Combination probes.(b) Static pressure taps.
Figure 5~-Circumferential locations of instrumentationat measuring stations (looking donstreaml.
8 p0 eossure al staticoe
a uve m1wf
0 -- lc

Percentof design
0 100o 70a 80o 70
1.0- 0 609 * Design
.8-
.66
1.1.3
1.4
S 1.021
2.5-Sta ine
d
10 20 3040Equivalent mss flow. kgtsoc
Figure7. - Overall performnce of two-stage.low-aspect-ratio fan.
1.0
9
7 -7 s7r .2
3-21KI Percent
of design
0 100.300 .590
(a) Fis tg.1)First-stage rotor. 0 601.0-~ 0 Design
Z 5
4.
3.3

~gUbi)
0
CC *
0- z- T- - . 44 ta
:e
a&$-
c I
'C-C
eft I 10 I
a 0 ua
-z
010
0210.
UU
I ai
___ ____A__n_

0i z
h U$in ft C
CL)O.ZCL
- --J
tzI
Lt lla I q I Ir- h
3o a " aL In ci a a a a aan nc 0& -C Q. n m - ~ . n ~
-jj
- '- 1-C
a .JU -CUL 0.. Li10h CD. o- m-U,-11dA o.ift C..5(a hi .C~a -c a
26zI K IC

C, .c - -CE
x i us L
i
-C b i bei a~.
4 40
z hi
0 0 0. a - 0 _ %
x * to *En0
6041 0
lI.
hia.
- - - - - - - - - - - - - - - - - - - -- - - - - - - -
hn
I- In .en
2 2

4"
ina"
ft
A-
0 El &
-4-a- On 2
0 81 0.
a I- I I a- 2 C3 a a , a 3 a a a3
W Q -Ax w
. - X* 4 C3
c~a -L
aie~4 CEn
-- 1 LA2
El a6
0 a
00 00 Li -0-
Ut0.
o 0 co 10 a- a
Z,-a 0 o

0
1
maa
A0 "a*
i (A uz W0
ccc4cu i i
.- ~QE hiaJ iai Lain a
Ann I C',LLK
0 . 3 .3 2 2 .ai an .0 C 0c
z 4c -C 0
a.
- SO hi
Q'
-~Jin
xhi\ cOA
C.K4 E3z 5C
0 05
014
IC~( X -1ICI
-4-0 - M-55
A&C 0
-4- ----- 4 ii

Percent ofpassaeheight
0 1
0 3
12 Prs 4e uto
(b i 15eds~ tto xt
140
200
2 - ---

1. RePol No. NASA TP-2052 2. Government Accession No. 3. Recipient's Catalog No.
Corrected Copy AVRADCOM TR 81-C-28 -D /q / 395'7 o _____________
4. Title and Subtitle 5. Report Date
Detailed Flow Measurements in Casing Boundary Layer Januiary 1984of 429-Meter-Per-Second-Tip-Speed Two-Stage Fan 6. Performing Organization Code
505-32-227. Authour%) S. Performing Organization Report No.
E-219William T. Gorrell .WokUiN.
9. Performing Organization; Nane and Address 11.__ContractorGrantNo.Propulsion Laboratory1.Cotatr rnN.
AVRADCOM Research and Technology LaboratoriesLewis Research Center _____________
Cleveland, Ohio 44135 13. Type of Report and Period Covered
12. Sponsoring Agency Name and Address Technical PaperNational Aeronautics and Space Administration______________Washington, D.C. 20546 and 14. Sponsoring Agency CodeU.S. Army Aviation Research and Development CommandSt. Louis, Missouri 63166
15. Supplemetary Notes
16. Abetract
Detailed flow measurements between all blade rows were taken in the outer 30 per-cent of passage height of a two-stage fan. Tabulations of the detailed flow meas-urements are included. Results of these measurements revealed the steep axialvelocity profiles near the casing. The axial velocity profile near the casing atthe rotor exits was much steeper than at the stator exits. The data also showoverturning of the flow at the tip at the stator exits. The effect of mixing isshown by the redistribution of the first-stage rotor-exit total temperature pro-file as it passes through the following stator.
17. KW 111111011116 P uelle by DestuWtb11INutMM SWeMent
Turbomachinery Unclassified -unlimited
STAR Category 07
No. Iss of Viuu e pro la 8 Iuew, caWu IN im" "a of. Pam I IPOWUnclassified IUnclassified 32 jA03
eft mis by ft Naianm Taemw mtioma go~l o lnflt Virgni 3161
NASA-Laftley. IM6
.- =ItIL--. .16 !f

FIME