Embed Size (px)
Citation preview


Demographic Data
Group Study Cohort Control p
N 60 20
Age, Mean (years) 36.3 64.4 < 0.001
Age, Median (years) 33.2 64 < 0.001
Male 41 (68.4%) 4 (20%) 0.001
Female 19 (31.6%) 16 (80%) 0.001
Mechanism of Injury
Hemorrhagic Stroke 7 0 0.155
Motor Vehicle Collision 15 0 0.002
Fall 5 1 0.638
Gun Shot Wound 12 1 0.077
Anoxic Brain Injury 4 0 0.312
Assault 2 0 0.787
Ischemic Stroke 1 7 < 0.001
Ruptured Aneurysm 4 1 0.446
Meningitis 1 0 0.647
Pedestrian vs Auto 5 0 0.073
Motorcycle Collision 1 0 0.481
All-Terrain Vehicle Collision 1 0 0.481
Headache 0 9 < 0.001
Toxic Encephalopathy 0 1 0.394

0%
10%
20%
30%
40%
50%
60%
70%
80%
90%
100%
NMPT CTA
No Cerebral Blood Flow
0%
10%
20%
30%
40%
50%
60%
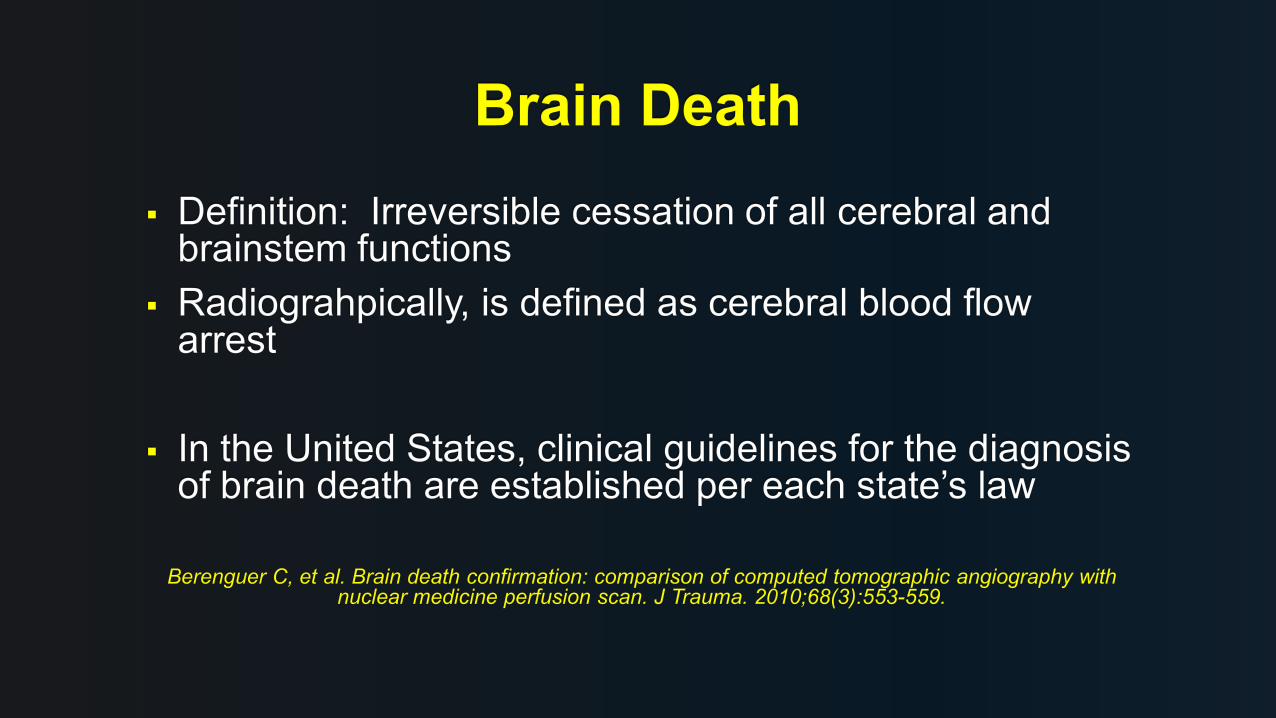
(-/-) Group (-/+) Group (+/+) Group

0%
10%
20%
30%
40%
50%
60%
(-/-) Group (-/+) Group (+/+) Group

0%
10%
20%
30%
40%
50%
60%
(-/-) Group (-/+) Group (+/+) Group

0%
10%
20%
30%
40%
50%
60%
(-/-) Group (-/+) Group (+/+) Group

0%
10%
20%
30%
40%
50%
60%
(-/-) Group (-/+) Group (+/+) Group
PERFUSION NO PERFUSION

Control Group +/+ Group
-/+ Group -/- Group

Control Group +/+ Group
-/+ Group -/- Group

Control Group +/+ Group
-/+ Group -/- Group

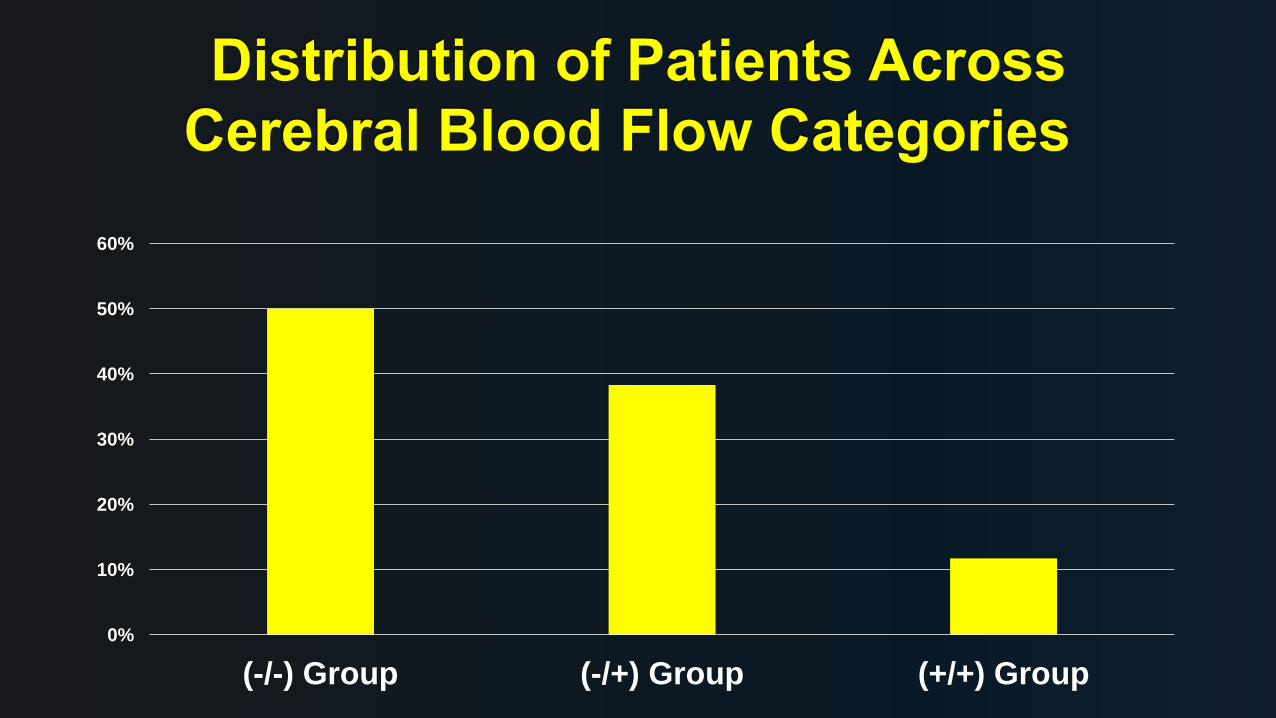
CTA Average Hounsfield Unit Readings
Group
n Minimum Maximum Mean SD p
M1 -/- 30 22.25 78.00 37.44 12.89 < 0.001
-/+ 23 36.80 131.25 64.73 20.86
+/+ 6 125.45 320.00 190.74 73.58
Control 20 233.40 1317.15 634.32 252.35
A1 -/- 30 21.25 94.75 36.80 14.07 < 0.001
-/+ 23 34.21 105.10 53.43 17.25
+/+ 6 84.20 245.00 171.66 55.52
Control 20 111.80 795.45 452.64 182.53
BA -/- 30 19.50 75.00 35.68 12.42 < 0.001
-/+ 23 17.20 78.70 39.74 15.46
+/+ 6 112.00 293.50 200.48 57.51
Control 20 189.40 924.80 540.67 193.62 NMPT: nuclear medicine perfusion test
M1: Horizontal segment of middle cerebral artery
A1: Precommunicating segment of anterior cerebral artery
BA: Basilar artery
CTA: computed tomographic angiography
-/-: intracranial circulatory arrest on NMPT and CTA
-/+: intracranial circulatory arrest on NMPT, intracranial perfusion on CTA
+/+: intracranial perfusion on both NMPT and CTA

Significant Differences Between Groups
Vessel Mean SD n Mean SD n p
-/- vs. -/+
M1 37.44 12.89 30 64.73 20.86 23 .002
A1 36.80 14.07 30 53.43 17.25 23 .025
BA 35.68 12.42 30 39.74 15.46 23 .778
-/- vs. +/+
M1 37.44 12.89 30 190.74 73.58 6 < 0.001
A1 36.80 14.07 30 171.66 55.52 6 < 0.001
BA 35.68 12.42 30 200.02 57.51 6 < 0.001
-/+ vs. +/+
M1 64.73 20.86 23 190.74 73.58 6 < 0.001
A1 53.43 17.25 23 171.66 55.52 6 < 0.001
BA 39.74 15.46 23 200.02 57.51 6 < 0.001
-/- vs. control
M1 37.44 12.89 30 634.32 252.35 20 < 0.001
A1 36.80 14.07 30 452.64 182.53 20 < 0.001
BA 35.68 12.42 30 540.67 193.62 20 < 0.001
-/+ vs. control
M1 64.73 20.86 23 634.32 252.35 20 < 0.001
A1 53.43 17.25 23 452.64 182.53 20 < 0.001
BA 39.74 15.46 23 540.67 193.62 20 < 0.001
+/+ vs. control
M1 190.74 73.58 6 634.32 252.35 20 < 0.001
A1 171.66 55.52 6 452.64 182.53 20 < 0.001
BA 200.02 57.51 6 540.67 193.62 20 < 0.001

CTA Average Hounsfield Unit Readings
Group
n Minimum Maximum Mean SD p
M1 -/- 30 22.25 78.00 37.44 12.89 < 0.001
-/+ 23 36.80 131.25 64.73 20.86
+/+ 6 125.45 320.00 190.74 73.58
Control 20 233.40 1317.15 634.32 252.35
A1 -/- 30 21.25 94.75 36.80 14.07 < 0.001
-/+ 23 34.21 105.10 53.43 17.25
+/+ 6 84.20 245.00 171.66 55.52
Control 20 111.80 795.45 452.64 182.53
BA -/- 30 19.50 75.00 35.68 12.42 < 0.001
-/+ 23 17.20 78.70 39.74 15.46
+/+ 6 112.00 293.50 200.48 57.51
Control 20 189.40 924.80 540.67 193.62 NMPT: nuclear medicine perfusion test
M1: Horizontal segment of middle cerebral artery
A1: Precommunicating segment of anterior cerebral artery
BA: Basilar artery
CTA: computed tomographic angiography
-/-: intracranial circulatory arrest on NMPT and CTA
-/+: intracranial circulatory arrest on NMPT, intracranial perfusion on CTA
+/+: intracranial perfusion on both NMPT and CTA
M1 A1 BA