Embed Size (px)
Citation preview
DEA Deutsche Erdoel AG
Group Management Report
and
Consolidated Financial Statements
Fiscal Year
1 January - 31 December 2016
Management Report of the DEA Group
as at 31 December 2016
1. Group structure and business
The DEA Group (DEA) is an international independent oil and gas company with full lifecycle capabilities
across exploration, development and production. Our primary mission is the secure, environmentally-
conscious and sustainable production of crude oil, natural gas and natural gas liquids. Our core produc-
tion and development assets are located in Germany, Norway, Denmark, Egypt and Algeria. Addition-
ally, we own large-scale underground natural gas storage facilities in Germany for storage of third-party
gas.
DEA is both operator and an active but non-operating partner in international joint ventures. We cover
the entire value chain from exploration to development and production of hydrocarbons. In addition to
its operations, DEA Deutsche Erdoel AG oversees the control and financing of activities of its subsidi-
aries. For purposes of internal management control within the DEA Group, production, EBITDAX and
liquidity are the key metrics used. Reporting to the shareholder is carried out by the following regions:
Germany/Denmark, Norway, North Africa (comprising Egypt and Algeria) and Other.
DEA Deutsche Erdoel AG (DEA AG), headquartered in Hamburg, is the parent company of the DEA
Group, comprising a total of 23 enterprises. DEA Deutsche Erdoel AG is a wholly owned subsidiary of
L1E Acquisitions GmbH, Hamburg which, via L1 Energy Capital Holdings S.A., Luxembourg, is a wholly
owned subsidiary of LetterOne Holdings S.A., Luxembourg. A domination and profit and loss transfer
agreement is in place between DEA Deutsche Erdoel AG and L1E Acquisitions GmbH.
Following a resolution adopted at the Annual General Meeting of 17 April 2015 and the entry in the
Commercial Register on 22 April 2015, DEA Deutsche Erdoel AG declared a short fiscal year for the
period from 1 April 2015 – 31 December 2015. Owing to the short fiscal year of the parent company,
financial statements were also prepared for the DEA Group for that short fiscal year. After 31 December
2015, the financial year once again corresponds to the calendar year. Since the current fiscal year com-
prises a 12-month period, a comparison with the 9-month period for the prior year is of limited value.
This report therefore focuses on the year-on-year comparison. The pro-forma figures for the consoli-
dated income statement as well as for the consolidated cash flow statement for the calendar year 2015
comprise the two short fiscal years 2015.
DEA Group will prepare consolidated financial statements as well as a group management report as at
31 December 2016 and will arrange for these to be disclosed in the German Government Gazette (Bun-
desanzeiger).
- 2 -
2. Strategy
Grow production and execute key projects
By focusing on proactive portfolio optimisation and utilising our strengths, we plan to continue to
strengthen and expand our presence in our core operating geographies, in particular in Northwestern
Europe. Our vision is to grow our daily production by safely and efficiently optimising the performance
of existing assets, successfully completing development projects, engaging in near-field exploration pro-
grams and undertaking strategic acquisitions in our core operating regions.
We have a diverse portfolio of producing Northwestern European assets located in OECD member
countries that are supported by established fiscal and regulatory regimes. We believe our position in
Northwestern Europe is underpinned by a long-standing business history in Germany and Norway. We
are committed to maintaining and strengthening our position in this region. We believe that our focus on
Northwestern Europe reduces our exposure to certain operational and geopolitical risks. Additionally,
we believe that focusing on this region enables us to benefit from significant synergies. We aim to further
expand our activities in this region through optimisation of production, future developments and near-
field exploration activities supplemented by strategic asset acquisitions. At the same time, we plan to
grow our production in North Africa through the completion of our West Nile Delta and Reggane Nord
development projects in Egypt and Algeria, respectively.
Increase value through balanced organic and inorganic growth
Regular portfolio management and enhancement are integral aspects of our exploration, development
and production strategy, through which we seek to realise value at an appropriate point in the lifecycle
of an asset. We continuously review macroeconomic, technical and competitive data with respect to our
exploration portfolio. Exploration is important to our operations and supports our plan to increase future
production. However, to complement our organic growth strategy, we also consider selective strategic
acquisitions of companies and/or interests in licences in our core and non-core operating regions as
well as other regions. As a result, we continue to monitor new opportunities for exploration and produc-
tion internationally.
Focus on costs and capital efficiency
We aim to maintain a conservative financial profile and strong balance sheet with ample liquidity. We
expect to fund exploration and development activities from a combination of cash flows from operating
activities, proceeds from debt issuances, and potentially through the proceeds of any portfolio manage-
ment activities, such as farm-downs or sales. Our financial policy is to target net debt / EBITDAX of
2.0 – 2.5x at the mid-point of the cycle. We intend to maintain a conservative approach to acquisitions;
potential future acquisitions need to satisfy this policy.
- 3 -
We also seek to monetise certain assets through divestments or farm-downs. This enables us to mon-
etise value early in the lifecycle of an asset and de-risk our interests by reducing our exposure to an
asset and associated development and other expenditures.
Continue to deliver high Quality, Health, Safety and Environment (QHSE) standards and sustainability
of operations
We are committed to sustainable business development. We continue to focus on maintaining high
safety and operational standards, which we believe are a prerequisite to doing business in our markets.
We are focused on continuing to strengthen our customer relationships, and aim to become the partner
of choice based on our technical and commercial excellence, environmental consciousness and sus-
tainable business development.
- 4 -
3. Economic fundamentals and climate
Economic environment
According to current forecasts of the International Monetary Fund, global economic output in 2016 in-
creased by approx. 3.1 % and will be slightly below the previous year’s figure of approx. 3.2 %. This is
essentially due to unexpected political and economic events such as “Brexit” as well as lower economic
growth in the threshold and emerging market countries. For the euro area, Gross Domestic Product is
currently expected to rise by 1.7 %, compared to 2.0 % in 2015.
Crude oil prices
After approximately four years of averaging around USD 100 per barrel, crude oil prices have fallen
significantly since 2014, reflecting strong production growth in the United States, increases in global
supply elsewhere and weaker global demand. The price decline continued in early 2016 due to ongoing
expectations of a market surplus, but subsequently recovered due to forecasts of growing oil demand
and production outages in Canada, Nigeria and Libya. Prices increased further after OPEC and some
non-OPEC countries like Russia agreed to cut oil production. At the beginning of December, prices
increased to more than 50 USD per barrel after the final OPEC decision to reduce its oil production by
1.3 million barrels per day, effective as of January 2017. This decision marked the first reduction in oil
production since 2008. Later in December, several non-OPEC countries (like Russia) agreed to a further
output cut of about 0.55 million barrels per day.
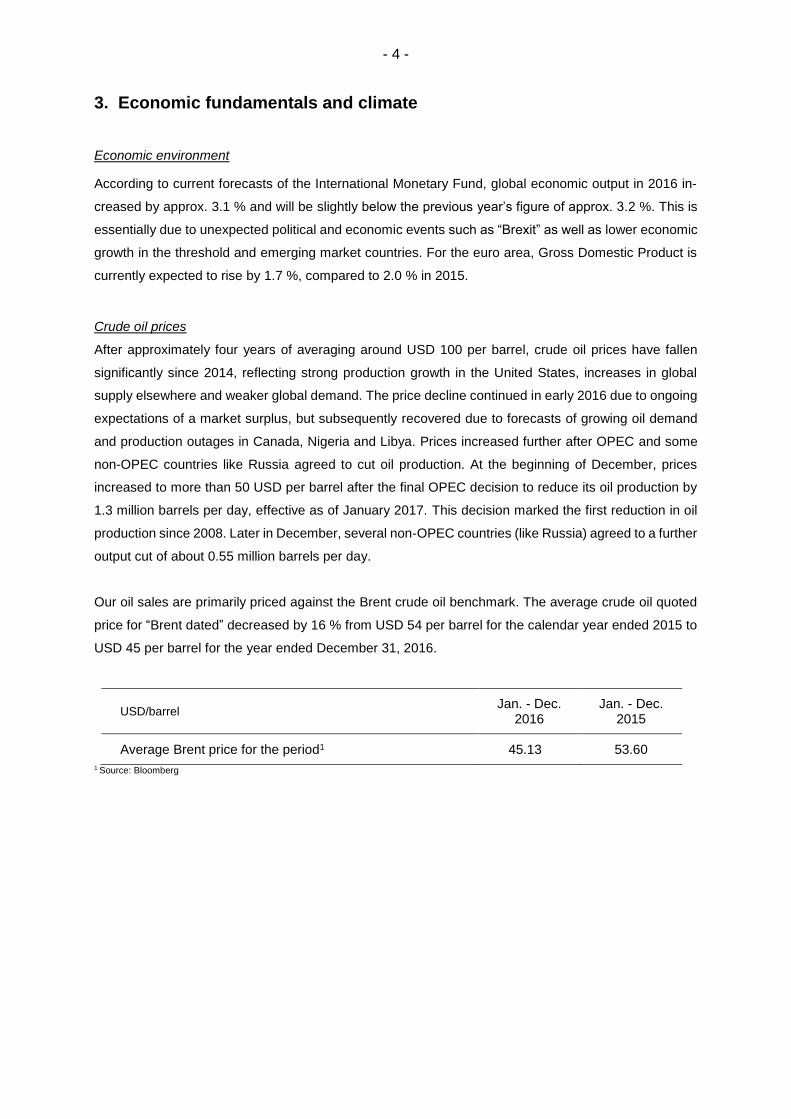
Our oil sales are primarily priced against the Brent crude oil benchmark. The average crude oil quoted
price for “Brent dated” decreased by 16 % from USD 54 per barrel for the calendar year ended 2015 to
USD 45 per barrel for the year ended December 31, 2016.
USD/barrel Jan. - Dec.
2016 Jan. - Dec.
2015
Average Brent price for the period1 45.13 53.60
1 Source: Bloomberg
- 5 -
Gas prices
On the back of falling crude oil prices, the traded UK NBP gas price has also come down from its level
over the past few years of around 25 EUR/MWh to just below 15 EUR/MWh. Most of that decline hap-
pened over the course of 2015, reflecting a certain time lag in the indexation of gas prices to oil product
prices in European long-term import contracts. However, gas prices have seen a recovery in the second
half of 2016, reaching almost 20 EUR/MWh towards year end. Some of the reasons for this rally include
a price recovery in the coal market following coal market consolidation, and an unplanned shutdown of
French nuclear power generation.
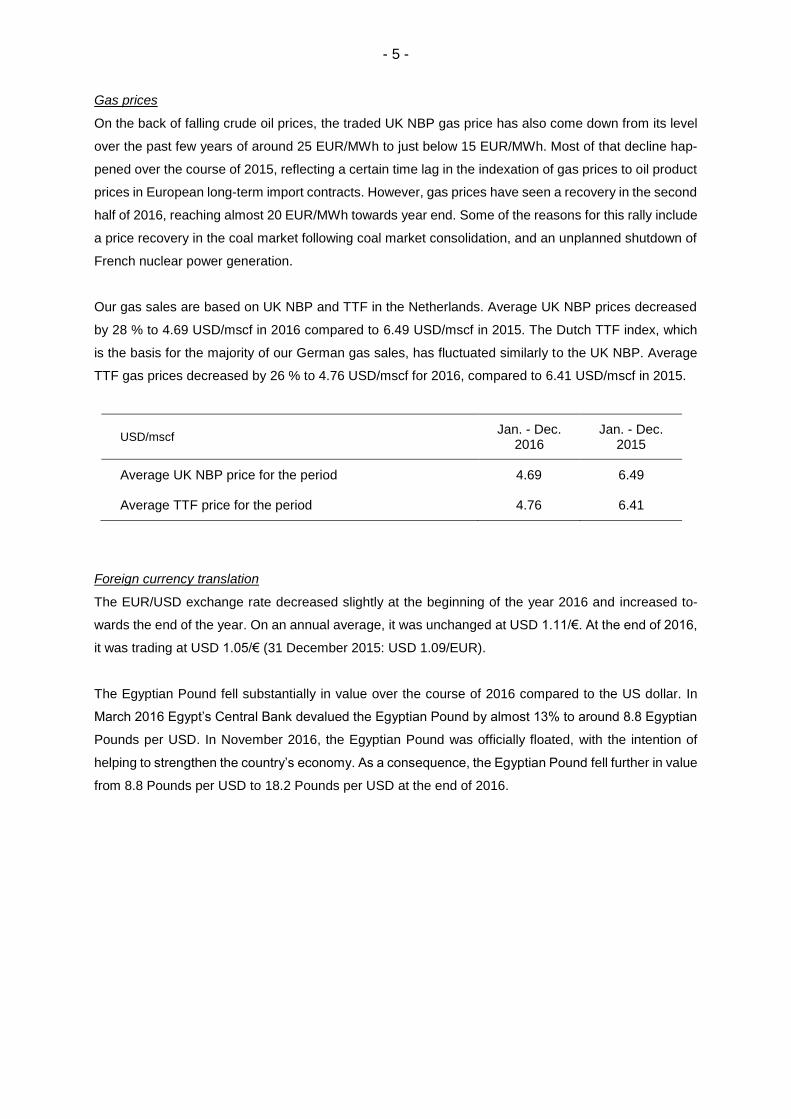
Our gas sales are based on UK NBP and TTF in the Netherlands. Average UK NBP prices decreased
by 28 % to 4.69 USD/mscf in 2016 compared to 6.49 USD/mscf in 2015. The Dutch TTF index, which
is the basis for the majority of our German gas sales, has fluctuated similarly to the UK NBP. Average
TTF gas prices decreased by 26 % to 4.76 USD/mscf for 2016, compared to 6.41 USD/mscf in 2015.
USD/mscf Jan. - Dec.
2016 Jan. - Dec.
2015
Average UK NBP price for the period 4.69 6.49
Average TTF price for the period 4.76 6.41
Foreign currency translation
The EUR/USD exchange rate decreased slightly at the beginning of the year 2016 and increased to-
wards the end of the year. On an annual average, it was unchanged at USD 1.11/€. At the end of 2016,
it was trading at USD 1.05/€ (31 December 2015: USD 1.09/EUR).
The Egyptian Pound fell substantially in value over the course of 2016 compared to the US dollar. In
March 2016 Egypt’s Central Bank devalued the Egyptian Pound by almost 13% to around 8.8 Egyptian
Pounds per USD. In November 2016, the Egyptian Pound was officially floated, with the intention of
helping to strengthen the country’s economy. As a consequence, the Egyptian Pound fell further in value
from 8.8 Pounds per USD to 18.2 Pounds per USD at the end of 2016.
- 6 -
4. Profitability and business performance
Production
Natural gas (million scf/day)
Jan. - Dec.
2016
Jan. - Dec.
2015
Germany/Denmark 148 161
Norway 167 53
North Africa 153 179
468 393
Crude oil (kbbl OE/day) Jan. - Dec.
2016
Jan. - Dec.
2015
Germany/Denmark 15 15
Norway 35 22
North Africa 11 12
61 49
Total production (kbbl OE/day) Jan. - Dec.
2016
Jan. - Dec.
2015
Germany/Denmark 39 42
Norway 63 31
North Africa 36 42
138 115
Production is shown per day and on a working interest basis.
Scf – standard cubic feet
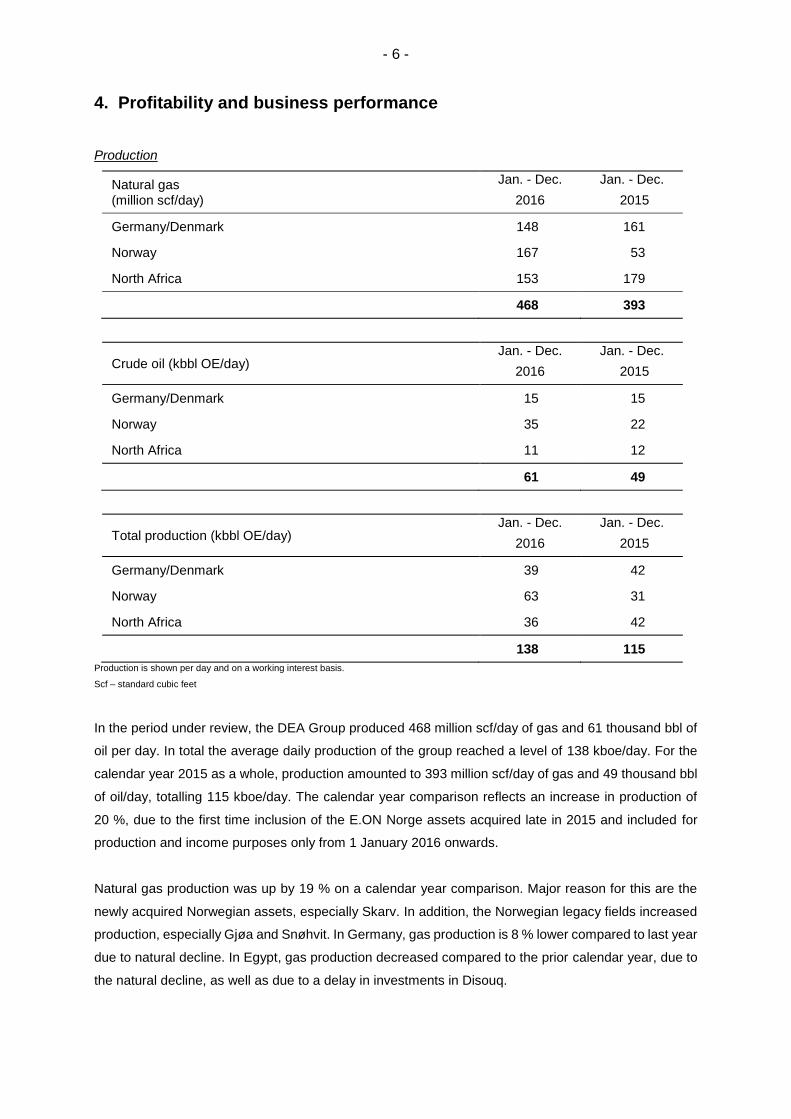
In the period under review, the DEA Group produced 468 million scf/day of gas and 61 thousand bbl of
oil per day. In total the average daily production of the group reached a level of 138 kboe/day. For the
calendar year 2015 as a whole, production amounted to 393 million scf/day of gas and 49 thousand bbl
of oil/day, totalling 115 kboe/day. The calendar year comparison reflects an increase in production of
20 %, due to the first time inclusion of the E.ON Norge assets acquired late in 2015 and included for
production and income purposes only from 1 January 2016 onwards.
Natural gas production was up by 19 % on a calendar year comparison. Major reason for this are the
newly acquired Norwegian assets, especially Skarv. In addition, the Norwegian legacy fields increased
production, especially Gjøa and Snøhvit. In Germany, gas production is 8 % lower compared to last year
due to natural decline. In Egypt, gas production decreased compared to the prior calendar year, due to
the natural decline, as well as due to a delay in investments in Disouq.
- 7 -
In crude oil production, we recorded a 24 % increase in 2016 in relation to the calendar year 2015 due
to the addition of the newly acquired Norwegian assets as well as higher oil production in Denmark due
to improved uptime of the facilities and an additional well. In Germany we could compensate the natural
decline and maintain a stable production due to the continuous drilling mode. Oil production in the Gulf
of Suez in Egypt is down owing to the natural production decline.
Results of operations
Consolidated income Statement of the DEA Group
€ m Jan. - Dec.
2016 Apr. - Dec.
2015 Jan. - Dec.
2015
Sales and other operating revenues 1,483 1,115 1,449
Cost of sales -1,101 -673 -847
Gross profit 382 442 602
Exploration costs -119 -119 -206
General and administration expenses -149 -123 -171
Net impairment of assets -70 -229 -538
Operating Result 44 -29 -313
Financial income 129 64 120
Financial expenses -224 -161 -213
Result from continuing operations be-fore taxes
-51 -126 -406
Income taxes 18 -27 -10
Result from continuing operations -33 -153 -416
Result from discontinued operations -3 -241 -235
Net result -36 -394 -651
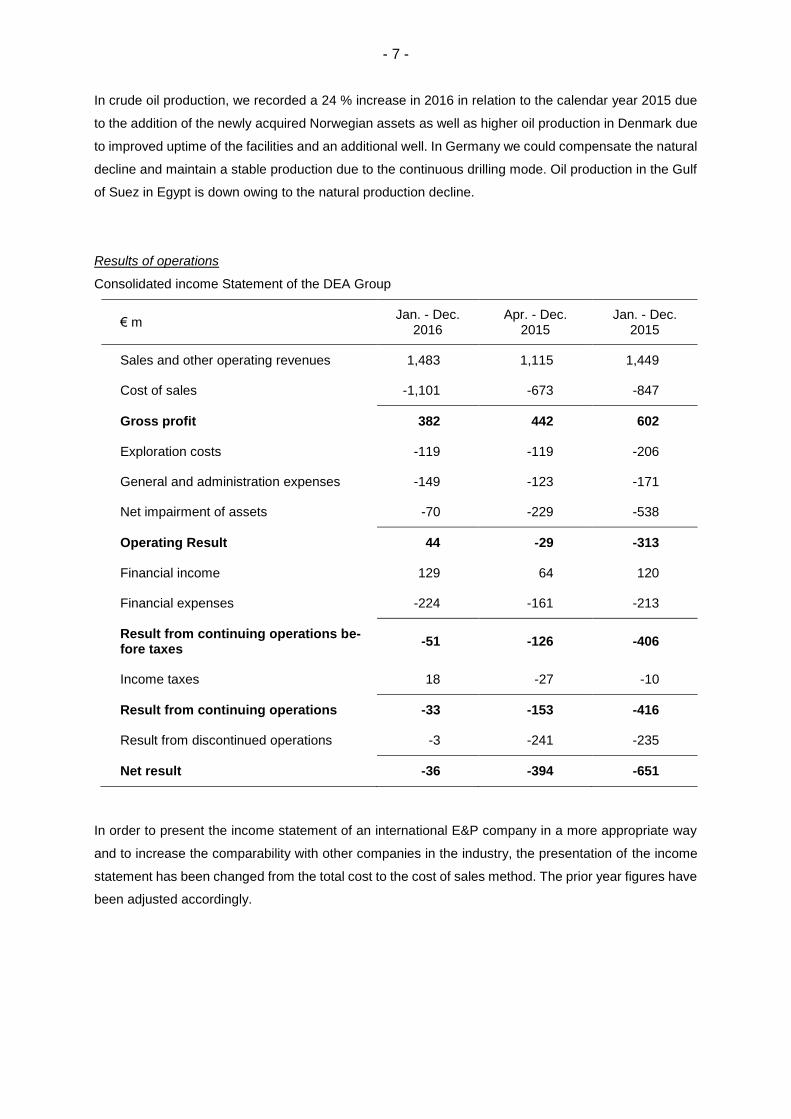
In order to present the income statement of an international E&P company in a more appropriate way
and to increase the comparability with other companies in the industry, the presentation of the income
statement has been changed from the total cost to the cost of sales method. The prior year figures have
been adjusted accordingly.
- 8 -
Jan. - Dec.
2016 Jan. - Dec.
2015
Average realised oil price including oil hedge result (in USD/bbl)
42.20 60.27
Average realised oil price excluding oil hedge result (in USD/bbl)
39.79 48.44
Germany/Denmark 38.60 46.04
Norway 41.16 50.82
North Africa 34.17 46.08
Average realised gas price (in USD/mscf) 4.96 5.80
Germany/Denmark 5.25 6.50
Norway 5.89 5.80
North Africa 2.67 2.80
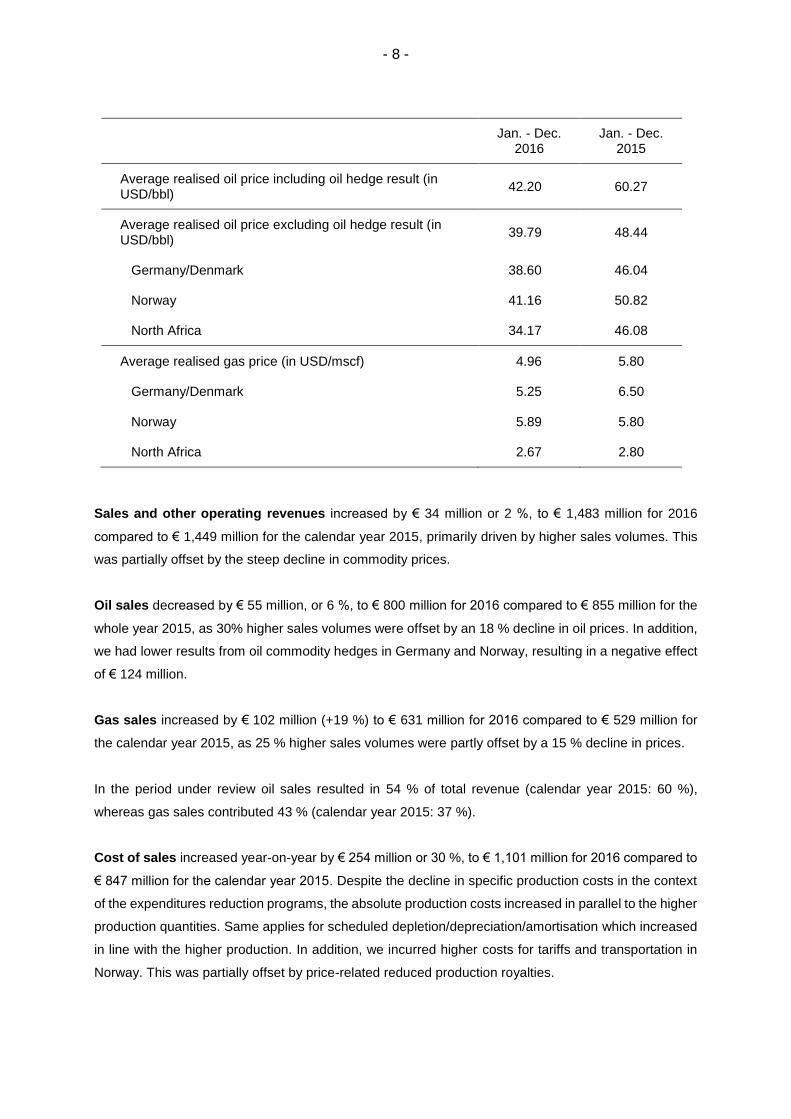
Sales and other operating revenues increased by € 34 million or 2 %, to € 1,483 million for 2016
compared to € 1,449 million for the calendar year 2015, primarily driven by higher sales volumes. This
was partially offset by the steep decline in commodity prices.
Oil sales decreased by € 55 million, or 6 %, to € 800 million for 2016 compared to € 855 million for the
whole year 2015, as 30% higher sales volumes were offset by an 18 % decline in oil prices. In addition,
we had lower results from oil commodity hedges in Germany and Norway, resulting in a negative effect
of € 124 million.
Gas sales increased by € 102 million (+19 %) to € 631 million for 2016 compared to € 529 million for
the calendar year 2015, as 25 % higher sales volumes were partly offset by a 15 % decline in prices.
In the period under review oil sales resulted in 54 % of total revenue (calendar year 2015: 60 %),
whereas gas sales contributed 43 % (calendar year 2015: 37 %).
Cost of sales increased year-on-year by € 254 million or 30 %, to € 1,101 million for 2016 compared to
€ 847 million for the calendar year 2015. Despite the decline in specific production costs in the context
of the expenditures reduction programs, the absolute production costs increased in parallel to the higher
production quantities. Same applies for scheduled depletion/depreciation/amortisation which increased
in line with the higher production. In addition, we incurred higher costs for tariffs and transportation in
Norway. This was partially offset by price-related reduced production royalties.
- 9 -
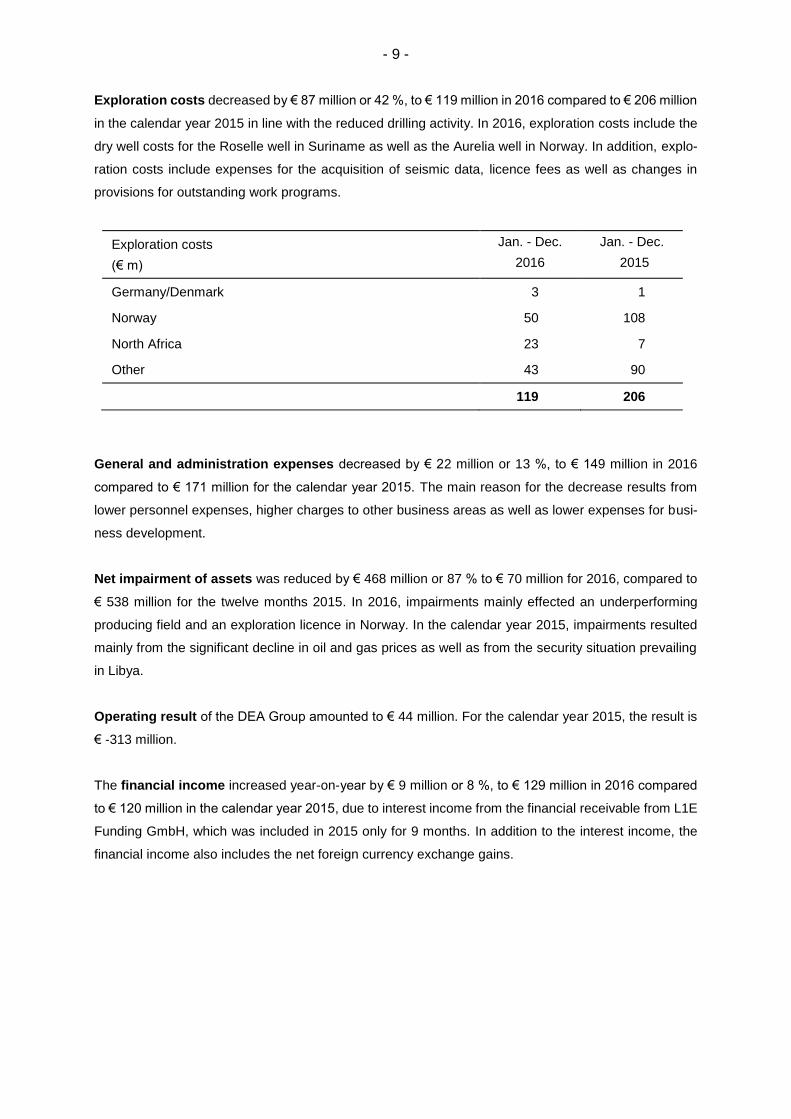
Exploration costs decreased by € 87 million or 42 %, to € 119 million in 2016 compared to € 206 million
in the calendar year 2015 in line with the reduced drilling activity. In 2016, exploration costs include the
dry well costs for the Roselle well in Suriname as well as the Aurelia well in Norway. In addition, explo-
ration costs include expenses for the acquisition of seismic data, licence fees as well as changes in
provisions for outstanding work programs.
Exploration costs
(€ m)
Jan. - Dec.
2016
Jan. - Dec.
2015
Germany/Denmark 3 1
Norway 50 108
North Africa 23 7
Other 43 90
119 206
General and administration expenses decreased by € 22 million or 13 %, to € 149 million in 2016
compared to € 171 million for the calendar year 2015. The main reason for the decrease results from
lower personnel expenses, higher charges to other business areas as well as lower expenses for busi-
ness development.
Net impairment of assets was reduced by € 468 million or 87 % to € 70 million for 2016, compared to
€ 538 million for the twelve months 2015. In 2016, impairments mainly effected an underperforming
producing field and an exploration licence in Norway. In the calendar year 2015, impairments resulted
mainly from the significant decline in oil and gas prices as well as from the security situation prevailing
in Libya.
Operating result of the DEA Group amounted to € 44 million. For the calendar year 2015, the result is
€ -313 million.
The financial income increased year-on-year by € 9 million or 8 %, to € 129 million in 2016 compared
to € 120 million in the calendar year 2015, due to interest income from the financial receivable from L1E
Funding GmbH, which was included in 2015 only for 9 months. In addition to the interest income, the
financial income also includes the net foreign currency exchange gains.
- 10 -
The financial expenses increased € 11 million (+5 %) to € 224 million in 2016 compared to € 213 million
in the calendar year 2015. Interest expenses for the RBL facility as well as for the shareholder loans
increased, since they were included in the prior calendar year only for 9 and 10 months, respectively. In
addition, interest expenses increased in line with a higher LIBOR. In addition to the interest expenses,
the financial expenses also include the net losses from financial derivatives as well as for the calendar
year 2015 the net foreign currency exchange losses.
Result from continuing operations before taxes amounted to € -51 million in 2016, and to € -406
million for the full calendar year 2015. In the reporting period, DEA had in a total tax income of € 18
million. Current income tax expense, resulting from the fact that various expenses are not tax deductible,
was compensated by deferred tax income, due to temporary differences mainly in Norway. In 2016, tax
rate was 35 %.
Result from continuing operations amounted to € -33 million.
Result from discontinued operations for 2016 comprises adjustments in regard to the sale of our
British activities. In 2015, it included the complete result of the British activities sold. In addition to the
operating result, this also comprised necessary impairments due to the sales price, the costs of the sale
as well as deconsolidation effects.
Net result came to € -36 million, considerably better than the value for the calendar year 2015.
All in all, the DEA Group is in an environment of continuously low oil and gas prices, which imposed a
substantial burden on results despite rising production volumes in the reporting period.
EBITDAX
EBITDAX is the factor used for internal management control purposes within the DEA Group. As a key
ratio of the income statement it is determined as earnings before interest, taxes, depletion/deprecia-
tion/amortisation and exploration expenditure for the last 12 months; in addition, adjustments are made
for realised and unrealised gains/losses arising from derivatives and exchange rate fluctuations as well
as non-recurring effects.
In 2016, EBITDAX amounted to € 776 million, down by € 52 million compared to the calendar year 2015.
Revenues increased only slightly due the offsetting effects of higher sales volumes and significantly
lower commodity prices. Despite the decline in specific production costs in the context of the expendi-
tures reduction programs, the absolute production costs increased in parallel to the higher production
quantities. In addition, we incurred higher costs for tariffs and transportation in Norway. This was partially
offset by price-related reduced production royalties.
- 11 -
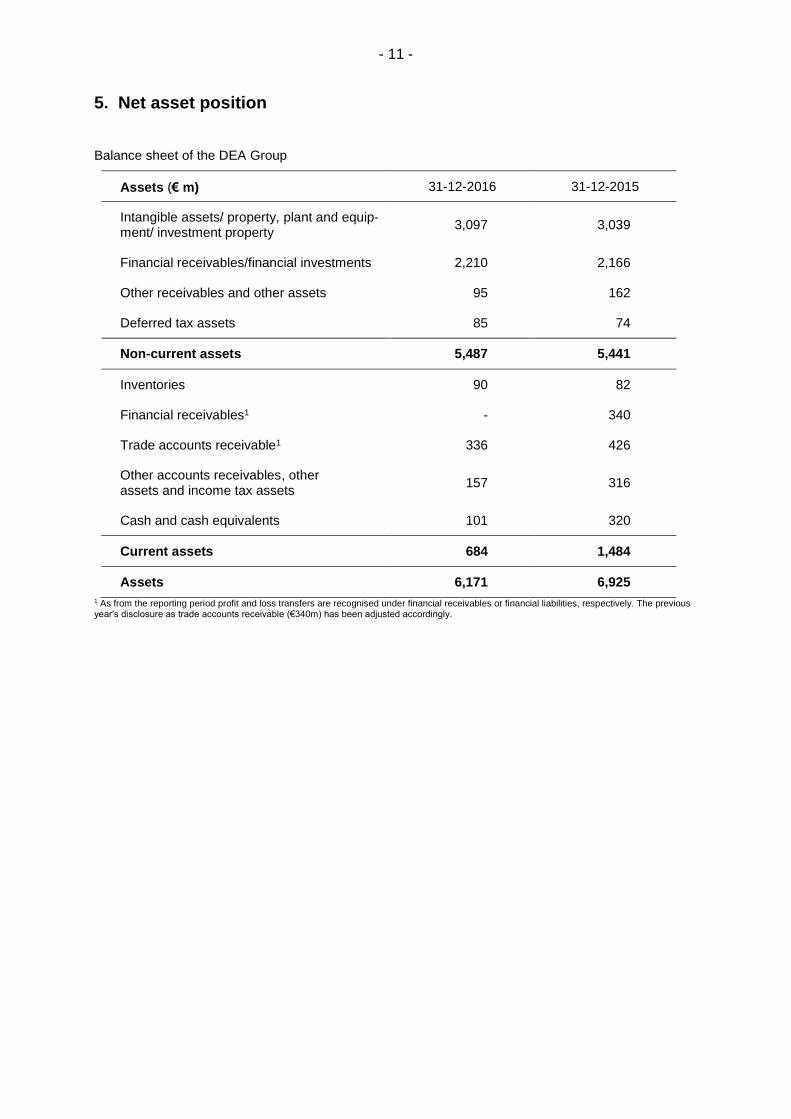
5. Net asset position
Balance sheet of the DEA Group
Assets (€ m) 31-12-2016 31-12-2015
Intangible assets/ property, plant and equip-ment/ investment property
3,097 3,039
Financial receivables/financial investments 2,210 2,166
Other receivables and other assets 95 162
Deferred tax assets 85 74
Non-current assets 5,487 5,441
Inventories 90 82
Financial receivables1 - 340
Trade accounts receivable1 336 426
Other accounts receivables, other assets and income tax assets
157 316
Cash and cash equivalents 101 320
Current assets 684 1,484
Assets 6,171 6,925
1 As from the reporting period profit and loss transfers are recognised under financial receivables or financial liabilities, respectively. The previous year's disclosure as trade accounts receivable (€340m) has been adjusted accordingly.
- 12 -
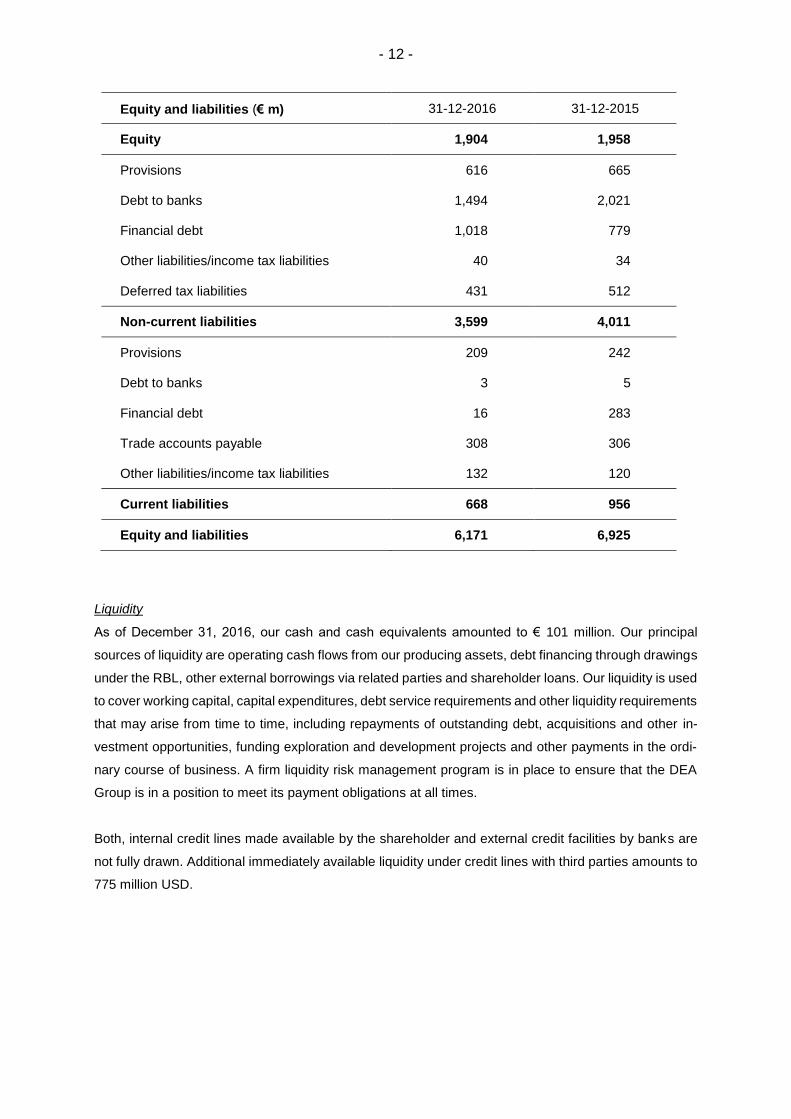
Equity and liabilities (€ m) 31-12-2016 31-12-2015
Equity 1,904 1,958
Provisions 616 665
Debt to banks 1,494 2,021
Financial debt 1,018 779
Other liabilities/income tax liabilities 40 34
Deferred tax liabilities 431 512
Non-current liabilities 3,599 4,011
Provisions 209 242
Debt to banks 3 5
Financial debt 16 283
Trade accounts payable 308 306
Other liabilities/income tax liabilities 132 120
Current liabilities 668 956
Equity and liabilities 6,171 6,925
Liquidity
As of December 31, 2016, our cash and cash equivalents amounted to € 101 million. Our principal
sources of liquidity are operating cash flows from our producing assets, debt financing through drawings
under the RBL, other external borrowings via related parties and shareholder loans. Our liquidity is used
to cover working capital, capital expenditures, debt service requirements and other liquidity requirements
that may arise from time to time, including repayments of outstanding debt, acquisitions and other in-
vestment opportunities, funding exploration and development projects and other payments in the ordi-
nary course of business. A firm liquidity risk management program is in place to ensure that the DEA
Group is in a position to meet its payment obligations at all times.
Both, internal credit lines made available by the shareholder and external credit facilities by banks are
not fully drawn. Additional immediately available liquidity under credit lines with third parties amounts to
775 million USD.
- 13 -
Effective as of 2 April 2015, DEA Deutsche Erdoel AG and various subsidiaries became parties to an
existing loan agreement for up to USD 2.3 billion between L1E Funding GmbH and a syndicate of banks
(reserve-based lending or RBL facility). Under this loan agreement, DEA has the option to borrow addi-
tional external resources for Group funding purposes as long as the credit facility is collateralised by
productive assets.
In October 2016 DEA Finance SA, a related party to DEA Deutsche Erdoel AG, issued Senior unsecured
Notes with a principal amount of € 400 million and a term until 2022. DEA AG and its major subsidiaries
became guarantors of the notes. The proceeds of the notes were onlent to DEA Norge AS with the same
maturity.
Additionally, DEA has a USD 50 million working capital facility for intra-month cash management pur-
poses that remains undrawn.
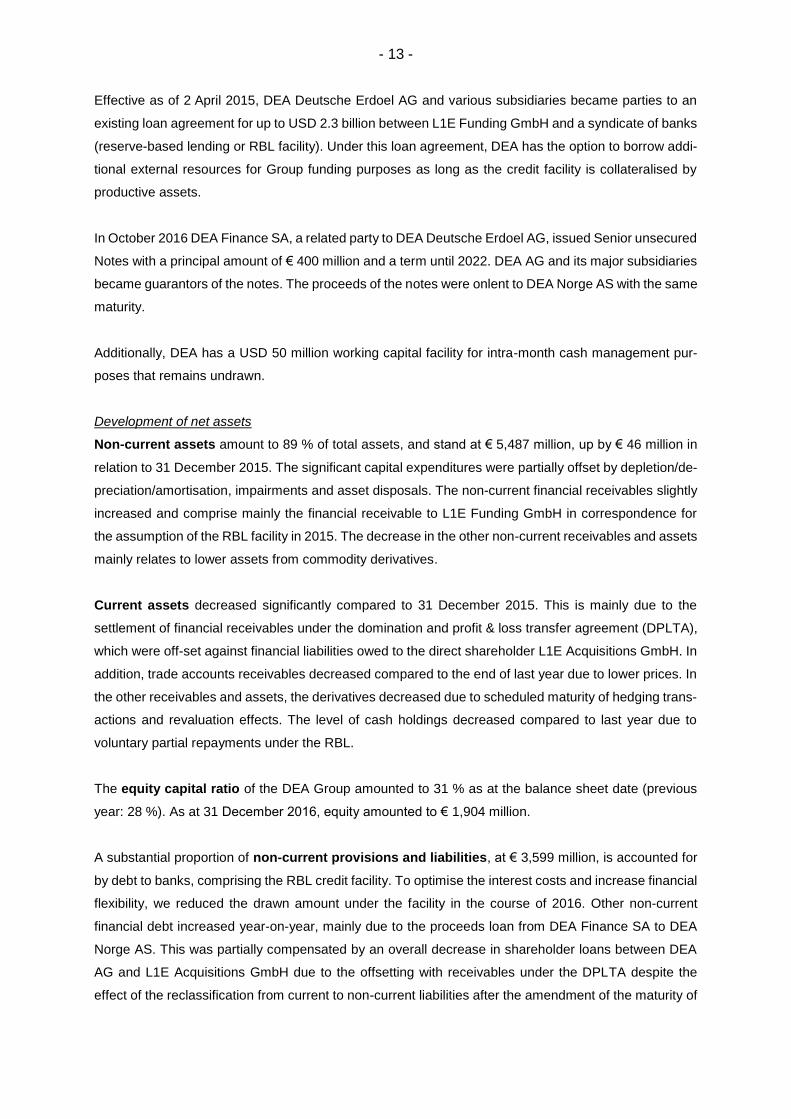
Development of net assets
Non-current assets amount to 89 % of total assets, and stand at € 5,487 million, up by € 46 million in
relation to 31 December 2015. The significant capital expenditures were partially offset by depletion/de-
preciation/amortisation, impairments and asset disposals. The non-current financial receivables slightly
increased and comprise mainly the financial receivable to L1E Funding GmbH in correspondence for
the assumption of the RBL facility in 2015. The decrease in the other non-current receivables and assets
mainly relates to lower assets from commodity derivatives.
Current assets decreased significantly compared to 31 December 2015. This is mainly due to the
settlement of financial receivables under the domination and profit & loss transfer agreement (DPLTA),
which were off-set against financial liabilities owed to the direct shareholder L1E Acquisitions GmbH. In
addition, trade accounts receivables decreased compared to the end of last year due to lower prices. In
the other receivables and assets, the derivatives decreased due to scheduled maturity of hedging trans-
actions and revaluation effects. The level of cash holdings decreased compared to last year due to
voluntary partial repayments under the RBL.
The equity capital ratio of the DEA Group amounted to 31 % as at the balance sheet date (previous
year: 28 %). As at 31 December 2016, equity amounted to € 1,904 million.
A substantial proportion of non-current provisions and liabilities, at € 3,599 million, is accounted for
by debt to banks, comprising the RBL credit facility. To optimise the interest costs and increase financial
flexibility, we reduced the drawn amount under the facility in the course of 2016. Other non-current
financial debt increased year-on-year, mainly due to the proceeds loan from DEA Finance SA to DEA
Norge AS. This was partially compensated by an overall decrease in shareholder loans between DEA
AG and L1E Acquisitions GmbH due to the offsetting with receivables under the DPLTA despite the
effect of the reclassification from current to non-current liabilities after the amendment of the maturity of
- 14 -
the shareholder loans. In addition, € 616 million is accounted for by pension provisions and decommis-
sioning provisions, as well as other provisions. On the whole, the extent of provisions decreased, espe-
cially for decommissioning, owing to the higher interest rate year-on-year. On the contrary, pension
provisions increased due the decrease of the applicable interest rate. The decrease in deferred tax
liabilities is the result of a higher netting with deferred tax assets.
Current provisions and liabilities are down by € 288 million or 30 % year-on-year, essentially due to
the reclassification of shareholder loans. In addition, other provisions slightly decreased year-on-year
due to lower provisions related to personnel and outstanding work programs.
- 15 -
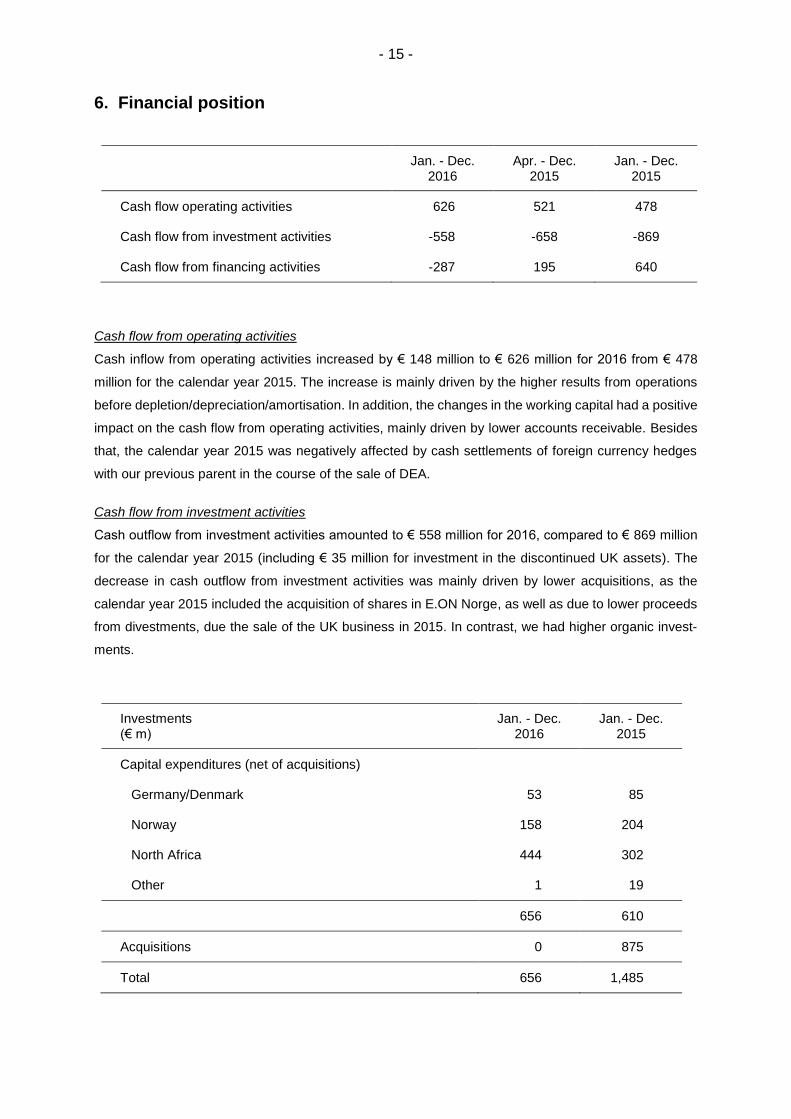
6. Financial position
Jan. - Dec.
2016 Apr. - Dec.
2015 Jan. - Dec.
2015
Cash flow operating activities 626 521 478
Cash flow from investment activities -558 -658 -869
Cash flow from financing activities -287 195 640
Cash flow from operating activities
Cash inflow from operating activities increased by € 148 million to € 626 million for 2016 from € 478
million for the calendar year 2015. The increase is mainly driven by the higher results from operations
before depletion/depreciation/amortisation. In addition, the changes in the working capital had a positive
impact on the cash flow from operating activities, mainly driven by lower accounts receivable. Besides
that, the calendar year 2015 was negatively affected by cash settlements of foreign currency hedges
with our previous parent in the course of the sale of DEA.
Cash flow from investment activities
Cash outflow from investment activities amounted to € 558 million for 2016, compared to € 869 million
for the calendar year 2015 (including € 35 million for investment in the discontinued UK assets). The
decrease in cash outflow from investment activities was mainly driven by lower acquisitions, as the
calendar year 2015 included the acquisition of shares in E.ON Norge, as well as due to lower proceeds
from divestments, due the sale of the UK business in 2015. In contrast, we had higher organic invest-
ments.
Investments (€ m)
Jan. - Dec. 2016
Jan. - Dec. 2015
Capital expenditures (net of acquisitions)
Germany/Denmark 53 85
Norway 158 204
North Africa 444 302
Other 1 19
656 610
Acquisitions 0 875
Total 656 1,485
- 16 -
Our expenditures for tangible and intangible assets increased year-on-year by 8 %, due to the capex for
our current development projects in the Egyptian West Nile Delta and Reggane in Algeria. In total, our
capital expenditures (excluding acquisitions) reached € 656 million. In addition to the spendings for the
development projects, key capex investments were made in existing producing fields in Germany and
Norway.
Cash flow from financing activities
Cash flow from financing activities amounted to € -287 million, compared to a cash flow of € +640 million
in the twelve months 2015. Cash flow from financing activities in the reporting period mostly reflects
outflow from the net repayment of the RBL and of shareholder loans, partly compensated by the cash
inflow from the proceeds loan from DEA Finance SA. The cash inflow from financing activities in 2015
resulted from additional shareholder loans in the amount of € 643 million.
- 17 -
7. Employees
The average number of employees of the DEA Group decreased from 1,433 (Ø 1 April – 31 December
2015) by 95, to 1,338 (Ø 1 January – 31 December 2016) full-time equivalents (FTEs). The main driver
for the reduction are the various measures for cost reduction and efficiency improvement on all DEA
sites. The average number of employees at the German companies decreased by approx. 6 %. In Nor-
way the number of employees started to decrease after the merger of the two Norwegian companies by
43 FTE. The number of employees in Egypt on 31 December 2016 declined by 49 FTE. In Libya the
workforce was reduced by about 3 employees, in Turkmenistan by 9 employees.
On 31 December 2016, DEA Deutsche Erdoel AG had 17 apprentices and trainees; as at 31 December
2015 there were 19. As a supplementary strategy, within the scope of a training sponsorship program
DEA supports 7 trainees engaged in small to medium-scale enterprises.
A key factor in achieving success internationally is the quality of staff, both locally and on an international
scale. Despite the restructuring programs, DEA still sends expatriates to other countries and brings also
employees of the foreign companies to work in Hamburg and at other locations. On 31 December 2016,
2 impatriates from other countries worked in Germany, 1 was employed in Turkmenistan, 7 in Norway
and 18 in Egypt. We meanwhile have 149 employees on an international scale that do not have the
nationality of the countries in which they work. This represents a share of over 11 %. This enables us to
achieve a better understanding amongst our employees of foreign cultures in general, and of special
aspects pertaining to the different locations in which we operate.
Effective as of 1 February 2016, DEA Deutsche Erdoel AG and the IG Bergbau, Chemie, Energie (the
German trade union for employees in the mining, chemical and energy industries) had entered into a
new Company Collective Agreement with a minimum term until 31 January 2017. An essential element
of the Collective Agreement was a freeze in collective wages and salaries and in trainee remuneration.
Nevertheless, it was agreed to grant each full time employee an one-off payment of gross € 400.
Through our employer-funded company pension scheme, we make a contribution to our employees’
retirement provision and support them in the event of invalidity or bereavement. Our company pension
scheme provides for a personal pension to be paid to each employee of DEA Deutsche Erdoel AG once
the waiting period has elapsed. The extent of this company pension depends on the years of service
and remuneration paid. In supplementation of the employer-funded pension scheme, our employees
also have the option of providing for retirement themselves by means of a remuneration conversion,
thus additionally securing their standard of living after retirement. At DEA Deutsche Erdoel AG, employ-
ees have a choice of investing components of their gross remuneration in pension insurance funds,
pension funds, direct life insurance and direct commitments. Our employees also benefit from pension
plans in a number of our foreign companies.
- 18 -
Declaration of corporate governance according to § 289a HGB
In accordance with the [German] Act for equal treatment of women and men in leadership positions in
the private sector and the civil service (Gesetz für die gleichberechtigte Teilhabe von Frauen und Män-
nern an Führungspositionen in der Privatwirtschaft und im öffentlichen Dienst) the Supervisory Board of
DEA AG adopted a resolution in 2015 to establish a target quota of 0 % for women on the Company’s
Supervisory Board and also 0 % for women on the Board of Management for the first performance period
defined pursuant to this Act, i.e. up to 30 June 2017. These quotas correspond to the then current quota
of women in the two management bodies.
The Board of Management has defined a target quota of 5 % for the first managerial level below the
Board of Management and a target quota of 16 % for the second managerial level. This corresponds to
the current quota of women at these managerial levels at the time of defining these targets. These
quotas are planned to be met by 30 June 2017.
- 19 -
8. Risk management
Risk management system
Overall responsibility for the group wide risk management system sits with the Board of Management of
DEA Deutsche Erdoel AG. It establishes the rules and minimum standards and determines how much
risk the company is willing to take. Our Risk Committee is in charge of monitoring and refining the risk
management system. It is composed of the full Board of Management of DEA Deutsche Erdoel AG, the
managing directors of the operating subsidiaries and the heads of the following departments of DEA AG
which are accountable for the entire group: Treasury, Controlling, Accounting/Tax, Audit, QHSSE and
Commercial Development & Infrastructure. The Treasury Department bears responsibility for the con-
trol, steering and co-ordination of the risk management system. This department regularly reports on
the Group’s risk situation to both the Risk Committee and the Audit Committee of the Supervisory Board
of DEA Deutsche Erdoel AG.
It is our business policy to make optimum use of opportunities and contain risks at the same time. All
risks and opportunities are monitored and controlled by means of a risk management system in place
throughout the Group. It is supported by a documented risk management system and gives appropriate
consideration to the risk aspect in all decisions and business processes of DEA through ongoing early
identification, standardised recording, assessment, control, and monitoring. We gain an overview of our
opportunities and risks once every three months by performing a bottom-up analysis. The executive and
supervisory bodies are updated on the risk exposure within the scope of the quarterly reporting. The
term “risk” is defined in a way to ensure that the long-term strategic objectives are attained and to pro-
duce an adequate depiction of the entire risk portfolio. The risks and the key figures and ratios for risk
measurement are aligned with the control parameters of the DEA Group. We analyse the material indi-
vidual risks of the Group using a matrix in which the risks’ probability of occurrence and potential net
damage are represented. We can derive from this whether there is need for action and the scope of
such action. Actions in place are as well reported and evaluated in this process as possible future actions
to mitigate the risk. We assess risks based on how they affect our EBITDAX/equity and/or how they
impact our liquidity.
Commodity price risks and opportunities
As an upstream enterprise, we are exposed to the risks but also stand to benefit from the opportunities
arising from the level of oil and gas prices on the international markets. These are constantly analysed,
quantified and reported on a regular basis. As part of our mid-term planning, we also calculated the
sensitivities of commodity price. A change in the oil price by USD -10/bbl would have an influence of
approx. € -124 million on EBITDAX or approx. € -81 million on the free cash flow in 2017. A change in
the gas price by -10 % would result in a change to EBITDAX in 2017 of approx. € -28 million and to
approx. € -19 million to the free cash flow. Rising oil and gas prices lead to opportunities in EBITDAX
and free cash flow for DEA Group, respectively.
- 20 -
The Risk Committee meets regularly to discuss the policies to be applied in the face of all risks, espe-
cially commodity price risks. These essentially consist of risks arising from operations (payments to be
received for future sales revenues from future production) as well as from financing processes. Com-
modity-price swaps and fixed price marketing agreements are in place to hedge price risks. The terms
of such transactions are based on the term of the underlying transaction and are therefore predominantly
short to medium-term. All hedging transactions serve the exclusive purpose of covering the risk from
operational and financial transactions as well as underlying transactions accounted for or expected with
a high degree of probability. Oil and gas prices are to be hedged in order to stabilise our future cash
flows and the RBL borrowing base. The extent of the volumes to be hedged depends on the economic
exposures and the prevailing oil and gas prices. Owing to the current level of oil and gas prices, com-
modity-price swaps were concluded for the calendar years 2017 - 2019. For the calendar year 2017,
approx. 20 % of the oil production exposed to market price risks is hedged by commodity-price swaps.
This is in line with the target defined in our hedge policy and covers 50 % of the economic exposure
after taxes. The oil hedge ratio for 2018 is currently at approx. 15 % and for 2019 at approx. 10 %. Gas
price risks for 2017 are hedged at approx. 28 % by fixed price agreements against gas price fluctuations.
The gas hedge ratio is currently for 2018 at approx. 12 % and for 2019 at approx. 10 %. We continue to
actively hedge our 2018 and 2019 production in line with our hedging policy.
Risks and opportunities from exchange rate fluctuations
As an international active group, we are also exposed to the risks and stand to benefit from the oppor-
tunities arising from movements in exchange rates on the international markets, especially changes in
USD/EUR, USD/NOK and NOK/GBP. These risks are managed in the DEA Group by means of system-
atic risk management procedures and broadly matching currency structure of assets and liabilities, using
short-term currency swaps, amongst other solutions. According to our current mid-term planning, a
change to the USD/€ exchange rate of USD 0.1/€ would lead to a change in EBITDAX of approx.
€ -92 million and approx. € -40 million in the free cash flow. Decreasing exchange rate ratios lead to
opportunities in EBITDAX and free cash flow for DEA Group, respectively.
Specific risks of the E&P industry
As an international active E&P group, our operations are subject to all risks common in our industry (e.g.
blow out, oil spills). To protect our core business against loss and liability to third parties we maintain
insurance that we believe is consistent with customary industry practices in the jurisdictions in which we
do business.
DEA faces also risks that involve above all the possible misinterpretation of geological structures and
the resultant dry wells drilled. We contain such risks through state-of-the-art technology and systematic
quality assurance.
Reserve estimates may undergo positive or negative changes in the course of time and exert an influ-
ence on current depreciation and amortisation as well as the value of the company’s assets. In general,
estimates of economically recoverable oil and gas reserves are based on a number of factors and as-
sumptions made as of the date on which the reserves estimates were determined, such as geological
- 21 -
and engineering estimates, historical production from the properties, the assumed effects on regulation
by governmental agencies and estimates of future commodity prices and operating costs, all of which
may vary considerably from actual results. Our policy regarding internal controls over the recording of
reserves is structured to objectively and accurately estimate our oil and gas reserve quantities and val-
ues in compliance with 2007 SPE/AAPG/WPC/SPEE PRMS. Our Petroleum Reservoir Simulation De-
partment maintains oversight and compliance responsibility for our internal reserve estimate process
and provides appropriate data to our independent reserves auditors for the annual estimation of our
year-end reserves.
The timely execution within the planned cost budget of our large development projects receives high
attention in the Risk Committee to enable possible countermeasures.
Financial risks
The development of oil and gas prices influences the RBL credit facility. If prices fall over a defined
period of time below a certain price deck used by the banks for the latest calculation of the available
facility amount, a recalculation of the facility amount is triggered which could lead to a (partial) short-
term repayment of the drawn facility amount, if not compensated by other measures such as the inclu-
sion of new reserves. In case of potentially necessary partial repayments of the outstanding loan DEA
has other financing opportunities that need to be used.
DEA Group is subject to restrictive debt covenants. In the reporting period, DEA was in compliance with
its obligations under all financing arrangements.
We closely monitor liquidity risk through cash flow forecasts and sensitivity analyses. We manage our
credit risk by assessing the creditworthiness of potential counterparties before entering into transactions
and through ongoing creditworthiness evaluations with respect to ongoing transactions.
Political risks
In the course of its foreign operations, DEA is exposed to the political risks prevailing in the various
countries. Our investments in North Africa are secured by federal German government guarantees. In
addition, our risk management activities also call for us to monitor the security situation in the countries
in which we ourselves or our subsidiaries are engaged very closely. The prevailing security situation in
Libya still prevents any operational activities in that country. We will continue to monitor developments
very closely and will react at short notice and take preventive measures to protect our employees and
their families.
- 22 -
Risk assessment of DEA Group
The assessment of the general situation of the risk environment is the result of a consolidated analysis
of all material individual risks. The focus was primarily on the significant market risks owing to fluctua-
tions in commodity prices. By deferring investment or portfolio optimisation decisions, DEA takes the
appropriate action to cope with the ongoing low level of prices. Furthermore, an organisational cost
reduction study is under way to increase efficiency. From today’s perspective, there are no risks threat-
ening the continued existence of the DEA Group as a going concern.
- 23 -
9. Environmental protection and safety
Quality, health, safety and environmental excellence is imperative to our business. We actively manage
the safety of all personnel working across our operations, including the application of health and safety
standards, the implementation of security measures at our facilities and internal and external audits of
health and safety standards. One of the performance measures we track is the recognised industry
metric, lost time injury (“LTI”) and lost time injury frequency (“LTIF”). We monitor our injury rates and
currently benchmark them on a regional basis due to the varying lost time injury criteria across the
countries in which we operate. On Germany our LTIF in 2015 was approximately 2 % of the German
industry average. Overall, our LTIF was 0.32 per million working hours in 2016. We encountered 1 LTI
in Germany in the calendar year 2016.
We carefully manage our impact on the environment and strive to uphold the highest international envi-
ronmental, health and safety standards. We undertake a wide range of construction-related and opera-
tional measures for the conservation of soil and water resources. These include the shielding of local
environments by means of special catchment tanks and monitoring facilities. Additionally, one of the
critical objects of our environmental policy is the avoidance of water pollution. To achieve this objective,
we define a number of water pollution control measures during the planning phase, prior to the under-
taking of any development activity.
We operate in jurisdictions with stringent regulatory regimes, including Germany and Norway. To ensure
compliance with relevant legislations and regulations, we routinely monitor our activities and constantly
adapt our operations to incorporate new innovations and safety measures.
We spent € 23 million on environmental protection in the period under review, with investments in envi-
ronmental protection amounting to € 52 million.
- 24 -
10. Research and development
Our Company’s activities in the exploration and development of hydrocarbon reservoirs are typical for
our industry. To support these activities, we have our own laboratories in our Geo Support Centre for
production engineering and geo-sciences, for example. The focus of our research activities quite natu-
rally is on the ongoing improvement of our methods for the exploration, development and production of
hydrocarbon deposits.
The personnel of the “F&E and Special Projects” Department comprises of 4 employees. For execution
and efficient handling of R&D projects, we continue to rely on the proactive support of project attendants
from the relevant functional departments. Our expenditure on development in 2016 came to a total of
€ 3 million. We succeeded in maintaining our participation in key R&D projects and programs. This was
possible to achieve on the one hand through in-kind services, i.e. the performance of cost-equivalent
own services, as well as through increased use of shared research, such as in Deutsche Wissenschaft-
liche Gesellschaft für Erdöl, Erdgas und Kohle (DGMK) [German Society for Petroleum and Coal Sci-
ence and Technology] or joint industry projects (JIP) on the other.
The focus in the period under review was on our participation in application-oriented development pro-
jects together with DGMK. By ensuring timely implementation, these projects lead to improved and more
efficient production processes and to minimised exploration risks. Via the research fund of our industrial
association BVEG, we also support projects to do with basic research.
- 25 -
11. Comparison with previous outlook and 2017 guidance
In the 4th quarter 2016, the new mid-term planning (MTP) of the DEA Group for the following five years
was prepared and adopted. Our guidance for 2017 is based on this MTP.
The following reference criteria are used:
“slight” represents a change of 1 - 10 %
“considerable” applies for changes of 11 % or higher.
In total, we expect for 2017 a slight decrease in production and a slight increase in commodity prices.
We face the current environment in the E&P industry with further measures to optimise the structure of
the DEA group.
Underlying assumptions
On average, the Brent oil price quoted in US dollars developed below our last year’s guidance due to
the further decline of prices in the first quarter 2016. On average, the European NBP and TTF gas prices
of key importance to our business likewise turned out to be below our last year’s guidance. Regarding
the exchange rate between US dollar and EUR, the actual development was in line with the guidance.
Our guidance 2017 is based on forwards and consensus of analyst estimates for commodity prices and
exchange rate:
We assume Brent prices in a range of 50 – 55 USD/bbl and UK NBP prices in a range of 5.0 –
5.5 USD/mscf for 2017
We assume the USD/EUR exchange rate to be in a range of 1.05 – 1.15.
Production is based on our latest production profiles for the respective fields.
Production
Our total production in the calendar year was slightly below the level of our last year’s guidance. For oil,
production was slightly below guidance due to lower production in the Gulf of Suez in Egypt and slightly
lower production in Norway, whereas production in Germany was in line with the guidance. Gas produc-
tion was also slightly below our guidance due to lower production volumes in Egypt and Germany,
whereas Norway slightly exceeded the guidance.
For the year 2017, we assume that our production will be at a range of 120 – 130 kbbl OE/d as the
decline in the already producing fields is expected to be partially compensated by the production start
of the development projects in the West Nile Delta and Reggane in Egypt and Algeria, respectively.
DEA Deutsche Erdoel AG
Consolidated Financial Statements
Fiscal Year
1 January - 31 December 2016
- 2 -
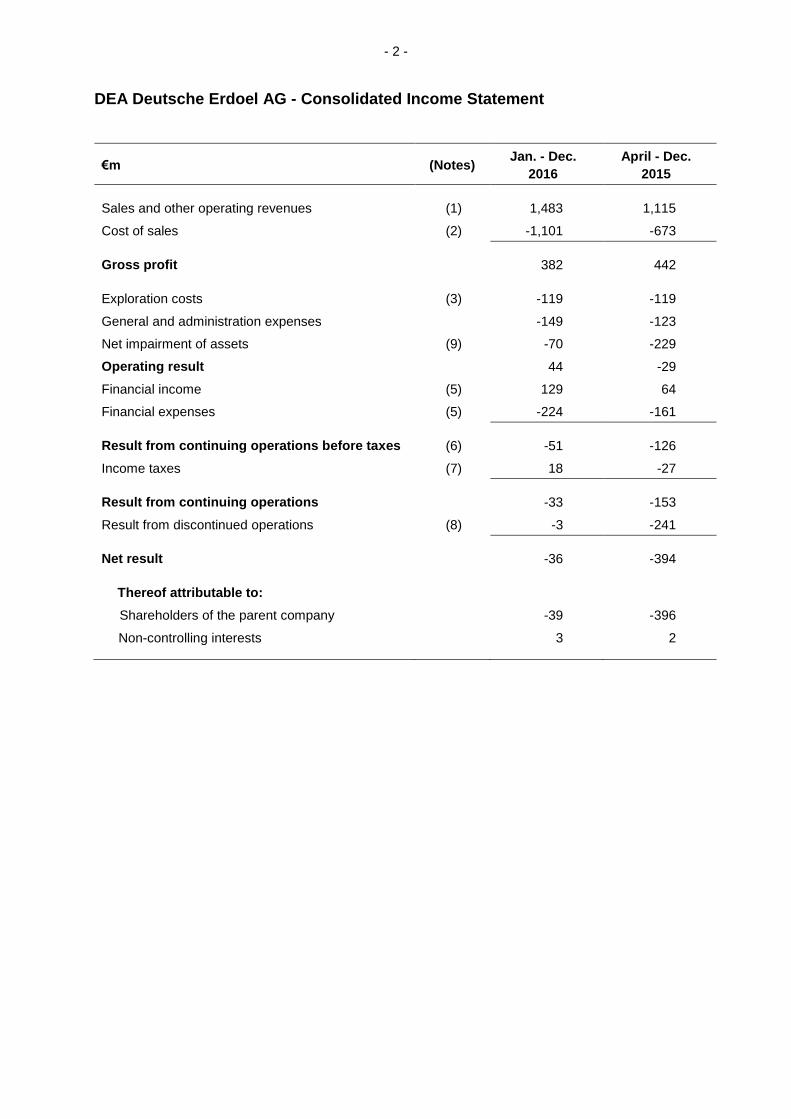
DEA Deutsche Erdoel AG - Consolidated Income Statement
€m (Notes) Jan. - Dec.
2016
April - Dec.
2015
Sales and other operating revenues (1) 1,483 1,115
Cost of sales (2) -1,101 -673
Gross profit 382 442
Exploration costs (3) -119 -119
General and administration expenses -149 -123
Net impairment of assets (9) -70 -229
Operating result 44 -29
Financial income (5) 129 64
Financial expenses (5) -224 -161
Result from continuing operations before taxes (6) -51 -126
Income taxes (7) 18 -27
Result from continuing operations -33 -153
Result from discontinued operations (8) -3 -241
Net result -36 -394
Thereof attributable to:
Shareholders of the parent company -39 -396
Non-controlling interests 3 2
- 3 -
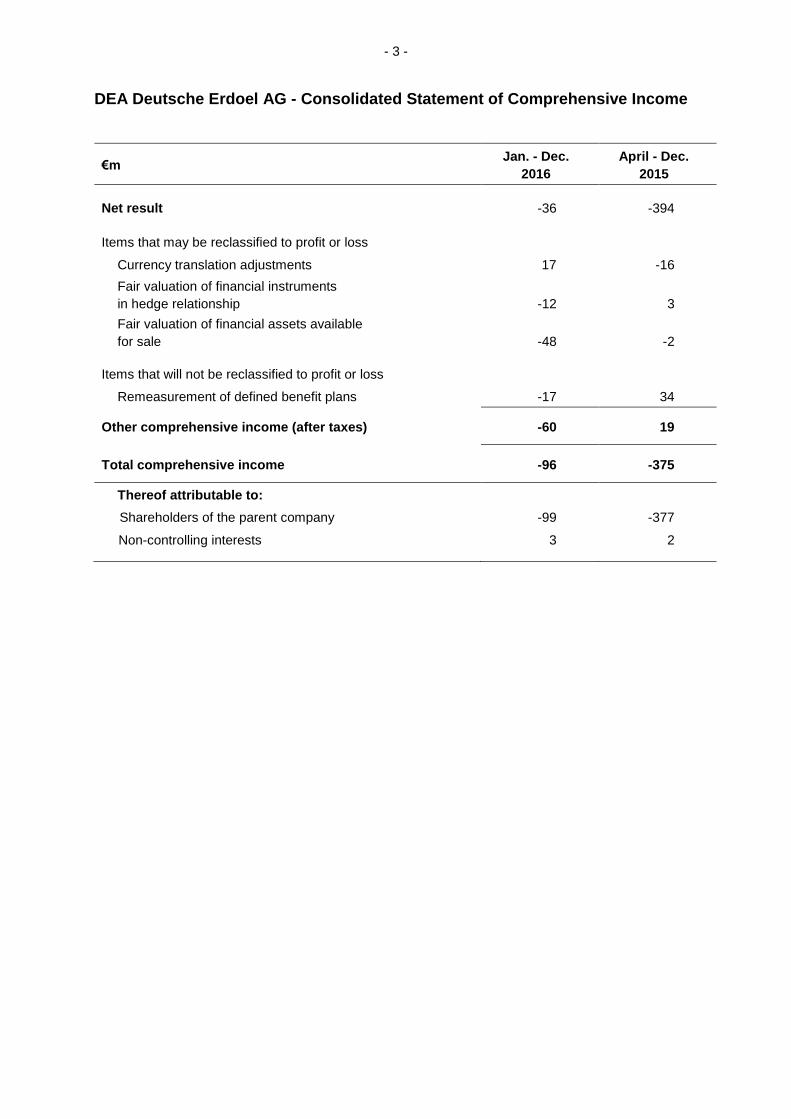
DEA Deutsche Erdoel AG - Consolidated Statement of Comprehensive Income
€m Jan. - Dec.
2016
April - Dec.
2015
Net result -36 -394
Items that may be reclassified to profit or loss
Currency translation adjustments 17 -16
Fair valuation of financial instruments
in hedge relationship
-12
3
Fair valuation of financial assets available
for sale
-48
-2
Items that will not be reclassified to profit or loss
Remeasurement of defined benefit plans -17 34
Other comprehensive income (after taxes) -60 19
Total comprehensive income -96 -375
Thereof attributable to:
Shareholders of the parent company -99 -377
Non-controlling interests 3 2
- 4 -
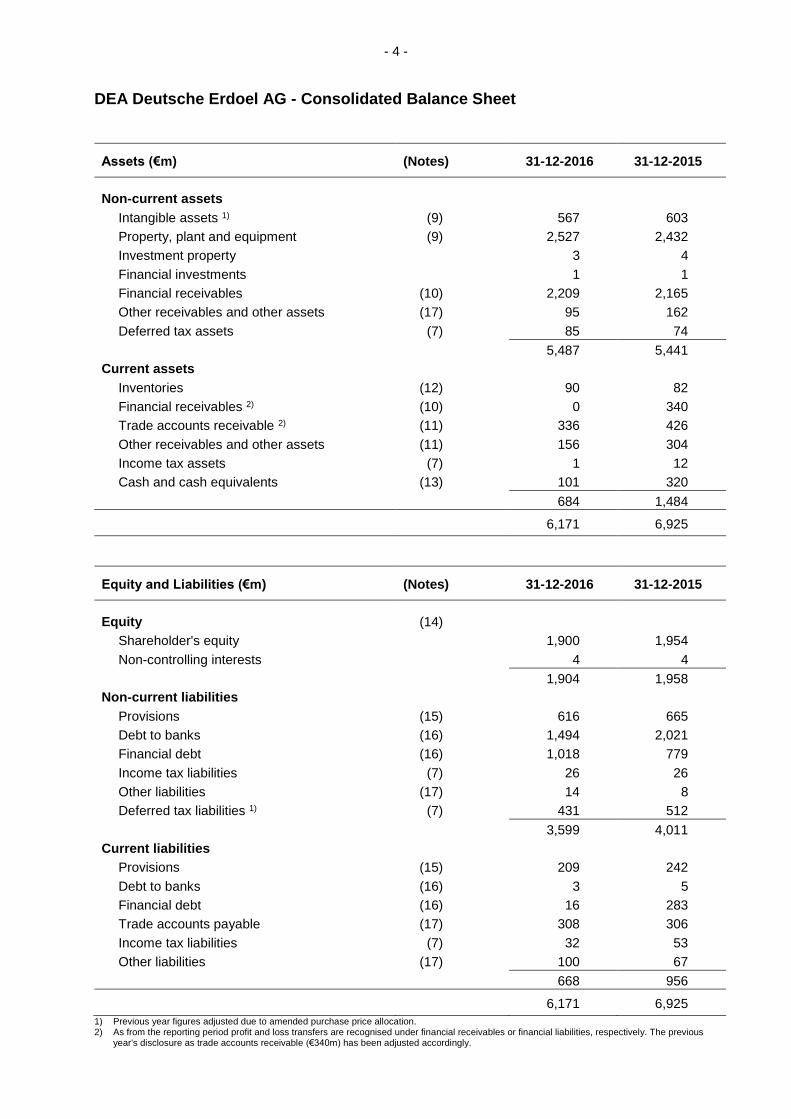
DEA Deutsche Erdoel AG - Consolidated Balance Sheet
Assets (€m) (Notes) 31-12-2016 31-12-2015
Non-current assets
Intangible assets 1) (9) 567 603
Property, plant and equipment (9) 2,527 2,432
Investment property 3 4
Financial investments 1 1
Financial receivables (10) 2,209 2,165
Other receivables and other assets (17) 95 162
Deferred tax assets (7) 85 74
5,487 5,441
Current assets
Inventories (12) 90 82
Financial receivables 2) (10) 0 340
Trade accounts receivable 2) (11) 336 426
Other receivables and other assets (11) 156 304
Income tax assets (7) 1 12
Cash and cash equivalents (13) 101 320
684 1,484
6,171 6,925
Equity and Liabilities (€m) (Notes) 31-12-2016 31-12-2015
Equity (14)
Shareholder's equity 1,900 1,954
Non-controlling interests 4 4
1,904 1,958
Non-current liabilities
Provisions (15) 616 665
Debt to banks (16) 1,494 2,021
Financial debt (16) 1,018 779
Income tax liabilities (7) 26 26
Other liabilities (17) 14 8
Deferred tax liabilities 1) (7) 431 512
3,599 4,011
Current liabilities
Provisions (15) 209 242
Debt to banks (16) 3 5
Financial debt (16) 16 283
Trade accounts payable (17) 308 306
Income tax liabilities (7) 32 53
Other liabilities (17) 100 67
668 956
6,171 6,925
1) Previous year figures adjusted due to amended purchase price allocation. 2) As from the reporting period profit and loss transfers are recognised under financial receivables or financial liabilities, respectively. The previous year's disclosure as trade accounts receivable (€340m) has been adjusted accordingly.
- 5 -
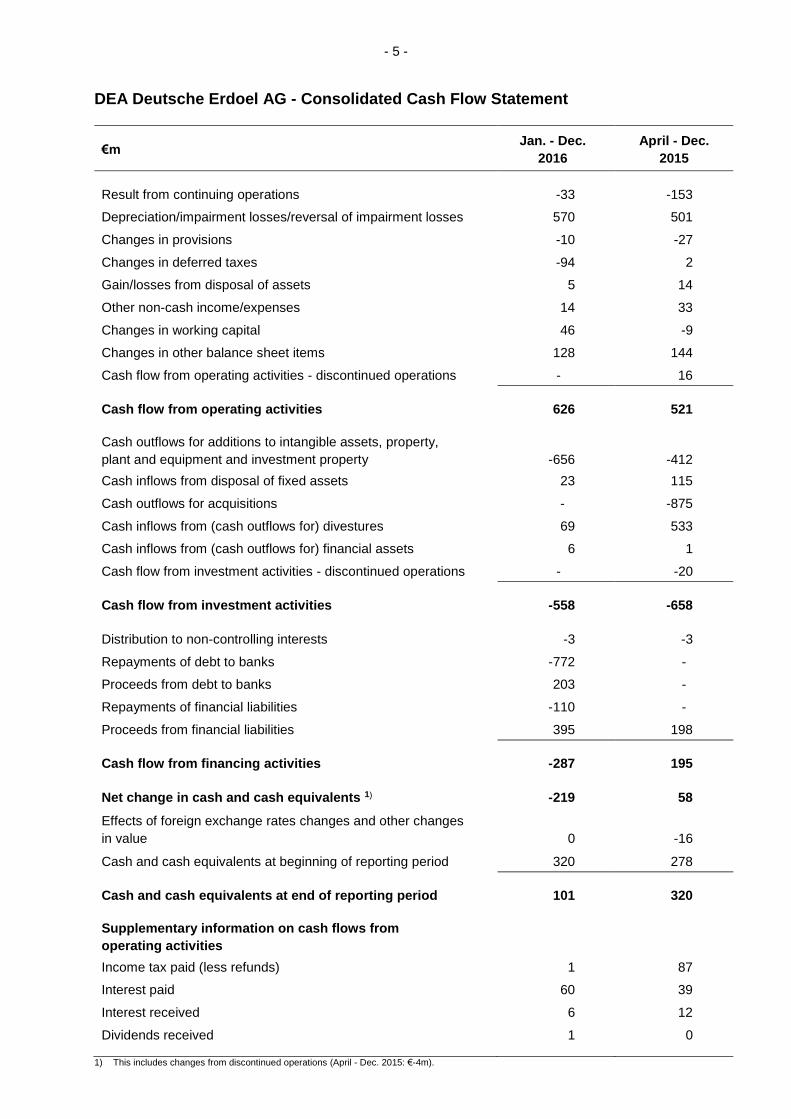
DEA Deutsche Erdoel AG - Consolidated Cash Flow Statement
€m Jan. - Dec.
2016
April - Dec.
2015
Result from continuing operations -33 -153
Depreciation/impairment losses/reversal of impairment losses 570 501
Changes in provisions -10 -27
Changes in deferred taxes -94 2
Gain/losses from disposal of assets 5 14
Other non-cash income/expenses 14 33
Changes in working capital 46 -9
Changes in other balance sheet items 128 144
Cash flow from operating activities - discontinued operations - 16
Cash flow from operating activities 626 521
Cash outflows for additions to intangible assets, property,
plant and equipment and investment property
-656
-412
Cash inflows from disposal of fixed assets 23 115
Cash outflows for acquisitions - -875
Cash inflows from (cash outflows for) divestures 69 533
Cash inflows from (cash outflows for) financial assets 6 1
Cash flow from investment activities - discontinued operations - -20
Cash flow from investment activities -558 -658
Distribution to non-controlling interests -3 -3
Repayments of debt to banks -772 -
Proceeds from debt to banks 203 -
Repayments of financial liabilities -110 -
Proceeds from financial liabilities 395 198
Cash flow from financing activities -287 195
Net change in cash and cash equivalents 1) -219 58
Effects of foreign exchange rates changes and other changes
in value
0
-16
Cash and cash equivalents at beginning of reporting period 320 278
Cash and cash equivalents at end of reporting period 101 320
Supplementary information on cash flows from
operating activities
Income tax paid (less refunds) 1 87
Interest paid 60 39
Interest received 6 12
Dividends received 1 0
1) This includes changes from discontinued operations (April - Dec. 2015: €-4m).
- 6 -
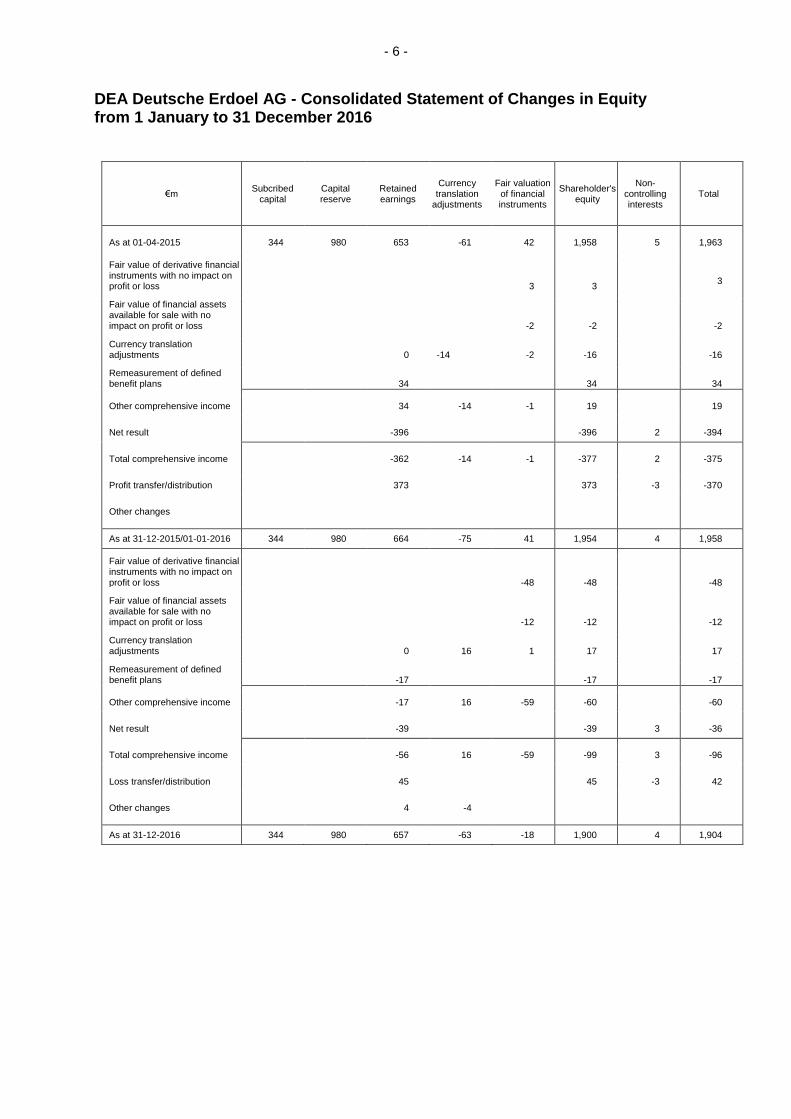
DEA Deutsche Erdoel AG - Consolidated Statement of Changes in Equity from 1 January to 31 December 2016
€m Subcribed
capital Capital reserve
Retained earnings
Currency translation
adjustments
Fair valuation of financial instruments
Shareholder's equity
Non- controlling interests
Total
As at 01-04-2015 344 980 653 -61 42 1,958 5 1,963
Fair value of derivative financial instruments with no impact on profit or loss
3
3
3
Fair value of financial assets available for sale with no impact on profit or loss
-2
-2
-2
Currency translation adjustments
0
-14
-2
-16
-16
Remeasurement of defined benefit plans
34
34
34
Other comprehensive income 34 -14 -1 19 19
Net result -396 -396 2 -394
Total comprehensive income -362 -14 -1 -377 2 -375
Profit transfer/distribution 373 373 -3 -370
Other changes
As at 31-12-2015/01-01-2016 344 980 664 -75 41 1,954 4 1,958
Fair value of derivative financial instruments with no impact on profit or loss
-48
-48
-48
Fair value of financial assets available for sale with no impact on profit or loss
-12
-12
-12
Currency translation adjustments
0
16
1
17
17
Remeasurement of defined benefit plans
-17
-17
-17
Other comprehensive income -17 16 -59 -60 -60
Net result -39 -39 3 -36
Total comprehensive income -56 16 -59 -99 3 -96
Loss transfer/distribution 45 45 -3 42
Other changes 4 -4
As at 31-12-2016 344 980 657 -63 -18 1,900 4 1,904
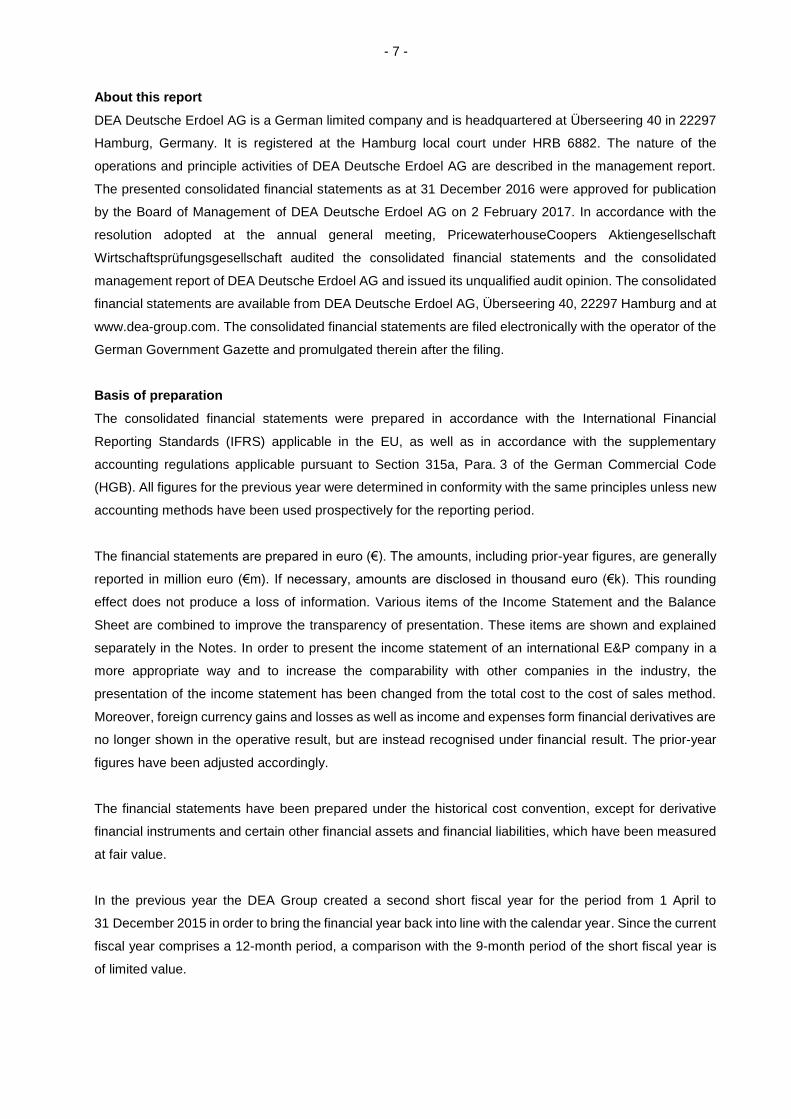
- 7 - About this report
DEA Deutsche Erdoel AG is a German limited company and is headquartered at Überseering 40 in 22297
Hamburg, Germany. It is registered at the Hamburg local court under HRB 6882. The nature of the
operations and principle activities of DEA Deutsche Erdoel AG are described in the management report.
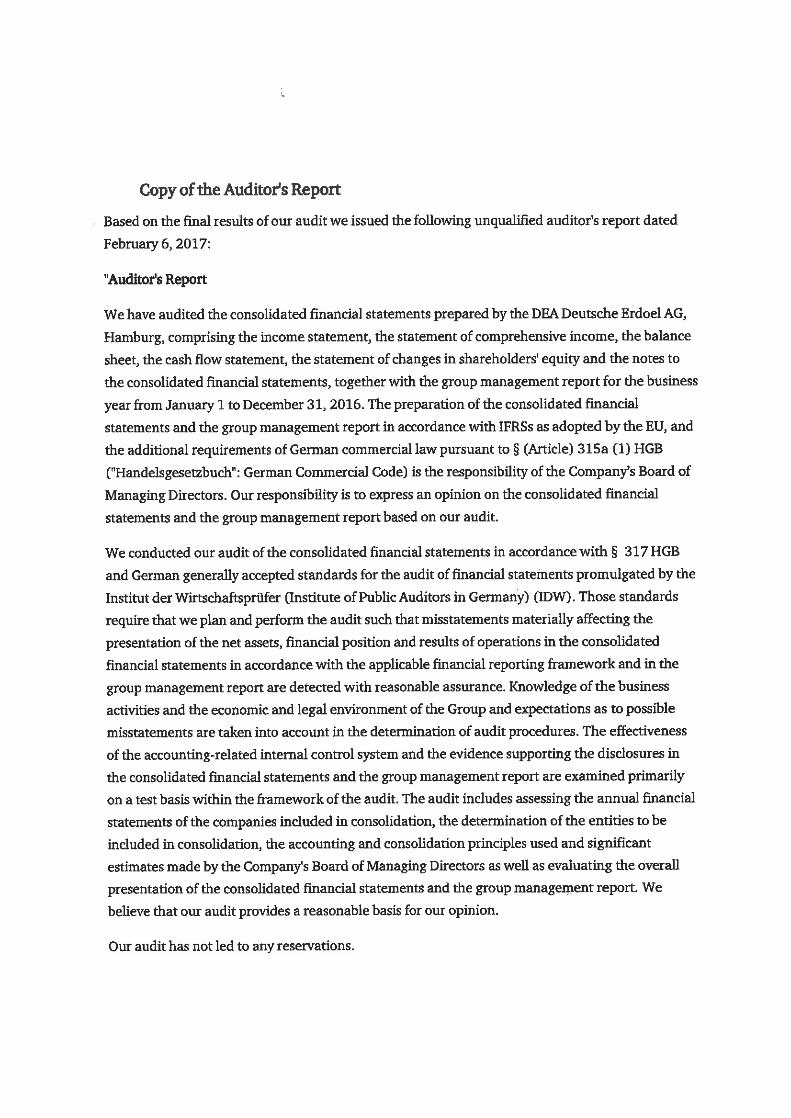
The presented consolidated financial statements as at 31 December 2016 were approved for publication
by the Board of Management of DEA Deutsche Erdoel AG on 2 February 2017. In accordance with the
resolution adopted at the annual general meeting, PricewaterhouseCoopers Aktiengesellschaft
Wirtschaftsprüfungsgesellschaft audited the consolidated financial statements and the consolidated
management report of DEA Deutsche Erdoel AG and issued its unqualified audit opinion. The consolidated
financial statements are available from DEA Deutsche Erdoel AG, Überseering 40, 22297 Hamburg and at
www.dea-group.com. The consolidated financial statements are filed electronically with the operator of the
German Government Gazette and promulgated therein after the filing.
Basis of preparation
The consolidated financial statements were prepared in accordance with the International Financial
Reporting Standards (IFRS) applicable in the EU, as well as in accordance with the supplementary
accounting regulations applicable pursuant to Section 315a, Para. 3 of the German Commercial Code
(HGB). All figures for the previous year were determined in conformity with the same principles unless new
accounting methods have been used prospectively for the reporting period.
The financial statements are prepared in euro (€). The amounts, including prior-year figures, are generally
reported in million euro (€m). If necessary, amounts are disclosed in thousand euro (€k). This rounding
effect does not produce a loss of information. Various items of the Income Statement and the Balance
Sheet are combined to improve the transparency of presentation. These items are shown and explained
separately in the Notes. In order to present the income statement of an international E&P company in a
more appropriate way and to increase the comparability with other companies in the industry, the
presentation of the income statement has been changed from the total cost to the cost of sales method.
Moreover, foreign currency gains and losses as well as income and expenses form financial derivatives are
no longer shown in the operative result, but are instead recognised under financial result. The prior-year
figures have been adjusted accordingly.
The financial statements have been prepared under the historical cost convention, except for derivative
financial instruments and certain other financial assets and financial liabilities, which have been measured
at fair value.
In the previous year the DEA Group created a second short fiscal year for the period from 1 April to
31 December 2015 in order to bring the financial year back into line with the calendar year. Since the current
fiscal year comprises a 12-month period, a comparison with the 9-month period of the short fiscal year is
of limited value.
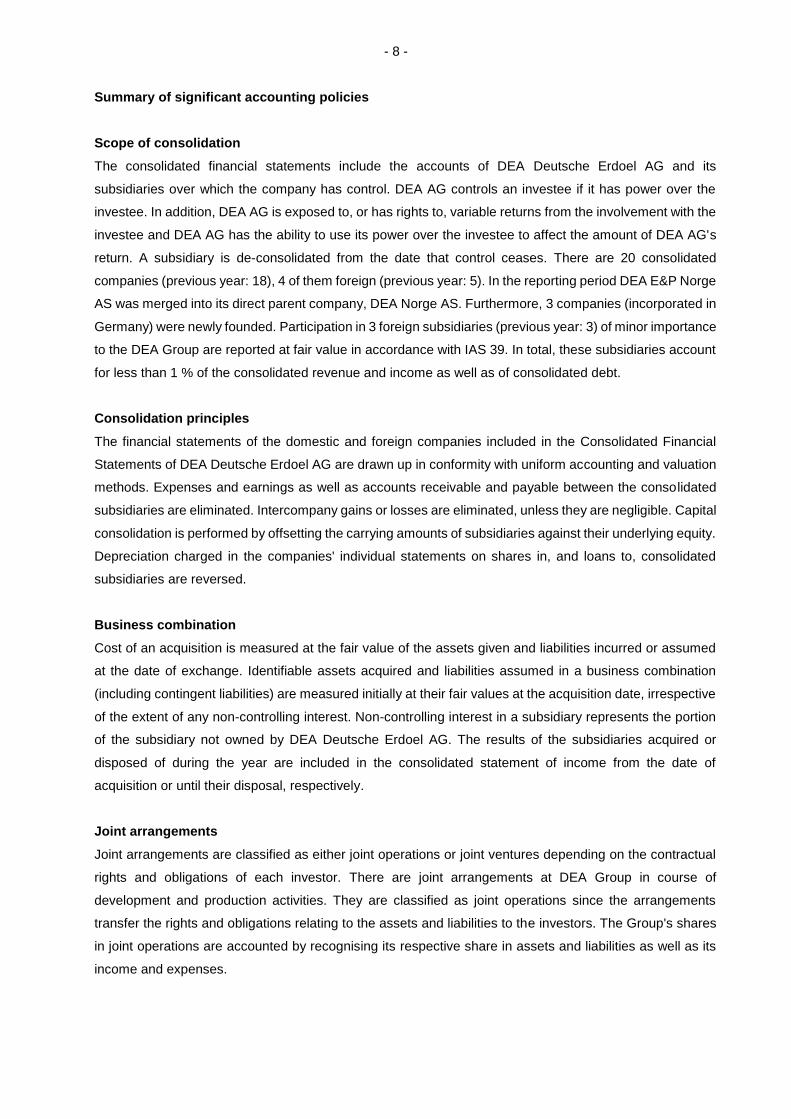
- 8 - Summary of significant accounting policies
Scope of consolidation
The consolidated financial statements include the accounts of DEA Deutsche Erdoel AG and its
subsidiaries over which the company has control. DEA AG controls an investee if it has power over the
investee. In addition, DEA AG is exposed to, or has rights to, variable returns from the involvement with the
investee and DEA AG has the ability to use its power over the investee to affect the amount of DEA AG's
return. A subsidiary is de-consolidated from the date that control ceases. There are 20 consolidated
companies (previous year: 18), 4 of them foreign (previous year: 5). In the reporting period DEA E&P Norge
AS was merged into its direct parent company, DEA Norge AS. Furthermore, 3 companies (incorporated in
Germany) were newly founded. Participation in 3 foreign subsidiaries (previous year: 3) of minor importance
to the DEA Group are reported at fair value in accordance with IAS 39. In total, these subsidiaries account
for less than 1 % of the consolidated revenue and income as well as of consolidated debt.
Consolidation principles
The financial statements of the domestic and foreign companies included in the Consolidated Financial
Statements of DEA Deutsche Erdoel AG are drawn up in conformity with uniform accounting and valuation
methods. Expenses and earnings as well as accounts receivable and payable between the consolidated
subsidiaries are eliminated. Intercompany gains or losses are eliminated, unless they are negligible. Capital
consolidation is performed by offsetting the carrying amounts of subsidiaries against their underlying equity.
Depreciation charged in the companies' individual statements on shares in, and loans to, consolidated
subsidiaries are reversed.
Business combination
Cost of an acquisition is measured at the fair value of the assets given and liabilities incurred or assumed
at the date of exchange. Identifiable assets acquired and liabilities assumed in a business combination
(including contingent liabilities) are measured initially at their fair values at the acquisition date, irrespective
of the extent of any non-controlling interest. Non-controlling interest in a subsidiary represents the portion
of the subsidiary not owned by DEA Deutsche Erdoel AG. The results of the subsidiaries acquired or
disposed of during the year are included in the consolidated statement of income from the date of
acquisition or until their disposal, respectively.
Joint arrangements
Joint arrangements are classified as either joint operations or joint ventures depending on the contractual
rights and obligations of each investor. There are joint arrangements at DEA Group in course of
development and production activities. They are classified as joint operations since the arrangements
transfer the rights and obligations relating to the assets and liabilities to the investors. The Group's shares
in joint operations are accounted by recognising its respective share in assets and liabilities as well as its
income and expenses.
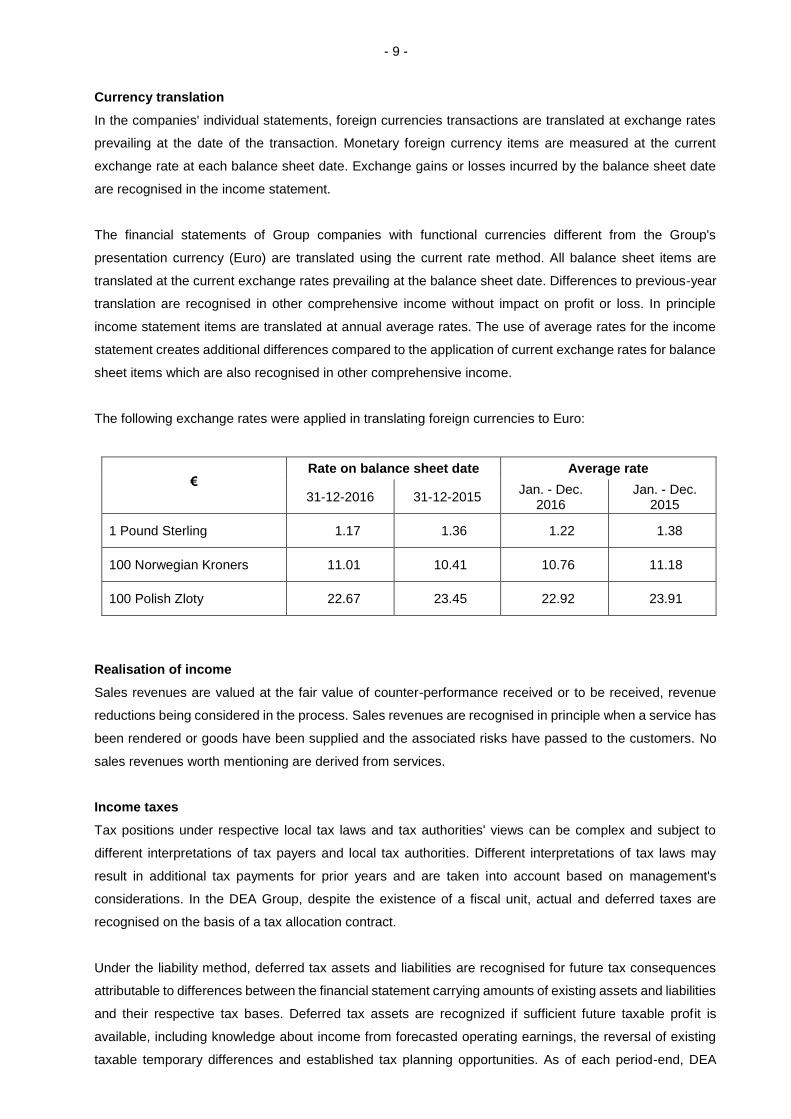
- 9 - Currency translation
In the companies' individual statements, foreign currencies transactions are translated at exchange rates
prevailing at the date of the transaction. Monetary foreign currency items are measured at the current
exchange rate at each balance sheet date. Exchange gains or losses incurred by the balance sheet date
are recognised in the income statement.
The financial statements of Group companies with functional currencies different from the Group's
presentation currency (Euro) are translated using the current rate method. All balance sheet items are
translated at the current exchange rates prevailing at the balance sheet date. Differences to previous-year
translation are recognised in other comprehensive income without impact on profit or loss. In principle
income statement items are translated at annual average rates. The use of average rates for the income
statement creates additional differences compared to the application of current exchange rates for balance
sheet items which are also recognised in other comprehensive income.
The following exchange rates were applied in translating foreign currencies to Euro:
€ Rate on balance sheet date Average rate
31-12-2016 31-12-2015 Jan. - Dec.
2016 Jan. - Dec.
2015
1 Pound Sterling 1.17 1.36 1.22 1.38
100 Norwegian Kroners 11.01 10.41 10.76 11.18
100 Polish Zloty 22.67 23.45 22.92 23.91
Realisation of income
Sales revenues are valued at the fair value of counter-performance received or to be received, revenue
reductions being considered in the process. Sales revenues are recognised in principle when a service has
been rendered or goods have been supplied and the associated risks have passed to the customers. No
sales revenues worth mentioning are derived from services.
Income taxes
Tax positions under respective local tax laws and tax authorities' views can be complex and subject to
different interpretations of tax payers and local tax authorities. Different interpretations of tax laws may
result in additional tax payments for prior years and are taken into account based on management's
considerations. In the DEA Group, despite the existence of a fiscal unit, actual and deferred taxes are
recognised on the basis of a tax allocation contract.
Under the liability method, deferred tax assets and liabilities are recognised for future tax consequences
attributable to differences between the financial statement carrying amounts of existing assets and liabilities
and their respective tax bases. Deferred tax assets are recognized if sufficient future taxable profit is
available, including knowledge about income from forecasted operating earnings, the reversal of existing
taxable temporary differences and established tax planning opportunities. As of each period-end, DEA
- 10 - Group evaluates the recoverability of deferred tax assets, based on projected future taxable profits. Based
upon the level of historical taxable income and projections for future taxable income over the periods in
which the deferred tax assets are deductible, DEA Group believes it is probable the company will realise
the benefits of these deductible differences. As future developments are uncertain, assumptions are
necessary to estimate future taxable profits as well as the period in which deferred tax assets will recover.
Estimates are revised in the period in which there are sufficient evidence to revise the assumption.
Intangible assets
Intangible assets include capitalised exploration expenditures, other intangible assets such as cost
recovery rights, licence rights in the production phase, commercial and technical software as well as
goodwills. They are reported at amortised costs.
The exploration phase comprises the period from the receipt of exploration rights until their expiry or until
technical feasibility of a field development and economic viability have been demonstrated respectively.
The exploration expenditures capitalised during this phase include for example concession acquisition
costs, licences and exploration rights as well as exploration wells. Exploration wells are accounted for at
their historic cost of acquisition or production according to the successful efforts method, i.e. expenses
incurred on exploration wells are only capitalised in principle if they were successful, in the sense that they
led in particular to the discovery of crude oil and gas deposits. Once the reserves are proved and
commercial viability is established as well as the development is highly probable the exploration wells are
reclassified into property, plant and equipment and intangible exploration rights are reclassified into other
intangible assets. During the exploration phase, the exploration expenditures capitalised are not subject to
scheduled amortisation/depreciation. With the start of production they are amortised/depreciated according
to the unit-of-production method.
With the exception of goodwill, all intangible assets have a finite useful life and are therefore subject to
systematic linear or production-related depreciation. The useful life of concessions and other licence rights
corresponds to the contractual term or comprises the period until the end of economic production. Software
for commercial or technical applications is depreciated under the straight-line method over three years. The
useful economic life and amortisation methods are subject to annual review.
Goodwill is not subject to systematic amortisation. It is subject to an impairment test on an annual basis or
whenever there are indications of a diminution in value (impairment test). Goodwill is part of cash-
generating units. The goodwill impairment test is performed at the level of a cash-generating unit or a group
of cash-generating units. This is the lowest level at which goodwill is monitored for internal management
purposes.
Property, plant and equipment
Property, plant and equipment comprise land and buildings, oil and gas assets, other plant, machinery and
equipment as well as fixtures and fittings and office equipment. They are valued at amortised acquisition
or production cost. Borrowing costs that can be directly allocated to the acquisition or production of an asset
are capitalised as part of acquisition or production costs if a considerable period is necessary to convert
the asset into its intended state for use or sale ("qualified asset"). The cost of property, plant and equipment
- 11 - includes the estimated cost of de-installation or demolition and removal and of the reconditioning of the
asset under public or private law obligations, to the extent related provisions were set up. Maintenance and
repair costs are stated as expenses.
Oil and gas assets are generally depreciated using the unit-of-production method. Basically, in case of
capitalised wells the depreciation is based on the current production of the period in relation to proved
developed producing reserves and in case of acquisition costs and production facilities/support equipment
the current production of the period is set in relation to total proved reserves.
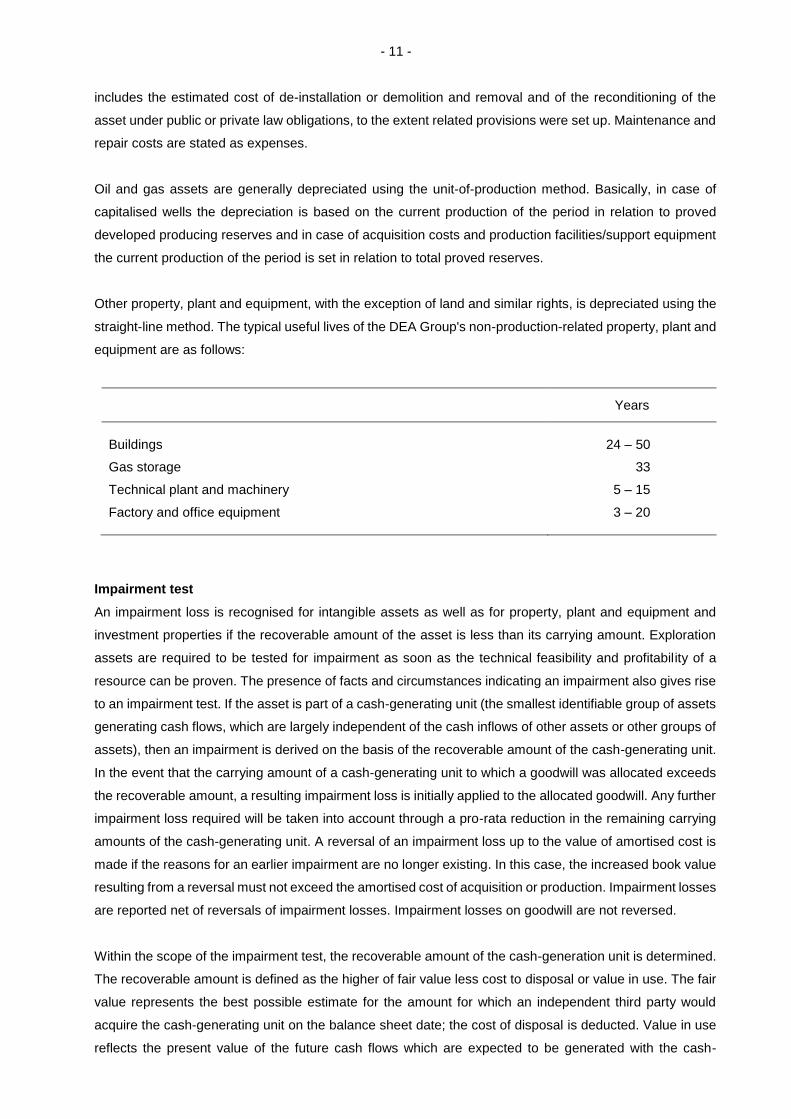
Other property, plant and equipment, with the exception of land and similar rights, is depreciated using the
straight-line method. The typical useful lives of the DEA Group's non-production-related property, plant and
equipment are as follows:
Years
Buildings 24 – 50
Gas storage 33
Technical plant and machinery 5 – 15
Factory and office equipment 3 – 20
Impairment test
An impairment loss is recognised for intangible assets as well as for property, plant and equipment and
investment properties if the recoverable amount of the asset is less than its carrying amount. Exploration
assets are required to be tested for impairment as soon as the technical feasibility and profitability of a
resource can be proven. The presence of facts and circumstances indicating an impairment also gives rise
to an impairment test. If the asset is part of a cash-generating unit (the smallest identifiable group of assets
generating cash flows, which are largely independent of the cash inflows of other assets or other groups of
assets), then an impairment is derived on the basis of the recoverable amount of the cash-generating unit.
In the event that the carrying amount of a cash-generating unit to which a goodwill was allocated exceeds
the recoverable amount, a resulting impairment loss is initially applied to the allocated goodwill. Any further
impairment loss required will be taken into account through a pro-rata reduction in the remaining carrying
amounts of the cash-generating unit. A reversal of an impairment loss up to the value of amortised cost is
made if the reasons for an earlier impairment are no longer existing. In this case, the increased book value
resulting from a reversal must not exceed the amortised cost of acquisition or production. Impairment losses
are reported net of reversals of impairment losses. Impairment losses on goodwill are not reversed.
Within the scope of the impairment test, the recoverable amount of the cash-generation unit is determined.
The recoverable amount is defined as the higher of fair value less cost to disposal or value in use. The fair
value represents the best possible estimate for the amount for which an independent third party would
acquire the cash-generating unit on the balance sheet date; the cost of disposal is deducted. Value in use
reflects the present value of the future cash flows which are expected to be generated with the cash-
- 12 - generating unit. If either of these amounts exceeds the carrying amount, it is not always necessary to
determine both amounts. These values are generally determined based on discounted cash flow
calculations which, in turn, are generally based on the current corporate planning. The cash flow forecasts
pertain to the life-of-field-period for the individual concession/licence or groups of concessions/licences.
The calculations are based on historical experiences as well as the expectations for future market trends.
The principal assumptions underlying the determination by management of recoverable amount are the
forecasts for market prices of crude oil and natural gas, the estimated reserves, the production forecast as
well as the discount rates. The discount rates applied are based on the weighted average capital costs
taking into consideration specific country risks. The calculation was not related to the actual capital structure
of the company but was generated as a derivation from Peer Group.
Financial assets
Financial assets are recognised in the balance sheet if a company is a party to a contract for the asset in
question. Market-conform purchases or sales of financial assets are recognised or derecognised,
respectively, on the day of trading. Financial assets are derecognised when the contractual rights to cash
flows from the asset expire or the entity transfers the financial asset. The latter applies when substantially
all the risks and rewards of ownership of the asset are transferred, or the entity no longer has control of the
asset.
Financial assets are allocated to the following valuation categories: “loans and receivables”, “available-for-
sale financial assets” and “financial assets at fair value through profit or loss” ("held for trading" or “held in
hedging relationship”).
Financial assets, with the exception of financial derivatives and available-for-sale financial assets, are
valued at amortised cost by applying the effective interest method, if necessary. Any impairments
necessary are determined by the actual risk of default. In the presence of appropriate indications, such as
the insolvency of a customer or disputed invoices, specific impairments are made. Receivables are
generally corrected via an allowance account. Impairments are reversed if payments are received or the
default risk is reduced accordingly. The reversal is recognised in the same expense item in which the
original impairment loss was recorded.
The available-for-sale financial assets are recognised initially and in the following periods at fair value as
long as such can be determined reliably. Unrealised gains and losses are stated as other comprehensive
income without impact on profit or loss. If there are objective and material indications of a reduction in the
value of an asset, an impairment loss is recognised in profit or loss.
Inventories
Inventories are carried at cost of acquisition or production or at the lower net realisable value. Production
costs reflect the full costs directly related to production and are determined based on the normal capacity.
To the extent that the net realisable value of previously impaired inventories has increased, the resulting
reversal is recognised in the same expense item in which the original impairment was recorded.
- 13 - Provisions
Provisions are set up for all legal or factual obligations to third parties as at the balance sheet date which
are based on past events, will probably lead to an outflow of resources in the future and the extent of which
can be reliably estimated. Possible obligations to third parties or existing obligations where an outflow of
resources is improbable or the extent thereof cannot be reliably determined, are not to be recognised as
provisions. They have to be disclosed as contingent liabilities in the notes unless the possibility of an outflow
of resources with economic benefits is remote.
Provisions are carried at their foreseeable settlement amount and not netted against any recovery claims.
The settlement amount comprises cost increases to be taken into account as of the balance sheet date. In
case of non-current provisions the amounts are discounted to the present value applying the country-/
currency-specific market interest rate applicable as of the respective balance sheet date. Provisions based
on large number of similar events are reported at their expected value. Releases of provisions are written
back against the expense item in which the provision was originally set up.
Decommissioning provisions cover the updated commitments for the plugging of wells, the de-installation
of onshore and offshore production facilities and the reconditioning of operations and drilling sites. Their
extent is based on the anticipated full costs, taking into account the empirical data and the cost benchmarks
determined by the Association of German Crude Oil and Natural Gas Producers, with comparable
assumptions being available for foreign activities. Should any changes in interest rates or estimates in
terms of the time or the level of payouts lead to changes in this provision, then the carrying amount of the
associated asset will be adjusted accordingly. If the reduction is higher than the book value, the excess
amount must be recorded with direct impact on income.
Provisions for pensions are recognised for defined benefit plans. This relates to commitments by the
company to cover vested entitlements of employees in active service and current benefits to active and
former employees or their dependents. These commitments relate in particular to old-age pension
payments. The specific commitments are based on benefits that vary throughout the industry; however, as
a rule they are measured according to the term of service and remuneration of the employees.
The companies’ pension plan consists both of defined benefit and contribution-oriented benefit plans.
Provisions for defined benefit plans are based on the actuarial projected benefit obligation, measured using
the projected unit credit method. This benefit/years of service method not only takes into account the
pension benefits and benefit entitlements known as of the balance sheet date, but also anticipated future
increases in salaries and pension benefits. The calculation is based on actuarial reports, taking into account
appropriate biometric parameters (for Germany, in particular the “Richttafeln 2005G” by Klaus Heubeck;
for Norway the mortality table “K2013”). The provision is reduced by the fair value of the plan assets set up
to cover the pension commitments. The service cost, i.e. the increase in the obligation resulting from the
work performed by employees in the period under review, is disclosed in operating result and the interest
expenses/income are reported in financial expenses.
- 14 - Results of the remeasurement of defined benefit plans are fully recognised in the fiscal year in which they
occur. They are reported outside of profit or loss in the consolidated statement of comprehensive income
and immediately assigned to retained earnings. Therefore, they remain outside profit or loss in subsequent
periods as well.
In the case of contribution-oriented benefit plans, the company does not incur any further obligations
beyond making contribution payments to special-purpose funds. The contribution payments are recorded
as expenses.
Financial liabilities
Financial liabilities are allocated to the following categories: “liabilities valued at amortised cost of
acquisition” and “financial liabilities at fair value through profit or loss” (“held for trading” or “designated as
hedging instruments”).
Financial liabilities recognised for the first time are stated at fair value. For subsequent periods, liabilities,
with the exception of financial derivatives, are valued at amortised cost of acquisition by applying the
effective interest method, if necessary.
Derivative financial instruments
Derivative financial instruments are reported as assets or liabilities. All derivative financial instruments are
measured at fair value regardless of their purpose. Derivative hedge transactions are reported in the
balance sheet as at the relevant transaction dates. Changes in the fair value are recognised with an effect
on income unless the instruments are used for hedge accounting purposes.
Cash flow hedges are used to hedge the risk of variability in cash flows related to an asset or liability carried
on the balance sheet or related to a highly probable forecast transaction. If a cash flow hedge exists, the
effective parts of changes in fair value for the hedging transactions effected are recorded under other
comprehensive income in the equity until such time as the hedging transaction is realised. Changes in fair
value of the hedge transactions deployed, caused by market price changes, are counteracted to an equal
extent by expected changes in the fair value of the existing underlying transactions. As a rule, fair value
changes are reported with an impact on profit or loss at that point in time when the hedge transaction is
realised through profit or loss. The contribution to earnings from the hedging transaction is then transferred
from other comprehensive income to the income statement.
IAS 39 establishes certain requirements when accounting for hedging transactions. In particular, hedging
relationships need to be documented in detail and be effective, i.e. the changes in fair value of the hedge
must lie within a bandwidth of 80 to 125 % to the diametrically opposed changes in fair value of the
underlying transaction, both prospectively and retrospectively. Only the effective portion of a hedging
relationship may be accounted for according to the rules described for cash flow hedges. The ineffective
part of the hedge is immediately taken to the income statement.
- 15 - Agreements concluded for the purpose of receiving or supplying non-financial items in accordance with the
company’s expected buying, selling or utilisation demand and held for this purpose (own use contracts) are
not accounted for as financial derivatives but as pending transactions. If the agreements contain embedded
derivatives, then the derivatives will be accounted for separately from the underlying agreement if the
economic characteristics and risks of the embedded derivative are not closely related to the economic
characteristics and risks of the underlying agreement.
Prior-year information
The presentation of certain prior-year information has been reclassified to conform to the current year
presentation.
Important estimates and assumptions
Preparation of the consolidated financial statements on the basis of IFRS requires management to make
estimates and assumptions that affect the amounts reported for assets, liabilities, income and expenses as
well as disclosed contingent liabilities and fair values. The assumptions and estimates are mainly
concerning the following areas:
Oil and gas reserves
Oil and natural gas reserves are applied to determine the value in use within in the framework of the
impairment test as well as for the production-related depreciation and amortisation using the unit-of-
production method. Reserves are estimated by the Group's own qualified engineers and geoscientists
applying standardised valuation methods and classified correspondent to international industry standards.
This process is subject to defined principles. Furthermore, the estimates are audited by an independent
consultant (RPS Group) on an annual basis.
Impairment tests
Key assumptions within impairment tests for intangible assets and property, plant and equipment relate to
estimated reserves, forecasts for market prices of crude oil and natural gas, production forecasts as well
as discount rates.
Derivative financial instruments
In accounting for derivative financial instruments, assumptions have to be made as to whether the principles
of hedge accounting apply. In addition, for certain contracts a decision is required as to whether they are
to be recognised as derivatives or treated as pending transactions like so-called own use contracts.
Provisions
Decommissioning provisions mainly require estimates and assumptions with regard to terms, exchange
rates, costs to be considered and discount rates. Due to changes in relation to these items, the future actual
cash outflows can be different.
With regard to pension provisions, the discount rate is one of the very important estimates. The discount
factor for pension obligations is determined on the basis of yields on high quality, fixed-rate corporate bonds
on the financial markets as of the balance sheet date.
- 16 -
All assumptions and estimates are based on conditions and evaluations made as at the balance sheet date.
In addition, with regard to expected future business trends, the future development (considered realistic at
the present time) of the economic environment in the industries and the regions in which the DEA Group
operates was taken into account. If the actual trend deviates from the assumed development of conditions,
then the assumptions and, if necessary, the carrying amounts of the assets and liabilities concerned will be
adjusted accordingly. As of the date of preparation of the consolidated financial statements, it is not
presumed that there will be a material change in the assumptions and estimates.
Changes in accounting policies
The International Accounting Standards Board (IASB) has adopted changes in the existing International
Financial Reporting Standards (IFRS), which became effective for the DEA Group as of 1 January 2016:
Improvements to IFRSs 2012 – 2014 (2014)
Amendments to IAS 27 (2014) "Equity Method in Separate Financial Statements"
Amendments to IAS 16 and IAS 41 (2014) "Bearer Plants"
Amendments to IAS 16 and IAS 38 (2014) "Clarification of Acceptable Methods of Depreciation and
Amortisation"
Amendments to IFRS 11 (2014) "Accounting for Acquisitions of Interests in Joint Operations"
Amendments to IAS 1 (2014) "Disclosure Initiative"
Amendments to IFRS 10, IFRS 12 and IAS 28 (2014) "Investment Entities: Applying Consolidation
Exception"
The first-time adaption does not have any material effects on the DEA Group’s consolidated financial
statements.
Moreover, the IASB has issue the standard IFRS 14 (2014) "Regulatory Deferral Accounts", which became
effective as of 1 January 2016. Due to the fact that the adoption into European law should not take place,
DEA Group did not apply this standard in the reporting period. The implementation would not have had any
impact on the consolidated financial statements.
New accounting policies
The IASB and the IFRS IC have adopted further standards as well as amendments to standards, which
were not yet mandatory in the European Union (EU) for fiscal years which begin on 1 January 2016. EU
endorsement is still pending in some cases.
- 17 - The most important changes are described in the following:
IFRS 9 (2014) "Financial Instruments" replaces the previous regulations of IAS 39. IFRS 9 contains
new requirements for the classification and measurement of financial instruments, fundamental changes
regarding the accounting treatment of financial asset impairments, and a reformed approach to hedge
accounting. IFRS 9 retains "amortised cost" and "fair value" as the criteria for measuring financial
instruments. Whether financial assets are measured at amortised cost or fair value will depend on two
factors: the entity's business model for managing the portfolio to which the financial asset belongs and
contractual cash flow characteristics of the financial asset. In the future, the recognition of financial asset
impairments is based on expected losses according to IFRS 9. The general approach adopts a three-
stage model to assess the provisions for risks. The model requires different degrees of impairment
based on the credit default risk of the counterparties. For certain financial instruments, such as trade
accounts receivable, operational simplifications for recognising impairment losses apply. IFRS 9
regulations on hedge accounting aim for a closer alignment of hedge accounting with the entity's risk
management strategy. IFRS 9 (2014) becomes effective for the first time for fiscal years starting on or
after 1 January 2018.
IFRS 15 (2014) "Revenue from Contracts with Customers" replaces the previous regulations of
IAS 11, IAS 18, IFRIC 13, IFRIC 15, IFRIC 18 and SIC 31. The new standard introduces uniform criteria
for the timing of revenue recognition. According to IFRS 15, sales revenue is recognised when control
of the agreed-upon goods or services and the benefits obtainable from them are transferred to the
customer. The transfer of major risks and rewards of ownership of the goods is no longer the deciding
factor. Sales revenue is measured as the amount the entity expects to receive in exchange for goods
and services. The new model for the determination of revenue recognition is based on five steps,
whereby the contract with the customer and the individual performance obligations within the contract
are initially identified. The transaction price is then determined and allocated to the performance
obligations in the contract. Finally, sales are recognised for each performance obligation in the amount
of allocated portion of the transaction price as soon as the agreed-upon good or service has been
provided or the customer receives control over it. Principles are set out for determining whether the
goods or services have been provided over time or at one point in time. IFRS 15 (2014) becomes
effective for the first time for fiscal years starting on or after 1 January 2018.
IFRS 16 (2016) "Leases" replaces the previous regulations of IAS 17, IFRIC 4, SIC 15 and SIC 27. The
new standard introduces a single lessee accounting model. It requires a lessee to recognise assets and
liabilities for all leases with a term of more than twelve months, unless the underlying asset is of low
value. As for the lessor, the new standard substantially continues the lessor accounting requirements of
IAS 17. IFRS 16 (2016) is applicable for the first time for fiscal years that begin on or after 1 January
2019.
- 18 - In addition, the following changes exist, which are applicable for the first time for reporting years that begin
on or after 1 January 2017 or 1 January 2018, respectively:
Amendments to IAS 12 (2016) "Recognition of Deferred Tax Assets for Unrealised Losses"
Amendments to IAS 7 (2016) "Disclosure Initiative"
Annual Improvements to IFRS Standards 2014 - 2016 (2016)
Clarification of IFRS 15 (2016) "Revenues from Contracts with Customers"
Amendments to IFRS 2 (2016) "Classification and Measurement of Share-based Payments Trans-
actions"
Amendments to IFRS 4 (2016) "Applying IFRS 9 Financial Instruments with IFRS 4 Insurance Contracts"
IFRS Interpretation 22 (2016) "Foreign Currency Transactions and Advance Consideration"
Amendments to IAS 40 (2016) "Transfer of Investment Property"
We are currently reviewing what effects the new standards will have on the DEA Group’s consolidated
financial statements.
The following amendments to standards have been postponed for an undefined period of time:
Amendments to IFRS 10 and IAS 28 (2014) "Sale or Contribution of Assets between an Investor and its
Associate or Joint Venture".
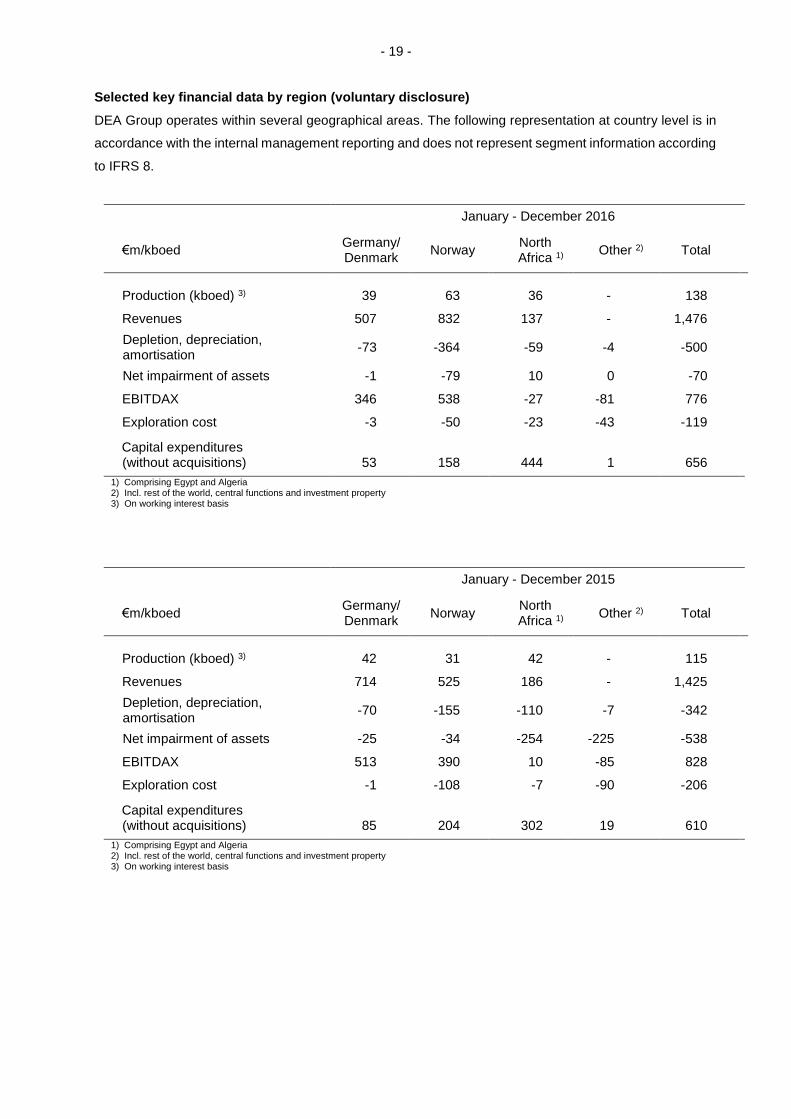
- 19 - Selected key financial data by region (voluntary disclosure)
DEA Group operates within several geographical areas. The following representation at country level is in
accordance with the internal management reporting and does not represent segment information according
to IFRS 8.
January - December 2016
€m/kboed Germany/ Denmark
Norway North
Africa 1) Other 2) Total
Production (kboed) 3) 39 63 36 - 138
Revenues 507 832 137 - 1,476
Depletion, depreciation, amortisation
-73 -364 -59 -4 -500
Net impairment of assets -1 -79 10 0 -70
EBITDAX 346 538 -27 -81 776
Exploration cost -3 -50 -23 -43 -119
Capital expenditures (without acquisitions)
53
158
444
1
656
1) Comprising Egypt and Algeria 2) Incl. rest of the world, central functions and investment property 3) On working interest basis
January - December 2015
€m/kboed Germany/ Denmark
Norway North
Africa 1) Other 2) Total
Production (kboed) 3) 42 31 42 - 115
Revenues 714 525 186 - 1,425
Depletion, depreciation, amortisation
-70 -155 -110 -7 -342
Net impairment of assets -25 -34 -254 -225 -538
EBITDAX 513 390 10 -85 828
Exploration cost -1 -108 -7 -90 -206
Capital expenditures (without acquisitions)
85
204
302
19
610
1) Comprising Egypt and Algeria 2) Incl. rest of the world, central functions and investment property 3) On working interest basis
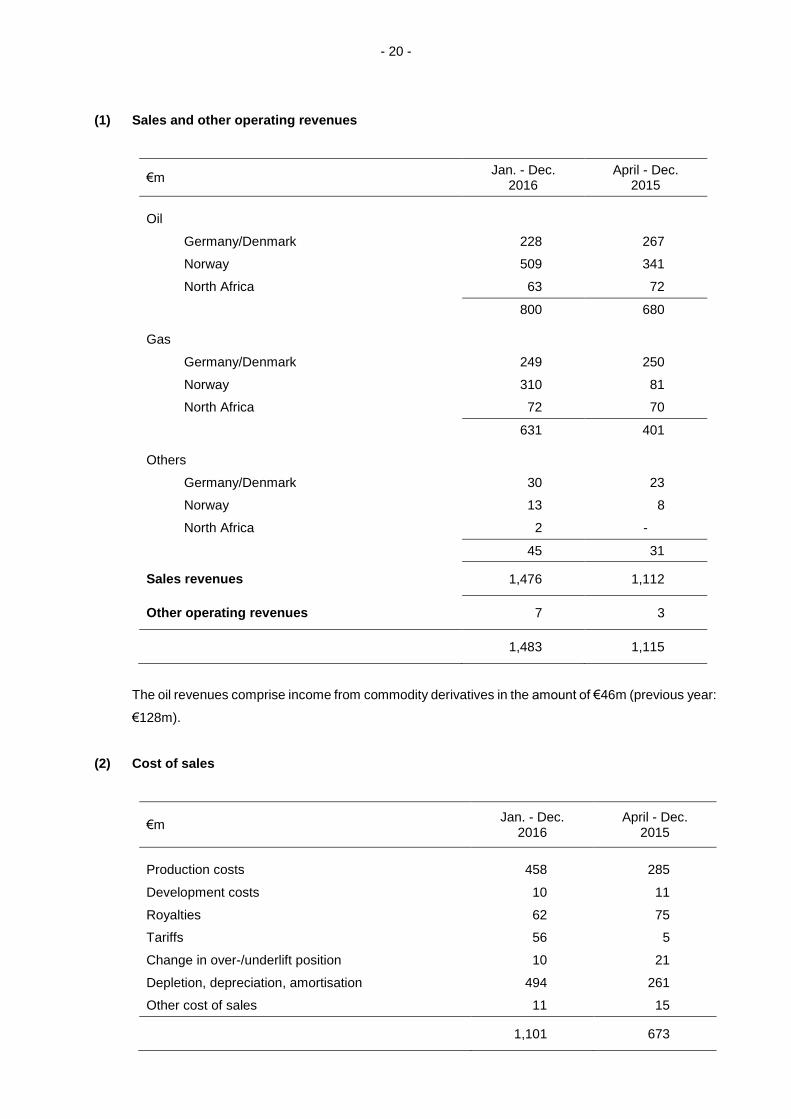
- 20 -
(1) Sales and other operating revenues
€m Jan. - Dec.
2016 April - Dec.
2015
Oil
Germany/Denmark 228 267
Norway 509 341
North Africa 63 72
800 680
Gas
Germany/Denmark 249 250
Norway 310 81
North Africa 72 70
631 401
Others
Germany/Denmark 30 23
Norway 13 8
North Africa 2 -
45 31
Sales revenues 1,476 1,112
Other operating revenues 7 3
1,483 1,115
The oil revenues comprise income from commodity derivatives in the amount of €46m (previous year:
€128m).
(2) Cost of sales
€m Jan. - Dec.
2016 April - Dec.
2015
Production costs 458 285
Development costs 10 11
Royalties 62 75
Tariffs 56 5
Change in over-/underlift position 10 21
Depletion, depreciation, amortisation 494 261
Other cost of sales 11 15
1,101 673
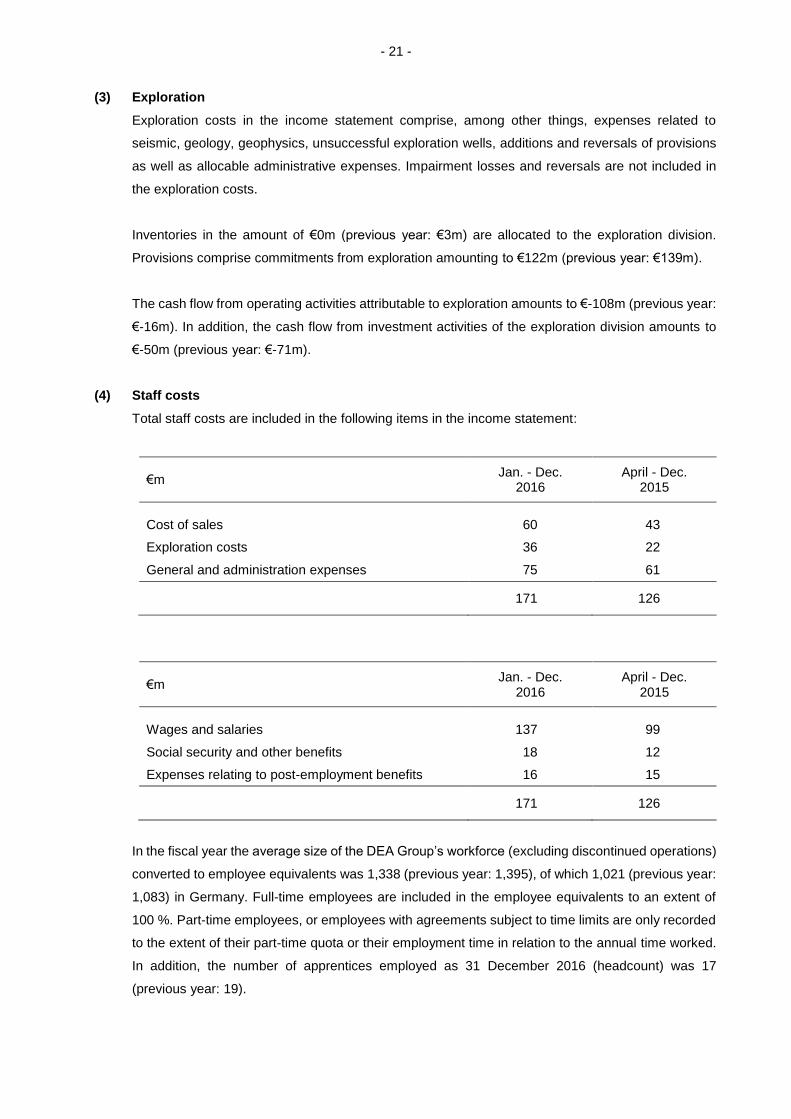
- 21 - (3) Exploration
Exploration costs in the income statement comprise, among other things, expenses related to
seismic, geology, geophysics, unsuccessful exploration wells, additions and reversals of provisions
as well as allocable administrative expenses. Impairment losses and reversals are not included in
the exploration costs.
Inventories in the amount of €0m (previous year: €3m) are allocated to the exploration division.
Provisions comprise commitments from exploration amounting to €122m (previous year: €139m).
The cash flow from operating activities attributable to exploration amounts to €-108m (previous year:
€-16m). In addition, the cash flow from investment activities of the exploration division amounts to
€-50m (previous year: €-71m).
(4) Staff costs
Total staff costs are included in the following items in the income statement:
€m Jan. - Dec.
2016 April - Dec.
2015
Cost of sales 60 43
Exploration costs 36 22
General and administration expenses 75 61
171 126
€m Jan. - Dec.
2016 April - Dec.
2015
Wages and salaries 137 99
Social security and other benefits 18 12
Expenses relating to post-employment benefits 16 15
171 126
In the fiscal year the average size of the DEA Group’s workforce (excluding discontinued operations)
converted to employee equivalents was 1,338 (previous year: 1,395), of which 1,021 (previous year:
1,083) in Germany. Full-time employees are included in the employee equivalents to an extent of
100 %. Part-time employees, or employees with agreements subject to time limits are only recorded
to the extent of their part-time quota or their employment time in relation to the annual time worked.
In addition, the number of apprentices employed as 31 December 2016 (headcount) was 17
(previous year: 19).
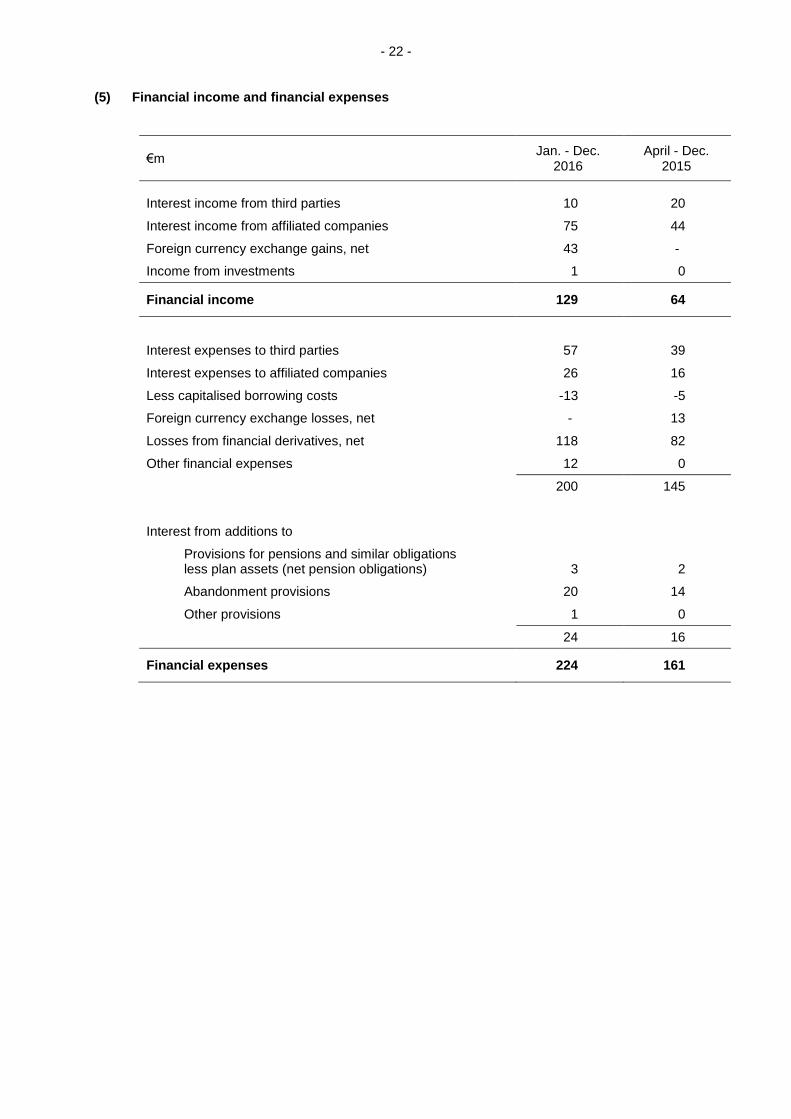
- 22 - (5) Financial income and financial expenses
€m Jan. - Dec.
2016 April - Dec.
2015
Interest income from third parties 10 20
Interest income from affiliated companies 75 44
Foreign currency exchange gains, net 43 -
Income from investments 1 0
Financial income 129 64
Interest expenses to third parties 57 39
Interest expenses to affiliated companies 26 16
Less capitalised borrowing costs -13 -5
Foreign currency exchange losses, net - 13
Losses from financial derivatives, net 118 82
Other financial expenses 12 0
200 145
Interest from additions to
Provisions for pensions and similar obligations less plan assets (net pension obligations)
3
2
Abandonment provisions 20 14
Other provisions 1 0
24 16
Financial expenses 224 161
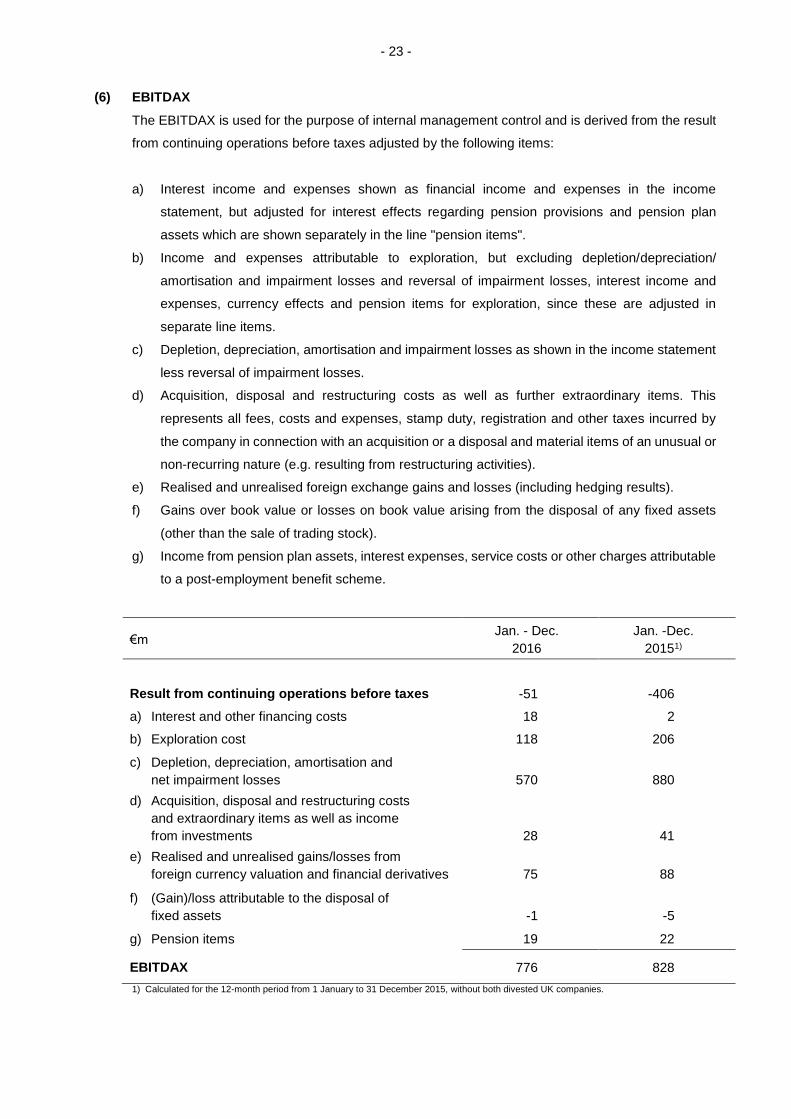
- 23 - (6) EBITDAX
The EBITDAX is used for the purpose of internal management control and is derived from the result
from continuing operations before taxes adjusted by the following items:
a) Interest income and expenses shown as financial income and expenses in the income
statement, but adjusted for interest effects regarding pension provisions and pension plan
assets which are shown separately in the line "pension items".
b) Income and expenses attributable to exploration, but excluding depletion/depreciation/
amortisation and impairment losses and reversal of impairment losses, interest income and
expenses, currency effects and pension items for exploration, since these are adjusted in
separate line items.
c) Depletion, depreciation, amortisation and impairment losses as shown in the income statement
less reversal of impairment losses.
d) Acquisition, disposal and restructuring costs as well as further extraordinary items. This
represents all fees, costs and expenses, stamp duty, registration and other taxes incurred by
the company in connection with an acquisition or a disposal and material items of an unusual or
non-recurring nature (e.g. resulting from restructuring activities).
e) Realised and unrealised foreign exchange gains and losses (including hedging results).
f) Gains over book value or losses on book value arising from the disposal of any fixed assets
(other than the sale of trading stock).
g) Income from pension plan assets, interest expenses, service costs or other charges attributable
to a post-employment benefit scheme.
€m Jan. - Dec.
2016
Jan. -Dec.
20151)
Result from continuing operations before taxes -51 -406
a) Interest and other financing costs 18 2
b) Exploration cost 118 206
c) Depletion, depreciation, amortisation and
net impairment losses
570
880
d) Acquisition, disposal and restructuring costs
and extraordinary items as well as income
from investments
28
41
e) Realised and unrealised gains/losses from
foreign currency valuation and financial derivatives
75
88
f) (Gain)/loss attributable to the disposal of
fixed assets
-1
-5
g) Pension items 19 22
EBITDAX 776 828
1) Calculated for the 12-month period from 1 January to 31 December 2015, without both divested UK companies.
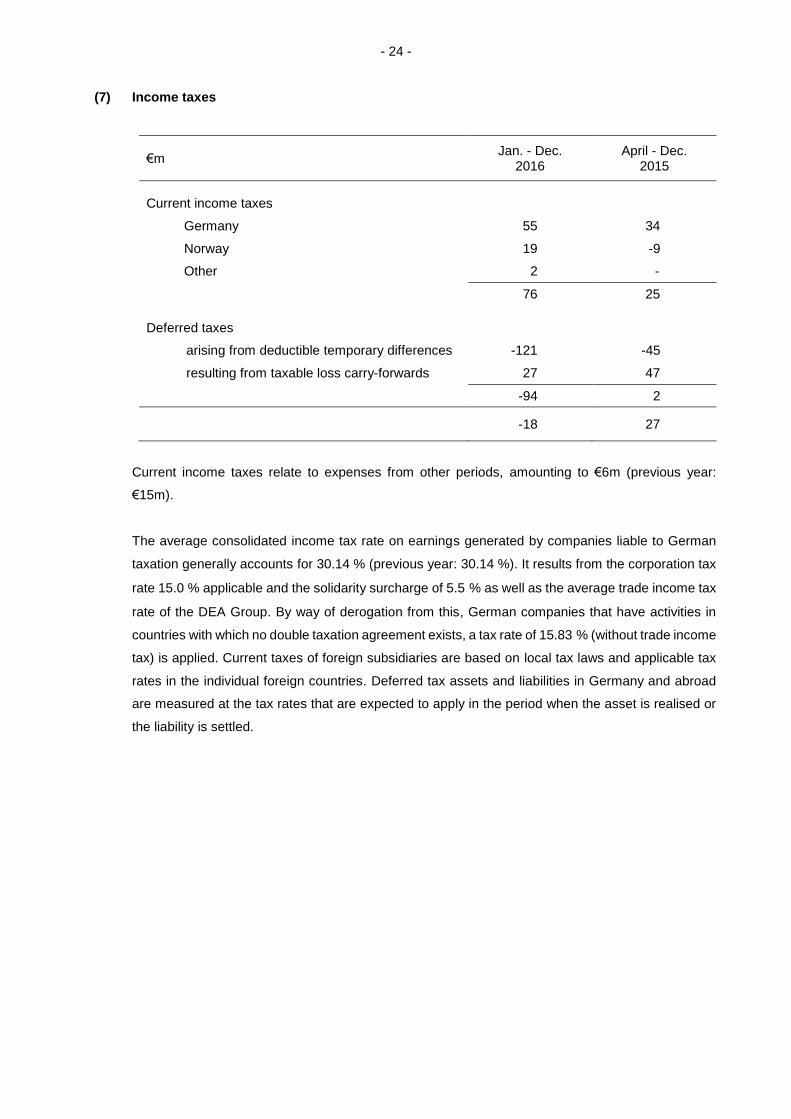
- 24 - (7) Income taxes
€m Jan. - Dec.
2016 April - Dec.
2015
Current income taxes
Germany 55 34
Norway 19 -9
Other 2 -
76 25
Deferred taxes
arising from deductible temporary differences -121 -45
resulting from taxable loss carry-forwards 27 47
-94 2
-18 27
Current income taxes relate to expenses from other periods, amounting to €6m (previous year:
€15m).
The average consolidated income tax rate on earnings generated by companies liable to German
taxation generally accounts for 30.14 % (previous year: 30.14 %). It results from the corporation tax
rate 15.0 % applicable and the solidarity surcharge of 5.5 % as well as the average trade income tax
rate of the DEA Group. By way of derogation from this, German companies that have activities in
countries with which no double taxation agreement exists, a tax rate of 15.83 % (without trade income
tax) is applied. Current taxes of foreign subsidiaries are based on local tax laws and applicable tax
rates in the individual foreign countries. Deferred tax assets and liabilities in Germany and abroad
are measured at the tax rates that are expected to apply in the period when the asset is realised or
the liability is settled.
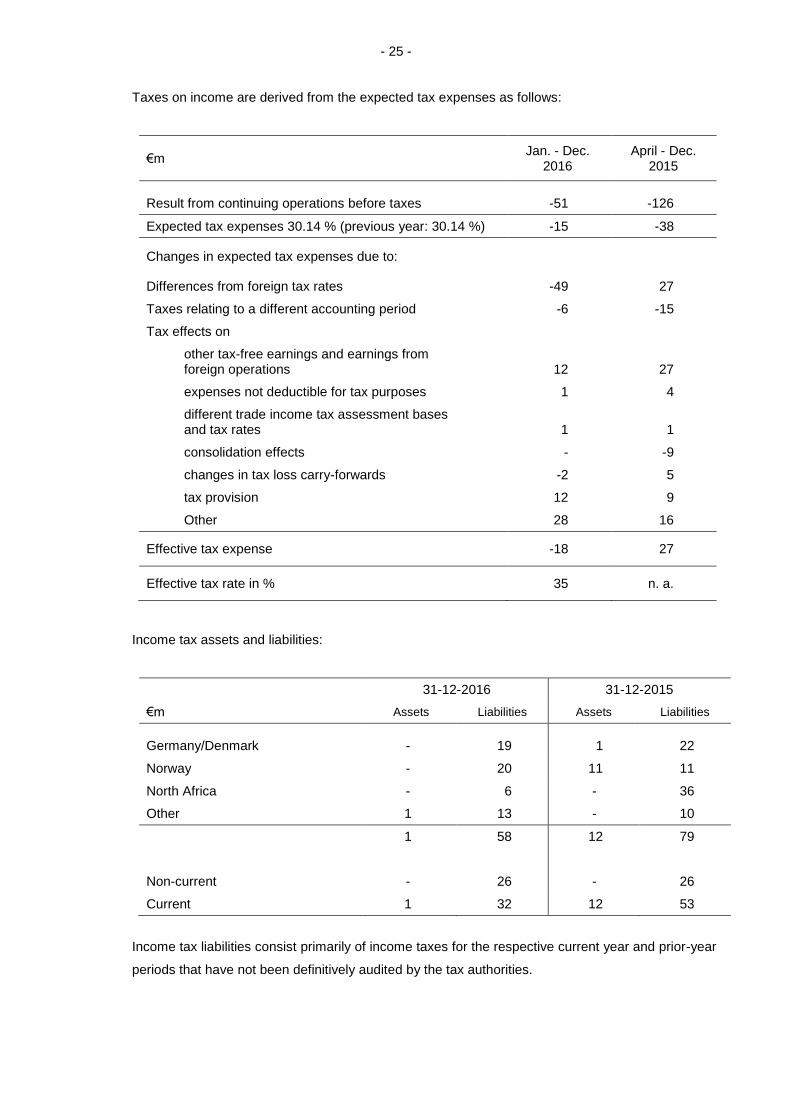
- 25 - Taxes on income are derived from the expected tax expenses as follows:
€m Jan. - Dec.
2016 April - Dec.
2015
Result from continuing operations before taxes -51 -126
Expected tax expenses 30.14 % (previous year: 30.14 %) -15 -38
Changes in expected tax expenses due to:
Differences from foreign tax rates -49 27
Taxes relating to a different accounting period -6 -15
Tax effects on
other tax-free earnings and earnings from foreign operations
12
27
expenses not deductible for tax purposes 1 4
different trade income tax assessment bases and tax rates
1
1
consolidation effects - -9
changes in tax loss carry-forwards -2 5
tax provision 12 9
Other 28 16
Effective tax expense -18 27
Effective tax rate in % 35 n. a.
Income tax assets and liabilities:
31-12-2016 31-12-2015
€m Assets Liabilities Assets Liabilities
Germany/Denmark - 19 1 22
Norway - 20 11 11
North Africa - 6 - 36
Other 1 13 - 10
1 58 12 79
Non-current - 26 - 26
Current 1 32 12 53
Income tax liabilities consist primarily of income taxes for the respective current year and prior-year
periods that have not been definitively audited by the tax authorities.
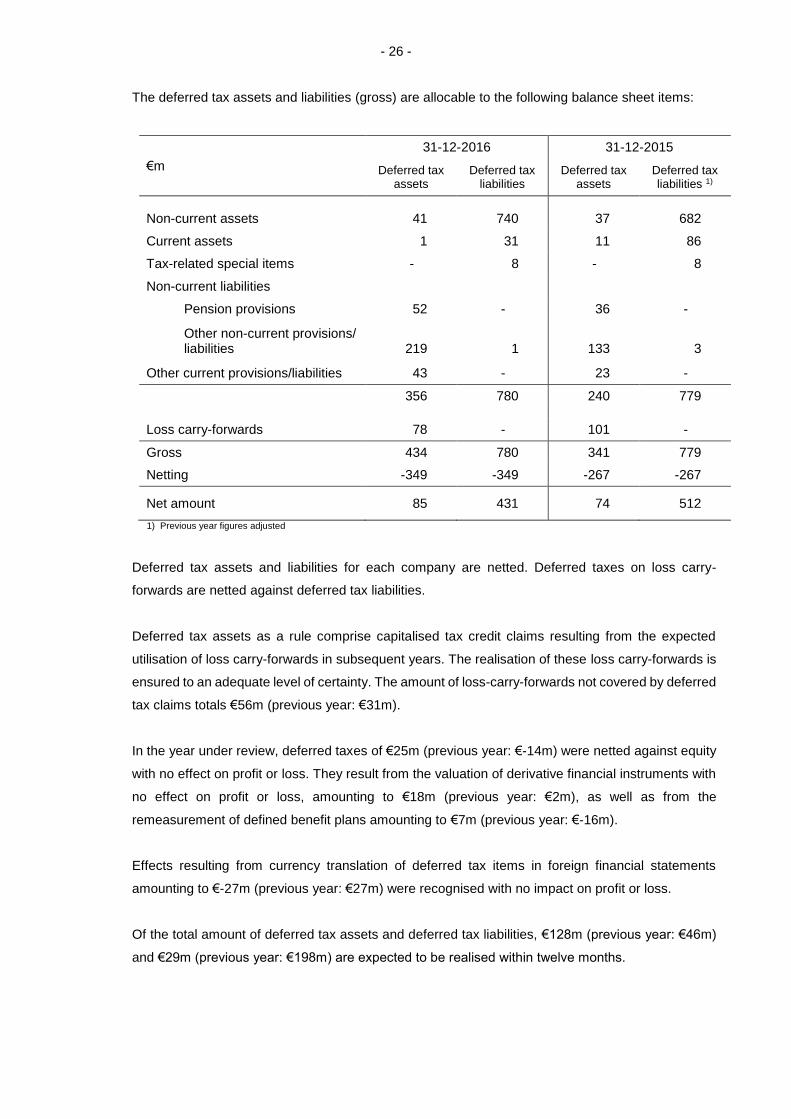
- 26 - The deferred tax assets and liabilities (gross) are allocable to the following balance sheet items:
€m
31-12-2016 31-12-2015
Deferred tax assets
Deferred tax liabilities
Deferred tax assets
Deferred tax liabilities 1)
Non-current assets 41 740 37 682
Current assets 1 31 11 86
Tax-related special items - 8 - 8
Non-current liabilities
Pension provisions 52 - 36 -
Other non-current provisions/ liabilities
219
1
133
3
Other current provisions/liabilities 43 - 23 -
356 780 240 779
Loss carry-forwards 78 - 101 -
Gross 434 780 341 779
Netting -349 -349 -267 -267
Net amount 85 431 74 512
1) Previous year figures adjusted
Deferred tax assets and liabilities for each company are netted. Deferred taxes on loss carry-
forwards are netted against deferred tax liabilities.
Deferred tax assets as a rule comprise capitalised tax credit claims resulting from the expected
utilisation of loss carry-forwards in subsequent years. The realisation of these loss carry-forwards is
ensured to an adequate level of certainty. The amount of loss-carry-forwards not covered by deferred
tax claims totals €56m (previous year: €31m).
In the year under review, deferred taxes of €25m (previous year: €-14m) were netted against equity
with no effect on profit or loss. They result from the valuation of derivative financial instruments with
no effect on profit or loss, amounting to €18m (previous year: €2m), as well as from the
remeasurement of defined benefit plans amounting to €7m (previous year: €-16m).
Effects resulting from currency translation of deferred tax items in foreign financial statements
amounting to €-27m (previous year: €27m) were recognised with no impact on profit or loss.
Of the total amount of deferred tax assets and deferred tax liabilities, €128m (previous year: €46m)
and €29m (previous year: €198m) are expected to be realised within twelve months.
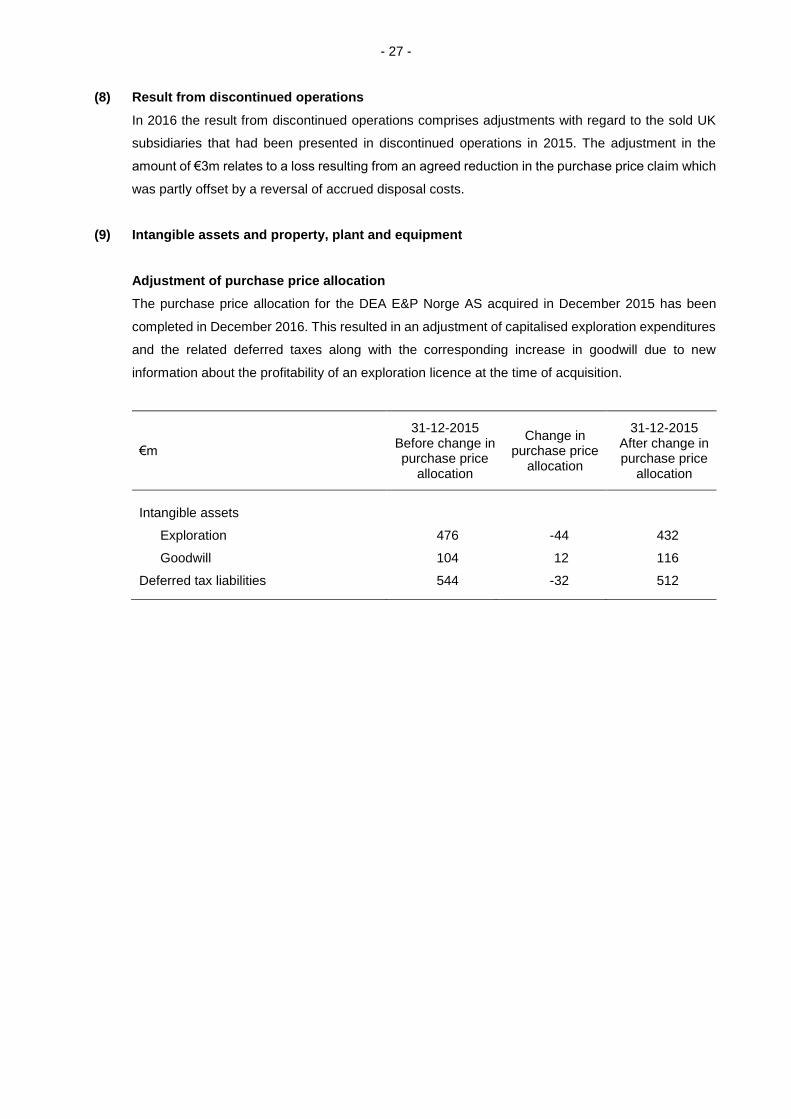
- 27 - (8) Result from discontinued operations
In 2016 the result from discontinued operations comprises adjustments with regard to the sold UK
subsidiaries that had been presented in discontinued operations in 2015. The adjustment in the
amount of €3m relates to a loss resulting from an agreed reduction in the purchase price claim which
was partly offset by a reversal of accrued disposal costs.
(9) Intangible assets and property, plant and equipment
Adjustment of purchase price allocation
The purchase price allocation for the DEA E&P Norge AS acquired in December 2015 has been
completed in December 2016. This resulted in an adjustment of capitalised exploration expenditures
and the related deferred taxes along with the corresponding increase in goodwill due to new
information about the profitability of an exploration licence at the time of acquisition.
€m
31-12-2015 Before change in purchase price
allocation
Change in purchase price
allocation
31-12-2015 After change in purchase price
allocation
Intangible assets
Exploration 476 -44 432
Goodwill 104 12 116
Deferred tax liabilities 544 -32 512
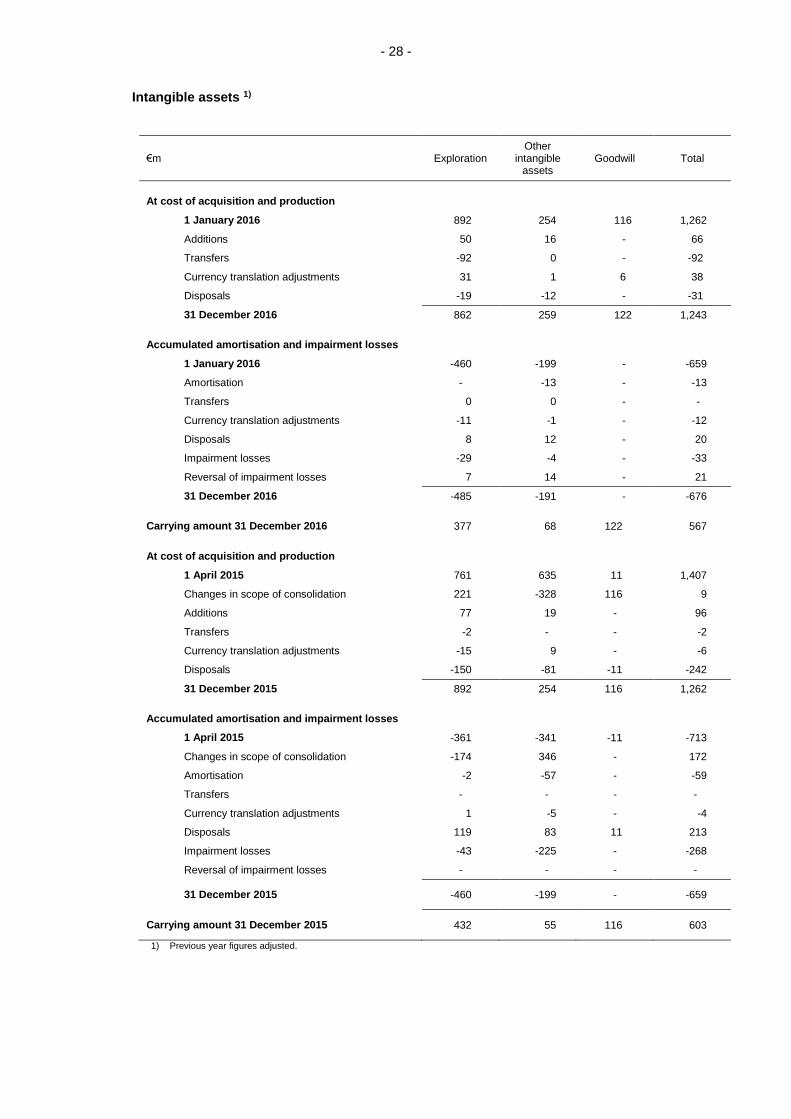
- 28 - Intangible assets 1)
€m Exploration Other
intangible assets
Goodwill Total
At cost of acquisition and production
1 January 2016 892 254 116 1,262
Additions 50 16 - 66
Transfers -92 0 - -92
Currency translation adjustments 31 1 6 38
Disposals -19 -12 - -31
31 December 2016 862 259 122 1,243
Accumulated amortisation and impairment losses
1 January 2016 -460 -199 - -659
Amortisation - -13 - -13
Transfers 0 0 - -
Currency translation adjustments -11 -1 - -12
Disposals 8 12 - 20
Impairment losses -29 -4 - -33
Reversal of impairment losses 7 14 - 21
31 December 2016 -485 -191 - -676
Carrying amount 31 December 2016 377 68 122 567
At cost of acquisition and production
1 April 2015 761 635 11 1,407
Changes in scope of consolidation 221 -328 116 9
Additions 77 19 - 96
Transfers -2 - - -2
Currency translation adjustments -15 9 - -6
Disposals -150 -81 -11 -242
31 December 2015 892 254 116 1,262
Accumulated amortisation and impairment losses
1 April 2015 -361 -341 -11 -713
Changes in scope of consolidation -174 346 - 172
Amortisation -2 -57 - -59
Transfers - - - -
Currency translation adjustments 1 -5 - -4
Disposals 119 83 11 213
Impairment losses -43 -225 - -268
Reversal of impairment losses - - - -
31 December 2015 -460 -199 - -659
Carrying amount 31 December 2015 432 55 116 603
1) Previous year figures adjusted.
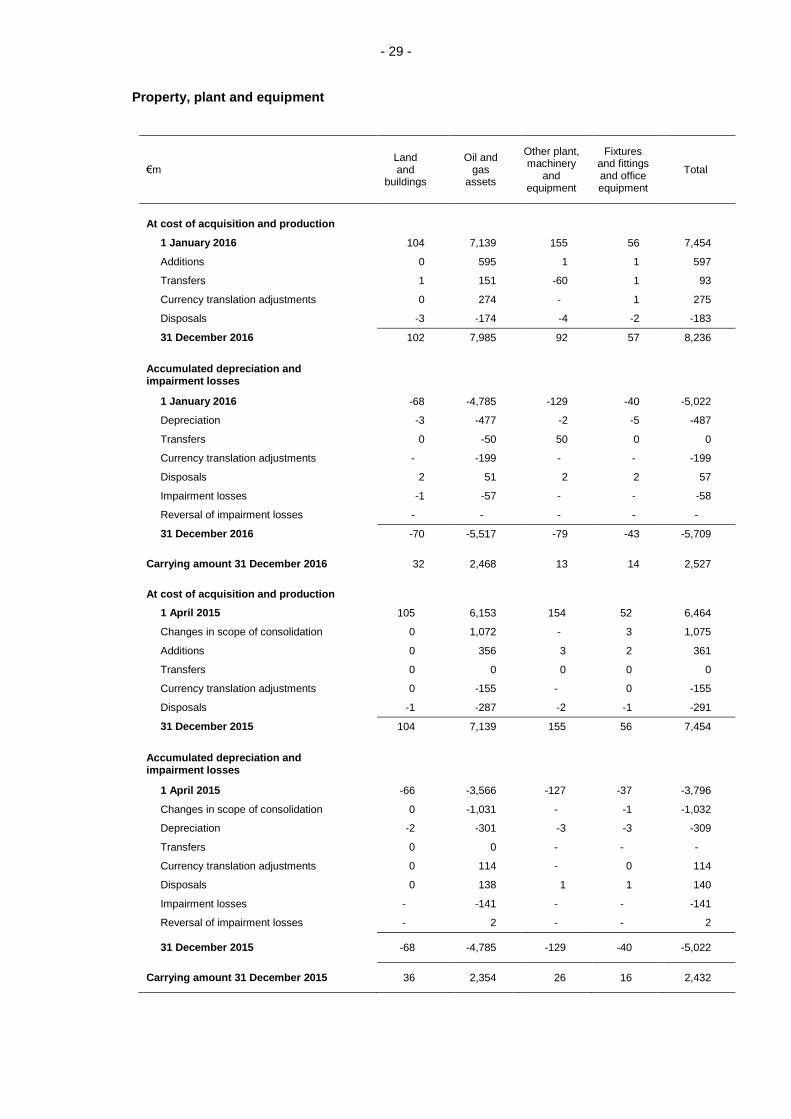
- 29 - Property, plant and equipment
€m Land and
buildings
Oil and gas
assets
Other plant, machinery
and equipment
Fixtures and fittings and office equipment
Total
At cost of acquisition and production
1 January 2016 104 7,139 155 56 7,454
Additions 0 595 1 1 597
Transfers 1 151 -60 1 93
Currency translation adjustments 0 274 - 1 275
Disposals -3 -174 -4 -2 -183
31 December 2016 102 7,985 92 57 8,236
Accumulated depreciation and impairment losses
1 January 2016 -68 -4,785 -129 -40 -5,022
Depreciation -3 -477 -2 -5 -487
Transfers 0 -50 50 0 0
Currency translation adjustments - -199 - - -199
Disposals 2 51 2 2 57
Impairment losses -1 -57 - - -58
Reversal of impairment losses - - - - -
31 December 2016 -70 -5,517 -79 -43 -5,709
Carrying amount 31 December 2016 32 2,468 13 14 2,527
At cost of acquisition and production
1 April 2015 105 6,153 154 52 6,464
Changes in scope of consolidation 0 1,072 - 3 1,075
Additions 0 356 3 2 361
Transfers 0 0 0 0 0
Currency translation adjustments 0 -155 - 0 -155
Disposals -1 -287 -2 -1 -291
31 December 2015 104 7,139 155 56 7,454
Accumulated depreciation and impairment losses
1 April 2015 -66 -3,566 -127 -37 -3,796
Changes in scope of consolidation 0 -1,031 - -1 -1,032
Depreciation -2 -301 -3 -3 -309
Transfers 0 0 - - -
Currency translation adjustments 0 114 - 0 114
Disposals 0 138 1 1 140
Impairment losses - -141 - - -141
Reversal of impairment losses - 2 - - 2
31 December 2015 -68 -4,785 -129 -40 -5,022
Carrying amount 31 December 2015 36 2,354 26 16 2,432
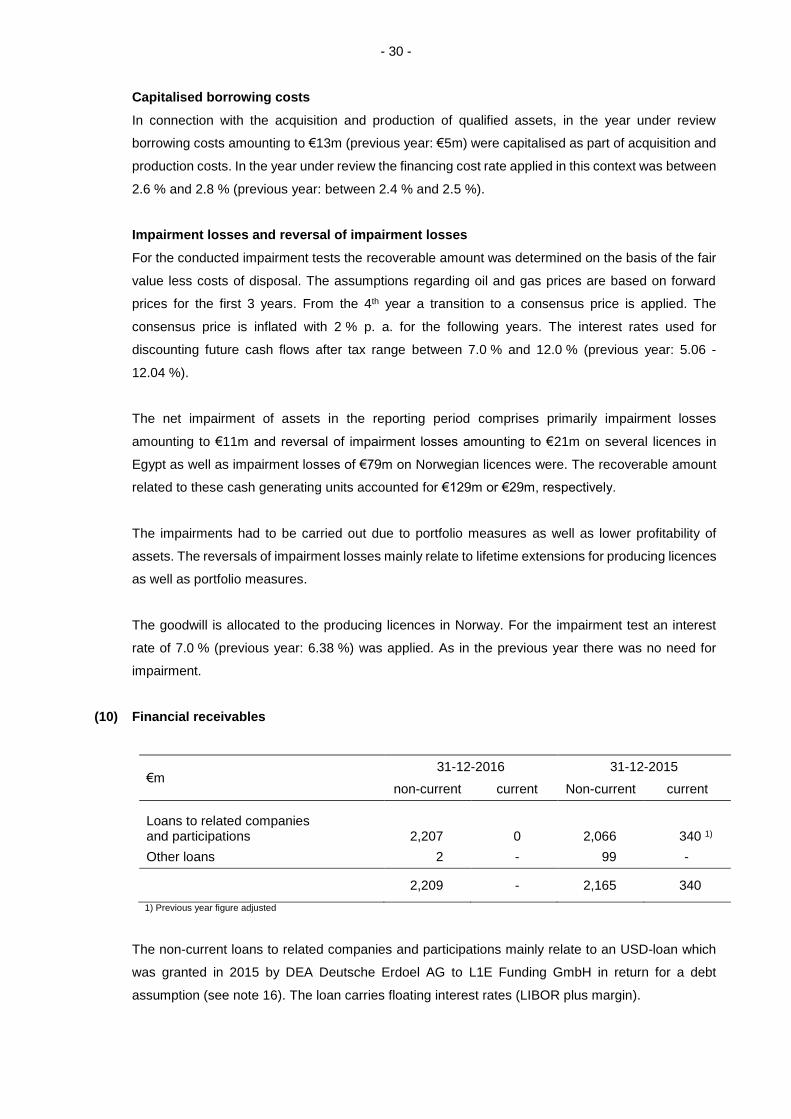
- 30 - Capitalised borrowing costs
In connection with the acquisition and production of qualified assets, in the year under review
borrowing costs amounting to €13m (previous year: €5m) were capitalised as part of acquisition and
production costs. In the year under review the financing cost rate applied in this context was between
2.6 % and 2.8 % (previous year: between 2.4 % and 2.5 %).
Impairment losses and reversal of impairment losses
For the conducted impairment tests the recoverable amount was determined on the basis of the fair
value less costs of disposal. The assumptions regarding oil and gas prices are based on forward
prices for the first 3 years. From the 4th year a transition to a consensus price is applied. The
consensus price is inflated with 2 % p. a. for the following years. The interest rates used for
discounting future cash flows after tax range between 7.0 % and 12.0 % (previous year: 5.06 -
12.04 %).
The net impairment of assets in the reporting period comprises primarily impairment losses
amounting to €11m and reversal of impairment losses amounting to €21m on several licences in
Egypt as well as impairment losses of €79m on Norwegian licences were. The recoverable amount
related to these cash generating units accounted for €129m or €29m, respectively.
The impairments had to be carried out due to portfolio measures as well as lower profitability of
assets. The reversals of impairment losses mainly relate to lifetime extensions for producing licences
as well as portfolio measures.
The goodwill is allocated to the producing licences in Norway. For the impairment test an interest
rate of 7.0 % (previous year: 6.38 %) was applied. As in the previous year there was no need for
impairment.
(10) Financial receivables
€m 31-12-2016 31-12-2015
non-current current Non-current current
Loans to related companies and participations
2,207
0
2,066
340 1)
Other loans 2 - 99 -
2,209 - 2,165 340
1) Previous year figure adjusted
The non-current loans to related companies and participations mainly relate to an USD-loan which
was granted in 2015 by DEA Deutsche Erdoel AG to L1E Funding GmbH in return for a debt
assumption (see note 16). The loan carries floating interest rates (LIBOR plus margin).
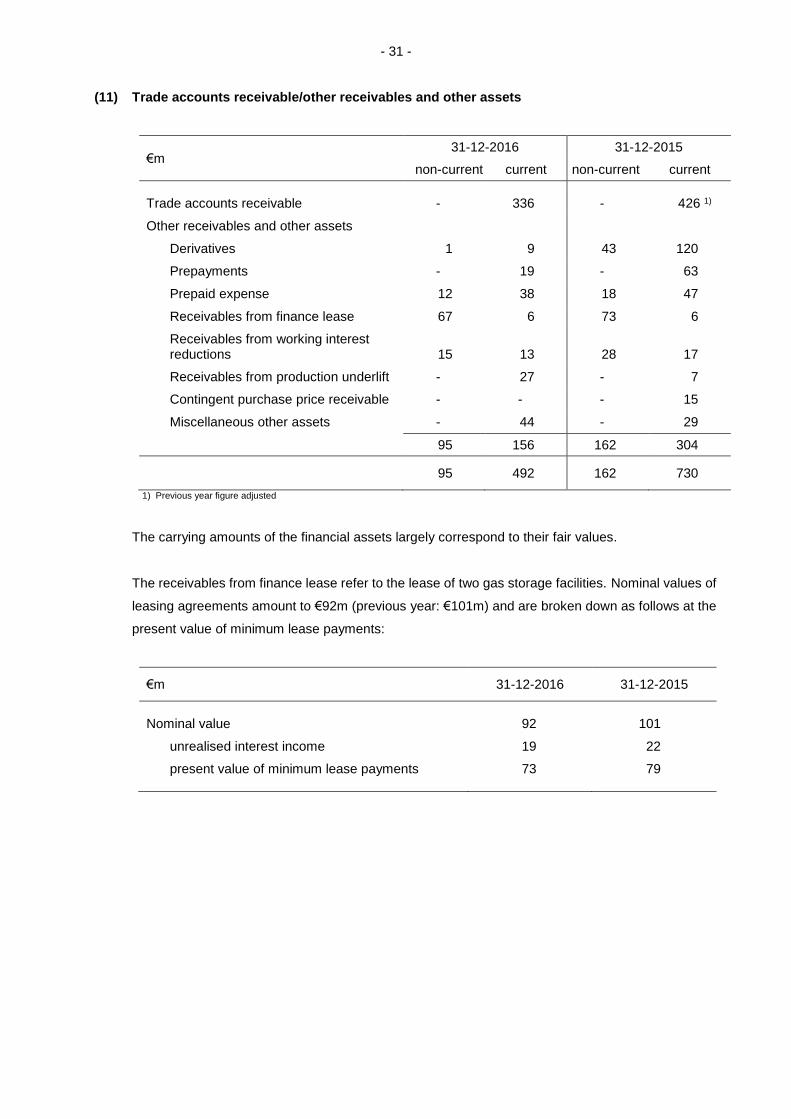
- 31 - (11) Trade accounts receivable/other receivables and other assets
€m 31-12-2016 31-12-2015
non-current current non-current current
Trade accounts receivable - 336 - 426 1)
Other receivables and other assets
Derivatives 1 9 43 120
Prepayments - 19 - 63
Prepaid expense 12 38 18 47
Receivables from finance lease 67 6 73 6
Receivables from working interest reductions
15
13
28
17
Receivables from production underlift - 27 - 7
Contingent purchase price receivable - - - 15
Miscellaneous other assets - 44 - 29
95 156 162 304
95 492 162 730
1) Previous year figure adjusted
The carrying amounts of the financial assets largely correspond to their fair values.
The receivables from finance lease refer to the lease of two gas storage facilities. Nominal values of
leasing agreements amount to €92m (previous year: €101m) and are broken down as follows at the
present value of minimum lease payments:
€m 31-12-2016 31-12-2015
Nominal value 92 101
unrealised interest income 19 22
present value of minimum lease payments 73 79
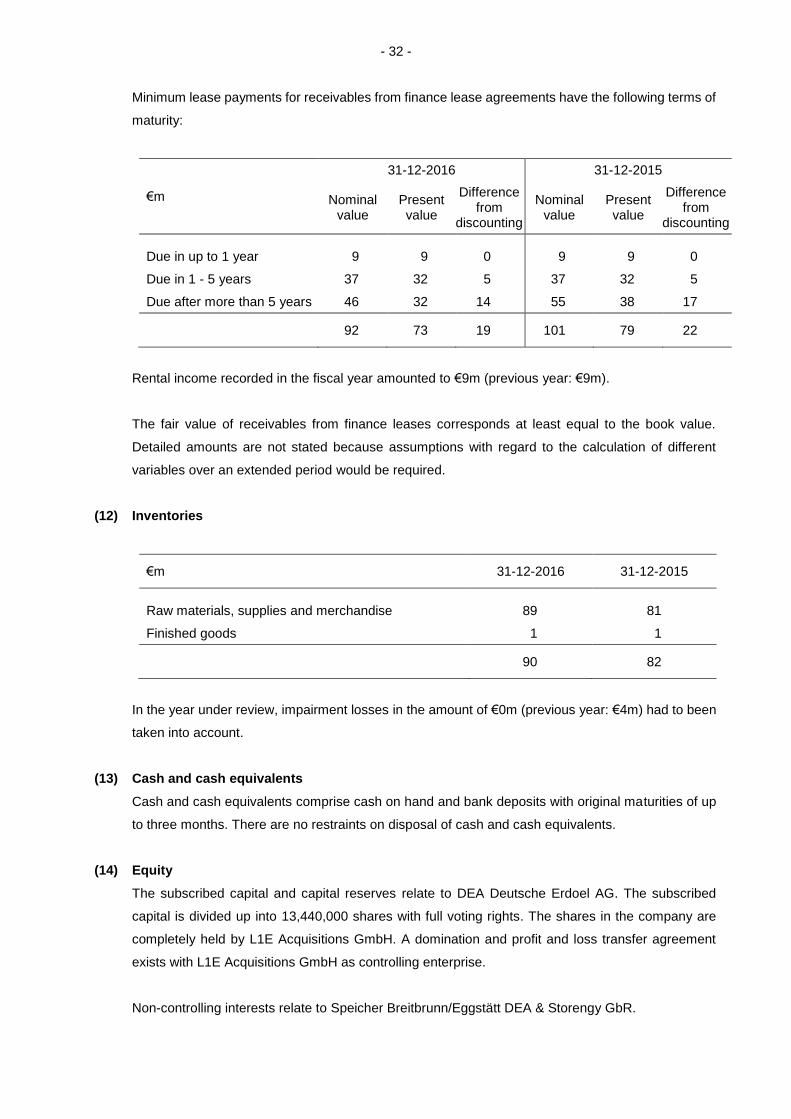
- 32 - Minimum lease payments for receivables from finance lease agreements have the following terms of
maturity:
€m
31-12-2016 31-12-2015
Nominal value
Present value
Difference from
discounting
Nominal value
Present value
Difference from
discounting
Due in up to 1 year 9 9 0 9 9 0
Due in 1 - 5 years 37 32 5 37 32 5
Due after more than 5 years 46 32 14 55 38 17
92 73 19 101 79 22
Rental income recorded in the fiscal year amounted to €9m (previous year: €9m).
The fair value of receivables from finance leases corresponds at least equal to the book value.
Detailed amounts are not stated because assumptions with regard to the calculation of different
variables over an extended period would be required.
(12) Inventories
€m 31-12-2016 31-12-2015
Raw materials, supplies and merchandise 89 81
Finished goods 1 1
90 82
In the year under review, impairment losses in the amount of €0m (previous year: €4m) had to been
taken into account.
(13) Cash and cash equivalents
Cash and cash equivalents comprise cash on hand and bank deposits with original maturities of up
to three months. There are no restraints on disposal of cash and cash equivalents.
(14) Equity
The subscribed capital and capital reserves relate to DEA Deutsche Erdoel AG. The subscribed
capital is divided up into 13,440,000 shares with full voting rights. The shares in the company are
completely held by L1E Acquisitions GmbH. A domination and profit and loss transfer agreement
exists with L1E Acquisitions GmbH as controlling enterprise.
Non-controlling interests relate to Speicher Breitbrunn/Eggstätt DEA & Storengy GbR.
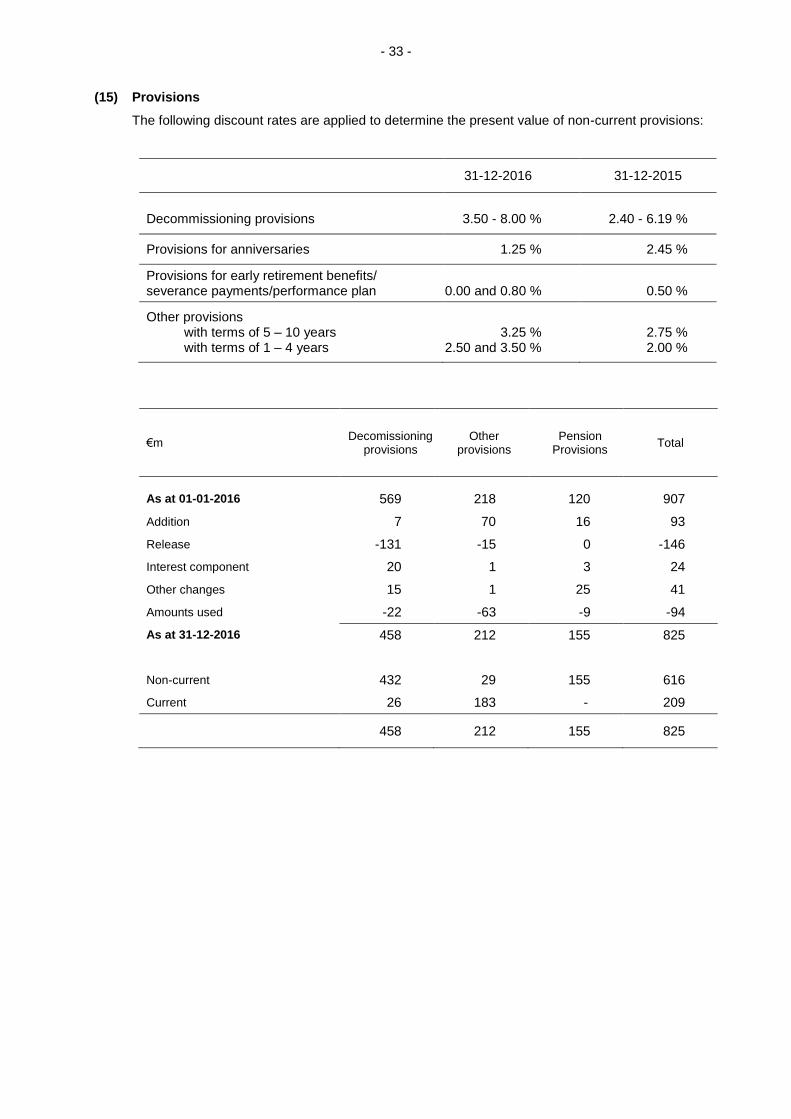
- 33 - (15) Provisions
The following discount rates are applied to determine the present value of non-current provisions:
31-12-2016 31-12-2015
Decommissioning provisions 3.50 - 8.00 % 2.40 - 6.19 %
Provisions for anniversaries 1.25 % 2.45 %
Provisions for early retirement benefits/ severance payments/performance plan
0.00 and 0.80 %
0.50 %
Other provisions with terms of 5 – 10 years with terms of 1 – 4 years
3.25 %
2.50 and 3.50 %
2.75 % 2.00 %
€m Decomissioning
provisions Other
provisions Pension
Provisions Total
As at 01-01-2016 569 218 120 907
Addition 7 70 16 93
Release -131 -15 0 -146
Interest component 20 1 3 24
Other changes 15 1 25 41
Amounts used -22 -63 -9 -94
As at 31-12-2016 458 212 155 825
Non-current 432 29 155 616
Current 26 183 - 209
458 212 155 825
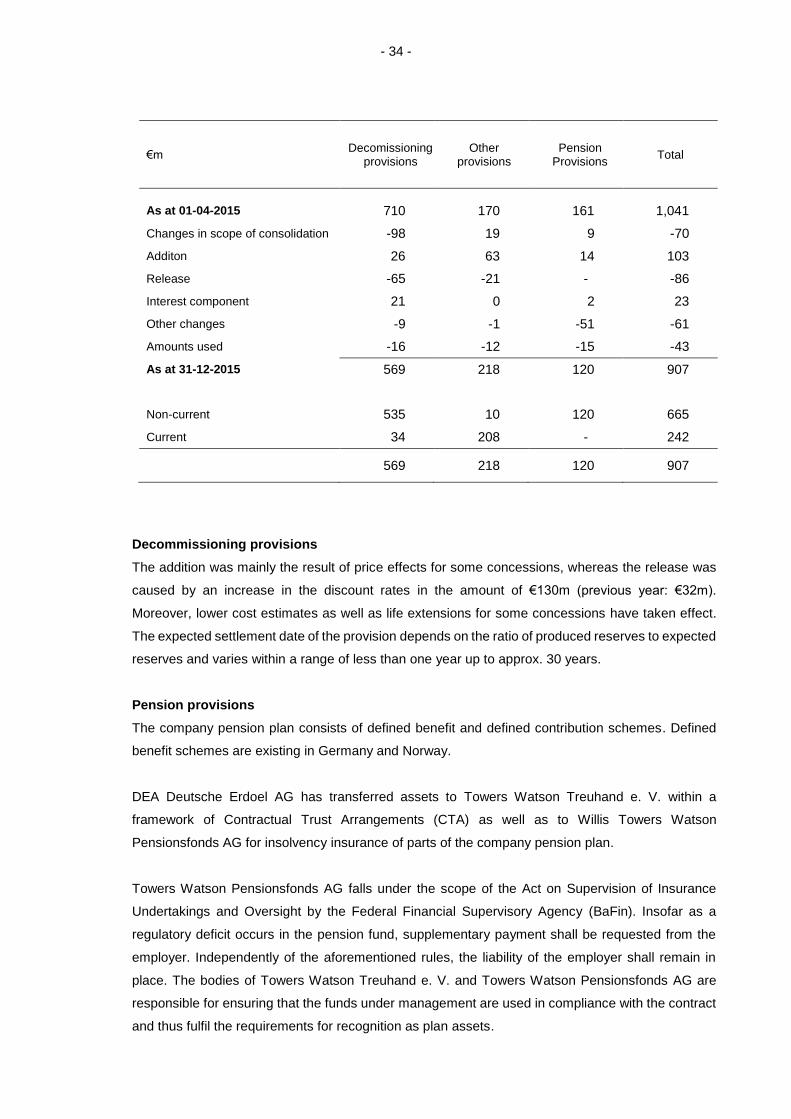
- 34 -
€m Decomissioning
provisions Other
provisions Pension
Provisions Total
As at 01-04-2015 710 170 161 1,041
Changes in scope of consolidation -98 19 9 -70
Additon 26 63 14 103
Release -65 -21 - -86
Interest component 21 0 2 23
Other changes -9 -1 -51 -61
Amounts used -16 -12 -15 -43
As at 31-12-2015 569 218 120 907
Non-current 535 10 120 665
Current 34 208 - 242
569 218 120 907
Decommissioning provisions
The addition was mainly the result of price effects for some concessions, whereas the release was
caused by an increase in the discount rates in the amount of €130m (previous year: €32m).
Moreover, lower cost estimates as well as life extensions for some concessions have taken effect.
The expected settlement date of the provision depends on the ratio of produced reserves to expected
reserves and varies within a range of less than one year up to approx. 30 years.
Pension provisions
The company pension plan consists of defined benefit and defined contribution schemes. Defined
benefit schemes are existing in Germany and Norway.
DEA Deutsche Erdoel AG has transferred assets to Towers Watson Treuhand e. V. within a
framework of Contractual Trust Arrangements (CTA) as well as to Willis Towers Watson
Pensionsfonds AG for insolvency insurance of parts of the company pension plan.
Towers Watson Pensionsfonds AG falls under the scope of the Act on Supervision of Insurance
Undertakings and Oversight by the Federal Financial Supervisory Agency (BaFin). Insofar as a
regulatory deficit occurs in the pension fund, supplementary payment shall be requested from the
employer. Independently of the aforementioned rules, the liability of the employer shall remain in
place. The bodies of Towers Watson Treuhand e. V. and Towers Watson Pensionsfonds AG are
responsible for ensuring that the funds under management are used in compliance with the contract
and thus fulfil the requirements for recognition as plan assets.
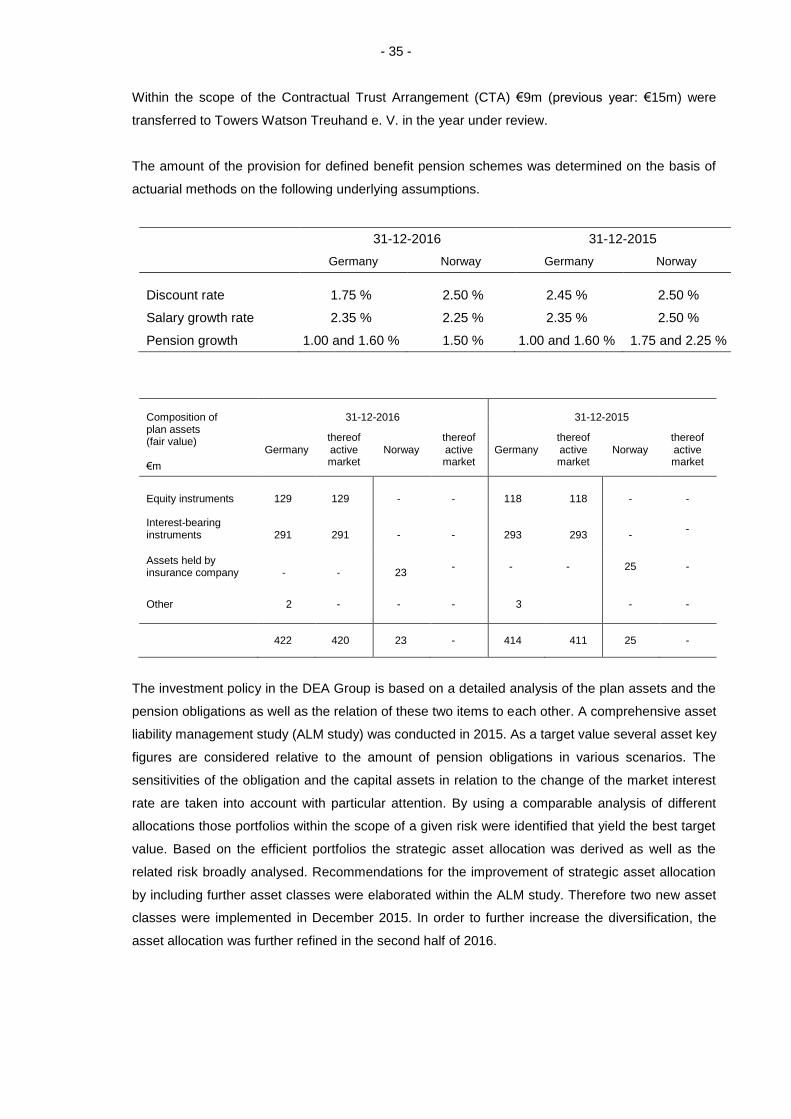
- 35 - Within the scope of the Contractual Trust Arrangement (CTA) €9m (previous year: €15m) were
transferred to Towers Watson Treuhand e. V. in the year under review.
The amount of the provision for defined benefit pension schemes was determined on the basis of
actuarial methods on the following underlying assumptions.
31-12-2016 31-12-2015
Germany Norway Germany Norway
Discount rate 1.75 % 2.50 % 2.45 % 2.50 %
Salary growth rate 2.35 % 2.25 % 2.35 % 2.50 %
Pension growth 1.00 and 1.60 % 1.50 % 1.00 and 1.60 % 1.75 and 2.25 %
Composition of plan assets (fair value) €m
31-12-2016
31-12-2015
Germany thereof active market
Norway thereof active market
Germany thereof active market
Norway thereof active market
Equity instruments 129 129 - - 118 118 - -
Interest-bearing instruments
291
291
-
-
293
293
-
-
Assets held by insurance company
-
-
23
- - - 25 -
Other 2 - - - 3 - -
422 420 23 - 414 411 25 -
The investment policy in the DEA Group is based on a detailed analysis of the plan assets and the
pension obligations as well as the relation of these two items to each other. A comprehensive asset
liability management study (ALM study) was conducted in 2015. As a target value several asset key
figures are considered relative to the amount of pension obligations in various scenarios. The
sensitivities of the obligation and the capital assets in relation to the change of the market interest
rate are taken into account with particular attention. By using a comparable analysis of different
allocations those portfolios within the scope of a given risk were identified that yield the best target
value. Based on the efficient portfolios the strategic asset allocation was derived as well as the
related risk broadly analysed. Recommendations for the improvement of strategic asset allocation
by including further asset classes were elaborated within the ALM study. Therefore two new asset
classes were implemented in December 2015. In order to further increase the diversification, the
asset allocation was further refined in the second half of 2016.
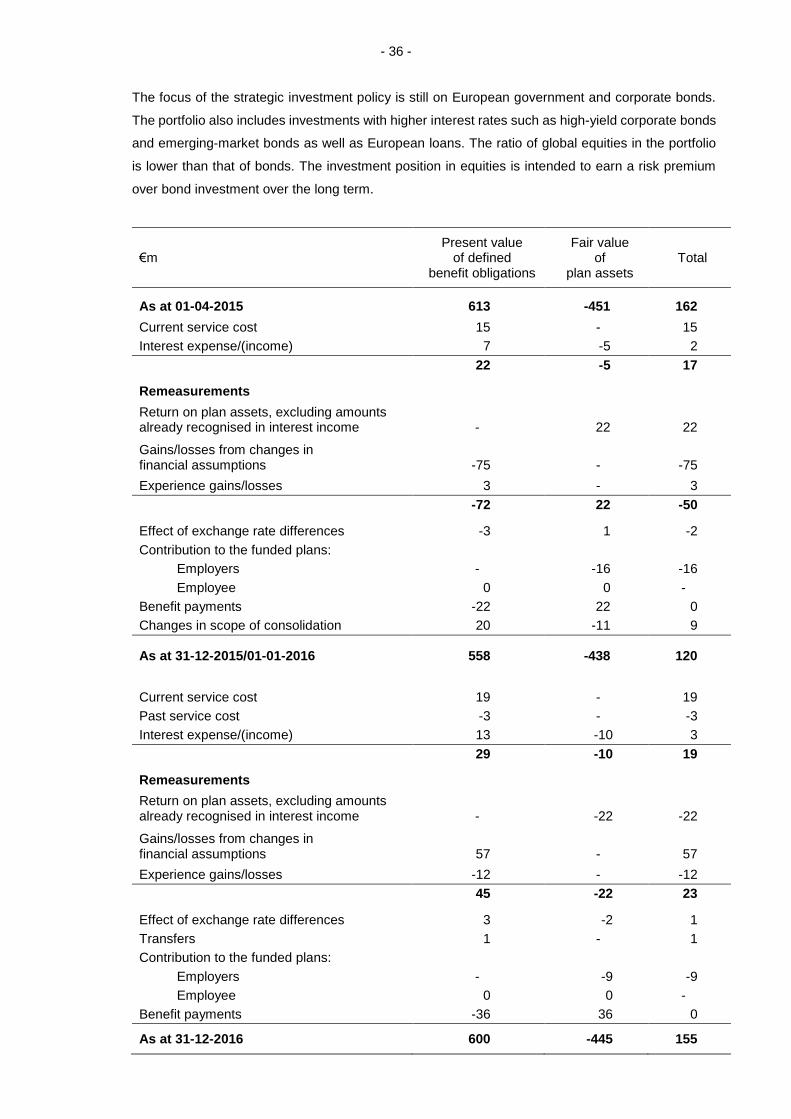
- 36 - The focus of the strategic investment policy is still on European government and corporate bonds.
The portfolio also includes investments with higher interest rates such as high-yield corporate bonds
and emerging-market bonds as well as European loans. The ratio of global equities in the portfolio
is lower than that of bonds. The investment position in equities is intended to earn a risk premium
over bond investment over the long term.
€m Present value
of defined benefit obligations
Fair value of
plan assets Total
As at 01-04-2015 613 -451 162
Current service cost 15 - 15
Interest expense/(income) 7 -5 2
22 -5 17
Remeasurements
Return on plan assets, excluding amounts already recognised in interest income
-
22
22
Gains/losses from changes in financial assumptions
-75
-
-75
Experience gains/losses 3 - 3
-72 22 -50
Effect of exchange rate differences -3 1 -2
Contribution to the funded plans:
Employers - -16 -16
Employee 0 0 -
Benefit payments -22 22 0
Changes in scope of consolidation 20 -11 9
As at 31-12-2015/01-01-2016 558 -438 120
Current service cost 19 - 19
Past service cost -3 - -3
Interest expense/(income) 13 -10 3
29 -10 19
Remeasurements
Return on plan assets, excluding amounts already recognised in interest income
-
-22
-22
Gains/losses from changes in financial assumptions
57
-
57
Experience gains/losses -12 - -12
45 -22 23
Effect of exchange rate differences 3 -2 1
Transfers 1 - 1
Contribution to the funded plans:
Employers - -9 -9
Employee 0 0 -
Benefit payments -36 36 0
As at 31-12-2016 600 -445 155
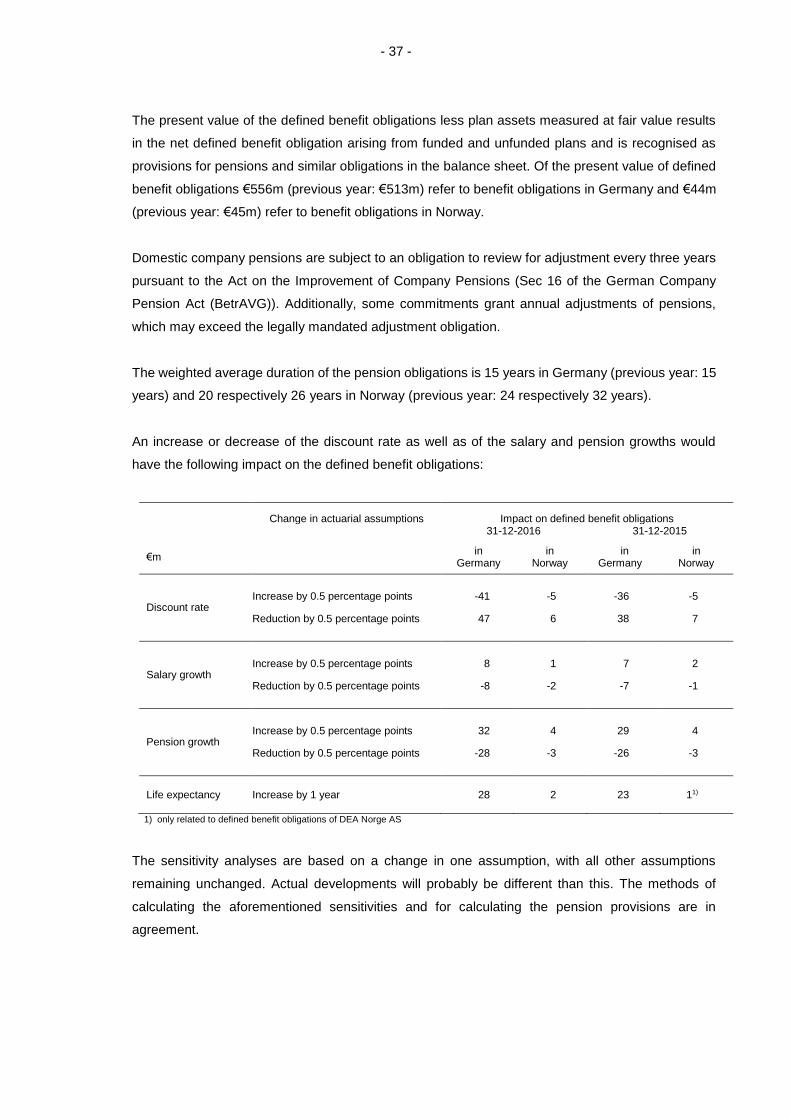
- 37 -
The present value of the defined benefit obligations less plan assets measured at fair value results
in the net defined benefit obligation arising from funded and unfunded plans and is recognised as
provisions for pensions and similar obligations in the balance sheet. Of the present value of defined
benefit obligations €556m (previous year: €513m) refer to benefit obligations in Germany and €44m
(previous year: €45m) refer to benefit obligations in Norway.
Domestic company pensions are subject to an obligation to review for adjustment every three years
pursuant to the Act on the Improvement of Company Pensions (Sec 16 of the German Company
Pension Act (BetrAVG)). Additionally, some commitments grant annual adjustments of pensions,
which may exceed the legally mandated adjustment obligation.
The weighted average duration of the pension obligations is 15 years in Germany (previous year: 15
years) and 20 respectively 26 years in Norway (previous year: 24 respectively 32 years).
An increase or decrease of the discount rate as well as of the salary and pension growths would
have the following impact on the defined benefit obligations:
Change in actuarial assumptions Impact on defined benefit obligations
31-12-2016 31-12-2015
€m in
Germany in
Norway in
Germany in
Norway
Discount rate Increase by 0.5 percentage points -41 -5 -36 -5
Reduction by 0.5 percentage points 47 6 38 7
Salary growth Increase by 0.5 percentage points 8 1 7 2
Reduction by 0.5 percentage points -8 -2 -7 -1
Pension growth Increase by 0.5 percentage points 32 4 29 4
Reduction by 0.5 percentage points -28 -3 -26 -3
Life expectancy Increase by 1 year 28 2 23 11)
1) only related to defined benefit obligations of DEA Norge AS
The sensitivity analyses are based on a change in one assumption, with all other assumptions
remaining unchanged. Actual developments will probably be different than this. The methods of
calculating the aforementioned sensitivities and for calculating the pension provisions are in
agreement.
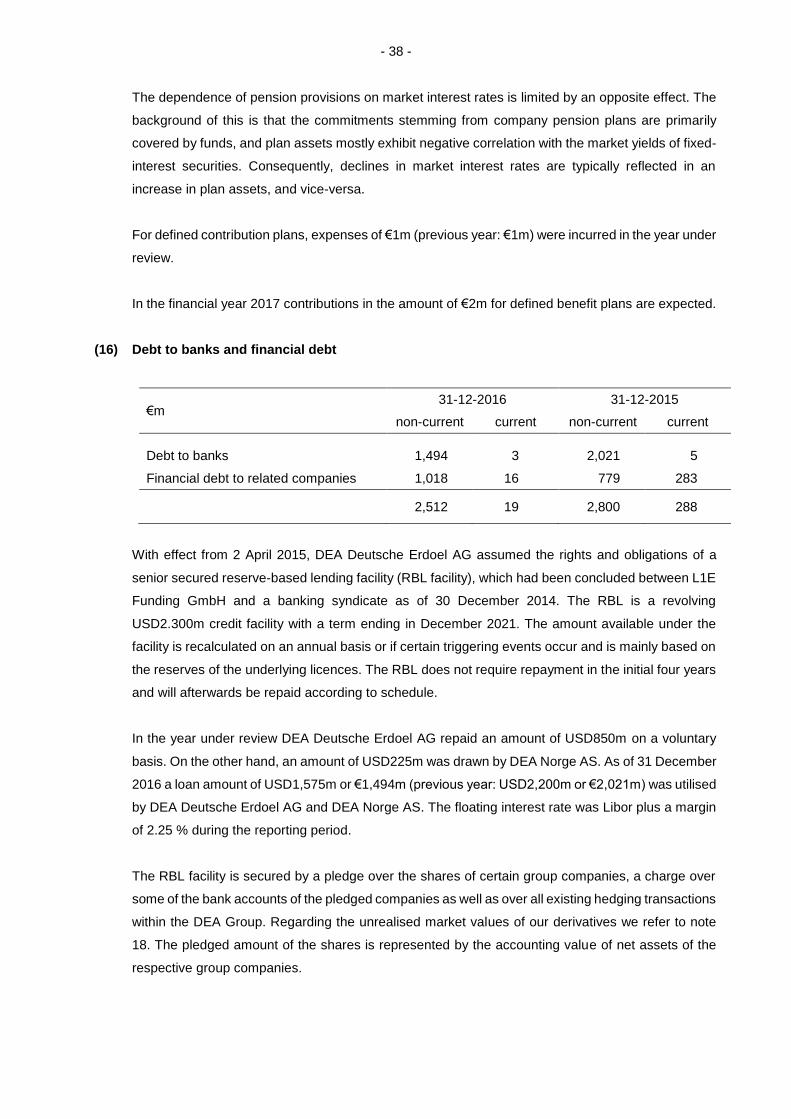
- 38 - The dependence of pension provisions on market interest rates is limited by an opposite effect. The
background of this is that the commitments stemming from company pension plans are primarily
covered by funds, and plan assets mostly exhibit negative correlation with the market yields of fixed-
interest securities. Consequently, declines in market interest rates are typically reflected in an
increase in plan assets, and vice-versa.
For defined contribution plans, expenses of €1m (previous year: €1m) were incurred in the year under
review.
In the financial year 2017 contributions in the amount of €2m for defined benefit plans are expected.
(16) Debt to banks and financial debt
€m 31-12-2016 31-12-2015
non-current current non-current current
Debt to banks 1,494 3 2,021 5
Financial debt to related companies 1,018 16 779 283
2,512 19 2,800 288
With effect from 2 April 2015, DEA Deutsche Erdoel AG assumed the rights and obligations of a
senior secured reserve-based lending facility (RBL facility), which had been concluded between L1E
Funding GmbH and a banking syndicate as of 30 December 2014. The RBL is a revolving
USD2.300m credit facility with a term ending in December 2021. The amount available under the
facility is recalculated on an annual basis or if certain triggering events occur and is mainly based on
the reserves of the underlying licences. The RBL does not require repayment in the initial four years
and will afterwards be repaid according to schedule.
In the year under review DEA Deutsche Erdoel AG repaid an amount of USD850m on a voluntary
basis. On the other hand, an amount of USD225m was drawn by DEA Norge AS. As of 31 December
2016 a loan amount of USD1,575m or €1,494m (previous year: USD2,200m or €2,021m) was utilised
by DEA Deutsche Erdoel AG and DEA Norge AS. The floating interest rate was Libor plus a margin
of 2.25 % during the reporting period.
The RBL facility is secured by a pledge over the shares of certain group companies, a charge over
some of the bank accounts of the pledged companies as well as over all existing hedging transactions
within the DEA Group. Regarding the unrealised market values of our derivatives we refer to note
18. The pledged amount of the shares is represented by the accounting value of net assets of the
respective group companies.
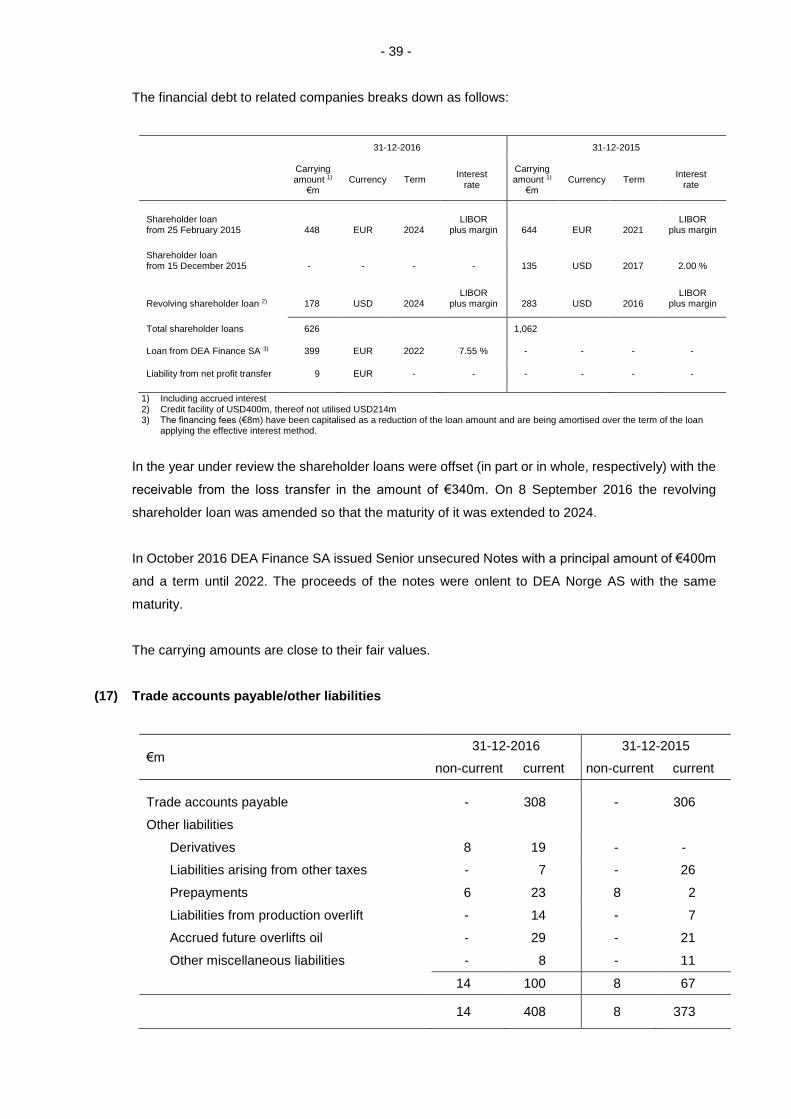
- 39 - The financial debt to related companies breaks down as follows:
31-12-2016 31-12-2015
Carrying amount 1)
€m Currency Term
Interest rate
Carrying amount 1)
€m Currency Term
Interest rate
Shareholder loan from 25 February 2015
448
EUR
2024
LIBOR plus margin
644
EUR
2021
LIBOR plus margin
Shareholder loan from 15 December 2015
-
-
-
-
135
USD
2017
2.00 %
Revolving shareholder loan 2)
178
USD
2024
LIBOR plus margin
283
USD
2016
LIBOR plus margin
Total shareholder loans 626 1,062
Loan from DEA Finance SA 3) 399 EUR 2022 7.55 % - - - -
Liability from net profit transfer 9 EUR - - - - - -
1) Including accrued interest 2) Credit facility of USD400m, thereof not utilised USD214m 3) The financing fees (€8m) have been capitalised as a reduction of the loan amount and are being amortised over the term of the loan applying the effective interest method.
In the year under review the shareholder loans were offset (in part or in whole, respectively) with the
receivable from the loss transfer in the amount of €340m. On 8 September 2016 the revolving
shareholder loan was amended so that the maturity of it was extended to 2024.
In October 2016 DEA Finance SA issued Senior unsecured Notes with a principal amount of €400m
and a term until 2022. The proceeds of the notes were onlent to DEA Norge AS with the same
maturity.
The carrying amounts are close to their fair values.
(17) Trade accounts payable/other liabilities
€m 31-12-2016 31-12-2015
non-current current non-current current
Trade accounts payable - 308 - 306
Other liabilities
Derivatives 8 19 - -
Liabilities arising from other taxes - 7 - 26
Prepayments 6 23 8 2
Liabilities from production overlift - 14 - 7
Accrued future overlifts oil - 29 - 21
Other miscellaneous liabilities - 8 - 11
14 100 8 67
14 408 8 373
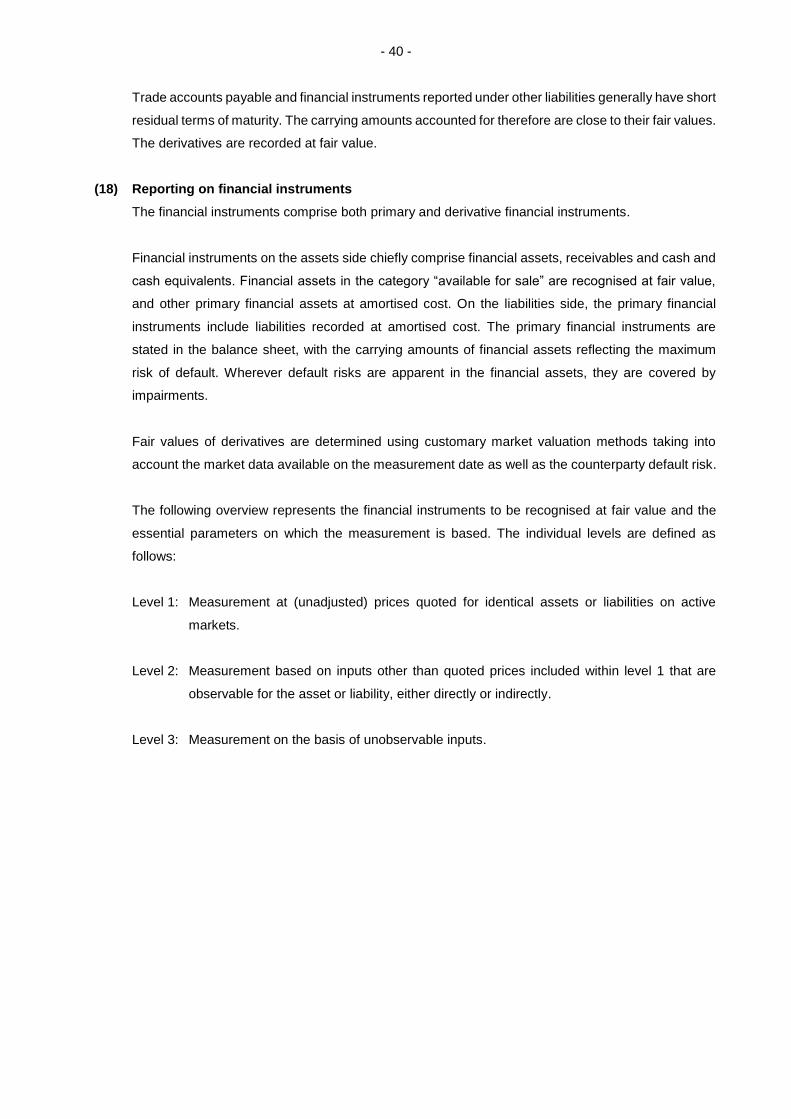
- 40 - Trade accounts payable and financial instruments reported under other liabilities generally have short
residual terms of maturity. The carrying amounts accounted for therefore are close to their fair values.
The derivatives are recorded at fair value.
(18) Reporting on financial instruments
The financial instruments comprise both primary and derivative financial instruments.
Financial instruments on the assets side chiefly comprise financial assets, receivables and cash and
cash equivalents. Financial assets in the category “available for sale” are recognised at fair value,
and other primary financial assets at amortised cost. On the liabilities side, the primary financial
instruments include liabilities recorded at amortised cost. The primary financial instruments are
stated in the balance sheet, with the carrying amounts of financial assets reflecting the maximum
risk of default. Wherever default risks are apparent in the financial assets, they are covered by
impairments.
Fair values of derivatives are determined using customary market valuation methods taking into
account the market data available on the measurement date as well as the counterparty default risk.
The following overview represents the financial instruments to be recognised at fair value and the
essential parameters on which the measurement is based. The individual levels are defined as
follows:
Level 1: Measurement at (unadjusted) prices quoted for identical assets or liabilities on active
markets.
Level 2: Measurement based on inputs other than quoted prices included within level 1 that are
observable for the asset or liability, either directly or indirectly.
Level 3: Measurement on the basis of unobservable inputs.
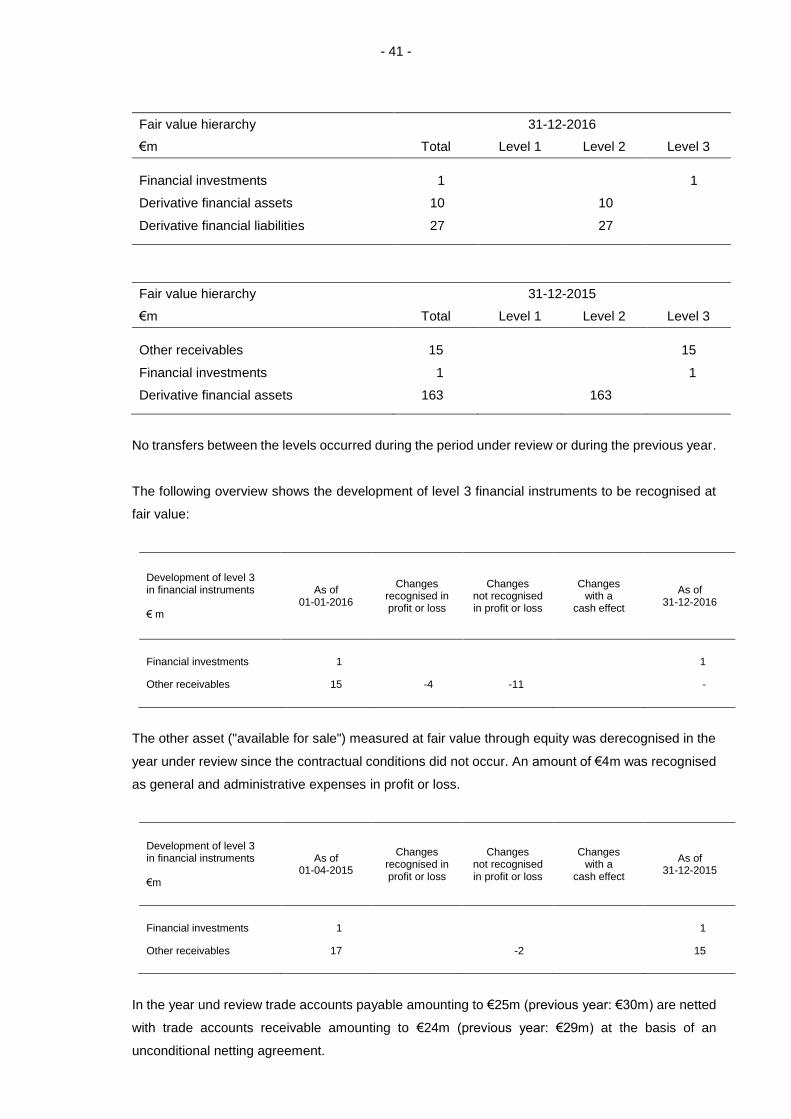
- 41 -
Fair value hierarchy 31-12-2016
€m Total Level 1 Level 2 Level 3
Financial investments 1 1
Derivative financial assets 10 10
Derivative financial liabilities 27 27
Fair value hierarchy 31-12-2015
€m Total Level 1 Level 2 Level 3
Other receivables 15 15
Financial investments 1 1
Derivative financial assets 163 163
No transfers between the levels occurred during the period under review or during the previous year.
The following overview shows the development of level 3 financial instruments to be recognised at
fair value:
Development of level 3 in financial instruments € m
As of 01-01-2016
Changes recognised in profit or loss
Changes not recognised in profit or loss
Changes with a
cash effect
As of 31-12-2016
Financial investments 1 1
Other receivables 15 -4 -11 -
The other asset ("available for sale") measured at fair value through equity was derecognised in the
year under review since the contractual conditions did not occur. An amount of €4m was recognised
as general and administrative expenses in profit or loss.
Development of level 3 in financial instruments €m
As of 01-04-2015
Changes recognised in profit or loss
Changes not recognised in profit or loss
Changes with a
cash effect
As of 31-12-2015
Financial investments 1 1
Other receivables 17 -2 15
In the year und review trade accounts payable amounting to €25m (previous year: €30m) are netted
with trade accounts receivable amounting to €24m (previous year: €29m) at the basis of an
unconditional netting agreement.
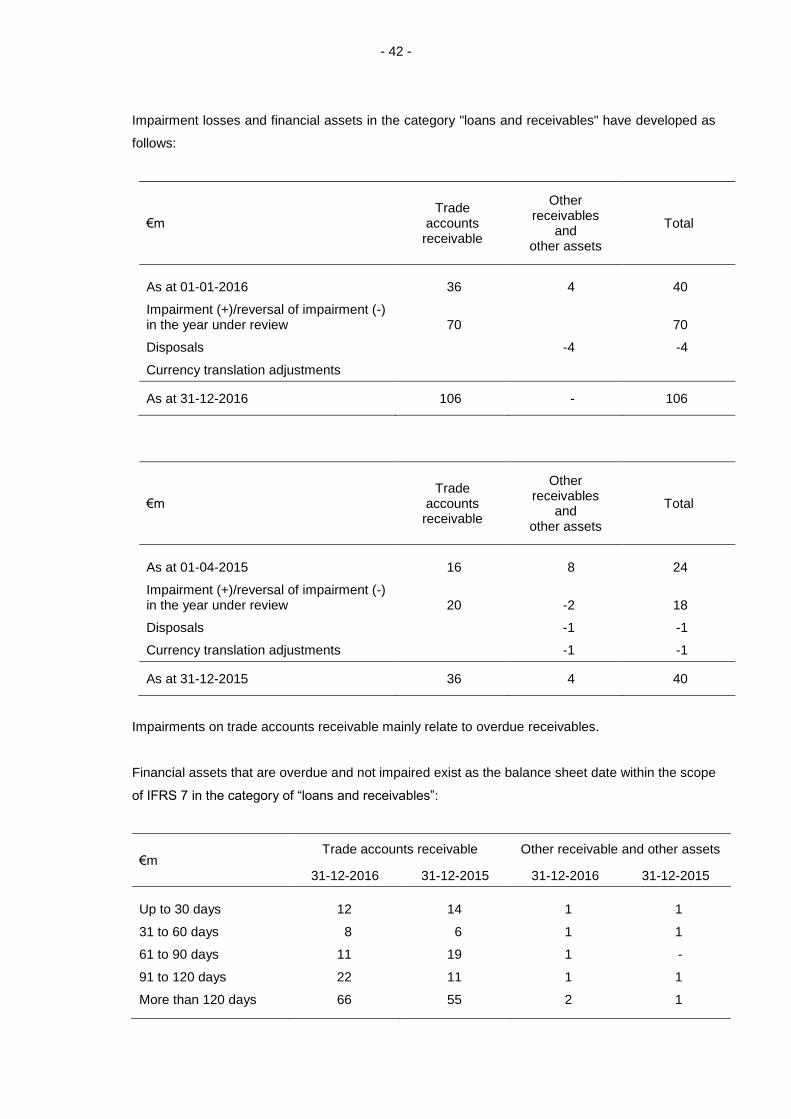
- 42 -
Impairment losses and financial assets in the category "loans and receivables" have developed as
follows:
€m Trade
accounts receivable
Other receivables
and other assets
Total
As at 01-01-2016 36 4 40
Impairment (+)/reversal of impairment (-) in the year under review
70
70
Disposals -4 -4
Currency translation adjustments
As at 31-12-2016 106 - 106
€m Trade
accounts receivable
Other receivables
and other assets
Total
As at 01-04-2015 16 8 24
Impairment (+)/reversal of impairment (-) in the year under review
20
-2
18
Disposals -1 -1
Currency translation adjustments -1 -1
As at 31-12-2015 36 4 40
Impairments on trade accounts receivable mainly relate to overdue receivables.
Financial assets that are overdue and not impaired exist as the balance sheet date within the scope
of IFRS 7 in the category of “loans and receivables”:
€m Trade accounts receivable Other receivable and other assets
31-12-2016 31-12-2015 31-12-2016 31-12-2015
Up to 30 days 12 14 1 1
31 to 60 days 8 6 1 1
61 to 90 days 11 19 1 -
91 to 120 days 22 11 1 1
More than 120 days 66 55 2 1
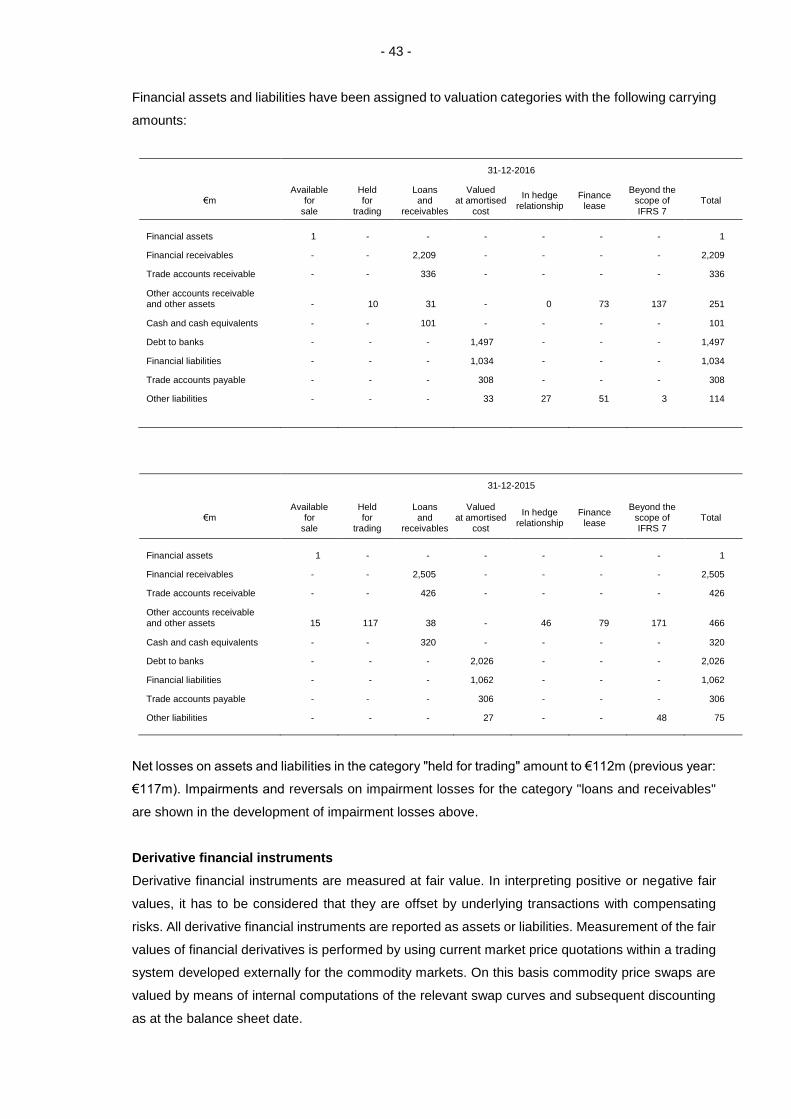
- 43 - Financial assets and liabilities have been assigned to valuation categories with the following carrying
amounts:
31-12-2016
€m Available
for sale
Held for
trading
Loans and
receivables
Valued at amortised
cost
In hedge relationship
Finance lease
Beyond the scope of IFRS 7
Total
Financial assets 1 - - - - - - 1
Financial receivables - - 2,209 - - - - 2,209
Trade accounts receivable - - 336 - - - - 336
Other accounts receivable and other assets
-
10
31
-
0
73
137
251
Cash and cash equivalents - - 101 - - - - 101
Debt to banks - - - 1,497 - - - 1,497
Financial liabilities - - - 1,034 - - - 1,034
Trade accounts payable - - - 308 - - - 308
Other liabilities - - - 33 27 51 3 114
31-12-2015
€m Available
for sale
Held for
trading
Loans and
receivables
Valued at amortised
cost
In hedge relationship
Finance lease
Beyond the scope of IFRS 7
Total
Financial assets 1 - - - - - - 1
Financial receivables - - 2,505 - - - - 2,505
Trade accounts receivable - - 426 - - - - 426
Other accounts receivable and other assets
15
117
38
-
46
79
171
466
Cash and cash equivalents - - 320 - - - - 320
Debt to banks - - - 2,026 - - - 2,026
Financial liabilities - - - 1,062 - - - 1,062
Trade accounts payable - - - 306 - - - 306
Other liabilities - - - 27 - - 48 75
Net losses on assets and liabilities in the category "held for trading" amount to €112m (previous year:
€117m). Impairments and reversals on impairment losses for the category "loans and receivables"
are shown in the development of impairment losses above.
Derivative financial instruments
Derivative financial instruments are measured at fair value. In interpreting positive or negative fair
values, it has to be considered that they are offset by underlying transactions with compensating
risks. All derivative financial instruments are reported as assets or liabilities. Measurement of the fair
values of financial derivatives is performed by using current market price quotations within a trading
system developed externally for the commodity markets. On this basis commodity price swaps are
valued by means of internal computations of the relevant swap curves and subsequent discounting
as at the balance sheet date.
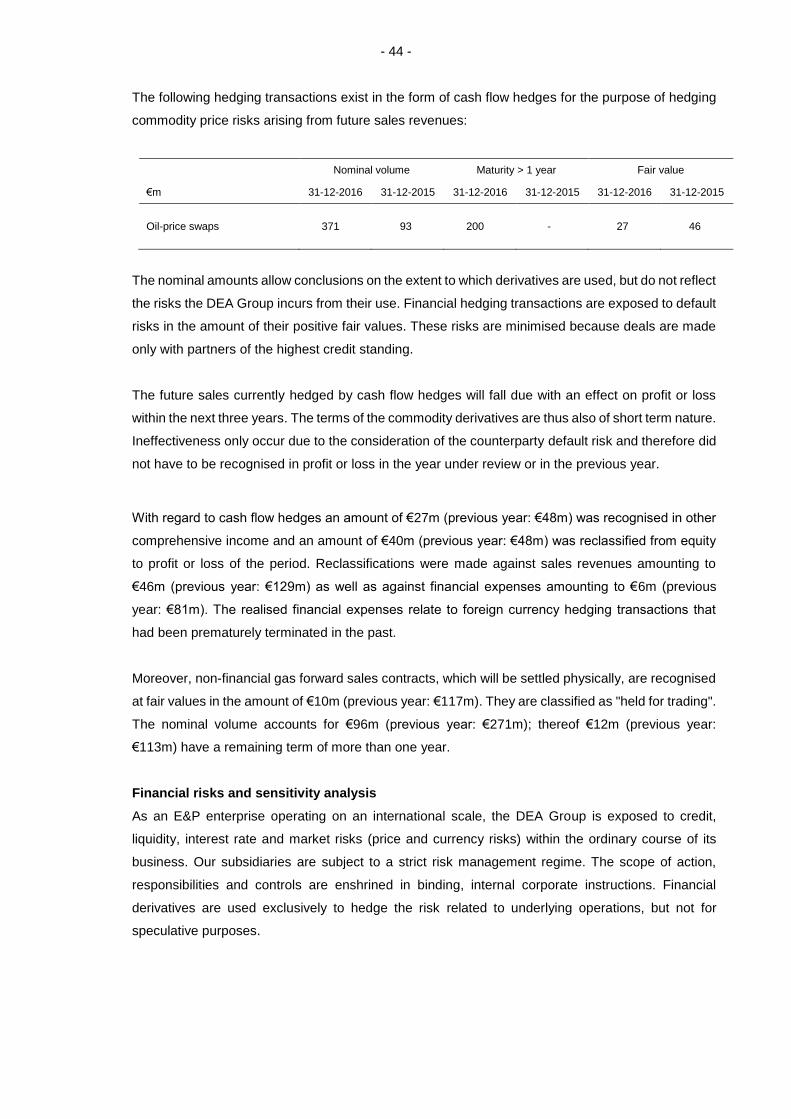
- 44 - The following hedging transactions exist in the form of cash flow hedges for the purpose of hedging
commodity price risks arising from future sales revenues:
Nominal volume Maturity > 1 year Fair value
€m 31-12-2016 31-12-2015 31-12-2016 31-12-2015 31-12-2016 31-12-2015
Oil-price swaps 371 93 200 - 27 46
The nominal amounts allow conclusions on the extent to which derivatives are used, but do not reflect
the risks the DEA Group incurs from their use. Financial hedging transactions are exposed to default
risks in the amount of their positive fair values. These risks are minimised because deals are made
only with partners of the highest credit standing.
The future sales currently hedged by cash flow hedges will fall due with an effect on profit or loss
within the next three years. The terms of the commodity derivatives are thus also of short term nature.
Ineffectiveness only occur due to the consideration of the counterparty default risk and therefore did
not have to be recognised in profit or loss in the year under review or in the previous year.
With regard to cash flow hedges an amount of €27m (previous year: €48m) was recognised in other
comprehensive income and an amount of €40m (previous year: €48m) was reclassified from equity
to profit or loss of the period. Reclassifications were made against sales revenues amounting to
€46m (previous year: €129m) as well as against financial expenses amounting to €6m (previous
year: €81m). The realised financial expenses relate to foreign currency hedging transactions that
had been prematurely terminated in the past.
Moreover, non-financial gas forward sales contracts, which will be settled physically, are recognised
at fair values in the amount of €10m (previous year: €117m). They are classified as "held for trading".
The nominal volume accounts for €96m (previous year: €271m); thereof €12m (previous year:
€113m) have a remaining term of more than one year.
Financial risks and sensitivity analysis
As an E&P enterprise operating on an international scale, the DEA Group is exposed to credit,
liquidity, interest rate and market risks (price and currency risks) within the ordinary course of its
business. Our subsidiaries are subject to a strict risk management regime. The scope of action,
responsibilities and controls are enshrined in binding, internal corporate instructions. Financial
derivatives are used exclusively to hedge the risk related to underlying operations, but not for
speculative purposes.
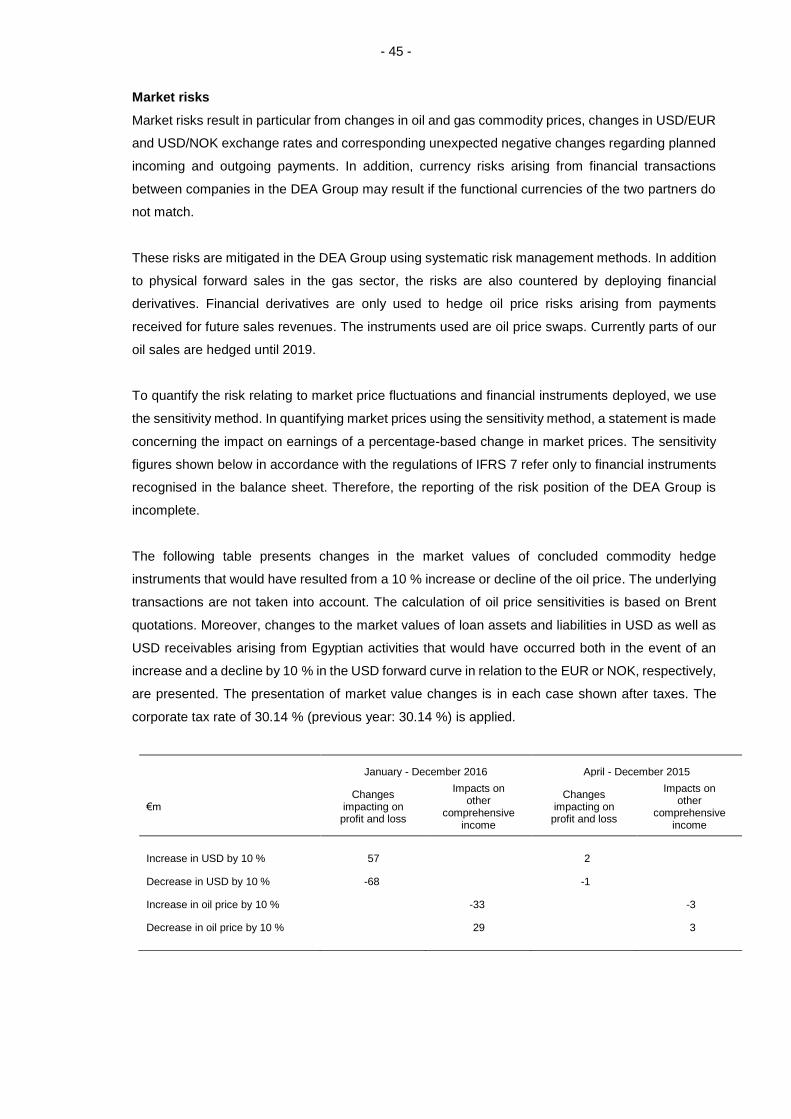
- 45 - Market risks
Market risks result in particular from changes in oil and gas commodity prices, changes in USD/EUR
and USD/NOK exchange rates and corresponding unexpected negative changes regarding planned
incoming and outgoing payments. In addition, currency risks arising from financial transactions
between companies in the DEA Group may result if the functional currencies of the two partners do
not match.
These risks are mitigated in the DEA Group using systematic risk management methods. In addition
to physical forward sales in the gas sector, the risks are also countered by deploying financial
derivatives. Financial derivatives are only used to hedge oil price risks arising from payments
received for future sales revenues. The instruments used are oil price swaps. Currently parts of our
oil sales are hedged until 2019.
To quantify the risk relating to market price fluctuations and financial instruments deployed, we use
the sensitivity method. In quantifying market prices using the sensitivity method, a statement is made
concerning the impact on earnings of a percentage-based change in market prices. The sensitivity
figures shown below in accordance with the regulations of IFRS 7 refer only to financial instruments
recognised in the balance sheet. Therefore, the reporting of the risk position of the DEA Group is
incomplete.
The following table presents changes in the market values of concluded commodity hedge
instruments that would have resulted from a 10 % increase or decline of the oil price. The underlying
transactions are not taken into account. The calculation of oil price sensitivities is based on Brent
quotations. Moreover, changes to the market values of loan assets and liabilities in USD as well as
USD receivables arising from Egyptian activities that would have occurred both in the event of an
increase and a decline by 10 % in the USD forward curve in relation to the EUR or NOK, respectively,
are presented. The presentation of market value changes is in each case shown after taxes. The
corporate tax rate of 30.14 % (previous year: 30.14 %) is applied.
January - December 2016 April - December 2015
€m Changes
impacting on profit and loss
Impacts on other
comprehensive income
Changes impacting on
profit and loss
Impacts on other
comprehensive income
Increase in USD by 10 % 57 2
Decrease in USD by 10 % -68 -1
Increase in oil price by 10 % -33 -3
Decrease in oil price by 10 % 29 3
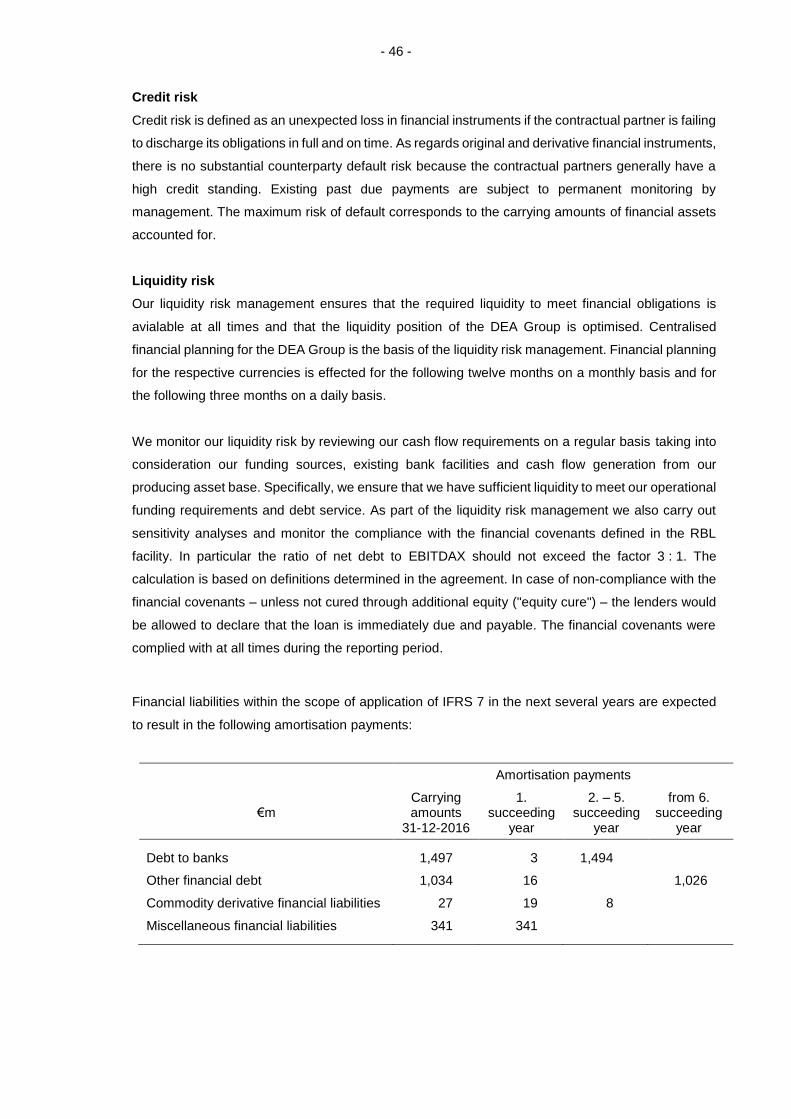
- 46 - Credit risk
Credit risk is defined as an unexpected loss in financial instruments if the contractual partner is failing
to discharge its obligations in full and on time. As regards original and derivative financial instruments,
there is no substantial counterparty default risk because the contractual partners generally have a
high credit standing. Existing past due payments are subject to permanent monitoring by
management. The maximum risk of default corresponds to the carrying amounts of financial assets
accounted for.
Liquidity risk
Our liquidity risk management ensures that the required liquidity to meet financial obligations is
avialable at all times and that the liquidity position of the DEA Group is optimised. Centralised
financial planning for the DEA Group is the basis of the liquidity risk management. Financial planning
for the respective currencies is effected for the following twelve months on a monthly basis and for
the following three months on a daily basis.
We monitor our liquidity risk by reviewing our cash flow requirements on a regular basis taking into
consideration our funding sources, existing bank facilities and cash flow generation from our
producing asset base. Specifically, we ensure that we have sufficient liquidity to meet our operational
funding requirements and debt service. As part of the liquidity risk management we also carry out
sensitivity analyses and monitor the compliance with the financial covenants defined in the RBL
facility. In particular the ratio of net debt to EBITDAX should not exceed the factor 3 : 1. The
calculation is based on definitions determined in the agreement. In case of non-compliance with the
financial covenants – unless not cured through additional equity ("equity cure") – the lenders would
be allowed to declare that the loan is immediately due and payable. The financial covenants were
complied with at all times during the reporting period.
Financial liabilities within the scope of application of IFRS 7 in the next several years are expected
to result in the following amortisation payments:
Amortisation payments
€m Carrying amounts
31-12-2016
1. succeeding
year
2. – 5. succeeding
year
from 6. succeeding
year
Debt to banks 1,497 3 1,494
Other financial debt 1,034 16 1,026
Commodity derivative financial liabilities 27 19 8
Miscellaneous financial liabilities 341 341
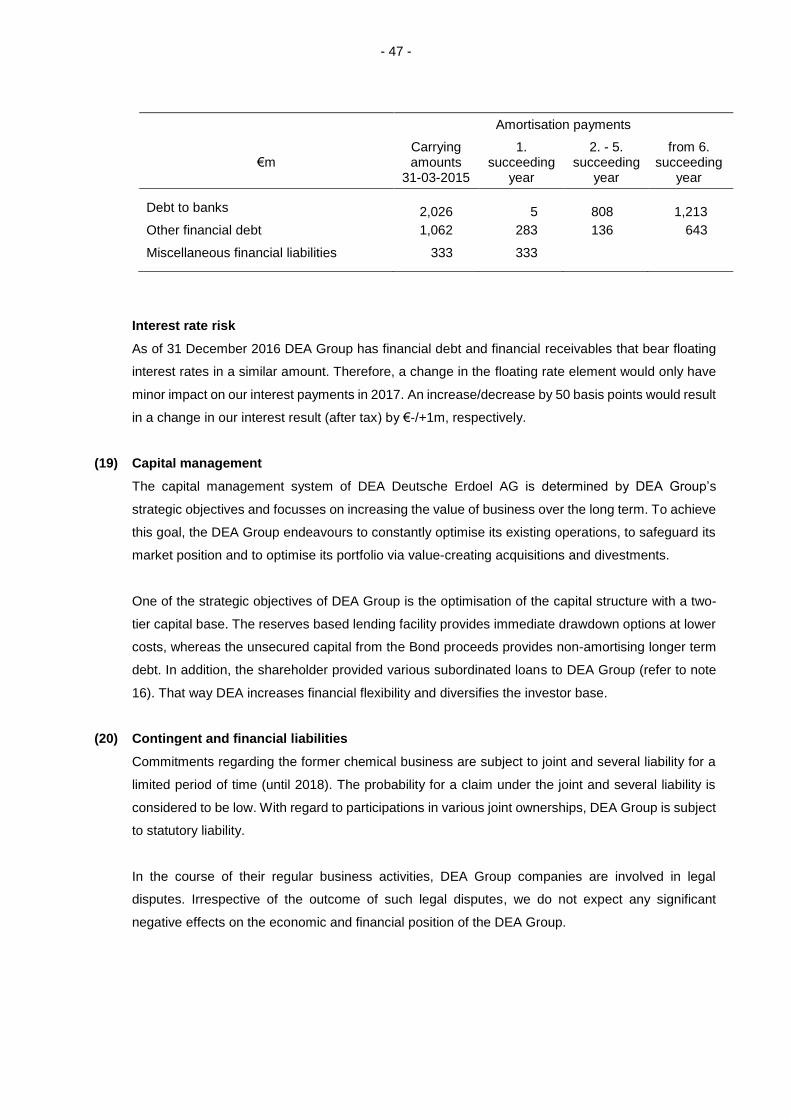
- 47 -
Amortisation payments
€m Carrying amounts
31-03-2015
1. succeeding
year
2. - 5. succeeding
year
from 6. succeeding
year
Debt to banks 2,026 5 808 1,213
Other financial debt 1,062 283 136 643
Miscellaneous financial liabilities 333 333
Interest rate risk
As of 31 December 2016 DEA Group has financial debt and financial receivables that bear floating
interest rates in a similar amount. Therefore, a change in the floating rate element would only have
minor impact on our interest payments in 2017. An increase/decrease by 50 basis points would result
in a change in our interest result (after tax) by €-/+1m, respectively.
(19) Capital management
The capital management system of DEA Deutsche Erdoel AG is determined by DEA Group’s
strategic objectives and focusses on increasing the value of business over the long term. To achieve
this goal, the DEA Group endeavours to constantly optimise its existing operations, to safeguard its
market position and to optimise its portfolio via value-creating acquisitions and divestments.
One of the strategic objectives of DEA Group is the optimisation of the capital structure with a two-
tier capital base. The reserves based lending facility provides immediate drawdown options at lower
costs, whereas the unsecured capital from the Bond proceeds provides non-amortising longer term
debt. In addition, the shareholder provided various subordinated loans to DEA Group (refer to note
16). That way DEA increases financial flexibility and diversifies the investor base.
(20) Contingent and financial liabilities
Commitments regarding the former chemical business are subject to joint and several liability for a
limited period of time (until 2018). The probability for a claim under the joint and several liability is
considered to be low. With regard to participations in various joint ownerships, DEA Group is subject
to statutory liability.
In the course of their regular business activities, DEA Group companies are involved in legal
disputes. Irrespective of the outcome of such legal disputes, we do not expect any significant
negative effects on the economic and financial position of the DEA Group.
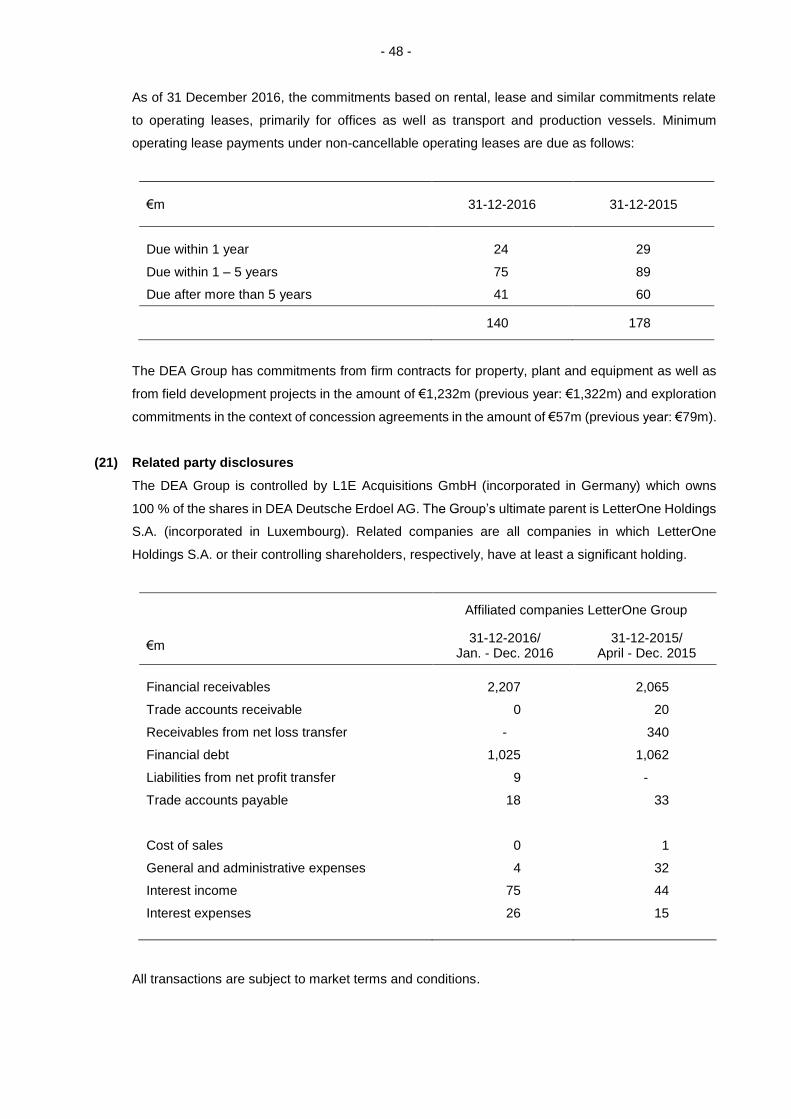
- 48 - As of 31 December 2016, the commitments based on rental, lease and similar commitments relate
to operating leases, primarily for offices as well as transport and production vessels. Minimum
operating lease payments under non-cancellable operating leases are due as follows:
€m 31-12-2016 31-12-2015
Due within 1 year 24 29
Due within 1 – 5 years 75 89
Due after more than 5 years 41 60
140 178
The DEA Group has commitments from firm contracts for property, plant and equipment as well as
from field development projects in the amount of €1,232m (previous year: €1,322m) and exploration
commitments in the context of concession agreements in the amount of €57m (previous year: €79m).
(21) Related party disclosures
The DEA Group is controlled by L1E Acquisitions GmbH (incorporated in Germany) which owns
100 % of the shares in DEA Deutsche Erdoel AG. The Group’s ultimate parent is LetterOne Holdings
S.A. (incorporated in Luxembourg). Related companies are all companies in which LetterOne
Holdings S.A. or their controlling shareholders, respectively, have at least a significant holding.
Affiliated companies LetterOne Group
€m 31-12-2016/
Jan. - Dec. 2016 31-12-2015/
April - Dec. 2015
Financial receivables 2,207 2,065
Trade accounts receivable 0 20
Receivables from net loss transfer - 340
Financial debt 1,025 1,062
Liabilities from net profit transfer 9 -
Trade accounts payable 18 33
Cost of sales 0 1
General and administrative expenses 4 32
Interest income 75 44
Interest expenses 26 15
All transactions are subject to market terms and conditions.
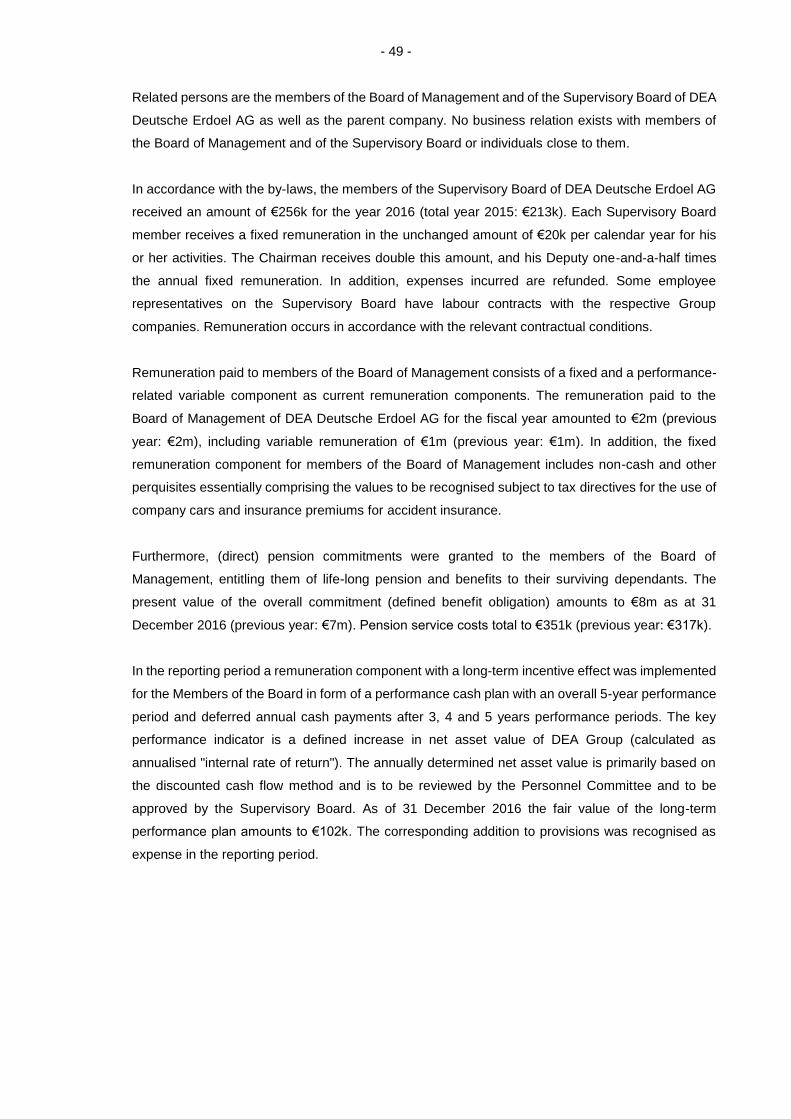
- 49 - Related persons are the members of the Board of Management and of the Supervisory Board of DEA
Deutsche Erdoel AG as well as the parent company. No business relation exists with members of
the Board of Management and of the Supervisory Board or individuals close to them.
In accordance with the by-laws, the members of the Supervisory Board of DEA Deutsche Erdoel AG
received an amount of €256k for the year 2016 (total year 2015: €213k). Each Supervisory Board
member receives a fixed remuneration in the unchanged amount of €20k per calendar year for his
or her activities. The Chairman receives double this amount, and his Deputy one-and-a-half times
the annual fixed remuneration. In addition, expenses incurred are refunded. Some employee
representatives on the Supervisory Board have labour contracts with the respective Group
companies. Remuneration occurs in accordance with the relevant contractual conditions.
Remuneration paid to members of the Board of Management consists of a fixed and a performance-
related variable component as current remuneration components. The remuneration paid to the
Board of Management of DEA Deutsche Erdoel AG for the fiscal year amounted to €2m (previous
year: €2m), including variable remuneration of €1m (previous year: €1m). In addition, the fixed
remuneration component for members of the Board of Management includes non-cash and other
perquisites essentially comprising the values to be recognised subject to tax directives for the use of
company cars and insurance premiums for accident insurance.
Furthermore, (direct) pension commitments were granted to the members of the Board of
Management, entitling them of life-long pension and benefits to their surviving dependants. The
present value of the overall commitment (defined benefit obligation) amounts to €8m as at 31
December 2016 (previous year: €7m). Pension service costs total to €351k (previous year: €317k).
In the reporting period a remuneration component with a long-term incentive effect was implemented
for the Members of the Board in form of a performance cash plan with an overall 5-year performance
period and deferred annual cash payments after 3, 4 and 5 years performance periods. The key
performance indicator is a defined increase in net asset value of DEA Group (calculated as
annualised "internal rate of return"). The annually determined net asset value is primarily based on
the discounted cash flow method and is to be reviewed by the Personnel Committee and to be
approved by the Supervisory Board. As of 31 December 2016 the fair value of the long-term
performance plan amounts to €102k. The corresponding addition to provisions was recognised as
expense in the reporting period.
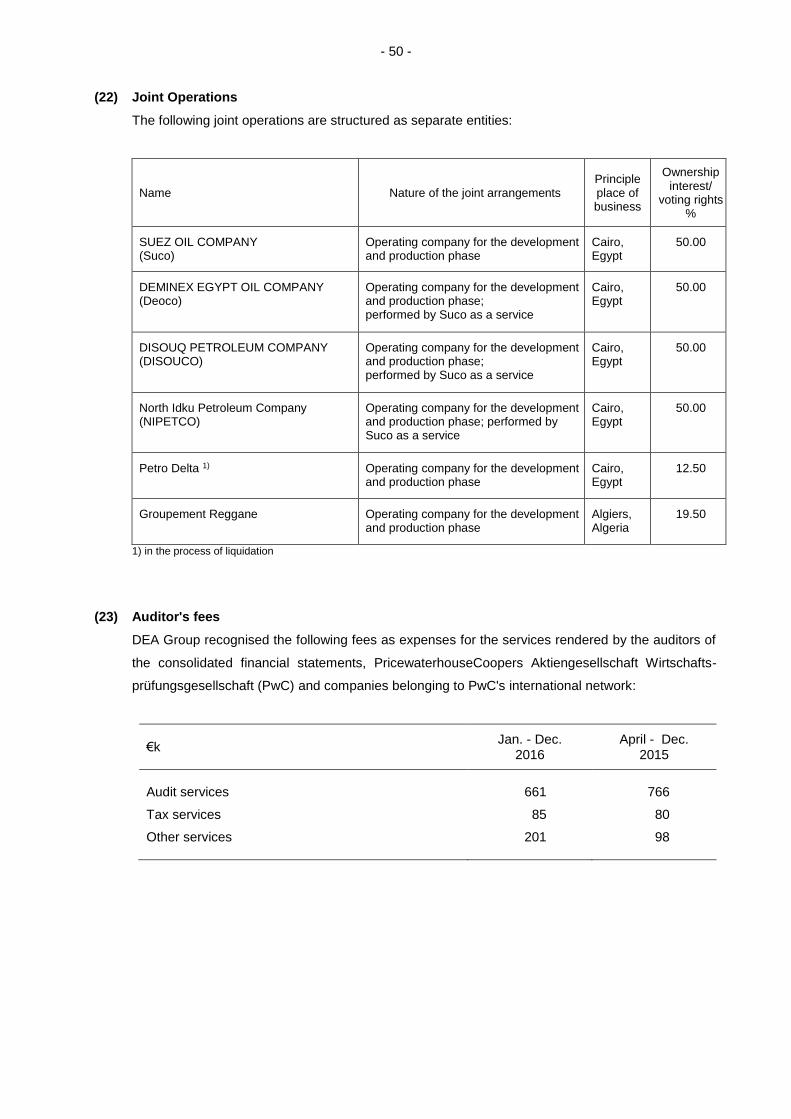
- 50 - (22) Joint Operations
The following joint operations are structured as separate entities:
Name Nature of the joint arrangements Principle place of business
Ownership interest/
voting rights %
SUEZ OIL COMPANY (Suco)
Operating company for the development and production phase
Cairo, Egypt
50.00
DEMINEX EGYPT OIL COMPANY (Deoco)
Operating company for the development and production phase; performed by Suco as a service
Cairo, Egypt
50.00
DISOUQ PETROLEUM COMPANY (DISOUCO)
Operating company for the development and production phase; performed by Suco as a service
Cairo, Egypt
50.00
North Idku Petroleum Company (NIPETCO)
Operating company for the development and production phase; performed by Suco as a service
Cairo, Egypt
50.00
Petro Delta 1) Operating company for the development and production phase
Cairo, Egypt
12.50
Groupement Reggane Operating company for the development and production phase
Algiers, Algeria
19.50
1) in the process of liquidation
(23) Auditor's fees
DEA Group recognised the following fees as expenses for the services rendered by the auditors of
the consolidated financial statements, PricewaterhouseCoopers Aktiengesellschaft Wirtschafts-
prüfungsgesellschaft (PwC) and companies belonging to PwC's international network:
€k Jan. - Dec.
2016 April - Dec.
2015
Audit services 661 766
Tax services 85 80
Other services 201 98
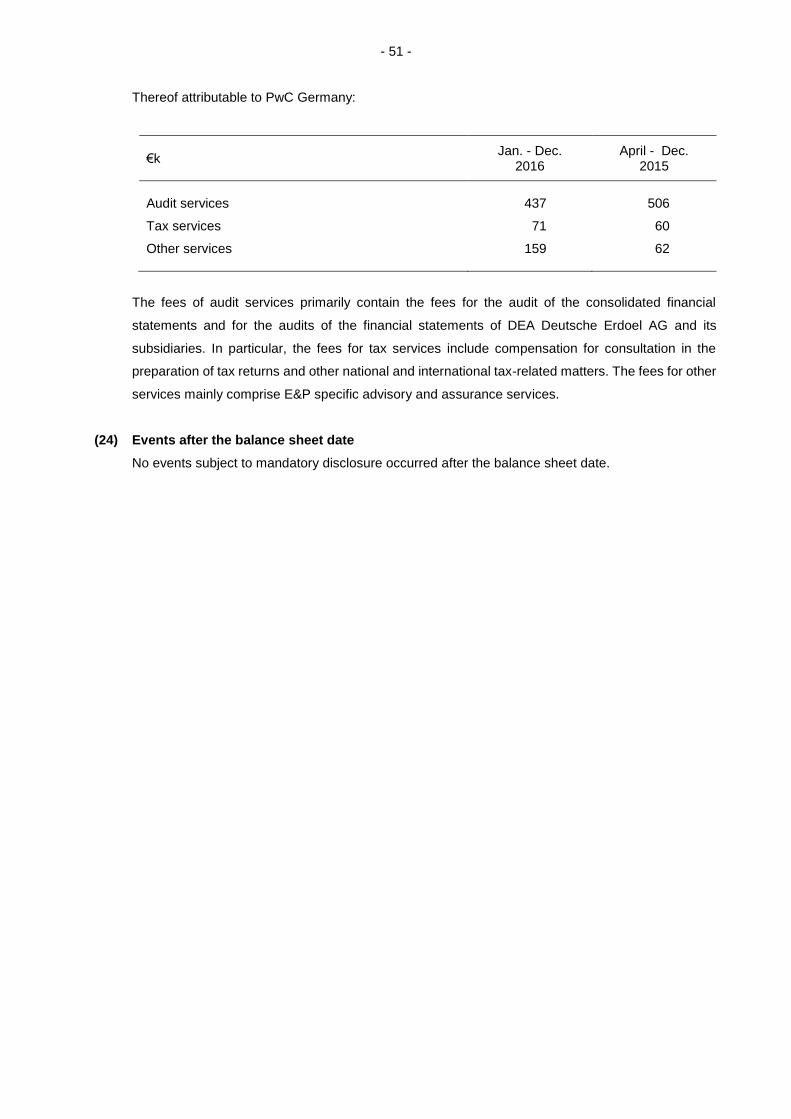
- 51 - Thereof attributable to PwC Germany:
€k Jan. - Dec.
2016 April - Dec.
2015
Audit services 437 506
Tax services 71 60
Other services 159 62
The fees of audit services primarily contain the fees for the audit of the consolidated financial
statements and for the audits of the financial statements of DEA Deutsche Erdoel AG and its
subsidiaries. In particular, the fees for tax services include compensation for consultation in the
preparation of tax returns and other national and international tax-related matters. The fees for other
services mainly comprise E&P specific advisory and assurance services.
(24) Events after the balance sheet date
No events subject to mandatory disclosure occurred after the balance sheet date.
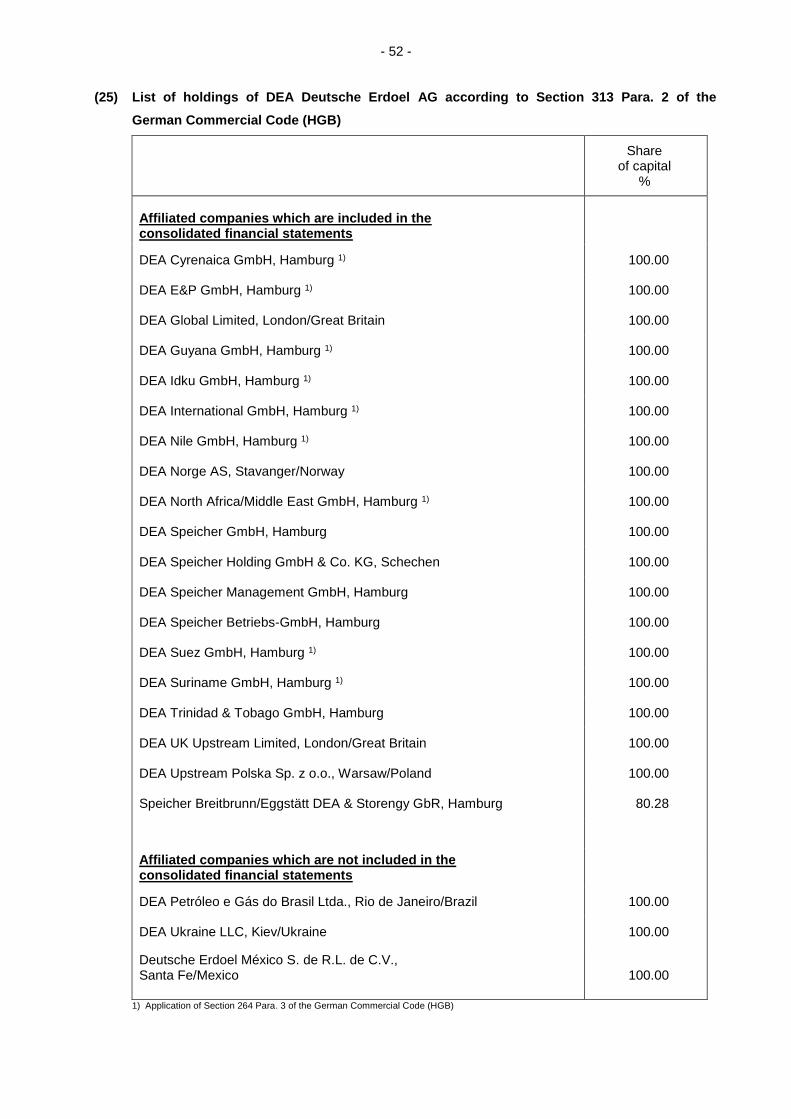
- 52 - (25) List of holdings of DEA Deutsche Erdoel AG according to Section 313 Para. 2 of the
German Commercial Code (HGB)
Share
of capital %
Affiliated companies which are included in the consolidated financial statements
DEA Cyrenaica GmbH, Hamburg 1) 100.00
DEA E&P GmbH, Hamburg 1) 100.00
DEA Global Limited, London/Great Britain 100.00
DEA Guyana GmbH, Hamburg 1) 100.00
DEA Idku GmbH, Hamburg 1) 100.00
DEA International GmbH, Hamburg 1) 100.00
DEA Nile GmbH, Hamburg 1) 100.00
DEA Norge AS, Stavanger/Norway 100.00
DEA North Africa/Middle East GmbH, Hamburg 1) 100.00
DEA Speicher GmbH, Hamburg 100.00
DEA Speicher Holding GmbH & Co. KG, Schechen 100.00
DEA Speicher Management GmbH, Hamburg 100.00
DEA Speicher Betriebs-GmbH, Hamburg 100.00
DEA Suez GmbH, Hamburg 1) 100.00
DEA Suriname GmbH, Hamburg 1) 100.00
DEA Trinidad & Tobago GmbH, Hamburg 100.00
DEA UK Upstream Limited, London/Great Britain 100.00
DEA Upstream Polska Sp. z o.o., Warsaw/Poland 100.00
Speicher Breitbrunn/Eggstätt DEA & Storengy GbR, Hamburg 80.28
Affiliated companies which are not included in the consolidated financial statements
DEA Petróleo e Gás do Brasil Ltda., Rio de Janeiro/Brazil 100.00
DEA Ukraine LLC, Kiev/Ukraine 100.00
Deutsche Erdoel México S. de R.L. de C.V., Santa Fe/Mexico
100.00
1) Application of Section 264 Para. 3 of the German Commercial Code (HGB)
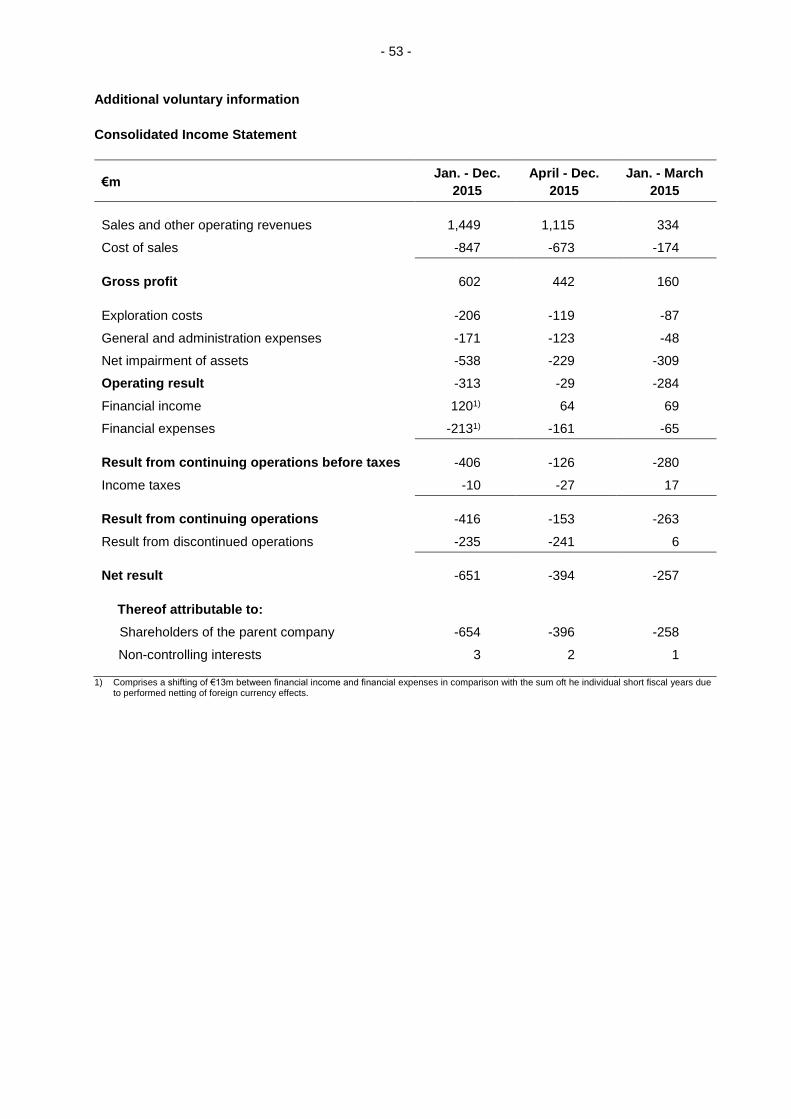
- 53 -
Additional voluntary information
Consolidated Income Statement
€m Jan. - Dec.
2015
April - Dec.
2015
Jan. - March
2015
Sales and other operating revenues 1,449 1,115 334
Cost of sales -847 -673 -174
Gross profit 602 442 160
Exploration costs -206 -119 -87
General and administration expenses -171 -123 -48
Net impairment of assets -538 -229 -309
Operating result -313 -29 -284
Financial income 1201) 64 69
Financial expenses -2131) -161 -65
Result from continuing operations before taxes -406 -126 -280
Income taxes -10 -27 17
Result from continuing operations -416 -153 -263
Result from discontinued operations -235 -241 6
Net result -651 -394 -257
Thereof attributable to:
Shareholders of the parent company -654 -396 -258
Non-controlling interests 3 2 1
1) Comprises a shifting of €13m between financial income and financial expenses in comparison with the sum oft he individual short fiscal years due to performed netting of foreign currency effects.
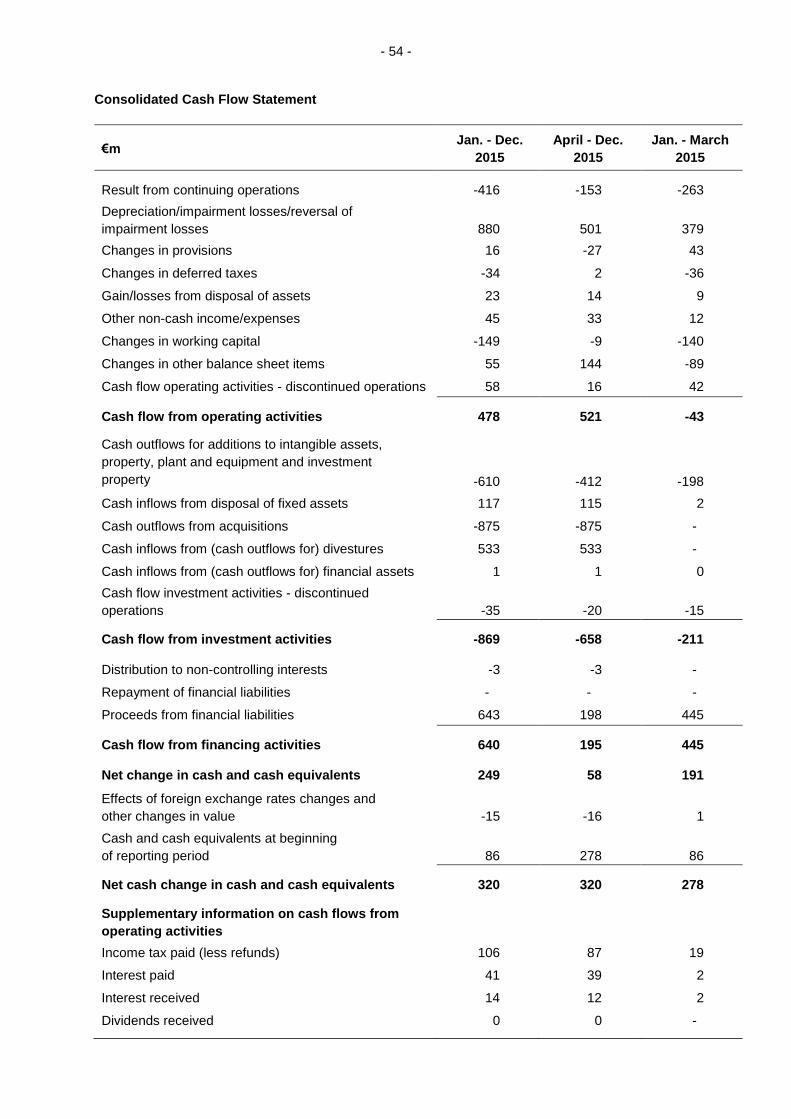
- 54 -
Consolidated Cash Flow Statement
€m Jan. - Dec.
2015
April - Dec.
2015
Jan. - March
2015
Result from continuing operations -416 -153 -263
Depreciation/impairment losses/reversal of
impairment losses
880
501
379
Changes in provisions 16 -27 43
Changes in deferred taxes -34 2 -36
Gain/losses from disposal of assets 23 14 9
Other non-cash income/expenses 45 33 12
Changes in working capital -149 -9 -140
Changes in other balance sheet items 55 144 -89
Cash flow operating activities - discontinued operations 58 16 42
Cash flow from operating activities 478 521 -43
Cash outflows for additions to intangible assets,
property, plant and equipment and investment
property
investment property
-610
-412
-198
Cash inflows from disposal of fixed assets 117 115 2
Cash outflows from acquisitions -875 -875 -
Cash inflows from (cash outflows for) divestures 533 533 -
Cash inflows from (cash outflows for) financial assets 1 1 0
Cash flow investment activities - discontinued
operations
-35
-20
-15
Cash flow from investment activities -869 -658 -211
Distribution to non-controlling interests -3 -3 -
Repayment of financial liabilities - - -
Proceeds from financial liabilities 643 198 445
Cash flow from financing activities 640 195 445
Net change in cash and cash equivalents 249 58 191
Effects of foreign exchange rates changes and
other changes in value
-15
-16
1
Cash and cash equivalents at beginning
of reporting period
86
278
86
Net cash change in cash and cash equivalents 320 320 278
Supplementary information on cash flows from
operating activities
Income tax paid (less refunds) 106 87 19
Interest paid 41 39 2
Interest received 14 12 2
Dividends received 0 0 -
- 55 - Supervisory Board, Management Board
Supervisory Board
Lord Edmund John Phillip Browne of Madingley, London (Chairman)
Executive Chairman, L1 Energy (UK) LLP
Günther Prien, Hamburg (Deputy Chairman)
Chairman of the Joint Works Council, DEA Deutsche Erdoel AG
Werner Bischoff, Monheim (until 16 September 2016)
Former member of the Management Executive Council, Union of the Mining, Chemical and Energy
Hans-Hermann Andreae, Hamburg (until 15 May 2016)
General Manager, DEA Norge AS
Daniela Freise, Hamburg (since 16 September 2016)
Manager Risk Controlling & Back Office, Treasury, DEA Deutsche Erdoel AG
Mikhail Fridman, London/Moskau
Chairman, LetterOne Holdings S.A.
Andreas J. Goss, Duisburg
Executive Chairman, ThyssenKrupp Steel Europe AG
Franz-Gerd Hörnschemeyer, Hannover (since 16 September 2016)
Political Union Secretary, Union of Mining, Chemical and Energy
German Khan, London/Moskau
Director, LetterOne Holdings S.A.
Dr Jan Konerding, Hamburg
Auditor, Tax Advisor, Lawyer
René Pawel, Hamburg (since 16 September 2016)
Vice President Geo Support Center, DEA Deutsche Erdoel AG
Rajko Pientka, Hamburg
Political Union Secretary, Union of Mining, Chemical and Energy
Holger Pittelkow, Hamburg (until 16 September 2016)
Functional Department Head Indirect Taxes and Tax Audits, DEA Deutsche Erdoel AG