Embed Size (px)
Citation preview
An Assessment of Some Predictive Methodsfor In-tube Condensation Heat Transferof Refrigerant Mixtures
Mirza Mohammad Shah, PhD, PE Ahmad M. Mahmoud, PhD Jaeseon Lee, PhDFellow ASHRAE
DE-13-004
PREPRINT ONLY. Authors may request permission to reprint or post on their personal or company website once the final version of the article has been published.
ABSTRACT
Condensation heat transfer coefficient of non-azeotropicmixtures is significantly lower than that of single-componentfluids due to mass transfer resistances. Several correctionfactors have been proposed for modifying the predictions ofsingle fluid correlations for use with multicomponent refrig-erant mixtures. A comprehensive study evaluating thesecorrection factors against a wide range of experimental datahas not been undertaken previously. This research aims atpresenting an assessment of such predictive methods to fulfillthis need in industry and academia. Analyzable data for misci-ble mixtures condensing in plain tubes were compared with thepredictions of the general correlation of Shah (2009) modifiedby correction factors proposed by three researchers. The dataincluded 529 test points for 36 refrigerant mixtures from 22studies in horizontal and vertical tubes and included temper-ature glides up to 35.5°C (63.9 °F). These were predicted witha mean deviation of 18% using the correction factors of Belland Ghaly (1973) and McNaught (1979).
INTRODUCTION
In compliance with the Montreal Protocol, the use of manychlorofluorocarbons (CFC) refrigerants such as R-11 and R-12has already been prohibited in new equipment. The phasing outof many hydrochlorofluorocarbons (HCFC) such as R-22 is inprogress. New mixtures are being proposed in an effort toobtain better thermal performance while minimizing GlobalWarming Potential (GWP) and Ozone Depletion Potential(ODP). For the design of condensers using these new mixtures,methods for calculating heat transfer are required. As is wellknown, heat transfer coefficients during condensation of non-azeotropic mixtures are lower than those of the components due
to mass transfer resistance at the vapor-liquid interface. Heattransfer coefficients of non-azeotropic mixtures cannot becalculated with correlations for pure fluids simply by usingmixture mean properties. To predict the heat transfer perfor-mance of mixtures, many theoretical and empirical methodshave been proposed. The most common approach used in prac-tical design applications is to apply correction factors to thepredictions of reliable correlations for single-component fluids.Many such correction factors have been developed.
The classical method used for correcting the performanceof binary mixtures is the film theory method proposed byColburn and Drew (1937) which subsequently has beenextended to multicomponent mixtures. Such methods aredescribed in Taylor and Krishna (1993). These methods arequite tedious, especially when there are more than two compo-nents. Much more commonly used is the equilibrium methodproposed by Bell and Ghaly (1973), which assumes that themass transfer resistance is proportional to the resistance tosensible cooling in the vapor phase. Several modifications to theBell and Ghaly method have been proposed. These includethose by Del Col et al. (2005), McNaught (1979), and Sardesaiet al. (1983). While these methods have been verified with a fewdata sets, there has been no comprehensive comparison withdata from many sources. Such a study is needed to know whichmethods are reliable in what range of parameters. This researchwas done in an attempt to fulfill this need.
During this research, a comprehensive database formixture condensation was compared to a correlation well-veri-fied for single-component fluids, modifying this correlation’spredictions by three published correction factors for mixtureeffects. The results of this comparison are presented in thefollowing.
2013 ASHRAE. THIS PREPRINT MAY NOT BE DISTRIBUTED IN PAPER OR DIGITAL FORM IN WHOLE OR IN PART. IT IS FOR DISCUSSION PURPOSES ONLYAT THE 2013 ASHRAE ANNUAL CONFERENCE. The archival version of this paper along with comments and author responses will be published in ASHRAETransactions, Volume 119, Part 2. ASHRAE must receive written questions or comments regarding this paper by July 15, 2013, for them to be included in Transactions.
Mirza Mohammed Shah is a consultant in Redding, Connecticut.Ahmad M. Mahmoud and Jaeseon Lee are staff engineers in research engi-neering for the Thermo-Fluid Dynamics Group at the United Technologies Research Center in East Hartford, Connecticut.
PREPRINT ONLY. Authors may request permission to reprint or post on their personal or company website once the final version of the article has been published.
CORRELATIONS
FOR SINGLE-COMPONENT FLUIDS
As is well known, condensation at higher flow rates isindependent of heat flux while at lower flow rates it becomesincreasingly affected by heat flux. Numerous correlations,empirical and analytical, have been proposed for heat transferduring condensation of single-component fluids inside tubes.Many of them are applicable only to higher flow rates whereheat flux has no significant effect. Examples of successfulcorrelations of this type are Shah (1979), Traviss et al. (1973),and Moser et al. (1998). Very few well-verified correlationsinclude the entire range, heat flux dependent and independent.Among these are the correlations of Dobson and Chato (1998),Cavallini et al. (2006), and Shah (2009). The last two are appli-cable only to horizontal tubes while the Shah correlation isapplicable to both horizontal and vertical tubes (2009). TheShah correlation takes into account heat flux implicitly andhence heat flux need not be known to be compared with testdata. The correlations known to us that have been demon-strated to be applicable to heat flux dependent regime, such asthat of Cavallini et al. (2006), include heat flux explicitly andhence heat flux has to be known in order to compare with thedata. The majority of researchers have not reported heat fluxfor their data points. Such data can be compared to the Shahcorrelation but not to the others (2009).
As shown in Shah (2009), the Shah correlation is well-verified, is applicable to all orientations, and can be comparedto all data (even if they do not report heat flux). It was decidedto use it as the single-component correlation for the evaluationof mixture correction factors.
The Shah Correlation (2009)
The Shah correlation (2009) has three heat transferregimes. The condensation heat transfer coefficient is given bythe following relations:
In Regime I (turbulent regime),
(1)
In Regime II (mixed regime),
(2)
In Regime III (laminar regime),
(3)
where hI and hNu in the above equations are obtained from thefollowing equations:
(4)
(5)
Equation 5 is the Nusselt equation for laminar filmcondensation in vertical tubes; the constant has beenincreased by 20% as recommended by McAdams (1954) onthe basis of comparison with test data. The same is usedhere also for horizontal tubes. Equation 5 is a modificationof Shah’s earlier correlation (1979), the difference beingthat the 1979 version did not have the viscosity ratio term.This term becomes significant only at higher pr .
In Equation 4, hLS is the heat transfer of the liquidphase flowing alone in the tube. It is calculated by thefollowing equation:
(6)
Regime I is called the turbulent regime as it usesEquations 1 through 4, which are for turbulent flow.Regime III is called the laminar regime as it exclusivelyuses the Nusselt formula for laminar flow (Equation 5).Regime II is called the mixed regime as it adds the predic-tions for the laminar and turbulent regimes.
The heat transfer regimes are determined as follows.
Vertical and inclined tubes: Regime I occurs when
(7)
The boundary between Regimes II and III is given by thefollowing relation: Regime III prevails when
(8)
Jg is the dimensionless vapor velocity defined as
(9)
Horizontal tubes: The boundary between Regimes I andII is given by the following relation: Regime I occurs when
(10)
A third regime is expected at very low flow rates.Analyzable data were not available for such conditions.Tentatively and conservatively, Regime III is defined tooccur when both ReLS and ReGS is less than 1000. This is thecriteria of Lockhart and Martinelli (1949) for their laminar-laminar regime.
The Shah correlation was validated by comparisonwith 1189 data points for 22 fluids (water, organics, halo-carbon refrigerants) from 39 studies in horizontal, vertical,and inclined tubes. These included tube diameters from 2 to49 mm (0.079 to 1.93 in.), pr from 0.0005 to 0.9, and G from4 to 820 kg/m2s (49 to 10086 lb./ft2s). Complete details ofthis validation and data analysis are given in Shah (2009).
hTP hI=
hTP hI hNu+=
hTP hNu=
hI hLS 1 3.8Z0.95------------+
f
14g------------ 0.0058 0.557 pr+
=
hNu 1.32ReLS1 3/–
l l g– gk f3
f2
--------------------------------------1 3/
=
hLS 0.023ReLS0.8Pr f
0.4k f D=
J g1
2.4Z 0.73+----------------------------
J g 0.89 0.93 0.087Z 1.17–– exp–
J gxG
gDg l g– 0.5------------------------------------------------=
J g 0.98 Z 0.263+ 0.62–
2 DE-13-004
PREPRINT ONLY. Authors may request permission to reprint or post on their personal or company website once the final version of the article has been published.
CORRECTION FACTORS
FOR MIXTURE EFFECTS
Three of the available correction methods for mixtureswere selected for evaluating their ability to correct thepredictions of the Shah (2009) general correlation for awide range of experimental data. These methods aredescribed below.
The Bell and Ghaly (1973) method calculates themixture condensing heat transfer coefficient as
(11)
where:
(12)
hc is the condensing heat transfer coefficient calculatedwith mixture properties using a correlation for pure fluids.hGS is the superficial heat transfer coefficient of the vaporphase, i.e., assuming vapor phase to be flowing alone in thetube, calculated by the following equation,
(13)
Del Col et al. (2005) have presented two methodsapplicable to different flow pattern groups. For the inter-mittent, annular, and mist flow patterns, they reasoned thatthe heat transfer coefficient of the vapor phase is increasedby means of interfacial waves and interfacial shear. To takethese factors into account, they modified Equation 11 to thefollowing:
(14)
where hG is the heat transfer coefficient of vapor phase inthe tube cross section occupied by vapor and is calculatedby using Equation 13 but replacing uGS with the vaporvelocity through the area occupied by the vapor. The inter-facial friction factor, fi, is calculated using a number ofequations that include those for the calculation of flowpatterns and void fraction. Their correction factor for thestratified and stratified-wavy flow patterns requires thatheat flux be known. The Shah correlation (2009) does notinclude heat flux explicitly; it is included in Regimes II andIII implicitly through the liquid Reynolds number in Equa-tion 5. Further, most of the data sets available in the openliterature do not provide the heat flux. Therefore, the DelCol et al. (2005) correction factor method for stratified andstratified-wavy flow patterns was not tested here.
According to McNaught (1979), the mass transferresistance can be significantly higher than that calculated
through the Bell and Ghaly method (1973). McNaughtreplaced hGS in Equation 11 by hGS, mod given by the follow-ing equation:
(15)
is the Ackermann factor given by:
(16)
where m is the individual mass flux of a component. Thesubscript i indicates for component i. The summation iscarried out for all n components of the mixture. Thepredicted heat transfer coefficient by the McNaughtmethod (1979) is always equal or lower than that by theBell and Ghaly method (1973).
COMPARISON WITH TEST DATA
Data Collection
Vigorous attempts were made to collect test data forin-tube condensation of mixtures of miscible fluids. Whilea large number of studies for mixtures were found, many ofthem did not provide sufficient information (such as pres-sure) to be included in this analysis. While numerous stud-ies on R-404A and R-410A with analyzable data wereavailable, the temperature glides of these fluids are so smallthat comparison with them does not give a meaningful testof the capabilities of the correction factors. Only one dataset of each of these fluids has been included in this study todemonstrate the applicability of these predictive methodsto this class of fluid mixtures. Most of the data wascollected by analyzing graphs in research papers or reports.Only a few data sets are available in tabular form.
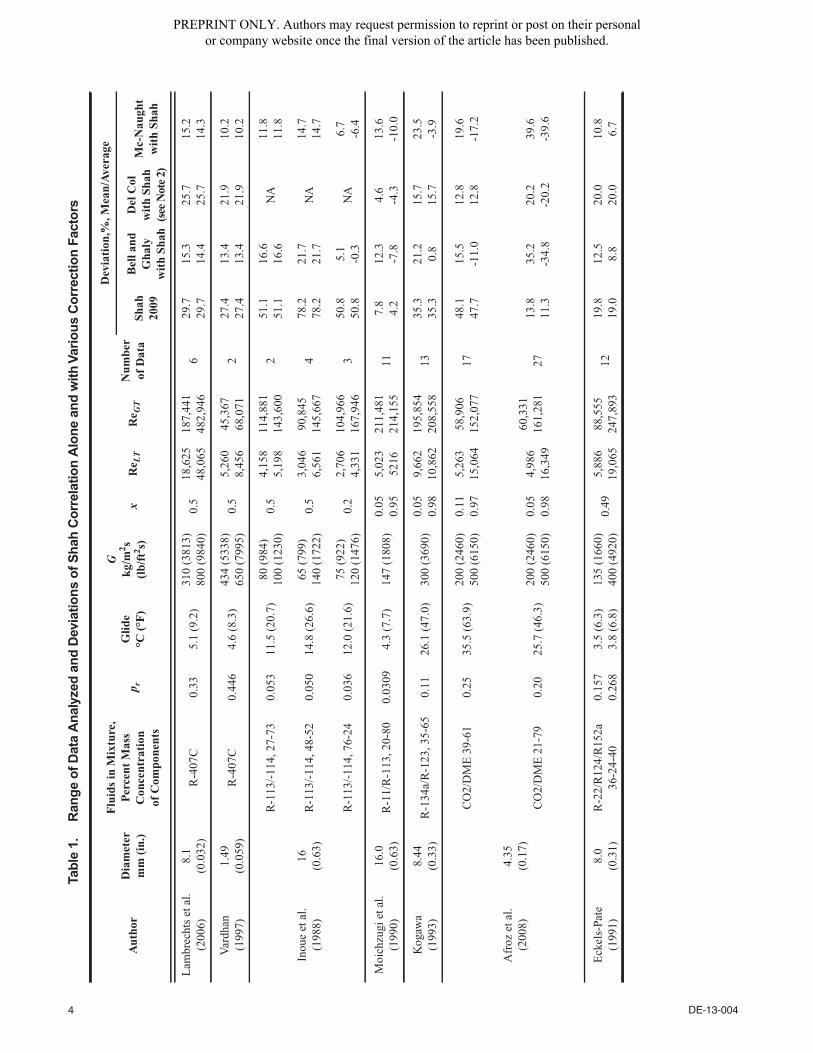
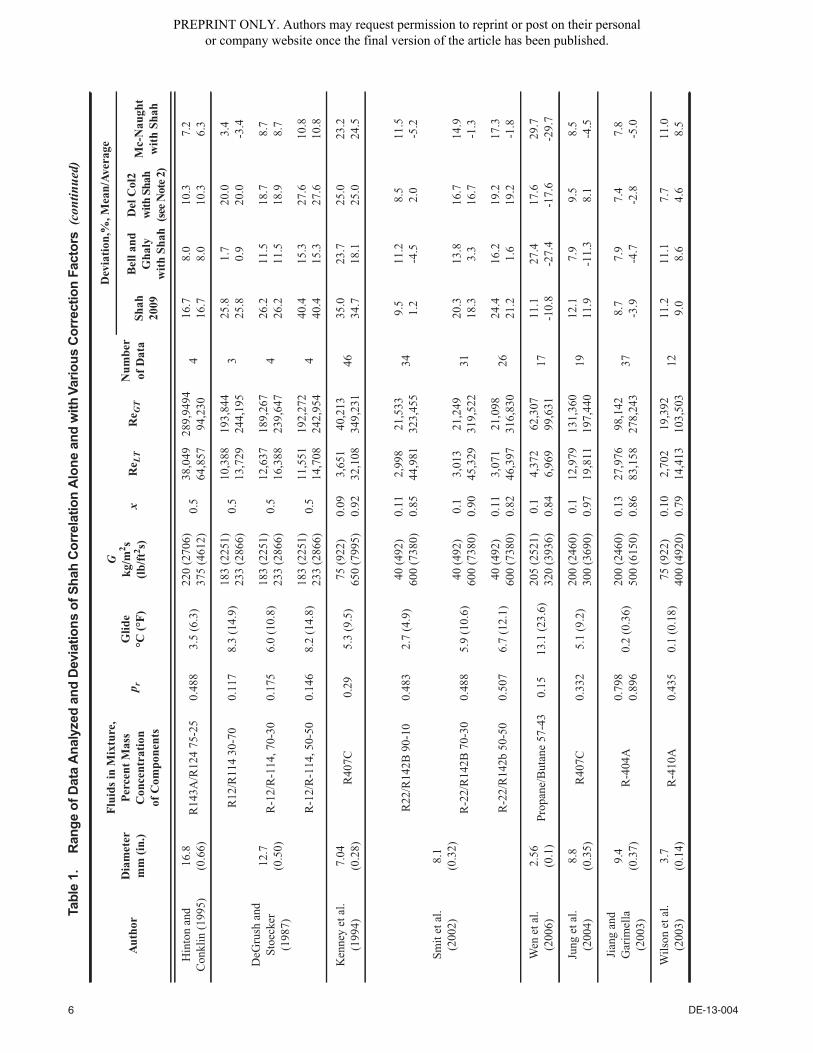
Table 1 lists the range of the data analyzed. It can beseen in Table 1 that the majority of data sets are for hori-zontal tubes with the exception of two which are for verticaltubes (downflow).
Methodology
The compositions of vapor and liquid phases werecalculated at each value of vapor quality. The properties ofvapor and liquid phases were calculated at these composi-tions. The critical pressure was calculated for the vapor-phase composition. All calculations were done using theselocal properties. The condensing heat transfer coefficient hcin Equations 11 and 14 was calculated by the Shah (2009)correlation at each value of vapor quality, x, using theselocal values of properties. The correction factors by thethree methods evaluated were also calculated the same waywith properties at the local vapor quality. Flow patternswere calculated using the correlation of El Hajal et al.(2003). This method was used as Del Col et al. (2005) had
1hmix----------- 1
hc-----
Y G
hGS---------+=
Y G xC pg
dT glide
dI-------------------=
hGS 0.023uGSgD
g--------------------- 0.8Prg
0.4k g
D-------------------=
1hmix----------- 1
hc-----
Y G
hGS f i-----------------+=
hGS , mod
hGS
exp 1– ---------------------------=
miC pg , i
hGS------------------------
i 1=
n
=
DE-13-004 3
PREPRINT ONLY. Authors may request permission to reprint or post on their personal or company website once the final version of the article has been published.
Tab
le1.
Ran
ge
of
Data
An
aly
zed
an
dD
evia
tio
ns
of
Sh
ah
Co
rrela
tio
nA
lon
ean
dw
ith
Vari
ou
sC
orr
ecti
on
Facto
rs
Aut
hor
Dia
met
erm
m(i
n.)
Flu
ids
inM
ixtu
re,
Per
cent
Mas
sC
once
ntra
tion
ofC
ompo
nent
s
p rG
lide
°C(°
F)
Gkg
/m2 s
(lb/
ft2 s)
xR
e LT
Re G
TN
umbe
rof
Dat
a
Dev
iati
on,%
,Mea
n/A
vera
ge
Shah
2009
Bel
land
Gha
lyw
ith
Shah
Del
Col
wit
hSh
ah(s
eeN
ote
2)
Mc-
Nau
ght
wit
hSh
ah
Lam
brec
hts
etal
.(2
006)
8.1
(0.0
32)
R-4
07C
0.33
5.1
(9.2
)31
0(3
813)
800
(984
0)0.
518
,625
48,0
6518
7,44
148
2,94
66
29.7
29.7
15.3
14.4
25.7
25.7
15.2
14.3
Var
dhan
(199
7)1.
49(0
.059
)R
-407
C0.
446
4.6
(8.3
)43
4(5
338)
650
(799
5)0.
55,
260
8,45
645
,367
68,0
712
27.4
27.4
13.4
13.4
21.9
21.9
10.2
10.2
Inou
eet
al.
(198
8)16
(0.6
3)
R-1
13/-
114,
27-7
30.
053
11.5
(20.
7)80
(984
)10
0(1
230)
0.5
4,15
85,
198
114,
881
143,
600
251
.151
.116
.616
.6N
A11
.811
.8
R-1
13/-
114,
48-5
20.
050
14.8
(26.
6)65
(799
)14
0(1
722)
0.5
3,04
66,
561
90,8
4514
5,66
74
78.2
78.2
21.7
21.7
NA
14.7
14.7
R-1
13/-
114,
76-2
40.
036
12.0
(21.
6)75
(922
)12
0(1
476)
0.2
2,70
64,
331
104,
966
167,
946
350
.850
.85.
1-0
.3N
A6.
7-6
.4
Moi
chzu
giet
al.
(199
0)16
.0(0
.63)
R-1
1/R
-113
,20-
800.
0309
4.3
(7.7
)14
7(1
808)
0.05
0.95
5,02
352
1621
1,48
121
4,15
511
7.8
4.2
12.3
-7.8
4.6
-4.3
13.6
-10.
0
Kog
awa
(199
3)8.
44(0
.33)
R-1
34a/
R-1
23,3
5-65
0.11
26.1
(47.
0)30
0(3
690)
0.05
0.98
9,66
210
,862
195,
854
208,
558
1335
.335
.321
.20.
815
.715
.723
.5-3
.9
Afr
ozet
al.
(200
8)4.
35(0
.17)
CO
2/D
ME
39-6
10.
2535
.5(6
3.9)
200
(246
0)50
0(6
150)
0.11
0.97
5,26
315
,064
58,9
0615
2,07
717
48.1
47.7
15.5
-11.
012
.812
.819
.6-1
7.2
CO
2/D
ME
21-7
90.
2025
.7(4
6.3)
200
(246
0)50
0(6
150)
0.05
0.98
4,98
616
,349
60,3
3116
1,28
127
13.8
11.3
35.2
-34.
820
.2-2
0.2
39.6
-39.
6
Eck
els-
Pate
(199
1)8.
0(0
.31)
R-2
2/R
124/
R15
2a36
-24-
400.
157
0.26
83.
5(6
.3)
3.8
(6.8
)13
5(1
660)
400
(492
0)0.
495,
886
19,0
6588
,555
247,
893
1219
.819
.012
.58.
820
.020
.010
.86.
7
4 DE-13-004

PREPRINT ONLY. Authors may request permission to reprint or post on their personal or company website once the final version of the article has been published.
Aut
hor
Dia
met
erm
m(i
n.)
Flu
ids
inM
ixtu
re,
Per
cent
Mas
sC
once
ntra
tion
ofC
ompo
nent
s
p rG
lide
°C(°
F)
Gkg
/m2 s
(lb/
ft2 s)
xR
e LT
Re G
TN
umbe
rof
Dat
a
Dev
iati
on,%
,Mea
n/A
vera
ge
Shah
2009
Bel
land
Gha
lyw
ith
Shah
Del
Col
2w
ith
Shah
(see
Not
e2)
Mc-
Nau
ght
wit
hSh
ah
Doe
ret
al.
(199
4)7.
5(0
.29)
R12
5/R
143a
/R13
4a44
-52-
040.
382
0.4
(0.7
2)12
7(1
562)
371
(456
3)0.
460.
487,
994
23,2
6176
471
221,
801
410
.08.
99.
57.
912
.510
.89.
37.
7
R-3
2/R
-125
/R13
4a30
-10-
600.
266
0.33
45.
3(9
.5)
5.6
(18.
7)13
0(1
599)
371
(456
3)0.
450.
476,
729
21,7
7976
,814
215,
059
1038
.538
.520
.920
.930
.730
.716
.816
.8
R-3
2/R
-134
a25
-75
0.24
20.
305.
2(9
.4)
5.5
(9.9
)13
1(1
611)
362
(445
3)0.
450.
466,
397
19,5
4380
,499
222,
139
1636
.536
.517
.917
.927
.627
.613
.813
.8
R-1
34a/
R-3
290
-10
0.21
20.
283
3.6
(6.5
)4.
6(8
.3)
129
(158
7)38
1(4
686)
0.45
0.48
5,61
318
,999
80,3
7022
29,9
0717
30.2
30.2
16.9
16.9
24.8
24.8
14.1
14.1
Cav
allin
ieta
l.(2
000)
8.0
(0.3
1)
R12
5-R
236e
a,28
-72
0.24
221
.6(3
8.9)
100
(123
0)75
0(9
225)
0.08
0.69
3,51
127
,873
57,7
7244
1,07
515
53.2
52.9
29.4
7.35
3.7
3.7
29.4
1.7
R12
5-23
6ea,
63-7
30.
402
16.8
(30.
2)10
0(1
230)
750
(922
5)0.
160.
815,
278
41,0
8755
,094
420,
694
2347
.247
.215
.713
.120
.920
.914
.74.
7
R-1
25-R
236e
a,46
-54
0.31
921
.3(3
8.3)
100
(123
0)75
0(9
225)
0.09
0.75
4,42
034
,449
56,6
8043
2,39
424
37.4
37.1
18.8
1.1
9.3
9.1
20.6
-4.2
Cav
allin
ieta
l.(1
999)
8.0
(0.3
1)R
-407
C0.
365
5.0
(9.0
)10
0(1
230)
750
(922
5)0.
240.
816,
267
46,9
4858
,558
439,
442
2813
.59.
710
.7-4
.312
.97.
211
.8-7
.8
Cha
nget
al.
(200
0)8.
0(0
.31)
R-2
90/R
-600
,50-
500.
219
12.3
(22.
1)57
(701
)15
9(1
956)
0.5
4,42
612
,346
51,5
3514
3,75
54
65.1
65.1
29.3
29.3
48.6
48.6
23.9
23.9
R-2
90/R
-600
,75-
250.
294
8.3
(14.
9)88
(108
2)17
0(2
091)
0.5
8,03
515
,522
77,6
8915
0,08
15
43.8
43.8
26.2
26.2
41.2
41.2
22.9
22.9
R-2
90/R
-600
,25-
750.
1710
.5(1
8.9)
63(7
75)
117
(143
9)0.
54,
275
7,94
058
,127
107,
951
348
.848
.816
.116
.148
.448
.411
.311
.3
R-2
90/R
-600
A,7
5-25
0.32
34.
6(8
.3)
95(1
168)
190
(233
7)0.
59,
041
18,0
8282
,382
166,
565
441
.441
.430
.130
.141
.741
.727
.827
.8
R-2
90/R
-600
a,50
-50
0.26
66.
5(1
1.7)
70(8
61)
155
(190
6)0.
55,
889
13,0
4162
,968
139,
429
339
.539
.522
.022
.044
.644
.619
.019
.0
R-2
90/R
-600
A,2
5-75
0.22
25.
6(1
0.1)
62(7
63)
152
(187
0)0.
54,
640
11,3
7657
,403
140,
731
352
.352
.331
.231
.241
.641
.627
.727
.7
Tab
le1.
Ran
ge
of
Data
An
aly
zed
an
dD
evia
tio
ns
of
Sh
ah
Co
rrela
tio
nA
lon
ean
dw
ith
Vari
ou
sC
orr
ecti
on
Facto
rs(c
ontin
ued)
DE-13-004 5
PREPRINT ONLY. Authors may request permission to reprint or post on their personal or company website once the final version of the article has been published.
Aut
hor
Dia
met
erm
m(i
n.)
Flu
ids
inM
ixtu
re,
Per
cent
Mas
sC
once
ntra
tion
ofC
ompo
nent
s
p rG
lide
°C(°
F)
Gkg
/m2 s
(lb/
ft2 s)
xR
e LT
Re G
TN
umbe
rof
Dat
a
Dev
iati
on,%
,Mea
n/A
vera
ge
Shah
2009
Bel
land
Gha
lyw
ith
Shah
Del
Col
2w
ithSh
ah(s
eeN
ote
2)
Mc-
Nau
ght
wit
hSh
ah
Hin
ton
and
Con
klin
(199
5)16
.8(0
.66)
R14
3A/R
124
75-2
50.
488
3.5
(6.3
)22
0(2
706)
375
(461
2)0.
538
,049
64,8
5728
9,94
9494
,230
416
.716
.78.
08.
010
.310
.37.
26.
3
DeG
rush
and
Stoe
cker
(198
7)
12.7
(0.5
0)
R12
/R11
430
-70
0.11
78.
3(1
4.9)
183
(225
1)23
3(2
866)
0.5
10,3
8813
,729
193,
844
244,
195
325
.825
.81.
70.
920
.020
.03.
4-3
.4
R-1
2/R
-114
,70-
300.
175
6.0
(10.
8)18
3(2
251)
233
(286
6)0.
512
,637
16,3
8818
9,26
723
9,64
74
26.2
26.2
11.5
11.5
18.7
18.9
8.7
8.7
R-1
2/R
-114
,50-
500.
146
8.2
(14.
8)18
3(2
251)
233
(286
6)0.
511
,551
14,7
0819
2,27
224
2,95
44
40.4
40.4
15.3
15.3
27.6
27.6
10.8
10.8
Ken
ney
etal
.(1
994)
7.04
(0.2
8)R
407C
0.29
5.3
(9.5
)75
(922
)65
0(7
995)
0.09
0.92
3,65
132
,108
40,2
1334
9,23
146
35.0
34.7
23.7
18.1
25.0
25.0
23.2
24.5
Smit
etal
.(2
002)
8.1
(0.3
2)
R22
/R14
2B90
-10
0.48
32.
7(4
.9)
40(4
92)
600
(738
0)0.
110.
852,
998
44,9
8121
,533
323,
455
349.
51.
211
.2-4
.58.
52.
011
.5-5
.2
R-2
2/R
142B
70-3
00.
488
5.9
(10.
6)40
(492
)60
0(7
380)
0.1
0.90
3,01
345
,329
21,2
4931
9,52
231
20.3
18.3
13.8
3.3
16.7
16.7
14.9
-1.3
R-2
2/R
142b
50-5
00.
507
6.7
(12.
1)40
(492
)60
0(7
380)
0.11
0.82
3,07
146
,397
21,0
9831
6,83
026
24.4
21.2
16.2
1.6
19.2
19.2
17.3
-1.8
Wen
etal
.(2
006)
2.56
(0.1
)Pr
opan
e/B
utan
e57
-43
0.15
13.1
(23.
6)20
5(2
521)
320
(393
6)0.
10.
844,
372
6,96
962
,307
99,6
3117
11.1
-10.
827
.4-2
7.4
17.6
-17.
629
.7-2
9.7
Jung
etal
.(2
004)
8.8
(0.3
5)R
407C
0.33
25.
1(9
.2)
200
(246
0)30
0(3
690)
0.1
0.97
12,9
7919
,811
131,
360
197,
440
1912
.111
.97.
9-1
1.3
9.5
8.1
8.5
-4.5
Jian
gan
dG
arim
ella
(200
3)
9.4
(0.3
7)R
-404
A0.
798
0.89
60.
2(0
.36)
200
(246
0)50
0(6
150)
0.13
0.86
27,9
7683
,158
98,1
4227
8,24
337
8.7
-3.9
7.9
-4.7
7.4
-2.8
7.8
-5.0
Wils
onet
al.
(200
3)3.
7(0
.14)
R-4
10A
0.43
50.
1(0
.18)
75(9
22)
400
(492
0)0.
100.
792,
702
14,4
1319
,392
103,
503
1211
.29.
011
.18.
67.
74.
611
.08.
5
Tab
le1.
Ran
ge
of
Data
An
aly
zed
an
dD
evia
tio
ns
of
Sh
ah
Co
rrela
tio
nA
lon
ean
dw
ith
Vari
ou
sC
orr
ecti
on
Facto
rs(c
ontin
ued)
6 DE-13-004

PREPRINT ONLY. Authors may request permission to reprint or post on their personal or company website once the final version of the article has been published.
Aut
hor
Dia
met
erm
m(i
n.)
Flu
ids
inM
ixtu
re,
Per
cent
Mas
sC
once
ntra
tion
ofC
ompo
nent
s
p rG
lide
°C(°
F)
Gkg
/m2 s
(lb/
ft2 s)
xR
e LT
Re G
TN
umbe
rof
Dat
a
Dev
iati
on,%
,Mea
n/A
vera
ge
Shah
2009
Bel
land
Gha
lyw
ith
Shah
Del
Col
2w
ith
Shah
(see
Not
e2)
Mc-
Nau
ght
wit
hSh
ah
Boi
sseu
xet
al.
(200
0)9.
5(0
.37)
R-4
07C
0.21
45.
6(1
0.1)
175
(215
2)0.
040.
969,
931
10,2
2713
1,95
613
2,39
813
24.1
23.7
13.7
6.7
35.2
35.2
12.2
3.1
R-4
17A
0.29
03.
1(5
.6)
207
(254
6)0.
020.
9512
,882
12,9
0415
1,61
215
2,28
110
50.5
50.5
38.8
38.8
53.8
53.8
36.2
36.2
Moi
chiz
ugie
tal.
(198
4)1
13.9
(0.5
5)
R-1
14/R
-11,
71-2
90.
076
2.7
(4.9
)82
(100
9)0.
54,
381
100,
554
115
.815
.89.
29.
2N
A8.
18.
1
R-1
14/R
-11,
37-6
30.
063.
5(6
.3)
81(9
96)
0.5
3,82
598
,619
111
.711
.71.
91.
9N
A0.
30.
3
Koz
itski
yet
al.
(197
1)1
40.0
(1.5
7)
R-2
2/R
-12,
75-2
50.
253
0.3
(0.5
4)1.
1(1
3.5)
3.7
(45.
5)0.
528
497
33,
371
11,5
494
17.1
-17.
131
.8-3
1.8
NA
33.0
-33.
0
R-2
2/R
-12,
12-8
80.
200
2.3
(4.1
)0.
9(1
1.1)
3.3
(40.
6)0.
521
176
82,
939
10,7
074
55.6
55.6
53.2
-53.
2N
A56
.2-5
6.2
All
data
for
hori
zont
altu
bes
1.49
(0.0
6)16
.8(0
.66)
32m
ixtu
res
0.03
90.
896
0.2
(0.3
6)35
.5(6
3.9)
40(4
92)
800
(984
0)0.
020.
982,
702
83,6
5919
,322
483,
000
527
26.9
23.4
17.7
4.1
20.1
6.3
17.6
0.5
1D
ata
for
vert
ical
tube
.All
othe
rda
taar
efo
rho
rizo
ntal
tube
s.2
The
devi
atio
nsgi
ven
for
Del
Col
etal
.cor
rect
ion
fact
orar
eon
lyfo
rho
rizo
ntal
tube
san
dm
ist,
annu
lar,
and
inte
rmitt
entf
low
patte
rns.
Tab
le1.
Ran
ge
of
Data
An
aly
zed
an
dD
evia
tio
ns
of
Sh
ah
Co
rrela
tio
nA
lon
ean
dw
ith
Vari
ou
sC
orr
ecti
on
Facto
rs(c
ontin
ued)
DE-13-004 7

PREPRINT ONLY. Authors may request permission to reprint or post on their personal or company website once the final version of the article has been published.
developed their correction factor using this correlation. Asstated earlier, the Del Col et al. correction was applied only tothe data with annular, mist, and intermittent flow patterns.Further, it was applied only to horizontal tubes as it is notapplicable to vertical tubes. For the data sets which gave onlythe mean heat transfer coefficients, the arithmetic mean of theinlet and outlet qualities was used for evaluation. All proper-ties were calculated using the NIST software REFPROPVersion 8.0 (Lemmon et al. 2007).
Results of Data Analysis
Table 1 lists the range of all data analyzed and the mean andaveragedeviationsof thedata setswith thepredictionsof theShahcorrelation (2009) alone as well as with corrections factors by thethree methods. Deviations are defined as follows.
The mean deviation is defined as
(17)
Average deviation is defined as
(18)
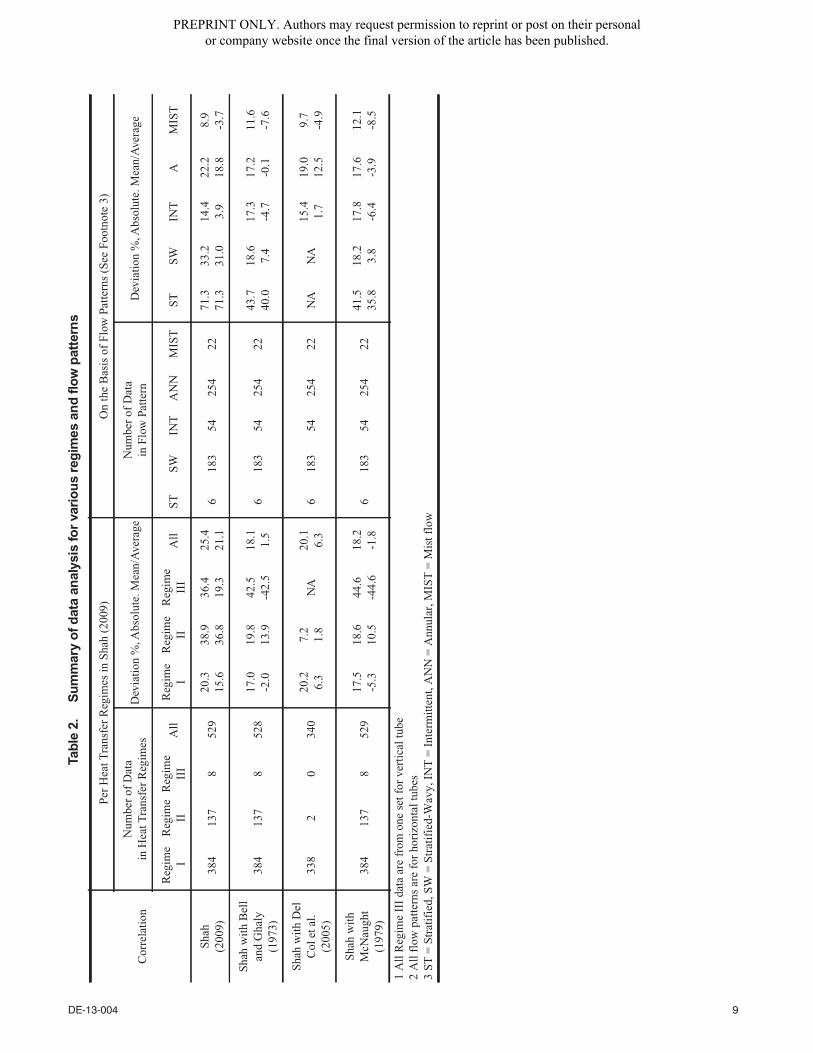
N is the number of data points.Table 2 gives the breakdown of deviations of horizontal tube
data in the three heat transfer regimes of the Shah correlation aswell as for the various flow patterns. Figures 1 to 5 provide graph-ical representation of some results to highlight some of the find-ings of this research.
DISCUSSION
As seen in Table 1, the data analyzed in this study include529 data points from 22 studies, for 36 fluid mixtures and temper-ature glides up to 35.5°C (63.9°F) for a wide range of reducedpressures and mass flow rates. The three correction factors gavemean deviations of about 17% to 20%. This is reasonably good,considering thewide rangeofdata.Someaspectsof the results arediscussed in the following to give better insight into them.
HeatTransfer Regimes of Shah Correlation
Considering the heat transfer regimes that correspond tothe Shah correlation (2009), the Bell and Ghaly correctionfactor (1973) has the least mean deviation in Regime I at17.0%, while that of the McNaught factor is a little higher at17.5%. Mean deviation with the Del Col et al. (2005) correc-tion factor is significantly higher at 20.2%. Hence the Belland Ghaly method (1973) is the best choice for Regime I. InRegime II, there are only two data points which had the flowpatterns to which Del Col et al. (2005) factor could beapplied. In this regime, the McNaught factor (1979) comesout best with a mean deviation of 18.6%, compared to 19.8%
with the Bell and Ghaly method (1973). In Regime II, massvelocities are lower than in Regime I. So the interfacial fric-tion is likely to be lower in Regime II, leading to greater masstransfer resistance as assumed by McNaught (1979). Thismay be the reason for the better performance of theMcNaught correction factor.
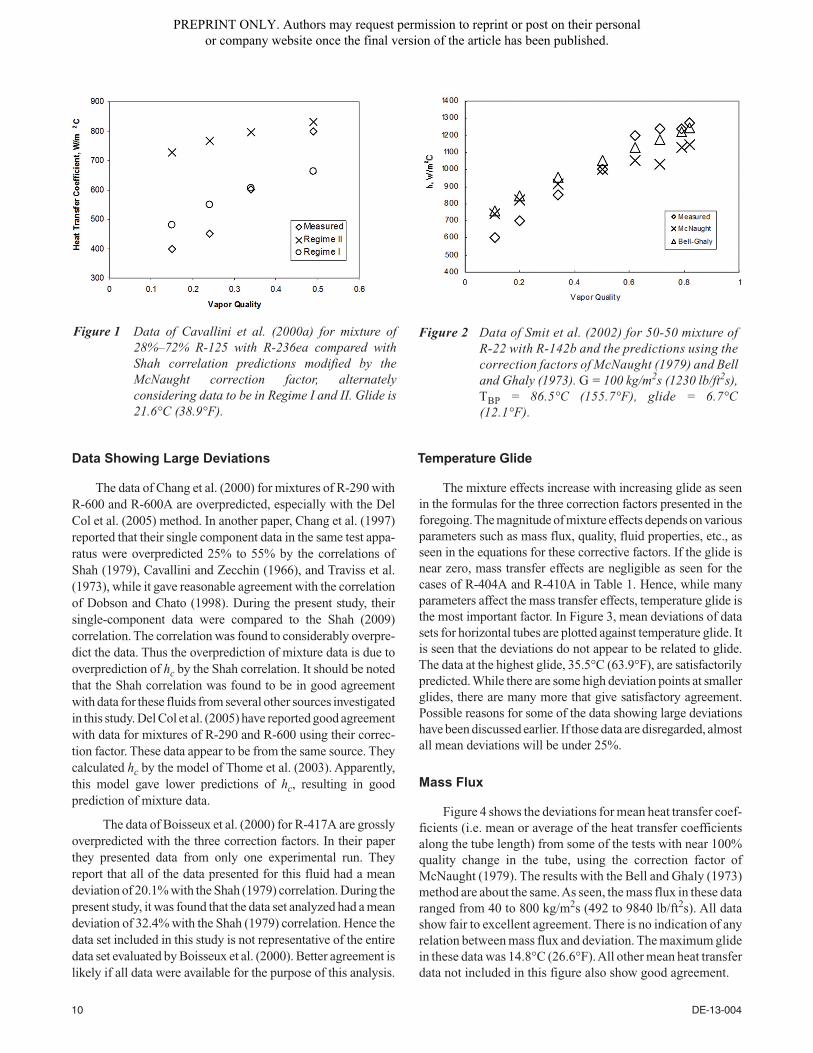
While the mean deviations considering all data arereasonably good, discrepancies were noticed in some casesin prediction of heat transfer regimes at the lowest flow rates.This is illustrated in Figure 1. According to the criterion ofEquation 10, these data are in Regime II. However, goodagreement is obtained, assuming them to be in Regime I. Theglide in these data was 21.6°C (38.9°F). Figure 2 shows dataof Smit et al. (2002) at the same flow rate but with a glide of6.7°C (12.1°F). These data are seen to be correctly predicted.Further, their mean heat transfer coefficient data atG = 40 kg/m2s (492 lb/ft2s) are also satisfactorily predicted.This appears to suggest that the boundary between Regime Iand II changes at high values of glide. It is therefore desirableto further investigate this point, considering all data at lowflow rates. The development of a new criterion for thisboundary, however, is beyond the scope of the present study.
Flow Patterns
In the stratified flow pattern, the mean deviations ofpredictions by both McNaught (1979) and Bell and Ghaly(1973) methods are high. It is mainly due to two data pointswhich have very high deviations; one of these is included inFigure 1. If these two are disregarded, the mean deviation ofthe remaining points is 17%. These two data points are at theboundary of Regimes I and II, and were predicted to be inRegime II. If they were in Regime I, good agreement will beobtained with both correction factors. Such scatter is notunusual near the boundaries. The possibility of the boundarybeing affected by glide has been discussed in the previoussection. It is to be noted that the Shah correlation was verifiedwith a very wide range of data that included very low flowrates and hence must have included many data in the strati-fied regime.
In the annular flow regime, the mean deviation withthe Del Col et al. (2005) method is somewhat higher than thatwith the other two methods. It should be noted that Del Colet al. optimized their method using the model of Thome et al.(2003) for pure fluids. If that model were used instead of theShah correlation, it is possible that the mean deviation couldbe lower than what was obtained here.
In the mist flow pattern, 19 of the 22 data points arefor R-404A, which has a glide of only 0.2°C (0.36°F). Soit is really a test of only the Shah correlation (2009). It is,however, satisfying to note the correct trend of the predic-tions of the three correction factors. As expected from theirmodels, McNaught (1979) predicts lowest and Del Col etal. (2005) highest, with Bell and Ghaly (1973) in betweenthe two.
m
AN
1
BS h predicted hmeasured– hmeasured
N----------------------------------------------------------------------------------------------------------------=
avg
h predicted hmeasured– hmeasured N
1
N----------------------------------------------------------------------------------------------------=
8 DE-13-004
PREPRINT ONLY. Authors may request permission to reprint or post on their personal or company website once the final version of the article has been published.
Tab
le2.
Su
mm
ary
of
data
an
aly
sis
for
vari
ou
sre
gim
es
an
dfl
ow
patt
ern
s
Cor
rela
tion
Per
Hea
tTra
nsfe
rR
egim
esin
Shah
(200
9)O
nth
eB
asis
ofFl
owPa
ttern
s(S
eeFo
otno
te3)
Num
ber
ofD
ata
inH
eatT
rans
fer
Reg
imes
Dev
iatio
n%
,Abs
olut
e.M
ean/
Ave
rage
Num
ber
ofD
ata
inFl
owPa
ttern
Dev
iatio
n%
,Abs
olut
e.M
ean/
Ave
rage
Reg
ime
IR
egim
eII
Reg
ime
III
All
Reg
ime
IR
egim
eII
Reg
ime
III
All
STSW
INT
AN
NM
IST
STSW
INT
AM
IST
Shah
(200
9)38
413
78
529
20.3
15.6
38.9
36.8
36.4
19.3
25.4
21.1
618
354
254
2271
.371
.333
.231
.014
.43.
922
.218
.88.
9-3
.7
Shah
with
Bel
lan
dG
haly
(197
3)38
413
78
528
17.0
-2.0
19.8
13.9
42.5
-42.
518
.11.
56
183
5425
422
43.7
40.0
18.6
7.4
17.3
-4.7
17.2
-0.1
11.6
-7.6
Shah
with
Del
Col
etal
.(2
005)
338
20
340
20.2
6.3
7.2
1.8
NA
20.1
6.3
618
354
254
22N
AN
A15
.41.
719
.012
.59.
7-4
.9
Shah
with
McN
augh
t(1
979)
384
137
852
917
.5-5
.318
.610
.544
.6-4
4.6
18.2
-1.8
618
354
254
2241
.535
.818
.23.
817
.8-6
.417
.6-3
.912
.1-8
.5
1A
llR
egim
eII
Ida
taar
efr
omon
ese
tfor
vert
ical
tube
2A
llfl
owpa
ttern
sar
efo
rho
rizo
ntal
tube
s3
ST=
Stra
tifie
d,SW
=St
ratif
ied-
Wav
y,IN
T=
Inte
rmitt
ent,
AN
N=
Ann
ular
,MIS
T=
Mis
tflo
w
DE-13-004 9
PREPRINT ONLY. Authors may request permission to reprint or post on their personal or company website once the final version of the article has been published.
Data Showing Large Deviations
The data of Chang et al. (2000) for mixtures of R-290 withR-600 and R-600A are overpredicted, especially with the DelCol et al. (2005) method. In another paper, Chang et al. (1997)reported that their single component data in the same test appa-ratus were overpredicted 25% to 55% by the correlations ofShah (1979), Cavallini and Zecchin (1966), and Traviss et al.(1973), while it gave reasonable agreement with the correlationof Dobson and Chato (1998). During the present study, theirsingle-component data were compared to the Shah (2009)correlation. The correlation was found to considerably overpre-dict the data. Thus the overprediction of mixture data is due tooverprediction of hc by the Shah correlation. It should be notedthat the Shah correlation was found to be in good agreementwith data for these fluids from several other sources investigatedin this study. Del Col et al. (2005) have reported good agreementwith data for mixtures of R-290 and R-600 using their correc-tion factor. These data appear to be from the same source. Theycalculated hc by the model of Thome et al. (2003). Apparently,this model gave lower predictions of hc, resulting in goodprediction of mixture data.
The data of Boisseux et al. (2000) for R-417A are grosslyoverpredicted with the three correction factors. In their paperthey presented data from only one experimental run. Theyreport that all of the data presented for this fluid had a meandeviation of 20.1% with the Shah (1979) correlation. During thepresent study, it was found that the data set analyzed had a meandeviation of 32.4% with the Shah (1979) correlation. Hence thedata set included in this study is not representative of the entiredata set evaluated by Boisseux et al. (2000). Better agreement islikely if all data were available for the purpose of this analysis.
Temperature Glide
The mixture effects increase with increasing glide as seenin the formulas for the three correction factors presented in theforegoing.The magnitude of mixture effects depends on variousparameters such as mass flux, quality, fluid properties, etc., asseen in the equations for these corrective factors. If the glide isnear zero, mass transfer effects are negligible as seen for thecases of R-404A and R-410A in Table 1. Hence, while manyparameters affect the mass transfer effects, temperature glide isthe most important factor. In Figure 3, mean deviations of datasets for horizontal tubes are plotted against temperature glide. Itis seen that the deviations do not appear to be related to glide.The data at the highest glide, 35.5°C (63.9°F), are satisfactorilypredicted. While there are some high deviation points at smallerglides, there are many more that give satisfactory agreement.Possible reasons for some of the data showing large deviationshave been discussed earlier. If those data are disregarded, almostall mean deviations will be under 25%.
Mass Flux
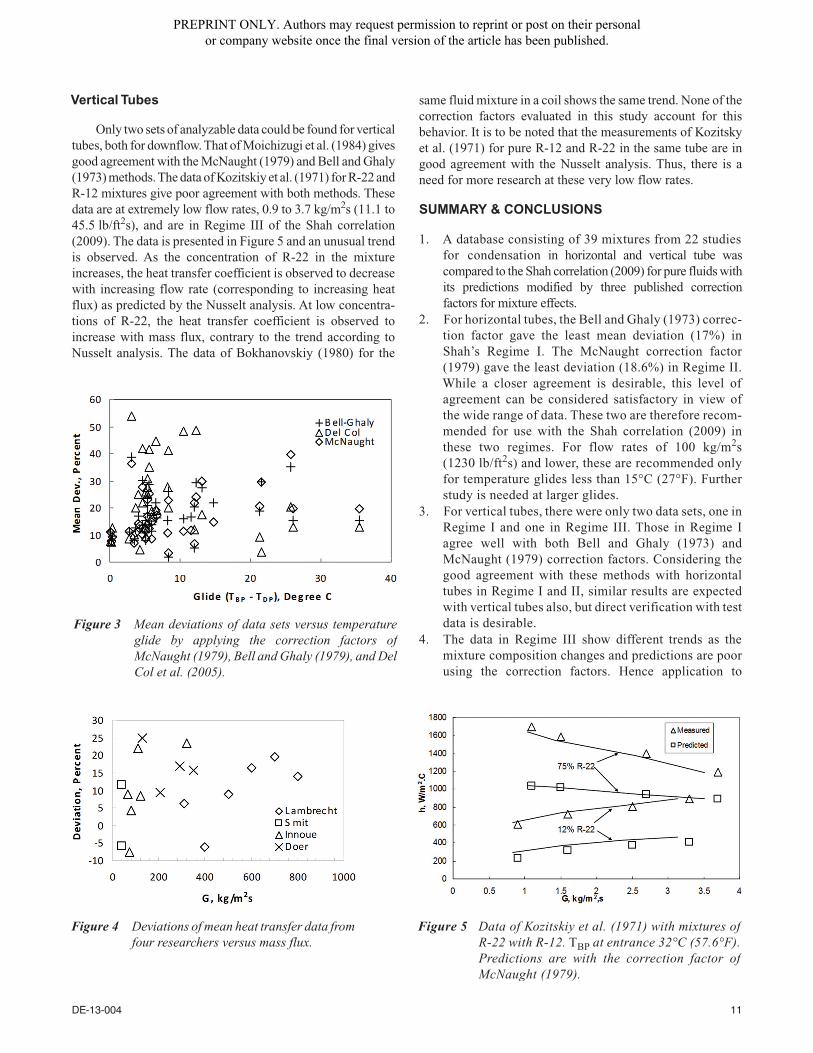
Figure 4 shows the deviations for mean heat transfer coef-ficients (i.e. mean or average of the heat transfer coefficientsalong the tube length) from some of the tests with near 100%quality change in the tube, using the correction factor ofMcNaught (1979). The results with the Bell and Ghaly (1973)method are about the same.As seen, the mass flux in these dataranged from 40 to 800 kg/m2s (492 to 9840 lb/ft2s). All datashow fair to excellent agreement. There is no indication of anyrelation between mass flux and deviation. The maximum glidein these data was 14.8°C (26.6°F).All other mean heat transferdata not included in this figure also show good agreement.
Figure 1 Data of Cavallini et al. (2000a) for mixture of28%–72% R-125 with R-236ea compared withShah correlation predictions modified by theMcNaught correction factor, alternatelyconsidering data to be in Regime I and II. Glide is21.6°C (38.9°F).
Figure 2 Data of Smit et al. (2002) for 50-50 mixture ofR-22 with R-142b and the predictions using thecorrection factors of McNaught (1979) and Belland Ghaly (1973). G = 100 kg/m2s (1230 lb/ft2s),TBP = 86.5°C (155.7°F), glide = 6.7°C(12.1°F).
10 DE-13-004
PREPRINT ONLY. Authors may request permission to reprint or post on their personal or company website once the final version of the article has been published.
Vertical Tubes
Only two sets of analyzable data could be found for verticaltubes, both for downflow. That of Moichizugi et al. (1984) givesgood agreement with the McNaught (1979) and Bell and Ghaly(1973) methods.The data of Kozitskiy et al. (1971) for R-22 andR-12 mixtures give poor agreement with both methods. Thesedata are at extremely low flow rates, 0.9 to 3.7 kg/m2s (11.1 to45.5 lb/ft2s), and are in Regime III of the Shah correlation(2009). The data is presented in Figure 5 and an unusual trendis observed. As the concentration of R-22 in the mixtureincreases, the heat transfer coefficient is observed to decreasewith increasing flow rate (corresponding to increasing heatflux) as predicted by the Nusselt analysis. At low concentra-tions of R-22, the heat transfer coefficient is observed toincrease with mass flux, contrary to the trend according toNusselt analysis. The data of Bokhanovskiy (1980) for the
same fluid mixture in a coil shows the same trend. None of thecorrection factors evaluated in this study account for thisbehavior. It is to be noted that the measurements of Kozitskyet al. (1971) for pure R-12 and R-22 in the same tube are ingood agreement with the Nusselt analysis. Thus, there is aneed for more research at these very low flow rates.
SUMMARY & CONCLUSIONS
1. A database consisting of 39 mixtures from 22 studiesfor condensation in horizontal and vertical tube wascompared to the Shah correlation (2009) for pure fluids withits predictions modified by three published correctionfactors for mixture effects.
2. For horizontal tubes, the Bell and Ghaly (1973) correc-tion factor gave the least mean deviation (17%) inShah’s Regime I. The McNaught correction factor(1979) gave the least deviation (18.6%) in Regime II.While a closer agreement is desirable, this level ofagreement can be considered satisfactory in view ofthe wide range of data. These two are therefore recom-mended for use with the Shah correlation (2009) inthese two regimes. For flow rates of 100 kg/m2s(1230 lb/ft2s) and lower, these are recommended onlyfor temperature glides less than 15°C (27°F). Furtherstudy is needed at larger glides.
3. For vertical tubes, there were only two data sets, one inRegime I and one in Regime III. Those in Regime Iagree well with both Bell and Ghaly (1973) andMcNaught (1979) correction factors. Considering thegood agreement with these methods with horizontaltubes in Regime I and II, similar results are expectedwith vertical tubes also, but direct verification with testdata is desirable.
4. The data in Regime III show different trends as themixture composition changes and predictions are poorusing the correction factors. Hence application to
Figure 4 Deviations of mean heat transfer data fromfour researchers versus mass flux.
Figure 5 Data of Kozitskiy et al. (1971) with mixtures ofR-22 with R-12. TBP at entrance 32°C (57.6°F).Predictions are with the correction factor ofMcNaught (1979).
Figure 3 Mean deviations of data sets versus temperatureglide by applying the correction factors ofMcNaught (1979), Bell and Ghaly (1979), and DelCol et al. (2005).
DE-13-004 11
PREPRINT ONLY. Authors may request permission to reprint or post on their personal or company website once the final version of the article has been published.
Regime III is not recommended for any tube orienta-tion. More experimental and theoretical research isneeded for condensation of mixtures at very low flowrates (Regime III) to gain understanding of the mecha-nisms and developing methods to predict heat transfer.
5. It is expected that the application of the correction factors formixture effects evaluated in this study, to the predictionsof reliable general correlations for pure fluids otherthan the Shah correlation (2009) will give similarresults; verification is desirable.
ACKNOWLEDGEMENTS
This material is based upon work supported by theDepartment of Energy (Geothermal Technologies Program)under award DE-EE0002770 (Tailored Working Fluids forEnhanced Geothermal Power Plants) to the United Technolo-gies Research Center. This paper was prepared as an accountof work sponsored by an agency of the United States Govern-ment. Neither the United States Government nor any agencythereof, nor any of their employees, makes any warranty,express or implied, or assumes any legal liability or responsi-bility for the accuracy, completeness, or usefulness of anyinformation, apparatus, process, or process disclosed, orrepresents that its use would not infringe privately ownedrights. Reference herein to any specific commercial product,process, or service by trade name, trademark, manufacturer, orotherwise does not necessarily constitute or imply its endorse-ment, recommendation, or favoring by the United StatesGovernment or any agency thereof. The views and opinions ofauthors expressed herein do not necessarily reflect those of theUnited States Government or any agencies thereof. Theauthors are grateful for the support of the Department ofEnergy (DOE).
NOMENCLATURE
Cpg = specific heat of vapor at constant pressure(J kg–1 K–1) (Btu/lb·°F)
D = inside diameter of tube (m) (ft)
G = total mass flux (liquid + vapor) (kg m–2 s–1)(lb ft–2s–1)
g = acceleration due to gravity (m s–2) (ft s–2)
h = heat transfer coefficient (W m–2 K–1)(Btu ft–2·°F–1 s–1)
hc = condensing heat transfer coefficient of mixtureconsidering it to be a single fluid with mixtureproperties (W m–2 K–1) (Btu ft–2·°F–1 s–1)
hI = heat transfer coefficient given by Equation 4(W m–2 K–1) (Btu ft–2·°F–1 s–1)
hG = heat transfer coefficient of vapor phase flowing inthe cross-section occupied by vapor (W m–2 K–1)(Btu ft–2·°F–1 s–1)
hGS = heat transfer coefficient of vapor phase flowingalone in the tube (W m–2 K–1) (Btu ft–2·°F–1 s–1)
hLS = heat transfer coefficient assuming liquid phaseflowing alone in the tube (W m–2 K–1)(Btu ft–2·°F–1 s–1)
hLT = heat transfer coefficient assuming all mass flowingas liquid (W m–2 K–1) (Btu ft–2·°F–1 s–1)
hmix = condensing heat transfer coefficient of mixture (Wm–2 K–1) (Btu ft–2·oF–1 s–1) (Btu ft–2·°F–1 s–1)
hNu = heat transfer coefficient given by Equation 5, theNusselt relation (W m–2 K–1) (Btu ft–2·°F–1 s–1)
hTP = condensation heat transfer coefficient (W m–2 K–1)(Btu ft–2·°F–1 s–1)
I = enthalpy of mixture (J kg–1) (Btu lb–1)
Jg = dimensionless vapor velocity defined by Equation 9
k = thermal conductivity of fluid (W/m K) (Btu/ft s)
pr = reduced pressure
Pr = Prandtl number
ReGT = Reynolds number assuming total mass flowing asvapor, = GD/µg
ReLS = Reynolds number assuming liquid phase flowingalone, = G (1 – x) D/µf
ReLT = Reynolds number assuming total mass flowing asliquid = GD/µf
uGS = vapor velocity assuming vapor phase flowing alonein the tube (m s–1)
TBP = bubble point temperature of mixture (K) (R)
TDP = dew point temperature of mixture (K) (R)
Tglide = temperature glide, TDP – TBP, (K) (R)
x = vapor quality
Z = Shah’s correlating parameter = (1/x – 1)0.8 pr0.4
Greek
= Ackermann factor, defined by Equation 15
= dynamic viscosity, kg/(m.s) (lb/ft s)
= density, kg/m3 (lb/ft3)
Subscripts
f = of liquid
g = of vapor
REFERENCES
Afroz, H.M.M., Miyara, A., and K. Tsubaki. 2008. Heattransfer coefficients and pressure drops during in-tubecondensation of CO2/DME mixture refrigerant. Interna-tional Journal of Refrigeration 31:1458–66.
Ananiev, E.P., I.D. Boyko, and G.N. Kruzhilin. 1961. Heattransfer in the presence of steam condensation in hori-zontal tubes. International Developments in Heat Trans-fer (2):290–5.
Bell, K.J., and M.A. Ghaly. 1973. An approximate general-ized method for multicomponent partial condenser.
12 DE-13-004
PREPRINT ONLY. Authors may request permission to reprint or post on their personal or company website once the final version of the article has been published.
American Institute of Chemical Engineers SymposiumSeries 69:72–9.
Bokhanovskiy, Y.G. 1980. Heat transfer from Freon-12,Freon-22 and their mixtures in a coiled tube condenser.Heat Transfer: Soviet Research 12(4):43–5.
Boissieux, X., Heikal, M.R., Johns, R.A. 2000. Two-phaseheat transfer coefficients of three HFC refrigerantsinside a horizontal smooth tube, part II: condensation.International Journal of Refrigeration 23:345–52.
Cavallini, A. and R. Zecchin. 1966. High velocity condensa-tion of R-11 vapors inside vertical tubes. Studies onHeat Transfer in Refrigeration: Proceedings, Commis-sion 2. Trondheim, Norway: International Institute ofRefrigeration.
Cavallini, A., G. Censi, D. Del Col, L. Doretti, L. Rossetto,G.A. Longo. 1999. Condensation of R-22 and R-407Cinside a horizontal tube. Proceedings of the 20th Inter-national Congress of Refrigeration France.
Cavallini, A., G. Censi, D. Del Col, L. Doretti, L. Rossetto,S. Zilio, and G.A. Longo. 2000a. Analysis and predic-tion of condensation heat transfer of the zeotropic mix-ture R-125/236ea. Heat Transfer Division 366(4):103–10.
Cavallini, A., D. Del Col, and L. Doretti. 2000b. Condensa-tion of R-125, R-236ea and their 46/54% mixture insidea horizontal tube. Proceedings of the 34th National HeatTransfer Conference, 421–8. PA: Pittsburgh.
Cavallini, A., D.D. Col, L. Doretti, M. Matkovic, L. Ros-setto, and C. Zilio. 2006. Condensation in horizontalsmooth tubes: a new heat transfer model for heatexchanger design. Heat Transfer Engineering,27(8):31–8.
Chang, Y.S., Kim, M.S., S.T. Ro. 1997. Condensing heattransfer characteristics of hydrocarbon refrigerants in ahorizontal tube. Transactions of the Korean Society ofMechanical Engineers 21: 1656–67.
Chang, Y. S., M.S. Kim, and S.T. Ro. 2000. Performance andheat transfer characteristics of hydrocarbon refrigerantsin a heat pump system. International Journal of Refrig-eration 23: 232–42.
Colburn, A.P., and T.B. Drew. 1937. The condensation ofmixed vapors. Transactions of the American Institute ofChemical Engineers 33: 197–215.
DeGrush, D., and W.F. Stoecker. Measurement of heat trans-fer coefficients of nonazeotropic refrigerant mixturescondensing inside horizontal tubes. ORNL/Sub/81-7762/6 & 01.
Del Col, D., A. Cavallini, J.R. Thome. 2005. Condensationof zeotropic mixtures in horizontal tubes: new simpli-fied heat transfer model based on flow regimes. J. HeatTransfer, 127:221–30.
Dobson, M.K. and J.C. Chato 1998. Condensation in smoothhorizontal tubes. Journal of Heat Transfer, 120: 193–213.
Doer, T.M., S.J. Eckels, and M. B. Pate.1994. In-tube con-densation heat transfer of refrigerant mixtures. ASHRAETransactions 100(2): 547–57.
Eckels, S.J., and M.B. Pate. 1991. Evaporation and conden-sation heat transfer coefficients for a HCFC-124/HCFC-22/HCFC-152a blend and CFC-12. Proc. USNCIIR andASHRAE-CFC Conf., Purdue. University.
El Hajal, J., J.R. Thome, and A. Cavallini. 2003. Condensa-tion in horizontal tubes, part I: two-phase flow patternmap. International Journal of Heat and Mass Transfer.46:3349–63.
Hinton, D. L., and J.C. Conklin. 1995. Condensation ofrefrigerants flowing inside smooth and corrugated tubes.Fourth ASME/JSME Thermal Engineering Joint Con-ference, March 19–24, HI: Maui.
Inoue, M., et al 1988. Condensation of zeotropic binary mix-tures in a horizontal tube (R-113/R114). Twenty FifthJapanese National Heat Transfer Symposium, 460–2.
Jiang, Y., and S. Garimella. 2003. Heat transfer and pressuredrop for condensation of refrigerant R-404A at near crit-ical pressure. ASHRAE Transactions 109(1):677–88.
Jin, D.X., J.T. Kwon, and M.H. Kim. 2003. Prediction of in-tube condensation heat transfer characteristics of binaryrefrigerant mixtures. International Journal of Refrigera-tion 26: 593–600.
Jung, D., Y. Cho, and K. Park. 2004. Flow condensation heattransfer coefficients of R22, R134a, R407C, and R410Ainside plain and microfin tubes. International Journal ofRefrigeration 27:25–32.
Kenney, P. J., J.C. Chato, M K. Dobson, et al. 1994. Conden-sation of zeotropic refrigerant R-32/R-125/R-134a(23%/25%/52%) in a horizontal tube. ACRC-TR-62.Urbana: University of Illinois.
Kogawa, K. 1993. An experimental study on condensation ofR134a/R123 mixtures inside horizontal smooth andmicro-fin tubes. Master’s thesis, Kyushu University,Fukouka, Japan. Quoted by Jin et al (2003).
Kozitskiy, V.I., A.P. Klimenko, L.F. Tolubinskaya, and V.S.Shevchuk. 1971. Heat transfer for condensing mixturesof Freons 12 and 22. Heat Transfer: Soviet Research6(3):171–5.
Lambrechts, A., L. Liebenberg, A.E. Bergles, and J.P.Meyer. 2006. Heat transfer performance during conden-sation inside horizontal smooth micro-fin and herring-bone tubes. Journal of Heat Transfer 128:691–700.
Lemmon, E.W., M.L. Huber, and M.O. McLinden. 2007.NIST Reference Fluid Thermodynamic and TransportProperties—REFPROP, Version 8.0. NIST, Gaithers-burg, MD.
Lockhart, R.W. and R.C. Martinelli. 1949. Proposed correla-tion of data for isothermal two-phase two-componentflow in pipes. Chemical Engineering Progress45(1):39–48.
McAdams, W.H. 1954. Heat Transmission, 3rd ed. NewYork: McGraw-Hill.
DE-13-004 13
PREPRINT ONLY. Authors may request permission to reprint or post on their personal or company website once the final version of the article has been published.
McNaught, J.M. 1979. Mass-transfer correction term indesign methods for multicomponent/partial condensers.Condensation Heat Transfer. 111–8. ASME Publica-tion.
Mochizuki, S., Y. Yagi, and R. Tadano. 1984. Convectivefilmwise condensation of nonazeotropic binary mixturesin a vertical tube. Journal of Heat Transfer 106:531–8.
Mochizuki, S., T. Inoue, M. Tominga. 1990. Condensationheat transfer of nonazeotropic binary mixtures(R113+R11) in a horizontal tube. Heat Transfer—Japa-nese Research 19(2):33–42.
Moser, K.W., R.L. Webb, and B. Na 1998. A new equivalentReynolds number model for condensation in smoothtubes. Journal of Heat Transfer 120:410–6.
Sardesai, R.G., J.W. Palen, and J. Taborek. 1983. Modifiedresistance proration method for condensation of vapormixtures. AIChE Symp. Ser., 79(225): 41–6.
Smit, F.J., J.R. Thome, and J.P. Meyer. 2002. Heat transfercoefficients during condensation of the zeotropic refrig-erant mixture HCFC- 22/HCFC-142b. Journal of HeatTransfer 124: 1137–46.
Shah, M. M. 1979. A general correlation for heat transferduring film condensation in pipes. International Journalof Heat and Mass Transfer 22:547–56.
Shah, M.M. 2009. An improved and extended general corre-lation for heat transfer during condensation in plaintubes. HVAC&R Research 15 (October): 889–913.
Taylor, R.G. and R. Krishna. 1993. Multicomponent MassTransfer, New York: John Wiley and Sons.
Thome, J.R., J. El Hajal, and A. Cavallini. 2003. Condensa-tion in horizontal tubes part 2: new heat transfer modelbased on flow regimes. International Journal of Heatand Mass Transfer 46: 3365–87.
Traviss, D.P., W.M. Rohsenow, and A.B. Baron. 1973.Forced convection condensation inside tubes: A heattransfer equation for condenser design. ASHRAE Trans-actions 79(1):157–65.
Vardhan, A. 1997. Heat transfer and pressure drop character-istics of R-22, R-134a and R-407C in microchanneltubes. Master’s thesis, Department of Mechanical Engi-neering, University of Illinois at Urbana-Champaign, IL.
Wen, M.Y., C.Y. Ho, and J.M. Hsieh. 2006. Condensationheat transfer and pressure drop characteristics of R-290(propane), R-600 (butane), and a mixture of R-290/R-600 in the serpentine small-tube bank. Applied ThermalEngineering 26:2045–53.
Wilson, M.J., T.A. Newell, J.C. Chato, and C.A. Infante Fer-reira. 2003. Refrigerant charge, pressure drop, and con-densation heat transfer in flattened tubes. Int. J. Refrig.,26:443–51.
14 DE-13-004