Embed Size (px)
Citation preview

DDC112
Dual Current Input 20-BitANALOG-TO-DIGITAL CONVERTER
FEATURES MONOLITHIC CHARGE MEASUREMENT A/D
CONVERTER
DIGITAL FILTER NOISE REDUCTION:3.2ppm, rms
INTEGRAL LINEARITY:±0.005% Reading ±0.5ppm FSR
HIGH PRECISION, TRUE INTEGRATING FUNC-TION
PROGRAMMABLE FULL-SCALE
SINGLE SUPPLY
CASCADABLE OUTPUT
APPLICATIONS DIRECT PHOTOSENSOR DIGITIZATION
CT SCANNER DAS
INFRARED PYROMETER
PRECISION PROCESS CONTROL
LIQUID/GAS CHROMATOGRAPHY
BLOOD ANALYSIS
DESCRIPTIONThe DDC112 is a dual input, wide dynamic range, charge-digitizing analog-to-digital (A/D) converter with 20-bit resolu-tion. Low-level current output devices, such as photosensors,can be directly connected to its inputs. Charge integration iscontinuous as each input uses two integrators; while one isbeing digitized, the other is integrating.
For each of its two inputs, the DDC112 combines current-to-voltage conversion, continuous integration, programmablefull-scale range, A/D conversion, and digital filtering to achievea precision, wide dynamic range digital result. In addition tothe internal programmable full-scale ranges, external integrat-ing capacitors allow an additional user-settable full-scalerange of up to 1000pC.
To provide single-supply operation, the internal A/D converterutilizes a differential input, with the positive input tied to VREF.When the integration capacitor is reset at the beginning ofeach integration cycle, the capacitor charges to VREF. Thischarge is removed in proportion to the input current. At theend of the integration cycle, the remaining voltage is com-pared to VREF.
The high-speed serial shift register which holds the result ofthe last conversion can be configured to allow multiple DDC112units to be cascaded, minimizing interconnections. TheDDC112 is available in an SO-28 or TQFP-32 package and isoffered in two performance grades.
Protected by US Patent #5841310
DualSwitchedIntegrator
DualSwitchedIntegrator
∆ΣModulator
DigitalFilter
Control
DigitalInput/Output
DVALIDDXMITDOUTDIN
DCLK
RANGE2RANGE1RANGE0
TEST CONV CLK
CAP1ACAP1A
CAP1BCAP1B
CAP2ACAP2A
CAP2BCAP2B
IN2
IN1
VREF DGNDDVDDAGNDAVDD
CHANNEL 1
CHANNEL 2
SBAS085B – JANUARY 2000 – REVISED OCTOBER 2004
DDC112®
DDC112®
www.ti.com
PRODUCTION DATA information is current as of publication date.Products conform to specifications per the terms of Texas Instrumentsstandard warranty. Production processing does not necessarily includetesting of all parameters.
Copyright © 2000-2004, Texas Instruments Incorporated
Please be aware that an important notice concerning availability, standard warranty, and use in critical applications ofTexas Instruments semiconductor products and disclaimers thereto appears at the end of this data sheet.
All trademarks are the property of their respective owners.

DDC1122SBAS085Bwww.ti.com
AVDD to DVDD ....................................................................... –0.3V to +6VAVDD to AGND ..................................................................... –0.3V to +6VDVDD to DGND ..................................................................... –0.3V to +6VAGND to DGND ............................................................................... ±0.3VVREF Voltage to AGND ........................................... –0.3V to AVDD + 0.3VDigital Input Voltage to DGND .............................. –0.3V to DVDD + 0.3VDigital Output Voltage to DGND ........................... –0.3V to DVDD + 0.3VPackage Power Dissipation ............................................. (TJMAX – TA)/θJA
Maximum Junction Temperature (TJMAX) ...................................... +150°CThermal Resistance, SO, θJA .................................................... +150°C/WThermal Resistance, TQFP, θJA ................................................ +100°C/WLead Temperature (soldering, 10s) ............................................... +300°C
NOTE: (1) Stresses above those listed under Absolute Maximum Ratings maycause permanent damage to the device. Exposure to absolute maximumconditions for extended periods may affect device reliability.
ABSOLUTE MAXIMUM RATINGS(1)
PACKAGE/ORDERING INFORMATION(1)
MAXIMUM SPECIFICATIONINTEGRAL TEMPERATURE PACKAGE ORDERING TRANSPORT
PRODUCT LINEARITY ERROR RANGE PACKAGE-LEAD DESIGNATOR NUMBER(2) MEDIA
DDC112U ±0.025% Reading ±1.0ppm FSR –40°C to +85°C SO-28 DW DDC112U Rails
" " " " " DDC112U/1K Tape and Reel
DDC112UK ±0.025% Reading ±1.0ppm FSR 0°C to +70°C SO-28 DW DDC112UK Rails
" " " " " DDC112UK/1K Tape and Reel
DDC112Y ±0.025% Reading ±1.0ppm FSR –40°C to +85°C TQFP-32 PJT DDC112Y/250 Tape and Reel
" " " " " DDC112Y/2K Tape and Reel
DDC112YK ±0.025% Reading ±1.0ppm FSR 0°C to +70°C TQFP-32 PJT DDC112YK/250 Tape and Reel
" " " " " DDC112YK/2K Tape and Reel
NOTES: (1) For the most current package and ordering information, see the Package Option Addendum located at the end of this data sheet. (2) Models with a slash(/) are available only in Tape and Reel in the quantities indicated (/1K indicates 1000 devices per reel). Ordering 1000 pieces of DDC112U/1K will get a single 1000-piece Tape and Reel.
ELECTROSTATICDISCHARGE SENSITIVITY
This integrated circuit can be damaged by ESD. Texas Instru-ments recommends that all integrated circuits be handled withappropriate precautions. Failure to observe proper handlingand installation procedures can cause damage.
ESD damage can range from subtle performance degradationto complete device failure. Precision integrated circuits may bemore susceptible to damage because very small parametricchanges could cause the device not to meet its publishedspecifications.

DDC112 3SBAS085B www.ti.com
ELECTRICAL CHARACTERISTICSAt TA = +25°C, AVDD = DVDD = +5V, DDC112U, Y: TINT = 500µs, CLK = 10MHz, DDC112UK, YK: TINT = 333.3µs, CLK = 15MHz, VREF = +4.096V, continuous modeoperation, and internal integration capacitors, unless otherwise noted.
Specifications same as DDC112U, Y.NOTES: (1) Input is less than 1% of full scale. (2) CSENSOR is the capacitance seen at the DDC112 inputs from wiring, photodiode, etc. (3) FSR is Full-Scale Range.(4) A best-fit line is used in measuring linearity. (5) Matching between side A and side B, not input 1 to input 2. (6) Voltage produced by the DDC112 at its input whichis applied to the sensor. (7) Range drift does not include external reference drift. (8) Input reference current decreases with increasing TINT (see the Voltage Referencesection). (9) Data format is Straight Binary with a small offset (see the Data Retrieval section). (10) Ensured by design but not production tested.
DDC112U, Y DDC112UK, YK
PARAMETER CONDITIONS MIN TYP MAX MIN TYP MAX UNITS
ANALOG INPUTSExternal, Positive Full-Scale
Range 0 CEXT = 250pF 1000 pCInternal, Positive Full-Scale
Range 1 47.5 50 52.5 pCRange 2 95 100 105 pCRange 3 142.5 150 157.5 pCRange 4 190 200 210 pCRange 5 237.5 250 262.5 pCRange 6 285 300 315 pCRange 7 332.5 350 367.5 pC
Negative Full-Scale Input –0.4% of Positive FS pC
DYNAMIC CHARACTERISTICSConversion Rate 2 3 kHzIntegration Time, TINT Continuous Mode 500 1,000,000 333.3 µsIntegration Time, TINT Non-Continuous Mode 50 µsSystem Clock Input (CLK) 1 10 12 15 MHzData Clock (DCLK) 12 15 MHz
ACCURACYNoise, Low-Level Current Input(1) CSENSOR
(2) = 0pF, Range 5 (250pC) 3.2 ppm of FSR(3), rmsCSENSOR = 25pF, Range 5 (250pC) 3.8 ppm of FSR, rmsCSENSOR = 50pF, Range 5 (250pC) 4.2 6.0 7 ppm of FSR, rms
Differential Linearity Error ±0.005% Reading ±0.5ppmFSR (max)
Integral Linearity Error(4) ±0.005% Reading ±0.5ppmFSR (typ)
±0.025% Reading ±1.0ppmFSR (max)
No Missing Codes 20 BitsInput Bias Current TA = +25°C 0.1 10 pARange Error Range 5 (250pC) 5 % of FSRRange Error Match(5) All Ranges 0.1 0.5 % of FSRRange Sensitivity to VREF VREF = 4.096 ±0.1V 1:1
Offset Error Range 5, (250pC) ±200 ±600 ppm of FSROffset Error Match(5) ±100 ppm of FSRDC Bias Voltage(6) (Input VOS) ±0.05 ±2 mVPower-Supply Rejection Ratio ±25 ±200 ppm of FSR/VInternal Test Signal 13 pCInternal Test Accuracy ±10 %
PERFORMANCE OVER TEMPERATUREOffset Drift ±0.5 ±3(10) ppm of FSR/°COffset Drift Stability ±0.2 ±0.7(10) ppm of FSR/minuteDC Bias Voltage Drift Applied to Sensor Input 3 ±1 µV/°CInput Bias Current Drift +25°C to +45°C 0.01 1(10) pA/°CInput Bias Current TA = +75°C 2 50(10) pARange Drift(7) Range 5 (250pC) 25 0 25 50(10) ppm/°CRange Drift Match(5) Range 5 (250pC) ±0.05 ppm/°C
REFERENCEVoltage 4.000 4.096 4.200 VInput Current(8) TINT = 500µs 150 225 275 µA
DIGITAL INPUT/OUTPUTLogic Levels
VIH 4.0 DVDD + 0.3 VVIL –0.3 +0.8 VVOH IOH = –500µA 4.5 VVOL IOL = 500µA 0.4 V
Input Current, IIN –10 +10 µAData Format(9) Straight Binary
POWER-SUPPLY REQUIREMENTSPower-Supply Voltage AVDD and DVDD 4.75 5.25 VSupply Current
Analog Current AVDD = +5V 14.8 15.2 mADigital Current DVDD = +5V 1.2 1.8 mA
Total Power Dissipation 80 100 85 130 mW
TEMPERATURE RANGESpecified Performance –40 +85 0 +70 °CStorage –60 +100 °C

DDC1124SBAS085Bwww.ti.com
PIN DESCRIPTIONS
PIN LABEL DESCRIPTION
1 IN1 Input 1: analog input for Integrators 1A and 1B. Theintegrator that is active is set by the CONV input.
2 AGND Analog Ground
3 CAP1B External Capacitor for Integrator 1B
4 CAP1B External Capacitor for Integrator 1B
5 CAP1A External Capacitor for Integrator 1A
6 CAP1A External Capacitor for Integrator 1A
7 AVDD Analog Supply, +5V Nominal
8 TEST Test Control Input. When HIGH, a test charge is appliedto the A or B integrators on the next CONV transition.
9 CONV Controls which side of the integrator is connected toinput. In continuous mode; CONV HIGH → side A isintegrating, CONV LOW → side B is integrating. CONVmust be synchronized with CLK (see Figure 2).
10 CLK System Clock Input, 10MHz Nominal
11 DCLK Serial Data Clock Input. This input operates the serial I/O shift register.
12 DXMIT Serial Data Transmit Enable Input. When LOW, thisinput enables the internal serial shift register.
13 DIN Serial Digital Input. Used to cascade multiple DDC112s.
14 DVDD Digital Supply, +5V Nominal
15 DGND Digital Ground
16 DOUT Serial Data Output, Hi-Z when DXMIT is HIGH
17 DVALID Data Valid Output. A LOW value indicates valid data isavailable in the serial I/O register.
18 RANGE0 Range Control Input 0 (least significant bit)
19 RANGE1 Range Control Input 1
20 RANGE2 Range Control Input 2 (most significant bit)
21 AGND Analog Ground
22 VREF External Reference Input, +4.096V Nominal
23 CAP2A External Capacitor for Integrator 2A
24 CAP2A External Capacitor for Integrator 2A
25 CAP2B External Capacitor for Integrator 2B
26 CAP2B External Capacitor for Integrator 2B
27 AGND Analog Ground
28 IN2 Input 2: analog input for Integrators 2A and 2B. Theintegrator that is active is set by the CONV input.
PIN CONFIGURATION
Top View SO
1
2
3
4
5
6
7
8
9
10
11
12
13
14
28
27
26
25
24
23
22
21
20
19
18
17
16
15
IN2
AGND
CAP2B
CAP2B
CAP2A
CAP2A
VREF
AGND
RANGE2 (MSB)
RANGE1
RANGE0 (LSB)
DVALID
DOUT
DGND
IN1
AGND
CAP1B
CAP1B
CAP1A
CAP1A
AVDD
TEST
CONV
CLK
DCLK
DXMIT
DIN
DVDD
DDC112U

DDC112 5SBAS085B www.ti.com
CAP1A
CAP1A
AVDD
NC
NC
TEST
CONV
CLK
CAP2A
CAP2A
VREF
AGND
NC
NC
RANGE2 (MSB)
RANGE1
1
2
3
4
5
6
7
8
24
23
22
21
20
19
18
17
DDC112Y
CA
P1B
CA
P1B
AG
ND
IN1
IN2
AG
ND
CA
P2B
CA
P2B
32 31 30 29 28 27 26 25
DC
LK
DX
MIT
DIN
DV
DD
DG
ND
DO
UT
DV
ALI
D
RA
NG
E0
(LS
B)
9 10 11 12 13 14 15 16
PIN CONFIGURATION
Top View TQFP
PIN DESCRIPTIONS
PIN LABEL DESCRIPTION
1 CAP1A External Capacitor for Integrator 1A
2 CAP1A External Capacitor for Integrator 1A
3 AVDD Analog Supply, +5V Nominal
4 NC No Connection
5 NC No Connection
6 TEST Test Control Input. When HIGH, a test charge isapplied to the A or B integrators on the next CONVtransition.
7 CONV Controls which side of the integrator is connected toinput. In continuous mode; CONV HIGH side A isintegrating, CONV LOW side B is integrating CONVmust be synchronized with CLK (see text).
8 CLK System Clock Input, 10MHz Nominal
9 DCLK Serial Data Clock Input. This input operates theserial I/O shift register.
10 DXMIT Serial Data Transmit Enable Input. When LOW, thisinput enables the internal serial shift register.
11 DIN Serial Digital Input. Used to cascade multipleDDC112s.
12 DVDD Digital Supply, +5V Nominal
13 DGND Digital Ground
14 DOUT Serial Data Output, Hi-Z when DXMIT is HIGH
PIN LABEL DESCRIPTION
15 DVALID Data Valid Output. A LOW value indicates valid data isavailable in the serial I/O register.
16 RANGE0 Range Control Input 0 (least significant bit)
17 RANGE1 Range Control Input 1
18 RANGE2 Range Control Input 2. (most significant bit)
19 NC No Connection
20 NC No Connection
21 AGND Analog Ground
22 VREF External Reference Input, +4.096V Nominal
23 CAP2A External Capacitor for Integrator 2A
24 CAP2A External Capacitor for Integrator 2A
25 CAP2B External Capacitor for Integrator 2B
26 CAP2B External Capacitor for Integrator 2B
27 AGND Analog Ground
28 IN2 Input 2: analog input for Integrators 2A and 2B. Theintegrator that is active is set by the CONV input.
29 IN1 Input 1: analog input for Integrators 1A and 1B. Theintegrator that is active is set by the CONV input.
30 AGND Analog Ground
31 CAP1B External Capacitor for Integrator 1B
32 CAP1B External Capacitor for Integrator 1B
DDC1126SBAS085Bwww.ti.com
NOISE vs TINT
1 10000.1 10010
TINT (ms)
Noi
se (
ppm
of F
SR
, rm
s)
0
1
2
3
4
5
6
CSENSOR = 50pF
CSENSOR = 0pF
Range 5
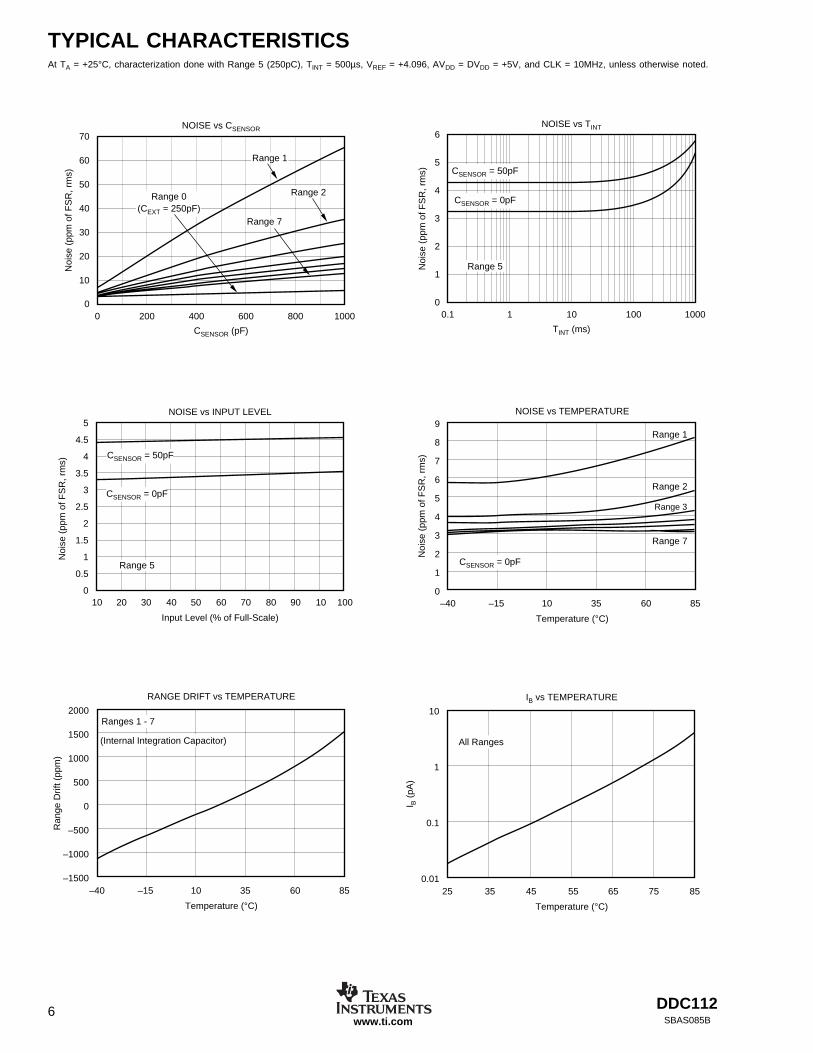
TYPICAL CHARACTERISTICSAt TA = +25°C, characterization done with Range 5 (250pC), TINT = 500µs, VREF = +4.096, AVDD = DVDD = +5V, and CLK = 10MHz, unless otherwise noted.
NOISE vs CSENSOR
200 8000 1000600400
CSENSOR (pF)
Noi
se (
ppm
of F
SR
, rm
s)
0
10
20
30
40
50
60
70
Range 7
Range 2
Range 1
Range 0(CEXT = 250pF)
NOISE vs INPUT LEVEL
30 4020 9010 10070 80 1050 60
Input Level (% of Full-Scale)
Noi
se (
ppm
of F
SR
, rm
s)
5
4.5
4
3.5
3
2.5
2
1.5
1
0.5
0
CSENSOR = 50pF
CSENSOR = 0pF
Range 5
NOISE vs TEMPERATURE9
8
7
6
5
4
3
2
1
0–40 –15 10 35 60 85
Temperature (°C)
Noi
se (
ppm
of F
SR
, rm
s)Range 1
Range 2
Range 7
Range 3
CSENSOR = 0pF
RANGE DRIFT vs TEMPERATURE
–40 –15 10 35 60 85
Temperature (°C)
Ran
ge D
rift (
ppm
)
Ranges 1 - 7
(Internal Integration Capacitor)
2000
1500
1000
500
0
–500
–1000
–1500
IB vs TEMPERATURE
25 35 45 55 65 75 85
Temperature (°C)
I B (
pA)
All Ranges
10
1
0.1
0.01

DDC112 7SBAS085B www.ti.com
TYPICAL CHARACTERISTICS (Cont.)At TA = +25°C, characterization done with Range 5 (250pC), TINT = 500µs, VREF = +4.096, AVDD = DVDD = +5V, and CLK = 10MHz, unless otherwise noted.
600POWER-SUPPLY REJECTION RATIO vs FREQUENCY
0 10025 7550
Frequency (KHz)
PS
RR
(pp
m o
f FS
R/V
)
0
100
200
300
400
500
INPUT VOS vs RANGE36
35
34
33
32
31
301 2 3 4 5 6 7
Range
VO
S (
µV)
DIGITAL SUPPLY CURRENT vs TEMPERATURE1.4
1.2
1.0
0.8
0.6
0.4
0.2
0–40 –15 10 35 60 85
Temperature (°C)
Cur
rent
(m
A)
ANALOG SUPPLY CURRENT vs TEMPERATURE18
16
14
12
10
8
6
4
2
0–40 –15 10 35 60 85
Temperature (°C)
Cur
rent
(m
A)
OFFSET DRIFT vs TEMPERATURE
25 35 45 55 65 75 85
Temperature (°C)
Offs
et D
rift (
ppm
of F
SR
)
100
50
0
–50
–100
All Ranges
CROSSTALK vs FREQUENCY0
–20
–40
–60
–80
–100
–120
–1400 100 200 300 400 500
Frequency (Hz)
Sep
arat
ion
(dB
)
Separation MeasuredBetween Inputs 1 and 2

DDC1128SBAS085Bwww.ti.com
THEORY OF OPERATIONThe basic operation of the DDC112 is illustrated in Figure 1.The device contains two identical input channels where eachperforms the function of current-to-voltage integration fol-lowed by a multiplexed analog-to-digital (A/D) conversion.Each input has two integrators so that the current-to-voltageintegration can be continuous in time. The output of the fourintegrators are switched to one delta-sigma (∆Σ) convertervia a four input multiplexer. With the DDC112 in the continu-ous integration mode, the output of the integrators from oneside of both of the inputs will be digitized while the other twointegrators are in the integration mode as illustrated in thetiming diagram in Figure 2. This integration and A/D conver-sion process is controlled by the system clock, CLK. With a10MHz system clock, the integrator combined with the delta-sigma converter accomplishes a single 20-bit conversion inapproximately 220µs. The results from side A and side B ofeach signal input are stored in a serial output shift register.
The DVALID output goes LOW when the shift registercontains valid data.
The digital interface of the DDC112 provides the digitalresults via a synchronous serial interface consisting of a dataclock (DCLK), a transmit enable pin (DXMIT), a valid data pin(DVALID), a serial data output pin (DOUT), and a serial datainput pin (DIN). The DDC112 contains only one A/D con-verter, so the conversion process is interleaved between thetwo inputs, as shown in Figure 2. The integration andconversion process is fundamentally independent of the dataretrieval process. Consequently, the CLK frequency andDCLK frequencies need not be the same. DIN is only usedwhen multiple converters are cascaded and should be tied toDGND otherwise. Depending on TINT, CLK, and DCLK, it ispossible to daisy-chain over 100 converters. This greatlysimplifies the interconnection and routing of the digital out-puts in cases where a large number of converters areneeded.
DualSwitchedIntegrator
DualSwitchedIntegrator
∆ΣModulator
DigitalFilter
Control
DigitalInput/Output
DVALIDDXMITDOUTDIN
DCLK
RANGE2RANGE1RANGE0
TEST CONV CLK
CAP1ACAP1A
CAP1BCAP1B
CAP2ACAP2A
CAP2BCAP2B
IN2
IN1
VREF DGNDDVDDAGNDAVDD
Input 1
Input 2
IN1, Integrator A
IN1, Integrator B
IN2, Integrator A
IN2, Integrator B
Conversion in Progress
DVALID
IN1B IN2B IN1A
Integrate
Integrate
Integrate
Integrate
Integrate
Integrate
Integrate
Integrate
IN2A IN1B IN2B IN1A IN2A
FIGURE 2. Basic Integration and Conversion Timing for the DDC112 (continuous mode).
FIGURE 1. Block Diagram.

DDC112 9SBAS085B www.ti.com
DEVICE OPERATION
Basic Integration Cycle
The fundamental topology of the front end of the DDC112 isa classical analog integrator, as shown in Figure 3. In thisdiagram, only Input 1 is shown. This representation of theinput stage consists of an operational amplifier, a selectablefeedback capacitor network (CF), and several switches thatimplement the integration cycle. The timing relationships ofall of the switches shown in Figure 3 are illustrated inFigure 4. Figure 4 is used to conceptualize the operation ofthe integrator input stage of the DDC112 and should not beused as an exact timing tool for design. Block diagrams ofthe reset, integrate, converter, and wait states of the inte-grator section of the DDC112 are shown in Figure 5. Thisinternal switching network is controlled externally with theconvert command (CONV), range selection pins (RANGE0-RANGE2), and the system clock (CLK). For the best noiseperformance, CONV must be synchronized with the risingedge of CLK. It is recommended CONV toggle within ±10nsof the rising edge of CLK.
The noninverting inputs of the integrators are internallyreferenced to ground. Consequently, the DDC112 analogground should be as clean as possible. The range switches,along with the internal and external capacitors (CF) areshown in parallel between the inverting input and output ofthe operational amplifier. Table I shows the value of theintegration capacitor (CF) for each range. At the beginning ofa conversion, the switches SA/D, SINTA, SINTB, SREF1, SREF2,and SRESET are set (see Figure 4).
At the completion of an A/D conversion, the charge on theintegration capacitor (CF) is reset with SREF1 and
CF INPUT RANGERANGE2 RANGE1 RANGE0 (pF, typ) (pC, typ)
0 0 0 External Up to 100012.5 to 250
0 0 1 12.5 –0.2 to 50
0 1 0 25 –0.4 to 100
0 1 1 37.5 –0.6 to 150
1 0 0 50 –0.8 to 200
1 0 1 62.5 –0.1 to 250
1 1 0 75 –1.2 to 300
1 1 1 87.5 –1.4 to 350
TABLE I. Range Selection of the DDC112.
FIGURE 3. Basic Integrator Configuration for Input 1 Shown with a 250pC (CF = 62.5pF) Input Range.
SRESET (see Figures 4 and 5a). This is done during the resettime. In this manner, the selected capacitor is charged to thereference voltage, VREF. Once the integration capacitor ischarged, SREF1, and SRESET are switched so that VREF is nolonger connected to the amplifier circuit while it waits to beginintegrating (see Figure 5b). With the rising edge on CONV,SINTA closes which begins the integration of Channel A. Thisputs the integrator stage into its integrate mode (seeFigure 5c).
Charge from the input signal is collected on the integrationcapacitor causing the voltage output of the amplifier todecrease. A falling edge CONV stops the integration byswitching the input signal from side A to side B (SINTA andSINTB). Prior to the falling edge of CONV, the signal on sideB was converted by the A/D converter and reset during thetime that side A was integrating. With the falling edge ofCONV, side B starts integrating the input signal. Now theoutput voltage of side A’s operational amplifier is presentedto the input of the ∆Σ A/D converter (see Figure 5d).
50pF
CAP1ACAP1A
25pF
12.5pF
VREF
RANGE2
RANGE1
RANGE0
To ConverterSRESET
SREF2SA/D1A
SINTA
SREF1
SINTB
IN1
ESDProtection
Diode
InputCurrent
Integrator A
Integrator B (same as A)Photodiode

DDC11210SBAS085Bwww.ti.com
FIGURE 5. Diagrams for the Four Configurations of the Front End Integrators of the DDC112.
FIGURE 4. Basic Integrator Timing Diagram as Illustrated in Figure 3.
To ConverterSRESET
SREF2
SA/D
VREF
SREF1
SINT
IN
CF
a) Reset Configuration
To ConverterSRESET
SREF2
SA/D
VREF
SREF1
SINT
IN
CF
c) Integrate Configuration
To ConverterSRESET
SREF2
SA/D
VREF
SREF1
SINT
IN
CF
d) Convert Configuration
To ConverterSRESET
SREF2
SA/D
VREF
SREF1
SINT
IN
CF
b) Wait Configuration
SA/D1A
VREF
Integrator AVoltage Output
Configuration ofIntegrator A WaitConvert WaitConvertIntegrate
SREF1
SREF2
SINTA
SINTB
SRESET
CONV
CLK
Wai
t
Res
et
Wai
t
Res
et

DDC112 11SBAS085B www.ti.com
Determining the Integration Capacitor (CF) Value
The value of the integrator’s feedback capacitor, the integra-tion period, and the reference voltage determine the positivefull-scale (+FS) value of the DDC112. The approximatepositive full-scale value of the DDC112 is given by thefollowing equations:
Q I T
Q V C
IV C
T
or
CI T
V
IN IN INT
FS REF F
FSREF F
INT
FFS INT
REF
= ×
= ( ) ×
= ( ) ×
= ×
0 96
0 96
0 96
.
.
( . )
The 0.96 factor allows the front end integrators to reach full-scale without having to completely swing to ground. Thenegative full-scale (–FS) range is approximately 0.4% of thepositive full-scale range. For example, Range 5 has a nomi-nal +FS range of 250pC. The –FS range is then approxi-mately –1pC. This relationship holds for external capacitorsas well and is independent of VREF (for VREF within theallowable range, see the Electrical Characteristics table).
Integration Capacitors
There are seven different capacitors available on-chip foreach side of each channel in the DDC112. These internalcapacitors are trimmed in production to achieve the specifiedperformance for range error of the DDC112. The rangecontrol pins (RANGE0-RANGE2) change the capacitor valuefor all four integrators. Consequently, both inputs and bothsides of each input will always have the same full-scalerange unless external capacitors are used.
External integration capacitors may be used instead of theinternal capacitors values by setting [RANGE2-RANGE0 =000]. The external capacitor pin connections are summa-rized in Table II. Usually, all four external capacitors areequal in value; however, it is possible to have differing pairsof external capacitors between Input 1 and Input 2 of theDDC112. Regardless of the selected value of the capacitor,it is strongly recommended that the capacitors for sides Aand B be the same.
INTEGRATOR
DDC112U, UK DDC112Y, YK Channel Side
5 and 6 1 and 2 1 A3 and 4 31 and 32 1 B
23 and 24 23 and 24 2 A25 and 26 25 and 26 2 B
TABLE II. External Capacitor Connections with Range Con-figuration of RANGE2-RANGE0 = 000.
Since the range accuracy depends on the characteristics ofthe integration capacitor, they must be carefully selected. Anexternal integration capacitor should have low-voltage coef-ficient, temperature coefficient, memory, and leakage cur-rent. The optimum selection depends on the requirements ofthe specific application. Suitable types include chip-on-glass(COG) ceramic, polycarbonate, polystyrene, and silver mica.
Voltage Reference
The external voltage reference is used to reset the integra-tion capacitors before an integration cycle begins. It is alsoused by the ∆Σ converter while the converter is measuringthe voltage stored on the integrators after an integrationcycle ends. During this sampling, the external reference mustsupply charge needed by the ∆Σ converter. For an integrationtime of 500µs, this charge translates to an average VREF
current of approximately 150µA. The amount of chargeneeded by the ∆Σ converter is independent of the integrationtime; therefore, increasing the integration time lowers theaverage current. For example, an integration time of 1000µslowers to average VREF current to 75µA.
It is critical that VREF be stable during the different modes ofoperation in Figure 5. The ∆Σ converter measures the volt-age on the integrator with respect to VREF. Since theintegrator’s capacitors are initially reset to VREF, any droop inVREF from the time the capacitors are reset to the time whenthe converter measures the integrator’s output will introducean offset. It is also important that VREF be stable over longerperiods of time as changes in VREF correspond directly tochanges in the full-scale range. Finally, VREF should intro-duce as little additional noise as possible.
For reasons mentioned above, it is strongly recommendedthat the external reference source be buffered with anoperational amplifier, as shown in Figure 6. In this circuit,the voltage reference is generated by a 4.096V reference.
FIGURE 6. Recommended External Voltage Reference Circuit for Best Low-Noise Operation with the DDC112.
0.10µF
+5V
10kΩ
10µF 4
3
3
2
12
7
6
+0.10µF
0.1µF10µF+
OPA350To VREFPin 22 of
the DDC112REF3040
+5V
0.47µF
EXTERNAL CAPACITOR PINS

DDC11212SBAS085Bwww.ti.com
CLK = 10MHz CLK = 15MHz
SYMBOL DESCRIPTION MIN TYP MAX MIN TYP MAX UNITS
t1 Setup Time for Test Mode Enable 100 100 ns
t2 Setup Time for Test Mode Disable 100 100 ns
t3 Hold Time for Test Mode Enable 100 100 ns
t4 From Rising Edge of TEST to the Edge of CONV 5.4 3.6 µswhile Test Mode Enabled
t5 Rising Edge to Rising Edge of TEST 5.4 3.6 µs
A low-pass filter to reduce noise connects it to an opera-tional amplifier configured as a buffer. This amplifier shouldhave a unity-gain bandwidth greater than 4MHz, low noise,and input/output common-mode ranges that support VREF.Following the buffer are capacitors placed close to theDDC112 VREF pin. Even though the circuit in Figure 6 mightappear to be unstable due to the large output capacitors, itworks well for most operational amplifiers. It is NOT recom-mended that series resistance be placed in the output leadto improve stability since this can cause droop in VREF whichproduces large offsets.
DDC112 Frequency Response
The frequency response of the DDC112 is set by the front endintegrators and is that of a traditional continuous time integra-tor, as shown in Figure 7. By adjusting TINT, the user canchange the 3dB bandwidth and the location of the notches inthe response. The frequency response of the ∆Σ converter thatfollows the front end integrator is of no consequence becausethe converter samples a held signal from the integrators. Thatis, the input to the ∆Σ converter is always a DC signal. Sincethe output of the front end integrators are sampled, aliasing canoccur. Whenever the frequency of the input signal exceedsone-half of the sampling rate, the signal will fold back down tolower frequencies.
Test Mode
When TEST is used, pins IN1 and IN2 are grounded andpackets of approximately 13pC charge are transferred to the
FIGURE 8. Timing Diagram of the Test Mode of the DDC112.
TABLE III. Timing for the DDC112 in the Test Mode.
integration capacitors of both Input 1 and Input 2. This fixedcharge can be transferred to the integration capacitors eitheronce during an integration cycle or multiple times. In the casewhere multiple packets are transferred during one integrationperiod, the 13pC charge is additive. This mode can be usedin both the continuous and noncontinuous mode timing. Thetiming diagrams for test mode are shown in Figure 8. The topthree lines in Figure 8 define the timing when one packet of13pC is sent to the integration capacitors. The bottom threelines define the timing when multiple packets are sent to theintegration capacitors.
FIGURE 7. Frequency Response of the DDC112.
0
–10
–20
–30
–40
–500.1TINT
100TINT
1TINT
10TINT
Frequency
Gai
n (d
B)
t1
t1 t3 t4
t4 t5 t2
Integrate BAction
CONV
TEST
Action
CONV
TEST
Integrate A
Test Mode Disabled
13pC into B 13pC into A 13pC into B 13pC into A
Test Mode DisabledTest Mode Enabled
Integrate B Integrate A
Integrate B Integrate A
Test Mode Disabled
13pC into B 26pC into A 39pC into B 52pC into A
Test Mode DisabledTest Mode Enabled
Integrate B Integrate A
t2

DDC112 13SBAS085B www.ti.com
TEST and CONV work together to implement this feature.The test mode is entered when TEST is HIGH prior to aCONV edge. At that point, a CONV edge triggers the ground-ing of the analog inputs and the switching of 13pC packetsof charge onto the integration capacitors. If TEST is keptHIGH through at least two conversions (that is, a rise and fallof CONV), all four integrators will be charged with a 13pCpacket. At the end of each conversion, the voltage at theoutput of the integrators is digitized as discussed in theContinuous and Non-Continuous Operational Modes sectionof this data sheet. The test mode is exited when TEST isLOW and a CONV edge occurs.
Once the test mode is entered as described above, TESTcan cycle as many times as desired. When this is done,additional 13pC packets are added on the rising edge ofTEST to the existing charge on the integrator capacitors.Multiple charge packets can be added in this way as long asthe TEST pin is not LOW when CONV toggles.
DIGITAL ISSUES
The digital interface of the DDC112 provides the digital resultsvia a synchronous serial interface consisting of a data clock(DCLK), a transmit enable pin (DXMIT), a valid data pin(DVALID), a serial data output pin (DOUT), and a serial datainput pin (DIN). The DDC112 contains only one A/D converter,so the conversion process is interleaved between the twoinputs (see Figure 2). The integration and conversion processis fundamentally independent of the data retrieval process.Consequently, the CLK frequency and DCLK frequenciesneed not be the same. DIN is used when multiple convertersare cascaded. Cascading or daisy-chaining greatly simplifiesthe interconnection and routing of the digital outputs in caseswhere a large number of converters are needed. Refer to theCascading Multiple Converters section of this data sheet formore detail.
The conversion rate of the DDC112 is set by a combination ofthe integration time (determined by the user) and the speed ofthe A/D conversion process. The A/D conversion time isprimarily a function of the system clock (CLK) speed. OneA/D conversion cycle encompasses the conversion of twosignals (one from each input of the DDC112) and reset timefor each of the integrators involved in the two conversions. Inmost situations, the A/D conversion time is shorter than theintegration time. If this condition exists, the DDC112 willoperate in the continuous mode. When the DDC112 is in thecontinuous mode, the sensor output is continuously integratedby one of the two sides of each input.
In the event that the A/D conversion takes longer than theintegration time, the DDC112 will switch into a noncontinu-ous mode. In noncontinuous mode, the A/D converter is notable to keep pace with the speed of the integration process.Consequently, the integration process is periodically halteduntil the digitizing process catches up. These two basicmodes of operation for the DDC112—continuous and non-continuous modes—are described in the Continuous andNoncontinuous Operational Modes section of this data sheet.
Continuous and Non-ContinuousOperational ModesThe state diagram of the DDC112 is shown in Figure 9. In all,there are 8 states. Table IV provides a brief explanation ofeach of the states.
Int A/Meas BCont
5CONV • mbsy
CONV • mbsy
CONV • mbsy
CONV • mbsy
CONV • mbsy
CONV • mbsy
CONV
CONV
Int B/Meas ACont
4
Ncont
1
Ncont
2
Int ACont
3
Ncont
8
Ncont
7
Int BCont
6 CONV
CONV
mbsy
mbsy
FIGURE 9. State Diagram.
Four signals are used to control progression around the statediagram: CONV and mbsy and their complements. The statemachine uses the level as opposed to the edges of CONV tocontrol the progression. mbsy is an internally-generatedsignal not available to the user. It is active whenever ameasurement/reset/auto-zero (m/r/az) cycle is in progress.
STATE MODE DESCRIPTION
1 Ncont Complete m/r/az of side A, then side B (if previousstate is state 4). Initial power-up state when CONVis initially held HIGH.
2 Ncont Prepare side A for integration.
3 Cont Integrate on side A.
4 Cont Integrate on side B; m/r/az on side A.
5 Cont Integrate on side A; m/r/az on side B.
6 Cont Integrate on side B.
7 Ncont Prepare side B for integration.
8 Ncont Complete m/r/az of side B, then side A (if previousstate is state 5). Initial power-up state when CONVis initially held LOW.
TABLE IV. State Descriptions.

DDC11214SBAS085Bwww.ti.com
TABLE V. Timing Specifications Generalized in CLK Periods.
SYMBOL DESCRIPTION VALUE (CLK periods)
t6 Cont mode m/r/az cycle. 4794
t7 Cont mode data ready. 4212 (tINT > 4794)
4212 ±3 (tINT = 4794)
t8 1st ncont mode data ready. 4212 ±3
t9 2nd ncont mode data ready. 4548
t10 Ncont mode m/r/az cycle. 9108
4321 5 4
Integrate BIntegrate A Integrate A Integrate B
m/r/az A m/r/az B m/r/az A
CONV
State
mbsy
m/r/azStatus
IntegrationStatus
DVALID
t6
t7t = 0
Power-UpSide AData
Side BData
Side AData
FIGURE 10. Continuous Mode Timing (CONV HIGH at power-up).
SYMBOL DESCRIPTION VALUE (CLK = 10MHz) VALUE (CLK = 15MHz)
t6 Cont mode m/r/az cycle. 479.4µs 319.6µs
t7 Cont mode data ready. 421.2µs (TINT > 479.4µs) 280.8µs (TINT > 319.6µs)421.2 ±0.3µs (TINT = 479.4µs) 280.8 ±0.2µs (TINT = 319.6µs)
During the cont mode, mbsy is not active when CONVtoggles. The non-integrating side is always ready to beginintegrating when the other side finishes its integration. Con-sequently, keeping track of the current status of CONV is allthat is needed to know the current state. Cont mode opera-tion corresponds to states 3-6. Two of the states, 3 and 6,only perform an integration (no m/r/az cycle).
mbsy becomes important when operating in the ncont mode;states 1, 2, 7, and 8. Whenever CONV is toggled while mbsyis active, the DDC112 will enter or remain in either ncontstate 1 (or 8). After mbsy goes inactive, state 2 (or 7) isentered. This state prepares the appropriate side for integra-tion. As mentioned above, in the ncont states, the inputs tothe DDC112 are grounded.
One interesting observation from the state diagram is that theintegrations always alternate between sides A and B. Thisrelationship holds for any CONV pattern and is independentof the mode. States 2 and 7 insure this relationship during thencont mode.
When power is first applied to the DDC112, the beginningstate is either 1 or 8, depending on the initial level of CONV.For CONV held HIGH at power-up, the beginning state is 1.Conversely, for CONV held LOW at power-up, the beginningstate is 8. In general, there is a symmetry in the statediagram between states 1-8, 2-7, 3-6, and 4-5. InvertingCONV results in the states progressing through their sym-metrical match.
TIMING EXAMPLES
Cont Mode
A few timing diagrams will now be discussed to help illustratethe operation of the state machine. These are shown inFigures 10 through 19. Table V gives generalized timingspecifications in units of CLK periods. Values in µs for
Table V can be easily found for a given CLK. For example,if CLK = 10MHz, then a CLK period = 0.1µs. t6 in Table Vwould then be 479.4µs.
Figure 10 shows a few integration cycles beginning withinitial power-up for a cont mode example. The top signal isCONV and is supplied by the user. The next line indicates thecurrent state in the state diagram. The following two tracesshow when integrations and measurement cycles are under-way. The internal signal mbsy is shown next. Finally, DVALIDis given. As described in the data sheet, DVALID goes activeLOW when data is ready to be retrieved from the DDC112.It stays LOW until DXMIT is taken LOW by the user. In Figure10 and the following timing diagrams, it is assumed thatDXMIT it taken LOW soon after DVALID goes LOW. The textbelow the DVALID pulse indicates the side of the data andarrows help match the data to the corresponding integration.The signals shown in Figures 10 through 19 are drawn atapproximately the same scale.
In Figure 10, the first state is ncont state 1. The DDC112always powers up in the ncont mode. In this case, the firststate is 1 because CONV is initially HIGH. After the first twostates, cont mode operation is reached and the states begintoggling between 4 and 5. From now on, the input is beingcontinuously integrated, either by side A or side B. The timeneeded for the m/r/az cycle, t6, is the same time that

DDC112 15SBAS085B www.ti.com
determines the boundary between the cont and ncont modesdescribed earlier in the Overview section. DVALID goesLOW after CONV toggles in time t7, indicating that data isready to be retrieved. As shown in Figure 10, there are twovalues for t7, depending on TINT. The reason for this will bediscussed in the Special Considerations section.
Figure 11 shows the result of inverting the logic level ofCONV. The only difference is in the first three states. After-wards, the states toggle between 4 and 5 just as in theprevious example. Figure 12 shows the timing diagram of theinternal operations occurring during continuous mode opera-tion.
FIGURE 11. Continuous Mode Timing (CONV LOW at power-up).
5678 4 5
Integrate AIntegrate B Integrate B Integrate A
m/r/az B m/r/az A m/r/az B
CONV
State
IntegrationStatus
m/r/azStatus
mbsy
DVALID
t6
t7t = 0
Power-UpSide BData
Side AData
Side BData
FIGURE 12. Timing Diagram of the Internal Operation in Continuous Mode of the DDC112.
t12
t12
t14t13
TINTTINT
End Integration Side AStart Integration Side B
Side A
Side AData Ready
Side BData Ready
Side B
Side A Side B
Side A
End Integration Side BStart Integration Side A
End Integration Side AStart Integration Side B
CONV
DVALID
A/D ConversionInput 1 (Internal)
A/D ConversionInput 2 (Internal)
CLK = 10MHz CLK = 15MHz
SYMBOL DESCRIPTION MIN TYP MAX MIN TYP MAX UNITS
TINT Integration Period (continuous mode) 500 1,000,000 333 1,000,000 µs
t12 A/D Conversion Time (internally controlled) 202.2 134.8 µs
t13 A/D Conversion Reset Time (internally controlled) 13.2 8.8 µs
t14 Integrator and A/D Conversion Reset Time 61.8 41.2 µs(internally controlled)
TABLE VI. Timing for the Internal Operation in the Continuous Mode.

DDC11216SBAS085Bwww.ti.com
FIGURE 13. Non-Continuous Mode Timing.
Ncont Mode
Figure 13 illustrates operation in the ncont mode. Theintegrations come in pairs (that is, sides A/B or sides B/A)followed by a time during which no integrations occur.During that time, the previous integrations are being mea-sured, reset and auto-zeroed. Before the DDC112 canadvance to states 3 or 6, both sides A and B must befinished with the m/r/az cycle which takes time t10. When them/r/az cycles are completed, time t11 is needed to preparethe next side for integration. This time is required for thencont mode because the m/r/az cycle of the ncont mode isslightly different from that of the cont mode. After the firstintegration ends, DVALID goes LOW in time t8. This is the
same time as in the cont mode. The second data will beready in time t9 after the first data is ready. One result of thenaming convention used in this application bulletin is thatwhen the DDC112 is operating in the ncont mode, it passesthrough both ncont mode states and cont mode states. Forexample, in Figure 13, the state pattern is 3, 4, 1, 2, 3, 4, 1,2, 3, 4...where 3 and 4 are cont mode states. Ncont modeby definition means that for some portion of the time, neitherside A nor B is integrating. States that perform an integrationare labeled cont mode states while those that do not arecalled ncont mode states. Since integrations are performedin the ncont mode, just not continuously, some cont modestates must be used in an ncont mode state pattern.
SYMBOL DESCRIPTION VALUE (CLK = 10MHz) VALUE (CLK = 15MHz)
t8 1st ncont mode data ready. 421.2 ±0.3µs 280.8 ±0.2µs
t9 2nd ncont mode data ready. 454.8µs 303.2µs
t10 Ncont mode m/r/az cycle. 910.8µs 607.2µs
t11 Prepare side for integration. ≥ 24.0µs ≥ 24.0µs
2 313 4 4 1 2
Int BInt AInt BInt A
m/r/az Bm/r/az A m/r/az A m/r/az B
CONV
State
mbsy
m/r/azStatus
IntegrationStatus
DVALID
t10
t9
t11
t8
Side AData
Side BData
Side AData
Side BData
DDC112 17SBAS085B www.ti.com
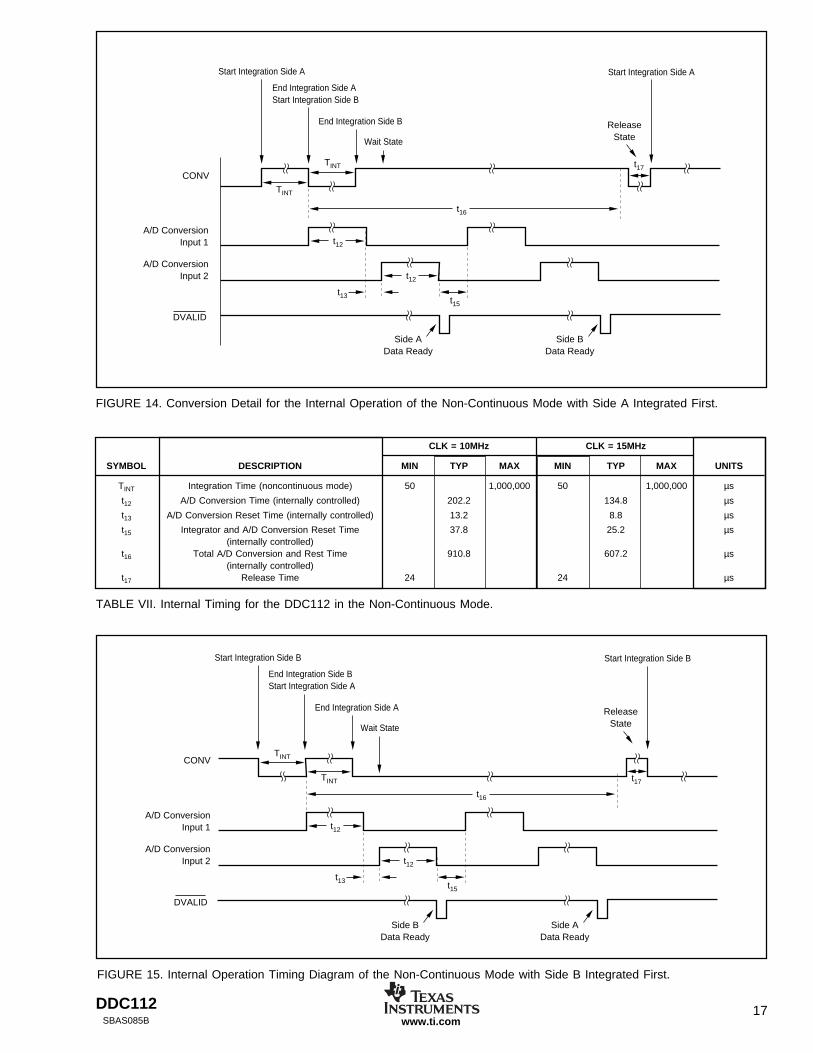
CLK = 10MHz CLK = 15MHz
SYMBOL DESCRIPTION MIN TYP MAX MIN TYP MAX UNITS
TINT Integration Time (noncontinuous mode) 50 1,000,000 50 1,000,000 µs
t12 A/D Conversion Time (internally controlled) 202.2 134.8 µs
t13 A/D Conversion Reset Time (internally controlled) 13.2 8.8 µs
t15 Integrator and A/D Conversion Reset Time 37.8 25.2 µs(internally controlled)
t16 Total A/D Conversion and Rest Time 910.8 607.2 µs(internally controlled)
t17 Release Time 24 24 µs
FIGURE 14. Conversion Detail for the Internal Operation of the Non-Continuous Mode with Side A Integrated First.
t12
TINT
TINT
t16
t12
t13t15
t17
ReleaseState
End Integration Side AStart Integration Side B
End Integration Side B
Wait State
Side AData Ready
Side BData Ready
Start Integration Side AStart Integration Side A
CONV
A/D ConversionInput 1
A/D ConversionInput 2
DVALID
t12
TINT
TINT
t16
t12
t13t15
t17
CONV
A/D ConversionInput 1
A/D ConversionInput 2
DVALID
ReleaseState
End Integration Side BStart Integration Side A
End Integration Side A
Wait State
Side BData Ready
Side AData Ready
Start Integration Side BStart Integration Side B
FIGURE 15. Internal Operation Timing Diagram of the Non-Continuous Mode with Side B Integrated First.
TABLE VII. Internal Timing for the DDC112 in the Non-Continuous Mode.

DDC11218SBAS085Bwww.ti.com
FIGURE 16. Equivalent CONV Signals in Non-Continuous Mode.
FIGURE 17. Non-Continuous Mode Timing with a 50% Duty Cycle CONV Signal.
CONV1
CONV2
2 313 4 4 1 2State
mbsy
CONV
DVALID
2 313 4 4 1State
IntegrationStatus
mbsy
Int BInt AInt B
Side AData
Side BData
Side AData
Int A
Looking at the state diagram, one can see that the CONVpattern needed to generate a given state progression is notunique. Upon entering states 1 or 8, the DDC112 remains inthose states until mbsy goes LOW, independent of CONV.As long as the m/r/az cycle is underway, the state machineignores CONV (see Figure 9). The top two signals aredifferent CONV patterns that produce the same state.This feature can be a little confusing at first, but it does allowflexibility in generating ncont mode CONV patterns. Forexample, the DDC112 Evaluation Fixture operates in thencont mode by generating a square wave with pulse width< t6. Figure 17 illustrates operation in the ncont mode using
a 50% duty cycle CONV signal with TINT = 1620 CLKperiods. Care must be exercised when using a square waveto generate CONV. There are certain integration times thatmust be avoided since they produce very short intervals forstate 2 (or state 7 if CONV is inverted). As seen in the statediagram, the state progresses from 2 to 3 as soon as CONVis HIGH. The state machine does not insure that the durationof state 2 is long enough to properly prepare the next sidefor integration (t11). This must be done by the user withproper timing of CONV. For example, if CONV is a squarewave with TINT = 3042 CLK periods, state 2 will only be 18CLK periods long, therefore, t11 will not be met.

DDC112 19SBAS085B www.ti.com
CONV
4214
Non-Continuous Continuous
3 3State
mbsy
m/r/azStatus
IntegrationStatus
m/r/az A m/r/az B m/r/az A
Int BInt A Integrate A Integrate B
FIGURE 18. Changing from Continuous Mode to Non-Continuous Mode.
FIGURE 19. Changing from Non-Continuous Mode to Continuous Mode.
CONV
8 74 5
Continuous Non-Continuous
5 6 5State
IntegrationStatus
m/r/azStatus
mbsy
m/r/az B m/r/az A m/r/az B m/r/az A m/r/az B
Integrate A Integrate B Int AInt A Int B
Changing Between Modes
Changing from the cont to ncont mode occurs wheneverTINT < t6. Figure 18 shows an example of this transition.In this figure, the cont mode is entered when the integrationon side A is completed before the m/r/az cycle on side B iscomplete. The DDC112 completes the measurement onsides B and A during states 8 and 7 with the input signalshorted to ground. Ncont integration begins with state 6.
Changing from the ncont to cont mode occurs when TINT isincreased so that TINT is always ≥ t6 (see Figure 14). With alonger TINT, the m/r/az cycle has enough time to finish beforethe next integration begins and continuous integration of theinput signal is possible. For the special case of the very firstintegration when changing to the cont mode, TINT can be< t6. This is allowed because there is no simultaneousm/r/az cycle on the side B during state 3—there is no needto wait for it to finish before ending the integration on side A.
DDC11220SBAS085Bwww.ti.com
SPECIAL CONSIDERATIONSNCONT MODE INTEGRATION TIME
The DDC112 uses a relatively fast clock. For CLK = 10MHz,this allows TINT to be adjusted in steps of 100ns since CONVshould be synchronized to CLK. However, for the internalmeasurement, reset and auto-zero operations, a slowerclock is more efficient. The DDC112 divides CLK by six anduses this slower clock with a period of 600ns to run the m/r/az cycle and data ready logic.
Because of the divider, it is possible for the integration timeto be a non-integer number of slow clock periods. Forexample, if TINT = 5000 CLK periods (500µs for CLK = 10MHz),there will be 833 1/3 slow clocks in an integration period. Thisnon-integer relationship between TINT and the slow clockperiod causes the number of rising and falling slow clockedges within an integration period to change from integrationto integration. The digital coupling of these edges to theintegrators will in turn change from integration to integrationwhich produces noise. The change in the clock edges is notrandom, but will repeat every 3 integrations. The couplingnoise on the integrators appears as a tone with a frequencyequal to the rate at which the coupling repeats.
To avoid this problem in cont mode, the internal slow clockis shut down after the m/r/az cycle is complete when it is nolonger needed. It starts up again just after the next integra-tion begins. Since the slow clock is always off when CONVtoggles, the same number of slow clock edges fall within anintegration period regardless of its length. Therefore,TINT ≥ 4794 CLK periods will not produce the couplingproblem described above.
For the ncont mode however, the slow clock must always beleft running. The m/r/az cycle is not completed before anintegration ends. It is then possible to have digital coupling tothe integrators. The digital coupling noise depends heavily onthe layout of the printed circuit board used for the DDC112.For solid grounds and power supplies with good bypassing,it is possible to greatly reduce the coupling. However, forensuring the best performance in the ncont mode, the inte-gration time should be chosen to be an integer multiple of1/(2fSLOWCLOCK). For CLK = 10MHz, the integration timeshould be an integer multiple of 300ns—TINT = 100µs is not.A better choice would be TINT = 99µs.
DATA READY
The DVALID signal which indicates that data is ready isgenerated using the internal slow clock. The phase relation-ship between this clock and CLK is set when power is firstapplied and is random. Since CONV is synchronized withCLK, it will have a random phase relationship with respect tothe slow clock. When TINT > t6, the slow clock will temporarilyshut down as described above. This shutdown processsynchronizes the internal clock with CONV so that the timebetween when CONV toggles to when DVALID goes LOW(t7 and t8) is fixed.
For TINT ≤ t6, the internal slow clock, is not allowed to shutdown and the synchronization never occurs. Therefore, thetime between CONV toggling and DVALID indicating data isready has uncertainty due to the random phase relationshipbetween CONV and the slow clock. This variation is±1/(2fSLOWCLOCK) or ±3/fCLK. The timing to the second DVALIDin the ncont mode will not have a variation since it istriggered off the first data ready (t9) and both are derivedfrom the slow clock.
Polling DVALID to determine when data is ready eliminatesany concern about the variation in timing since the readbackis automatically adjusted as needed. If the data readback istriggered off the toggling of CONV directly (instead of poll-ing), then waiting the maximum value of t7 or t8 insures thatdata will always be ready before readback occurs.
Data Retrieval
In the continuous and noncontinuous modes of operation,the data from the last conversion is available for retrieval withthe falling edge of DVALID (see Figure 22). The falling edgeof DXMIT in combination with the data clock (DCLK) willinitiate the serial transmission of the data from the DDC112.Typically, data is retrieved from the DDC112 as soon asDVALID falls and completed before the next CONV transitionfrom HIGH to LOW or LOW to HIGH occurs. If this is not thecase, care should be taken to stop activity on DCLK andconsequently DOUT by at least 10µs around a CONV tran-sition. If this caution is ignored it is possible that the integra-tion that is being initiated by CONV will have additional noiseintroduced.
The serial output data at DOUT is transmitted in StraightBinary Code per Table VIII. An output offset has been builtinto the DDC112 to allow for the measurement of inputsignals near and below zero. Board leakage up to ≈ –0.4%of the positive full-scale can be tolerated before the digitaloutput clips to all zeroes.
Cascading Multiple Converters
Multiple DDC112 units can be connected in serial or parallelconfigurations, as illustrated in Figures 20 and 21.
DOUT can be used with DIN to daisy-chain several DDC112devices together to minimize wiring. In this mode of opera-tion, the serial data output is shifted through multiple DDC112s,as illustrated in Figure 20.
RPULLUP prevents DIN from floating when DXMIT is HIGH.Care should be taken to keep the capacitive load on DOUTas low as possible when running CLK=15MHz.
CODE INPUT SIGNAL
1111 1111 1111 1111 1111 FS
1111 1111 1111 1111 1110 FS – 1LSB
0000 0001 0000 0000 0001 +1LSB
0000 0001 0000 0000 0000 Zero
0000 0000 0000 0000 0000 –0.4% FS
TABLE VIII. Straight Binary Code Table.

DDC112 21SBAS085B www.ti.com
FIGURE 20. Daisy-Chained DDC112s.
IN1 IN2
DCLK
DXMIT
DIN
DVALID
DOUT
DDC112
“F” “E”
Sensor “F” Sensor “E”
IN1 IN2
DCLK
DXMIT
DIN
DVALID
DOUT
DDC112
“D” “C”
Sensor “D” Sensor “C”
IN1 IN2
DCLK
DXMIT
DIN
DVALID
DOUTData RetrievalOutputs
DDC112
“B” “A”
Sensor “B” Sensor “A”
RP RP RP
Data RetrievelInputs
40 Bits 40 Bits 40 Bits
FIGURE 21. DDC112 in Parallel Operation.
SYMBOL DESCRIPTION MIN TYP MAX UNITS
t18 Propagation Delay from Rising Edge of CLK to DVALID LOW 30 nst19 Propagation Delay from DXMIT LOW to DVALID HIGH 30 nst20 Setup Time from DCLK LOW TO DXMIT LOW 20 nst21 Propagation Delay from DXMIT LOW to Valid DOUT 30 nst22 Hold Time that DOUT is Valid After Falling Edge of DCLK 5 nst23 Propagation Delay from DXMIT HIGH to DOUT Disabled 30 ns
t22A(1) Propagation Delay from Falling Edge of DCLK to Valid DOUT 25 ns
t22B(2) Propagation Delay from Falling Edge of DCLK to Valid DOUT 30 ns
NOTES: (1) Applies to DDC112UK, YK only, with a maximum load of one DDC112UK, YK DIN (4pF typical) with an additional load of (5pF 100kΩ). (2) Appliesto DDC112U, Y only, with a maximum load of one DDC112U,Y DIN (4pF typical) with an additional load of (5pF 100kΩ).
FIGURE 22. Digital Interface Timing Diagram for Data Retrieval From a Single DDC112.
TABLE IX. Timing for the DDC112 Data Retrieval.
DIN
DIN
DIN
DOUTDXMIT
DDC112
Data Output
DDC112
DDC112
Enable
DOUTDXMIT
DOUTDXMIT
t18
t19
t20
t21
t22t23
Input 2Bit 1
Input 2Bit 20
Input 1Bit 1
Input 1Bit 20
MSB LSB MSBOutput Disabled
Output Enabled
Output DisabledLSB
CLK
DVALID
DXMIT
DCLK(1)
DOUT
NOTE: (1) Disable DCLK (preferably hold LOW) when DXMIT is HIGH.

DDC11222SBAS085Bwww.ti.com
RETRIEVAL BEFORE CONV TOGGLES
(CONTINUOUS MODE)
This is the most straightforward method. Data retrieval be-gins soon after DVALID goes LOW and finishes beforeCONV toggles, see Figure 24. For best performance, dataretrieval must stop t28 before CONV toggles. This method isthe most appropriate for longer integration times. The maxi-mum time available for readback is TINT – t27 – t28.For DCLK and CLK = 10MHz, the maximum number ofDDC112s that can be daisy-chained together is:
T sINT
DCLK
– .431 240
µτ
Where τDCLK is the period of the data clock. For example, ifTINT = 1000µs and DCLK = 10MHz, the maximum number ofDDC112s is:
1000 431 240 100
142 2 142 112µ µ = →s s
nsDDC s
– .( )( )
.
RETRIEVAL AFTER CONV TOGGLES(CONTINUOUS MODE)
For shorter integration times, more time is available if dataretrieval begins after CONV toggles and ends before the newdata is ready. Data retrieval must wait t29 after CONV togglesbefore beginning. Figure 25 shows an example of this. Themaximum time available for retrieval is t27 – t29 – t26
(421.2µs – 10µs – 2µs for CLK = 10MHz), regardless of TINT.The maximum number of DDC112s that can be daisy-chained together is:
409 240
. µs
DCLKτ
For DCLK = 10MHz, the maximum number of DDC112s is102.
FIGURE 23. Timing Diagram When Using the DIN Function of the DDC112.
t18
t14
t20
t21
t22
t23
t24 t25
Output Disabled
Output Enabled
Output Disabled
CLK
DVALID
DXMIT
DCLK(1)
DIN
Input ABit 1
Input EBit 20
Input FBit 1
Input FBit 20
MSBOutput Disabled
Output Enabled
LSB LSB Output DisabledMSB
DOUT
NOTE: (1) Disable DCLK (preferably LOW) when DXMIT is HIGH.
t26
t22A, t22B
TABLE X. Timing for the DDC112 Data Retrieval Using DIN.
CLK = 10MHz CLK = 15MHz
SYMBOL DESCRIPTION MIN TYP MAX MIN TYP MAX UNITS
t24 Set-Up Time From DIN to Rising Edge of DCLK 10 5 ns
t25 Hold Time For DIN After Rising Edge of DCLK 10 10 ns
t26 Hold Time for DXMIT HIGH Before Falling 2 1.33 µsEdge of DVALID

DDC112 23SBAS085B www.ti.com
CLK = 10MHz CLK = 15MHz
SYMBOL DESCRIPTION MIN TYP MAX MIN TYP MAX UNITS
t27 Cont Mode Data Ready 421.2 280.8 µs
t28 Data Retrieval Shutdown Before Edge of CONV 10 10 µs
• • •• • •
• • •• • •
Side BData
Side AData
TINT TINT
t27t28
CONV
DVALID
DXMIT
DCLK
DOUT
FIGURE 24. Readback Before CONV Toggles.
TINT
t27t29 t26
TINT TINT
• • • • • • • • •
• • • • • • • • •
Side AData
Side BData
Side AData
CONV
DVALID
DXMIT
DCLK
DOUT
FIGURE 25. Readback After CONV Toggles.
CLK = 10MHz CLK = 15MHz
SYMBOL DESCRIPTION MIN TYP MAX MIN TYP MAX UNITS
t26 Hold Time for DXMIT HIGH Before Falling Edge 2 1.33 µsof DVALID
t27 Cont Mode Data Ready 421.2 280.8 µs
t29 Data Retrieval Start-Up After Edge of CONV 10 10 µs

DDC11224SBAS085Bwww.ti.com
RETRIEVAL BEFORE AND AFTER CONVTOGGLES (CONTINUOUS MODE)
For the absolute maximum time for data retrieval, data canbe retrieved before and after CONV toggles. Nearly all of TINT
is available for data retrieval. Figure 26 illustrates how this isdone by combining the two previous methods. You mustpause the retrieval during CONV toggling to prevent digitalnoise, as discussed previously, and finish before the nextdata is ready. The maximum number of DDC112s that canbe daisy-chained together is:
T s sINT
DCLK
– –20 240
µ µτ
For TINT = 500µs and DCLK = 10MHz, the maximum numberof DDC112s is 119.
RETRIEVAL: NONCONTINUOUS MODE
Retrieving in noncontinuous mode is slightly different ascompared with the continuous mode. As shown in Figure 27and described in detail in Application Bulletin SBAA024
(available for download at www.ti.com), DVALID goes LOWin time t30 after the first integration completes. If TINT isshorter than this time, all of t31 is available to retrieve databefore the other side’s data is ready. For TINT > t30, the firstintegration’s data is ready before the second integrationcompletes. Data retrieval must be delayed until the secondintegration completes leaving less time available for retrieval.The time available is t31 – (TINT – t30). The second integration’sdata must be retrieved before the next round of integrationsbegin. This time is highly dependent on the pattern used togenerate CONV. As with the continuous mode, data retrievalmust halt before and after CONV toggles (t28 and t29) and becompleted before new data is ready (t26).
POWER-UP SEQUENCING
Prior to power-up, all digital and analog input pins must beLOW. At the time of power-up, these signal inputs can bebiased to a voltage other than 0V, however, they shouldnever exceed AVDD or DVDD. The level of CONV at power-up is used to determine which side (A or B) will be integratedfirst. Before integrations can begin though, CONV musttoggle; see Figure 28.
• • • • • • • • • • • • • • • • • •
• • • • • • • • • • • • • • • • • •
DCLK
DXMIT
DVALID
CONV
DOUT
Side BData
Side AData
TINT
t29
t28
t26
TINT TINT
FIGURE 26. Readback Before and After CONV Toggles.
CLK = 10MHz CLK = 15MHz
SYMBOL DESCRIPTION MIN TYP MAX MIN TYP MAX UNITS
t26 Hold Time for DXMIT HIGH Before Falling 2 1.33 µsEdge of DVALID
t28 Data Retrieval Shutdown Before Edge of CONV 10 10 µs
t29 Data Retrieval Start-Up After dge of CONV 10 10 µs

DDC112 25SBAS085B www.ti.com
• • • • • •
• • • • • •
TINT
TINT
t30
TINT
TINT
t31
Side AData
Side BData
CONV
DVALID
DXMIT
DCLK
DOUT
FIGURE 27. Readback in Noncontinuous Mode.
FIGURE 28. Timing Diagram at Power-Up of the DDC112.
t32 t33 Integrate Side A
Integrate Side B
Power-UpInitialization
Release State
StartIntegration
CONV(HIGH at power-up)
CONV(LOW at power-up)
Power Supplies
SYMBOL DESCRIPTION MIN TYP MAX UNITS
t32 Power-On Initialization Period 50 µst33 From Release Edge to Integration Start 50 µs
TABLE XI. Timing for the DDC112 Power-Up Sequence.
CLK = 10MHz CLK = 15MHz
SYMBOL DESCRIPTION MIN TYP MAX MIN TYP MAX UNITS
t30 1st Ncont Mode Data Ready (see SBAA024) 421.1 ±0.3 280.8 µst31 2nd Ncont Mode Data Ready (see SBAA024) 454.8 303.2 µs
LAYOUTPower Supplies and Grounding
Both AVDD and DVDD should be as quiet as possible. It isparticularly important to eliminate noise from AVDD that isnon-synchronous with the DDC112 operation. Figure 29illustrates two acceptable ways to supply power to theDDC112. The first case shows two separate +5V supplies forAVDD and DVDD. In this case, each +5V supply of theDDC112 should be bypassed with 10µF solid tantalum ca-pacitors and 0.1µF ceramic capacitors. The second case
shows the DVDD power supply derived from the AVDD supplywith a < 10Ω isolation resistor. In both cases, the 0.1µFcapacitors should be placed as close to the DDC112 pack-age as possible.
Shielding Analog Signal Paths
As with any precision circuit, careful printed circuit layout willensure the best performance. It is essential to make short,direct interconnections and avoid stray wiring capacitance—particularly at the analog input pins. Digital signals should bekept as far from the analog input signals as possible on thePC board.

DDC11226SBAS085Bwww.ti.com
FIGURE 30. Recommended Shield for DDC112U LayoutDesign.
FIGURE 29. Power Supply Connection Options.
DDC112
0.1µF
< 10Ω
10µF
VS+
One +5V Supply
AVDD
DVDD
AVDD
DVDD
DDC112
0.1µF
0.1µF
0.1µF
10µF
VS+
Separate +5V Supplies
10µF
VDD+
Input shielding practices should be taken into considerationwhen designing the circuit layout for the DDC112. The inputsto the DDC112 are high impedance and extremely sensitiveto extraneous noise. Leakage currents between the PCBtraces can exceed the input bias current of the DDC112 ifshielding is not implemented. Figure 30 illustrates an accept-able approach to this problem. A PC ground plane is placedaround the inputs of the DDC112. This shield helps minimizecoupled noise into the input pins. Additionally, the pins that
DDC112U
1
2
3
4
5
6
7
8
9
10
11
12
13
14
28
27
26
25
24
23
22
21
20
19
18
17
16
15
Digital I/Oand
Digital Power
Digital I/Oand
Digital Power
Shield external
caps whenused
AnalogGround
AnalogPower
Shield external
caps whenused
AnalogGround
AnalogGround
IN1 IN2
AnalogGround
are used for the external integration capacitors should beguarded by a ground plane when the external capacitors areused.
The approach above reduces leakage affects by surroundingthese sensitive pins with a low impedance analog ground.Leakage currents from other portions of the circuit will flowharmlessly to the low impedance analog ground rather thaninto the analog input stage of the DDC112.

PACKAGE OPTION ADDENDUM
www.ti.com 24-Aug-2018
Addendum-Page 1
PACKAGING INFORMATION
Orderable Device Status(1)
Package Type PackageDrawing
Pins PackageQty
Eco Plan(2)
Lead/Ball Finish(6)
MSL Peak Temp(3)
Op Temp (°C) Device Marking(4/5)
Samples
DDC112U ACTIVE SOIC DW 28 20 Green (RoHS& no Sb/Br)
CU NIPDAU Level-1-260C-UNLIM -40 to 85 DDC112U
DDC112U/1K ACTIVE SOIC DW 28 1000 Green (RoHS& no Sb/Br)
CU NIPDAU Level-1-260C-UNLIM -40 to 85 DDC112U
DDC112UG4 ACTIVE SOIC DW 28 20 Green (RoHS& no Sb/Br)
CU NIPDAU Level-1-260C-UNLIM -40 to 85 DDC112U
DDC112UK ACTIVE SOIC DW 28 20 Green (RoHS& no Sb/Br)
CU NIPDAU Level-1-260C-UNLIM 0 to 70 DDC112UK
DDC112Y/250 ACTIVE TQFP PJT 32 250 Green (RoHS& no Sb/Br)
CU NIPDAU Level-2-260C-1 YEAR -40 to 85 DDC112Y
DDC112Y/2K ACTIVE TQFP PJT 32 2000 Green (RoHS& no Sb/Br)
CU NIPDAU Level-2-260C-1 YEAR -40 to 85 DDC112Y
DDC112YK/250 ACTIVE TQFP PJT 32 250 Green (RoHS& no Sb/Br)
CU NIPDAU Level-2-260C-1 YEAR 0 to 70 DDC112YK
DDC112YK/250G4 ACTIVE TQFP PJT 32 250 Green (RoHS& no Sb/Br)
CU NIPDAU Level-2-260C-1 YEAR 0 to 70 DDC112YK
(1) The marketing status values are defined as follows:ACTIVE: Product device recommended for new designs.LIFEBUY: TI has announced that the device will be discontinued, and a lifetime-buy period is in effect.NRND: Not recommended for new designs. Device is in production to support existing customers, but TI does not recommend using this part in a new design.PREVIEW: Device has been announced but is not in production. Samples may or may not be available.OBSOLETE: TI has discontinued the production of the device.
(2) RoHS: TI defines "RoHS" to mean semiconductor products that are compliant with the current EU RoHS requirements for all 10 RoHS substances, including the requirement that RoHS substancedo not exceed 0.1% by weight in homogeneous materials. Where designed to be soldered at high temperatures, "RoHS" products are suitable for use in specified lead-free processes. TI mayreference these types of products as "Pb-Free".RoHS Exempt: TI defines "RoHS Exempt" to mean products that contain lead but are compliant with EU RoHS pursuant to a specific EU RoHS exemption.Green: TI defines "Green" to mean the content of Chlorine (Cl) and Bromine (Br) based flame retardants meet JS709B low halogen requirements of <=1000ppm threshold. Antimony trioxide basedflame retardants must also meet the <=1000ppm threshold requirement.
(3) MSL, Peak Temp. - The Moisture Sensitivity Level rating according to the JEDEC industry standard classifications, and peak solder temperature.
(4) There may be additional marking, which relates to the logo, the lot trace code information, or the environmental category on the device.

PACKAGE OPTION ADDENDUM
www.ti.com 24-Aug-2018
Addendum-Page 2
(5) Multiple Device Markings will be inside parentheses. Only one Device Marking contained in parentheses and separated by a "~" will appear on a device. If a line is indented then it is a continuationof the previous line and the two combined represent the entire Device Marking for that device.
(6) Lead/Ball Finish - Orderable Devices may have multiple material finish options. Finish options are separated by a vertical ruled line. Lead/Ball Finish values may wrap to two lines if the finishvalue exceeds the maximum column width.
Important Information and Disclaimer:The information provided on this page represents TI's knowledge and belief as of the date that it is provided. TI bases its knowledge and belief on informationprovided by third parties, and makes no representation or warranty as to the accuracy of such information. Efforts are underway to better integrate information from third parties. TI has taken andcontinues to take reasonable steps to provide representative and accurate information but may not have conducted destructive testing or chemical analysis on incoming materials and chemicals.TI and TI suppliers consider certain information to be proprietary, and thus CAS numbers and other limited information may not be available for release.
In no event shall TI's liability arising out of such information exceed the total purchase price of the TI part(s) at issue in this document sold by TI to Customer on an annual basis.

TAPE AND REEL INFORMATION
*All dimensions are nominal
Device PackageType
PackageDrawing
Pins SPQ ReelDiameter
(mm)
ReelWidth
W1 (mm)
A0(mm)
B0(mm)
K0(mm)
P1(mm)
W(mm)
Pin1Quadrant
DDC112U/1K SOIC DW 28 1000 330.0 32.4 11.35 18.67 3.1 16.0 32.0 Q1
DDC112Y/250 TQFP PJT 32 250 180.0 16.4 9.6 9.6 1.5 12.0 16.0 Q2
DDC112Y/2K TQFP PJT 32 2000 330.0 16.4 9.6 9.6 1.5 12.0 16.0 Q2
DDC112YK/250 TQFP PJT 32 250 180.0 16.4 9.6 9.6 1.5 12.0 16.0 Q2
PACKAGE MATERIALS INFORMATION
www.ti.com 21-Jun-2018
Pack Materials-Page 1

*All dimensions are nominal
Device Package Type Package Drawing Pins SPQ Length (mm) Width (mm) Height (mm)
DDC112U/1K SOIC DW 28 1000 367.0 367.0 55.0
DDC112Y/250 TQFP PJT 32 250 213.0 191.0 55.0
DDC112Y/2K TQFP PJT 32 2000 367.0 367.0 38.0
DDC112YK/250 TQFP PJT 32 250 213.0 191.0 55.0
PACKAGE MATERIALS INFORMATION
www.ti.com 21-Jun-2018
Pack Materials-Page 2

MECHANICAL DATA
MPQF112 – NOVEMBER 2001
1POST OFFICE BOX 655303 • DALLAS, TEXAS 75265
PJT (S-PQFP–N32) PLASTIC QUAD FLATPACK
4203540/A 11/01
1
0,450,30
32
7,00 SQ
0,951,05
Seating Plane
0,450,75
0,25
Gage Plane
0,80 0,20
SQ9,00
1,001,20 0,10
0,050,15
0,200,09
M
0°– 7°
NOTES: A. All linear dimensions are in millimeters.B. This drawing is subject to change without notice.C. Falls within JEDEC MS-026


IMPORTANT NOTICE
Texas Instruments Incorporated (TI) reserves the right to make corrections, enhancements, improvements and other changes to itssemiconductor products and services per JESD46, latest issue, and to discontinue any product or service per JESD48, latest issue. Buyersshould obtain the latest relevant information before placing orders and should verify that such information is current and complete.TI’s published terms of sale for semiconductor products (http://www.ti.com/sc/docs/stdterms.htm) apply to the sale of packaged integratedcircuit products that TI has qualified and released to market. Additional terms may apply to the use or sale of other types of TI products andservices.Reproduction of significant portions of TI information in TI data sheets is permissible only if reproduction is without alteration and isaccompanied by all associated warranties, conditions, limitations, and notices. TI is not responsible or liable for such reproduceddocumentation. Information of third parties may be subject to additional restrictions. Resale of TI products or services with statementsdifferent from or beyond the parameters stated by TI for that product or service voids all express and any implied warranties for theassociated TI product or service and is an unfair and deceptive business practice. TI is not responsible or liable for any such statements.Buyers and others who are developing systems that incorporate TI products (collectively, “Designers”) understand and agree that Designersremain responsible for using their independent analysis, evaluation and judgment in designing their applications and that Designers havefull and exclusive responsibility to assure the safety of Designers' applications and compliance of their applications (and of all TI productsused in or for Designers’ applications) with all applicable regulations, laws and other applicable requirements. Designer represents that, withrespect to their applications, Designer has all the necessary expertise to create and implement safeguards that (1) anticipate dangerousconsequences of failures, (2) monitor failures and their consequences, and (3) lessen the likelihood of failures that might cause harm andtake appropriate actions. Designer agrees that prior to using or distributing any applications that include TI products, Designer willthoroughly test such applications and the functionality of such TI products as used in such applications.TI’s provision of technical, application or other design advice, quality characterization, reliability data or other services or information,including, but not limited to, reference designs and materials relating to evaluation modules, (collectively, “TI Resources”) are intended toassist designers who are developing applications that incorporate TI products; by downloading, accessing or using TI Resources in anyway, Designer (individually or, if Designer is acting on behalf of a company, Designer’s company) agrees to use any particular TI Resourcesolely for this purpose and subject to the terms of this Notice.TI’s provision of TI Resources does not expand or otherwise alter TI’s applicable published warranties or warranty disclaimers for TIproducts, and no additional obligations or liabilities arise from TI providing such TI Resources. TI reserves the right to make corrections,enhancements, improvements and other changes to its TI Resources. TI has not conducted any testing other than that specificallydescribed in the published documentation for a particular TI Resource.Designer is authorized to use, copy and modify any individual TI Resource only in connection with the development of applications thatinclude the TI product(s) identified in such TI Resource. NO OTHER LICENSE, EXPRESS OR IMPLIED, BY ESTOPPEL OR OTHERWISETO ANY OTHER TI INTELLECTUAL PROPERTY RIGHT, AND NO LICENSE TO ANY TECHNOLOGY OR INTELLECTUAL PROPERTYRIGHT OF TI OR ANY THIRD PARTY IS GRANTED HEREIN, including but not limited to any patent right, copyright, mask work right, orother intellectual property right relating to any combination, machine, or process in which TI products or services are used. Informationregarding or referencing third-party products or services does not constitute a license to use such products or services, or a warranty orendorsement thereof. Use of TI Resources may require a license from a third party under the patents or other intellectual property of thethird party, or a license from TI under the patents or other intellectual property of TI.TI RESOURCES ARE PROVIDED “AS IS” AND WITH ALL FAULTS. TI DISCLAIMS ALL OTHER WARRANTIES ORREPRESENTATIONS, EXPRESS OR IMPLIED, REGARDING RESOURCES OR USE THEREOF, INCLUDING BUT NOT LIMITED TOACCURACY OR COMPLETENESS, TITLE, ANY EPIDEMIC FAILURE WARRANTY AND ANY IMPLIED WARRANTIES OFMERCHANTABILITY, FITNESS FOR A PARTICULAR PURPOSE, AND NON-INFRINGEMENT OF ANY THIRD PARTY INTELLECTUALPROPERTY RIGHTS. TI SHALL NOT BE LIABLE FOR AND SHALL NOT DEFEND OR INDEMNIFY DESIGNER AGAINST ANY CLAIM,INCLUDING BUT NOT LIMITED TO ANY INFRINGEMENT CLAIM THAT RELATES TO OR IS BASED ON ANY COMBINATION OFPRODUCTS EVEN IF DESCRIBED IN TI RESOURCES OR OTHERWISE. IN NO EVENT SHALL TI BE LIABLE FOR ANY ACTUAL,DIRECT, SPECIAL, COLLATERAL, INDIRECT, PUNITIVE, INCIDENTAL, CONSEQUENTIAL OR EXEMPLARY DAMAGES INCONNECTION WITH OR ARISING OUT OF TI RESOURCES OR USE THEREOF, AND REGARDLESS OF WHETHER TI HAS BEENADVISED OF THE POSSIBILITY OF SUCH DAMAGES.Unless TI has explicitly designated an individual product as meeting the requirements of a particular industry standard (e.g., ISO/TS 16949and ISO 26262), TI is not responsible for any failure to meet such industry standard requirements.Where TI specifically promotes products as facilitating functional safety or as compliant with industry functional safety standards, suchproducts are intended to help enable customers to design and create their own applications that meet applicable functional safety standardsand requirements. Using products in an application does not by itself establish any safety features in the application. Designers mustensure compliance with safety-related requirements and standards applicable to their applications. Designer may not use any TI products inlife-critical medical equipment unless authorized officers of the parties have executed a special contract specifically governing such use.Life-critical medical equipment is medical equipment where failure of such equipment would cause serious bodily injury or death (e.g., lifesupport, pacemakers, defibrillators, heart pumps, neurostimulators, and implantables). Such equipment includes, without limitation, allmedical devices identified by the U.S. Food and Drug Administration as Class III devices and equivalent classifications outside the U.S.TI may expressly designate certain products as completing a particular qualification (e.g., Q100, Military Grade, or Enhanced Product).Designers agree that it has the necessary expertise to select the product with the appropriate qualification designation for their applicationsand that proper product selection is at Designers’ own risk. Designers are solely responsible for compliance with all legal and regulatoryrequirements in connection with such selection.Designer will fully indemnify TI and its representatives against any damages, costs, losses, and/or liabilities arising out of Designer’s non-compliance with the terms and provisions of this Notice.
Mailing Address: Texas Instruments, Post Office Box 655303, Dallas, Texas 75265Copyright © 2018, Texas Instruments Incorporated