Embed Size (px)
Citation preview
DCN 15-11-0074-00-004k
Submission
Sourav Dey, On-Ramp Wireless
Jan 2011
Slide 1
Project: IEEE P802.15 Working Group for Wireless Personal Area Networks (WPANs)
Submission Title: 802.15.4k Channel Interference ProfilesDate Submitted: 16, Jan 2011Source: Sourav Dey Company (On-Ramp Wireless, Inc.)Address 10920 Via Frontera, Suite 200, San Diego, CA 92127 USAVoice:858-592-6008, FAX: 858-592-6009, E-Mail: [email protected]
Re: ISM 2.4GHz Channel Interference Profiles
Abstract: The presentation presents a number of channel interference profiles for 2.4 GHz unlicensed LECIM deployments. Key observations include the asymmetric nature of interference between potential endpoint and access point locations. Endpoint locations show minimal rise over thermal whereas access point locations show significant rise over thermal due to co-located transmitters and a high height. Also of note is the dynamic nature of the ISM band interference.
Purpose: Illustrate 2.4GHz ISM band interference profiles
Notice: This document has been prepared to assist the IEEE P802.15. It is offered as a basis for discussion and is not binding on the contributing individual(s) or organization(s). The material in this document is subject to change in form and content after further study. The contributor(s) reserve(s) the right to add, amend or withdraw material contained herein.
Release: The contributor acknowledges and accepts that this contribution becomes the property of IEEE and may be made publicly available by P802.15.
DCN 15-11-0074-00-004k
Submission
Jan 2011
Sourav Dey, On-Ramp WirelessSlide 2
802.15.4k Channel Interference Profiles
13/1/2010
DCN 15-11-0074-00-004k
Submission
Purpose
• Illustrate 2.4 GHz ISM band interference profile– At various potential advantaged access point sites which are
located high above the ground– At various potential endpoint sites which are located close to the
ground
DCN 15-11-0074-00-004k
Submission
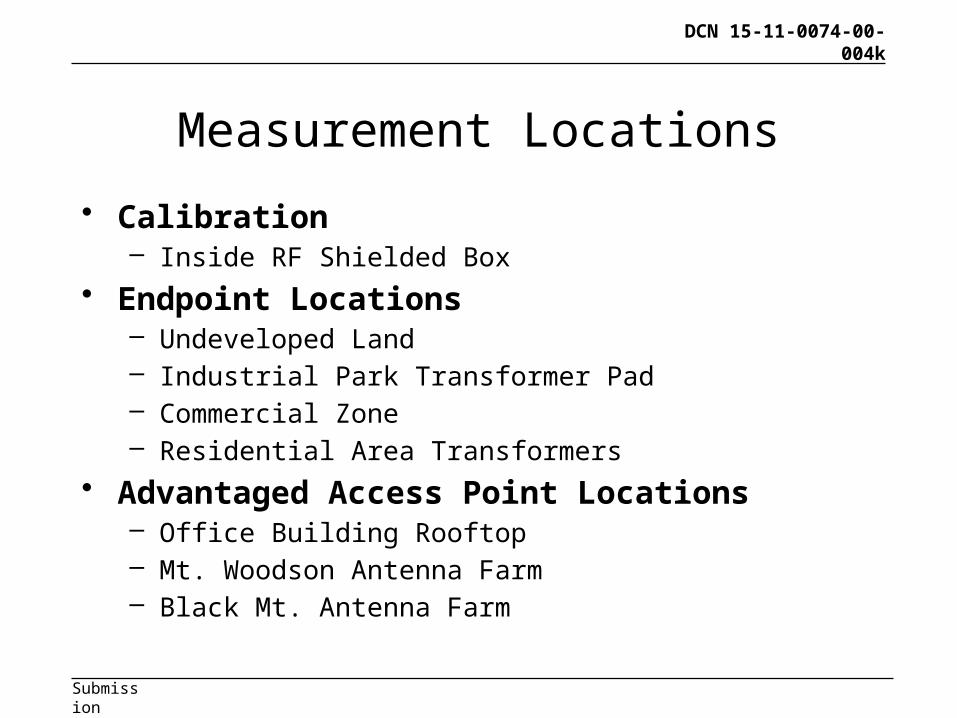
Measurement Locations
• Calibration– Inside RF Shielded Box
• Endpoint Locations– Undeveloped Land– Industrial Park Transformer Pad– Commercial Zone – Residential Area Transformers
• Advantaged Access Point Locations– Office Building Rooftop– Mt. Woodson Antenna Farm– Black Mt. Antenna Farm
DCN 15-11-0074-00-004k
Submission
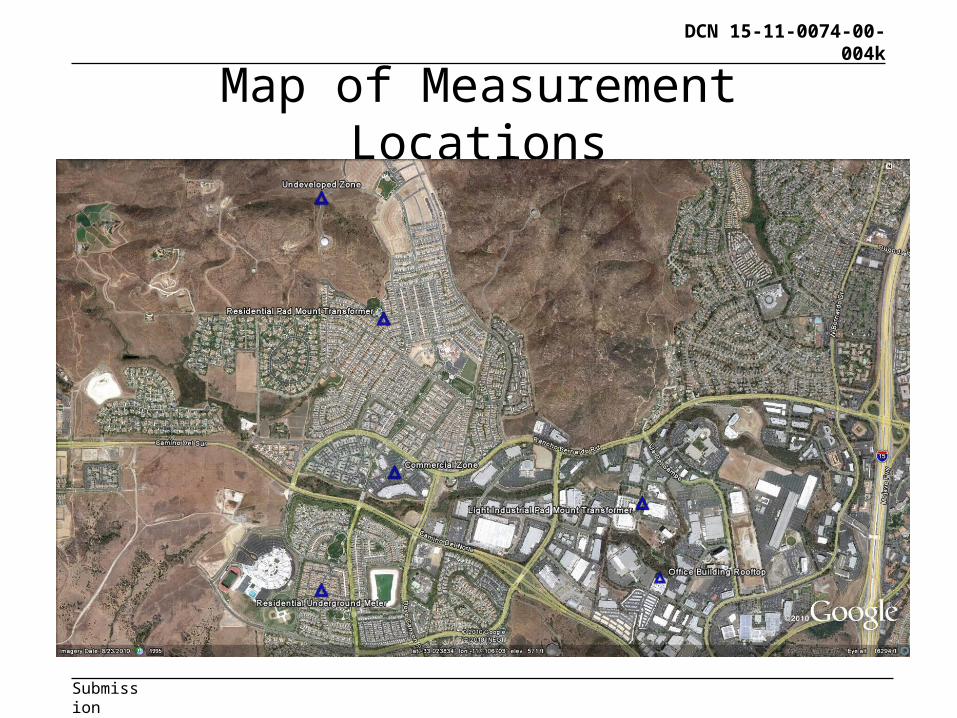
Map of Measurement Locations
DCN 15-11-0074-00-004k
Submission
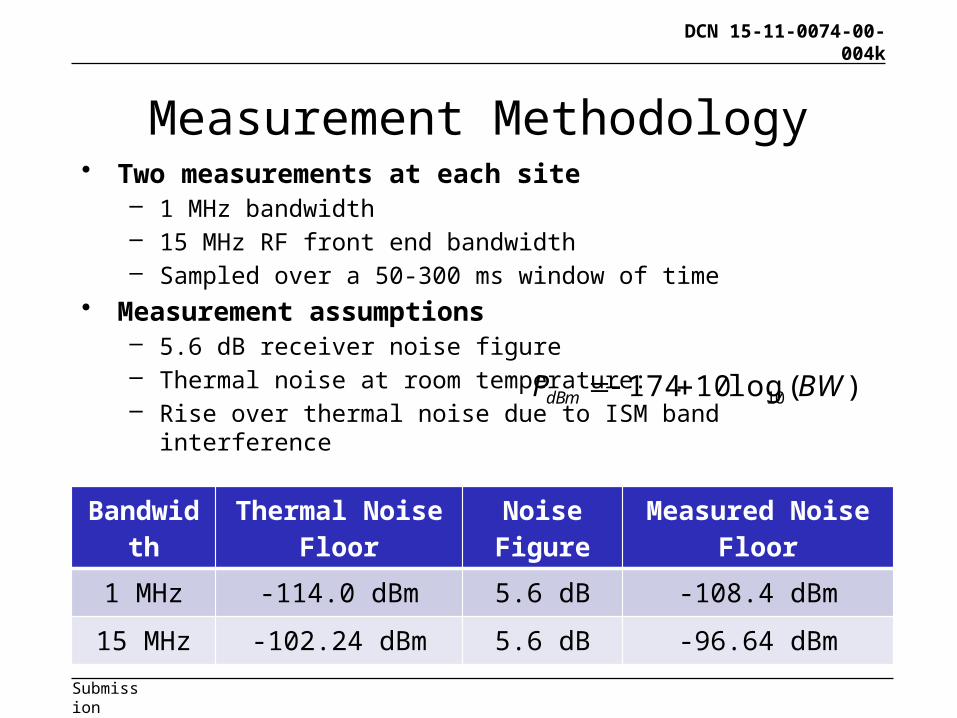
Measurement Methodology• Two measurements at each site
– 1 MHz bandwidth– 15 MHz RF front end bandwidth– Sampled over a 50-300 ms window of time
• Measurement assumptions– 5.6 dB receiver noise figure– Thermal noise at room temperature:– Rise over thermal noise due to ISM band interference
)(log10174 10 BWPdBm
Bandwidth Thermal Noise Floor Noise Figure Measured Noise Floor
1 MHz -114.0 dBm 5.6 dB -108.4 dBm
15 MHz -102.24 dBm 5.6 dB -96.64 dBm
DCN 15-11-0074-00-004k
Submission
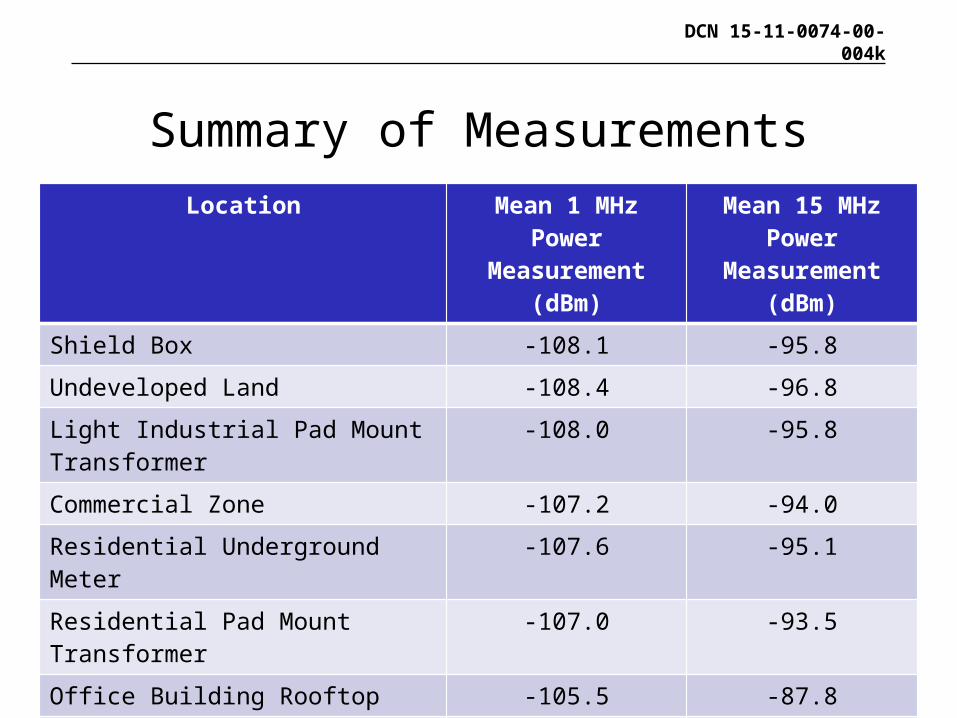
Summary of MeasurementsLocation Mean 1 MHz Power
Measurement (dBm)Mean 15 MHz Power Measurement (dBm)
Shield Box -108.1 -95.8
Undeveloped Land -108.4 -96.8
Light Industrial Pad Mount Transformer -108.0 -95.8
Commercial Zone -107.2 -94.0
Residential Underground Meter -107.6 -95.1
Residential Pad Mount Transformer -107.0 -93.5
Office Building Rooftop -105.5 -87.8
Mt. Woodson Antenna Farm -101.1 -86.0
Black Mt. Antenna Farm -94.2 -80.7
DCN 15-11-0074-00-004k
Submission
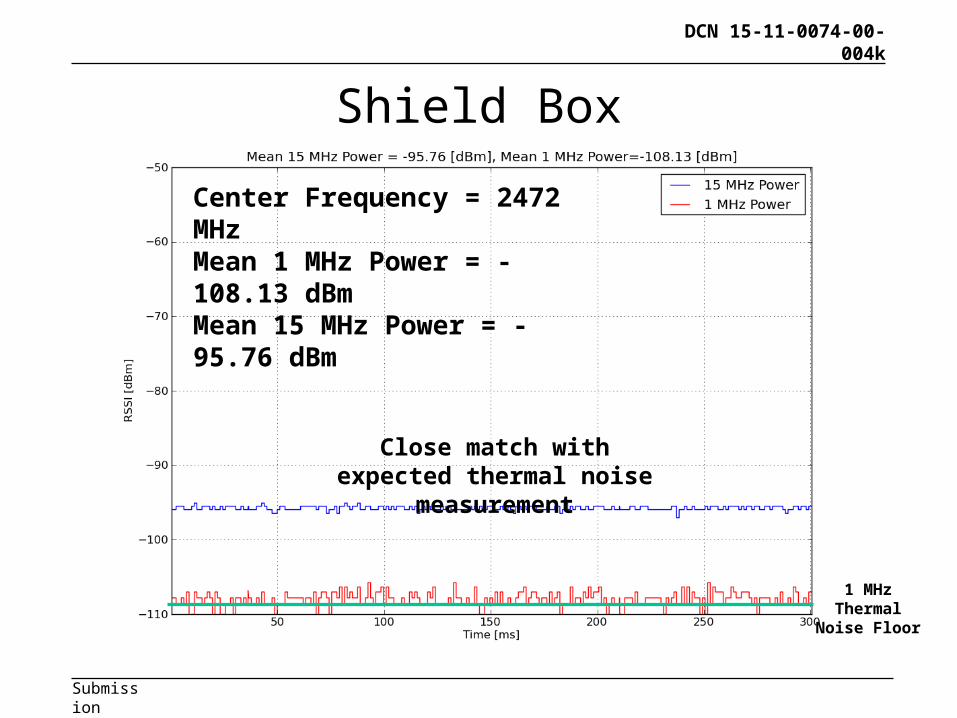
Shield Box
Close match with expected thermal noise measurement
Center Frequency = 2472 MHzMean 1 MHz Power = -108.13 dBmMean 15 MHz Power = -95.76 dBm
1 MHz Thermal Noise Floor
DCN 15-11-0074-00-004k
Submission
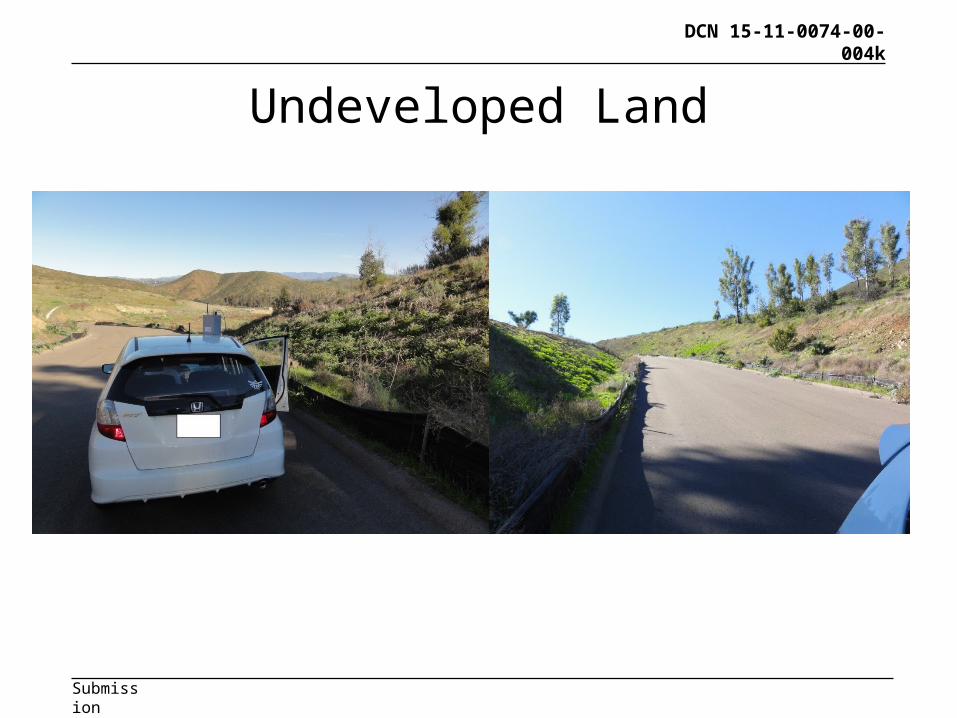
Undeveloped Land

DCN 15-11-0074-00-004k
Submission
Undeveloped Land
Center Frequency = 2426MHzMean 1 MHz Power = -108.41 dBmMean 15 MHz Power = -96.79 dBm
Close match with expected thermal noise measurement
1 MHz Thermal Noise Floor

DCN 15-11-0074-00-004k
Submission
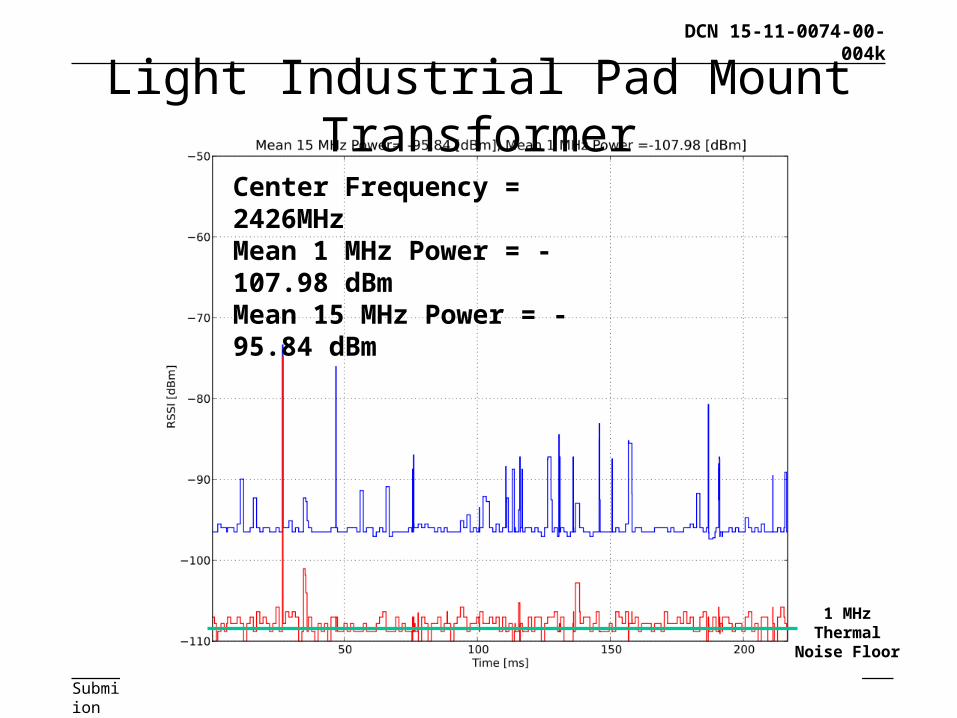
Light Industrial Pad Mount Transformer
DCN 15-11-0074-00-004k
Submission
Light Industrial Pad Mount Transformer
Center Frequency = 2426MHzMean 1 MHz Power = -107.98 dBmMean 15 MHz Power = -95.84 dBm
1 MHz Thermal Noise Floor
DCN 15-11-0074-00-004k
Submission
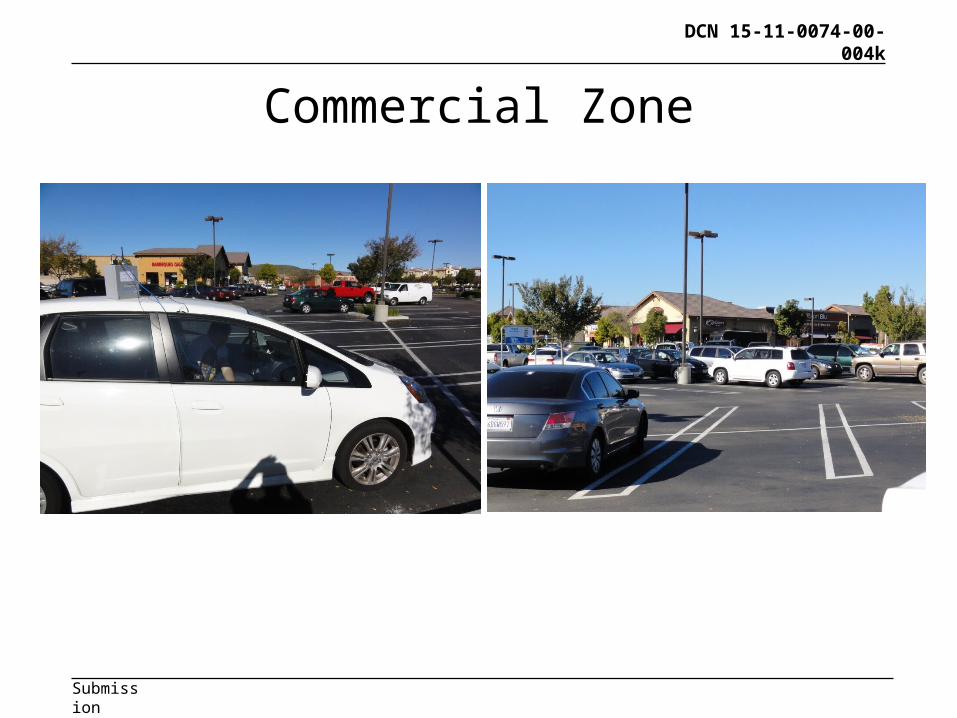
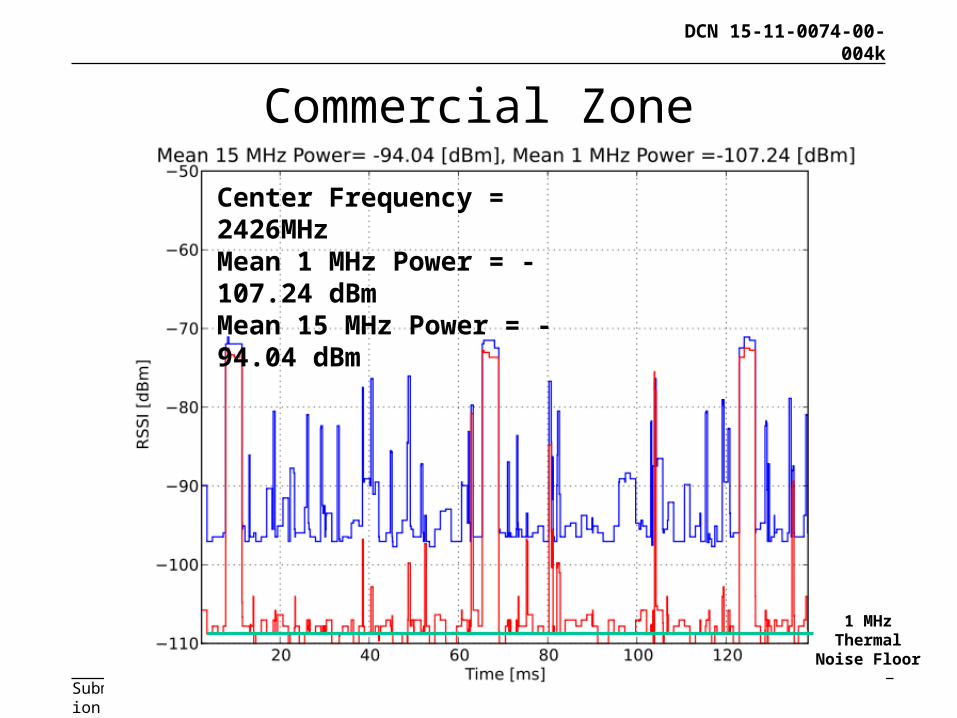
Commercial Zone
DCN 15-11-0074-00-004k
Submission
Commercial Zone
Center Frequency = 2426MHzMean 1 MHz Power = -107.24 dBmMean 15 MHz Power = -94.04 dBm
1 MHz Thermal Noise Floor
DCN 15-11-0074-00-004k
Submission
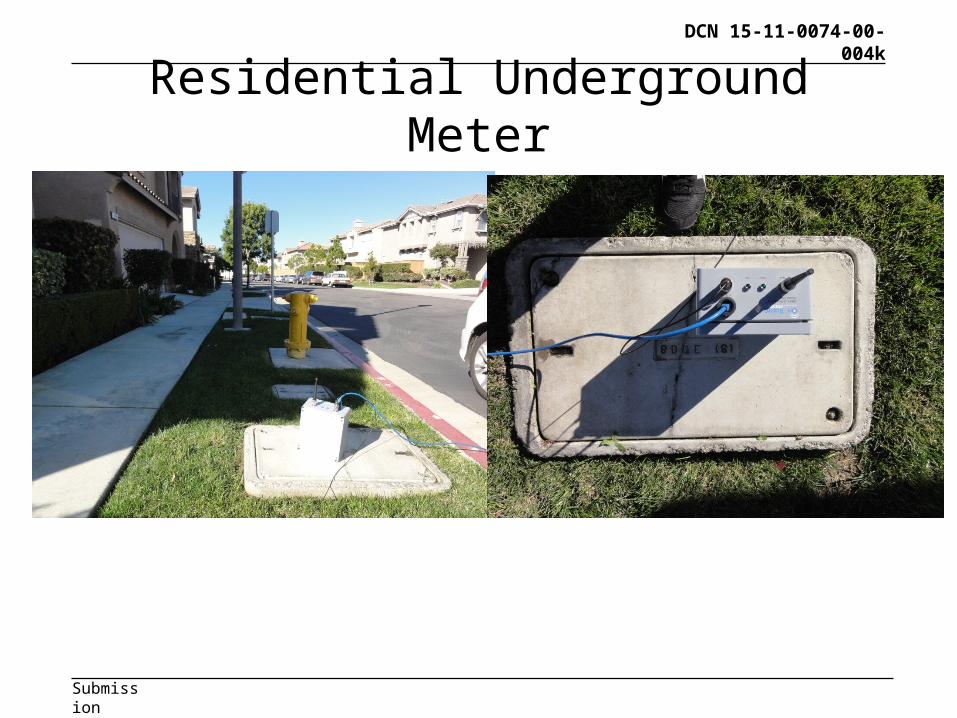
Residential Underground Meter
DCN 15-11-0074-00-004k
Submission
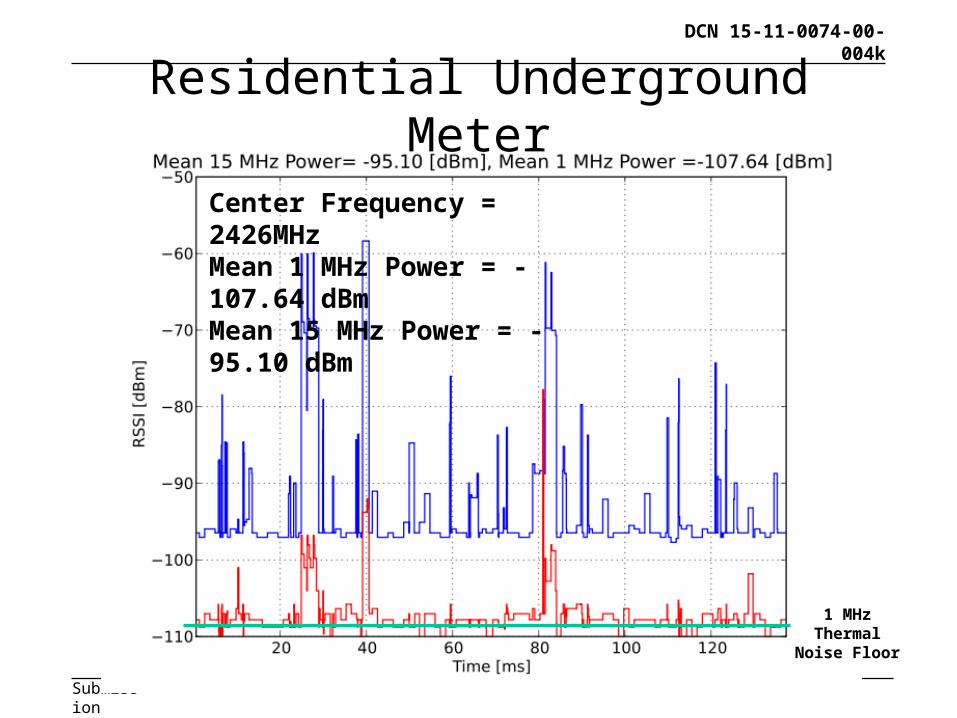
Residential Underground Meter
Center Frequency = 2426MHzMean 1 MHz Power = -107.64 dBmMean 15 MHz Power = -95.10 dBm
1 MHz Thermal Noise Floor
DCN 15-11-0074-00-004k
Submission
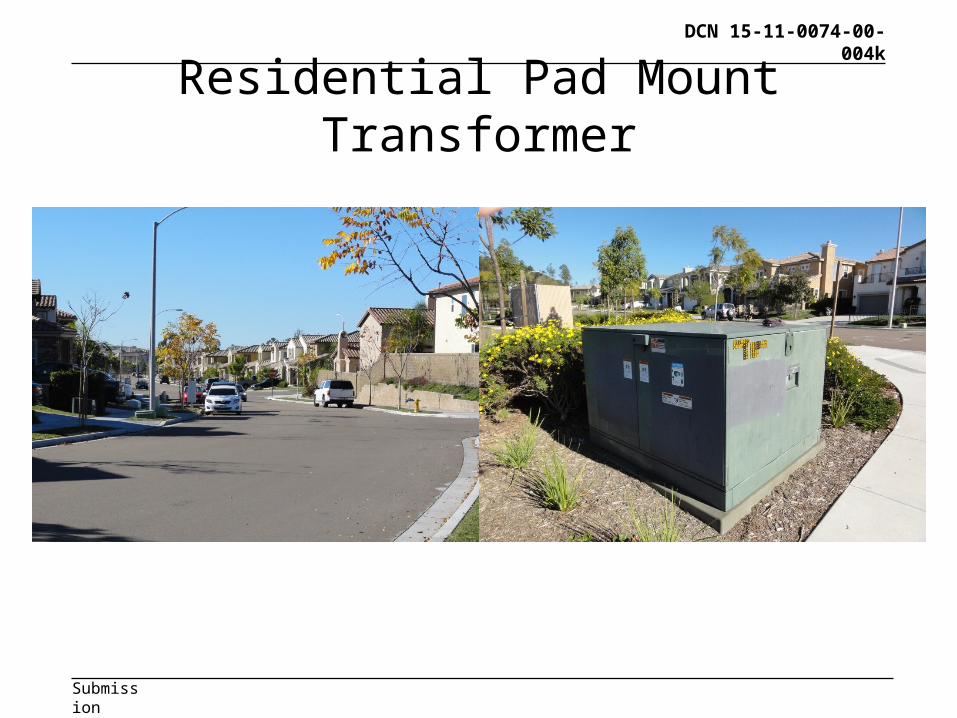
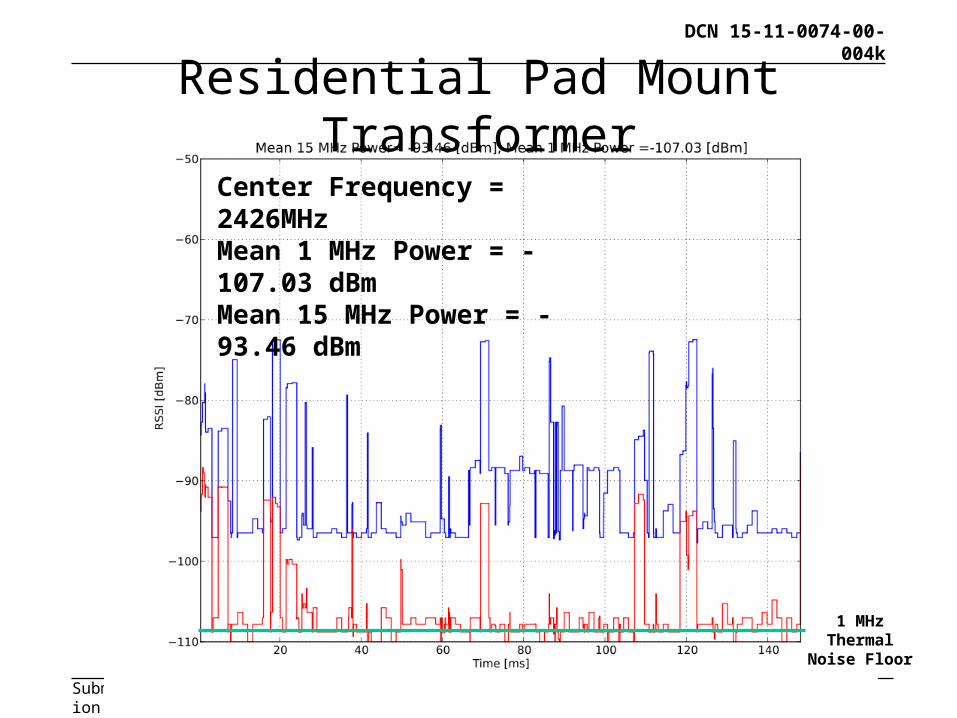
Residential Pad Mount Transformer
DCN 15-11-0074-00-004k
Submission
Residential Pad Mount Transformer
Center Frequency = 2426MHzMean 1 MHz Power = -107.03 dBmMean 15 MHz Power = -93.46 dBm
1 MHz Thermal Noise Floor
DCN 15-11-0074-00-004k
Submission
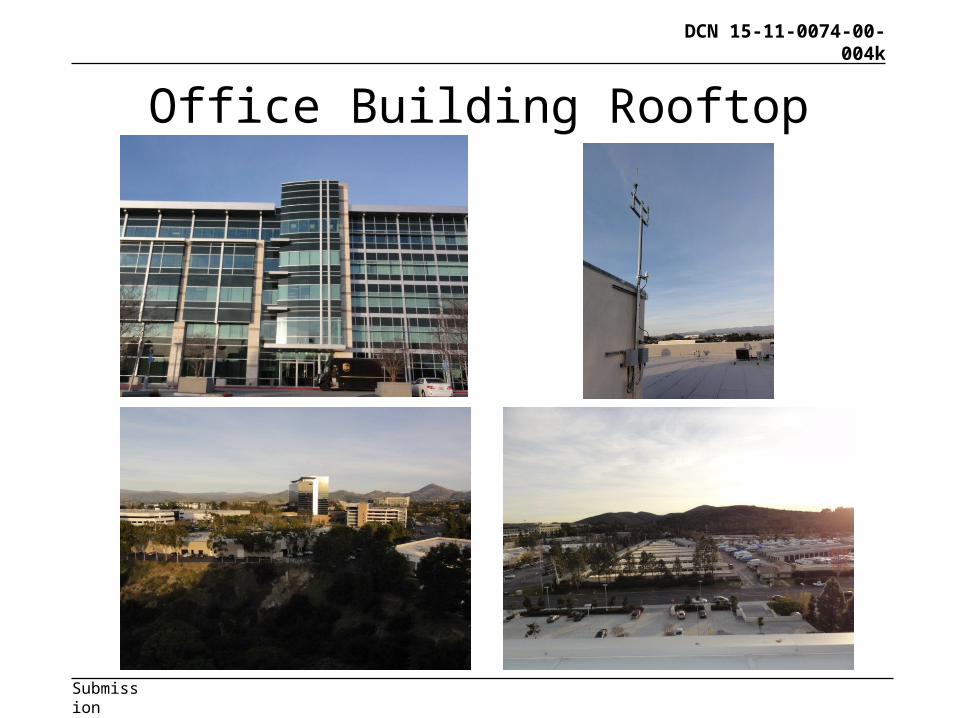
Office Building Rooftop
DCN 15-11-0074-00-004k
Submission
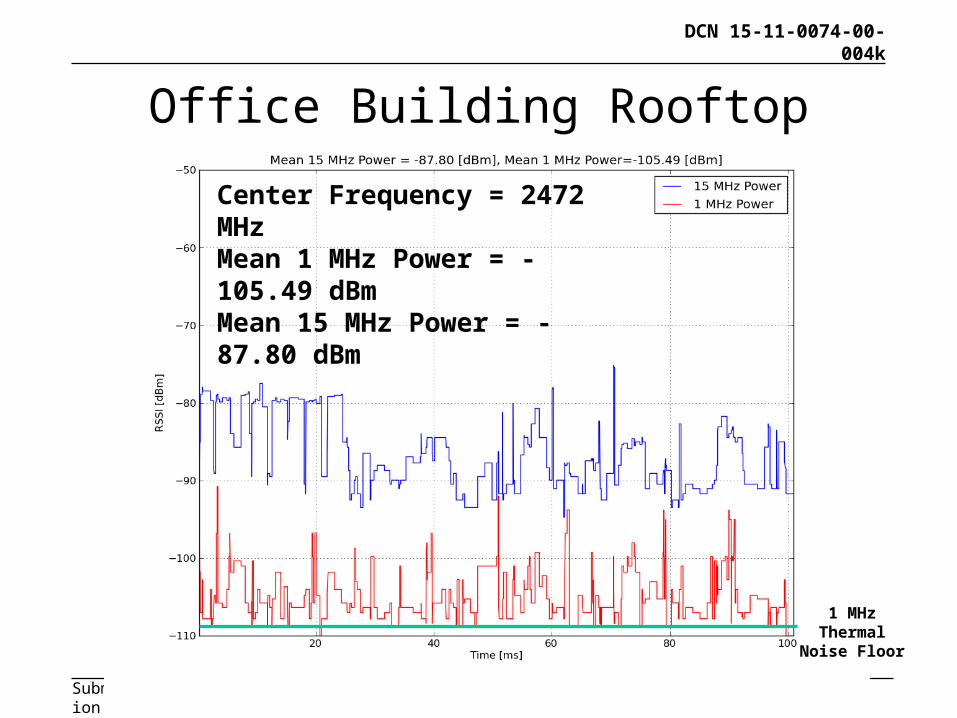
Office Building Rooftop
Center Frequency = 2472 MHzMean 1 MHz Power = -105.49 dBmMean 15 MHz Power = -87.80 dBm
1 MHz Thermal Noise Floor
DCN 15-11-0074-00-004k
Submission
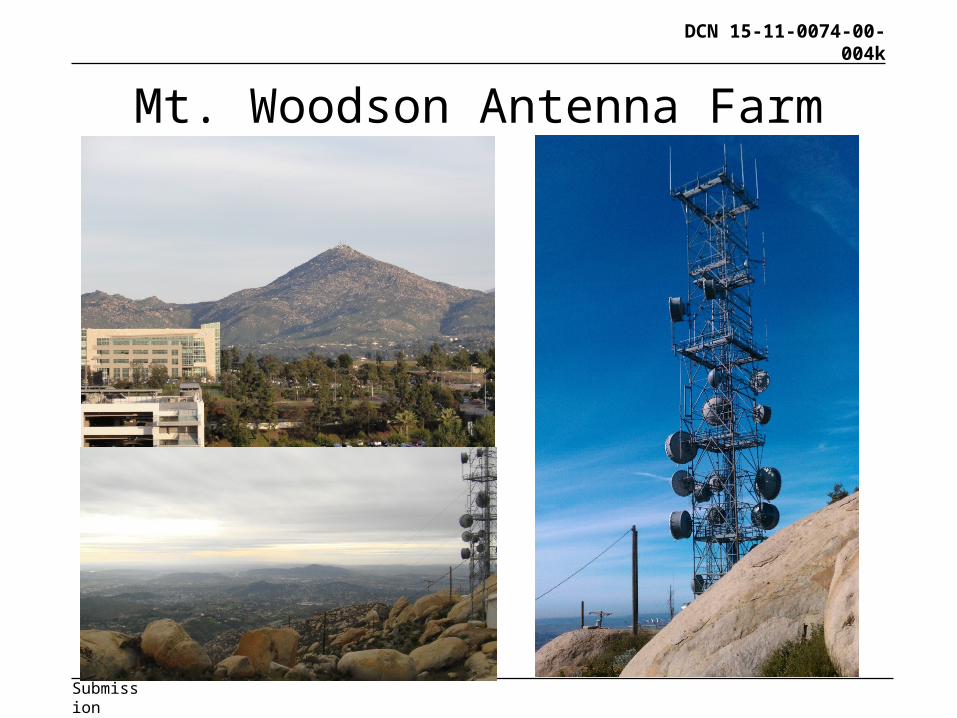
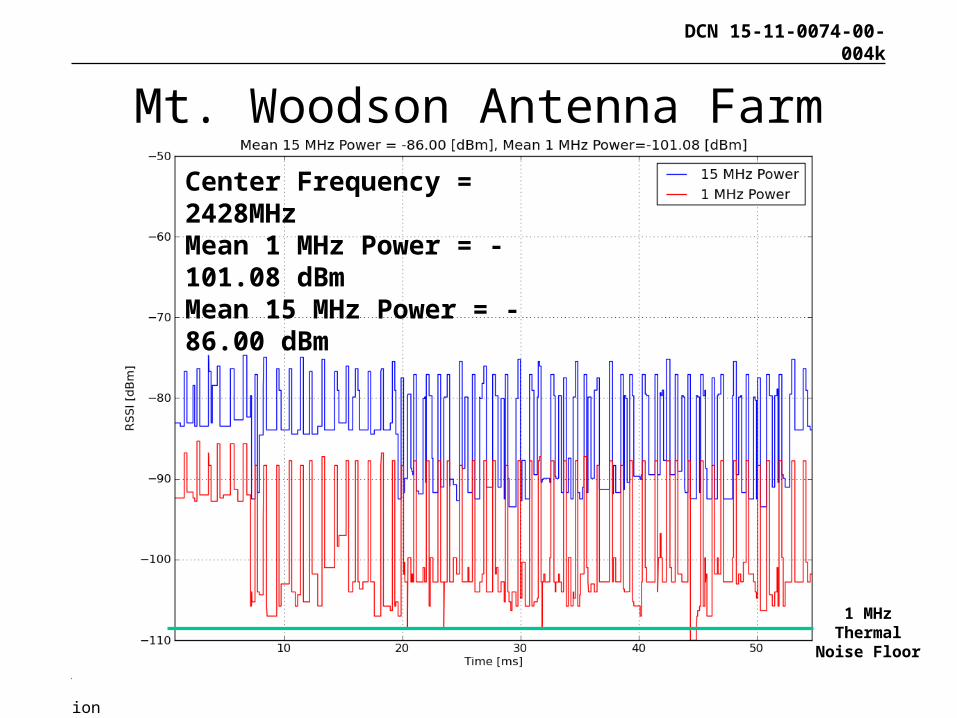
Mt. Woodson Antenna Farm
DCN 15-11-0074-00-004k
Submission
Mt. Woodson Antenna FarmCenter Frequency = 2428MHzMean 1 MHz Power = -101.08 dBmMean 15 MHz Power = -86.00 dBm
1 MHz Thermal Noise Floor
DCN 15-11-0074-00-004k
Submission
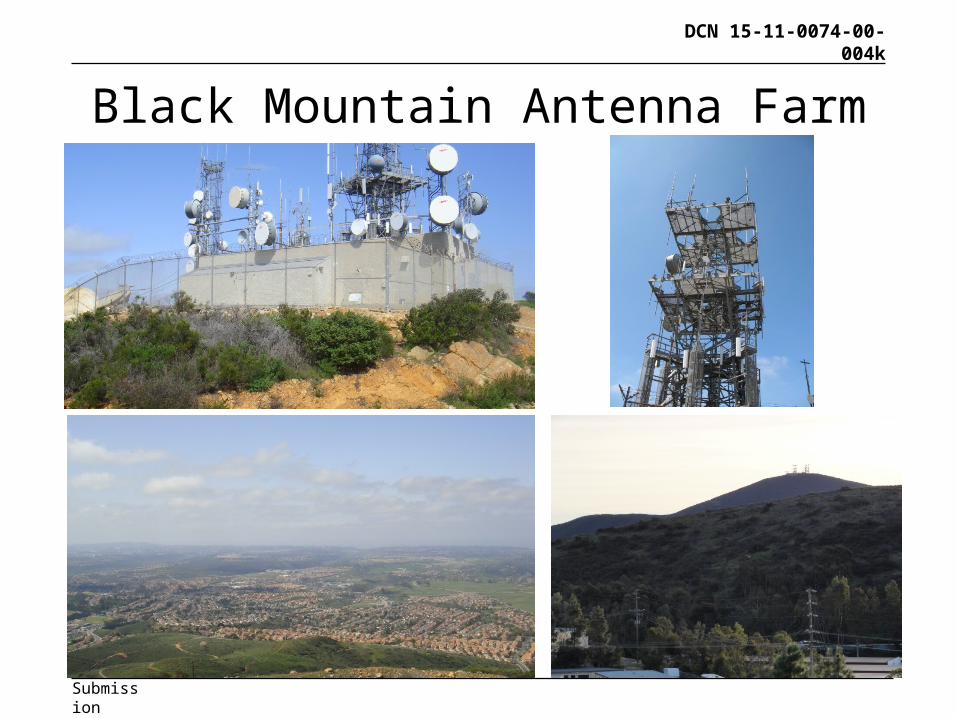
Black Mountain Antenna Farm
DCN 15-11-0074-00-004k
Submission
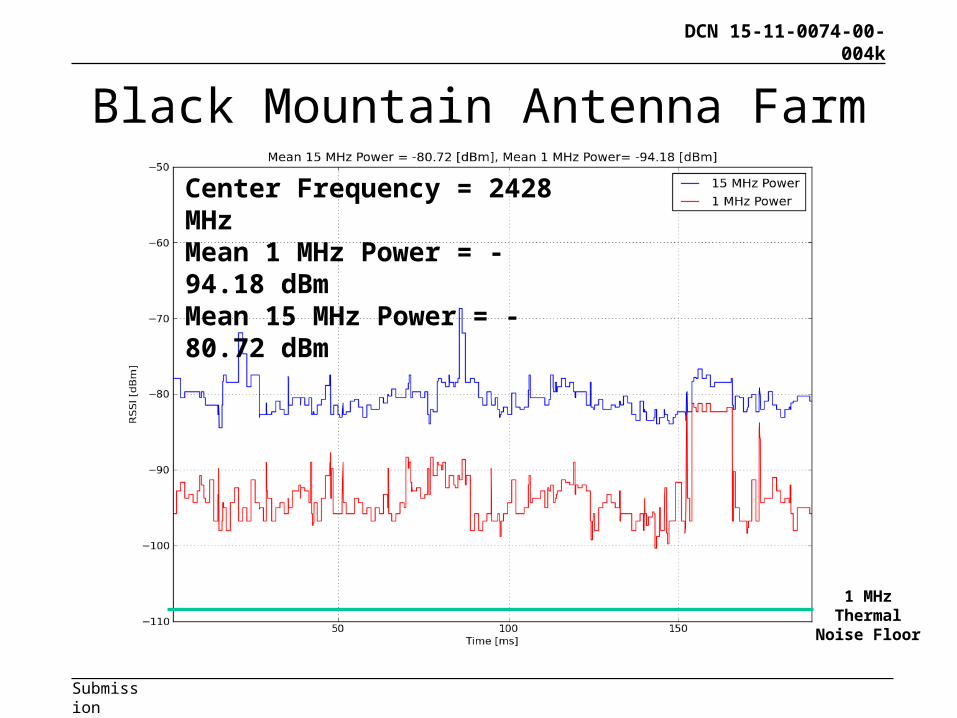
Black Mountain Antenna Farm
Center Frequency = 2428 MHzMean 1 MHz Power = -94.18 dBmMean 15 MHz Power = -80.72 dBm
1 MHz Thermal Noise Floor
DCN 15-11-0074-00-004k
Submission
Conclusions
• Asymmetric interference between advantaged vs. non-advantaged sites
• Not much rise over thermal at endpoint sites• Significant rise over thermal noise at advantaged sites• Dynamic and bursty interference due to other 2.4 GHz
traffic
DCN 15-11-0074-00-004k
Submission
<author>, <company>
BACKUP SLIDES
<month year>
Slide 26
DCN 15-11-0074-00-004k
Submission
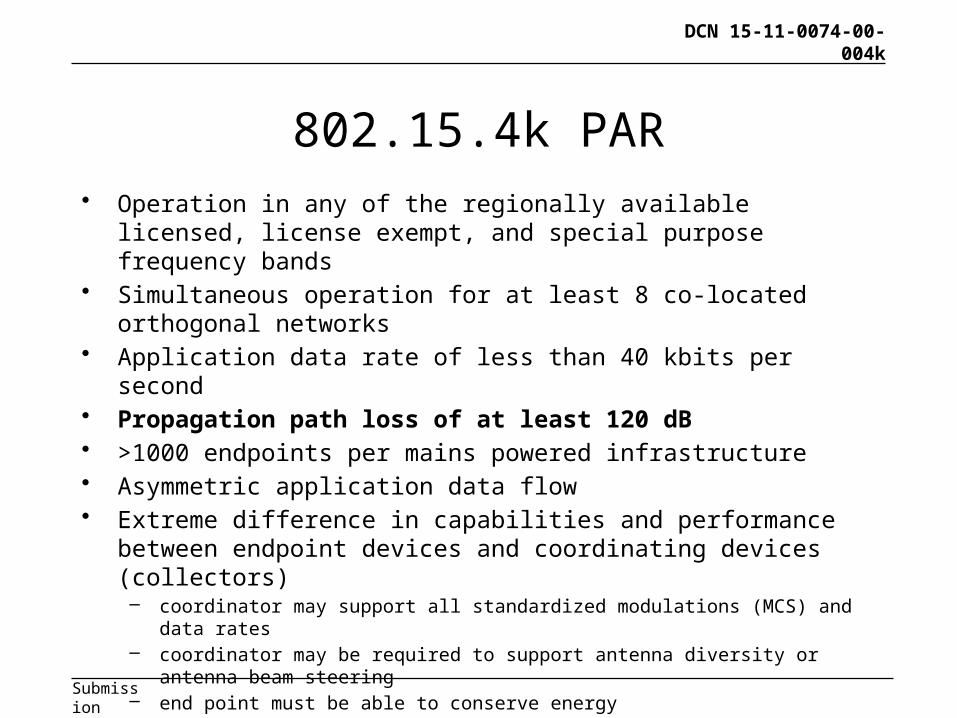
802.15.4k PAR• Operation in any of the regionally available licensed, license exempt, and
special purpose frequency bands• Simultaneous operation for at least 8 co-located orthogonal networks• Application data rate of less than 40 kbits per second• Propagation path loss of at least 120 dB• >1000 endpoints per mains powered infrastructure• Asymmetric application data flow• Extreme difference in capabilities and performance between endpoint devices
and coordinating devices (collectors)– coordinator may support all standardized modulations (MCS) and data rates– coordinator may be required to support antenna diversity or antenna beam steering– end point must be able to conserve energy
• Reliable operation in dramatically changing environments (no control over environment)