Embed Size (px)
Citation preview

DBF - Development and Verification of a Bibliometric Model for the Identification of Frontier Research
Synthesis Report
DBF

DBF Team
Katy Whitelegg (Coordinator) AIT Austrian Institute of Technology GmbH
Team Members AIT Austrian Institute of Technology GmbH
Edgar Schiebel
Thomas Scherngell
Dirk Holste (Coordinator until 10/2012)
Maria-Elizabeth Züger
Marianne Hörlesberger
INIST-CNRS, Institute for Scientific and Technical Information (Institut de l’Information Scien-tifique et Technique - INIST) of the French National Center for Scientific Research (CNRS)
Ivana Roche
Dominique Besagni
Claire Françoise [email protected] Pascal Cuxac [email protected] Nathalie Vedovotto [email protected]

iii
Acknowledgements The authors wish to express their gratitude to the many people who supported and influenced the project including Prof. Dr. Helga Nowotny (European Research Council) and to members of the Eu-ropean Research Council Executive Agency, especially Dr. Boris Kragelj, Dr. Alexis-Michel Muga-bushaka and Ms. Ulrike Kainz-Fernandez. We would also like to thank Ms. Katja Mayer (University of Vienna) and Prof. Dr. Michel Zitt (French National Institute for Agricultural Research, INRA) for the fruitful discussions and the help that these interactions brought us. The authors gratefully acknowledge the contributions made by Dr. Christoph Pollak (researchTUb), former project coordinator, and Dr. Jens Hemmelskamp (Research Executive Agency), the former project officer. The authors also wish to warmly thank the INIST-CNRS colleagues involved in the expertise tasks.

i
Executive Summary
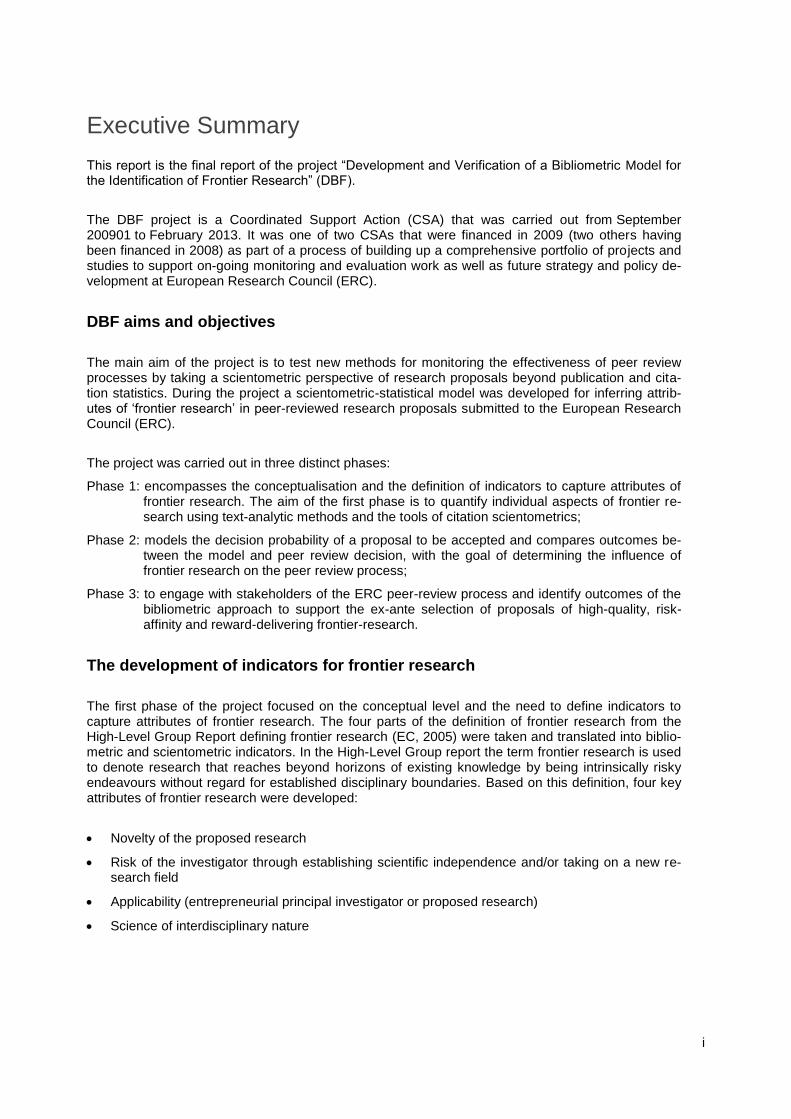
This report is the final report of the project “Development and Verification of a Bibliometric Model for the Identification of Frontier Research” (DBF).
The DBF project is a Coordinated Support Action (CSA) that was carried out from September 200901 to February 2013. It was one of two CSAs that were financed in 2009 (two others having been financed in 2008) as part of a process of building up a comprehensive portfolio of projects and studies to support on-going monitoring and evaluation work as well as future strategy and policy de-velopment at European Research Council (ERC).
DBF aims and objectives
The main aim of the project is to test new methods for monitoring the effectiveness of peer review processes by taking a scientometric perspective of research proposals beyond publication and cita-tion statistics. During the project a scientometric-statistical model was developed for inferring attrib-utes of ‘frontier research’ in peer-reviewed research proposals submitted to the European Research Council (ERC).
The project was carried out in three distinct phases:
Phase 1: encompasses the conceptualisation and the definition of indicators to capture attributes of frontier research. The aim of the first phase is to quantify individual aspects of frontier re-search using text-analytic methods and the tools of citation scientometrics;
Phase 2: models the decision probability of a proposal to be accepted and compares outcomes be-tween the model and peer review decision, with the goal of determining the influence of frontier research on the peer review process;
Phase 3: to engage with stakeholders of the ERC peer-review process and identify outcomes of the bibliometric approach to support the ex-ante selection of proposals of high-quality, risk-affinity and reward-delivering frontier-research.
The development of indicators for frontier research
The first phase of the project focused on the conceptual level and the need to define indicators to capture attributes of frontier research. The four parts of the definition of frontier research from the High-Level Group Report defining frontier research (EC, 2005) were taken and translated into biblio-metric and scientometric indicators. In the High-Level Group report the term frontier research is used to denote research that reaches beyond horizons of existing knowledge by being intrinsically risky endeavours without regard for established disciplinary boundaries. Based on this definition, four key attributes of frontier research were developed:
Novelty of the proposed research
Risk of the investigator through establishing scientific independence and/or taking on a new re-search field
Applicability (entrepreneurial principal investigator or proposed research)
Science of interdisciplinary nature

ii
These four attributes were then translated into five indicators that could be expressed in bibliometric terms (the first key attribute was split into two separate indicators):
Innovativeness
Timeliness
Risk
Pasteuresqueness
Interdisciplinarity
The individual indicators
The indicators timeliness and risk are derived from citation analysis. Timeliness is based on the simple assumption that the time (publication year) distribution of cited proposal references is a proxy for the novelty of research. The more recent references are (e.g. on average), the more likely the work is at the cutting edge of science. Timeliness computes for every reference of a proposal the relative difference in years between its publication date and the year of the application. References of the proposal are considered appropriate because not only do they relate directly to the project but constitute the knowledge base on which the proposal is built.
The indicator risk is used as a proxy for the “individual risk” of the principal investigator in carrying out the proposed research. In addition to references of a proposal (defining set I), it makes use of external reference information (with respect to the proposal). It compiles references of research pa-pers (set II) previously published by the applicant. Comparing the applicant’s references in set I vs. set II, the overlap between sets is used to compare the proposed research direction with respect to past research. The underlying assumption is that the lower the overlap between sets I and II is, the more it is indicative of a change from previous pursued research (and hence the more independent of previous research directions resp. risk-affine). Computationally, the indicator is defined by the correlation coefficient.
The indicators innovativeness and interdisciplinarity are derived from lexical analysis. The indi-cator innovativeness is based on lexical analysis and used as a proxy to infer the “novelty” of a pro-posal. The core concept has two main steps. 1) The construction of a “publication landscape” via a cluster map derived from scientific and technological information (including research publications, excluding proposals). The landscape is created at two time steps to characterise its level of change over time and identify resp. rank clusters with dynamic growth. 2) Each proposal is ‘embedded’ in the landscape to compute an innovativeness value depending on both distance and rank of nearest clusters. The underlying assumption is that the closer a proposal is to clusters of dynamic growth, the more novel it is.
Computationally, innovativeness is based on indexing keywords. To this end, the bibliographic data-base PASCAL is used, which provides a broad multidisciplinary coverage of about 20 million records. Each PASCAL record is indexed, either manually by scientific experts or automatically based on content analysis, with both keywords and thematic categories. Raw data are extracted from PASCAL (for international scientific and technological literature) by employing a query derived from the de-scription of ERC main research fields (15 in 2007, since then expanded to 10 fields in Physical and Engineering Sciences (PE) and 9 fields in Life sciences (LS)).
Subsequently diachronic cluster analysis is used to study the evolution of the publication landscape across time windows. The most recent time window is the year in which proposals were submitted. Structural alterations of clusters between two time windows are identified and analysed by human scientific experts. Techniques of association rule extraction are applied to facilitate the cluster analy-sis, using fuzzy association rules. There are two objectives. 1) Determining which clusters carry nov-

iii
el topics and to rank clusters by their ‘novelty index’ (a measure of the relationships between clusters from the two time windows build on association rules). 2) Evaluating the novelty of proposals by their similarity with respect to clusters with a high rank.
The indicator interdisciplinarity is used as a proxy to infer self-consistently the presence and pro-portions of characteristic terminology associated with individual ERC main research fields, thereby revealing the intra or inter-field character of a proposal. It is built upon the previously successfully tested approach (Schiebel et al. 2010) that the frequency of occurrence and distribution of research field specific keywords of scientific documents can classify and characterise research fields. While the core of the approach has been retained, the computation has been adopted and fine-tuned to the grant scheme under study.
The term pasteuresqueness is coined in reference to the definition of Pasteur’s Quadrant (Stokes 1997), which describes scientific research or methods that seek both fundamental understanding and social benefit. Guided by the Pasteur Quadrant, the indicator pasteuresqueness serves as a proxy for the applicability of expected results of each proposal. It is based on patent counts and journal classification (ratio of applied vs. theoretical) of applicant publications. Input data are obtained from proposals and external information sources (e.g. bibliographic databases).
Effects of frontier research on the selection outcome
The DBF project was interested in whether different dimensions of frontier research, captured by the five indicators timeliness, risk, innovativeness, interdisciplinarity and pasteuresqueness for frontier research, are statistically significant determinants that influence a research proposal submitted to the ERC to be accepted or rejected. Therefore during the project a statistical model was specified that relates different exogenous factors – involving indicators for frontier research – to the probability of a proposal to be accepted or rejected, under control of additional factors that may influence the ac-ceptance probability.
The model produces significant estimates for interdisciplinarity and innovativeness, i.e. it suggests that the review process accounts for these attributes of frontier research in their decision-making. However, parameter estimates for the remaining attributes, that is timeliness, risk and pasteuresque-ness, are not statistically significant. In this sense, the model suggests that these attributes do not play a significant role in the review process.
Conclusions
The conclusions of the DBF can be found on different levels from the conceptual to the implementa-tion level. The most important of these are summarised below.
Defining frontier research – the conceptual level
The DBF project took the ERC High Level Group’s definition of frontier research as its starting point and translated this into bibliometric indicators. The project did not attempt to reflect on the definition of frontier research on a level that goes beyond the High Level Group’s approach. The main focus of the project was on the translation and on the need to produce indicators that could be implemented in bibliometric terms. The resulting bibliometric indicators were intended to measure the four different aspects of frontier research; risk, novelty, interdisciplinarity and pasteuresqueness.
However, the process of producing concrete indicators did initiate an interesting discussion on what is meant by the individual key attributes of frontier research. One of the discussions that emerged from the definition of the risk indicator was that the way in which DBF defined risk as personal risk

iv
was not the way in which ERC defines risk. In addition, the discussions around the definition of the interdisciplinarity indicator also showed that there is more than one way of defining interdisciplinarity.
Another discussion was that of the interaction between the different key attributes. During the project, the individual proposals were ranked individually across all five indicators. However, it was never clear whether a really successful proposal should score highly on all five accounts. However, as mentioned before, the conceptual level of frontier research was not the main focus of the DBF project
The main conclusions therefore on frontier research that emerged from the DBF project were that the concept of frontier research from the High Level Group is a useful starting point, but is not one that can be directly translated into concrete indicators. Or more specifically, the key attribute can be translated into different indicators that mean quite different things.
Definition of indicators for frontier research in terms of bibliometric indicators
The DBF project took the concept of frontier research as defined by the high level group and turned it into indicators that can be measured. The translation of the concept into workable indicators was the first main success of the DBF project. DBF produced five concrete and tangible indicators for meas-uring frontier research in bibliometric terms. The methods used took bibliometric methods beyond their normal use and attempted to use them to measure a specific concept. This in itself was an in-novative approach. The five indicators proved that bibliometric indicators could be used to define and measure frontier research.
The translation of the key attributes into indicators proved to be very different for each of the individ-ual indicators. The indicators risk and pasteuresqueness were the most difficult to translate into a bibliometric indicator that measured the key attribute. This was due partly to the difficulty in pinning the concepts down to a single issue that could be measured and partly due to the fact that it was more difficult to address these issues in bibliometric terms.
On the basis of these five indicators, it could be suggested that using indicators that look at the con-tent of the proposal (interdisciplinarity and innovativeness) rather than only the citations or refer-ences in isolation (risk and timeliness) proves to be more successful. The project found that not only was it easier to define these two indicators (interdisciplinarity and innovativeness), but that the econ-ometric model also found that these two indicators played a statistically significant role in the peer review process. The output of this phase of the project was a ranking of proposals calculated for each of the individual indicators. This information in itself was another of the output successes of the DBF project. Although the indicators developed may not represent a complete reflection of the ERC´s understanding of frontier research, they pick up some of the aspects of frontier research, and can therefore serve as useful inputs in an evaluation context of grant proposals or peer-review pro-cesses for different purposes. For the first time, ERC had a list of the proposals ranked according to the key attributes of frontier research.
Do the peer review panels select frontier research?
The DBF project was interested in whether ERC peer review panels selected projects for funding which addressed frontier research. In order to compare the DBF ranking of proposals with the deci-sions taken by the ERC panels, an econometric model was used to compare the five indicators to the proposals selected during the peer review process. The outcome was that the peer review panels took only one aspect – though a core aspect -of frontier research, innovativeness into account. In addition, it emerged that for the indicator interdisciplinarity, the peer review panels were actually se-lecting projects that were not interdisciplinary, but disciplinary focused. However, the latter result is not surprising as it confirms earlier experiences from the ERC.

v
The fact the only one of the indicators was identified by the peer reviewers in the selection of the projects could have different reasons. It could be that the peer reviewers were really not selecting projects that addressed other aspects of frontier research. Another interpretation however, would be that the indicators measure other aspects than those that were taken into account for decisions.
Putting the DBF results into practice
The DBF project developed and implemented five indicators for frontier research. However, the aim of the project was not just to develop indicators but to look at how they could be implemented within the ERC. To a certain extent, the results already have begun to have an impact. The final workshop in Brussels led to a number of discussions about how ERC defines and implements the concept of frontier research. However, the DBF project initially aimed to “provide a methodology that allows the ERC to monitor the operation of the peer review process from a bibliometric perspective and poten-tially shall yield additional elements in the future execution of the peer review process”.
The DBF project created indicators and measured the extent to which the peer review panels took the defined and measured dimensions of frontier research into account in selecting projects. This process was complex and time consuming and only one of the indicators (interdisciplinarity) was able to be processed electronically in an easy way. The other indicator that was taken into account by the peer review panels (innovativeness) is still at a stage of development where it is too time consuming to be implemented by a research funding organisation such as ERC. However, the modelling results have important implications in a practical context; since, for instance, interdisciplinarity has even a negative effect on a proposals selection probability. The model could then be used in future review processes to see whether this has improved. The same holds for the other dimensions, risk, pas-teuresqueness and timeliness.
Using the DBF results in the peer review process
The DBF project developed and implemented indicators to identify frontier research. Of course ERC was interested in to what extent they could use the indicators themselves in the peer review process. The report has documented the benefits and the challenges with the approach and has provided ERC with an extremely good basis to proceed looking at the use of bibliometric indicators at ERC. However, the project team is of the opinion that before ERC implements such indicators, they would need to test the approach first. Having said this there are several different ways in which the project results could be used:
The ranking of the proposals by individual indicators could be provided to the panels after they have taken their decisions on which proposals to fund to provide an additional input to the decision making process.
The model used in the project is not one that can be used ex-ante to predict which projects address frontier research. However, it can be used ex-post to see whether frontier research dimensions are taken up in the review process, and – if this is not the case – respective measures may be taken by the ERC.
The approach to measure interdisciplinarity (maps of panels and panel keywords by the co-occurrence in 2009 starting grants) revealed that the panels need to be redefined and re-structured to better reflect the European research landscape and the strategic objectives of the ERC.
vi
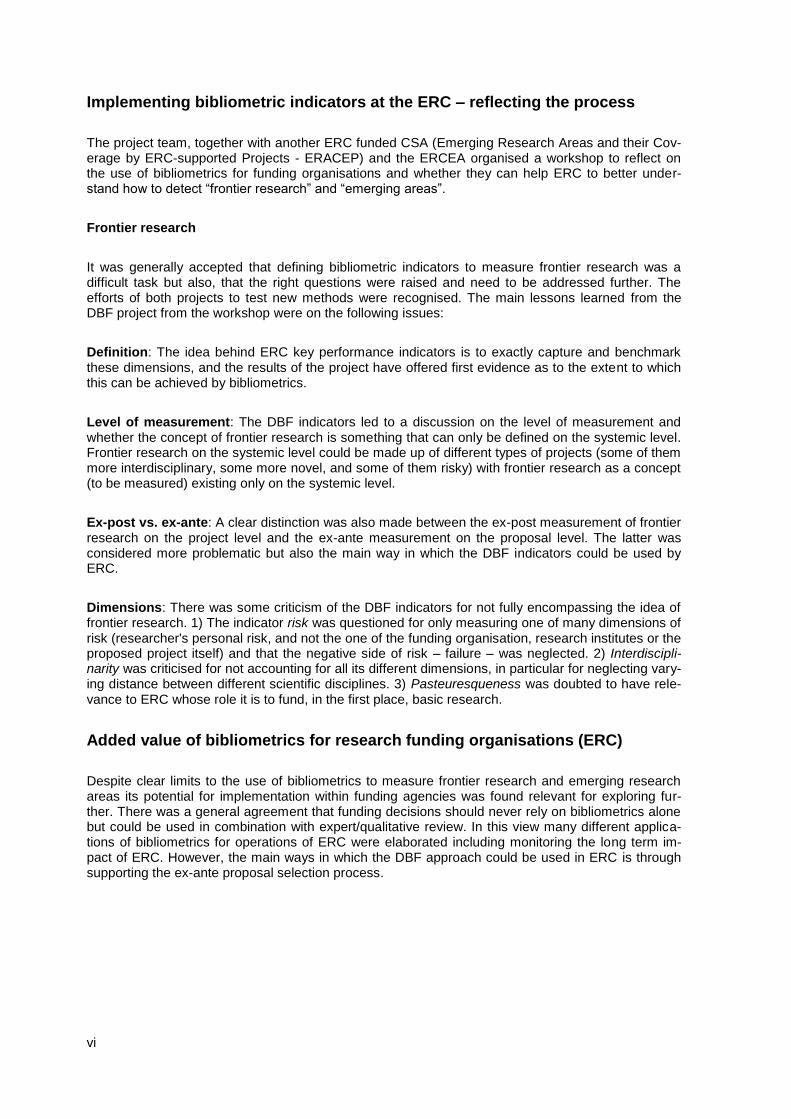
Implementing bibliometric indicators at the ERC – reflecting the process
The project team, together with another ERC funded CSA (Emerging Research Areas and their Cov-erage by ERC-supported Projects - ERACEP) and the ERCEA organised a workshop to reflect on the use of bibliometrics for funding organisations and whether they can help ERC to better under-stand how to detect “frontier research” and “emerging areas”.
Frontier research
It was generally accepted that defining bibliometric indicators to measure frontier research was a difficult task but also, that the right questions were raised and need to be addressed further. The efforts of both projects to test new methods were recognised. The main lessons learned from the DBF project from the workshop were on the following issues:
Definition: The idea behind ERC key performance indicators is to exactly capture and benchmark these dimensions, and the results of the project have offered first evidence as to the extent to which this can be achieved by bibliometrics.
Level of measurement: The DBF indicators led to a discussion on the level of measurement and whether the concept of frontier research is something that can only be defined on the systemic level. Frontier research on the systemic level could be made up of different types of projects (some of them more interdisciplinary, some more novel, and some of them risky) with frontier research as a concept (to be measured) existing only on the systemic level.
Ex-post vs. ex-ante: A clear distinction was also made between the ex-post measurement of frontier research on the project level and the ex-ante measurement on the proposal level. The latter was considered more problematic but also the main way in which the DBF indicators could be used by ERC.
Dimensions: There was some criticism of the DBF indicators for not fully encompassing the idea of frontier research. 1) The indicator risk was questioned for only measuring one of many dimensions of risk (researcher's personal risk, and not the one of the funding organisation, research institutes or the proposed project itself) and that the negative side of risk – failure – was neglected. 2) Interdiscipli-narity was criticised for not accounting for all its different dimensions, in particular for neglecting vary-ing distance between different scientific disciplines. 3) Pasteuresqueness was doubted to have rele-vance to ERC whose role it is to fund, in the first place, basic research.
Added value of bibliometrics for research funding organisations (ERC)
Despite clear limits to the use of bibliometrics to measure frontier research and emerging research areas its potential for implementation within funding agencies was found relevant for exploring fur-ther. There was a general agreement that funding decisions should never rely on bibliometrics alone but could be used in combination with expert/qualitative review. In this view many different applica-tions of bibliometrics for operations of ERC were elaborated including monitoring the long term im-pact of ERC. However, the main ways in which the DBF approach could be used in ERC is through supporting the ex-ante proposal selection process.
vii
Ex-post evaluation in support of future strategic thinking
Bibliometrics can provide measures to what extent outcomes of ERC funded research meets criteria of frontier research.
Ex-ante support to ERC evaluation process
The ex-ante use of indicators for frontier research is a much more debated way of deploying biblio-metrics in support of ERC operations. Despite general agreement that bibliometric indicators alone should never be used to determine funding decision, their potential to assist and complement peer-review selection process should not be neglected. Bibliometric indictors could help in identifying re-search proposals with frontier research potential.
Pre-evaluation of the proposals: One option is to put in place bibliometric indicators of frontier re-search to assess the quality of proposal and model/predict its selection outcome by statistical me-chanics (statistical simulation of peer review selection process). The results would provide a statisti-cal assessment of the quality of the proposals with a numerical prediction (probability) of the selec-tion outcome. In particular the bibliometric indicators of interdisciplinarity and innovativeness as in-troduced by DBF have proven to be good predictors of the ERC peer review selection criteria.
A solution like this could be helpful in the first step of proposals review, to be used for bibliometric (pre)screening of proposal. This could be useful for reducing workload of the selection panels by identification of (low) quality proposals that are (not) worth bringing to their attention, or may need some kind of special treatment. For example, a bibliometric model can reveal genuinely interdiscipli-nary or very novel proposals and ERC could consider if this information can be in any way useful for special treatment of such proposals.
Monitoring the peer review evaluation process: Alternatively, a bibliometric model approach could again be useful at the very end of the evaluation process, before final decision of the panel is taken, to reflect on the selection from another - "empirical" point of view - provided by bibliometric indica-tors.
Designing ERC panels and distribution of proposals: Bibliometric techniques of science mapping provide an insight into state of the art of scientific landscape, revealing relationships between scien-tific disciplines and corresponding research topics/questions/methods addressed in each of them.
The DBF indicator interdisciplinarity was used at the final workshop as a tool for looking at the panels and the interdisciplinary nature of the proposals selected. The concept behind the indicators can be used by ERC for thinking about specifying the concept of frontier research and what it means in prac-tice.
Confidence in indictors
The peer review process could benefit from all these approaches. However, before any step in this direction is even considered, bibliometric indicators and decision models based on them would need to be tested and proven to be 100% confident (sensitive and robust!). The first problem in achieving this was said to be cross-domain disparities in publication culture and patterns; in particular the So-cial Sciences & Humanities (SSH) domain would be difficult to fit into a general bibliometric model.
viii
There was also a worry that if bibliometric indicators became a part of the evaluation process, this would open a window for manipulation which could have a negative effect. Researchers will try to fit their proposals with the bibliometric model to improve their chance of being selected, rather than being creative and going beyond the expectations and frontiers of knowledge.
Recommendations
The DBF project came to the following conclusions as to improving and implementing the DBF re-sults.
Improving the conceptualisation of the indicators
The DBF project entered new territory from a bibliometric point of view with the definition of the indi-cators. The indicators were developed to specifically assess frontier research and not just to work with standard bibliometric indicators. Trying to define frontier research in terms of bibliometric data was not an easy task and it certainly involved taking certain limitations into account and working with what can be measured. The conceptualisation of frontier research in the form of indicators should be revisited to improve the basis for calculating the indicators.
Understanding the indicators – using panels
One way in which ERC could understand what is going on between ERC selection of proposals and discrepancy with the DBF indicators is to have a panel look at the content of the proposals and see if they can see why the DBF indicators have ranked a proposal highly or not. It would be very interest-ing to see whether a panel would view a project in a different light having seen the DBF rankings.
Understanding the indicators – interdisciplinary research to join concepts to measurements
One of the largest open questions of the DBF project is: are these indicators the best way of measur-ing frontier research and perhaps more importantly, whether the indicators are measuring what they are supposed to be measuring. One way of taking the development of such conceptual indicators further is to bring together researchers from different areas to work together on improving the indica-tors.
Improving the data collection
The preparation of both data sets (ERC and other data sources) was very time consuming. Some of these problems could be overcome in the future. One of the ways in which the indicators could be improved would be through having better data to start with either through changing the way in which data from the PIs is collected or through developing tools to make the extraction of data more effi-cient.
Using the model in different ways
There are several ways in which the model could be improved. The model would also benefit from better data and it would also benefit from having a larger data set than was available for several of the indicators. A comparison could then be made across different panels and different years. How-ever, the issue of additional variables was one that was discussed.
ix
The implementation of bibliometric and scientometric indicators in ERC
One very important next step for ERC is to test the indicators with panels at different stages of the process.
One option is to put in place bibliometric indicators of frontier research to assess the quality of proposal and model/predict its selection outcome by statistical mechanics (statistical simulation of peer review selection process);
Alternatively, a bibliometric model approach could again be useful at the very end of the evalua-tion process, before final decision of the panel is taken, to reflect on the selection from another - "empirical" point of view - provided by bibliometric indicators.
Watching out for the problems
However, before bibliometric indicators could be implemented by ERC several problems would have to be solved. The first problem in achieving is the cross-domain disparities in publication culture and patterns. In particular the SSH domain would be difficult to fit into a general bibliometric model. A second problem is the concern that if bibliometric indicators became a part of the evaluation process, this would open a window for manipulation which could have a negative effect.
Measuring for decision making
The main issue here and this is perhaps one of the main conclusions that would need further re-search, is about how you interpret the things that are being measured. Just because things can be measured does not been that they should form the basis of decision making. More work need to be done on translating the conclusions of bibliometric indicators for use in policy making. This project and especially the final workshop revealed that this is perhaps still too little understood. This would again probably need an interdisciplinary focus to bring together people who understand the larger picture with those who measure the details.

Table of Contents
Executive Summary i
Introduction 1
The DBF context 3
1.1 European Research Council – funding frontier research 3
1.2 The ERC peer review process 4
1.3 Assessing the peer review process 5
The DBF approach 7
Phase 1 – The development of indicators 8
1.4 Conceptual background 8
1.5 The indicators – an overview 9
1.6 The data used 10
Phase 1 - Individual indicators 12
1.7 Innovativeness 12
1.8 Timeliness 27
1.9 Risk 32
1.10 Pasteuresqueness 43
Phase 1 - Reviewing the indicators 62
1.12 Interpreting the results 62
1.13 The process – improving the indicators 63
1.14 Collection the data - problems 66
Phase 2 - Effects of frontier research on selection outcome of ERC proposals 67
Phase 2 – The statistical relationship between frontier research and selection outcome of ERC proposals 69
1.15 Methodological approach – using econometric models 69
1.16 Modelling results 72
1.17 Predictive ability and validity 75
1.18 Reviewing the results of the model 79
DBF – the main conclusions 81
Interpreting and validating the results 84
1.19 The final workshop 84
Recommendations 89
References 93
Annex 1 – Conferences attended 87
Annex 2 - Papers submitted for journal publication 95
Annex 3 – Indicator values 96
Annex 4 - Maps of panels with highlighted corresponding panel keywords 149
Annex 5 – List of panel keywords 168

List of Tables
Table 1: Relation between ERC descriptions of frontier research, key attributes indicators and the selected approach to operationalise the extraction of attributes 8
Table 2: Two examples illustrating how to evaluate the association rule A B in both cases, classical (a) and fuzzy (b) association rules 17
Table 3: Proposals from ERC panel LS3 ranked by decreasing value of innovativeness 24
Table 4: The 37 proposals from ERC panel LS3 ranked by increasing value of timeliness* 30
Table 5: Formal scheme of the considered reference sets 36
Table 6: Test case No 1 – no normal distribution and no linearity 37
Table 7: Test case No 2 38
Table 8: Test case No 3 and test case No 4 38
Table 9: The 31 proposals from ERC panel PE7 ranked by increasing value of risk* 40
Table 10: The 37 proposals from ERC panel LS3 ranked by decreasing value* 48
Table 11: Values for the Interdisciplinarity indicator 1 (CPI); proposals assigned to the ERC Panel PE1, ranked by descending indicator value 57
Table 12: Values for the Interdisciplinarity indicator 2 (high values mean lower interdisciplinarity), proposals assigned to the ERC Panel PE1 59
Table 13: Innovativeness – review and outlook 63
Table 14: Timeliness – review and outlook 64
Table 15: Risk – review and outlook 64
Table 16: Pasteuresqueness: source of publications – review and outlook 65
Table 17: Pasteuresqueness: patents – review and outlook 65
Table 18: Interdisciplinarity – review and outlook 66
Table 19: Empirical basis for the model 72
Table 20: Selected descriptive statistics of frontier research model variables 72
Table 21: Frontier research variables only model 73
Table 22: Full Model 74
Table 23: Estimation results for 684 observations 75
Table 24: Cross-validation with two samples taken from the original sample 76
Table 25: Selected model diagnostic statistics 77
List of Figures
Figure 1: Illustration of A B 16
Figure 2: Illustration of the two types of cluster relationships between the two periods: direct relationships appear in red and purple lines indicate indirect relationships 18
Figure 3: Methodological schema of the calculation of the Innovativeness indicator 24
Figure 4: Methodological schema of the calculation of the Timeliness indicator 28
Figure 5: Methodological schema of the calculation of the Risk indicator 34
Figure 6: Pasteur’s Quadrant 44
Figure 8: Methodology schema of the calculation of the Pasteuresqueness indicator 46
Figure 9: Methodological scheme of the calculation of the Interdisciplinarity indicator 52
Figure 10: Map of ERC panel keywords (PK) by their co-occurrence in proposals (Software: BibTechMon
TM – AIT) 54
Figure 11: Proposals in Map of panel keywords. white dots: panel keywords same as in Figure 10; green dots: not successful proposals; yellow dots: successful proposals; Software: BibTechMon
TM – AIT 55

01
Introduction
This report is the final report of the project “Development and Verification of a Bibliometric model for the Identification of Frontier Research” (DBF).
The DBF project is a Coordinated Support Action (CSA) that was carried out from 2009-09-01 to 2013-02-28. It was one of two CSAs that were financed by the European Research Council (ERC) in 2009 (two other having been financed in 2008) as part of a process of building up a com-prehensive portfolio of projects and studies to support the on-going monitoring and evaluation work as well as to the future strategy and policy development. At this point in time ERC had not been in existence for very long and as its approach was new on the European level, it was keen to monitor its own progress. Together, these four projects should provide insights into different aspects of the ERC work. The DBF project focused on one aspect of the call for tenders that requested projects that helped better understand the peer review process.
The DBF proposal was a direct response to the call ERC-2009-SUPPORT from July 2008. One part of this call stated that:
The ERC peer review system is at the very heart of the ERC's operations and a crucial element in realising its scientific strategy. Analysis is needed to monitor the effective-ness and efficiency of the peer review process (including its implementation) and to understand the particular dynamics and considerations at play in the ERC Monitoring process of selecting successful applicants, taking account of the interplay between scientific and administrative aspects of the process.
Based on a long-standing cooperation between the project partners on the development and the implementation of bibliometric and scientometric indicators, they submitted a proposal to use their expertise and apply it to assessing the peer review process of ERC.
The main aim of the project is to test new methods for monitoring the effectiveness of peer-review processes by taking a scientometric perspective of research proposals beyond publication and cita-tion statistics. During the project a scientometric-statistical model was developed for inferring attrib-utes of ‘frontier research’ in peer-reviewed research proposals submitted to the ERC.
The project was carried out in three distinct phases:
Phase 1: encompassed the conceptualisation and the definition of indicators to capture attributes of frontier research. The aim of the first phase is to quantify individual aspects of frontier re-search using text-analytic methods and the tools of citation scientometrics.
Phase 2: based on the combination of indicators, the second phase models the decision probability of a proposal to be accepted and compares outcomes between the model and peer-review decision, with the goal of determining the influence of frontier research on the peer-review process. The approach uses a data sample of about 10% of all proposals submitted to the ERC call (StG2009) for Starting Grants in the year 2009.
Phase 3: engaged with stakeholders and identified aspects of the bibliometric approach to support the selection of (high-quality, risk-affine and reward-delivering) frontier research.
This report provides an overview and a synthesis of the work carried out within the project. The struc-ture of the report follows the same structure as the project and describes the work completed and the results of each phase individually.

02 Synthesis Report
The first section of the report covers phase 1 of the project and describes the development of the indicators from their conceptualisation to their implementation. This section begins with the basis for the conceptual framework. However, the main part of this section contains a description of the five individual indicators, how they were designed and how they were implemented. It concludes with a summary and an analysis of the indicators.
The second section of the report covers the second phase of the project and focuses on the econo-metric model used to assess to what extent the peer review panels have taken frontier research (as defined by the indicators in the first phase) into account.
The third section of the report looks at the implications of the results of the project and how they can be used by ERC.
03
The DBF context
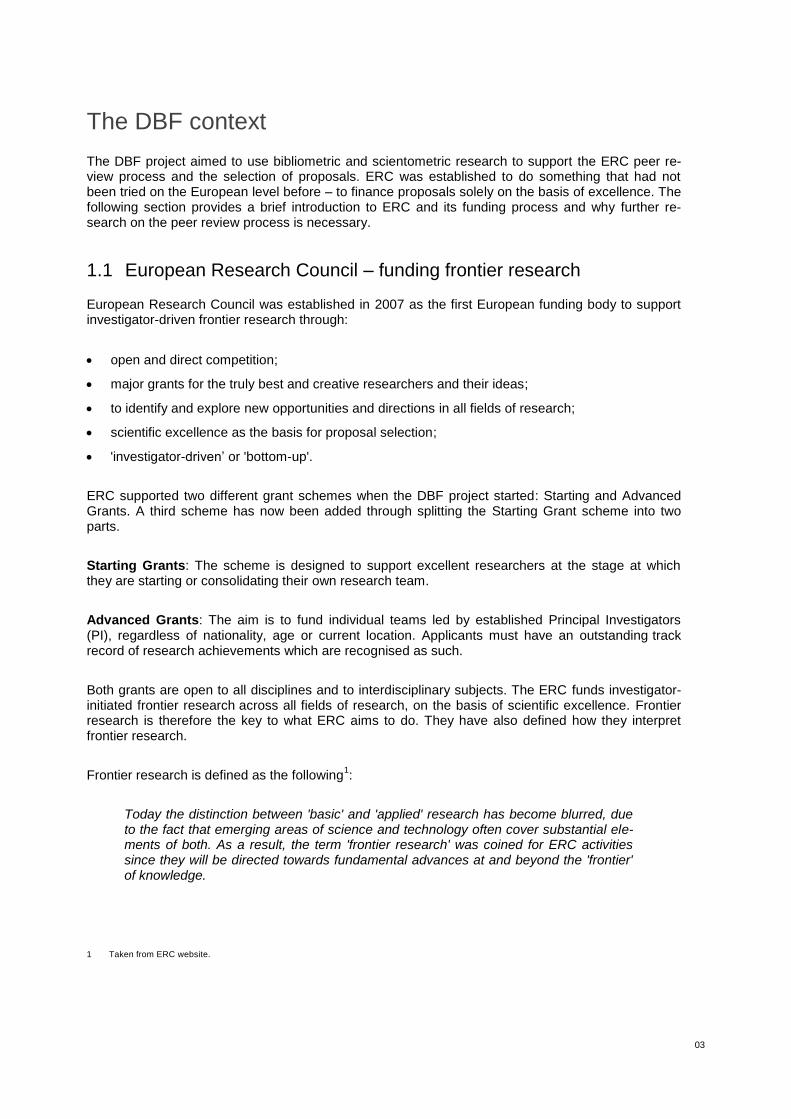
The DBF project aimed to use bibliometric and scientometric research to support the ERC peer re-view process and the selection of proposals. ERC was established to do something that had not been tried on the European level before – to finance proposals solely on the basis of excellence. The following section provides a brief introduction to ERC and its funding process and why further re-search on the peer review process is necessary.
1.1 European Research Council – funding frontier research
European Research Council was established in 2007 as the first European funding body to support investigator-driven frontier research through:
open and direct competition;
major grants for the truly best and creative researchers and their ideas;
to identify and explore new opportunities and directions in all fields of research;
scientific excellence as the basis for proposal selection;
'investigator-driven’ or 'bottom-up'.
ERC supported two different grant schemes when the DBF project started: Starting and Advanced Grants. A third scheme has now been added through splitting the Starting Grant scheme into two parts.
Starting Grants: The scheme is designed to support excellent researchers at the stage at which they are starting or consolidating their own research team.
Advanced Grants: The aim is to fund individual teams led by established Principal Investigators (PI), regardless of nationality, age or current location. Applicants must have an outstanding track record of research achievements which are recognised as such.
Both grants are open to all disciplines and to interdisciplinary subjects. The ERC funds investigator-initiated frontier research across all fields of research, on the basis of scientific excellence. Frontier research is therefore the key to what ERC aims to do. They have also defined how they interpret frontier research.
Frontier research is defined as the following1:
Today the distinction between 'basic' and 'applied' research has become blurred, due to the fact that emerging areas of science and technology often cover substantial ele-ments of both. As a result, the term 'frontier research' was coined for ERC activities since they will be directed towards fundamental advances at and beyond the 'frontier' of knowledge.
1 Taken from ERC website.

04 Synthesis Report
The term 'frontier research' reflects a new understanding of basic research. On one hand it denotes that basic research in science and technology is of critical importance to economic and social wel-fare, and on the other that research at and beyond the frontiers of understanding is an intrinsically risky venture, progressing on new and most exiting research areas and is characterised by an ab-sence of disciplinary boundaries.
In 2005, a High-Level Expert Group published a report (Frontier Research: The European Challenge - High-Level Expert Group Report) defining frontier research. In the report frontier research is used to denote research that reaches beyond horizons of existing knowledge by being intrinsically risky en-deavours without regard for established disciplinary boundaries.
According to the report, frontier research has the following characteristics:
Frontier research stands at the forefront of creating new knowledge and developing new under-standing. Those involved are responsible for fundamental discoveries and advances in theoreti-cal and empirical understanding, and even achieving the occasional revolutionary breakthrough that completely changes our knowledge of the world.
Frontier research is an intrinsically risky endeavour. In the new and most exciting research are-as, the approach or trajectory that may prove most fruitful for developing the field is often not clear. Researchers must be bold and take risks. Indeed, only researchers are generally in a posi-tion to identify the opportunities of greatest promise. The task of funding agencies is confined to supporting the best researchers with the most exciting ideas, rather than trying to identify priori-ties.
The traditional distinction between ‘basic’ and ‘applied’ research implies that research can be either one or the other but not both. With frontier research researchers may well be concerned with both new knowledge about the world and with generating potentially useful knowledge at the same time. Therefore, there is a much closer and more intimate connection between the result-ing science and technology, with few of the barriers that arise when basic research and applied research are carried out separately.
Frontier research pursues questions irrespective of established disciplinary boundaries. It may well involve multi-, inter- or trans-disciplinary research that brings together researchers from dif-ferent disciplinary backgrounds, with different theoretical and conceptual approaches, tech-niques, methodologies and instrumentation, perhaps even different goals and motivations.
1.2 The ERC peer review process
The ERC selects its proposals through peer review panels. The ERC panel structure consists of 25 panels. The panels of each grant are grouped into three disciplinary domains that cover the entire spectrum of science, engineering and scholarship:
Social sciences and Humanities (SH)
Life sciences (LS)
Physical and Engineering Sciences (PE)
Research proposals of a multi and inter disciplinary nature are strongly encouraged throughout the ERC's schemes. Proposals of this type are evaluated by the ERC's regular panels with the appropri-ate external expertise.
05
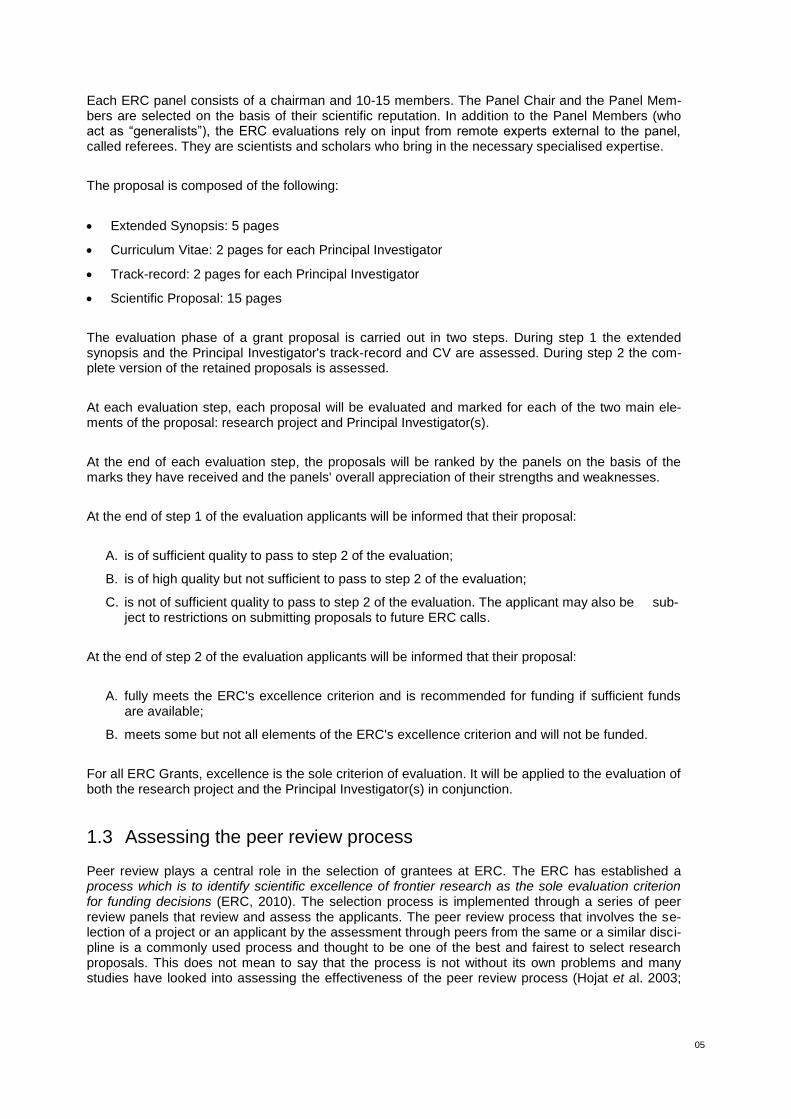
Each ERC panel consists of a chairman and 10-15 members. The Panel Chair and the Panel Mem-bers are selected on the basis of their scientific reputation. In addition to the Panel Members (who act as “generalists”), the ERC evaluations rely on input from remote experts external to the panel, called referees. They are scientists and scholars who bring in the necessary specialised expertise.
The proposal is composed of the following:
Extended Synopsis: 5 pages
Curriculum Vitae: 2 pages for each Principal Investigator
Track-record: 2 pages for each Principal Investigator
Scientific Proposal: 15 pages
The evaluation phase of a grant proposal is carried out in two steps. During step 1 the extended synopsis and the Principal Investigator's track-record and CV are assessed. During step 2 the com-plete version of the retained proposals is assessed.
At each evaluation step, each proposal will be evaluated and marked for each of the two main ele-ments of the proposal: research project and Principal Investigator(s).
At the end of each evaluation step, the proposals will be ranked by the panels on the basis of the marks they have received and the panels' overall appreciation of their strengths and weaknesses.
At the end of step 1 of the evaluation applicants will be informed that their proposal:
A. is of sufficient quality to pass to step 2 of the evaluation;
B. is of high quality but not sufficient to pass to step 2 of the evaluation;
C. is not of sufficient quality to pass to step 2 of the evaluation. The applicant may also be sub-ject to restrictions on submitting proposals to future ERC calls.
At the end of step 2 of the evaluation applicants will be informed that their proposal:
A. fully meets the ERC's excellence criterion and is recommended for funding if sufficient funds are available;
B. meets some but not all elements of the ERC's excellence criterion and will not be funded.
For all ERC Grants, excellence is the sole criterion of evaluation. It will be applied to the evaluation of both the research project and the Principal Investigator(s) in conjunction.
1.3 Assessing the peer review process
Peer review plays a central role in the selection of grantees at ERC. The ERC has established a process which is to identify scientific excellence of frontier research as the sole evaluation criterion for funding decisions (ERC, 2010). The selection process is implemented through a series of peer review panels that review and assess the applicants. The peer review process that involves the se-lection of a project or an applicant by the assessment through peers from the same or a similar disci-pline is a commonly used process and thought to be one of the best and fairest to select research proposals. This does not mean to say that the process is not without its own problems and many studies have looked into assessing the effectiveness of the peer review process (Hojat et al. 2003;

06 Synthesis Report
Bornmann & Daniel 2008, Marsh et al. 2008). Issues such as conservatism in peer review have also been addressed by various studies (Luukkonen 2012)
One suggestion of the way in which the peer review process could be improved is through using quantitative methods. The systematic use of quantitative methods to either support or evaluate the decision-making is witnessing increasing attention to cope with science output and efficiency (e.g., van den Besselaar & Leydesdorff 2009; van Noorden 2010). The advantages of bibliometric and scientometric-based methods are manifest in their objectivity, reliability, efficiency, and automation, while disadvantages are in limits of interpretation, applicability, confounding factors, and predictive validity (Adam 2002; van Noorden 2010).
While a number of studies have focused on peer-review in project funding decisions (see, e.g., Bornmann, Leydesdorff & van den Besselaar 2009; Juznic et al. 2010), this project’s primary interest is the extent to which research proposal comply with attributes of frontier research and the influence of these attributes on the selection of awarded grants. To this end, it looks at the scientometric eval-uation of proposals.

07
The DBF approach
The DBF project took the High-Level Groups definition of frontier research as its starting point for developing bibliometric and scientometric indicators. This section describes this process and pre-sents each individual indicator in detail.
DBF’s aim is three-fold:
to design, test and implement an ex-post bibliometric-based approach based on significant as-pects of frontier research identified and measured in grant applications evaluated by the ERC peer-review process;
to compare and draw lessons learned from the overlap resp. deviation between the human ex-pert-based peer-review process and the bibliometric evaluation;
to engage with stakeholders of the ERC peer-review process and identify outcomes of the bibli-ometric approach to support the ex-ante selection of proposals of high-quality, risk-affinity and reward-delivering frontier-research.
The DBF project treats attributes of frontier research (with relevance to the strategy of the ERC) with quantitative means in a bibliometric approach combining scientometric, text-mining methods, and decision-choice model, in areas with little or no lines of evidence as to how the bibliometric-based indicators perform in practice.
To this end, the DBF project consists of the following steps:
framing of attributes of frontier research and conceptualising indicators for capturing attributes from codified textual information of submitted proposals;
developing and testing of bibliometric corresponding to attributes of frontier research;
building a decision-making model to simulate the empirical selection probability of proposals (successful vs. non-successful);
ex-post analysis of the influence of indicators (attributes) resp. selection probability on the deci-sion of ERC review panels;
presentations of outcomes and discourse with stakeholders of the ERC review process to reflect the model-based approach in terms of own experiences and insight;
making recommendations for the usefulness and feasibility of a bibliometric-based approach to support the ERC-review process in ex-post and ex-ante analysis of proposals.

08 Synthesis Report
Phase 1 – The development of indicators This section focuses on the development of the indicators. It describes the process that began with a definition of frontier research and ended with the calculation of five indicators for frontier research. The section begins with an overview of the five indicators and subsequently presents the indicators individually.
1.4 Conceptual background
The first phase of the project focused on the need to take the four parts of the definition of frontier research from the High-Level group report and to see how these could be translated into bibliometric and scientometric indicators. Table 1 below provides an overview of the definitions in the left-hand column and the approach that was taken to translate them into indicators. First of all the definition was translated into a key-attribute, then into an indicator and the column on the right hand side shows the bibliometric or scientometric approach that was taken in order to quantify the indicator.
Table 1: Relation between ERC descriptions of frontier research, key attributes indicators and the selected approach to operationalise the extraction of attributes
Frontier research Key attribute Indicator Approach
“(…) stands at the forefront of creating new knowledge and de-veloping new understanding. Those involved are responsible for fundamental discoveries and ad-vances in theoretical and empirical understanding (...)”
Novelty of the proposed re-search
TIMELINESS
INNOVATIVENESS
Backward cited references;
Diachronic clus-ter analysis based on textual information
“(…) is an intrinsically risky en-deavour. In the new and most exciting research areas (...) Re-searchers must be bold and take risks. The task of funding agencies is confined to supporting the best researchers with the most exciting ideas, rather than trying to identify priorities.”
Risk of the inves-tigator through establishing sci-entific independ-ence and/or tak-ing on a new research field
RISK Originality of the proposed re-search based on reference infor-mation of the proposal and principal investi-gator
“(…) Therefore, there is a much closer and more intimate connec-tion between the resulting science and technology, with few of the barriers that arise when basic research and applied research are carried out separately.”
Applicability (en-trepreneurial principal investi-gator; proposed research)
PASTEURESQUENESS Applicability of the expected results
“(…) pursues questions irrespec-tive of established disciplinary boundaries. It may well involve multi-, inter- or trans-disciplinary research that brings together re-searchers from different discipli-nary backgrounds (...)”
Science of inter-disciplinary na-ture
INTERDISCIPLINARITY Diversity reflect-ed of the pro-posal on related panels other than the "home" panel based on textual information
Source: definition: EC (2005); indicator: own data.

09
The basis used for each indicator was slightly different. Some of the indicators are based on previous research such as interdisciplinarity and innovativeness. Others indicators were tested for the first time within this project although based on bibliometric and scientometric literature. One of the main considerations in this phase was to match potential relevant scientometric and bibliometric data (e.g. research field, publications, citations, patents) and content data (e.g. text-strings, keywords) con-tained in the grant applications to the definitions.
1.5 The indicators – an overview
The five indicators are all based on different assumptions and were calculated using different tech-niques.
Timeliness and risk – citation analysis
The indicators timeliness and risk are derived from citation analysis. Timeliness is based on the sim-ple assumption that the time (publication year) distribution of cited proposal references is a proxy for the novelty of research. The more recent references are (e.g. on average), the more likely the work is at the cutting edge of science. Timeliness computes for every reference of a proposal the relative difference in years between its publication date and the year of the application. References of the proposal are considered appropriate because not only do they relate directly to the project but consti-tute the knowledge base on which the proposal is built.
The indicator risk is used as a proxy for the “individual risk” of the principal investigator in carrying out the proposed research. In addition to references of a proposal (defining set I) it makes use of external reference information (with respect to the proposal). It compiles references of research pa-pers (set II) previously published by the applicant. Comparing the applicant’s references in set I vs. set II, the overlap between sets is used to compare the proposed research direction with respect to past research. The underlying assumption is that the lower the overlap between sets I and II is, the more it is indicative of a change from previous pursued research (and hence the more independent of previous research directions resp. risk-affine). Computationally, the indicator is defined by the correlation coefficient.
Innovativeness and interdisciplinarity – lexical analysis
The indicators innovativeness and interdisciplinarity are derived from lexical analysis. The indicator innovativeness is based on lexical analysis and used as a proxy to infer the “novelty” of a proposal. The core concept has two main steps. 1) The construction of a “publication landscape” via a cluster map derived from scientific and technological information (including research publications, excluding proposals). The landscape is created at two time steps to characterise its level of change over time and identify resp. rank clusters with dynamic growth. 2) Each proposal is ‘embedded’ in the land-scape to compute an innovativeness value depending on both distance and rank of nearest clusters. The underlying assumption is that the closer a proposal is to clusters of dynamic growth, the more novel it is.
Computationally, innovativeness is based on indexing keywords. To this end, the bibliographic data-base PASCAL is used, which provides a broad multidisciplinary coverage of about 20 million records. Each PASCAL record is indexed, either manually by scientific experts or automatically based on content analysis, with both keywords and thematic categories. Raw data are extracted from PASCAL (for international scientific and technological literature) by employing a query derived from the de-scription of ERC main research fields (15 in 2007, since then expanded to 10 fields in PE and 9 fields in LS).
10 Synthesis Report
Subsequently diachronic cluster analysis is used to study the evolution of the publication landscape across time windows. The most recent time window is the year in which proposals were submitted. Structural alterations of clusters between two time windows are identified and analysed by human scientific experts. Techniques of association rule extraction are applied to facilitate the cluster analy-sis, using fuzzy association rules. There are two objectives. 1) Determining which clusters carry nov-el topics and to rank clusters by their ‘novelty index’ (a measure of the relationships between clusters from the two time windows build on association rules). 2) Evaluating the novelty of proposals by their similarity with respect to clusters with a high rank.
The indicator interdisciplinarity is used as a proxy to infer self-consistently the presence and propor-tions of characteristic terminology associated with individual ERC main research fields, thereby re-vealing the intra or inter-field character of a proposal. It is built upon the previously successfully test-ed approach (Schiebel et al. 2010) that the frequency of occurrence and distribution of research field specific keywords of scientific documents can classify and characterise research fields. While the core of the approach has been retained, the computation has been adopted and fine-tuned to the grant scheme under study.
Pasteuresqueness
The term pasteuresqueness is coined in reference to the definition of Pasteur’s Quadrant (Stokes 1997), which describes scientific research or methods that seek both fundamental understanding and social benefit. Guided by the Pasteur Quadrant, the indicator pasteuresqueness serves as a proxy for the applicability of expected results of each proposal. It is based on patent counts and journal classification (ratio of applied vs. theoretical) of applicant publications. Input data are obtained from proposals and external information sources (e.g. bibliographic databases).
1.6 The data used
The indicators developed in section 4 relied on the availability of bibliometric and scientometric data. Two types of data were used in the DBF project: data contained in the grant application submitted to the ERC and data from external data bases. Depending on the individual indicator different types of data were used. This section gives an overview of the data that was used within the project. The section on the individual indicators gives a more detailed overview of the data used to calculate each individual indicator.
ERC data
Two different types of ERC data were used; references and citations on the one hand, and textual data on the other hand.
The ERC reference and citation data came from two sources:
The proposal references - these were the references provided by the PI in the proposal
The PI’s own list of references – provided in the CV
The textual data came from two sources:
The abstracts of the proposal
The summaries of the proposals submitted as part of the CVs
11
Initially the project team would have liked to use the full proposal texts. However, this was not possi-ble due to data protection laws. The project team attempted to use a programme to try to extract a string of words from the proposal texts that would be randomised. However, extracting the words from the PDF proposal texts proved to be too difficult and the results were not useable.
At the beginning of the project, the project team foresaw working with the following data sets:
Two different scientific domains: The DBF project focuses on the scientific domains “Physics & Engineering” (PE) and “Life Sciences” (LS). There are ten (nine) main research fields in PE (LS) and about 170 (100) subfields. The third domain “Social Sciences & Humanities (SSH)” is excluded as it is expected to differ in terms of publishing, citation behaviour, and other features from those ob-served in PE and LS (e.g., national/regional orientation, less publications in form of articles, different theoretical ‘development rate’, number of authors, non-scholarly publications), which make it less assessable for approaches developed for natural and the life sciences (Nederhof 2006; Juznic et al. 2010).
Two different grants: The initial idea was to work with both Starting Grants and Advanced Grants from two separate years (2007 and 2009).
External data sources
Depending on the scope of the indicator, the project anticipated comparing the data from the PI or the proposal with data extracted from other sources. These sources included extracting data from the following external sources:
The citations of the proposal references through identifying the PI in Thomson Reuters Web of Science (WoS).
Data from the PASCAL data base, a scientific bibliographic database, which is maintained by INIST (CNRS). PASCAL covers the core scientific literature in science, technology and medicine with special emphasis on European literature. PASCAL maintains a database of more than 17 million records, 90% of these are author abstracts.

12 Synthesis Report
Phase 1 - Individual indicators
Having decided on the concept and the method, the next step was to calculate the individual indica-tors. This section of the report focuses on each individual indicator in detail and provides a descrip-tion of the concept behind the indicator, the process of implementation, the results and perspectives concerning the future development of the indicator.
The indicators described are:
Innovativeness
Timeliness
Risk
Pasteuresqueness
Interdisciplinarity
1.7 Innovativeness
Innovativeness was employed to infer the “innovative degree” of a project proposal. With timeliness, this indicator is meant to represent “novelty”, one of the four key attributes we recognised from the definition of frontier research as given by the High Level Expert Group (HLEG).
1.7.1 Description of indicator
From frontier research to indicator
From the HLEG report (EC 2005), one of the elements of the definition of frontier research is:
Frontier research stands at the forefront of creating new knowledge and developing new understanding. Those involved are responsible for fundamental discoveries and advances in theoretical and empirical understanding, and even achieving the occa-sional revolutionary breakthrough that completely changes our knowledge of the world.
Because the notion of “revolutionary breakthrough” is practically inaccessible though bibliometric methods, the work concentrated on an indicator related to the up-to-dateness of the research activity to determine whether a project proposal is in a field that can be considered as dealing with an “emerging research topic”.
To identify these “emerging research topics” more easily, we decided to work panel by panel be-cause our approach is based on terminology, so to avoid ambiguities and other language-related impediments, the more homogeneously defined the domain we study, the better. For each panel, we considered the project proposals assigned to it, usually by the Principal Investigator (PI), as target panel for evaluation.
To build that indicator, we relied on the following hypotheses:
An ERC panel is considered a set of disciplinary fields defined by the panel descriptors delimitat-ing its perimeter, and is represented by a bibliographical database query (in the ad hoc query
13
language) that extracts from the said database a huge set of bibliographical records, hereafter referred to as “corpus”.
These bibliographical records are represented by keyword vectors that produce, with clustering methods, a map of clusters grouping the similar bibliographical records.
Metaphorically, that cluster map is considered as a representation of the scientific publication landscape corresponding to the studied ERC panel and the evolution over time of that represen-tation is produced by means of a diachronic analysis approach.
With that analysis, a measure of the evolution level of each cluster is performed which leads to the identification of clusters presenting a significant development and from that, the identification of regions of positive dynamic change in the final cluster map.
Each project proposal is positioned on the final cluster map, so the closer that proposal is to the previously recognised regions of positive dynamic change, the more innovative it is.
If we accept these working hypotheses, we can calculate the indicator.
1.7.2 Process of implementation
To build this indicator, we applied a diachronic analysis (Roche et al. 2011) on each research back-ground determined by the scientific perimeter of ERC panels. First of all, for each research back-ground we extracted two corpora corresponding to two different time periods. In a second step, text mining techniques were carried out to produce the keywords that represent the content of each bibli-ographic record of both corpora. With this indexing, we applied to each corpus a clustering technique in order to produce a set of clusters for each time period. Finally, we analysed the evolution of the cluster set contents between the successive time periods by examining their respective related ter-minology. For each research background we measured the strength of the evolution of each cluster. In parallel, the same text mining techniques were applied to each project proposal allocated to the corresponding ERC panel and then, their similarity to the clusters of the second period is evaluated. The result gives the value of innovativeness of the project proposal. In this section, we describe the input data, the applied techniques and their implementation.
Input data
The data necessary to calculate the Innovativeness indicator came from two sources: ERC and bibli-ographical databases.
From ERC, we received the description of the peer review evaluation panels and some elements of the project proposals from which we extracted the proposal title and abstract. First, we received the data about successful proposals and much later, those about non-successful proposals after agree-ment from their authors.
In this exploratory study, we used only one database: PASCAL2, a multidisciplinary bibliographic
database providing broad multidisciplinary coverage and containing nowadays about 20 million bibli-ographic records resulting from the analysis of the scientific and technical international literature pub-lished predominantly in journals and conference proceedings. Moreover, each PASCAL record is indexed, either manually by scientific experts or automatically based on a content analysis, by both keywords and thematic categories from a classification scheme.
2 PASCAL is a multidisciplinary bibliographic database produced by the INIST – CNRS.

14 Synthesis Report
Applied techniques
Text mining: the automatic indexing platform at INIST-CNRS
One of the major steps in text mining is collecting documents and representing the meaning they convey with a set of terms extracted from the text. It is possible to obtain a homogeneous and con-sistent representation of a corpus by using a recognition approach to extract terms such as the ap-proach implemented in the platform developed at INIST-CNRS and called ILC (Daille et al. 1996; Polanco et al. 1995; Royauté 1994; Royauté 1999). This platform is an open environment for con-trolled indexing of French or English texts. It integrates language processing tools and linguistic re-sources for recognising terms and their variants in a corpus, and uses the XML standards, which define the pivot communication format between the different modules (tools, resources, indexing). The natural language processing approach in ILC is based on Part-Of-Speech tagging and lemmati-sation, dictionaries of morphologically related forms for the two languages and a local transforma-tional parser, and as such is similar to Jacquemin and Tzoukermann's approach based on word morphology and phrasal syntax (Jacquemin and Tzoukermann 1999).
Terminological processing requires as input Part-Of-Speech tagged and lemmatised terms. ILC ex-ploits TreeTagger for this step (Schmid 1994). Then the parser FASTR, developed by Jacquemin (Jacquemin 1994), transforms words and terms into a formalism closed to PATR-II by which gram-mar rules are composed of a context-free skeleton and logical constraints (feature structures). The corpus is similarly transformed: each word is Part-Of-Speech tagged, lemmatised and transformed into PATR-II. Term extraction identifies no-variant and variant terms. A set of transformational rules (i.e. metarules) enables to identify variants of each term.
These rules describe the transformation conditions of a term into its variant during the indexing pro-cess. The linguistic variants taken into account in ILC are of three types: inflectional, syntactic and morphologic (Jacquemin and Royauté 1994).
Linguistic transformations operate on multi-word terms, i.e. terms containing two or more content words (“Tumour cells”, “Thyroid function test”, “Cell of bone”).
For example, the transformational rule of coordination:
X2 N1 → X2 PUNC (A|N|Np|V) PUNC? C (A|N|Np|V) N1
recognises and extracts in texts the variant “residual, recurrent or metastatic tumours” from the base term “Residual tumour”. This rule establishes an equivalence between, on the one hand, a term composed of two lexical units X2 and N1, belonging respectively to any part of speech (X) and to a nominal category (N), and on the other hand, a transformed textual string of this term corresponding to the following pattern: the word X2, a punctuation (PUNC), the insertion of an adjective (A), or a noun (N), proper name (Np) and verb (V), optionally followed by another punctuation, then a coordi-nation (C) and a further insertion of an adjective, or a noun, proper name, verb before the noun N1.
The natural language processing (NLP) on its whole performed by the platform ILC is automatic, but the result of the produced indexing requires human intervention for validation.
Clustering: the axial K-means clustering tool of INIST-CNRS
Our clustering tool applies a non-hierarchical clustering algorithm, the axial K-means method, coming from the neuronal formalism of Kohonen’s self-organising maps, followed by a principal component analysis (PCA) in order to represent the obtained clusters on a 2-D map (Lelu 1993; Lelu & François
15
1992). This step is realised by employing an in-house software tool, Stanalyst (Polanco et al. 2001), devoted to the scientific and technical information analysis.
The axial K-means is a variant of the well-known K-means clustering algorithm: it derives half-axes, or "axoïds" maximising a global inter-axes inertia criterion, instead of deriving cluster centroïds max-imising the inter-class inertia. One can sort the cluster's describers and documents along one of these half-axes as well as project the other terms and documents onto it. In this way, one can derive a fuzzy interpretation of the resulting axes, though the method is a strict clustering technique. This method is fast and can handle very large amounts of data. It is formally related to neural models with unsupervised winner-take-all learning.
The maps obtained by PCA do not allow a complete representation of the position of the clusters. To improve this particular point we use the RCA (Related Components Analysis). This technique gives the analyst the means of verifying if maps respect the distances between the clusters, and therefore the concentration of some clusters and the isolation of others. Moreover, the RCA facilitates the in-terpretation of the maps by allowing the clusters configuration to be visualised. This method is based on graph theory. It defines the related components which represent the relative closeness between clusters. These related components are not defined according to predefined thresholds, but 10 prox-imity levels are calculated from the distances between clusters. The highest level is defined by the minimum distance between clusters and the lowest by the maximum distance between clusters. At a given level, two clusters are connected if their distance is lower than the maximum threshold of that level. Once the connections are calculated, sets of clusters linked up by a connection path, named "related components", are defined. This operation is repeated for each level. While this method does not have the means to project the individual points (clusters), it clearly shows their closeness and separation in multidimensional space (Polanco et al. 1998).
Association rule extraction (ARE): a new tool developed for the DBF project
The association rules are mainly used in frequent patterns mining. They help in finding interesting associations and relationships between item sets in a given data sets. The Market Basket analysis is a typical example for the frequent patterns mining (Han and Kamber 2001; Hand et al. 2001). The association rules can also help in different data mining tasks such as data classification and cluster-ing.
Let 1 2, ,..., nI I I I be a set of items. An association rule is an implication of the form A B
where A I and B I . Two indexes are then calculated for every potential association rule: its “support” and its “confidence”.
The support is defined as the percentage of items that appear in both A and B item sets:
( ) ( )support A B P A B
This operation has the commutative property:
( ) ( )support A B support B A
The confidence is given by the percentage of items that appear in B under the condition that they appear also in A:
( ) ( | )confidence A B P B A

16 Synthesis Report
This operation has not the commutative property:
( ) ( )confidence A B confidence B A
We can then calculate the confidence of A B by using the support as follows:
( )( )
( )
support A Bconfidence A B
support A
In the context of this work, the items are the keywords (Kw) and the item sets A and B are the clus-ters. We give to a keyword the value 1 if it appears in the item set and 0 if it is absent.
Then, the ( )support A B is the percentage of keywords that appear in A as well as in B and the
( )confidence A B is the percentage of keywords that appear in B under the condition that they
appear also in A. The graphical representation of the ( )support A B is presented in Figure 1.
Figure 1: Illustration of A B
We calculate:
( )( )
( )
Kw A Bsupport A B
card I
( )( )
( )
Kw A Bconfidence A B
Kw A
The association rule A B in this context could be interpreted as how much we could consider
that the class A is included in B. A value of ( ) 1confidence A B means that all the keywords in
A are in B and therefore that A is totally included in B.
In case the appearance of an item in an item set is not evaluated by a binary value, the fuzzy associ-ation rules are then used (Cuxac et al. 2005). In the context of our work, the usually considered value is the obtained weight for each keyword in each item set after the clustering step.
17
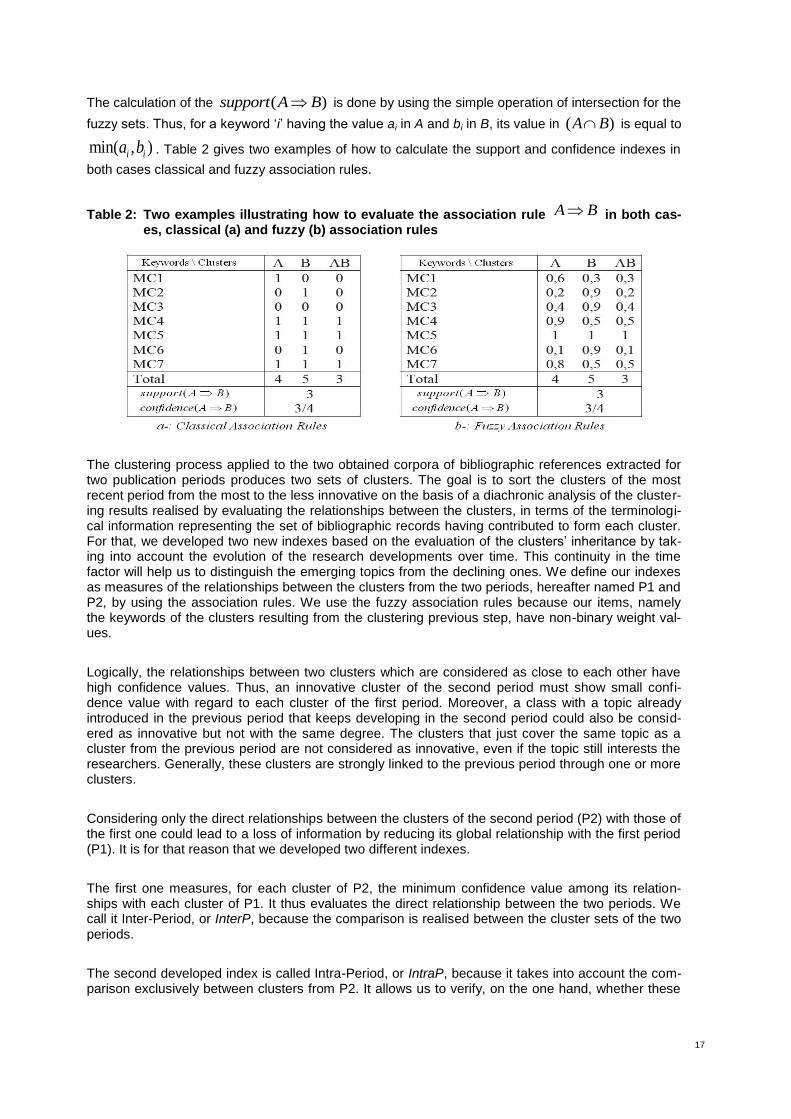
The calculation of the ( )support A B is done by using the simple operation of intersection for the
fuzzy sets. Thus, for a keyword ‘i’ having the value ai in A and bi in B, its value in ( )A B is equal to
min( , )i ia b . Table 2 gives two examples of how to calculate the support and confidence indexes in
both cases classical and fuzzy association rules.
Table 2: Two examples illustrating how to evaluate the association rule A B in both cas-es, classical (a) and fuzzy (b) association rules
The clustering process applied to the two obtained corpora of bibliographic references extracted for two publication periods produces two sets of clusters. The goal is to sort the clusters of the most recent period from the most to the less innovative on the basis of a diachronic analysis of the cluster-ing results realised by evaluating the relationships between the clusters, in terms of the terminologi-cal information representing the set of bibliographic records having contributed to form each cluster. For that, we developed two new indexes based on the evaluation of the clusters’ inheritance by tak-ing into account the evolution of the research developments over time. This continuity in the time factor will help us to distinguish the emerging topics from the declining ones. We define our indexes as measures of the relationships between the clusters from the two periods, hereafter named P1 and P2, by using the association rules. We use the fuzzy association rules because our items, namely the keywords of the clusters resulting from the clustering previous step, have non-binary weight val-ues.
Logically, the relationships between two clusters which are considered as close to each other have high confidence values. Thus, an innovative cluster of the second period must show small confi-dence value with regard to each cluster of the first period. Moreover, a class with a topic already introduced in the previous period that keeps developing in the second period could also be consid-ered as innovative but not with the same degree. The clusters that just cover the same topic as a cluster from the previous period are not considered as innovative, even if the topic still interests the researchers. Generally, these clusters are strongly linked to the previous period through one or more clusters.
Considering only the direct relationships between the clusters of the second period (P2) with those of the first one could lead to a loss of information by reducing its global relationship with the first period (P1). It is for that reason that we developed two different indexes.
The first one measures, for each cluster of P2, the minimum confidence value among its relation-ships with each cluster of P1. It thus evaluates the direct relationship between the two periods. We call it Inter-Period, or InterP, because the comparison is realised between the cluster sets of the two periods.
The second developed index is called Intra-Period, or IntraP, because it takes into account the com-parison exclusively between clusters from P2. It allows us to verify, on the one hand, whether these
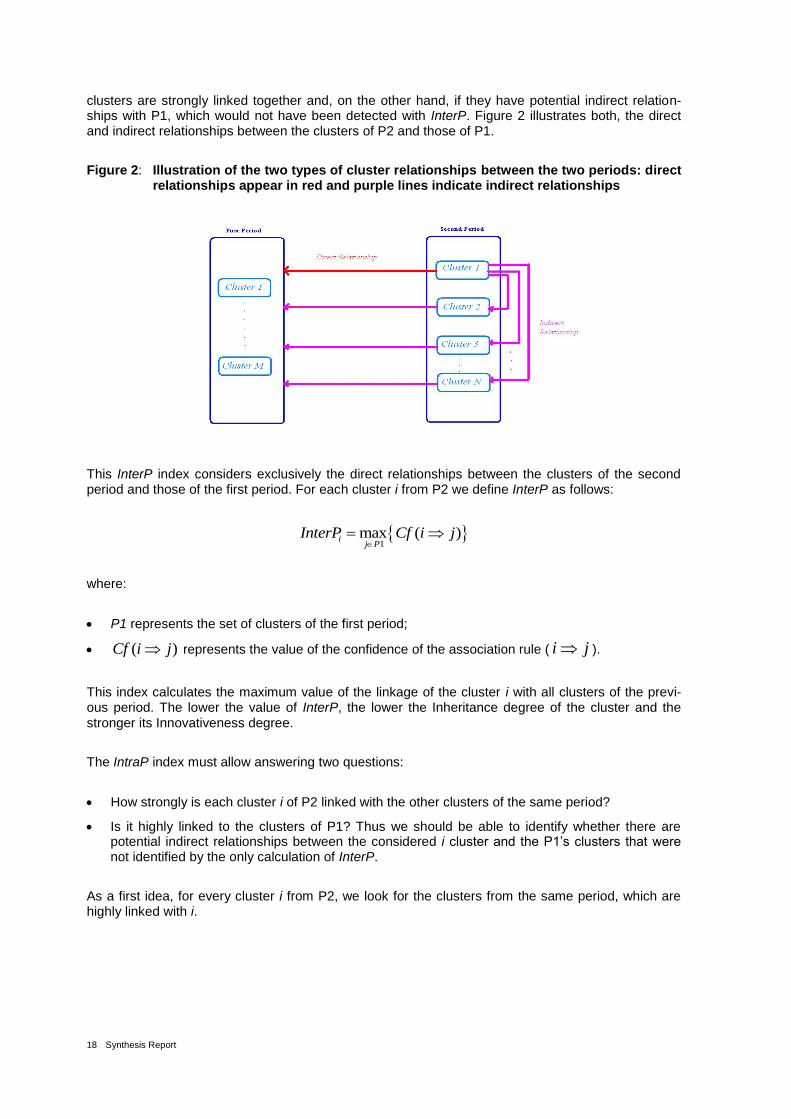
18 Synthesis Report
clusters are strongly linked together and, on the other hand, if they have potential indirect relation-ships with P1, which would not have been detected with InterP. Figure 2 illustrates both, the direct and indirect relationships between the clusters of P2 and those of P1.
Figure 2: Illustration of the two types of cluster relationships between the two periods: direct relationships appear in red and purple lines indicate indirect relationships
This InterP index considers exclusively the direct relationships between the clusters of the second period and those of the first period. For each cluster i from P2 we define InterP as follows:
1
max ( )ij P
InterP Cf i j
where:
P1 represents the set of clusters of the first period;
( )Cf i j represents the value of the confidence of the association rule ( i j ).
This index calculates the maximum value of the linkage of the cluster i with all clusters of the previ-ous period. The lower the value of InterP, the lower the Inheritance degree of the cluster and the stronger its Innovativeness degree.
The IntraP index must allow answering two questions:
How strongly is each cluster i of P2 linked with the other clusters of the same period?
Is it highly linked to the clusters of P1? Thus we should be able to identify whether there are potential indirect relationships between the considered i cluster and the P1’s clusters that were not identified by the only calculation of InterP.
As a first idea, for every cluster i from P2, we look for the clusters from the same period, which are highly linked with i.
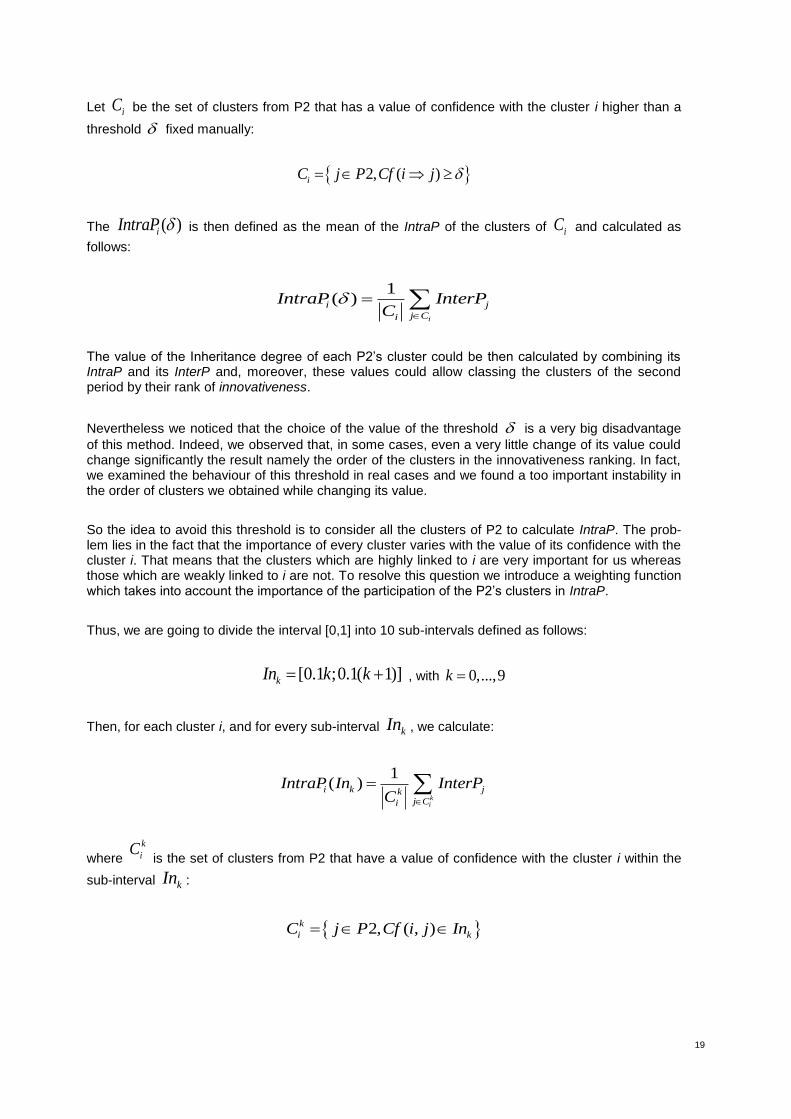
19
Let iC be the set of clusters from P2 that has a value of confidence with the cluster i higher than a
threshold fixed manually:
2, ( ) iC j P Cf i j
The ( )iIntraP is then defined as the mean of the IntraP of the clusters of iC and calculated as
follows:
1( )
i
i j
j Ci
IntraP InterPC
The value of the Inheritance degree of each P2’s cluster could be then calculated by combining its IntraP and its InterP and, moreover, these values could allow classing the clusters of the second period by their rank of innovativeness.
Nevertheless we noticed that the choice of the value of the threshold is a very big disadvantage
of this method. Indeed, we observed that, in some cases, even a very little change of its value could change significantly the result namely the order of the clusters in the innovativeness ranking. In fact, we examined the behaviour of this threshold in real cases and we found a too important instability in the order of clusters we obtained while changing its value.
So the idea to avoid this threshold is to consider all the clusters of P2 to calculate IntraP. The prob-lem lies in the fact that the importance of every cluster varies with the value of its confidence with the cluster i. That means that the clusters which are highly linked to i are very important for us whereas those which are weakly linked to i are not. To resolve this question we introduce a weighting function which takes into account the importance of the participation of the P2’s clusters in IntraP.
Thus, we are going to divide the interval [0,1] into 10 sub-intervals defined as follows:
[0.1 ;0.1( 1)]kIn k k , with 0,...,9k
Then, for each cluster i, and for every sub-interval kIn , we calculate:
1( )
ki
i k jkj Ci
IntraP In InterPC
where
k
iC is the set of clusters from P2 that have a value of confidence with the cluster i within the
sub-interval kIn :
2, ( , )k
i kC j P Cf i j In
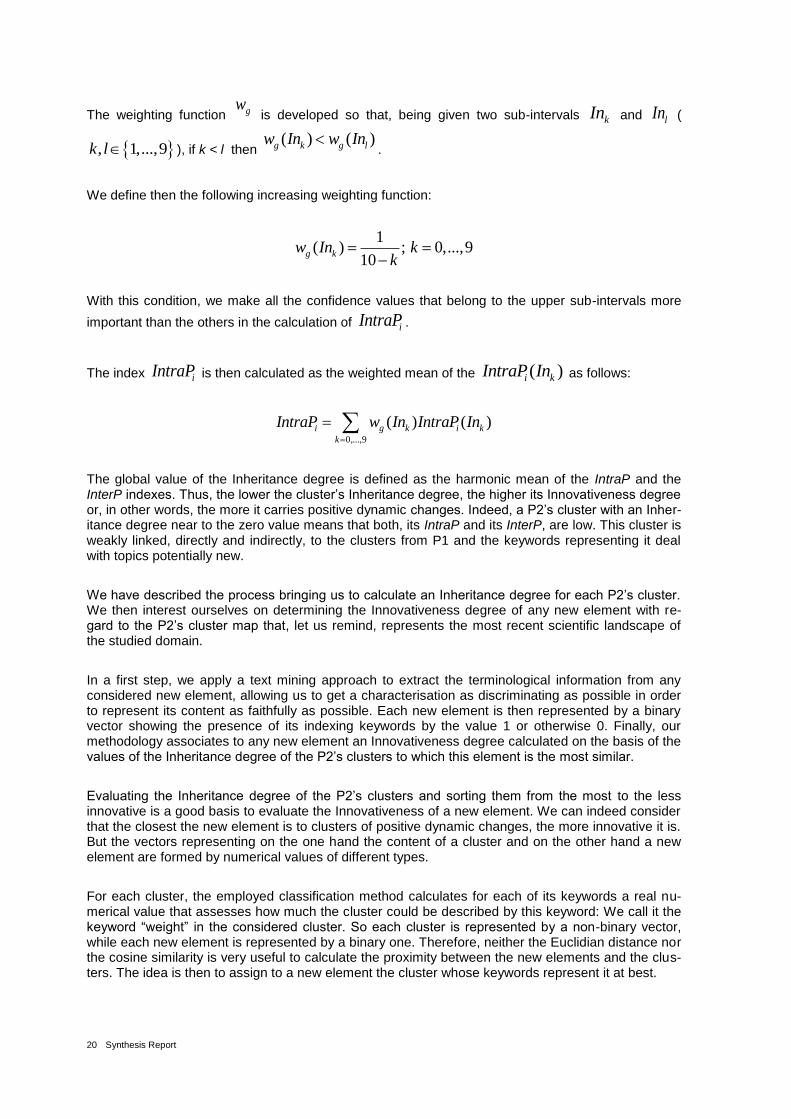
20 Synthesis Report
The weighting function gw is developed so that, being given two sub-intervals kIn and lIn (
, 1,...,9k l ), if k < l then ( ) ( )g k g lw In w In
.
We define then the following increasing weighting function:
1( ) ; 0,...,9
10
g kw In k
k
With this condition, we make all the confidence values that belong to the upper sub-intervals more
important than the others in the calculation of iIntraP .
The index iIntraP is then calculated as the weighted mean of the ( )i kIntraP In as follows:
0,...,9
( ) ( )
i g k i k
k
IntraP w In IntraP In
The global value of the Inheritance degree is defined as the harmonic mean of the IntraP and the InterP indexes. Thus, the lower the cluster’s Inheritance degree, the higher its Innovativeness degree or, in other words, the more it carries positive dynamic changes. Indeed, a P2’s cluster with an Inher-itance degree near to the zero value means that both, its IntraP and its InterP, are low. This cluster is weakly linked, directly and indirectly, to the clusters from P1 and the keywords representing it deal with topics potentially new.
We have described the process bringing us to calculate an Inheritance degree for each P2’s cluster. We then interest ourselves on determining the Innovativeness degree of any new element with re-gard to the P2’s cluster map that, let us remind, represents the most recent scientific landscape of the studied domain.
In a first step, we apply a text mining approach to extract the terminological information from any considered new element, allowing us to get a characterisation as discriminating as possible in order to represent its content as faithfully as possible. Each new element is then represented by a binary vector showing the presence of its indexing keywords by the value 1 or otherwise 0. Finally, our methodology associates to any new element an Innovativeness degree calculated on the basis of the values of the Inheritance degree of the P2’s clusters to which this element is the most similar.
Evaluating the Inheritance degree of the P2’s clusters and sorting them from the most to the less innovative is a good basis to evaluate the Innovativeness of a new element. We can indeed consider that the closest the new element is to clusters of positive dynamic changes, the more innovative it is. But the vectors representing on the one hand the content of a cluster and on the other hand a new element are formed by numerical values of different types.
For each cluster, the employed classification method calculates for each of its keywords a real nu-merical value that assesses how much the cluster could be described by this keyword: We call it the keyword “weight” in the considered cluster. So each cluster is represented by a non-binary vector, while each new element is represented by a binary one. Therefore, neither the Euclidian distance nor the cosine similarity is very useful to calculate the proximity between the new elements and the clus-ters. The idea is then to assign to a new element the cluster whose keywords represent it at best.
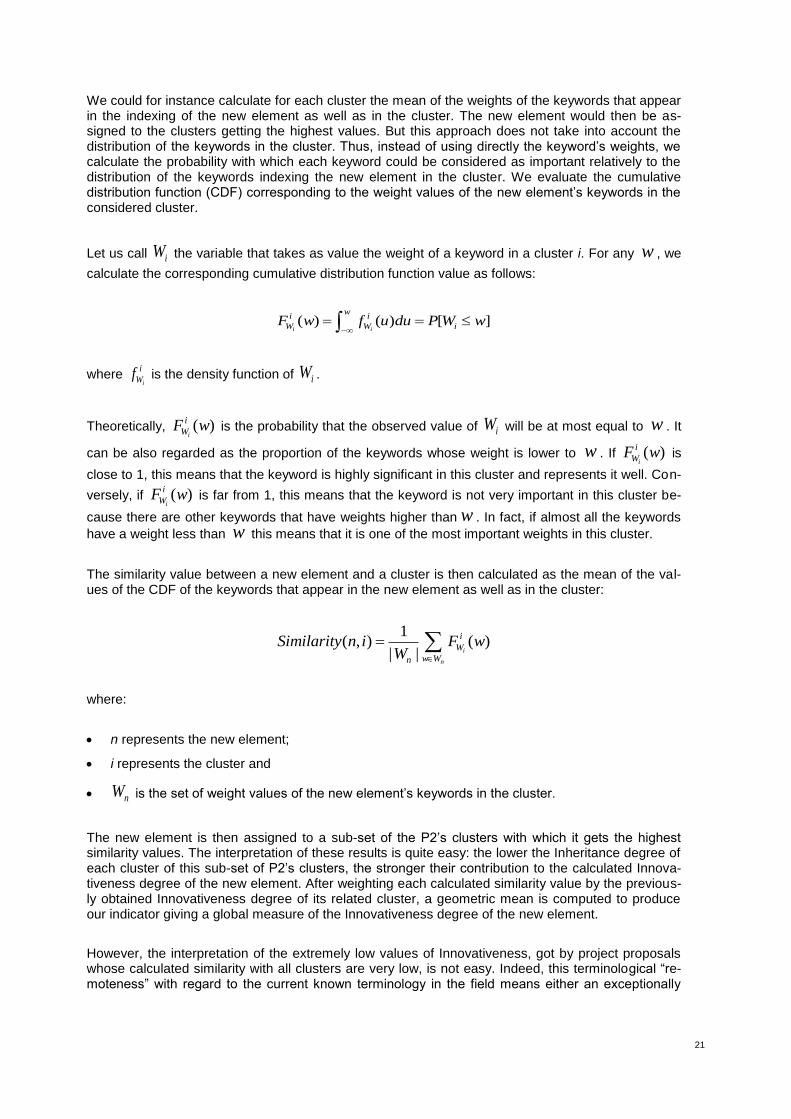
21
We could for instance calculate for each cluster the mean of the weights of the keywords that appear in the indexing of the new element as well as in the cluster. The new element would then be as-signed to the clusters getting the highest values. But this approach does not take into account the distribution of the keywords in the cluster. Thus, instead of using directly the keyword’s weights, we calculate the probability with which each keyword could be considered as important relatively to the distribution of the keywords indexing the new element in the cluster. We evaluate the cumulative distribution function (CDF) corresponding to the weight values of the new element’s keywords in the considered cluster.
Let us call iW the variable that takes as value the weight of a keyword in a cluster i. For any w , we
calculate the corresponding cumulative distribution function value as follows:
( ) ( ) [ ]
i i
wi i
W W iF w f u du P W w
where i
i
Wf is the density function of iW .
Theoretically, ( )i
i
WF w is the probability that the observed value of iW will be at most equal to w . It
can be also regarded as the proportion of the keywords whose weight is lower to w . If ( )i
i
WF w is
close to 1, this means that the keyword is highly significant in this cluster and represents it well. Con-
versely, if ( )i
i
WF w is far from 1, this means that the keyword is not very important in this cluster be-
cause there are other keywords that have weights higher than w . In fact, if almost all the keywords
have a weight less than w this means that it is one of the most important weights in this cluster.
The similarity value between a new element and a cluster is then calculated as the mean of the val-ues of the CDF of the keywords that appear in the new element as well as in the cluster:
1( , ) ( )
| |
i
n
i
W
w Wn
Similarity n i F wW
where:
n represents the new element;
i represents the cluster and
nW is the set of weight values of the new element’s keywords in the cluster.
The new element is then assigned to a sub-set of the P2’s clusters with which it gets the highest similarity values. The interpretation of these results is quite easy: the lower the Inheritance degree of each cluster of this sub-set of P2’s clusters, the stronger their contribution to the calculated Innova-tiveness degree of the new element. After weighting each calculated similarity value by the previous-ly obtained Innovativeness degree of its related cluster, a geometric mean is computed to produce our indicator giving a global measure of the Innovativeness degree of the new element.
However, the interpretation of the extremely low values of Innovativeness, got by project proposals whose calculated similarity with all clusters are very low, is not easy. Indeed, this terminological “re-moteness” with regard to the current known terminology in the field means either an exceptionally

22 Synthesis Report
new and innovative topic perfectly answering for the innovative criterion or, conversely, an empty project proposal of very poor value or even an off-topic application. Innovativeness cannot make the distinction between those two diametrically opposite situations but it could be captured through the Risk indicator.
Indicator implementation
The first step of the implementation was the choice of a sample of project proposals on which to test and assess our methodology. That choice was mainly driven by the availability and consistency of the data supplied by the ERC. At first, we started with the 2007 Call for Starting Grant
3 because that
was the only available data. Later, when we received some data from the 2009 Call for Starting Grant, we switched to that sample for the following reasons:
in the meantime, the selection process had changed so our work based on that former procedure might not have been suited to the new one;
also, the ERC classification by panels changed too, again meaning our work employing the for-mer classification would not have fit the new panel structure.
At the time, that sample from the 2009 Call for Starting Grant contained only data from successful project proposals. Bearing in mind the scope of the DBF project, it was impossible to model the se-lection process by considering only that set of proposals. We absolutely needed a set of non-successful proposals – and in sufficient number – to characterise what set apart a good proposal from a weak one. As concomitantly, the ERC rules for personal data confidentiality were strength-ened, it became mandatory to ask and obtain the prior agreement of each involved Principal Investi-gator (PI). It is easy to understand that this procedure was time consuming and that we obtained only a subset of the data. Needless to say, this new legal obligation brought a significant delay in the schedule of the DBF project. Since our diachronic analysis asks for a year of reference that is neither too recent nor too ancient as compared to the year of the Call, we decided to set that date at 2000.
We started our exploratory study by a calibration step on just one panel to set out our procedure, to fine tune the setting of our tools and validate our assumptions. That step consists in the 5 main fol-lowing tasks:
1. Choice of a “test” panel according to 2 important criteria: the availability of an in-house expert and the quality of the related terminological resources. By availability, we do not imply the mere presence of an expert, but also his or her ability to interact with the team of developers. The quality of the INIST - CNRS in-house terminological resources is not only the wealth of terms but also how correct and recent they are. For instance, the multidisciplinary lexicon contains more than 90,000 terms, a Physics-dedicated lexicon has more than 29,000 terms and shorter term lists established by discipline or by set of disciplines are employed as referential (named also authority list or controlled list) in the text-mining stage to come. Indeed, in the realisation of that stage, one or more authority lists of terms is employed, by using NLP techniques, to extract terms from the textual information contained in the bibliographic references and project pro-posals. The more frequently this list is updated, the more the results of the text-mining stage will be able to reflect the innovativeness represented in the analysed textual sources, namely the abstract and the title of the bibliographic records and of the project proposals. The update fre-quency (for instance, by introducing the newest concepts or the morpho-derivational variations, newly detected, of the old ones) of these terminological resources should be annual but in fact it is not homogeneous, varying according to the related disciplines, and most of them have not
3 There was no Call for Advanced Grant in 2007.
23
been updated for quite some time. For these reasons, our choice was to go with the ERC panel PE7 defined as “Systems and communication engineering: electronics, communication, optical and systems”.
2. Translation of the concepts behind that ERC panel and each of its sub-panels in a query lan-guage respecting the documentary rules, the syntax and authority files of the chosen biblio-graphic database, i.e. PASCAL. That task was performed by our in-house scientific expert and allowed us after several iterations to extract one corpus of bibliographical records for 2000 and 2009.
3. Text mining with the expert validation of the terminological resources, the automatic indexing by the ILC platform (sub-section “Text mining”) and a final validation by the expert of the indexing results.
4. Clustering and diachronic analysis. For this “test” panel, the clustering and the diachronic analy-sis was done manually by the expert in successive and numerous iterations in order to fine tune the setting of the tools and validate the results of that stage. The goal of this operation was to set up an automatic diachronic analysis for the later study of the other panels.
5. Calculation of Innovativeness indicator, ranking of the panel’s project proposals and comparison with the results of the selection by the ERC peer review panel.
That first step was followed by an operationalisation step that makes use of the same stages for each new considered panel with one significant difference: the automation of the diachronic analysis operated in stage 4.
For this operationalisation step, shown schematically in Figure 3, we chose 5 more panels with the same criteria as previously presented (i.e. availability of an expert and quality of the terminological resources) to which we added the mandatory need of balancing our sample by using panels from Life Sciences and from Physics & Engineering, as well as from basic domains and from applied do-mains. This led to the choice of the following panels:
LS3 - “Cellular and developmental biology”,
LS9 - “Applied life sciences and biotechnology”,
PE1 - “Mathematical foundations”,
PE2 - “Fundamental constituents of matter”,
PE8 - “Products and process engineering”.
With panel PE7 (“Systems and communication engineering”), this sample was constituted by 43 suc-cessful and 178 non-successful project proposals.
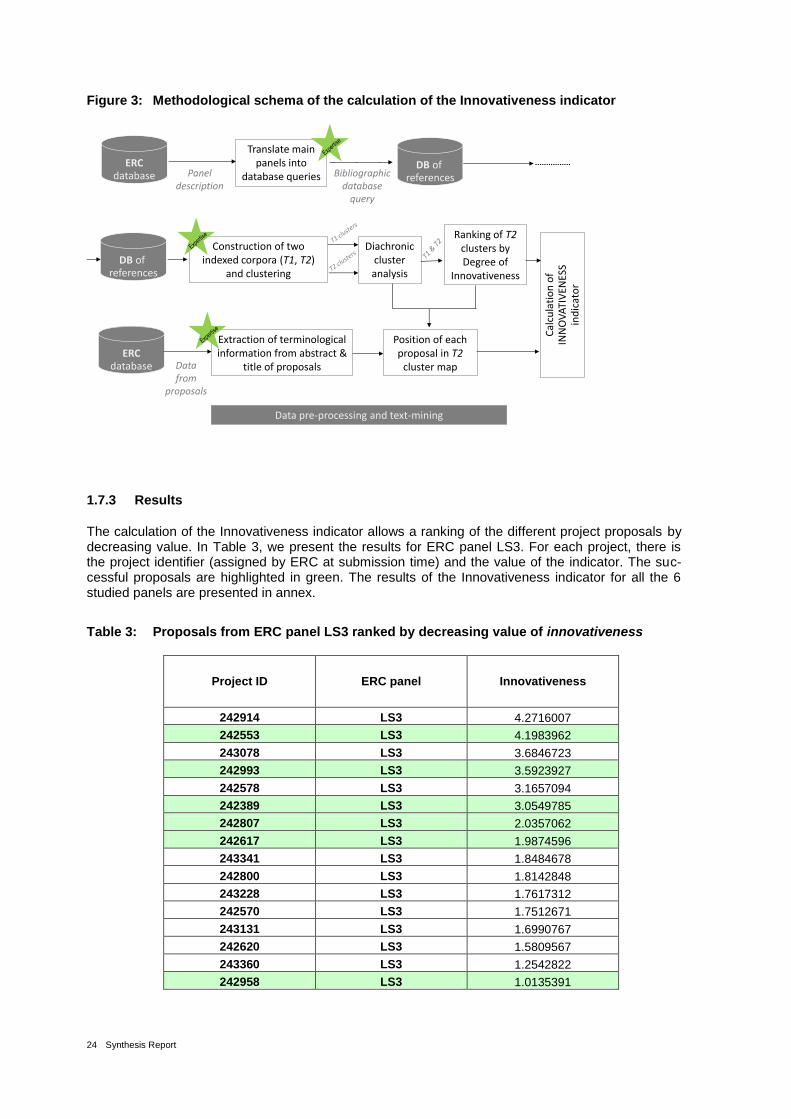
24 Synthesis Report
Figure 3: Methodological schema of the calculation of the Innovativeness indicator
1.7.3 Results
The calculation of the Innovativeness indicator allows a ranking of the different project proposals by decreasing value. In Table 3, we present the results for ERC panel LS3. For each project, there is the project identifier (assigned by ERC at submission time) and the value of the indicator. The suc-cessful proposals are highlighted in green. The results of the Innovativeness indicator for all the 6 studied panels are presented in annex.
Table 3: Proposals from ERC panel LS3 ranked by decreasing value of innovativeness
Project ID ERC panel Innovativeness
242914 LS3 4.2716007
242553 LS3 4.1983962
243078 LS3 3.6846723
242993 LS3 3.5923927
242578 LS3 3.1657094
242389 LS3 3.0549785
242807 LS3 2.0357062
242617 LS3 1.9874596
243341 LS3 1.8484678
242800 LS3 1.8142848
243228 LS3 1.7617312
242570 LS3 1.7512671
243131 LS3 1.6990767
242620 LS3 1.5809567
243360 LS3 1.2542822
242958 LS3 1.0135391
ERCdatabase
Translate main panels into
database queries
Data pre-processing and text-mining
Panel description
Bibliographic database
query
DB of references
DB of references
Construction of two indexed corpora (T1, T2)
and clustering
Diachronic cluster analysis
Ranking of T2clusters by Degree of
Innovativeness
Cal
cula
tio
n o
f IN
NO
VA
TIV
ENES
Sin
dic
ato
r
ERCdatabase Data
from proposals
Extraction of terminological information from abstract &
title of proposals
Position of each proposal in T2
cluster map

25
Project ID ERC panel Innovativeness
243316 LS3 0.9964613
243267 LS3 0.9940685
242366 LS3 0.9705928
243338 LS3 0.9676949
242651 LS3 0.950222
243116 LS3 0.8491293
241451 LS3 0.8147237
242816 LS3 0.7972799
243258 LS3 0.7577401
243087 LS3 0.6948286
242850 LS3 0.646313
243378 LS3 0.6397634
243194 LS3 0.6323592
242010 LS3 0.5472206
243305 LS3 0.4853756
243300 LS3 0.2102091
243263 LS3 0.1711867
242630 LS3 0.1576131
242741 LS3 0.149114
242976 LS3 0.1124645
243022 LS3 0.0512164
In this example, 5 of the 7 successful proposals are in the top 8 positions. Nevertheless, one pro-posal has an average score and the last one gets a mediocre score. This is likely the consequence of the sensitivity of that indicator to the quality of the data processed in its calculation, particularly, those involved in the text-mining steps. The main reasons we see for these uneven results are:
the “terminological wealth” of the textual information supplied by the PI in the proposal’s abstract. Indeed, the more informative it is and the clearer it presents the innovative points of the project, the better. Taking into account that each proposal is written by a different PI, it could be reason-ably expected that their writing skills vary. Of course, this remains an initial condition on which we have no control and whose consequences are not calculable, and we want to signal it to re-port the complexity inherent to the calculation of this indicator;
the quality of the INIST - CNRS in-house terminological resources which includes not only its correctness but also how recent it was updated. But, even with a frequently updated resource, the lack of a terminological extraction tool makes it possible that some new concepts are never-theless missing.
1.7.4 Perspectives
First of all, the results of this indicator are encouraging, although the whole process proved to be work intensive and time consuming. However, we can consider some improvements in the text min-ing step.
As we pointed out previously, the quality of the terminological resources is essential and requires that the new concepts appearing in the S&T literature be added as quickly as possible. But the work-load to determine in the huge “bag of words” produced by any terminological extraction, all the pos-sible different variations of each term and group them under an unique “canonical” form representing
26 Synthesis Report
the concept, without any regard for the other forms under which it can appear, is heavy. The manual curation of data contributed by involved scientific experts is both crucial and laborious, for it is to verify, assess, homogenise and validate lists of tens of thousands of term propositions that were automatically extracted. This task is critical if we look for reliable and exploitable results – this is the “garbage in, garbage out” principle – and it could be partially automatised by creating a computer-aided terminological extraction tool (CATEX) able to operate a term extraction ex nihilo without the help of terminological resources. A long-term approach could be adopted by nonetheless taking ad-vantage of the appropriate existing terminological resources to automatise the successive filtering and validation steps before any intervention by the scientific expert. And obviously, such a tool must also make possible the update of the existing terminological resources by facilitating the introduction of the extracted and validated new concepts in real time. CATEX should reduce greatly the need for human expertise, although it remains necessary.
The development of such a CATEX tool would be an attractive investment in the road of a possible automation of the whole process of the calculation of this indicator.
Besides the text-mining operation, the assistance to the calculation procedure of innovativeness is possible but to say that it can be completely automatised would be utopian. Indeed, if we wish, for instance, to process future ERC Calls, it is necessary to consider that scientific expertise is needed to:
update the corpus employed to draw the publication scientific landscape corresponding to each one of the panels by updating the query and validating the corpus;
redesign the different queries if necessary, for instance if the perimeter of one or more ERC panels comes to change;
find reliable, consistent and ad hoc source of bibliographical records to fit the content of the other ERC panels not yet processed.
In addition to the automation of the process, another point worth further investigation is the study of the numerical sensibility of the parameters directly involved in the computation of the indicator, as for example, by varying the number of clusters taken into account in the calculation of the geometric mean giving the measure of the Innovativeness degree of each proposal.

27
1.8 Timeliness
Together with the Innovativeness indicator, this indicator is meant to represent “novelty”, one of the four key attributes we recognised from the definition of frontier research as given by the High Level Expert Group (HLEG).
1.8.1 Description of indicator
From frontier research to indicator
From the HLEG report (EC 2005), one of the elements of the definition of frontier research is:
Frontier research stands at the forefront of creating new knowledge and developing new understanding. Those involved are responsible for fundamental discoveries and advances in theoretical and empirical understanding, and even achieving the occa-sional revolutionary breakthrough that completely changes our knowledge of the world.
Because the notion of “revolutionary breakthrough” is practically inaccessible by bibliometric meth-ods, the work concentrated on that indicator related to the recency of the cited works in the project proposal.
To build that indicator, we relied on the following hypotheses:
The cited references represent the knowledge on which the project proposal is based.
The more recent the cited references, the more likely the work is at the cutting edge of science.
If we accept these working hypotheses, we can calculate that indicator.
1.8.2 Process of implementation
To build this indicator, we measure the innovative or emerging degree of the project proposal by considering the bibliographic references cited by the applicant, but with regard to only one facet of these references: their recency, that is, the elapsed time since the publication of the cited docu-ments.
Input data
The data necessary to calculate the Timeliness indicator came from one source: the project pro-posals from ERC. Since we had not access to the project proposals, we received from ERC — very late in the course of the project — a file containing the bibliographies extracted from these proposals.
We also made use of the shorter bibliography of the extended synopsis present in the principal in-vestigator’s CV, although it represented often just a subset of the proposal bibliography, with some-time a few extra references. As it was mentioned for the other indicators, we first received from ERC the CVs from successful project proposals and much later, after agreement from their authors, those from non-successful project proposals.
Indicator implementation
As stated previously, the first step of the implementation was the choice of a sample of project pro-posals on which to test and assess our methodology. That choice was mainly driven by the availabil-

28 Synthesis Report
ity and consistency of the data supplied by the ERC. At first, we started with the 2007 Call for Start-ing Grant because that was the only available data. Later, when we received some data from the 2009 Call for Starting Grant, we switched to that sample for the following reasons:
in the meantime, the selection process had changed so our work based on that former procedure might not have been suited to the new one,
also, the ERC classification by panels changed too, again meaning our work employing the for-mer classification would not have fit the new panel structure.
At the time, that sample from the 2009 Call for Starting Grant contained only data from successful project proposals. Bearing in mind the scope of the DBF project, it was impossible to model the se-lection process by considering only that set of proposals. We absolutely needed a set of non-successful proposals – and in sufficient number – to characterise what set apart a good proposal from a weak one. As concomitantly, the ERC rules for personal data confidentiality were strength-ened, it became mandatory to ask and obtain the prior agreement of each involved Principal Investi-gator (PI). It is easy to understand that this procedure was time consuming and that we obtained only a subset of the data. Needless to say, this new legal obligation brought a significant delay in the schedule of the DBF project.
To be consistent with the other indicators, we chose the same 6 panels with the same criteria as previously presented, especially the need to balance our sample by using panels from Life Sciences and from Physics & Engineering, as well as panels from basic domains and from applied domains. This led to the choice of the following panels:
LS3 - “Cellular and developmental biology”,
LS9 - “Applied life sciences and biotechnology”,
PE1 - “Mathematical foundations”,
PE2 - “Fundamental constituents of matter”,
PE7 - “Systems and communication engineering”,
PE8 - “Products and process engineering”.
This sample was constituted by 43 successful and 178 non-successful project proposals.
Figure 4: Methodological schema of the calculation of the Timeliness indicator
ERCdatabase Project
proposal
Empirical distribution of
publication dates
Extraction ofpublication date
of references
Calculation of TIMELINESS
indicator
Data pre-processing and text-mining

29
The calculation of timeliness needs the following steps (cf. Figure 4):
extraction of the bibliography related to the project from the PI's extended synopsis and pro-posal,
selection of the references of journal articles and conference presentations to keep an homoge-neous dataset,
extraction of the publication year from these references and analysis.
The data was analysed by calculating the “age” of each citation: submission year minus publishing year. We have two possible indicators to represent timeliness: the arithmetic mean – or average – and the median which is known to be a more robust indicator in presence of outliers. As mentioned previously, the underlying hypothesis is that the more recent the backwards citations – or references –, the more likely the work is at the cutting edge of science, so we expect the proposal with the low-est value to present a greater degree of novelty.
At the start of the project, two members of the consortium went to the ERC headquarters in Brussels to extract, on the premises and under strict supervision, a list of “scrambled” keywords as well as bibliographic references from the project proposals. For security reasons, they could not communi-cate with the AIT computer specialist to validate and correct if necessary the extraction procedure. Without these iterations, the results were suboptimal. Even the extraction of the bibliography at the end of the proposals, first thought as being easier, did not give good results. Finally, the then project officer, Jens Hemmelskamp, provided us on October 2011 with a file containing the cited references for the list of proposals we were studying. For information, it took two weeks to an intern at ERC to extract that data, so the workload is not to be underestimated. And this solved the first part of the procedure, even if it is admittedly the most troublesome.
The calculation of the Timeliness indicator is relatively simple once we have the correct data, that is the references pertaining to the project and extracted from the PI’s extended synopsis and proposal. To keep the dataset homogeneous, we select only references from journal articles and conference presentations, which are the most common and regular ways of publication in many scientific do-mains. But this imposes to check every reference.
So far, we have no tools to facilitate that procedure of extracting and selecting the references and everything is done manually. The selection of the references is also labour intensive and it must be done carefully since the same dataset is later used for the calculation of the Risk indicator. The date is extracted from the references with a regular expression, although it gave sometime no result or too many, in which case, we have to intervene. In some extreme cases, this intervention consists on a search for the correct reference and publication year on the Internet.
1.8.3 Results
The calculation of the Timeliness indicator allows a ranking of the different project proposals by decreasing value of the indicator. In
Table 4, we present the results for ERC panel LS3. For each project, there is the project identifier (assigned by ERC at submission time) and the value of the average age of the references cited in the project proposals. The 7 successful proposals are highlighted in green. The results of the Timeli-ness indicator for all the 6 studied panels are presented in the annex.
In this example, 3 of 7 successful proposals are in the top 7 positions, 3 are in the bottom 11 posi-tions and the last one is at the 15
th position, roughly in the middle of the ranking. The interpretation of
these results is not easy and does not lead to an obvious conclusion.

30 Synthesis Report
Table 4: The 37 proposals from ERC panel LS3 ranked by increasing value of timeliness*
Project ID ERC panel Timeliness
243116 LS3 2.556
242651 LS3 2.917
242389 LS3 3.048
243228 LS3 3.14
242617 LS3 3.571
242800 LS3 4.232
242958 LS3 4.326
243022 LS3 4.381
243305 LS3 4.433
242741 LS3 4.645
243316 LS3 4.656
242816 LS3 4.853
243360 LS3 4.914
242976 LS3 5.143
242630 LS3 5.417
242010 LS3 5.704
243258 LS3 5.793
241451 LS3 5.81
243263 LS3 5.931
242620 LS3 5.954
243131 LS3 6.035
243194 LS3 6.079
242850 LS3 6.258
242366 LS3 6.367
243378 LS3 6.397
243267 LS3 6.424
242807 LS3 7.206
243338 LS3 7.629
242553 LS3 7.706
242570 LS3 7.837
242993 LS3 8.051
243341 LS3 8.217
243078 LS3 9.111
243087 LS3 9.175
242914 LS3 9.284
243300 LS3 9.38
242578 LS3 9.515 *calculated as the average age of the cited references (Call 2009 Starting Grant)
So, the extension of the whole calculation procedure of timeliness to more panels is possible if and only if the bibliography from the different project proposals is provided in a ready-to-use form, unlike what we received at the start of the DBF project.
The automation of the whole process of calculating timeliness – from the input PDF files to the final result – is possible if the following difficulties can be overcome:
31
extracting references from the project proposal or extended synopsis. In most cases, these references are neatly put at the end of the proposal with a “Bibliography” or “References” section header. But sometime, the references are present in the body of the text or as foot-notes on the pages where they are relevant and finding them automatically becomes very complicated;
selecting the references according to their document type. Here too, it is quite easy once you have the journal title or the conference acronym, but for having done that selection manually, we know it is not always that obvious. An automatic system would have to ask for confirma-tion sometime and to learn from previous examples;
extracting the publication year. In most cases, a simple regular expression is enough to find that date, but in some cases, there is no date or several numbers are possible matches. Usually, in the same bibliography, for the same document type, the publication year is al-ways at the same position in the reference. In the bibliographies we processed, it was not always the case, very likely because the references were copy-pasted from different sources with different reference syntaxes.
There are several ways to improve matters:
avoid using PDF documents as a source of data. They are meant to be read by humans, i.e. the reviewers, not processed by machines;
use of a style sheet for writing proposals and CVs with a precise guideline, especially for pa-tents and references, to ease the pre-processing step;
provide the information in a structured document which nowadays means in XML. It is to be noted that recent text processors work already in XML format and that the conversion in PDF, if necessary, is quite easy. Also, it has a positive impact on managing the access to confidential data: it makes it easier to extract a specific type of data from such an XML doc-ument as some data tagged with a low confidentiality (e.g. bibliography) without compromis-ing the whole project confidentiality.
1.8.4 Perspectives
The great quality of that indicator is its simplicity, but its results do not seem conclusive. We can identify some pointers to improve that indicator:
instead of the age of the project proposal references, we can use the age of the citations in the bibliography of those references. This could confirm that the recency observed at the first level is not an artefact. However, such a procedure is not going to be simple to implement. There are the known problems of finding and collecting the information in databases or elsewhere, of validating them and of extracting the desired data, the publication year;
we can create a profile of the age of the citations of a panel by combining the bibliographies of all the project proposals of that panel and compare it with a profile produced for the refer-ences of each project, and so ranking the proposals in the context of the whole panel.
32 Synthesis Report
1.9 Risk
This indicator is meant to represent “personal risk”, one of the four key attributes of frontier research defined by the High Level Expert Group (HLEG).
1.9.1 Description of indicator
From frontier research to indicator
From the HLEG report (EC 2005), one of the elements of the definition of frontier research is:
Frontier research is an intrinsically risky endeavour. In the new and most exciting re-search areas, the approach or trajectory that may prove most fruitful for developing the field is often not clear. Researchers must be bold and take risks. Indeed, only re-searchers are generally in a position to identify the opportunities of greatest promise. The task of funding agencies is confined to supporting the best researchers with the most exciting ideas, rather than trying to identify priorities.
An important aspect for the ERC is the personal risk of a Principal Investigator (PI). Therefore the emphasis in this project is to develop an indicator for this aspect of risk. When a scientist steps out of his or her science environment and builds up his or her own research and science, this might be risky in the sense of independence.
To build that indicator, we relied on the following hypotheses: The underlying hypothesis of our ap-proach could be phrased as follows. If a scientist shifts to a new research domain he or she will cite different references than he or she has done in their previous work. One aspect is to consider the knowledge base on which the current work is built on. Besides the own developed knowledge of the scientists and their experiences we find the knowledge base in the references they cite in their scien-tific work. We would like to measure the “distance” or the “proximity” of the past citation (reference) profile to the current citation profile of an individual scientist.
The higher the “distance” or the “proximity” of the cited references of the proposal to the past citations, the more likely the PI steps into a new field with the proposal.
If we accept these working hypotheses, we can calculate that indicator.
1.9.2 Process of implementation
To build this indicator, we measure the innovative or emerging degree of the project proposal by considering the bibliographic references cited by the applicant with regard to the reference profile of his or her former cited references and that in the proposal. The cited references are the knowledge base where a publication is built on. Is there a big difference between the former cited references of a PI in his or her former work and the profile of the cited references in a considered proposal the PI might step into a new research environment, which might be a personal risk and a step into his or her scientific independence.
Input data
The data necessary to calculate the Risk indicator came from several sources:
I. The project proposal from the ERC
33
a) The name of the PI, his or her CV in some cases, where the name might not be unique in Web of Science.
a) The list of cited references with regard to the importance to the proposal.
II. Web of Science data
b) The publications of the PI in the Web of Science.
c) The cited references of the PI are searched in the Web of Science to get a standard-isation of the cited references so that they are comparable with those in II.a).
Preparing these data is an incredible effort and toil in case they are not available in standardised format. However, this fact is true for most of the necessary data used in this project. Manuel work was necessary in several aspects such as extracting the publications from the proposal text. The proposals are not standardised regarding citing the references in that way they could be used for calculations with a machine. Then searching for a considered PI in Web of Science is sometimes a challenge and time consuming in case the name of the PI is not unique. In this case, one has to check the CV of the PI, his or her affiliations, etc. so that one can find the correct publications in Web of Science. Research ID in Web of Science obligatory for each PI would facilitate the work enor-mously.
Indicator implementation
As stated previously, the first step of the implementation was the choice of a sample of project pro-posals on which to test and assess our methodology. That choice was mainly driven by the availabil-ity and consistency of the data supplied by the ERC. At first, we started with the 2007 Call for Start-ing Grant because that was the only available data. Later, when we received some data from the 2009 Call for Starting Grant, we switched to that sample for the following reasons:
in the meantime, the selection process had changed so our work based on that former procedure might not have been suited to the new one;
also, the ERC classification by panels changed too, again meaning our work employing the for-mer classification would not have fit the new panel structure.
At the time, that sample from the 2009 Call for Starting Grant contained only data from successful project proposals. Bearing in mind the scope of the DBF project, it was impossible to model the se-lection process by considering only that set of proposals. We absolutely needed a set of non-successful proposals – and in sufficient number – to characterise what set apart a good proposal from a weak one. As concomitantly, the ERC rules for personal data confidentiality were strength-ened, it became mandatory to ask and obtain the prior agreement of each involved PI. It is easy to understand that the procedure was time consuming and that we obtained only a subset of the data. Needless to say, this new legal obligation brought a significant delay in the schedule of the DBF pro-ject.
To be consistent with the other indicators, we chose the same 6 panels with the same criteria as previously presented, especially the need to balance our sample by using panels from Life Sciences and from Physics & Engineering, as well as panels from basic domains and from applied domains. This led to the choice of the following panels:
LS3 - “Cellular and developmental biology”,
LS9 - “Applied life sciences and biotechnology”,
PE1 - “Mathematical foundations”,
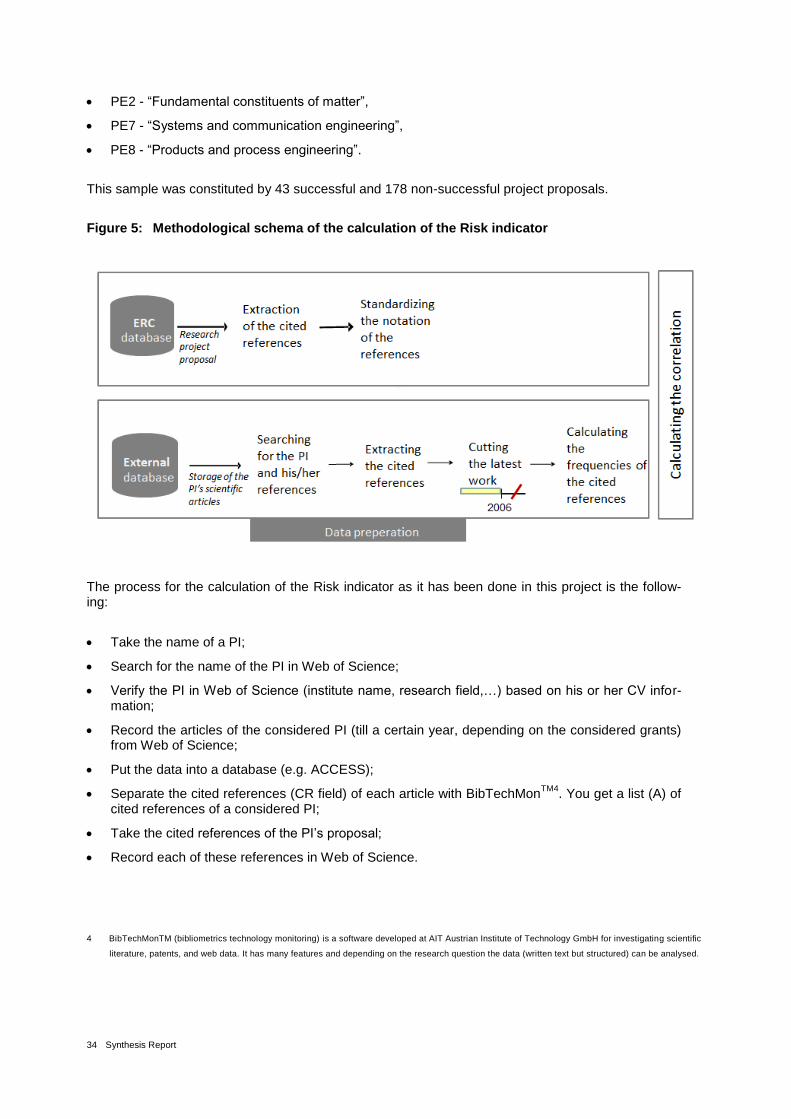
34 Synthesis Report
PE2 - “Fundamental constituents of matter”,
PE7 - “Systems and communication engineering”,
PE8 - “Products and process engineering”.
This sample was constituted by 43 successful and 178 non-successful project proposals.
Figure 5: Methodological schema of the calculation of the Risk indicator
The process for the calculation of the Risk indicator as it has been done in this project is the follow-ing:
Take the name of a PI;
Search for the name of the PI in Web of Science;
Verify the PI in Web of Science (institute name, research field,…) based on his or her CV infor-mation;
Record the articles of the considered PI (till a certain year, depending on the considered grants) from Web of Science;
Put the data into a database (e.g. ACCESS);
Separate the cited references (CR field) of each article with BibTechMonTM4
. You get a list (A) of cited references of a considered PI;
Take the cited references of the PI’s proposal;
Record each of these references in Web of Science.
4 BibTechMonTM (bibliometrics technology monitoring) is a software developed at AIT Austrian Institute of Technology GmbH for investigating scientific
literature, patents, and web data. It has many features and depending on the research question the data (written text but structured) can be analysed.

35
Import these references into the ACCESS database. You get a list (B) of the cited references of the proposal of the considered PI in the same data structure as it is in (A);
Create a query in ACCESS where you calculate the frequency of the cited references (A);
Create a list with all references and the questions “occurs in (A) with the frequency x” and “oc-curs also in (B) with the frequency y”. If there is no occurrence, the value is 0;
Export these data into EXCEL;
Apply the formulas:
- Correlation coefficient
- Sum product
- Cosine
Follow these 13 steps for each PI (in each considered panel).
The background for these steps is the following: We consider all publications of a scientist, he or she published in the past or in a first period for consideration. Let the number of this publications be n. We take all the references he or she cites in these publications and call them set R. R = {r1, r2, r3, …, rm}, where i is the consecutive numbering of the reference ri of this set. Each of these references oc-curs with a specific frequency, which means that some references are cited in more publications than others. Some are cited e.g. in all publications, and some possibly cited only once. We say ri has a frequency of fi.
Then we consider his / her proposal. We take the references of the considered proposal and call this set S. S = {s1, s2, s3,…, sp}. Each of these references occurs also with a specific frequency or in the specific case of a grant application with the frequency 1.
SR is the set of concurrence or references
If a scientist does not start in a complete new field there will be an overlap, an intersection between these two sets. We get e.g. that s1=r2, s2=rk, s3=rj, etc. where these references concur.
These sets can be presented also in the following way (see Table 5):
RSR
U
S

36 Synthesis Report
Table 5: Formal scheme of the considered reference sets
reference rifrequency of the
references in the set Rreference sj
frequency for each
references in the set S
r1 f1
r2 f2 s1= r2 g2 concurrence
r3 f3
… … s2=rk g2
… … …
… … sg gg
ri fi sh= ri gh concurrence
rj fj si=rj gi concurrence
… … …
… … sl gl
… … …
sm gm
sn gn
rm fu
rn fv
Set of references from
publicatons of the past (R)
Set of references from the
currenct research work (S)
There are different possibilities for measuring the “similarity”, the “distance”, the “proximity” of such cited reference profiles based on the prepared data. The correlation coefficient and the cosine are candidates for doing this. Although these two measurements are well known, they have nevertheless to be discussed here shortly because the data applied for such measurements have to have specific features.
Correlation Coefficient
The correlation coefficient is a measure of the strength of a linear association between two variables, in our case between R and S as described above (Table 5). The most familiar measure of depend-ence between two quantities is the Pearson product-moment correlation coefficient, or "Pearson's correlation." It is obtained by dividing the covariance of the two variables by the product of their standard deviations.
The population correlation coefficient ρX,Y between two random variables X and Y with expected val-ues μX and μY and standard deviations σX and σY is defined as:
where E is the expected value operator, cov means covariance and corr a widely used alternative notation for Pearson's correlation.
The correlation coefficient ranges from −1 to +1. A positive value for the correlation implies a positive association (large values of X tend to be associated with large values of Y and small values of X tend

37
to be associated with small values of Y). A negative value for the correlation implies a negative or inverse association (large values of X tend to be associated with small values of Y and vice versa).
For the application to our data, the sets of cited references we consider the frequencies of set R as variable X and the frequencies of the set S as variable Y. Then we apply the correlation coefficient to these variables of some test examples. We expect that the correlation coefficient will take a value closer to 1 in case the cited references concur widely in titles and frequency and will take a value closer to -1 if the cited references are more complementary. The statistical significance is particular here. We will see that although there is a high congruence of the titles concerning the frequencies the result of the correlation coefficient (taken from the frequency) takes the values not close to +1. And that is because of the conditions for the correlation coefficient.
The correlation coefficient (corr) works under the following conditions: scaling, normal distribution, linearity condition, significance condition. Roughly spoken in many cases these conditions are ful-filled. But there are also cases, e.g. those which we have here, where for instance the normal distri-bution or the linearity is not given.
We have to be careful with this approach. There are few examples which are realistic in regard to our considered data of cited references, and which explain the point of view. There is no shift into a new knowledge base in test case No 1 (see Table 6 ). The corr is slightly negative. In this case the corre-lation coefficient does not provide reasonable results. The next example (test case No 2 in Table 7) gives a classical corr result with a value of 0.93945447. The linearity between the two variables X and Y are quite well fulfilled.
Table 6: Test case No 1 – no normal distribution and no linearity
X (freq in period 1) Y (freq in period 2)
REF_01 4 1
REF_02 3 1
REF_03 2 1
REF_04 5 1
REF_05 1 1
REF_06 1 1
REF_07 1 1
REF_08 2 1
REF_09 1 1
REF_10 2 2
REF=cited reference
freq=frequency
Table 8 exemplifies another two test cases, the corr of case No 3 being -0.66390719 and the corr of case No 4 being -1, as we would expect if none of the cited references concur. Although not any of the variables in No 3 concur, the result of corr is not -1. This represents the features of the corr.
These discussions should only illustrate that applying the correlation coefficient is delicate and we have to be careful.
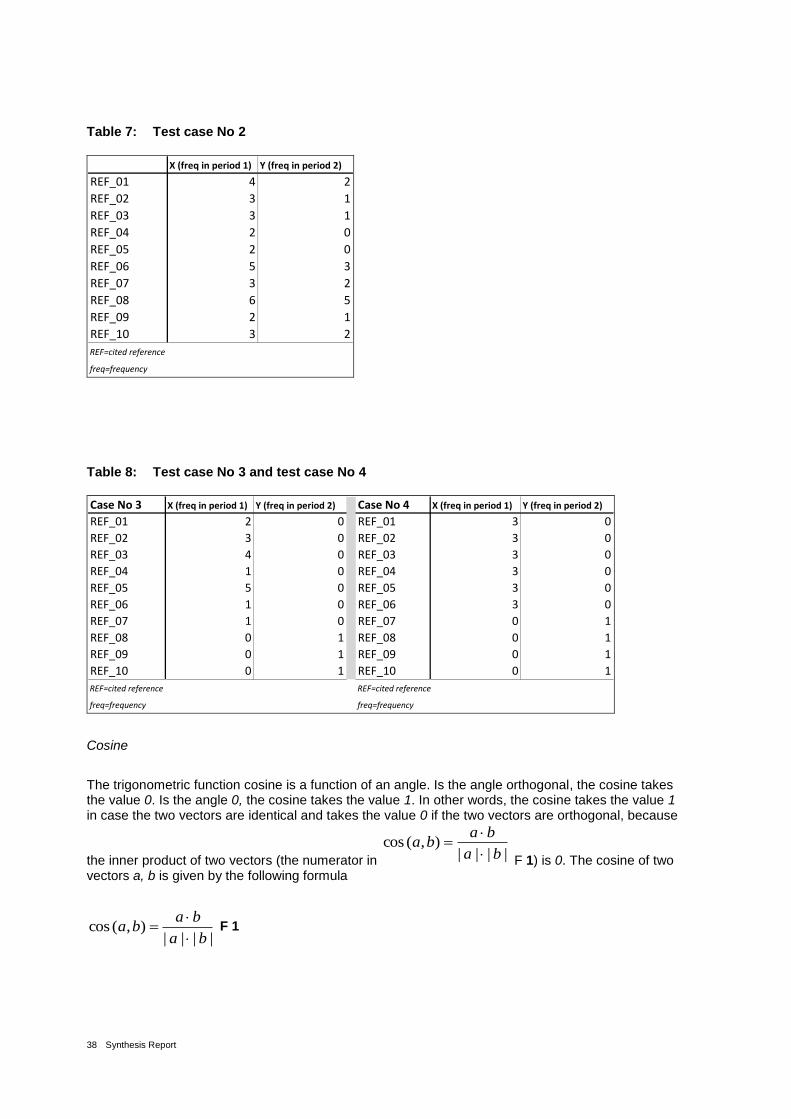
38 Synthesis Report
Table 7: Test case No 2
X (freq in period 1) Y (freq in period 2)
REF_01 4 2
REF_02 3 1
REF_03 3 1
REF_04 2 0
REF_05 2 0
REF_06 5 3
REF_07 3 2
REF_08 6 5
REF_09 2 1
REF_10 3 2
REF=cited reference
freq=frequency
Table 8: Test case No 3 and test case No 4
Case No 3 X (freq in period 1) Y (freq in period 2) Case No 4 X (freq in period 1) Y (freq in period 2)
REF_01 2 0 REF_01 3 0
REF_02 3 0 REF_02 3 0
REF_03 4 0 REF_03 3 0
REF_04 1 0 REF_04 3 0
REF_05 5 0 REF_05 3 0
REF_06 1 0 REF_06 3 0
REF_07 1 0 REF_07 0 1
REF_08 0 1 REF_08 0 1
REF_09 0 1 REF_09 0 1
REF_10 0 1 REF_10 0 1
REF=cited reference REF=cited reference
freq=frequency freq=frequency
Cosine
The trigonometric function cosine is a function of an angle. Is the angle orthogonal, the cosine takes the value 0. Is the angle 0, the cosine takes the value 1. In other words, the cosine takes the value 1 in case the two vectors are identical and takes the value 0 if the two vectors are orthogonal, because
the inner product of two vectors (the numerator in ||||),(cos
ba
baba
F 1) is 0. The cosine of two vectors a, b is given by the following formula
||||),(cos
ba
baba
F 1

39
Considering the frequencies of the set R as vector a and the frequencies of set S as vector b offers the possibility for applying the cosine to our research questions.
Let us apply these considerations to our data “cited references”. We expect a cosine value closer to 1 in case the cited references concur in two considered papers. If the cited references do not concur widely the cosine would take a value closer to 0.
The application of the cosine to our test examples uncovers that the cosine works very well.
Sum-product
The sum-product is the numerator in the formula for the cosine. The sum-product might be useful in cases where the denominator of the formula for the cosine is zero. In this case we have a division through zero, which is not defined. But the numerator is also zero, a useful value. This situation hap-pens in cases where a PI does not cite any cited references in the proposal but cite them in his or her former work.
All three approaches were applied.
1.9.3 Results
The calculation of the Risk indicator allows a ranking of the different project proposals by increasing value of all indicators. We choose the favourite indicator cosine, which provides reasonable results from the mathematical point of view as well as from the application of the discrete choice model point of view. Is the cosine 0, the two cited reference profile (the cited references in the former work – two years before the grant application – and the cited references in the proposal) are disjoint, which indi-cates that the PI uses a new knowledge base, steps into a new research field. Is the cosine higher than 0, the PI uses several cited references from his/her former work in his/her project proposal. Would the cosine value be 1, the two cited reference profiles would be identical, which never (hardly) occurs. In this case there might be not even one new aspect in the work.
In Table 9 we present the results for ERC panel PE7. For each project, there is the project identifier (assigned by ERC at submission time) and the values for the three investigated indicators, the corre-lation (corr), the cosine (cos) and the sum-product of the reference profiles of each PI in comparison with his/her reference profile of the project proposals. The four successful proposals are highlighted in green. The results of the Risk indicator for all the six studied panels are presented in the annex.
The Risk indicator does not indicate any successfulness. The aspect of independence of a PI might not be an important criterion of the peer review process.
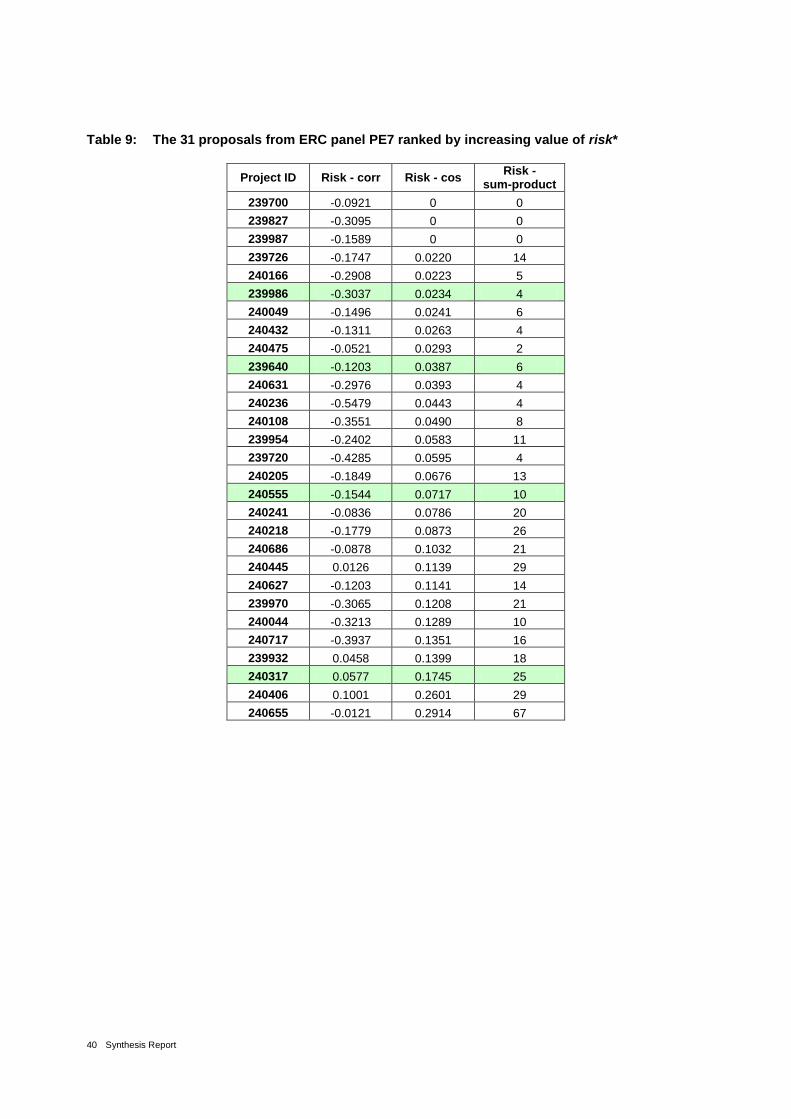
40 Synthesis Report
Table 9: The 31 proposals from ERC panel PE7 ranked by increasing value of risk*
Project ID Risk - corr Risk - cos Risk -
sum-product
239700 -0.0921 0 0
239827 -0.3095 0 0
239987 -0.1589 0 0
239726 -0.1747 0.0220 14
240166 -0.2908 0.0223 5
239986 -0.3037 0.0234 4
240049 -0.1496 0.0241 6
240432 -0.1311 0.0263 4
240475 -0.0521 0.0293 2
239640 -0.1203 0.0387 6
240631 -0.2976 0.0393 4
240236 -0.5479 0.0443 4
240108 -0.3551 0.0490 8
239954 -0.2402 0.0583 11
239720 -0.4285 0.0595 4
240205 -0.1849 0.0676 13
240555 -0.1544 0.0717 10
240241 -0.0836 0.0786 20
240218 -0.1779 0.0873 26
240686 -0.0878 0.1032 21
240445 0.0126 0.1139 29
240627 -0.1203 0.1141 14
239970 -0.3065 0.1208 21
240044 -0.3213 0.1289 10
240717 -0.3937 0.1351 16
239932 0.0458 0.1399 18
240317 0.0577 0.1745 25
240406 0.1001 0.2601 29
240655 -0.0121 0.2914 67

41
Project ID Risk - corr Risk - cos Risk -
sum-product
239668 #DIV/0!5 #DIV/0!
6 0
240456 #DIV/0! #DIV/0! 0 * cosine (Call 2009 Starting Grant)
The extension of the whole calculation procedure of risk (independence) to more panels is hardly possible with the current situation of the data format availability. The most work-intensive steps of the manual work would be:
identify each PI in the Web of Science;
extract the cited references of each PI out of the proposal of PDF format.
The automation of the whole process of calculating risk (independence) would be possible under the following conditions:
each PI has a researcher ID in Web of Science;
the format of the cited references in the proposal is exactly the same as in Web of Science.
Alternatively to the Web of Science version: each PI is asked for his or her former cited references, all in the same format (where also the commas, dots and other separator signs are exactly defined).
1.9.4 Perspectives
This indicator highlights the personal aspect of independence in the former work. This entails a PI moving away from their scientific environment, or for instance, a Starting Grand applicant moving away from his or her supervisor’s research field. The cosine provides useful results. The challenges for the calculation of this indicator are based on the format of the data availability as discussed above.
5 In case one of the standard deviations is 0, we get a division through zero. This is the case e.g. if a
PI does not have any publications neither inside the proposal nor “outside”.
The population correlation coefficient ρX,Y between two random variables X and Y with expected values μX and μY and standard deviations σX and σY is defined as:
where E is the expected value operator, cov means covariance, and, corr a widely used alternative notation for Pearson's correlation.
6 In case one of the vectors consists only of zero vector coordinates such as a=(0,0,0,0,0,0,0), its
length is 0 (is one of the factors in the denominator). Therefore it is the case of division through 0.

42 Synthesis Report
The PI’s independence from the known scientific environment by stepping into a new research envi-ronment is only one risk. It is a very interesting research question how to calculate the risk of a re-search idea from risk aspects such as “risky for the research idea”, “risky for the society”, “risky for …”. However, these questions go beyond the frame of the project.
43
1.10 Pasteuresqueness
Pasteuresqueness was employed to infer the general attitude of a researcher to create applicable relevant results in the context of his or her project proposal. This indicator is meant to represent “ap-plicability”, one of the four key attributes we recognised from the definition of frontier research as given by the High Level Expert Group (HLEG).
1.10.1 Description of indicator
From frontier research to indicator
From the HLEG report (EC 2005), one of the elements of the definition of frontier research is:
The traditional distinction between ‘basic’ and ‘applied’ research implies that research can be either one or the other but not both. With frontier research researchers may well be concerned with both new knowledge about the world and with generating po-tentially useful knowledge at the same time. Therefore, there is a much closer and more intimate connection between the resulting science and technology, with few of the barriers that arise when basic research and applied research are carried out sepa-rately.
One way of making the distinction between fundamental and applied research was introduced by Donald Stokes (Stokes 1997), who defined a two-dimensional chart, “the Pasteur’s Quadrant” (cf. Figure 7). It is a label given to a class of scientific research developments that both seek fundamen-tal understanding of scientific problems, and at the same time, seek to be eventually beneficial to society. The works of Louis Pasteur, the French chemist and physicist, pioneer of microbiology, are thought to exemplify this type of study, which bridges the gap between “fundamental” and “applied” research. The Pasteur’s Quadrant characterises three distinct classes of research:
pure fundamental research, illustrated by the work of Niels Bohr, the early 20th century atomic Danish physicist;
pure applied research, exemplified by the work of Thomas Edison, the North-American inventor and businessman;
application-inspired fundamental research, described as “Pasteur’s Quadrant”.
The term pasteuresqueness originates from this formalism which describes scientific research and methods that seek both fundamental understanding and at the same time social benefit (cf. Figure 7).
The construction of pasteuresqueness has given rise among the members of the Consortium to some lively debates during which several options were evoked. Before presenting the actual defini-tion of that indicator, we wish to chart the development of the underlying concept by detailing our interrogations on the consistency and the doability of all the possibilities we studied and decided to give up.
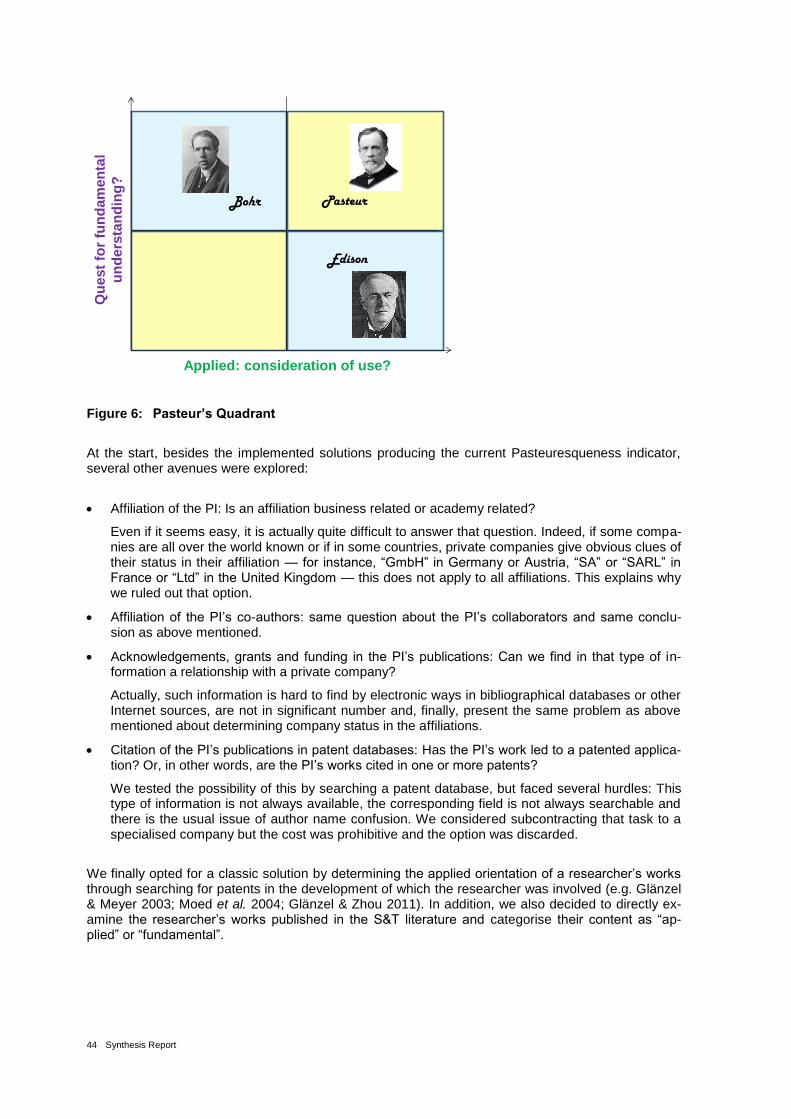
44 Synthesis Report
Figure 6: Pasteur’s Quadrant
At the start, besides the implemented solutions producing the current Pasteuresqueness indicator, several other avenues were explored:
Affiliation of the PI: Is an affiliation business related or academy related?
Even if it seems easy, it is actually quite difficult to answer that question. Indeed, if some compa-nies are all over the world known or if in some countries, private companies give obvious clues of their status in their affiliation — for instance, “GmbH” in Germany or Austria, “SA” or “SARL” in France or “Ltd” in the United Kingdom — this does not apply to all affiliations. This explains why we ruled out that option.
Affiliation of the PI’s co-authors: same question about the PI’s collaborators and same conclu-sion as above mentioned.
Acknowledgements, grants and funding in the PI’s publications: Can we find in that type of in-formation a relationship with a private company?
Actually, such information is hard to find by electronic ways in bibliographical databases or other Internet sources, are not in significant number and, finally, present the same problem as above mentioned about determining company status in the affiliations.
Citation of the PI’s publications in patent databases: Has the PI’s work led to a patented applica-tion? Or, in other words, are the PI’s works cited in one or more patents?
We tested the possibility of this by searching a patent database, but faced several hurdles: This type of information is not always available, the corresponding field is not always searchable and there is the usual issue of author name confusion. We considered subcontracting that task to a specialised company but the cost was prohibitive and the option was discarded.
We finally opted for a classic solution by determining the applied orientation of a researcher’s works through searching for patents in the development of which the researcher was involved (e.g. Glänzel & Meyer 2003; Moed et al. 2004; Glänzel & Zhou 2011). In addition, we also decided to directly ex-amine the researcher’s works published in the S&T literature and categorise their content as “ap-plied” or “fundamental”.
Qu
est
for
fun
da
men
tal
un
de
rsta
nd
ing
?
Bohr Pasteur
Edison
Applied: consideration of use?
45
Therefore, to build that indicator, we relied on the following hypotheses:
the granted or submitted patents represent a general attitude of the applicant of whether or not he or she is driven by the aim to create application relevant results;
the S&T literature, mainly journals or proceedings, can be categorised according to their main scopes, into applied or fundamental;
the category of the journals in which the applicant uses to publish gives an indication of the ap-plied vs. fundamental orientation of his or her research.
If we accept these working hypotheses, we can calculate that indicator.
Furthermore, as some domains are more likely to lead to applicable relevant results, we decided to work panel by panel to manage each discipline’s idiosyncrasy.
1.10.2 Process of implementation
This indicator combines two measures: on the one hand, the number of granted or submitted patents mentioned in the PI’s CV. Although in fact these data represent the application of the PI’s previous research, its evaluation can indicate the general attitude of a researcher of whether or not he or she is driven by the aim to create application relevant results and, on the other hand, the information about the PI’s self-citations published in journals categorised as “applied” vs. “fundamental”. In this section, we describe the input data and the indicator implementation.
Input data
The data necessary to calculate the Pasteuresqueness indicator came from two sources: ERC and, from INIST - CNRS, a list of the S&T journals categorised by macro-domains, that is their core scien-tific domain(s), and constituting our authority file.
From ERC, we received the applicants’ CV. First, we received the data about successful project pro-posals and much later, after agreement from their authors, those about non-successful project pro-posals.
Indicator implementation
As stated previously, the first step of the implementation was the choice of a sample of project pro-posals on which to test and assess our methodology. That choice was mainly driven by the availabil-ity and consistency of the data supplied by the ERC. At first, we started with the 2007 Call for Start-ing Grant because that was the only available data. Later, when we received some data from the 2009 Call for Starting Grant, we switched to that sample for the following reasons:
in the meantime, the selection process had changed so our work based on that former procedure might not have been suited to the new one,
also, the ERC classification by panels changed too, again meaning our work employing the for-mer classification would not have fit the new panel structure.
At the time, that sample from the 2009 Call for Starting Grant contained only data from successful project proposals. Bearing in mind the scope of the DBF project, it was impossible to model the se-lection process by considering only that set of proposals. We absolutely needed a set of non-successful proposals – and in sufficient number – to characterise what set apart a good proposal from a weak one. As concomitantly, the ERC rules for personal data confidentiality were strength-ened, it became mandatory to ask and obtain the prior agreement of each involved Principal Investi-

46 Synthesis Report
gator (PI). It is easy to understand that this procedure was time consuming and that we obtained only a subset of the data. Needless to say, this new legal obligation brought a significant delay in the schedule of the DBF project.
To be consistent with the other indicators, we chose the same 6 panels with the same criteria as previously presented, especially the need to balance our sample by using panels from Life Sciences and from Physics & Engineering, as well as panels from basic domains and from applied domains. This led to the choice of the following panels:
LS3 - “Cellular and developmental biology”,
LS9 - “Applied life sciences and biotechnology”,
PE1 - “Mathematical foundations”,
PE2 - “Fundamental constituents of matter”,
PE7 - “Systems and communication engineering”,
PE8 - “Products and process engineering”.
This sample was constituted by 43 successful and 178 non-successful project proposals.
Figure 7: Methodology schema of the calculation of the Pasteuresqueness indicator
To make possible the calculation of pasteuresqueness, we produced for each successful and non-successful proposal different types of data:
extraction from the PI’s CV of the list of granted or submitted patents;
extraction from the PI’s CV of the title of the journals where he or she published;
characterisation of the journal publishing scientific and technological (S&T) information, accord-ing to their main scopes, into “fundamental” or “applied”.
ERCdatabase
Data pre-processing and text-mining
Externaldatabases
Patents submitted or
granted
List of journals publishing them
List of applicant’s
publications
Data extracted from applicant’s curriculum vitae
Journals and
their scopes
Classification of “basic” and “applied” journals
Cal
cula
tio
n o
f PA
STEU
RES
QU
ENES
S
ind
icat
or

47
The data was analysed on the one hand, by counting the number of granted or submitted patents by proposal and, on the other hand, by calculating the part of the PI’s self-publications in S&T journals tagged as “applied”, thus producing two sub indicators (cf. Figure 8).
Because the different CVs were supplied in PDF format, the first task was to convert them in plain text with the open-source tool pdftotext. To find the number of patents in each CV, we first thought of using a simple regular expression. Since the applicants had a great freedom in writing their CV, that solution turned out to be insufficient. So, to get around the problem, we searched for the occurrences of the character string “patent” and retrieved the surrounding lines in order to keep enough contextu-al information to make sense of what we extracted. Concerning the journal titles, we studied the pos-sibility to write a script to extract the references, to single them out and to locate the journal title if present. This happened to be more complex than first thought because of several things: imperfect conversion of the layout from the original PDF file, the huge heterogeneity allowed in the syntax of the references and the difficulty to separate journals from other document types like proceedings or dissertations. In consequence, we had no other choice than to do this task manually, which was time consuming. In addition, matching the journal titles extracted from the references to those from the authority file from INIST – CNRS was not automatic, then again because of the heterogeneity in the way these titles may be written.
Additionally, the “applied” vs. “fundamental” categorisation of the journal titles in the authority file was also an issue. First, we have to understand that the “applied” label of a journal is necessarily domain-dependent. For instance, a biologist’s publication in the “Journal of Mathematical Biology” may be considered as fundamental, a mathematician’s publication in the same journal may be considered as applied. This nuance was not taken into account in the indicator calculation and the S&T journal cat-egorisation was the same for all the studied ERC panels.
A second remark deals directly with the information source at the origin of the journal categorisation. In practice, we employed an INIST - CNRS in-house file giving an indexing of the S&T journals by macro-domains, so delivering an indication about the scientific discipline(s) concerned by the works usually published in each journal. Then, we reduced this information to a dichotomous categorisation by taking into account the “applied” or “fundamental” orientation of each macro-domain. To illustrate the difficulty encountered on this particular point, we present below two points by illustrating them with some examples:
These macro-domains present very different scientific granularity. For instance, we have “Der-matology”, a very specific domain, and “Geology”, a very general one. If it is easy to set “Derma-tology” in the “applied” category, it is a little bit more difficult to decide for “Geology”;
If we consider, for instance, the macro-domain “Computer science”, it could a priori seem specific enough and deserves to be in the “applied” category but, inside this domain we can have topics as “Cryptography” that strongly interacts with the “Number theory”, a domain classically consid-ered as fundamental. Conversely, the macro-domain “Mathematics”, that we can categorise as “fundamental”, contains disciplines like, for instance, “Scientific computation” that presents typi-cal characteristics of the category “applied”.
These fine distinctions were not — and could not be — taken into account in the calculation of this sub indicator, given the binary nature of the journal categorisation.
The final objective is to produce two sub indicators measuring:
The general attitude of the PI to be implicated in the creation of applicable relevant results;
The orientation of the PI’s published works towards “applied” research.

48 Synthesis Report
Two values, corresponding to the two defined sub indicators, are calculated by proposal. They are calculated as:
The enumeration of the patents to which the researcher contributed. This sub indicator is an
integer value included in the interval [0, [. Unfortunately, the number of patents is often very low, which involves a lack of accuracy of the related indicator;
The ratio of the researcher’s publications appearing in journals which content is categorised as applied. This sub indicator is a real number between 0 and 1.
The higher these values, the more the proposal can be expected to deal with a possible applicable issue. The expectation is to get the higher values of both sub indicators in the successful project proposals.
1.10.3 Results
The calculation of the Pasteuresqueness indicator allows a ranking of the different project proposals by decreasing value of each sub indicator. In Table 10Fehler! Verweisquelle konnte nicht gefun-den werden. we present the results for ERC panel LS3. For each project, there is the project identi-fier (assigned by ERC at submission time) and the value of each sub indicator. The seven successful proposals are highlighted in green. The results of the Pasteuresqueness sub indicators for all the six studied panels are presented in the annex.
The ranking we observe is misleading because the project proposals with a same score — and it is very obvious for a score of 0 — should be at the same rank, except we cannot represent them that way. The spread sheet software used the project ID as a secondary sort key which explains the cur-rent position of the proposals, although it has no particular meaning: for the ranking by number of patents, the 37
th proposal — the last one — is neither worse nor better than the 10
th proposal since
they share the very same score of 0 for this sub indicator.
Table 10: The 37 proposals from ERC panel LS3 ranked by decreasing value*
Project ID ERC panel Pasteuresqueness -
patents
Pasteuresqueness - applied part of PI's pub-
lications
243300 LS3 0 1
243316 LS3 0 1
242651 LS3 0 0.6896552
242993 LS3 0 0.6363636
243258 LS3 11 0.625
242958 LS3 0 0.6153846
243360 LS3 0 0.6
242914 LS3 3 0.5454545
242850 LS3 0 0.5
242976 LS3 0 0.5
243116 LS3 3 0.3333333
242010 LS3 0 0.3333333
243338 LS3 0 0.3157895
242617 LS3 0 0.2666667
242578 LS3 2 0.2142857
243378 LS3 2 0.1875
242570 LS3 0 0.1666667
243228 LS3 1 0.1428571

49
Project ID ERC panel Pasteuresqueness -
patents
Pasteuresqueness - applied part of PI's pub-
lications
242366 LS3 0 0.1428571
242630 LS3 2 0.1304348
242800 LS3 0 0.125
243267 LS3 1 0.1176471
241451 LS3 0 0.0769231
243022 LS3 1 0.0666667
242741 LS3 0 0.0526316
242389 LS3 0 0
242553 LS3 0 0
242620 LS3 0 0
242807 LS3 0 0
242816 LS3 0 0
243078 LS3 0 0
243087 LS3 0 0
243131 LS3 0 0
243194 LS3 0 0
243263 LS3 0 0
243305 LS3 0 0
243341 LS3 0 0
* The number of patents and the part of applied works published by the PI (Call 2009 Starting Grant)
The calculation procedure of pasteuresqueness can be extended to more panels. The necessary and sufficient condition is getting data from ERC containing the PI’s self-publications in an easily-exploitable and proper format to avoid the pitfalls of PDF files which are meant to be read by hu-mans, not processed by machines. After conversion in plain text, even in layout mode, they lack the necessary structure that would make it easy to extract the desired piece of information, as a refer-ence or a journal title.
If the data is supplied in a structured format as XML, the whole calculation procedure of pas-teuresqueness can be envisaged. It asks for supplementary efforts, namely:
automatising the procedure matching the journal titles where the PI has published and the cate-gorised (applied vs. fundamental) list of journals;
automatising the extraction of the occurrences of granted or submitted patent citations in the PI’s CV (supplied by ERC in a PDF file that we converted into a text file);
automatising the calculation of the two sub indicators.
Furthermore, from the obtained results we can stress that:
the S&T journal categorisation step deserves to be improved in order to introduce some nuances in the calculation of the sub indicator based on the PI’s self-references (see above, at the begin-ning of section 1.10.1 Indicator implementation);
the sub indicator based on the patent counting must be interpreted carefully; the absence of patents in a proposal allocated to very fundamental ERC panels cannot be compared with the same result gotten by a proposal belonging to the most applied ones.

50 Synthesis Report
1.10.4 Perspectives
If the approach we developed to calculate the Pasteuresqueness indicator sounds pragmatic, it shows a few weaknesses, in particular because of the journals categorisation step. Indeed, by using a binary categorisation “applied vs. fundamental”, it seems a priori easy to automatically transpose the journal's category to all the articles that are published in it. As we mentioned previously, this af-firmation does not reflect reality. The first difficulty is determining the criteria defining this binary cat-egorisation of the journals. If there are works dealing with a hierarchical tree classification, more or less detailed, of the scientific domains, the problem persists when we wish to identify which ones are definitively applied or completely fundamental.
In addition, the category of a journal can be variable, according to the scientific domain of each re-searcher that publishes work in it. Let us consider, for instance, the Biology domain as a priori fun-damental. All the journals classed in this domain get then the category “fundamental” as well as all the articles published in it. But things are not that simple. Indeed, if this remains true for the biolo-gists’ publications in these journals, that of an IT specialist who would bring a development software to the Biology should receive the “applied” category.
So, one alternative to calculate the Pasteuresqueness indicator, already presented in Roche et al. 2012], can be given by analysing the S&T literature citing the researcher’s publications. It is a real and pragmatic information source about the utilisation of his or her former work by the scientific community in new researches getting inspired by his or her results. A content analysis approach applied to this corpus gives us the means to appreciate the applicability of the researcher’s work achieved before the submission of his or her project proposal. This way, we can detect potentially applicable works whose results could be used by colleagues in their own research.
Concomitantly, in order to analyse more precisely the project itself, we focus on the S&T literature sharing citations with the project by building a corpus of publications having at least one common cited reference with the project bibliography. We hypothesised that all these publications can repre-sent works using partially the same foundations. A content analysis approach operated on this cor-pus allows us to qualify the degree of application of these works based on the same knowledge is-sues. Then, by analogy, we associate to the project the same degree of applicability.
Finally, the comparison of these two analyses allows us to define the evolution of the degree of ap-plicability of the works of a researcher from his or her former work to his or her submitted project.
The first results are encouraging but in its current state of development the procedure involved much human – especially expert – interventions. There is on-going work to validate the procedure results and to ease the workload related to its operationalisation.
51
1.11 Interdisciplinarity
The definition of the DBF indicators are all based on the characteristics of frontier research defined by the ERC High Level Expert Group in its report on frontier research: The European Challenge. The fourth one of these characteristics refers to the necessity of frontier research to bring together differ-ent disciplines.
1.11.1 Description of the indicator
The definition from the High Level Expert group:
Frontier research pursues questions irrespective of established disciplinary boundaries. It may well involve multi-, inter- or trans-disciplinary research that brings together researchers from different disciplinary backgrounds, with different theoretical and conceptual approach-es, techniques, methodologies and instrumentation, perhaps even different goals and moti-vations.
7
The terms multi-disciplinarity, inter-disciplinarity and trans-disciplinarity all refer to a different way in which disciplines can work together.
Multi-disciplinarity involves different scientific disciplines in the pursuit of a common task by working together without combining their skills; e.g. the treatment of a traumatised patient by a physician & a psychologist
Inter-disciplinarity involves different scientific disciplines in the pursuit of a common task by com-bining their skills; e.g. the development of a new X-ray apparatus developed together by doctors and engineers
Trans-disciplinarity involves skills other than scientific disciplines in the pursuit of a common task; e.g. the treatment of a traumatised patient in a hospital by physicians, psychologists, nursing staff and nutritionists
The initial task was to translate this characteristic of frontier research into an indicator that could be measured using a textual approach. For this reason it was decided to look for the extent to which different disciplines were involved in submitted proposals. For this purpose the overall term inter-disciplinarity was chosen.
1.11.2 Process of implementation
Initially there were two different methods chosen to operationalise the characteristic interdisciplinari-ty, see Figure 8. Both methods are based on looking at the occurrence of key words. The idea being that disciplines can be defined through their key words and that a proposal that contains key words from more than one discipline is more interdisciplinary. We used the panels and the panel de-scriptors as disciplines.
Indicator 1: The first method was designed to look at whether the proposals are inter-disciplinary according to the number of different ERC Panel key words that have been allocated in the proposal by the applicant.
7 EUROPEAN COMMISSION (2005) Frontier research: The European Challenge High Level Expert Group Report

52 Synthesis Report
Indicator 2: The second method involves a lexical analysis and extracted key words from the sum-maries of proposals in order to see whether the proposals use key words from different disciplines.
Figure 8: Methodological scheme of the calculation of the Interdisciplinarity indicator
Input data
For the measurement of the indicator we used proposal data of Starting Grants for the year 2009 (SG2009) and the definition of panels and related panel keywords. We used also additional infor-mation from ERC about proposals that have been classified as cross panel interdisciplinary.
For each proposal we had the following information in a table of proposal abstracts:
Proposal ID
Successful or not successful
Main panel
4 possible panel keywords
Free keyword given by the author
Acronym
Title
Abstract
Summary
The number of successful (SGA2009) and non-successful (NGA2009) Starting Grant applications was 130 and 628, respectively.
The ERC had defined 25 panels to cover all the fields of science, engineering and scholarship as-signed to three research domains: Social Sciences and Humanities (6 Panels: SH1-SH6), Physical Sciences and Engineering (10 Panels: PE1-PE10) and Life Sciences (9 Panels: LS1-LS9). We used only proposals with a main panel from Physical Sciences and Engineering (PE) and Life Sciences (LS). Social Sciences and Humanities were not taken into account, because bibliometric indicators are not very useful for these disciplines.
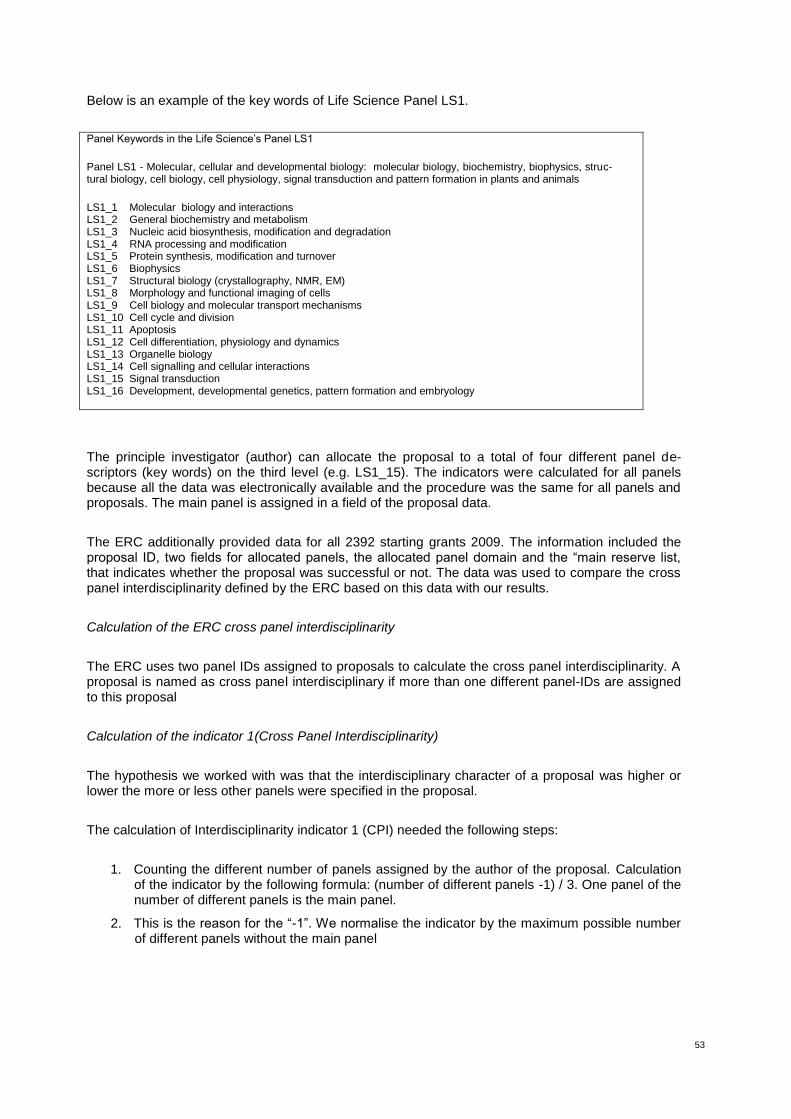
53
Below is an example of the key words of Life Science Panel LS1.
Panel Keywords in the Life Science’s Panel LS1
Panel LS1 - Molecular, cellular and developmental biology: molecular biology, biochemistry, biophysics, struc-tural biology, cell biology, cell physiology, signal transduction and pattern formation in plants and animals
LS1_1 Molecular biology and interactions LS1_2 General biochemistry and metabolism LS1_3 Nucleic acid biosynthesis, modification and degradation LS1_4 RNA processing and modification LS1_5 Protein synthesis, modification and turnover LS1_6 Biophysics LS1_7 Structural biology (crystallography, NMR, EM) LS1_8 Morphology and functional imaging of cells LS1_9 Cell biology and molecular transport mechanisms LS1_10 Cell cycle and division LS1_11 Apoptosis LS1_12 Cell differentiation, physiology and dynamics LS1_13 Organelle biology LS1_14 Cell signalling and cellular interactions LS1_15 Signal transduction LS1_16 Development, developmental genetics, pattern formation and embryology
The principle investigator (author) can allocate the proposal to a total of four different panel de-scriptors (key words) on the third level (e.g. LS1_15). The indicators were calculated for all panels because all the data was electronically available and the procedure was the same for all panels and proposals. The main panel is assigned in a field of the proposal data.
The ERC additionally provided data for all 2392 starting grants 2009. The information included the proposal ID, two fields for allocated panels, the allocated panel domain and the “main reserve list, that indicates whether the proposal was successful or not. The data was used to compare the cross panel interdisciplinarity defined by the ERC based on this data with our results.
Calculation of the ERC cross panel interdisciplinarity
The ERC uses two panel IDs assigned to proposals to calculate the cross panel interdisciplinarity. A proposal is named as cross panel interdisciplinary if more than one different panel-IDs are assigned to this proposal
Calculation of the indicator 1(Cross Panel Interdisciplinarity)
The hypothesis we worked with was that the interdisciplinary character of a proposal was higher or lower the more or less other panels were specified in the proposal.
The calculation of Interdisciplinarity indicator 1 (CPI) needed the following steps:
1. Counting the different number of panels assigned by the author of the proposal. Calculation of the indicator by the following formula: (number of different panels -1) / 3. One panel of the number of different panels is the main panel.
2. This is the reason for the “-1”. We normalise the indicator by the maximum possible number of different panels without the main panel
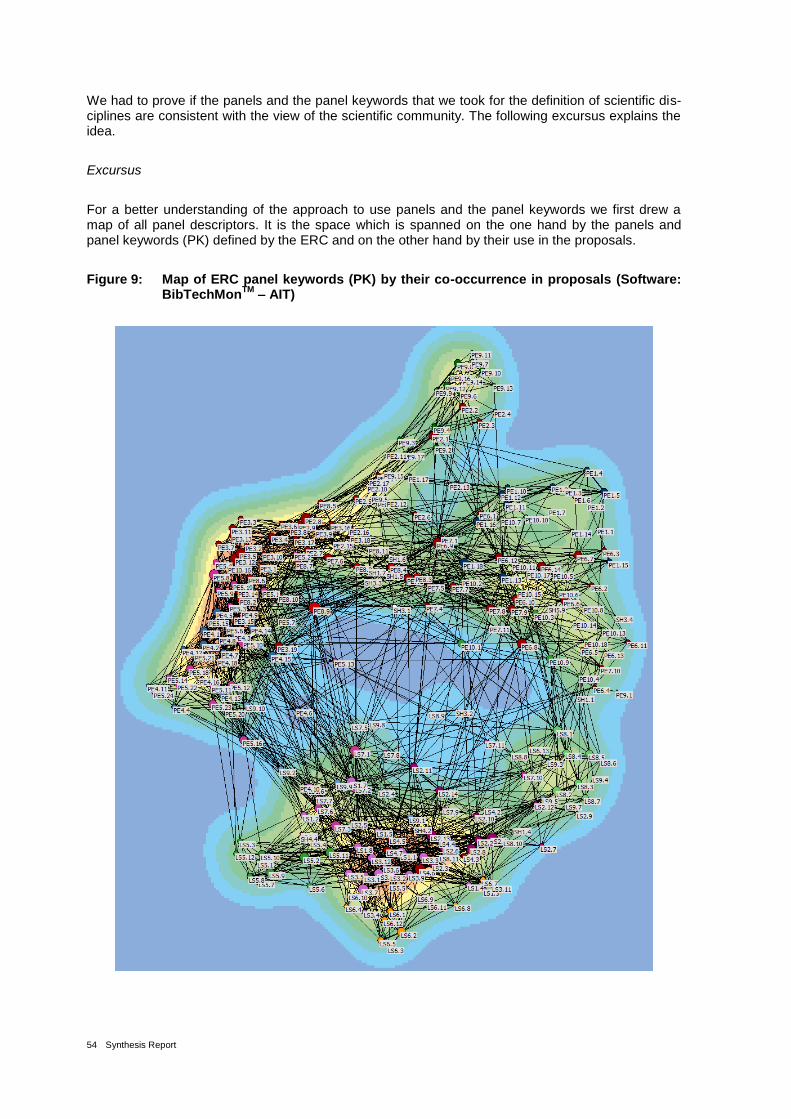
54 Synthesis Report
We had to prove if the panels and the panel keywords that we took for the definition of scientific dis-ciplines are consistent with the view of the scientific community. The following excursus explains the idea.
Excursus
For a better understanding of the approach to use panels and the panel keywords we first drew a map of all panel descriptors. It is the space which is spanned on the one hand by the panels and panel keywords (PK) defined by the ERC and on the other hand by their use in the proposals.
Figure 9: Map of ERC panel keywords (PK) by their co-occurrence in proposals (Software: BibTechMon
TM – AIT)
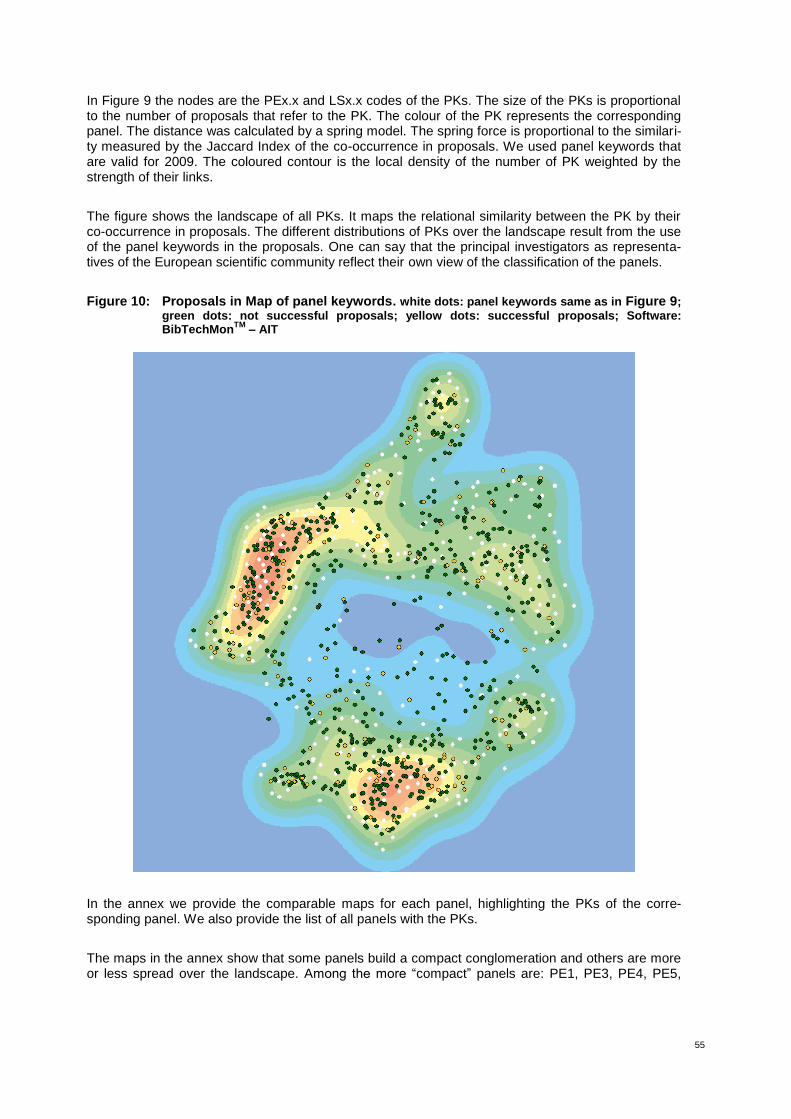
55
In Figure 9 the nodes are the PEx.x and LSx.x codes of the PKs. The size of the PKs is proportional to the number of proposals that refer to the PK. The colour of the PK represents the corresponding panel. The distance was calculated by a spring model. The spring force is proportional to the similari-ty measured by the Jaccard Index of the co-occurrence in proposals. We used panel keywords that are valid for 2009. The coloured contour is the local density of the number of PK weighted by the strength of their links.
The figure shows the landscape of all PKs. It maps the relational similarity between the PK by their co-occurrence in proposals. The different distributions of PKs over the landscape result from the use of the panel keywords in the proposals. One can say that the principal investigators as representa-tives of the European scientific community reflect their own view of the classification of the panels.
Figure 10: Proposals in Map of panel keywords. white dots: panel keywords same as in Figure 9;
green dots: not successful proposals; yellow dots: successful proposals; Software: BibTechMon
TM – AIT
In the annex we provide the comparable maps for each panel, highlighting the PKs of the corre-sponding panel. We also provide the list of all panels with the PKs.
The maps in the annex show that some panels build a compact conglomeration and others are more or less spread over the landscape. Among the more “compact” panels are: PE1, PE3, PE4, PE5,
56 Synthesis Report
PE9, LS2, LS3, LS5 and LS6; more or less spread clusters are: PE2, PE6, PE7, PE8, PE10, LS1, LS4, LS7, LS8 and LS9.
This means that for indicator 1 proposals with a main panel or panel keywords from the compact conglomerations indicate the interdisciplinary character better than proposals that refer to the spread ones. For example, let us assume that we have a proposal with the main panel LS7 and the keyword LS7.5: “Toxicology”. The indicator 1 would give us the lowest value of interdisciplinarity, but the panel keyword “Toxicology” is somewhere between life sciences and PE5 “Materials and Synthesis: mate-rials synthesis, structure-properties relations, functional and advanced materials, molecular architec-ture and organic chemistry”. The proposal of our example could have a high interdisciplinary charac-ter although the indicator 1 indicates a low interdisciplinarity.
We have visualised the positions of proposals in the panel keyword map (see Figure 10). The pro-posals are positioned close to their assigned panel keywords. A proposal with only one panel key-word has a very small distance to its panel keyword dot. A cross disciplinary proposal with, for ex-ample, two panel keywords (one from LS and one from PE) is positioned somewhere in between. Proposals that are positioned in circles around the centre are strong cross disciplinary. There are just a few successful ones. Such a map helps to categorise proposals better as cross disciplinary in the context of all panel keywords and all proposals.
Calculation of the indicator 2 (Keyword based Indicator)
The hypothesis we worked with was that the interdisciplinary character of a proposal was higher or lower the more or less keywords from other disciplines than the home discipline occurred in the summary of the proposal.
The calculation of Interdisciplinarity indicator 2 needed the following steps:
1. Extracting all phrasemes (keywords with several single terms such as “gene expression”) from the summaries of the proposals by automated indexing.
2. Calculating the probability with which a phraseme occurs per panel.
3. Each word gets the home panel as the one associated with the highest probability of occur-rence.
4. Count of the number of home panel keywords (HPK) and the number of not home panel keywords (nHPK).
5. Calculation of the indicator by the following formula: (HPK)/(nHPK+HPK) in per cent. Note that higher values of the indicator denote a low level of interdisciplinarity, while low values denote a high level of interdisciplinarity
1.11.3 Results
Results for ERC cross panel interdisciplinarity
The success rate of the 2009 starting Grants proposals was 10.2 per cent: this means that 245 out of 2392 proposals were successful. We have a lower share of 9.1 per cent successful (130 of 1304) proposals that are understood as cross panel interdisciplinary in comparison to a share of 12.0 per cent (115 of 843) proposals with only one panel ID. This approach to measure interdisciplinarity de-fines 60 per cent (1434 of 2392) of all proposals as interdisciplinary and 40 per cent (958 of 2392) as disciplinary.
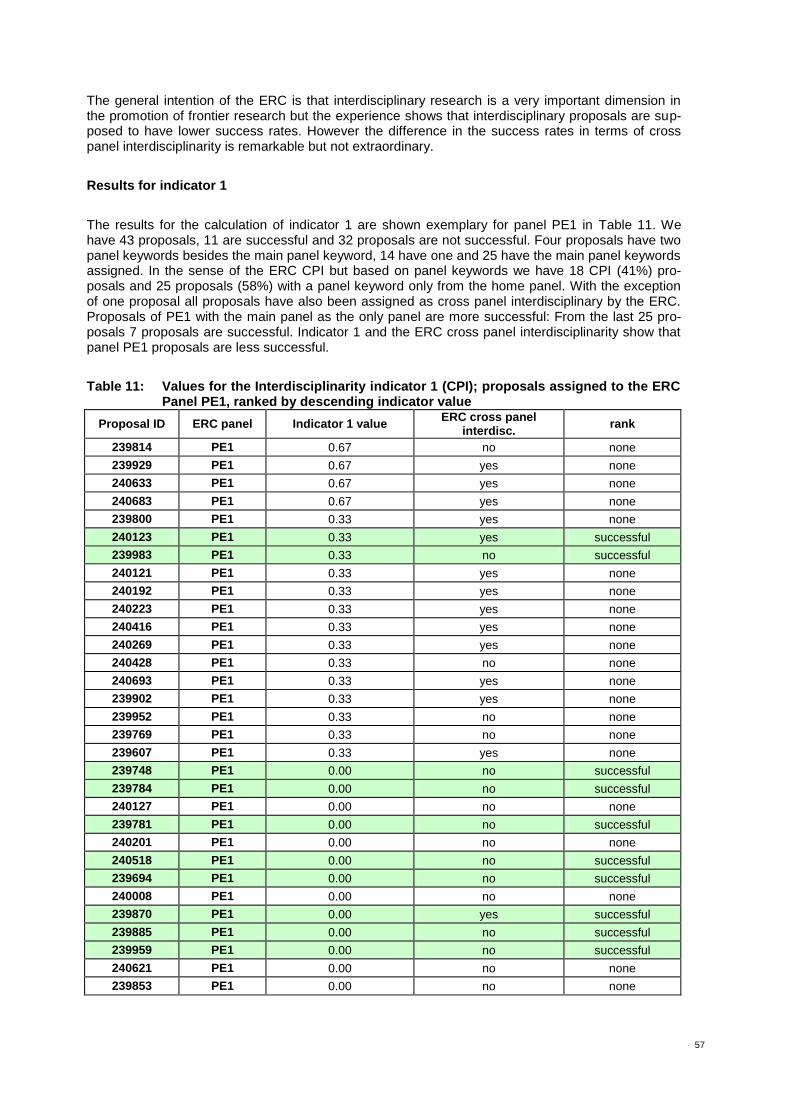
57
The general intention of the ERC is that interdisciplinary research is a very important dimension in the promotion of frontier research but the experience shows that interdisciplinary proposals are sup-posed to have lower success rates. However the difference in the success rates in terms of cross panel interdisciplinarity is remarkable but not extraordinary.
Results for indicator 1
The results for the calculation of indicator 1 are shown exemplary for panel PE1 in Table 11. We have 43 proposals, 11 are successful and 32 proposals are not successful. Four proposals have two panel keywords besides the main panel keyword, 14 have one and 25 have the main panel keywords assigned. In the sense of the ERC CPI but based on panel keywords we have 18 CPI (41%) pro-posals and 25 proposals (58%) with a panel keyword only from the home panel. With the exception of one proposal all proposals have also been assigned as cross panel interdisciplinary by the ERC. Proposals of PE1 with the main panel as the only panel are more successful: From the last 25 pro-posals 7 proposals are successful. Indicator 1 and the ERC cross panel interdisciplinarity show that panel PE1 proposals are less successful.
Table 11: Values for the Interdisciplinarity indicator 1 (CPI); proposals assigned to the ERC Panel PE1, ranked by descending indicator value
Proposal ID ERC panel Indicator 1 value ERC cross panel
interdisc. rank
239814 PE1 0.67 no none
239929 PE1 0.67 yes none
240633 PE1 0.67 yes none
240683 PE1 0.67 yes none
239800 PE1 0.33 yes none
240123 PE1 0.33 yes successful
239983 PE1 0.33 no successful
240121 PE1 0.33 yes none
240192 PE1 0.33 yes none
240223 PE1 0.33 yes none
240416 PE1 0.33 yes none
240269 PE1 0.33 yes none
240428 PE1 0.33 no none
240693 PE1 0.33 yes none
239902 PE1 0.33 yes none
239952 PE1 0.33 no none
239769 PE1 0.33 no none
239607 PE1 0.33 yes none
239748 PE1 0.00 no successful
239784 PE1 0.00 no successful
240127 PE1 0.00 no none
239781 PE1 0.00 no successful
240201 PE1 0.00 no none
240518 PE1 0.00 no successful
239694 PE1 0.00 no successful
240008 PE1 0.00 no none
239870 PE1 0.00 yes successful
239885 PE1 0.00 no successful
239959 PE1 0.00 no successful
240621 PE1 0.00 no none
239853 PE1 0.00 no none
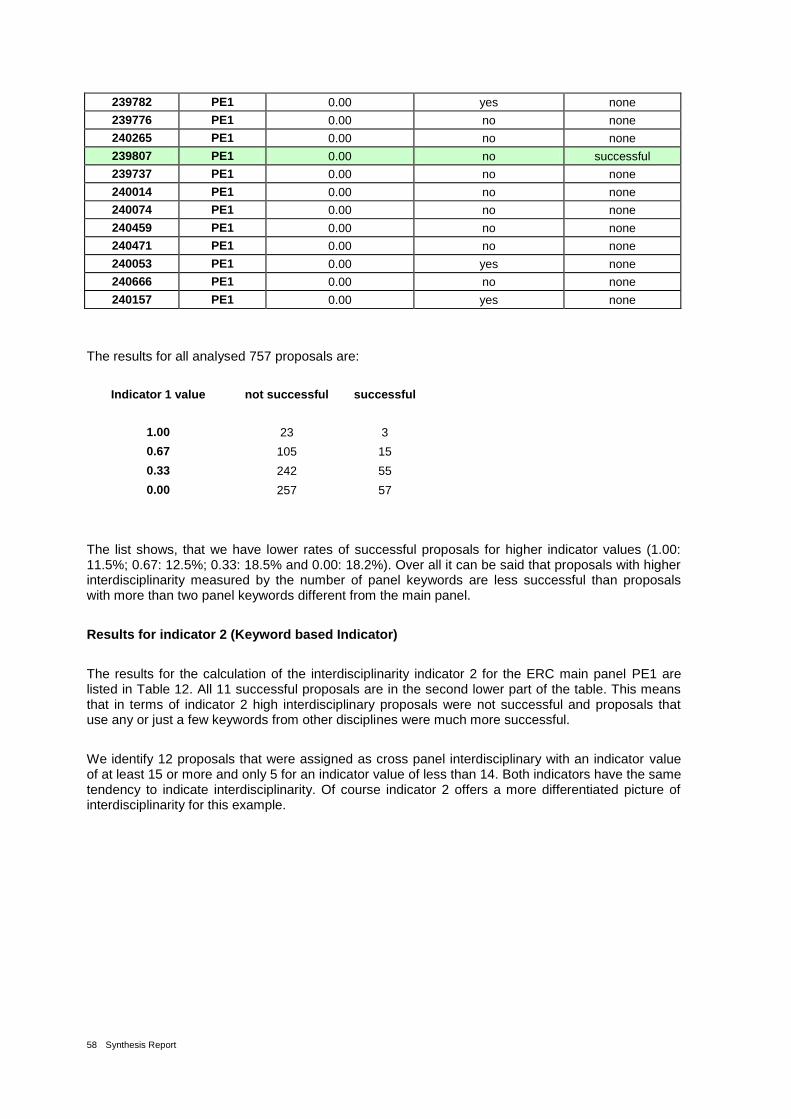
58 Synthesis Report
239782 PE1 0.00 yes none
239776 PE1 0.00 no none
240265 PE1 0.00 no none
239807 PE1 0.00 no successful
239737 PE1 0.00 no none
240014 PE1 0.00 no none
240074 PE1 0.00 no none
240459 PE1 0.00 no none
240471 PE1 0.00 no none
240053 PE1 0.00 yes none
240666 PE1 0.00 no none
240157 PE1 0.00 yes none
The results for all analysed 757 proposals are:
Indicator 1 value not successful successful
1.00 23 3
0.67 105 15
0.33 242 55
0.00 257 57
The list shows, that we have lower rates of successful proposals for higher indicator values (1.00: 11.5%; 0.67: 12.5%; 0.33: 18.5% and 0.00: 18.2%). Over all it can be said that proposals with higher interdisciplinarity measured by the number of panel keywords are less successful than proposals with more than two panel keywords different from the main panel.
Results for indicator 2 (Keyword based Indicator)
The results for the calculation of the interdisciplinarity indicator 2 for the ERC main panel PE1 are listed in Table 12. All 11 successful proposals are in the second lower part of the table. This means that in terms of indicator 2 high interdisciplinary proposals were not successful and proposals that use any or just a few keywords from other disciplines were much more successful.
We identify 12 proposals that were assigned as cross panel interdisciplinary with an indicator value of at least 15 or more and only 5 for an indicator value of less than 14. Both indicators have the same tendency to indicate interdisciplinarity. Of course indicator 2 offers a more differentiated picture of interdisciplinarity for this example.

59
Table 12: Values for the Interdisciplinarity indicator 2 (high values mean lower interdiscipli-narity), proposals assigned to the ERC Panel PE1
Proposal ID ERC panel Indicator 2 value ERC cross panel
interdisc. rank
240683 PE1 44 yes none
240192 PE1 43 yes none
240053 PE1 40 yes none
240459 PE1 40 no none
239737 PE1 38 no none
239853 PE1 27 no none
240428 PE1 26 no none
240014 PE1 25 no none
240416 PE1 25 yes none
240121 PE1 22 yes none
240633 PE1 22 yes none
240269 PE1 21 yes none
239782 PE1 17 yes none
239814 PE1 17 no none
239776 PE1 16 no none
240693 PE1 16 yes none
240471 PE1 16 no none
240223 PE1 15 yes none
239929 PE1 15 yes none
239607 PE1 15 yes none
239983 PE1 14 no successful
239902 PE1 14 yes none
240621 PE1 14 no none
239952 PE1 13 no none
240157 PE1 13 yes none
239885 PE1 12 no successful
239769 PE1 12 no none
240518 PE1 12 no successful
239807 PE1 10 no successful
240265 PE1 10 no none
239870 PE1 9 yes successful
239694 PE1 8 no successful
239748 PE1 7 no successful
239800 PE1 7 yes none
240008 PE1 7 no none
240074 PE1 7 no none
239959 PE1 6 no successful
240666 PE1 6 no none
239784 PE1 6 no successful
240127 PE1 5 no none
240201 PE1 5 no none
240123 PE1 3 yes successful
239781 PE1 0 no successful
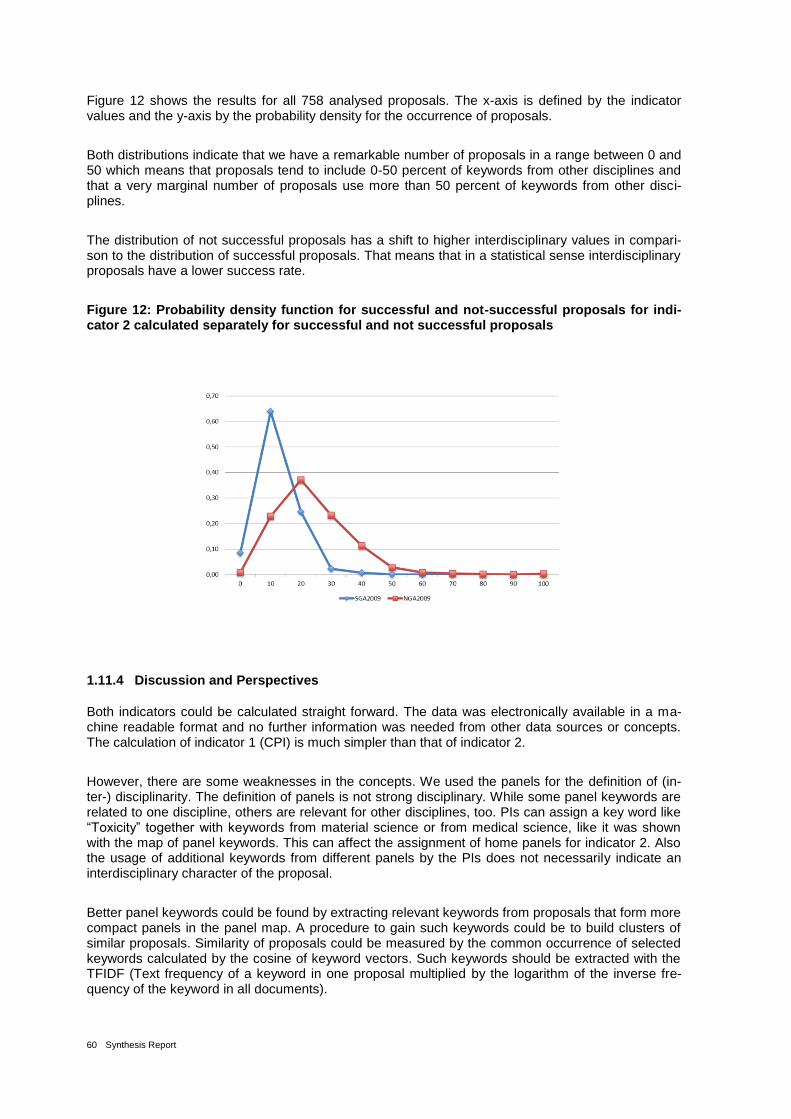
60 Synthesis Report
Figure 12 shows the results for all 758 analysed proposals. The x-axis is defined by the indicator values and the y-axis by the probability density for the occurrence of proposals.
Both distributions indicate that we have a remarkable number of proposals in a range between 0 and 50 which means that proposals tend to include 0-50 percent of keywords from other disciplines and that a very marginal number of proposals use more than 50 percent of keywords from other disci-plines.
The distribution of not successful proposals has a shift to higher interdisciplinary values in compari-son to the distribution of successful proposals. That means that in a statistical sense interdisciplinary proposals have a lower success rate.
Figure 12: Probability density function for successful and not-successful proposals for indi-cator 2 calculated separately for successful and not successful proposals
1.11.4 Discussion and Perspectives
Both indicators could be calculated straight forward. The data was electronically available in a ma-chine readable format and no further information was needed from other data sources or concepts. The calculation of indicator 1 (CPI) is much simpler than that of indicator 2.
However, there are some weaknesses in the concepts. We used the panels for the definition of (in-ter-) disciplinarity. The definition of panels is not strong disciplinary. While some panel keywords are related to one discipline, others are relevant for other disciplines, too. PIs can assign a key word like “Toxicity” together with keywords from material science or from medical science, like it was shown with the map of panel keywords. This can affect the assignment of home panels for indicator 2. Also the usage of additional keywords from different panels by the PIs does not necessarily indicate an interdisciplinary character of the proposal.
Better panel keywords could be found by extracting relevant keywords from proposals that form more compact panels in the panel map. A procedure to gain such keywords could be to build clusters of similar proposals. Similarity of proposals could be measured by the common occurrence of selected keywords calculated by the cosine of keyword vectors. Such keywords should be extracted with the TFIDF (Text frequency of a keyword in one proposal multiplied by the logarithm of the inverse fre-quency of the keyword in all documents).

61
We used all extracted keywords from proposals for the calculation of indicator 2. The relevant key-words for the assignment of home panels were selected by the TFIDF on the panel level. The as-signment of a home panel to keywords that are relevant for different disciplines (like “cell”) and do not really indicate interdisciplinary usage should not be taken into account. The Gini index that measures the concentration of a distribution would be appropriate to fulfil that task.
Nevertheless, it might have an advantage to use all keywords. It is obvious that some communities of scientists use similar combinations of terms that have no specific disciplinary meaning but the com-bination of the use can be characteristic for a discipline. Such terms occur more often in this disci-pline and due to their higher probability of occurrence they are tagged with the same home panel. If such sets of not meaningful terms occur in a proposal, it could be an additional indicator for the inter-disciplinary character. We made some tests with a threshold to remove terms with lower frequencies but we obtained the highest significance in the econometric decision model by using all keywords.
We have no information about the weight of the 4 possible panel keywords that are given in one proposal. Maybe some of the panel keywords in one proposal are more or less important for the pro-posed research work of the PI.
Another point that could affect the indicator 2 values is the number of keywords that were extracted from one proposal. The probability to use more home panel keywords from other panels could be higher if there is a longer text.
The indicator 2 values just indicate interdisciplinarity in a statistical sense. The application for individ-ual proposals needs some verification:
a. Consistent definition of panels and panel descriptors by the ERC b. Selection of disciplinary specific keywords by improving the ERC stop word list. c. A test phase with a verification of the interdisciplinary character of single proposals based
on assigned keywords and home panels in comparison to the content of the proposal fol-lowed by the improvement of the calculation of the indicator.
The software BibTechMonTM
is a powerful tool to assist the calculation of indicators. The interactive visualisation allows the graphical selection of objects and the retrieval of information such as pro-posal data, indicators etc.
62 Synthesis Report
Phase 1 - Reviewing the indicators
There are two ways of reviewing the indicators. The first is to look at what the results of the indicator calculations mean in terms of what is taking place in the panels and the second is to look at the pro-cess and whether this could be improved or done differently. Having said this, the DBF project never aimed to review the indicators at this stage. The project required the indicator’s values in order to progress to the next stage and work with the econometric model to compare the panels’ decisions with the results of the DBF indicators. However, members of the ERCEA were very interested in what the tables of indicator values mean for ERC, the proposal selection process and the types of projects being selected.
1.12 Interpreting the results
The calculation of the indicators resulted in a table for each indicator and each panel calculated. Examples of these tables are in the results section of the description of each individual indicator. These examples show that the results are different for the individual indicators. The main results for each of the examples are:
Innovativeness: 5 of the 7 successful proposals are in the top 8 positions (panel LS3).
Timeliness: in this example, 3 of 7 successful proposals are in the top 7 positions, 3 are in the bottom 11 positions and the last one is at the 15
th position, roughly in the middle of the ranking
(LS3).
Risk: the 4 successful proposals (from the panel PE7) are spread across the table with one close to the bottom
Pasteuresqueness: in this example (from the panel LS3) the successful proposals are also spread across the table.
Interdisciplinarity (2): In a list of descending sorted proposals for interdisciplinarity from Panel PE1 there is only one successful proposal ranked at place 21. All other 10 successful proposals are in the range from 22 to 43 within the lowest interdisciplinary ranked ones.
We revealed that in only one case a high score from our indicators match with positive ERC funding decisions – innovativeness. Interdisciplinarity revealed the opposite, that disciplinary proposals were more likely to be financed. For the other three indictors there was no match between the successful proposals and the DBF indicator values. This could indicate several things. It could mean that the panels are not choosing proposals that have the characteristics timeliness, pasteuresqueness and risk. It could, however, also mean that the DBF indicator does not adequately measure the concept and therefore there is no match. As has been mentioned before, interpreting the result at this stage of the project was not the main focus of DBF especially due to the fact that a proper analysis of what this would mean for project selection and identifying frontier research would have meant actually going into the proposals and evaluating the content of the proposal to see if there was any difference between proposals that obtained a high DBF value and those that did not. This was not possible during the DBF project as the project team did not have access to the full proposals.
The project team at CNRS tried to see if they could see why there was a difference between the proposals selected by ERC and those with a high DBF score by looking at the proposal abstracts. However, the abstracts did not really offer enough detail to be able to see what the differences could be. To understand better what is really going on it would be necessary to work with the panels more closely and to verify what is going on and to find out whether for instance, if the panels received lists of the values for each individual indicator it might help them to see proposals in a different light than before. This would certainly be a way in which ERC could take the DBF project further in the future.

63
1.13 The process – improving the indicators
One of the main reasons for reviewing the indicators was to look at whether and in what way they could be implemented by ERC. This section looks at this issue. It draws both on the analysis of the individual indicators and on the results of an internal workshop held in Vienna, October 15-16 2012, where the indicators were analysed and compared with each other. The main focused of the work-shop was to look at the indicators from a practical perspective. The project team reviewed the indica-tors according to three main questions:
How practical was and would be the indicator to implement?
What would be necessary to calculate the indicator more easily?
What could be done next to improve the indicator and its calculation?
The tables below summarise the main results of this workshop. Each indicator is briefly described according to its definition and its “validity”, that is how the definition was validated or put into practice. Finally, statements follow the questions.
Innovativeness
Innovativeness was an indicator that was complex to calculate and needed experts for verification of the data. This could be improved by developing text-mining tools.
Table 13: Innovativeness – review and outlook
Definition Infers the innovative degree of a proposal through the dynamic change of the scientific landscape corresponding to the proposal’s allocated panel
Validity It is based on the terminological representation of the content of each proposal embedded in the global representation of the related ERC panel
Practicability Currently, it wasn’t easy to implement due to the work load related to the text mining steps
What would be necessary to calculate it easily?
The development/introduction of a computer aided terminological extraction tool to decrease the expertise workload
What could be done next? Further development of the text mining step on the bibliographic refer-ences (can be done before) and the text mining step on the proposals
Timeliness
Timeliness was an easy indicator to calculate once the data was available and had been prepared. Fu-
ture improvement of the calculation of this indicator could be through requiring the PIs to submit their
references in a specific form.
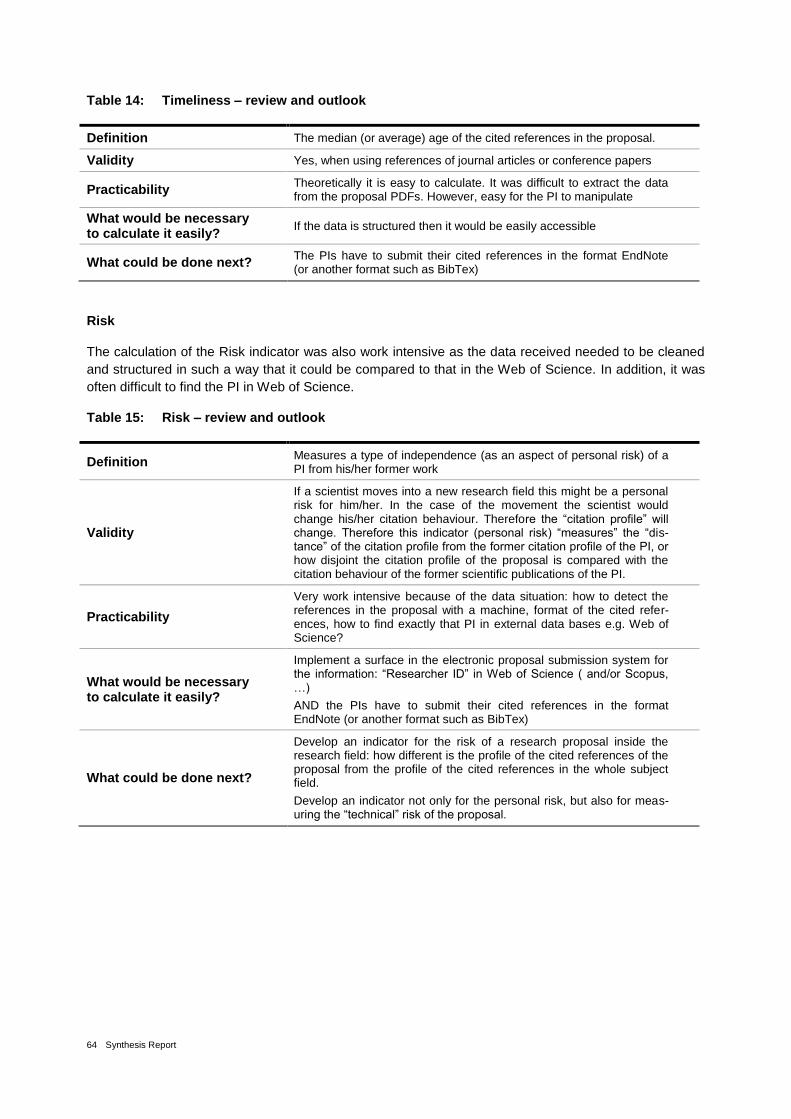
64 Synthesis Report
Table 14: Timeliness – review and outlook
Definition The median (or average) age of the cited references in the proposal.
Validity Yes, when using references of journal articles or conference papers
Practicability Theoretically it is easy to calculate. It was difficult to extract the data from the proposal PDFs. However, easy for the PI to manipulate
What would be necessary to calculate it easily?
If the data is structured then it would be easily accessible
What could be done next? The PIs have to submit their cited references in the format EndNote (or another format such as BibTex)
Risk
The calculation of the Risk indicator was also work intensive as the data received needed to be cleaned
and structured in such a way that it could be compared to that in the Web of Science. In addition, it was
often difficult to find the PI in Web of Science.
Table 15: Risk – review and outlook
Definition Measures a type of independence (as an aspect of personal risk) of a PI from his/her former work
Validity
If a scientist moves into a new research field this might be a personal risk for him/her. In the case of the movement the scientist would change his/her citation behaviour. Therefore the “citation profile” will change. Therefore this indicator (personal risk) “measures” the “dis-tance” of the citation profile from the former citation profile of the PI, or how disjoint the citation profile of the proposal is compared with the citation behaviour of the former scientific publications of the PI.
Practicability
Very work intensive because of the data situation: how to detect the references in the proposal with a machine, format of the cited refer-ences, how to find exactly that PI in external data bases e.g. Web of Science?
What would be necessary to calculate it easily?
Implement a surface in the electronic proposal submission system for the information: “Researcher ID” in Web of Science ( and/or Scopus, …)
AND the PIs have to submit their cited references in the format EndNote (or another format such as BibTex)
What could be done next?
Develop an indicator for the risk of a research proposal inside the research field: how different is the profile of the cited references of the proposal from the profile of the cited references in the whole subject field.
Develop an indicator not only for the personal risk, but also for meas-uring the “technical” risk of the proposal.
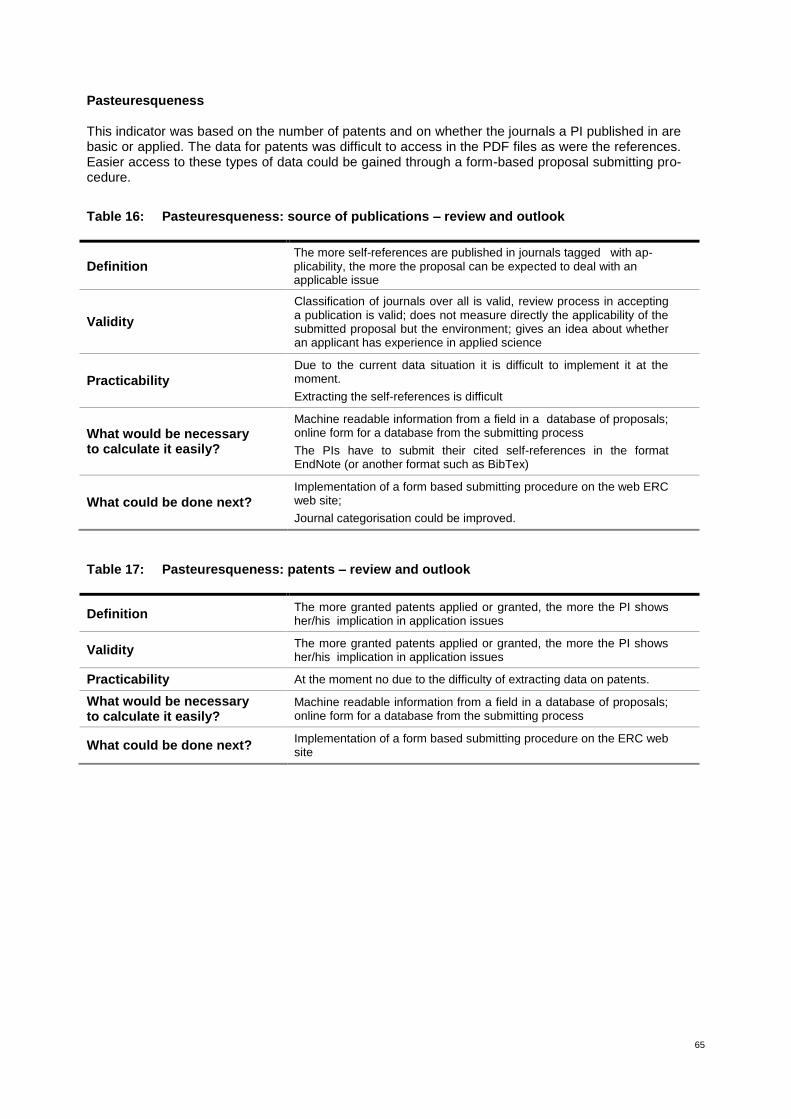
65
Pasteuresqueness
This indicator was based on the number of patents and on whether the journals a PI published in are basic or applied. The data for patents was difficult to access in the PDF files as were the references. Easier access to these types of data could be gained through a form-based proposal submitting pro-cedure.
Table 16: Pasteuresqueness: source of publications – review and outlook
Definition The more self-references are published in journals tagged with ap-plicability, the more the proposal can be expected to deal with an applicable issue
Validity
Classification of journals over all is valid, review process in accepting a publication is valid; does not measure directly the applicability of the submitted proposal but the environment; gives an idea about whether an applicant has experience in applied science
Practicability
Due to the current data situation it is difficult to implement it at the moment.
Extracting the self-references is difficult
What would be necessary to calculate it easily?
Machine readable information from a field in a database of proposals; online form for a database from the submitting process
The PIs have to submit their cited self-references in the format EndNote (or another format such as BibTex)
What could be done next?
Implementation of a form based submitting procedure on the web ERC web site;
Journal categorisation could be improved.
Table 17: Pasteuresqueness: patents – review and outlook
Definition The more granted patents applied or granted, the more the PI shows her/his implication in application issues
Validity The more granted patents applied or granted, the more the PI shows her/his implication in application issues
Practicability At the moment no due to the difficulty of extracting data on patents.
What would be necessary to calculate it easily?
Machine readable information from a field in a database of proposals; online form for a database from the submitting process
What could be done next? Implementation of a form based submitting procedure on the ERC web site
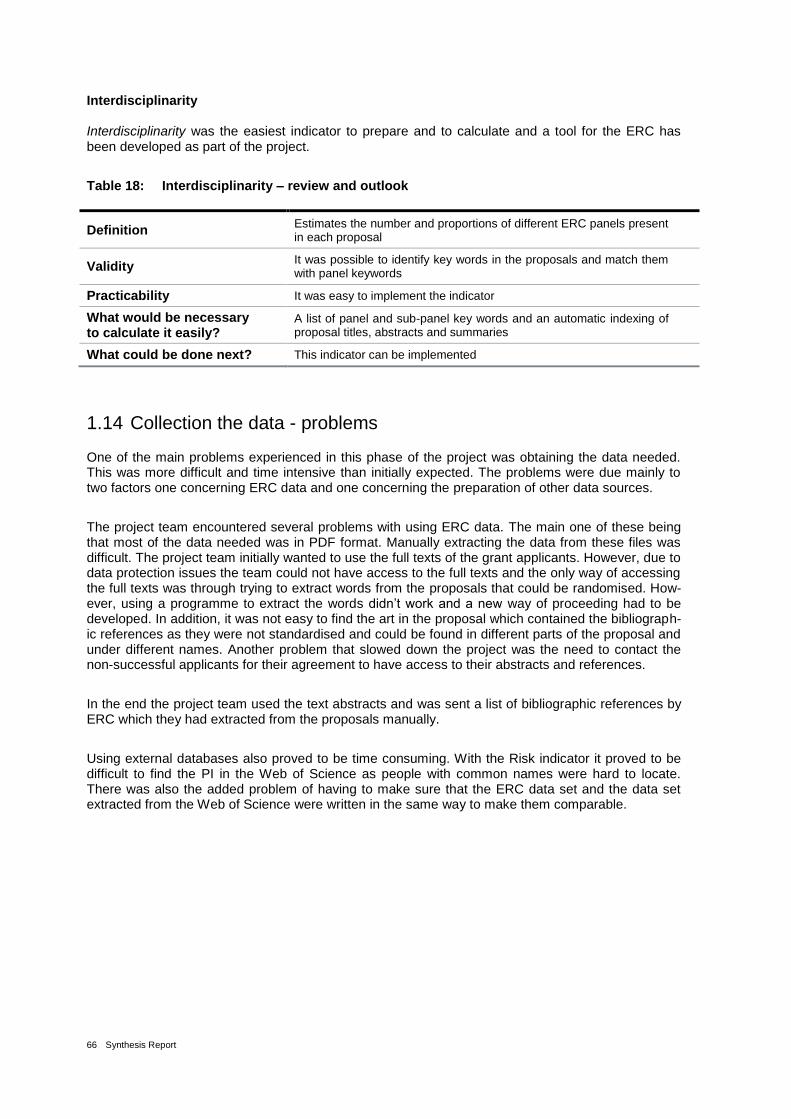
66 Synthesis Report
Interdisciplinarity
Interdisciplinarity was the easiest indicator to prepare and to calculate and a tool for the ERC has been developed as part of the project.
Table 18: Interdisciplinarity – review and outlook
Definition Estimates the number and proportions of different ERC panels present in each proposal
Validity It was possible to identify key words in the proposals and match them with panel keywords
Practicability It was easy to implement the indicator
What would be necessary to calculate it easily?
A list of panel and sub-panel key words and an automatic indexing of proposal titles, abstracts and summaries
What could be done next? This indicator can be implemented
1.14 Collection the data - problems
One of the main problems experienced in this phase of the project was obtaining the data needed. This was more difficult and time intensive than initially expected. The problems were due mainly to two factors one concerning ERC data and one concerning the preparation of other data sources.
The project team encountered several problems with using ERC data. The main one of these being that most of the data needed was in PDF format. Manually extracting the data from these files was difficult. The project team initially wanted to use the full texts of the grant applicants. However, due to data protection issues the team could not have access to the full texts and the only way of accessing the full texts was through trying to extract words from the proposals that could be randomised. How-ever, using a programme to extract the words didn’t work and a new way of proceeding had to be developed. In addition, it was not easy to find the art in the proposal which contained the bibliograph-ic references as they were not standardised and could be found in different parts of the proposal and under different names. Another problem that slowed down the project was the need to contact the non-successful applicants for their agreement to have access to their abstracts and references.
In the end the project team used the text abstracts and was sent a list of bibliographic references by ERC which they had extracted from the proposals manually.
Using external databases also proved to be time consuming. With the Risk indicator it proved to be difficult to find the PI in the Web of Science as people with common names were hard to locate. There was also the added problem of having to make sure that the ERC data set and the data set extracted from the Web of Science were written in the same way to make them comparable.

67
Phase 2 - Effects of frontier research on selection out-come of ERC proposals
In Phase 2, the project shifts attention to the effects of frontier research on the selection outcome of proposals submitted to ERC. We aim to investigate ERC peer-review process with respect to the main objective of ERC, which is to support research reflecting scientific excellence at the highest international level, standing at the forefront of creating new knowledge (see Section 2). In this sense, after we have comprehensively discussed in Phase 1 how we propose to measure different aspects of frontier research by bibliometric indicators, Phase 2 focuses on the question whether ERC review process is able to detect frontier research and its different aspects in grant proposals, based on the indicators for frontier research that we have developed and described in Phase 1.
In implementing these indicators, comprehensive data preparation procedures have been accom-plished to calculate indicator values for a number of proposals. With this, it was possible to produce a comparison of the successful proposals selected by the peer review panels with a ranking of the proposals on an indicator by indicator basis according to the indicators developed during this project. As can be seen from the descriptive analysis in Phase 1, with some indicators the match between selected proposals and our indicator ranking seems high and with some it seems rather low, i.e. for some indicators we find a non-random distribution of successful vs. non-successful proposals over different indicator values, while for other indicators successful and non-successful proposals seem to be randomly distributed across different indicator values.
While the results of this descriptive analysis from Phase 1 are quite interesting, we cannot say too much about the statistical significance and inference of these findings as well as on the average selection outcome of a proposal given a specific value for each indicator under consideration. Thus, this section of the report focuses on investigating the relationship between our indicators for frontier research, i.e. the indicator values that we observe for a number of proposals, and the selection out-come of a set of proposals in a statistical sense. By this, we aim to compare the selections made by specific peer review panels with the indicators developed. The main question here is does the fron-tier research character of a proposal indeed affect the selection outcome by the peer review panel in a statistical sense?
Further, Phase 2 aims to rank the proposals according to a specific selection probability – that can be derived jointly from our indicators for frontier research – with the observed selection outcome of proposals. By this, we are able to pick up proposals that, for instance, show a high frontier research character with respect to our indicators, but actually have not been selected. The detection of such proposals may be an important exercise to gain further insights into which mechanisms are at force in review panels, and what other determinants than the frontier research character of a proposal may play a role for its selection outcome. The same can be done vice-versa: we may detect proposals that show a low selection probability given its frontier research character according to our indicators, but actually have been selected, and therefore may be subject to more in-depth analyses given their selection outcome.
From a policy perspective, the indicators for frontier research may be expected to have a positive effect on the decision probability of a grant application, in case their measurement is actually captur-ing what we want to measure. If these indicators are statistically not influential, the review process may not be able to pick up those proposals that represent frontier research – in the sense of the indicators developed in this project. It is worth noting in this context that the selection outcome of a proposal after review has in principle three possible outcomes: Type-A) above threshold and funded, Type-B) above threshold and not funded, and Type-C) below threshold. However, since we do not have empirical information on the score a proposal has reached, we can just infer on the selection outcome, i.e. Type-A/B vs. Type-C proposals.

68 Synthesis Report
To address these questions, we propose a statistical modelling approach that will be introduced in detail in the section that follows. In this modelling approach, derived from econometrics, the indica-tors will be jointly analysed in a way that selection probabilities for each proposal under consideration can be computed and compared with the actual, observed selection outcome. Further, the model will provide quantitative evidence on the statistical relationship between our five indicators for frontier research and the selection outcome of grant proposals, i.e. the model investigates whether proposals that reflect frontier research or different aspects of frontier research indeed show a higher probability to be selected by the review process from a statistical perspective. By this, it provides the basic framework for opening-up the black box of the ERC review process, particularly concerning the ques-tion whether the goal to explicitly support frontier research as the main funding criterion have been met by the review process.
69
Phase 2 – The statistical relationship between frontier re-search and selection outcome of ERC proposals
In this section, we introduce in some detail the econometric model that we use to address the ques-tion how the frontier research character of a proposal, as measured by our indicators, influences its selection probability. From our conceptual background (see Section 2), we are interested in whether our different dimensions of frontier research, are a statistically significant determinant influencing an ERC project proposal to be accepted or rejected. The other way round, one could say that proposals that show a lower degree of different aspects of frontier research should statistically show a lower probability to get accepted.
Section 1.15 initially describes the methodological approach. Section 0 presents the empirical setting and the results of the statistical analysis, while Section 0 presents some checks for robustness and validity. Section 0 closes with some concluding remarks and a short outlook.
1.15 Methodological approach – using econometric models
In methodological terms, we are interested in statistical models that relate different exogenous fac-tors – involving our frontier research indicators – to the probability of a proposal to be accepted or rejected. However, since other attributes of a proposal or – in some cases – of a PI may also influ-ence selection outcome, we need to isolate frontier research effects from such other effects, referred to as control variables, in order to get – in a statistical sense – consistent estimations of the influence of our five aspects of frontier research on the selection outcome of ERC proposals. Note that we employ a step-wise approach here, in a first step, estimating a model using frontier research indica-tors only, while, in a second step, we bring in the control variables to see how the results change when adding these control variables. Further, we want to shed some light on the association of these exogenous factors, i.e. which indicators show a high influence on acceptance probability in relation to other indicators.
We use methods from econometric modelling to address this question. Econometrics provides a rich analytical toolset to describe the relationship between a dependent, endogenous variable (in our case selection outcome of a proposal) and different explanatory, exogenous or independent varia-bles (in our case our indicators for frontier research and other control variables) that explain the out-come of the dependent variables.
The variable that we want to explain is the selection outcome of a proposal. The selection outcome is by definition binary. Thus, in a first attempt, our model assumes a binary choice between the two central outcomes of the dependent variable, namely the rejection or acceptance of a project pro-posal. In econometric terms, we are therefore dealing with a so-called limited dependent variable (see Greene 2003), referring to situations where the dependent variable represents discrete alterna-tives rather than a continuous measure of activity, such as sales or price.
Conceptionally, we rely on the wide-spread class of discrete choice models, which is based on the unobservable utility obtained from a specific choice among alternatives (see Train 2009) that is in our case the choice of a reviewer to accept or reject a project proposal. The unobserved utility is given by the fact that we cannot observe the reasoning of a reviewer or a review panel to accept or reject a proposal, but we can observe its outcome ex-post, namely whether a reviewer or a review panel has selected or rejected a proposal.
For the interested reader, Box 1 sets forth the mathematical situation that we consider and describes the model from a formal perspective. Coming to the independent variables that are assumed to ex-plain selection outcome of a proposal we take into account our five indicators for frontier research in the following form (see also Section 0):
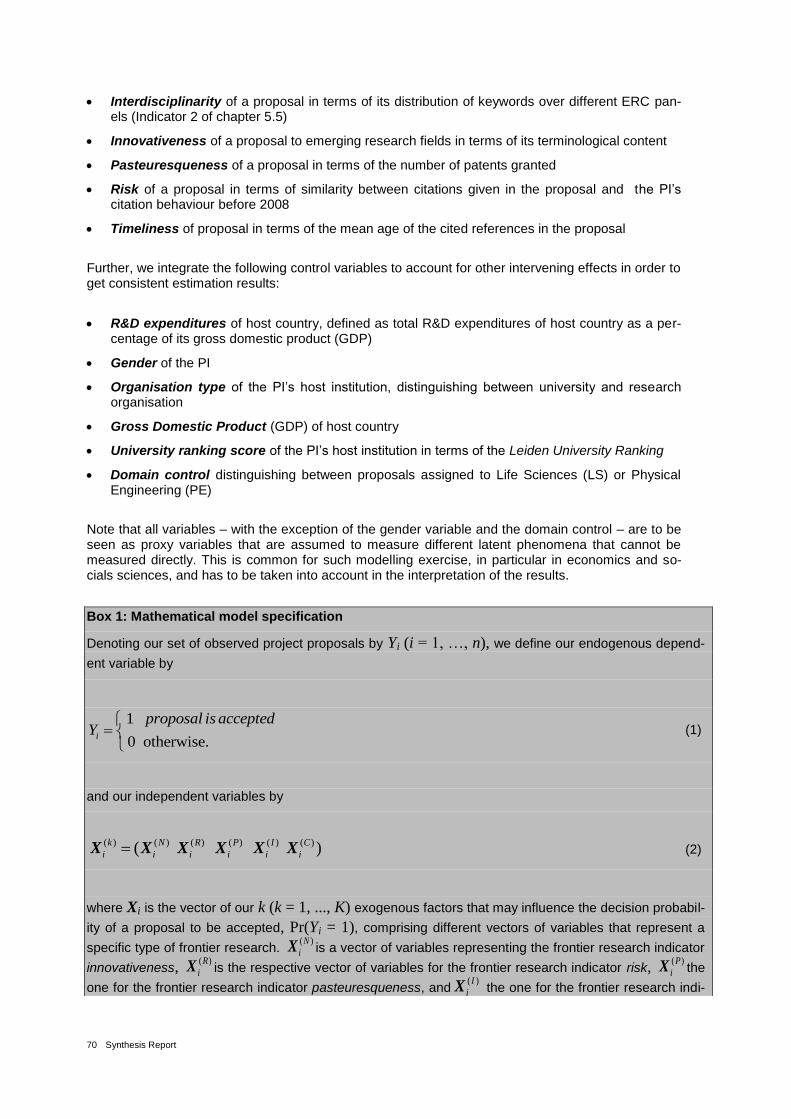
70 Synthesis Report
Interdisciplinarity of a proposal in terms of its distribution of keywords over different ERC pan-els (Indicator 2 of chapter 5.5)
Innovativeness of a proposal to emerging research fields in terms of its terminological content
Pasteuresqueness of a proposal in terms of the number of patents granted
Risk of a proposal in terms of similarity between citations given in the proposal and the PI’s citation behaviour before 2008
Timeliness of proposal in terms of the mean age of the cited references in the proposal
Further, we integrate the following control variables to account for other intervening effects in order to get consistent estimation results:
R&D expenditures of host country, defined as total R&D expenditures of host country as a per-centage of its gross domestic product (GDP)
Gender of the PI
Organisation type of the PI’s host institution, distinguishing between university and research organisation
Gross Domestic Product (GDP) of host country
University ranking score of the PI’s host institution in terms of the Leiden University Ranking
Domain control distinguishing between proposals assigned to Life Sciences (LS) or Physical Engineering (PE)
Note that all variables – with the exception of the gender variable and the domain control – are to be seen as proxy variables that are assumed to measure different latent phenomena that cannot be measured directly. This is common for such modelling exercise, in particular in economics and so-cials sciences, and has to be taken into account in the interpretation of the results.
Box 1: Mathematical model specification
Denoting our set of observed project proposals by Yi (i = 1, …, n), we define our endogenous depend-
ent variable by
1
0 otherwise.i
proposal is acceptedY
(1)
and our independent variables by
( ) ( ) ( ) ( ) ( ) ( )( )k N R P I C
i i i i i iX X X X X X (2)
where Xi is the vector of our k (k = 1, ..., K) exogenous factors that may influence the decision probabil-
ity of a proposal to be accepted, Pr(Yi = 1), comprising different vectors of variables that represent a
specific type of frontier research. ( )N
iX is a vector of variables representing the frontier research indicator
innovativeness, ( )R
iX is the respective vector of variables for the frontier research indicator risk, ( )P
iX the
one for the frontier research indicator pasteuresqueness, and( )I
iX the one for the frontier research indi-
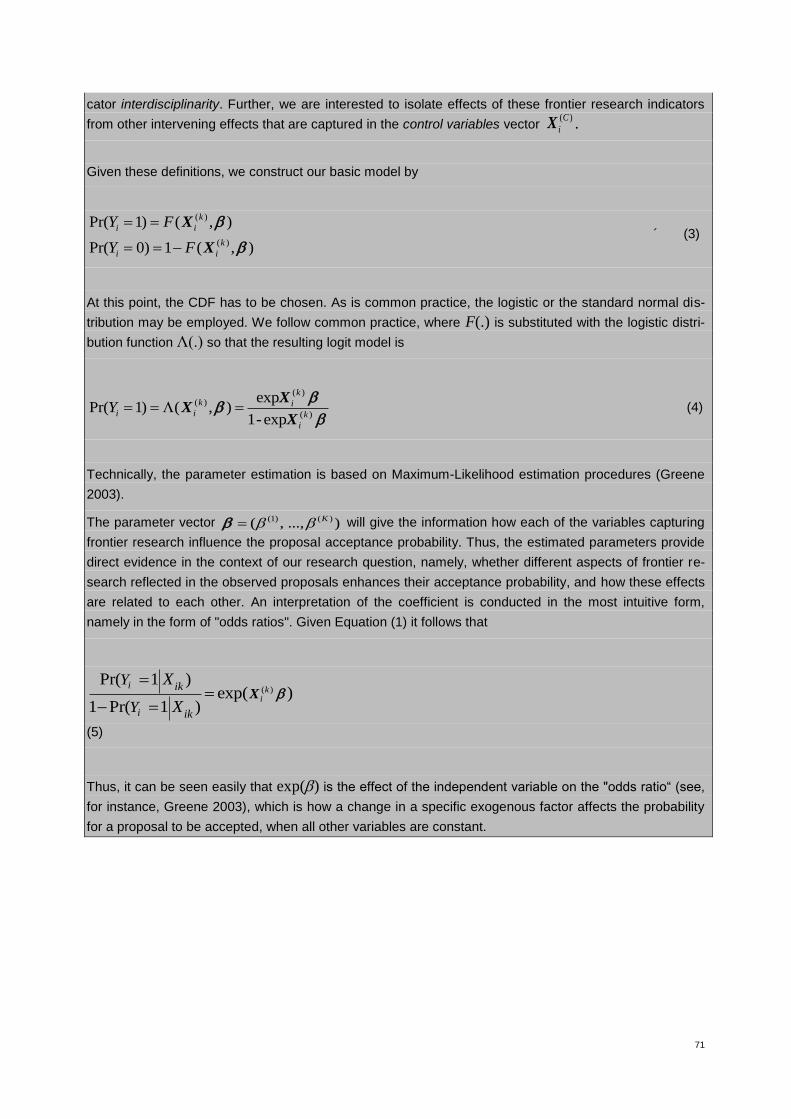
71
cator interdisciplinarity. Further, we are interested to isolate effects of these frontier research indicators
from other intervening effects that are captured in the control variables vector ( )C
iX .
Given these definitions, we construct our basic model by
( )
( )
Pr( 1) ( , )
Pr( 0) 1 ( , )
k
i i
k
i i
Y F
Y F
X
X
´ (3)
At this point, the CDF has to be chosen. As is common practice, the logistic or the standard normal dis-
tribution may be employed. We follow common practice, where F(.) is substituted with the logistic distri-
bution function Λ(.) so that the resulting logit model is
( )( )
( )
expPr( 1) ( , )
1- exp
kk i
i i k
i
Y X
XX
(4)
Technically, the parameter estimation is based on Maximum-Likelihood estimation procedures (Greene
2003).
The parameter vector (1) ( )( , ..., )K will give the information how each of the variables capturing
frontier research influence the proposal acceptance probability. Thus, the estimated parameters provide
direct evidence in the context of our research question, namely, whether different aspects of frontier re-
search reflected in the observed proposals enhances their acceptance probability, and how these effects
are related to each other. An interpretation of the coefficient is conducted in the most intuitive form,
namely in the form of "odds ratios". Given Equation (1) it follows that
( )Pr( 1 )
exp( )1 Pr( 1 )
ki
i
i
ik
ik
Y
Y
X
X
X
(5)
Thus, it can be seen easily that exp() is the effect of the independent variable on the "odds ratio“ (see,
for instance, Greene 2003), which is how a change in a specific exogenous factor affects the probability
for a proposal to be accepted, when all other variables are constant.
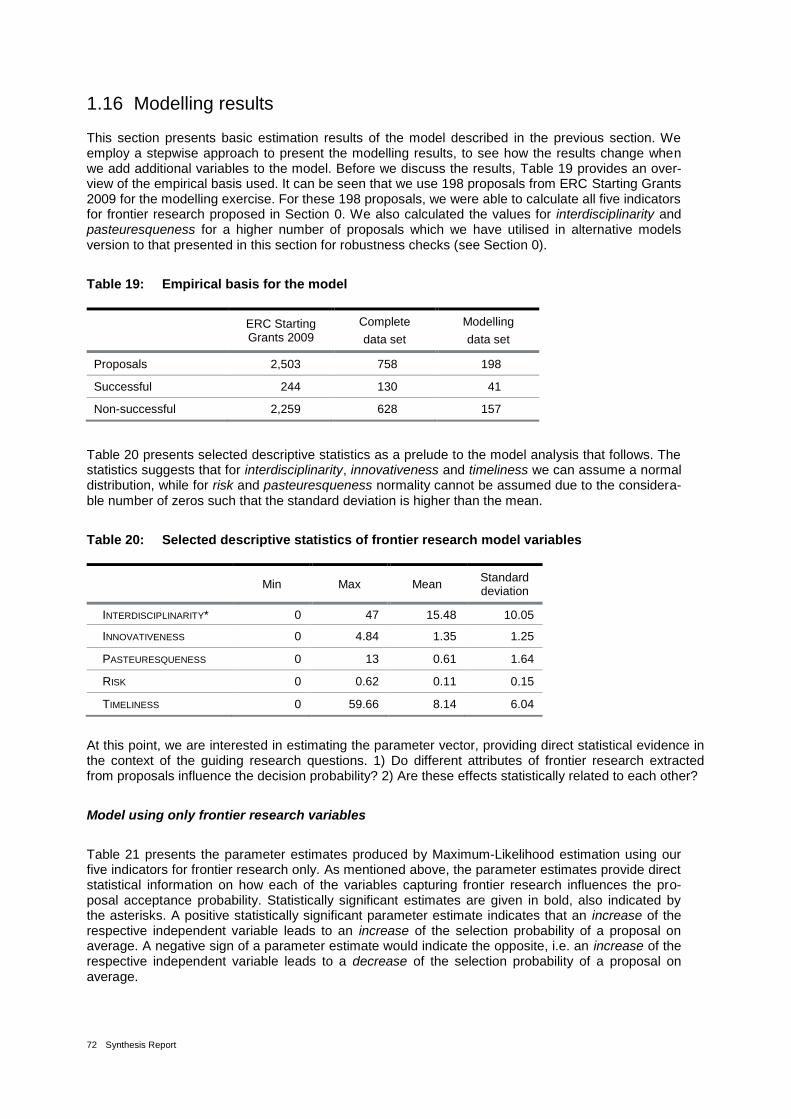
72 Synthesis Report
1.16 Modelling results
This section presents basic estimation results of the model described in the previous section. We employ a stepwise approach to present the modelling results, to see how the results change when we add additional variables to the model. Before we discuss the results, Table 19 provides an over-view of the empirical basis used. It can be seen that we use 198 proposals from ERC Starting Grants 2009 for the modelling exercise. For these 198 proposals, we were able to calculate all five indicators for frontier research proposed in Section 0. We also calculated the values for interdisciplinarity and pasteuresqueness for a higher number of proposals which we have utilised in alternative models version to that presented in this section for robustness checks (see Section 0).
Table 19: Empirical basis for the model
ERC Starting Grants 2009
Complete
data set
Modelling
data set
Proposals 2,503 758 198
Successful 244 130 41
Non-successful 2,259 628 157
Table 20 presents selected descriptive statistics as a prelude to the model analysis that follows. The statistics suggests that for interdisciplinarity, innovativeness and timeliness we can assume a normal distribution, while for risk and pasteuresqueness normality cannot be assumed due to the considera-ble number of zeros such that the standard deviation is higher than the mean.
Table 20: Selected descriptive statistics of frontier research model variables
Min Max Mean
Standard deviation
INTERDISCIPLINARITY* 0 47 15.48 10.05
INNOVATIVENESS 0 4.84 1.35 1.25
PASTEURESQUENESS 0 13 0.61 1.64
RISK 0 0.62 0.11 0.15
TIMELINESS 0 59.66 8.14 6.04
At this point, we are interested in estimating the parameter vector, providing direct statistical evidence in the context of the guiding research questions. 1) Do different attributes of frontier research extracted from proposals influence the decision probability? 2) Are these effects statistically related to each other?
Model using only frontier research variables
Table 21 presents the parameter estimates produced by Maximum-Likelihood estimation using our five indicators for frontier research only. As mentioned above, the parameter estimates provide direct statistical information on how each of the variables capturing frontier research influences the pro-posal acceptance probability. Statistically significant estimates are given in bold, also indicated by the asterisks. A positive statistically significant parameter estimate indicates that an increase of the respective independent variable leads to an increase of the selection probability of a proposal on average. A negative sign of a parameter estimate would indicate the opposite, i.e. an increase of the respective independent variable leads to a decrease of the selection probability of a proposal on average.

73
Table 21: Frontier research variables only model
Frontier research variable Parameter estimate
(standard error in brackets)
INTERDISCIPLINARITY (1) -0.132***
(0.023)
INNOVATIVENESS (2) 0.524***
(0.077)
PASTEURESQUENESS (3) 0.077 (0.121)
RISK (4) 0.765 (2.635)
TIMELINESS (5) -0.047 (0.049)
Constant (0) 11.412***
(0.433)
Note: The independent variables are defined as given in the text; ***significant at the 0.01 % level; ** significant at the 0.05 % level, *significant at the 0.1 % level.
Interpreting the model using only frontier research variables
As can be seen from Table 21, the model produces significant estimates for interdisciplinarity and innovativeness, i.e. it suggests that the review process accounts for these attributes of frontier re-search in their decision-making. The model produces significant estimates for interdisciplinarity and innovativeness, i.e. it suggests that these attributes of frontier research play a statistical significant role for selection outcome:
While for innovativeness we find a positive effect on the selection outcome of a proposal, i.e. a higher innovativeness significantly increases the probability of a proposal the get selected,
we find a negative effect – though smaller in magnitude – for interdisciplinarity, i.e. higher in-terdisciplinarity of a proposal decreases its selection probability.
Given the concept of frontier research to be taken into account in the ERC review process, the result that innovativeness is indeed a significant determinant of a proposals selection probability can – from a policy perspective – be regarded as a very positive outcome of the review process. However, though the ERC explicitly aims to support interdisciplinary proposals, the results show that selection probability of interdisciplinary proposals – as measured by interdisciplinarity indicator 1 (see Section 5.5.2) – even slightly decreases. Furthermore, parameter estimates for the remaining attributes, that is timeliness, risk and pasteuresqueness, are not statistically significant. In this sense, the model suggests that these attributes do not play a significant role in the review process.
Note that we cannot say from the model, whether the reviewer does not take these dimensions into account. We can only say that these dimensions do not play a statistical significant role in the way they are measured in this project, for our sample of 198 proposals.
Full model
Given the interesting results of the model presented in Table 21, the question arises whether these results are robust when we add other intervening factors, the control variables as above. In this con-text, Table 22 presents the parameter estimates for the full model, using our five indicators for fron-tier research in combination with the control variables. The results are striking. The parameter esti-mates for frontier research seem to be sufficiently robust with respect to adding further control varia-bles to the model. They only change slightly when the control variables are added in the full model. Also the full model produces significant estimates for interdisciplinarity and innovativeness; also the
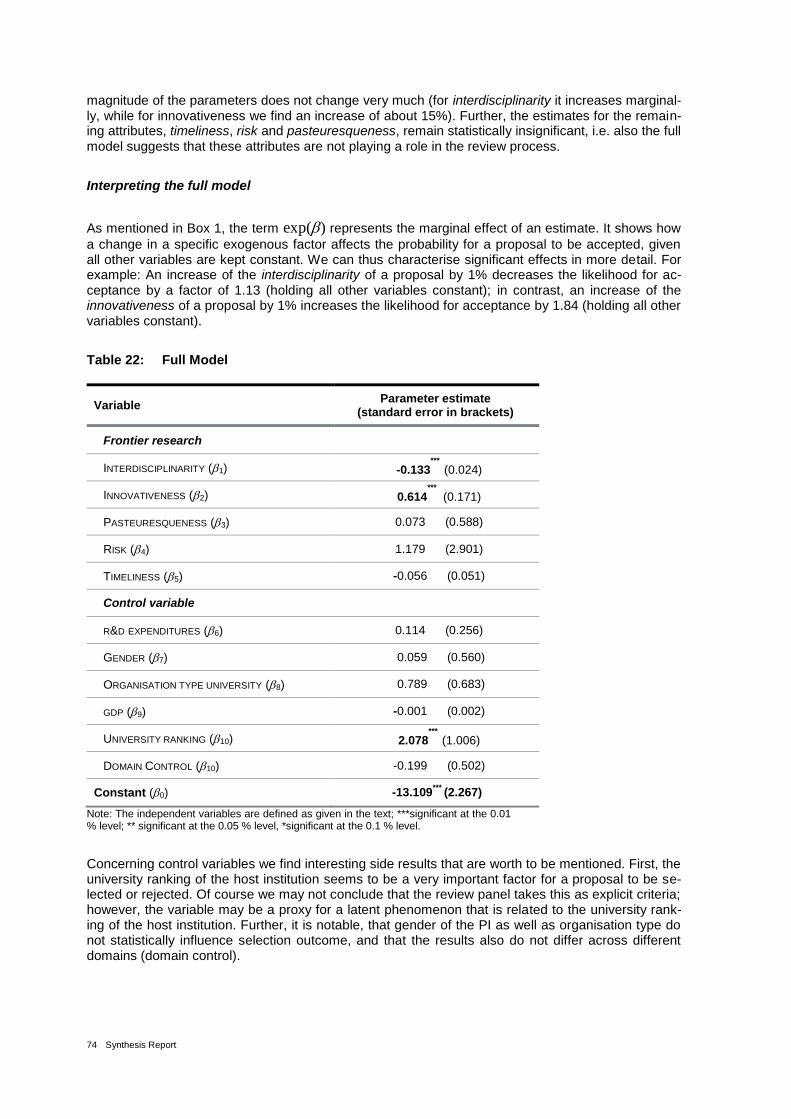
74 Synthesis Report
magnitude of the parameters does not change very much (for interdisciplinarity it increases marginal-ly, while for innovativeness we find an increase of about 15%). Further, the estimates for the remain-ing attributes, timeliness, risk and pasteuresqueness, remain statistically insignificant, i.e. also the full model suggests that these attributes are not playing a role in the review process.
Interpreting the full model
As mentioned in Box 1, the term exp() represents the marginal effect of an estimate. It shows how
a change in a specific exogenous factor affects the probability for a proposal to be accepted, given all other variables are kept constant. We can thus characterise significant effects in more detail. For example: An increase of the interdisciplinarity of a proposal by 1% decreases the likelihood for ac-ceptance by a factor of 1.13 (holding all other variables constant); in contrast, an increase of the innovativeness of a proposal by 1% increases the likelihood for acceptance by 1.84 (holding all other variables constant).
Table 22: Full Model
Variable Parameter estimate
(standard error in brackets)
Frontier research
INTERDISCIPLINARITY (1) -0.133***
(0.024)
INNOVATIVENESS (2) 0.614***
(0.171)
PASTEURESQUENESS (3) 0.073 (0.588)
RISK (4) 1.179 (2.901)
TIMELINESS (5) -0.056 (0.051)
Control variable
R&D EXPENDITURES (6) 0.114 (0.256)
GENDER (7) -0.059 (0.560)
ORGANISATION TYPE UNIVERSITY (8) -0.789 (0.683)
GDP (9) -0.001 (0.002)
UNIVERSITY RANKING (10) 2.078***
(1.006)
DOMAIN CONTROL (10) -0.199
(0.502)
Constant (0) -13.109***
(2.267)
Note: The independent variables are defined as given in the text; ***significant at the 0.01 % level; ** significant at the 0.05 % level, *significant at the 0.1 % level.
Concerning control variables we find interesting side results that are worth to be mentioned. First, the university ranking of the host institution seems to be a very important factor for a proposal to be se-lected or rejected. Of course we may not conclude that the review panel takes this as explicit criteria; however, the variable may be a proxy for a latent phenomenon that is related to the university rank-ing of the host institution. Further, it is notable, that gender of the PI as well as organisation type do not statistically influence selection outcome, and that the results also do not differ across different domains (domain control).
75
1.17 Predictive ability and validity
One can address the validity of the model specification from a statistical perspective as well as the model robustness of the parameter estimates produced by Maximum-Likelihood estimation proce-dures through statistical model tests. The above model has been tested using a number of standard tests for robustness and validation (e.g., testing the link function between the dependent and the independent variables as well as the behaviour of the residuals) and was found to be valid. In the following we shortly focus on the predictive ability and representativeness, as well as on validity and model diagnostics.
Predictive ability and representativeness
The question that may be raised looking at the model results from above is how well the model actu-ally captures the selection process. For this reason, we computed acceptance probabilities for each proposal using the obtained parameter estimates from the full model (see Table 22), which enables in-depth analysis of proposals. This is simply done for each of the 198 proposals by adding each parameter estimate to Equation (4) from Box 1, producing an acceptance probability for each pro-posal. The results of this exercise are promising and insightful:
i. Among the top 20 probabilities, we find only 4 wrong predictions, i.e. four non-successful proposals.
ii. Between ranks 21 and 30, we find alterations between successful and non-successful pro-posals, i.e. indicative of tight decision-making whether a proposal is accepted or rejected.
iii. Below ranks 30 and up to rank 198, we find 20 out of 169 wrong model predictions.
However, since we only calculate the model using 198 proposals, the question of representativeness comes up; i.e. can we infer results from our sample to the whole 2009 starting grant review process given the number of observations? We have, thus, calculated an alternative model with 684 observa-tions, using two indicators for frontier research, interdisciplinarity and pasteuresqueness, and the control variables, to see whether results do change. Remember that we could not use the whole sample for all indicators since computation time for it was too extensive.
Estimation results of the model on 684 observations are given in Table 23. The positive outcome is that the parameter estimates are robust using a larger number of observations. As in the model with 198 observations only, interdisciplinarity remains significant, with the magnitude increasing very slightly, while pasteuresqueness remains insignificant. As for the control variables, the results are also robust, again the university ranking variable estimated as the only significant one. Of course we are not able from this exercise to infer on the behaviour of the remaining frontier research variables using a larger number of observations. However, the model from Table 23 at least points to a rather high representativeness of the 198 proposals used in the full model for all frontier research indicators including control variables.
Table 23: Estimation results for 684 observations
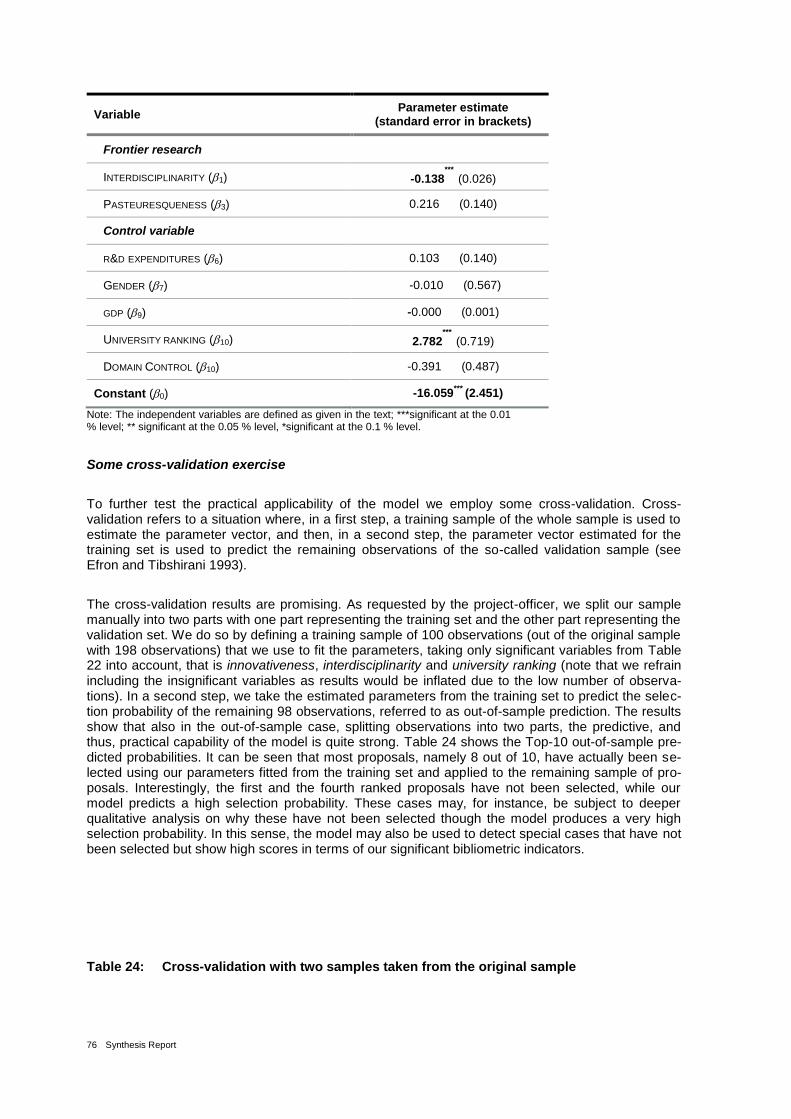
76 Synthesis Report
Variable Parameter estimate
(standard error in brackets)
Frontier research
INTERDISCIPLINARITY (1) -0.138***
(0.026)
PASTEURESQUENESS (3) 0.216 (0.140)
Control variable
R&D EXPENDITURES (6) 0.103 (0.140)
GENDER (7) --0.010 (0.567)
GDP (9) -0.000 (0.001)
UNIVERSITY RANKING (10) 2.782***
(0.719)
DOMAIN CONTROL (10) -0.391
(0.487)
Constant (0) -16.059***
(2.451)
Note: The independent variables are defined as given in the text; ***significant at the 0.01 % level; ** significant at the 0.05 % level, *significant at the 0.1 % level.
Some cross-validation exercise
To further test the practical applicability of the model we employ some cross-validation. Cross-validation refers to a situation where, in a first step, a training sample of the whole sample is used to estimate the parameter vector, and then, in a second step, the parameter vector estimated for the training set is used to predict the remaining observations of the so-called validation sample (see Efron and Tibshirani 1993).
The cross-validation results are promising. As requested by the project-officer, we split our sample manually into two parts with one part representing the training set and the other part representing the validation set. We do so by defining a training sample of 100 observations (out of the original sample with 198 observations) that we use to fit the parameters, taking only significant variables from Table 22 into account, that is innovativeness, interdisciplinarity and university ranking (note that we refrain including the insignificant variables as results would be inflated due to the low number of observa-tions). In a second step, we take the estimated parameters from the training set to predict the selec-tion probability of the remaining 98 observations, referred to as out-of-sample prediction. The results show that also in the out-of-sample case, splitting observations into two parts, the predictive, and thus, practical capability of the model is quite strong. Table 24 shows the Top-10 out-of-sample pre-dicted probabilities. It can be seen that most proposals, namely 8 out of 10, have actually been se-lected using our parameters fitted from the training set and applied to the remaining sample of pro-posals. Interestingly, the first and the fourth ranked proposals have not been selected, while our model predicts a high selection probability. These cases may, for instance, be subject to deeper qualitative analysis on why these have not been selected though the model produces a very high selection probability. In this sense, the model may also be used to detect special cases that have not been selected but show high scores in terms of our significant bibliometric indicators.
Table 24: Cross-validation with two samples taken from the original sample
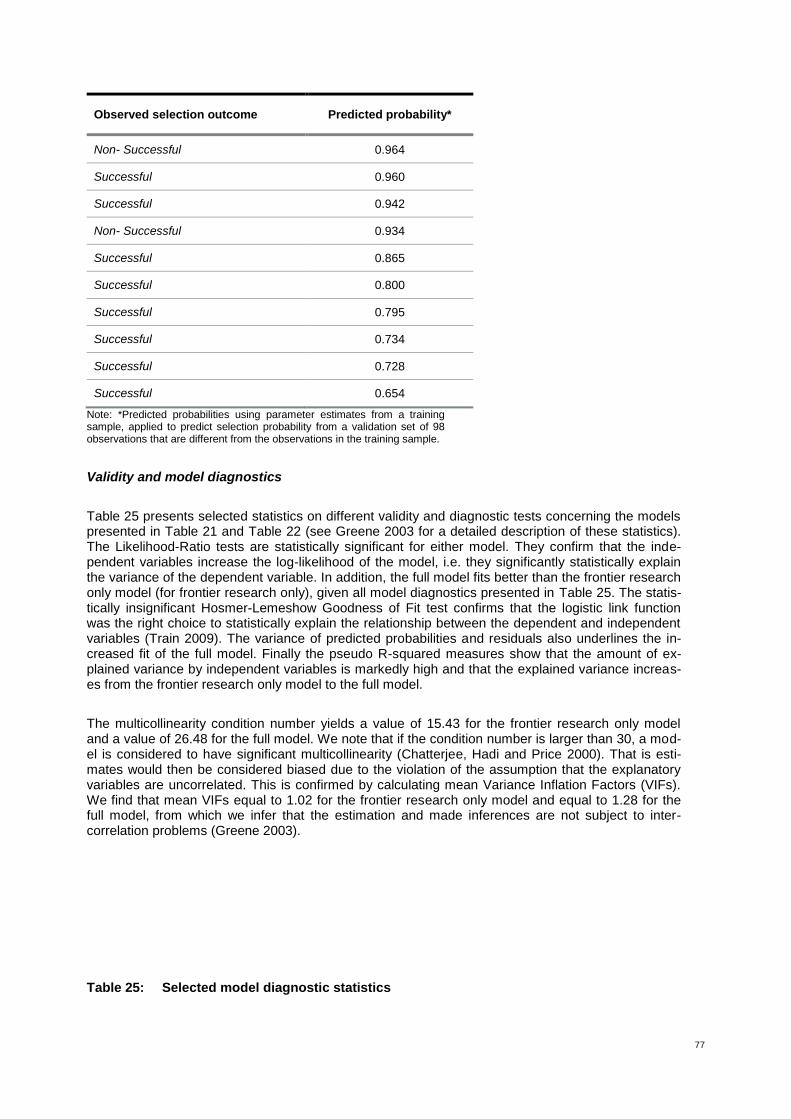
77
Observed selection outcome Predicted probability*
Non- Successful 0.964
Successful 0.960
Successful 0.942
Non- Successful 0.934
Successful 0.865
Successful 0.800
Successful 0.795
Successful 0.734
Successful 0.728
Successful 0.654
Note: *Predicted probabilities using parameter estimates from a training sample, applied to predict selection probability from a validation set of 98 observations that are different from the observations in the training sample.
Validity and model diagnostics
Table 25 presents selected statistics on different validity and diagnostic tests concerning the models presented in Table 21 and Table 22 (see Greene 2003 for a detailed description of these statistics). The Likelihood-Ratio tests are statistically significant for either model. They confirm that the inde-pendent variables increase the log-likelihood of the model, i.e. they significantly statistically explain the variance of the dependent variable. In addition, the full model fits better than the frontier research only model (for frontier research only), given all model diagnostics presented in Table 25. The statis-tically insignificant Hosmer-Lemeshow Goodness of Fit test confirms that the logistic link function was the right choice to statistically explain the relationship between the dependent and independent variables (Train 2009). The variance of predicted probabilities and residuals also underlines the in-creased fit of the full model. Finally the pseudo R-squared measures show that the amount of ex-plained variance by independent variables is markedly high and that the explained variance increas-es from the frontier research only model to the full model.
The multicollinearity condition number yields a value of 15.43 for the frontier research only model and a value of 26.48 for the full model. We note that if the condition number is larger than 30, a mod-el is considered to have significant multicollinearity (Chatterjee, Hadi and Price 2000). That is esti-mates would then be considered biased due to the violation of the assumption that the explanatory variables are uncorrelated. This is confirmed by calculating mean Variance Inflation Factors (VIFs). We find that mean VIFs equal to 1.02 for the frontier research only model and equal to 1.28 for the full model, from which we infer that the estimation and made inferences are not subject to inter-correlation problems (Greene 2003).
Table 25: Selected model diagnostic statistics
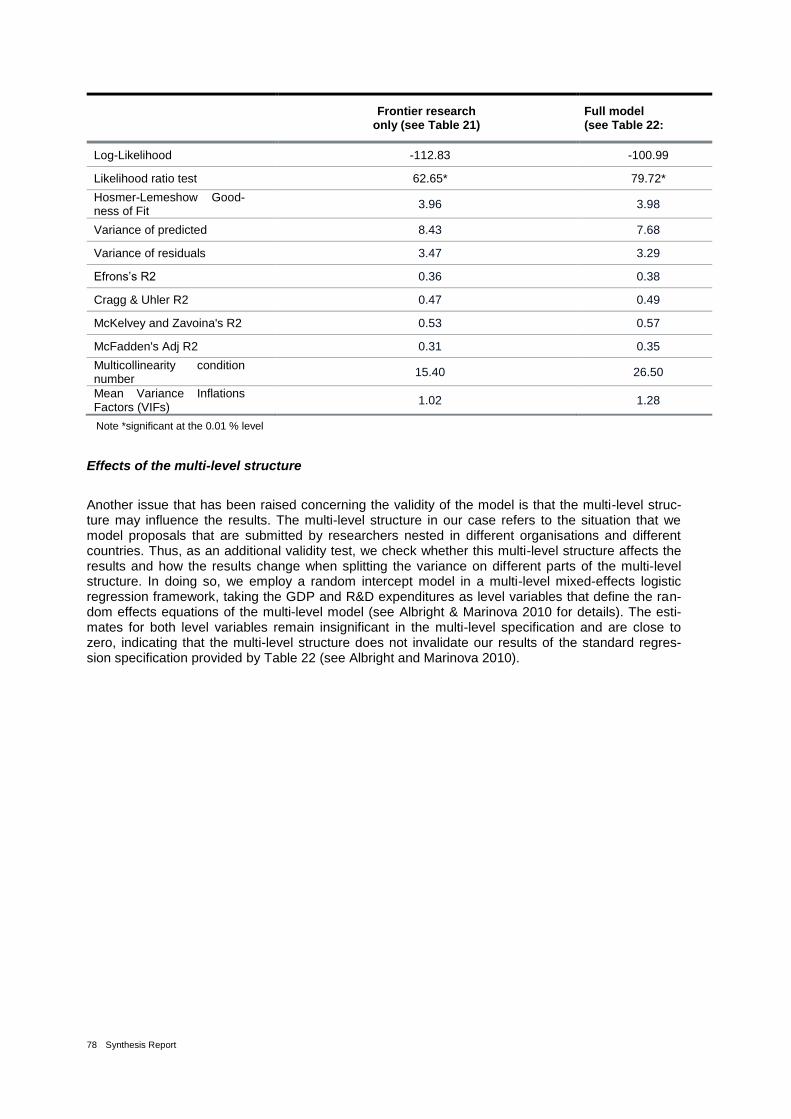
78 Synthesis Report
Frontier research
only (see Table 21) Full model (see Table 22: Full Model)
Log-Likelihood -112.83 -100.99
Likelihood ratio test 62.65* 79.72*
Hosmer-Lemeshow Good-ness of Fit
3.96 3.98
Variance of predicted 8.43 7.68
Variance of residuals 3.47 3.29
Efrons’s R2 0.36 0.38
Cragg & Uhler R2 0.47 0.49
McKelvey and Zavoina's R2 0.53 0.57
McFadden's Adj R2 0.31 0.35
Multicollinearity condition number
15.40 26.50
Mean Variance Inflations Factors (VIFs)
1.02 1.28
Note *significant at the 0.01 % level
Effects of the multi-level structure
Another issue that has been raised concerning the validity of the model is that the multi-level struc-ture may influence the results. The multi-level structure in our case refers to the situation that we model proposals that are submitted by researchers nested in different organisations and different countries. Thus, as an additional validity test, we check whether this multi-level structure affects the results and how the results change when splitting the variance on different parts of the multi-level structure. In doing so, we employ a random intercept model in a multi-level mixed-effects logistic regression framework, taking the GDP and R&D expenditures as level variables that define the ran-dom effects equations of the multi-level model (see Albright & Marinova 2010 for details). The esti-mates for both level variables remain insignificant in the multi-level specification and are close to zero, indicating that the multi-level structure does not invalidate our results of the standard regres-sion specification provided by Table 22 (see Albright and Marinova 2010).

79
1.18 Reviewing the results of the model
This section presented a statistical model that aims at advancing the development of quantitative methods for examining the relationship between peer-review and decisions about ERC research grant allocation in terms of attributes of frontier research. The model utilises information present in research proposals and purposefully builds on econometric modelling to address the influence of frontier research on the decision probability of submitted proposals. The objective was to develop a sound and practical statistical modelling approach that relates different aspects of frontier research – reflected in proposals – to the selection outcome of proposals. Note that the model is aiming to pro-vide an additional view on the peer-review process and its underlying mechanisms; it is not intended to represent an alternative approach that may replace peer-review or to serve as a tool for proposal ranking in an ex-ante context. However, in its ability to disclose the statistical relationship between different frontier research aspects and selection outcome of proposals, it may serve well as comple-mentary ex-post evaluation tool of the review process. In this sense, it can, for instance, identify those frontier research dimension that were not addressed in the review process; future review pro-cesses may thus be adjusted in this direction, for instance by making reviewer more thoroughly aware to account for certain aspects of frontier research that have found to play no role in previous review rounds. The following review round may again be examined by the model to see whether the situation has changed.
The essence of the statistical approach presented in this section was to implement the conceptual-ised indicators for frontier research (see Section 0) in a statistical model, enabling the exploration of different attributes of frontier research, as conceptualised by our indicators innovativeness, risk, pas-teuresqueness, interdisciplinarity and timeliness. We used a data sample of 198 research proposals submitted as ERC Starting Grants of the year 2009, employing a discrete choice modelling perspec-tive, specified in form of a logistic regression model, to quantify whether the review process selects proposals that address frontier research themes according to the conceptualisation of frontier re-search developed in this project.
The empirical analysis demonstrates the benefit of the approach, both in terms of a first proof of the indicator concept as well as in terms of the modelling approach and obtained results with statistical reliability. The results suggest that (under control of additional effects that may affect decision proba-bility):
the frontier research attributes innovativeness and interdisciplinarity influence the decision prob-ability for a proposal to be selected;
whereas innovativeness is the more important attribute, influencing selection probability in a positive way;
In contrast, interdisciplinarity has a negative effect, i.e. higher interdisciplinarity of a proposal decreases its selection probability.
However, the review process is not seen as being able to select proposals taking into account risk, pasteuresqueness or timeliness;
at least in the form as measured by our indicators for these frontier research dimensions.
From the perspective of a grant agency, these initial results bear promises for tactical and strategic implications derived from scientometric evaluation. It can be positively stated that presumably the most important indicator for frontier research, innovativeness, indeed is an important criterion for a proposal to be accepted. In this sense, it seems the goal has been met to specifically select topics that are innovative and close to emerging research fronts.
However, for interdisciplinarity we find negative results. Though the ERC explicitly aims to support interdisciplinary proposals, the results show that selection probability of interdisciplinary proposals even slightly decreases. By this, the model confirms experiences from the ERC that considers the

80 Synthesis Report
probability for interdisciplinary proposals to be selected as lower. This bears important policy implica-tions; the ERC may implement measures to motivate and make reviewers aware that interdiscipli-narity should be taken more thoroughly into account as a positive criterion of proposal in the review process.
Some further ideas for interpretation of the results and conclusions come to mind. As some of the indicators are not statistically significant, different interpretations are possible.
Concerning the Risk indicator, it may be speculated that the indicator developed in this project is not actually capturing what the review panels understand as riskiness of research, or at least on-ly a very specific part of riskiness, that is related to some kind of experience of the researcher in a certain field.
Concerning pasteuresqueness, one may conclude that review panels indeed do not look at ap-plicability of the research in terms of patenting. However, since the number of patents is inter-preted as proxy for the pasteuresqueness orientation of a researcher, it seems that review pan-els indeed do not give much attention to this frontier research dimension in their decisions pro-cess.
A similar conclusion may be drawn for timeliness. Review panels do not look at the novelty of the research in terms of the age of the references in the proposal. However, whether they may take into account the timeliness of the proposed research in any other way remains open.
The presented model has focused on the ERC grant scheme but could be more broadly applicable depending on the mission, review process, attributes and correspondence of indicators for other grant schemes. However, some points for improvements of the model should be taken into account in future applications, both inside or outside the ERC:
Further research on the conception indicators for frontier research is needed in order to more effectively capture different aspects of frontier research, as, for instance, concerning the riski-ness of a proposal.
Additional control variables may be taken into account, not only for isolating frontier research effects from other intervening factors, but also to get additional insights into which mechanisms are at work in the review panels. Since reviewers are confronted with a high work load, the result that university ranking is a statistically important determinant of selection outcome may be a hint in this direction; note that the university ranking variable may be interpreted as a rough proxy for the general excellence of the researcher, assuming that the best researchers may apply for the best universities.
However, such additional variables are also subject to the number of observations and data is-sues. The calculation of both frontier research variables and control variables for a larger set of proposals, also for different points in time, may indeed improve inferences that can be drawn from the model. Of course this is also subject to data availability and the form in which data are delivered so that automated or at least semi-automated processing is possible.
Ultimately, the concept presented in this section has the potential to allow a grant agency to support the monitoring of the operation of the peer-review process from a statistical perspective, maybe only partly ex-ante, but mainly from an ex-post perspective.
81
DBF – the main conclusions
The DBF project is a pilot project that uses bibliometric indicators to support ERC in identifying fron-tier research. The report so far has given a detailed overview and analysis of the work undertaken within the project. This included an overview of the indicators and the comparison of the bibliometric analysis with the decisions of the peer review panels to find out if ERC was selecting projects that could be defined as addressing frontier research. The aim of this chapter is to reflect on the project’s results, and in particular to look at what the DBF conclusions mean for ERC. Can the results of the DBF project contribute to defining frontier research and can they contribute to further developing the peer review process and the selection of proposals?
Defining frontier research – the conceptual level
The DBF project took the ERC High Level Group’s definition of frontier research as its starting point and translated this into bibliometric and scientometric indicators. The project did not attempt to reflect on the definition of frontier research on a level that went beyond the High Level Group’s approach. The project did not reflect on whether the High Level Group’s approach did really define frontier re-search. The main focus of the DBF project was on the translation of the concepts and on the need to produce indicators that could be implemented in bibliometric terms. The resulting bibliometric indica-tors were intended to measure four different aspects of frontier research that is risk, novelty, interdis-ciplinarity and pasteuresqueness.
However, the process of producing concrete indicators did initiate an interesting discussion on what is meant by the individual key attributes of frontier research. Translating abstract concepts into con-crete indicators that can measure frontier research is not easy. One of the discussions that emerged from the definition of the risk indicator was that the way in which DBF defined risk as personal risk was not the way in which ERC defined risk. In addition, discussions around the definition of the inter-disciplinarity indicator showed that there is more than one way of defining interdisciplinarity.
Another discussion was that of the interaction between the different key attributes. During the project, the individual proposals were ranked individually across all five indicators. However, it was never clear whether a really successful proposal should score highly on all five accounts. However, as mentioned before, the conceptual level of frontier research was not the main focus of the DBF project
The main conclusions therefore on frontier research that emerged from the DBF project were that the concept of frontier research from the High Level Group is a useful starting point, but is not one that can be directly translated into concrete indicators. Or, more specifically, the key attribute can be translated into different indicators that mean quite different things.
Definition of indicators for frontier research in terms of bibliometric indicators
The DBF project took the concept of frontier research as defined by the high level group and turned it into indicators that can be measured. The translation of the concept into workable indicators was the first main success of the DBF project. DBF produced five concrete and tangible indicators for meas-uring frontier research in bibliometric terms. The methods took bibliometric methods beyond their normal use and attempted to use them to measure a concept. This in itself was an innovative ap-proach. The five indicators proved that bibliometric indicators could be used to define and measure frontier research.
82 Synthesis Report
The five indicators:
interdisciplinarity of a proposal in terms of its distribution of keywords over different ERC panels
innovativeness of a proposal to emerging research fields in terms of its terminological con-tent
pasteuresqueness of a proposal in terms of the number of patents granted
risk of a proposal in terms of similarity between citations given in the proposal and the PI’s citation behaviour before 2008
timeliness of proposal in terms of the mean age of the cited references in the proposal
The translation of the key attributes into indicators proved to be very different for each of the individ-ual indicators. The indicators risk and pasteuresqueness were the most difficult to translate into a bibliometric indicator that measured the key attribute. This was due partly to the difficulty in pinning the concepts down to a single issue that could be measured and partly due to the fact that it was more difficult to address these issues in bibliometric terms.
On the basis of these five indicators, it could be suggested that using indicators that look at the con-tent of the proposal (interdisciplinarity and innovativeness) rather than only the citations or refer-ences in isolation (risk and timeliness) proves to be more successful. The project found that not only was it easier to define these two indicators (interdisciplinarity and innovativeness), but that the econ-ometric model also found that these two indicators played a statistical significant role in the peer review process. The output of this phase of the project was a ranking of proposals calculated for each of the individual indicators. This information in itself was another of the output successes of the DBF project. Though the indicators developed may not represent a complete reflection of the ERC´s understanding of frontier research, they pick up some relevant aspects of frontier research, and may, in this sense, serve as useful inputs in an evaluation context of grant proposals or peer-review pro-cesses for different purposes. For the first time, ERC had a list of the proposals ranked according to the key attributes of frontier research.
Do the peer review panels select frontier research?
The DBF project was interested in whether ERC peer review panels selected projects for funding which addressed frontier research. In order to compare the DBF ranking of proposals with the deci-sions taken by the ERC panels, an econometric model was used to compare the five indicators to the proposals selected during the peer review process. The outcome was that the peer review panels took only one aspect – though a core aspect -of frontier research, innovativeness into account. In addition, it emerged that for the indicator interdisciplinarity, the peer review panels were actually se-lecting projects that were not interdisciplinary, but disciplinary focused. However, the latter result is not surprising as it confirms the ERC’s own experiences.
The fact the only one of the indicators was identified by the peer reviewers in the selection of the projects could have different reasons. It could be that the peer reviewers were really not selecting projects that addressed other aspects of frontier research. Another interpretation however, would be that the indicators measure other aspects than those that were taken into account for decisions.
Putting the DBF results into practice
The DBF developed and implemented five indicators for frontier research. One important question that arises now is how the results could be used within ERC. To a certain extent, the results already have begun to have an impact. The final workshop in Brussels led to a number of discussions about how ERC defines and implements the concept of frontier research. However, the DBF project initially

83
aimed to “provide a methodology that allows the ERC to monitor the operation of the peer review process from a bibliometric perspective and potentially shall yield additional elements in the future execution of the peer review process”.
The DBF project created indicators and measured the extent to which the peer review panels took the defined and measured dimensions of frontier research into account in selecting projects. This process was complex and time consuming and only one of the indicators (interdisciplinarity) was able to be processed electronically in an easy way. The other indicator that was taken into account by the peer review panels (innovativeness) is still at a stage of development where it is too time consuming to be implemented by a research funding organisation such as ERC. However, the modelling results have important implications in a practical context; since, for instance, interdisciplinarity has even a negative effect on a proposals selection probability. The model could then be used in future review processes to see whether this has improved. The same holds for the other dimensions, risk, pas-teuresqueness and timeliness.
Using the DBF results in the peer review process
The DBF project developed and implemented indicators to identify frontier research. Of course ERC was interested in to what extent they could use the indicators themselves in the peer review process. The report has documented the benefits and the challenges with the approach and has provided ERC with an extremely good basis to proceed looking at the use of bibliometric indicators at ERC. However, the project team is of the opinion that before ERC implements such indicators, they would need to test the approach first. Having said this there are several different ways in which the project results could be used:
The ranking of the proposals by individual indicators could be provided to the panels after they have taken their decisions on which proposals to fund to provide an additional input to the decision making process.
The model used in the project is not one that can be used ex-ante to predict which projects address frontier research. However, it can be used ex-post to see whether frontier research dimensions are taken up in the review process and, if this is not the case, the process could be redesigned so as to rectify any biases.
The approach to measure interdisciplinarity (maps of panels and panel keywords by the co-occurrence in 2009 starting grants) revealed that the panels need to be redefined and re-structured to better reflect the European research landscape and the strategic objectives of the ERC.
84 Synthesis Report
Interpreting and validating the results
The work and research carried out during the DBF workshop was well received by the bibliometric and scientometric communities who thought that the approach taken by the project was new and innovative. Two of the project’s approaches were thought to be particularly innovative. The first of these was the attempt to define frontier research through bibliometric and scientometric indicators. Secondly the use of an econometric model to predict the probability of a proposals selection was perceived to be new. The papers written, the conferences attended and the articles published during the project show a commitment by the project team to gain a better understanding of the use of bibli-ometric and scientometric indicators in an applied and very specific situation. A brief look at Annex 1 shows the considerable scientific output from the project. However DBF was not just supposed to develop bibliometric and scientometric indicators in order to write papers and publish articles. The project also specifically aimed at looking at how these indicators could be used by ERC in practice. One of the main ways in which the project looked at verifying the results was to present the results at a final workshop, the results of which are summarised here.
1.19 The final workshop
In February 2013 the project team organised a workshop in Brussels together with ERCEA and ISI Fraunhofer, the project coordinators of the Emerging Research Areas and their Coverage by ERC-supported Projects - ERACEP project. The workshop aimed to present the results of the project to a wider audience and to discuss the main ways in which the results of the project could be implement-ed by the ERC. The workshop presented the two projects three times on three different levels. The first presentation on the DBF project was about the concept behind the project and on the definition of the indicators; the second presentation was on the use of the model and the comparison of the peer review decisions with the DBF indicators of frontier research. The third presentation was on the level of the individual indicator and how it was calculated. The fact that the workshop covered all three levels allowed the invited external experts and the ERC and ERCEA experts to review the pro-ject from the concept level to the calculation of the individual indicator. This provided the project team with very precise and useful comments. The following section aims at integrating these comments into the DBF project conclusions. It draws heavily on the summary of the workshop written by the ERC project officer and the two project managers. However, it also tries to consolidate the points that specifically refer to the DBF project and not the ERACEP project.
The discussions during the workshop focused on the following questions:
What is the value and potential of bibliometrics in research funding?
What can bibliometrics offer to ERC operations and what are the main limitations of bibliometric practices?
What is the experience of ERC (and other agencies) with using bibliometric techniques?
How can bibliometric methods be used to support the peer review process: Can bibliometrics address some of the issues identified as problematic in the peer review process?
Which elements of DBF and ERACEP methods are suited for integration into ERC evaluation processes and how could they be implemented?
What are the key issues concerning the integration of bibliometric methods into the peer review process?
Which bibliometric approaches would need external support and which could be internalised independently, under what conditions?
85
The discussions covered both the projects. The following synthesis focuses on the outcomes of the workshop that apply more to DBF issues, that is issues around conceptualising and measuring fron-tier research and less about emerging fields which more concerned the ERACEP project.
1.19.1 Frontier research
It was generally accepted that defining bibliometric indicators to measure frontier research was a difficult task but also, that the right questions were raised and need to be addressed further. The efforts of both projects to test new methods were recognised. The main lessons learned from the DBF project were on the following issues:
Definition: The idea behind ERC key performance indicators is to exactly capture and benchmark these dimensions, and the results of the projects have offered first evidence as to the extent to which this can be achieved by bibliometrics. Level of measurement: The DBF indicators led to a discussion on the level of measurement and whether the concept of frontier research is something that can only be defined on the systemic level. Frontier research on the systemic level could be made up of different types of projects (some of them more interdisciplinary, some more novel, and some of them risky) with frontier research as a concept (to be measured) existing only on the systemic level.
Ex-post vs. ex-ante: A clear distinction was also made between the ex-post measurement of frontier research on the project level and the ex-ante measurement on the proposal level. The latter was considered more problematic but also the main way in which the DBF indicators could be used by ERC.
Dimensions: There was some criticism of the DBF indicators for not fully encompassing the idea of frontier research. 1) The indicator risk was questioned for only measuring one of many dimensions of risk (researcher's personal risk, and not the one of funding organisation, research institutes or the proposed project itself) and that the negative side of risk – failure – was neglected. 2) Interdiscipli-narity was criticised for not accounting for all its different dimensions, in particular for neglecting vary-ing distance between different scientific disciplines. 3) Pasteuresqueness was doubted to have rele-vance to ERC whose role it is to fund, in the first place, basic research.
The second main finding of the workshop concerned the added value of bibliometrics for research funding organisations. Here the DBF and the ERACEP project could play quite different roles.
1.19.2 Added value of bibliometrics for research funding organisations (ERC)
Despite clear limits to the use of bibliometrics to measure frontier research and emerging research areas its potential for implementation within funding agencies was found relevant for exploring fur-ther. There was a general agreement that funding decisions should never rely on bibliometrics alone but could be used in combination with expert/qualitative review. In this view many different applica-tions of bibliometrics for operations of ERC were elaborated including monitoring the long term im-pact of ERC. However, the main ways in which the DBF approach could be used in ERC is in the following ways:
Ex-post evaluation in support of future strategic thinking
Since ERC aims to support projects and researchers that are working on issues that are not yet visi-ble to bibliometrics (which is based on past achievements) the most useful employment for biblio-metric indicators for ERC was recognised in the ex-post evaluation context, for a purpose of inform-ing future strategic thinking of ERC.

86 Synthesis Report
The DBF approach can mainly be used in one way to inform strategic thinking through the evaluation of funding decisions and mechanisms. Bibliometrics can provide measures to what extent outcomes of ERC funded research meets criteria of frontier research (including identifying and structuring emerging fields) by looking at results (papers, patents, citations) of ERC funded projects portfolio. The same logic can be further extended to evaluate researchers, research organisations and even participating regions, as well as put in place to monitor peer review system and the outcome of its different panels, by evaluating their selection decisions according to the bibliometric (frontier re-search) indicators.
This can then of course feed into ERC strategy. The use of bibliometrics ex-post can offer great po-tential to monitor interesting issues for ERC. The results of such approaches could feed into the stra-tegic thinking of ERC and support the Scientific Council in what could be called reflexive strategy building. Some of these ideas are already in the pipeline, and more of them could be considered, to be integrated into ERC research information system (ERIS) which will serve as a central reporting tool for monitoring and evaluation of ERC activities.
Ex-ante support to ERC evaluation process
The ex-ante use of indicators for frontier research is a much more debated way of deploying biblio-metrics in support of ERC operations. Despite general agreement that bibliometric indicators alone should never be used to determine funding decision, their potential to assist and complement peer-review selection process should not be neglected. Bibliometric indictors could help in identifying re-search proposals with frontier research potential.
Pre-evaluation of the proposals: One option is to put in place bibliometric indicators of frontier re-search to assess the quality of proposal and model/predict its selection outcome by statistical me-chanics (statistical simulation of peer review selection process). The results would provide a statisti-cal assessment of the quality of the proposals with a numerical prediction (probability) of the selec-tion outcome. In particular the bibliometric indicators of interdisciplinarity and innovativeness as in-troduced by DBF have proven to be good predictors of the ERC peer review selection criteria.
A solution like this could be helpful in the first step of proposals review, to be used for bibliometric (pre)screening of proposal. This could be useful for reducing workload of the selection panels by identification of (low) quality proposals that are (not) worth bringing to their attention, or may need some kind of special treatment. For example, bibliometric model can reveal genuinely interdiscipli-nary or very novel proposals and ERC could consider if this information can be in any way useful for special treatment of such proposals.
Monitoring the peer review evaluation process: Alternatively, a bibliometric model approach could again be useful at the very end of the evaluation process, before the final decision of the panel is taken, to reflect on the selection from another - "empirical" point of view - provided by bibliometric indicators.
Designing ERC panels and distribution of proposals: Bibliometric techniques of science mapping provide an insight into state of the art of scientific landscape, revealing relationships between scien-tific disciplines and corresponding research topics/questions/methods addressed in each of them.
The DBF indicator interdisciplinarity was used at the final workshop as a tool for looking at the panels and the interdisciplinary nature of the proposals selected. The concept behind the indicators can be used by ERC for thinking about specifying the concept of frontier research and what it means in prac-tice.
87
Confidence in indicators
The peer review process could benefit from all these approaches. However, before any step in this direction is even considered, bibliometric indicators and decision models based on them would need to be tested and proven to be 100% confident (sensitive and robust!). The first problem in achieving this was said to be cross-domain disparities in publication culture and patterns; in particular the SSH domain would be difficult to fit into a general bibliometric model.
There was also a worry that if bibliometric indicators became a part of the evaluation process, this would open a window for manipulation which could have a negative effect. Researchers will try to fit their proposals with bibliometric model to improve their chance of being selected, rather than being creative and going beyond the expectations and frontiers of knowledge.
1.19.3 Implementation of bibliometric techniques into ERC operations
Data issues: The two projects stressed enormous difficulties in processing the data received from ERC. ERC application format (in PDF) is very difficult to extract bibliometric data from and requires complex mechanical or long and time consuming manual operations that are both prone to errors. If ERC wants to use bibliometric indicators for any serious purpose it was recommended that it needs to introduce more structured application format and a common standard for bibliographic references. Utmost important, it would need to assure that application data is available in machine readable for-mat. Clearly structured application in machine readable data format is a first condition for swift and reliable mechanical bibliometric analysis.
Internalisation: Measurement of standard bibliometric indicators (publications, citations, patents) can be internalised provided that ERC gets access to external bibliographic data from one of the major academic bibliographic databases on the market (WoS, Scopus). However, the most interest-ing point here is to what extent ERC could use the DBF indicators.
Externalisation: Measurement of specific (frontier research) bibliometric indicators (interdisciplinari-ty, risk, novelty, and pasteuresqueness) is more difficult to internalise independently as this, in itself, is still a research in progress and no standard bibliometric techniques or tools to measure them are yet available.
1.19.4 Workshop conclusions
Ex-post application of bibliometrics for monitoring and evaluation of (individual or portfolio of) re-search projects, researchers, research organisations, and even research funding organisations was not disputed. This is a well-established and conventional way of assessing and benchmarking the value and impact of past research. On the other hand, many reservations were made over ex-ante use of bibliometrics in the evaluation phase. It was generally agreed that this line of bibliometrics deserves further attention with ERC strongly encouraging further study and development of the po-tentials provided by bibliometrics hereby, by following-up on the work of DBF and ERACEP projects. However, the position of ERC on actually using such bibliometric techniques in the evaluation pro-cess was rather negative. It was mentioned that ERC's current efforts goes even into de-emphasising the value of standard/conventional bibliometric indicators in their briefing introduction to peer review evaluation process.
On the other hand, bibliometric techniques can be a powerful tool in specific situations/operations of research funding organisations and it would be stupid to ignore this. Just like bibliometrics, peer re-view also has its own flaws and combination of both was recommended as the best approach by the experts, who offered an interesting figure: in 75% of cases peer review agrees with bibliometric indi-cators, while only 25% of cases show a discrepancy that need special attention and deliberation.
88 Synthesis Report
There was a consensus that bibliometric techniques indeed could be used to assist and complement the peer-review process, but they should not be used in making funding decisions by substituting them for peer/expert based evaluation. Bibliometrics could be used as an information provision tool in the hand of scientific officers/peers/experts who should be able to guide the application of such tools to meet their needs and help them making better informed funding decisions. Bibliometrics ex-ante could complement peer review by providing it with additional new information on the individual research proposal, rather than being used to value the information that is already available in-there.
Before even considering the implementation of ex-ante bibliometric techniques in the operations of ERC such techniques would have to prove to be confident: clear in understanding, easy to use, reli-able (sensitive and robust at the same time), and well tested for their validity. The main problem in reaching this level of confidence however does not stay with bibliometrics and its techniques, but is rooted in the science itself. By radical deviation of SSH domain from generally established conven-tions of communicating scientific results (this being the base of any bibliometric technique) and in this respect, different standards in different scientific disciplines, a universal, standardised, and confident approach for bibliometric analysis of research proposals is simply not feasible. A hybrid approach (still very much in its development) combining bibliographic and textual approach was mentioned as the way forward in this direction.

89
Recommendations
The main conclusion from the DBF project is that the direction is the right one, and that the DBF pro-ject was addressing the right questions. The work involved in the project, however, was enormous and certain elements of the process were considerably underestimated. The DBF results are ones that ERC can and has been building on. However, there is still a considerable amount of work to be done in order to produce solid, working indicators for frontier research that could be used in ERC peer review process. This section on recommendations synthesises the review by the project team and the feedback from the final workshop and presents some of the ways in which the DBF results could be improved on in the future.
Improving the conceptualisation of the indicators
The DBF project entered new territory from a bibliometric point of view with the definition of the indi-cators. The indicators were developed to specifically assess frontier research and not just to work with standard bibliometric indicators. Trying to define frontier research in terms of bibliometric data was not an easy task and it certainly involved taking certain limitations into account and working with what can be measured. The conceptualisation of frontier research in the form of indicators should be revisited for the following reasons:
Risk should be revisited as it was thought to be the wrong type of risk that the DBF project had conceptualised
- Risk also needs to be seen in terms of funding organisation, research institutes or the pro-posed project itself
- Risk also needs to be conceptualised from the negative side – failure was not included in the DBF indicator
Interdisciplinarity should be revisited as it is only one type of interdisciplinarity that it picks up and perhaps it would be possible to think of measuring another type
- the varying distance between different scientific disciplines could be another aspect of in-terdisciplinarity
Pasteuresqueness should be revisited as patents is not a form of indicator ERC would like to see used
In addition future work could concentrate on the level on which frontier research is measured. Does every project have to contain all five indicators or is it possible to have a definition of frontier research that could be used flexibly?
However, the main problem for many of the indicators was the problem that collecting the data and calculating them was too complicated and time consuming. Before an organisation such as ERC would be able to implement such indicators they would have to become considerably easier to im-plement. This would entail both developing indicators that would be easier to implement and could be implemented automatically such as interdisciplinarity also and finding ways of simplifying the data collection.
90 Synthesis Report
Understanding the indicators – using panels
One way in which ERC could understand what is going on between ERC selection of proposals and discrepancy with the DBF indicators is to have a panel look at the content of the proposals and see if they can see why the DBF indicators have ranked a proposal highly or not. It would be very interest-ing to see whether a panel would view a project in a different light having seen the DBF rankings.
Understanding the indicators – interdisciplinary research to join concepts to meas-urements
One of the largest open questions of the DBF project is: Are these indicators the best way of measur-ing frontier research and perhaps more importantly, whether the indicators are measuring what they are supposed to be measuring. One way of taking the development of such conceptual indicators further is to bring together researchers from different areas to work together. This project has shown that the future development of indicators could be improved by joining forces with research that focus on more conceptual issues such as interdisciplinarity. Another way of improving indicators would be to bring together experts on peer review processes and member of panels to better understand what the issues are and where best peer review process could be supported. These issues are by nature interdisciplinary and need an interdisciplinary answer that cannot be provided by any one discipline alone.
Improving the data collection
The preparation of both data sets (ERC and other data sources) was very time consuming. Some of these problems could be overcome in the future. One of the ways in which the indicators could be improved would be through having better data to start with either through changing the way in which data from the PIs is collected or through developing tools to make the extraction of data more effi-cient.
Extracting better data from the PIs
The provision of ERC data could be improved by having the data provided in a format that could be used directly to calculate indicators, i.e. not having to extract the data from PDFs first. This would entail the PIs submitting their references in a separate part and in a particulate format so that they could be compared with other data sources. Information about patents could also be collected in a predefined format. In addition, as many researchers now have a Web of Science ID, the PIs could be asked to provide it so as to make identifying them easier. However, the question remains what effect this would have if applicants thought that ERC was using their identification to assess them.
Tools to speed up the extraction of data
The extraction of the data for the indicator innovativeness could be made more efficient through de-veloping a data extraction tool. As described in the section of the innovativeness indicator, there are also other tools on the market at the moment that have been developed since the project started that could also be used to assist the data extraction.
Using the model in different ways
There are several ways in which the model could be improved. The model would also benefit from better data and it would also benefit from having a larger data set than was available for several of the indicators. A comparison could then be made across different panels and different years. How-ever, the issue of additional variables was one that was discussed.
91
Additional control variables may be taken into account, not only for isolating frontier research effects from other intervening factors, but also to get additional insights into which mechanisms are at work in the review panels. Since reviewers are confronted with a high work load, the result that university ranking is a statistically important determinant of selection outcome may be a hint in this direction; note that the university ranking variable may be interpreted as a rough proxy for the general excellence of the researcher, assuming that the best researchers may apply for the best universities.
However, such additional variables are also subject to the number of observations and data is-sues. The calculation of both frontier research variables and control variables for a larger set of proposals, also for different points in time, may indeed improve inferences that can be drawn from the model. Of course this is also subject to data availability and the form in which data are delivered so that automated or at least semi-automated processing is possible.
The implementation of bibliometric and scientometric indicators in ERC
The main idea behind the project was to see how and where bibliometric indicators could be used by ERC. The summary of the final workshop addressed many different ways in which bibliometric indi-cators could be used in ERC peer review process to reflect on the peer review process, by comple-menting it and making it more transparent. The question is how to take the implementation of biblio-metric indicators to the next stage now that we know where they would theoretically be useful?
One option is to put in place bibliometric indicators of frontier research to assess the quality of proposal and model/predict its selection outcome by statistical mechanics (statistical simulation of peer review selection process). A solution like this could be helpful in the first step of pro-posals review, to be used for bibliometric (pre)screening of proposal.
For example, a bibliometric model can reveal genuinely interdisciplinary or very novel proposals and ERC could consider if this information can be in any way useful for special treatment of such proposals.
Alternatively, a bibliometric model approach could again be useful at the very end of the evalua-tion process, before the final decision of the panel is taken, to reflect on the selection from an-other - "empirical" point of view - provided by bibliometric indicators. In this way it would serve as a validation tool for the decision of panels before the selection outcome is announced. The bibli-ometric "frontier research" model could be run to numerically evaluate portfolio of (non-)selected proposals after each step of the peer-review process to reveal any bias or identify possible outli-ers.
One future step would be to work with a panel on an experimental basis to gauge their reactions to the use of indicators. It would be interesting to see how they would react to using such indicators in different parts of the process.
Watching out for the problems
However, before bibliometric indicators could be implemented by ERC several problems would have to be solved.
The first problem in achieving is the cross-domain disparities in publication culture and patterns. In particular the SSH domain would be difficult to fit into a general bibliometric model. The question is how could this problem be solved? The publication pattern is not likely to change. If SSH was left out of bibliometric supported peer review processes would this have an effect on proposal selecting?

92 Synthesis Report
A second problem is the concern that if bibliometric indicators became a part of the evaluation pro-cess, this would open a window for manipulation which could have a negative effect. Researchers will try to fit their proposals to bibliometric model to improve their chance of being selected, rather than being creative and going beyond the expectations and frontiers of knowledge.
Both these issues are ones which would have to be monitored long-term to see if any changes were taking place if an experimental phase were to be introduced.
Measuring for decision making
It is one thing to be able to measure something and a very different thing to use it as a basis for deci-sion making. The final workshop focused on the use of implementing bibliometric indicators ex-ante. There was an almost unanimous agreement at the workshop that bibliometric techniques could be used to assist and complement the peer-review process, but they should not be used in making fund-ing decisions by substituting them for peer/expert based evaluation. Bibliometrics used ex-ante could complement the peer review process by providing it with additional new information on the individual research proposals.
The main issue here and this is perhaps one of the main conclusions that would need further re-search, is about how you interpret the things that are being measured. Just because things can be measured does not been that they should form the basis of decision making. More work need to be done on translating the conclusions of bibliometric indicators for use in policy making. This project and especially the final workshop revealed that this is perhaps still too little understood. This would again probably need an interdisciplinary focus to bring together people who understand the larger picture with those who measure the details.

93
References
Adam D. (2002)
Citation analysis: The counting house, Nature, 415, pp. 726-729
Albright J.J, Marinova D.M. (2010)
Estimating Multilevel Models using SPSS, Stata, SAS, and R, Indiana, Indiana State University
Bornmann L., Leydesdorff L., & van den Besselaar P. (2010)
A Meta-evaluation of Scientific Research Proposals: Different Ways of Comparing Rejected to Awarded Applica-tions. Journal of Informetrics 4(3) (2010) 211-220 Bornmann L., Daniel H. D. (2008)
What do citation counts measure? A review of studies on citing behavior
Chatterjee S., Hadi A.S., Price B. (2000)
Regression analysis by example. John Wiley & Sons, New York [USA]
Cuxac P., Cadot M., François C. (2005)
Analyse comparative de classification: Apport des règles d’association Floue. In EGC 2005, pp. 519–530
Daille B., Habert B., Jacquemin C., Royauté J. (1996)
Empirical observation of term variations and principles for their description. Terminology, 1996, 3:2, pp.197-257
EC – European Commission (2005)
Frontier research: The European Challenge. High Level Expert Group Report, EUR 21619 ERC – European Research Council, (2010)
ERC Grant Schemes Guide for Peer Reviewers Applicable to the ERC, Starting Grants and Advanced Grants (Work-Programme 2011), updated September 2010, retrieved January 7, 2011, from http://erc.europa.eu/pdf/Guide_ERC_Peer_Reviewers_2011.pdf.
Efron B., Tibshirani R. (1993)
An Introduction to the Bootstrap. Boca Raton, FL: Chapman & Hall/CRC
Glänzel W., Meyer M. (2003)
Patents cited in the scientific literature: An exploratory study of “reverse” citation relations. Scientometrics, 58, pp. 415-428
Glänzel W., Zhou P. (2011)
Publication activity, citation impact and bi-directional links between publications and patents in biotechnology. Scien-tometrics, 86, pp. 505-525
Greene W. H. (2003)
Econometric analysis, Fifth Edition, Prentice Hall, Upper Saddle River, NJ
Han J., Kamber M. (2001)
Data Mining : Concepts and Techniques. San Francisco: Morgan Kaufmann Publishers
Hand D. Mannila H., Smyth P. (2001)
Principals of Data Mining. Cambridge, Massachusetts, USA: The MIT Press
Hojat M., Gonnella J.S., Caelleigh A.S., (2003)
Impartial judgment by the “gatekeepers” of science: Fallibility & accountability in the peer review process. Advances in Health Sciences Education, 8, pp. 75-96
Jacquemin C. (1994)
FASTR: A unification-based front-end to automatic indexing. In: Proceedings of RIAO 1994, New York, USA
Jacquemin C. and Royauté J. (1994)
Retrieving terms and their variants in a lexicalized unification-based framework. In: Proceedings of SIGIR 1994, Dublin, Ireland, July 3rd – 6th
Jacquemin C., Tzoukermann E. (1999)
NLP for term variant extraction: A synergy of morphology, lexicon and syntax. Strazlkowski T. (ed.), Natural Lan-guage Information Retrieval, Kluwer, Boston, 25-74
Juznic P., Peclin S., Zaucer M., Mandelj T., Pusnik M., Demsar F., (2010)
Scientometric indicators: peer-review, bibliometric methods and conflict of interest, Scientometrics, 85, pp. 429-441
94 Synthesis Report
Lelu A. (1993)
Modèles neuronaux pour l’analyse de données documentaires et textuelles. PhD Dissertation, Université de Paris 6
Lelu A., François C. (1992)
Hypertext paradigm in the field of information retrieval: A neural approach. 4th ACM Conference on Hypertext, Mila-no, November 30th–December 4th
Luukkonen T. (2012)
Conservatism and risk-taking in peer review: Emerging ERC practices, Research Evaluation 21(1): 48-60
Marsh H.W., Jayasinghe U.W., Bond N.W., (2008)
Improving the peer-review process for grant applications - Reliability, validity, bias, and generalizability, American Psychologist, 63, pp. 160-8
Moed H.F., Glänzel W., Schmoch U. (2004)
Handbook of quantitative science and technology research: The use of publication and patent statistics in studies of S&T systems. Kluwer Academic Publishers
Nederhof A.J., (2006)
Bibliometric monitoring of research performance in the Social Sciences and the Humanities: A review. Scientomet-rics, 66, 81-100
van Noorden R., (2010)
A profusion of measures, Nature, 465, pp. 864-865.
Polanco X., François C., Ould Louly M.A. (1998)
For Visualization-based Analysis Tools in Knowledge Discovery Process: A Multilayer Perceptron versus Principal Components Analysis. A Comparative Study. In: Proceedings of PKDD 1998
Polanco X., François C., Royauté J., Besagni D., Roche I. (2001)
Stanalyst®: An integrated environment for clustering and mapping analysis on science and technology. In: Proceed-ings of the 8th ISSI, Sydney, July 16th - 20th
Polanco X., Grivel L., Royauté J. (1995)
How to do things with terms in informetrics: Terminological variation and stabilization as science watch indicators. In: Proceedings of 5th International Conference of the International Society for Scientometrics and Informetrics, M.E.D. Koening and A. Bookstein (eds.), Medford (NJ, USA): Learned Information Inc., pp. 435-444
Roche I., Vedovotto N., Besagni D., François C., Mounet R., Schiebel E., Hörlesberger M. (2011)
Identification of emergent research issues: the case of optoelectronic devices. Optoelectronic Devices and Proper-ties, Oleg Sergiyenko (Ed.), ISBN: 978-953-307-204-3, InTech Available from: http://www.intechopen.com/articles/show/title/identification-of-emergent-research-issues-the-case-of-optoelectronic-devices
Roche, I., Vedovotto, N., François, C. Besagni, D. Cuxac, P., Hörlesberger, M. Holste, D., Schiebel E. (2012)
Towards a methodology based on the content analysis to estimate the potential applicability of a research project. In: S&TI 2012, Montréal, Canada, September 5th – 8
th
Royauté J. (1994)
Formal description of complex noun phrases with predicative nouns. Current Issues in Mathematical Linguistics, C. Martin-Vide (ed.) Amsterdam: North-Holland, pp. 209-218
Royauté J. (1999)
Les groupes nominaux complexes et leurs propriétés : application à l’analyse de l’information, Thèse de doctorat en informatique, LORIA,Univ. Henri Poincaré-Nancy I
Schiebel E., Hörlesberger M., Roche I., Francois C., Besagni D. (2010)
An advanced diffusion model to identify emergent research issues: the case of optoelectronic devices, Scientomet-rics, online; DOI 10.1007/s11192-009-0137-4
Schmid H. (1994)
Probabilistic Part-of-Speech Tagging Using Decision Trees. In: Proceedings of International Conference on New Methods in Language Processing, Manchester, UK
Stokes D.E. (1997)
Pasteur’s Quadrant. Basic Science and Technological Innovation, The Brookings Institution Press
Train, K.E. (2009)
Discrete Choice Methods with Simulation. 2nd edition, Cambridge University Press, Cambridge
van den Besselaar P., Leydesdorff L. (2009)
Past performance, peer review and project selection: a case study in the social and behavioral sciences, Research Evaluation, 18, pp. 273-288
Annex 1 – Conferences attended
This annex contains an overview of the conferences attended during the project and conferences that will be attended in the near future and where DBF results will be presented.
Conferences attended
13th ISSI (International Society for Informetrics and Scientometrics) Conference
Conference focus
The International Society for Informetrics and Scientometrics, ISSI, is an association of professionals active in the interdisciplinary fields of informetrics, bibliometrics/scientometrics, technometrics and webometrics. Among its membership are scientists from over 30 countries representing all five conti-nents. The Society aims to encourage communication and exchange of professional information in the field of scientometrics and informetrics, to improve standards, theory and practice in all areas of the discipline, to stimulate research, education and training, and to enhance the public perception of the discipline. The articles of Association state that the aim of ISSI is the advancement of the theory, methods and explanations through two main streams: quantitative studies, and mathematical, statis-tical, and computational modelling and analysis of information processes.
The ISSI organises biennially since 1987 a conference to promote the meeting of scientometric and informetric scholars from around the world. The 13th edition of ISSI Conference was held in July 2011 at Durban.
Paper presented
Holste, D., Roche, I., Hörlesberger, M., Besagni, D., Scherngell, T., Francois, C., Cuxac, P. and Schiebel, E. (2011)
A concept for Inferring "Frontier Research" in Research Project Proposals. Noyons, E., Ngulube, P. and Leta, J. (Eds.), Proceedings of the ISSI 2011 Conference. 13th International Conference of the International Society for Sci-entometrics & Informetrics. Volume I, July, 4th-7th, Durban, South Africa, 315-326
Paper focus
At this conference we present a paper dealing with the conceptual approach of the metrics devel-oped in the DBF project. Basically, we describe the modelling of the evaluation criteria operated on the ERC proposals in a way that they can be measured using information included in the grant appli-cations and in additional bibliographical databases. The paper discusses a concept for inferring at-tributes of ‘frontier research’ in peer-reviewed research proposals under the popular scheme of the European Research Council (ERC). The concept serves two purposes: firstly to conceptualise, de-fine and operationalise in scientometric terms the attributes of ‘frontier research’; and secondly to build and compare outcomes of a statistical model with the review decision in order to obtain further insight and reflect upon the influence of frontier research in the peer-review process. To this end, indicators across scientific disciplines and in accord with the strategic definition of frontier research by the ERC are elaborated, exploiting textual proposal information and other data of grant applicants. Subsequently, a suitable model is formulated to measure ex-post the influence of attributes of frontier research on the decision probability of a proposal to be accepted. We present first empirical data as proof of concept for inferring frontier research in grant proposals. Ultimately the concept is aiming at advancing the methodology to deliver signals for monitoring the effectiveness of peer-review pro-cesses.
88 Synthesis Report
2011’s ENID (European Network Indicators Designers) Conference
Conference focus
The European Network Indicators Designers (ENID) is an association under the French law, whose ob-jective is to promote the cooperation between institutions and individuals working in the field of Science and Technology Indicators (S&TI). In particular, it aims to promote following activities in the field:
the organisation of an international conference series on S&TI jointly with the Centre for Science and Technology Studies (CWTS, Leiden) that investigates the development of science and tech-nology using large-scale databases of scientific and technical publications;
the organisation of researcher’s training activities on science and technology indicators;
the publication of scholarly papers and of journals special issues devoted to S&TI;
the diffusion of information on events and activities related to indicators, especially through a website and the ENID mail list.
ENID and CWTS Leiden organise from 2010 onwards the STI Indicators Conference Series: the aim of the conference series is to provide a forum for discussion an advances in STI indicators around the no-tion of positioning indicators and focusing on new emerging areas, as well as on the development of advanced methodologies for STI indicators. Besides scholarly presentations, the conference series aims also to promote networking and cooperation between researchers, international organisations and users of STI indicators, to contributing also their relevance for policy making. The conference takes place each year. The 2011’s edition of the conference took place at Rome.
Paper presented
Hörlesberger, M., Holste, D., Schiebel, E., Roche I., Francois, C., Besagni, T. and Cuxac, P. Measuring the Preferences of the Scientific Orientation of Authors from their Profiles of Published References
Paper focus
We present a paper dealing with the assessment of the scientific change of authors from their profiles of published references. This work is directly derived from an indicator inferring one of the evaluation crite-ria operated on the ERC proposals, and developed in the DBF project. How much is the current research of a scientist related to his work performed in the past? This research question naturally arises while tracking the ‘research path’ of the development of any scientist either working always in the same field or having decided to change his research field at a certain moment of his career. These two kinds of re-searchers with such different behaviours have been metaphorically qualified by Michel Serres, a French philosopher, science historian and author, as, respectively, a wild boar, pursuing indefatigably his re-search themes, and a fox, always loan to investigate the other paths. Stepping out of one’s known scien-tific and research environment creates new opportunities as well as potential risk, and there is an interest in defining and identifying such path and people changing from one field toward another. The core re-search question is how the movement of a scientist within different research fields can be assessed by comparing the profiles of his cited references in his scientific publications. The hypothesis behind is that we assume if a scientist moves to a new field his/her citations in the current work will be different from his/her former publications. For assessing this movement the citation reference profiles are compared and measured once by the correlation coefficient and by the cosine. The constraints and advantages of this approach are discussed. The method is presented and discussed firstly on fictive examples and ap-plied to three actual cases. It turns out that the cosine is a reliable measurement for the problem in ques-tion.

89
1st GTM (Global TechMining) Conference
Conference focus
The goal of the Global TechMining Conference is to help build cross-disciplinary networks of analysts, software specialists, and researchers to advance the use of textual information in multiple science, tech-nology, and business development fields. Within this context, the main conference themes are:
Data
o sourcing, preparing, and interpreting data sources including patents, publications, web-scraping, and other novel data sources
Text-mining tools and methods
o best practices in software-based topic modelling, clumping, association rules, term manipula-tion, text manipulation, etc.
o visualisation
Applied research
o Future-Oriented Technology Analysis (FTA)
o intelligence gathering to support decision-making in the private sector (e.g., management of technology)
This conference is intended for researchers and students across multiple fields, especially Scientomet-rics, Public Policy, Management of Technology and Information Science.
The conference takes place annually since 2011, and the first edition was held in September 2011 at Atlanta.
Paper presented
Roche, I., Ghribi, M., Vedovotto, N., Francois, C., Besagni, D., Cuxac, P., Holste, D., Hörlesberger, M., Schiebel, E. (2011)
Detecting domain dynamics: Association Rule Extraction and diachronic clustering techniques in support of exper-tise. Text-mining, Analysis and Visualization. First Global TechMining Conference, September, 13th - 14th, Atlanta
Paper focus
At this conference we present a paper which the goal is to identify the evolution trends of a scientific domain. In this work, two corpora of indexed bibliographic records related to the domain ‘Systems and communication engineering’ are extracted from the PASCAL database over two non-successive time periods. A clustering algorithm enables then to map each corpus in clusters of similar records with re-spect to their keywords. Metaphorically, the obtained cluster maps represent the publication scientific landscape at two different times. Then a diachronic analysis is operated by examining the content of each cluster and their relative position in the network of clusters. This huge expertise task consisting on to focus on the structural alterations of maps and clusters between the two periods: the merging, splitting and disappearing of clusters, as well as the presence of stable and new clusters or changes in cluster status. The application of the association rule extraction (ARE) techniques could significantly decrease the load of this essential expertise task, by providing a ranking of the clusters of the most recent cluster map, with respect to their dynamics. Finally, an indicator is developed to position a new element and assign to it a proximity value in relation to the similarity to the nearest clusters as well as the ranking of these clusters. The underlying hypothesis is: the similar the new element is to clusters of positive dynam-ic changes, the more innovative it is.

90 Synthesis Report
FRéDoc 2011
Conference focus
Renatis is the French national network of librarians and information officers in CNRS (French Center for Scientific Research). It was created in 2006 and its creation was motivated by common preoccupations, reflections and experiences focusing on, for instance, existing training initiatives. Renatis took place in the context of the complex French landscape of the scientific and technological information and is sup-ported by the MCRT (Mission for Resources and Technological Competences). The meeting FRéDoc (Training of Documentary Networks) appears also in 2006.
The 2011’s edition of FRéDoc was held at Bordeaux and focused on the ‘Research libraries and infor-mation through the prism of Europe’. The aim was to get acquainted with major European projects, how one works in other countries in Europe and improve our practices on the European scale, focusing on professional collaboration.
Contribution focus
At this conference, we have been invited to present the DBF project as an example of collaborative and fruitful collaboration made possible by an EC grant.
3rd VSST (Strategic, Scientific and Technological Watching) Conference
Conference focus
The VSST (Strategic, Scientific and Technological Watching) Conference is organised with the objective to bring together researchers, developers, and practitioners from academia and industry sectors working in all facets of competitive intelligence. The conference serves as a forum for the dissemination of state-of-the-art research, development, implementations of competitive intelligence systems, methodologies, technologies, and applications. The key objective of VSST is to create a program that achieves a bal-ance between theory and practice, academia and industry, systems/tools-oriented research and content creation. The 2012’s edition of VSST Conference took place at Ajaccio.
Paper presented
Roche, I., Vedovotto, N., François, C., Besagni, D., Cuxac, P., Hörlesberger, M., Holste, D. and Schiebel, E. (2012)
Evaluation du potentiel d'applicabilite d'un project de recherche: vers une methodologie fondee sur l'analyse de contenu. Le 3éme Séminaire de Veille Stratégique, Scientifique et Technologique - VSST'12, Mai, 24th - 25th, Ajac-cio, France
Paper focus
The question which we are studying in this work is the evaluation of the potential applicability of a re-search project. We were faced with this problem within the framework of a European project which goal is to support the selection process of research projects submitted for financing to the ERC (European Research Council). We have developed an analytical methodology based on the informetric modelling of criteria used by their scientific experts.
91
17th STI (International Conference on Science and Technology Indicators) Conference
Conference focus
The STI (International Conference on Science and Technology Indicators) has become the main yearly venue for the S&T indicators community of practitioners, researchers and users. The International Con-ference on Science and Technology Indicators, informally known as the ‘Leiden Conference’, was tradi-tionally held every other year. In 2010, it merged with the conference series organised by ENID (Europe-an Network of Indicator Designers), which was held in the alternate years. The resulting STI conference series will continue presenting high-quality scholarly work while also providing a venue for networking and the promotion of cooperation between researchers, international organisations and other S&T indica-tor users.
The 2012 STI conference was jointly organised by Science-Metrix and the Observatory of the Sciences and Technologies (OST, France) and has hold in September at the University of Québec at Montréal (UQAM). The 2012 edition was organised around the three following themes:
theoretical, historical, practical and social aspects of S&T indicator development and use;
methodological aspects in the use of S&T indicators and the production of statistics;
use of S&T indicators in R&D management and S&T strategy development and evaluation.
At this conference, we presented two papers:
Papers presented
Holste, D., Scherngell, T., Roche, I., Hörlesberger, M., Besagni, D., Züger, M.-E., Cuxac, P., Schiebel, E. and Francois, C. (2012)
Capturing Frontier Research in Grant Proposals and Initial Analysis of the Comparison between Model vs. Peer Review. Archambault, E., Gingras,Y. and Larivière, V. (Eds.), Proceedings of STI 2012 Montréal - 17th International Conference on Science and Technology Indicators, Volume 1, September, 5th-8th, Montréal, Canada, 389-402
Paper focus
The first one discusses a scientometric-statistical model for inferring attributes of ‘frontier research’ in peer-reviewed research proposals submitted to the European Research Council (ERC). The first step conceptualises and defines indicators to capture attributes of frontier research, by using proposal texts as well as scientometric and bibliometric data of grant applicants. Based on the combination of indica-tors, the second step models the decision probability of a proposal to be accepted and compares out-comes between the model and peer-review decision, with the goal to determine the influence of frontier research on the peer-review process. In a first attempt, we demonstrate and discuss in a proof-of-concept approach a data sample of about 10% of all proposals submitted to the ERC call (StG2009) for Starting Grants in the year 2009, which shows the feasibility and usefulness of the scientometric-statistical model. Ultimately the overall concept is aiming at testing new methods for monitoring the effec-tiveness of peer-review processes by taking a scientometric perspective of research proposals beyond publication and citation statistics.
Papers presented
Roche, I., Vedovotto, N., Francois, C., Besagni, D., Cuxac, P., Hörlesberger, M., Holste, D. and Schiebel, E. (2012)
Towards a Methodology based on the Content Analysis to Estimate the Potential Applicability of a Research Project. Poster presentation. Archambault, E., Gingras,Y. and Larivière, V. (Eds.), Proceedings of STI 2012 Montréal - 17th International Conference on Science and Technology Indicators, Volume 2, September, 5th-8th, Montréal, Canada, 886-887
92 Synthesis Report
Paper focus
The second one discusses a methodology for evaluating the potential applicability of a research project submitted for funding to a grant agency. Our methodology develops a content analysis approach operat-ed with the help of text mining tools coming from the NLP (natural language processing) and clustering tools. So, firstly, we analyse the literature citing the researcher’s publications which expresses their ex-ploitation, in different ways and at different degrees of importance. It is a real and pragmatic information source about the utilisation of his or her former works by colleagues in new researches. The content analysis approach applied to this corpus gives us the means to appreciate the applicability of the re-searcher’s work achieved before the submission of his or her project. By the way, we can detect poten-tially applicable works whose results could be integrated by colleagues in more applied issues. Secondly, in order to analyse more precisely the project itself, we focus on the literature sharing citations with the project by building a corpus of publications having at least one common cited reference with project bibli-ography. We guess that all these publications can represent works using partially the same foundations. The content analysis approach operated on this corpus allows us to qualify the degree of application of these works based on the same knowledge issues. Then, by analogy, we associate to the project the same degree of application. Finally, the comparison of these two analyses allows us to define the evolu-tion of the degree of applicability of the works of a researcher from his or her past works to his or her submitted project. We illustrate our methodology by processing a real case extracted from the results of a prestigious European funding agency that has established a selection process which is to identify sci-entific excellence of ‘frontier research’ as the sole evaluation criterion for funding decisions.
13th Collnet (Global Interdisciplinary Research Network for the Study of all Aspects of Collaboration in Science and in Technology) Conference
Conference focus
Collnet (Global Interdisciplinary Research Network for the Study of all Aspects of Collaboration in Sci-ence and in Technology) is representing a global interdisciplinary research network on the topic ‘Collabo-ration in Science and in Technology’ based on webometrics, informetrics and scientometrics as well as on qualitative aspects of science of science.
The development of information and library sciences together with science studies will, among other things, be fashioned by the development of the traditional quantitative studies conducted in this field called scientometrics or informetrics and nowadays additionally webometrics. Quantitative and qualitative aspects of science of science are studied as well as collaboration and communication in science and in technology.
The works on the topic of collaboration in science have, over a number of years, encouraged a number of scientists working in the field of quantitative as well as qualitative scientific research to concentrate their research in this field. This has led both to an increase in the number of relevant publications con-cerning this topic in international magazines, and to an increase in the number of lectures in international conferences.
Moreover, the rise in collaboration in science and technology experienced worldwide at national and international level, has assumed such an overriding importance that there is now an urgent need percep-tible to study such processes with a view to acquiring fundamental knowledge for organising future re-search and its application to science and technology policies. Therefore in the year 2000 the time had come, for three scientists from China, India and Germany, to create a global interdisciplinary research network Collnet on the topic "Collaboration in Science and in Technology". The Collnet members from more than 25 countries from all over the world intended to work on both theoretical and applied aspects. The focus of this research network is to examine the phenomena of collaboration in science, its effect on productivity, innovation and quality, and the benefits and outcomes accruing to individuals, institutions and nations of collaborative work and co-authorship in science. On account of the diversity of these is-sues it is possible to obtain promising results only against the backdrop of an interdisciplinary approach and from an intercultural viewpoint including both developing and developed countries. The 2012 edition of Collnet held in October at Seoul.
93
Paper presented
Roche, I., Vedovotto, N., Francois, C., Besagni, D., Hörlesberger, M., Holste, D., Schiebel, E. and Cuxac, P. (2012)
Assessment of the applied orientation of a researcher’s production: An informetric approach based on content analy-sis. 8th International Conference on Webometrics, Informetrics and Scientometrics and 13th COLLNET Meeting, October, 23rd-26th, Seoul, Korea
Paper focus
At this conference, we present a work occurring within this context of an evaluating process of the poten-tial applicability of the results produced by a researcher and published in the scientific and technological literature. Our methodology develops a content analysis approach operated with the help of text mining tools, coming from the NLP (natural language processing) techniques, and clustering tools. The primary data extracted from a bibliographic database corresponds to the list of the researcher’s publications in S&T literature. This list enables to determine the set of publications citing at least one of the extracted publications. This corpus can be considered as an image of the scientific landscape of citing papers that are based on the past work of this researcher. The deployment of the developed methodology allows relieving the final stage of expertise which nevertheless remains necessary. We illustrate our methodolo-gy by processing a real case extracted from the results of a prestigious European funding agency that has established a selection process which is to identify scientific excellence of frontier research as the sole evaluation criterion for funding decisions.
Conferences to be attended
14th ISSI (International Society for Informetrics and Scientometrics) Conference
The International Society for Informetrics and Scientometrics, ISSI, is an association of professionals active in the interdisciplinary fields of informetrics, bibliometrics/scientometrics, technometrics and webometrics. Among its membership are scientists from over 30 countries representing all five conti-nents. The Society aims to encourage communication and exchange of professional information in the field of scientometrics and informetrics, to improve standards, theory and practice in all areas of the dis-cipline, to stimulate research, education and training, and to enhance the public perception of the disci-pline. The articles of Association state that the aim of ISSI is the advancement of the theory, methods and explanations through two main streams: quantitative studies, and mathematical, statistical, and computational modelling and analysis of information processes.
The ISSI organises biennially since 1987 a conference to promote the meeting of scientometric and in-formetric scholars from around the world. The 14th edition of ISSI Conference has been held in July 2013 at Vienna. We plan to present the operated approach in the DBF project to produce a bibliometric indicator inferring the degree of interdisciplinarity of a project submitted for funding at an ERC call. In the process of evaluation set up by the ERC, the experts are supposed to choose the projects answering at the best to criteria defined by the High Level Expert Group. One of them is the intrinsic capacity of the issues of a project to cross the disciplinary barriers, the so-called, interdisciplinarity.
22nd IAMOT (International Association for Management of Technology) Con-ference
The International Association for Management of Technology, IAMOT, is a non-governmental, non-profit organisation incorporated in 1992 in the State of Florida, USA. Its purpose is to encourage high quality research and education in the field of management of technology (MOT). It accomplishes this purpose through various activities, including sponsoring international conferences; publishing newslet-ters/periodicals, conference proceedings, a book series and a scholarly archival journal on MOT and Innovation (Technovation). It also supports a number of other internationally recognised journals. IAMOT acts as an information exchange hub on teaching and research issues in MOT. IAMOT is the only inter-
94 Synthesis Report
national organisation dedicated to advancing the state-of-the-art in MOT education and research. As such, the majority of our members are faculty and students of degree granting academic institutions. The association has approximately 670 active members from 79 countries. IAMOT is chartered as a non-profit professional association in the USA and is governed through established bylaws. IAMOT member-ship meets at least once a year during the International Management of Technology conference. The theme of the IAMOT 2013 conference is ‘Science, Technology and Innovation in the Emerging Market Economies’. The 2013 edition of the conference will take place in April at Porto Alegre (Brazil).
We plan to study and compare, in the field of the Information and Communication Technologies (ICT), two different types of scientific production both coming from the research efforts. The first will be repre-sented by a corpus of records extracted from a bibliographic database and signifying the results of re-search works published in the scientific and technological literature. The second will be constituted by a corpus of records extracted from a database collecting the information related to the projects answering the calls for projects launched under the aegis of the European Commission in the framework of the Seventh Framework Programme (FP7). Then we will compare, in terms of the distribution of the treated topics and of the potential applicability of the works, these two corpora with the help of an expert. The main purpose is to point out discrepancies, convergences, antagonisms, complementarities between these two types of scientific production.
95
Annex 2 - Papers submitted for journal publication
Research Evaluation (from ENID)
Hörlesberger, M., Holste, D., Schiebel, E., Roche I., Francois, C., Besagni, T. and Cuxac, P. (submitted)
Measuring the Preferences of the Scientific Orientation of Authors from their Profiles of Published References;
Research Evaluation (from STI 2012)
Holste, D., Scherngell, T., Roche, I., Hörlesberger, M., Besagni, D., Züger, M.-E., Cuxac, P., Schiebel, E. and Francois, C. (2012) (submitted)
Capturing Frontier Research in Grant Proposals and Initial Analysis of the Comparison between Model vs. Peer Review.
Technological Forecasting & Social Change (from GTM 2011)
Roche, I., Ghribi, M., Vedovotto, N., Francois, C., Besagni, D., Cuxac, P. Holste, D., Hörlesberger, M., Schie-bel, E. (submitted)
Detecting domain dynamics: Association Rule Extraction and diachronic clustering techniques in support of exper-tise; FRéDoc 2011 - Electronic publishing (link to be determined)
Scientometrics (from ISSI 2011)
Holste, D., Roche, I., Hörlesberger, M., Besagni, D., Scherngell, T., Francois, C., Cuxac, P., Schiebel, E. and Zitt, M. (accepted) (2013)
A concept for inferring "frontier research" in grant proposals. Scientometrics
Scientometrics (from Collnet 2012)
Roche I., Vedovotto, N., Francois, C., Besagni, D., Hörlesberger, Holste, D., M., Schiebel, E., Cuxac, P. (sub-mitted)
Assessment of the applied orientation of a researcher’s production: An informetric approach based on a content analysis Intelligences Journal (from VSST 2012) - Electronic publishing (link to be determined) Roche, I., Vedovotto, N., Francois, C., Besagni, D., Cuxac, P. Hörlesberger, Holste, D., M., Schiebel, E. (sub-mitted)
Evaluation du potentiel d’applicabilite d’un projet de recherche : vers une methodologie fondee sur l’analyse de con-tenu
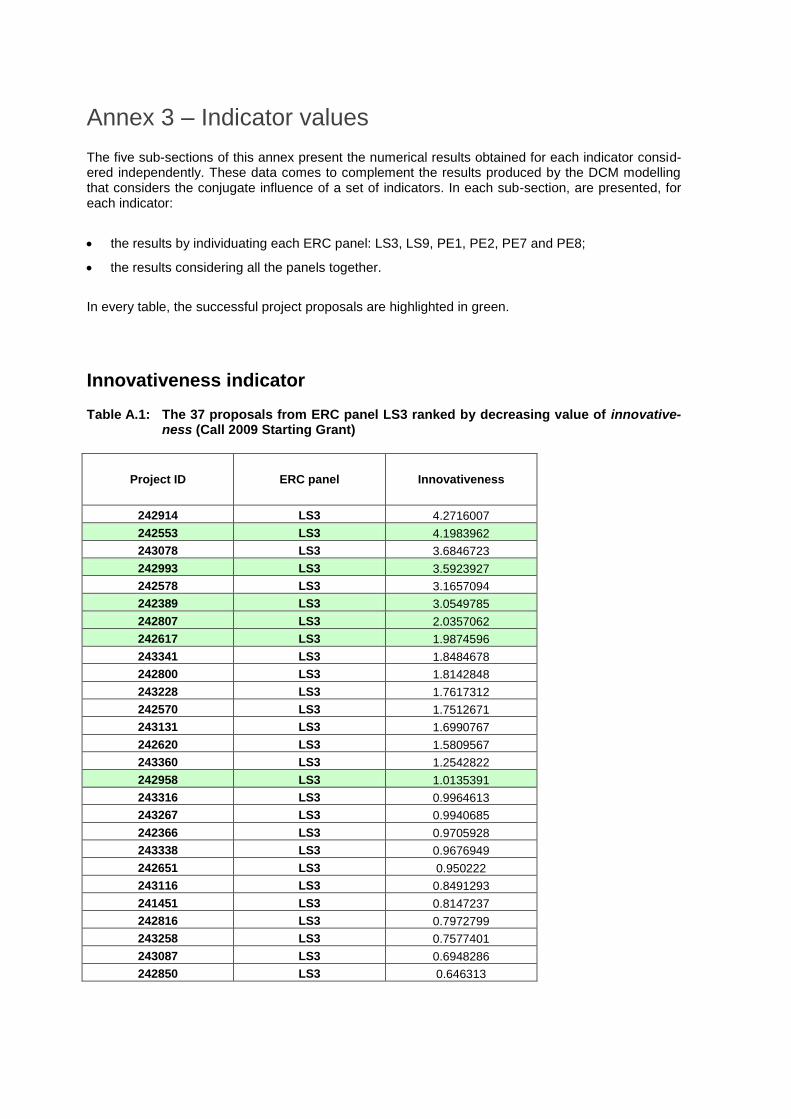
Annex 3 – Indicator values
The five sub-sections of this annex present the numerical results obtained for each indicator consid-ered independently. These data comes to complement the results produced by the DCM modelling that considers the conjugate influence of a set of indicators. In each sub-section, are presented, for each indicator:
the results by individuating each ERC panel: LS3, LS9, PE1, PE2, PE7 and PE8;
the results considering all the panels together.
In every table, the successful project proposals are highlighted in green.
Innovativeness indicator
Table A.1: The 37 proposals from ERC panel LS3 ranked by decreasing value of innovative-ness (Call 2009 Starting Grant)
Project ID ERC panel Innovativeness
242914 LS3 4.2716007
242553 LS3 4.1983962
243078 LS3 3.6846723
242993 LS3 3.5923927
242578 LS3 3.1657094
242389 LS3 3.0549785
242807 LS3 2.0357062
242617 LS3 1.9874596
243341 LS3 1.8484678
242800 LS3 1.8142848
243228 LS3 1.7617312
242570 LS3 1.7512671
243131 LS3 1.6990767
242620 LS3 1.5809567
243360 LS3 1.2542822
242958 LS3 1.0135391
243316 LS3 0.9964613
243267 LS3 0.9940685
242366 LS3 0.9705928
243338 LS3 0.9676949
242651 LS3 0.950222
243116 LS3 0.8491293
241451 LS3 0.8147237
242816 LS3 0.7972799
243258 LS3 0.7577401
243087 LS3 0.6948286
242850 LS3 0.646313
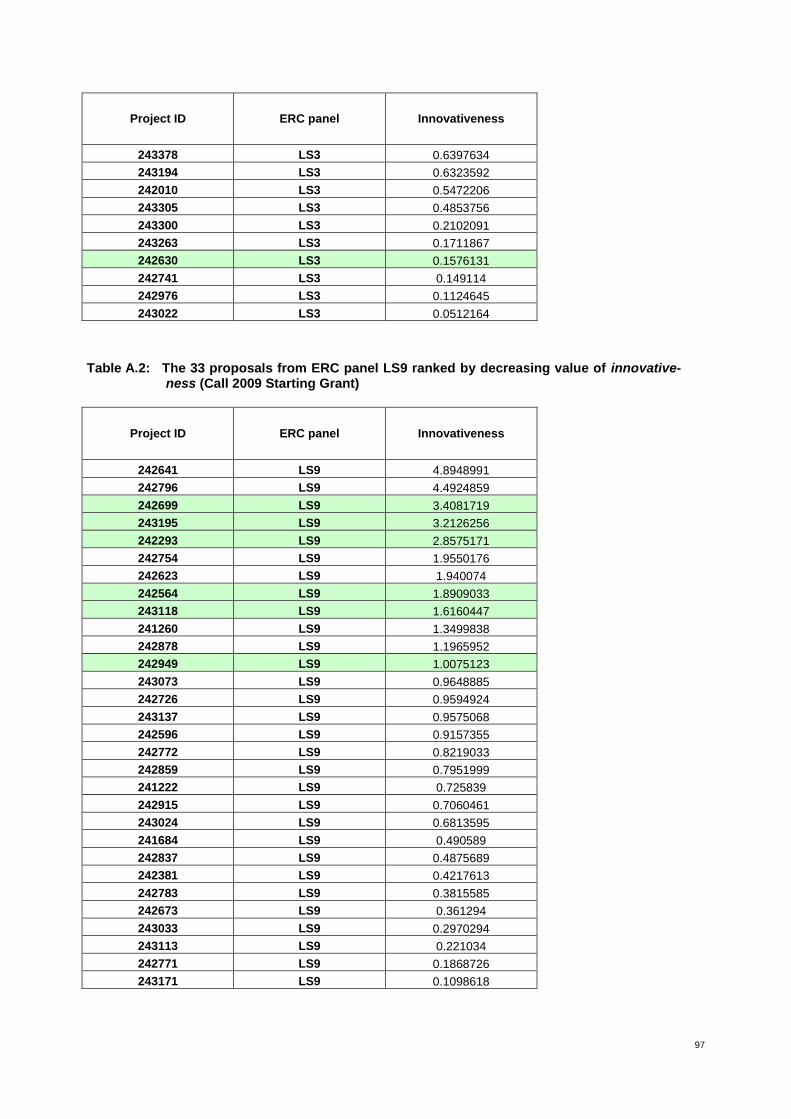
97
Project ID ERC panel Innovativeness
243378 LS3 0.6397634
243194 LS3 0.6323592
242010 LS3 0.5472206
243305 LS3 0.4853756
243300 LS3 0.2102091
243263 LS3 0.1711867
242630 LS3 0.1576131
242741 LS3 0.149114
242976 LS3 0.1124645
243022 LS3 0.0512164
Table A.2: The 33 proposals from ERC panel LS9 ranked by decreasing value of innovative-ness (Call 2009 Starting Grant)
Project ID ERC panel Innovativeness
242641 LS9 4.8948991
242796 LS9 4.4924859
242699 LS9 3.4081719
243195 LS9 3.2126256
242293 LS9 2.8575171
242754 LS9 1.9550176
242623 LS9 1.940074
242564 LS9 1.8909033
243118 LS9 1.6160447
241260 LS9 1.3499838
242878 LS9 1.1965952
242949 LS9 1.0075123
243073 LS9 0.9648885
242726 LS9 0.9594924
243137 LS9 0.9575068
242596 LS9 0.9157355
242772 LS9 0.8219033
242859 LS9 0.7951999
241222 LS9 0.725839
242915 LS9 0.7060461
243024 LS9 0.6813595
241684 LS9 0.490589
242837 LS9 0.4875689
242381 LS9 0.4217613
242783 LS9 0.3815585
242673 LS9 0.361294
243033 LS9 0.2970294
243113 LS9 0.221034
242771 LS9 0.1868726
243171 LS9 0.1098618
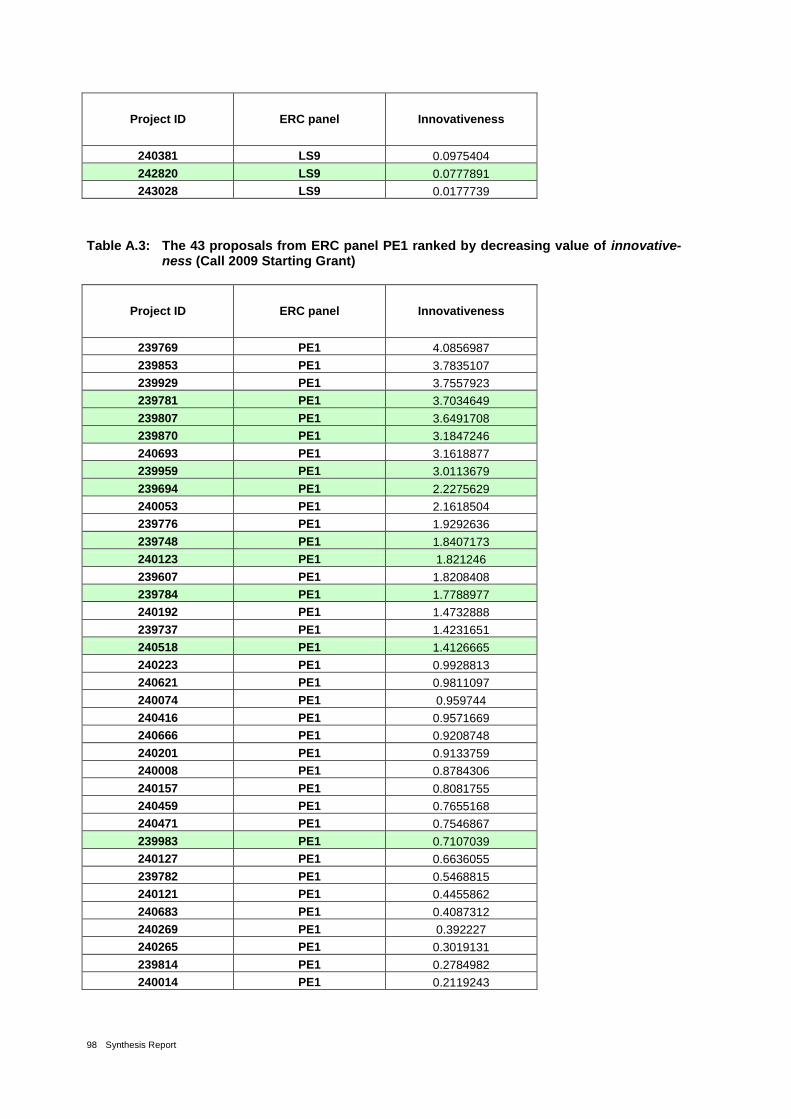
98 Synthesis Report
Project ID ERC panel Innovativeness
240381 LS9 0.0975404
242820 LS9 0.0777891
243028 LS9 0.0177739
Table A.3: The 43 proposals from ERC panel PE1 ranked by decreasing value of innovative-ness (Call 2009 Starting Grant)
Project ID ERC panel Innovativeness
239769 PE1 4.0856987
239853 PE1 3.7835107
239929 PE1 3.7557923
239781 PE1 3.7034649
239807 PE1 3.6491708
239870 PE1 3.1847246
240693 PE1 3.1618877
239959 PE1 3.0113679
239694 PE1 2.2275629
240053 PE1 2.1618504
239776 PE1 1.9292636
239748 PE1 1.8407173
240123 PE1 1.821246
239607 PE1 1.8208408
239784 PE1 1.7788977
240192 PE1 1.4732888
239737 PE1 1.4231651
240518 PE1 1.4126665
240223 PE1 0.9928813
240621 PE1 0.9811097
240074 PE1 0.959744
240416 PE1 0.9571669
240666 PE1 0.9208748
240201 PE1 0.9133759
240008 PE1 0.8784306
240157 PE1 0.8081755
240459 PE1 0.7655168
240471 PE1 0.7546867
239983 PE1 0.7107039
240127 PE1 0.6636055
239782 PE1 0.5468815
240121 PE1 0.4455862
240683 PE1 0.4087312
240269 PE1 0.392227
240265 PE1 0.3019131
239814 PE1 0.2784982
240014 PE1 0.2119243

99
Project ID ERC panel Innovativeness
239800 PE1 0.188382
239902 PE1 0.1269868
240633 PE1 0.1251828
239885 PE1 0.0971318
239952 PE1 0.0357117
240428 PE1 0.0318328
Table A.4: The 44 proposals from ERC panel PE2 ranked by decreasing value of innovative-ness (Call 2009 Starting Grant)
Project ID ERC panel Innovativeness
240603 PE2 4.802032
240390 PE2 4.3807927
240054 PE2 4.3375017
240333 PE2 4.1808642
239689 PE2 4.0394594
240292 PE2 3.7784716
240131 PE2 3.706471
239920 PE2 2.2027861
240315 PE2 1.9885216
239764 PE2 1.9592914
240036 PE2 1.9073647
239937 PE2 1.8097345
240004 PE2 1.5472155
239501 PE2 1.505957
239767 PE2 1.3324483
240486 PE2 1.2998317
239786 PE2 1.2575082
240034 PE2 1.2550951
240319 PE2 1.2510839
239681 PE2 1.243525
240091 PE2 1.2301561
240165 PE2 1.1580576
240286 PE2 1.149294
239695 PE2 1.1386244
240391 PE2 0.9339932
239999 PE2 0.9057919
240086 PE2 0.8234578
240616 PE2 0.807531
240162 PE2 0.7979286
239593 PE2 0.7739171
240354 PE2 0.5036627
240087 PE2 0.498364
239828 PE2 0.4747587
239949 PE2 0.4560328

100 Synthesis Report
Project ID ERC panel Innovativeness
240149 PE2 0.3987385
240213 PE2 0.3170995
239864 PE2 0.276923
240527 PE2 0.1738652
239680 PE2 0.1626117
240020 PE2 0.1418863
239860 PE2 0.1258966
240013 PE2 0.1189977
240040 PE2 0.0461714
240625 PE2 0.0344461
Table A.5: The 31 proposals from ERC panel PE7 ranked by decreasing value of innovative-ness (Call 2009 Starting Grant)
Project ID ERC panel Innovativeness
240406 PE7 4.2531482
240475 PE7 4.0131009
240205 PE7 3.9791262
239720 PE7 2.7891120
239986 PE7 2.6024873
239970 PE7 1.6896012
240456 PE7 1.6641112
239954 PE7 1.3077947
240108 PE7 1.1616939
239640 PE7 1.0550606
240717 PE7 1.0483630
240044 PE7 0.9894150
239987 PE7 0.8360117
240241 PE7 0.5556014
240236 PE7 0.5337129
240445 PE7 0.5116574
240655 PE7 0.4732998
240166 PE7 0.3967563
240049 PE7 0.3748664
240317 PE7 0.3644320
240218 PE7 0.3606187
239726 PE7 0.2866609
239827 PE7 0.2268073
240686 PE7 0.1936860
239932 PE7 0.1860426
240627 PE7 0.1755278
240432 PE7 0.1641978
240631 PE7 0.1635585
240555 PE7 0.1578166
239668 PE7 N/A

101
Project ID ERC panel Innovativeness
239700 PE7 N/A
Table A.6: The 35 proposals from ERC panel PE8 ranked by decreasing value of innovative-ness (Call 2009 Starting Grant)
Project ID ERC panel Innovativeness
240046 PE8 4.9676736
239745 PE8 4.751581
239913 PE8 4.419843
240446 PE8 4.2611873
239783 PE8 4.0050731
239865 PE8 3.1769614
240487 PE8 3.1413375
240675 PE8 1.7731907
240280 PE8 1.6248177
240490 PE8 1.5938915
240712 PE8 1.5555114
240529 PE8 1.4833794
239685 PE8 1.3110587
240454 PE8 0.8767574
240698 PE8 0.8350086
240030 PE8 0.8002805
240649 PE8 0.793975
240547 PE8 0.76375
240519 PE8 0.7406472
240436 PE8 0.7057743
240067 PE8 0.6787352
240682 PE8 0.6557407
240337 PE8 0.5852677
240462 PE8 0.4897644
240677 PE8 0.4387444
240072 PE8 0.4220877
240189 PE8 0.3403857
240710 PE8 0.3165504
239866 PE8 0.3081671
240332 PE8 0.2760251
240522 PE8 0.2238119
240050 PE8 0.135477
240372 PE8 0.0364413
239751 PE8 0.0047835
240093 PE8 0.0028184
Table A.7: The 223 proposals from ERC panels LS3, LS9, PE1, PE2, PE7 and PE8 ranked by decreasing value of innovativeness (Call 2009 Starting Grant)
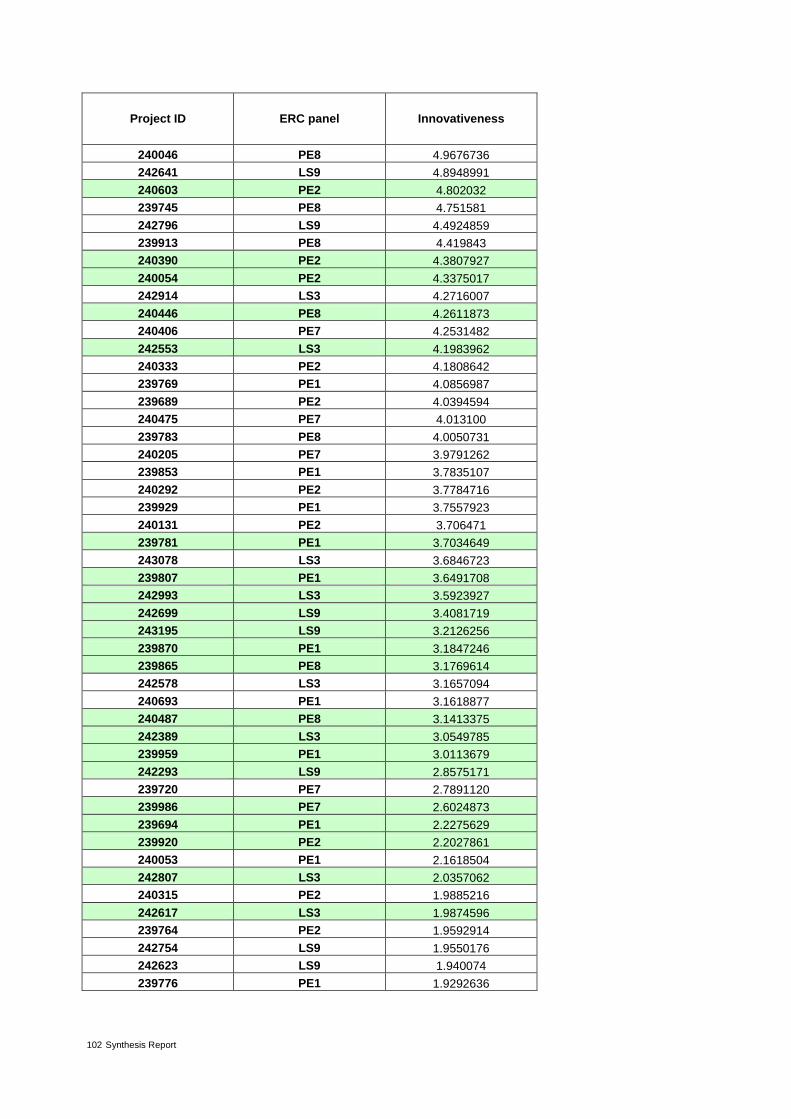
102 Synthesis Report
Project ID ERC panel Innovativeness
240046 PE8 4.9676736
242641 LS9 4.8948991
240603 PE2 4.802032
239745 PE8 4.751581
242796 LS9 4.4924859
239913 PE8 4.419843
240390 PE2 4.3807927
240054 PE2 4.3375017
242914 LS3 4.2716007
240446 PE8 4.2611873
240406 PE7 4.2531482
242553 LS3 4.1983962
240333 PE2 4.1808642
239769 PE1 4.0856987
239689 PE2 4.0394594
240475 PE7 4.013100
239783 PE8 4.0050731
240205 PE7 3.9791262
239853 PE1 3.7835107
240292 PE2 3.7784716
239929 PE1 3.7557923
240131 PE2 3.706471
239781 PE1 3.7034649
243078 LS3 3.6846723
239807 PE1 3.6491708
242993 LS3 3.5923927
242699 LS9 3.4081719
243195 LS9 3.2126256
239870 PE1 3.1847246
239865 PE8 3.1769614
242578 LS3 3.1657094
240693 PE1 3.1618877
240487 PE8 3.1413375
242389 LS3 3.0549785
239959 PE1 3.0113679
242293 LS9 2.8575171
239720 PE7 2.7891120
239986 PE7 2.6024873
239694 PE1 2.2275629
239920 PE2 2.2027861
240053 PE1 2.1618504
242807 LS3 2.0357062
240315 PE2 1.9885216
242617 LS3 1.9874596
239764 PE2 1.9592914
242754 LS9 1.9550176
242623 LS9 1.940074
239776 PE1 1.9292636
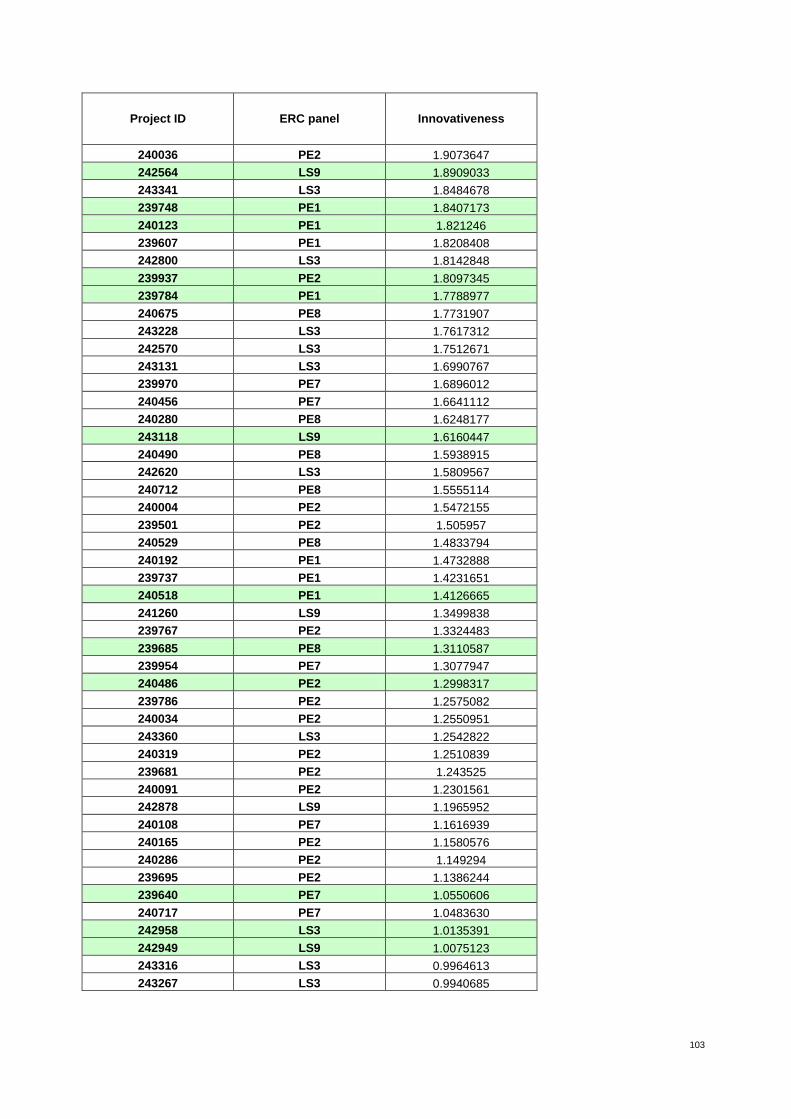
103
Project ID ERC panel Innovativeness
240036 PE2 1.9073647
242564 LS9 1.8909033
243341 LS3 1.8484678
239748 PE1 1.8407173
240123 PE1 1.821246
239607 PE1 1.8208408
242800 LS3 1.8142848
239937 PE2 1.8097345
239784 PE1 1.7788977
240675 PE8 1.7731907
243228 LS3 1.7617312
242570 LS3 1.7512671
243131 LS3 1.6990767
239970 PE7 1.6896012
240456 PE7 1.6641112
240280 PE8 1.6248177
243118 LS9 1.6160447
240490 PE8 1.5938915
242620 LS3 1.5809567
240712 PE8 1.5555114
240004 PE2 1.5472155
239501 PE2 1.505957
240529 PE8 1.4833794
240192 PE1 1.4732888
239737 PE1 1.4231651
240518 PE1 1.4126665
241260 LS9 1.3499838
239767 PE2 1.3324483
239685 PE8 1.3110587
239954 PE7 1.3077947
240486 PE2 1.2998317
239786 PE2 1.2575082
240034 PE2 1.2550951
243360 LS3 1.2542822
240319 PE2 1.2510839
239681 PE2 1.243525
240091 PE2 1.2301561
242878 LS9 1.1965952
240108 PE7 1.1616939
240165 PE2 1.1580576
240286 PE2 1.149294
239695 PE2 1.1386244
239640 PE7 1.0550606
240717 PE7 1.0483630
242958 LS3 1.0135391
242949 LS9 1.0075123
243316 LS3 0.9964613
243267 LS3 0.9940685
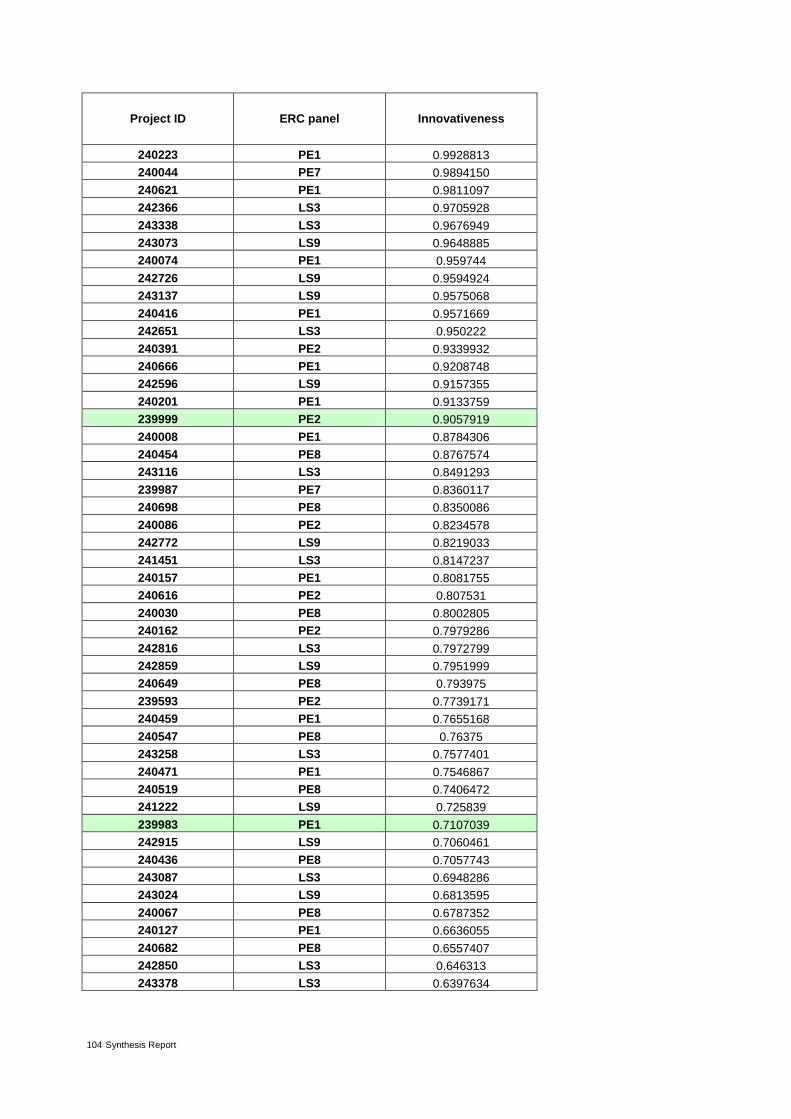
104 Synthesis Report
Project ID ERC panel Innovativeness
240223 PE1 0.9928813
240044 PE7 0.9894150
240621 PE1 0.9811097
242366 LS3 0.9705928
243338 LS3 0.9676949
243073 LS9 0.9648885
240074 PE1 0.959744
242726 LS9 0.9594924
243137 LS9 0.9575068
240416 PE1 0.9571669
242651 LS3 0.950222
240391 PE2 0.9339932
240666 PE1 0.9208748
242596 LS9 0.9157355
240201 PE1 0.9133759
239999 PE2 0.9057919
240008 PE1 0.8784306
240454 PE8 0.8767574
243116 LS3 0.8491293
239987 PE7 0.8360117
240698 PE8 0.8350086
240086 PE2 0.8234578
242772 LS9 0.8219033
241451 LS3 0.8147237
240157 PE1 0.8081755
240616 PE2 0.807531
240030 PE8 0.8002805
240162 PE2 0.7979286
242816 LS3 0.7972799
242859 LS9 0.7951999
240649 PE8 0.793975
239593 PE2 0.7739171
240459 PE1 0.7655168
240547 PE8 0.76375
243258 LS3 0.7577401
240471 PE1 0.7546867
240519 PE8 0.7406472
241222 LS9 0.725839
239983 PE1 0.7107039
242915 LS9 0.7060461
240436 PE8 0.7057743
243087 LS3 0.6948286
243024 LS9 0.6813595
240067 PE8 0.6787352
240127 PE1 0.6636055
240682 PE8 0.6557407
242850 LS3 0.646313
243378 LS3 0.6397634

105
Project ID ERC panel Innovativeness
243194 LS3 0.6323592
240337 PE8 0.5852677
240241 PE7 0.5556014
242010 LS3 0.5472206
239782 PE1 0.5468815
240236 PE7 0.5337129
240445 PE7 0.5116574
240354 PE2 0.5036627
240087 PE2 0.498364
241684 LS9 0.490589
240462 PE8 0.4897644
242837 LS9 0.4875689
243305 LS3 0.4853756
239828 PE2 0.4747587
240655 PE7 0.4732998
239949 PE2 0.4560328
240121 PE1 0.4455862
240677 PE8 0.4387444
240072 PE8 0.4220877
242381 LS9 0.4217613
240683 PE1 0.4087312
240149 PE2 0.3987385
240166 PE7 0.3967563
240269 PE1 0.392227
242783 LS9 0.3815585
240049 PE7 0.3748664
240317 PE7 0.3644320
242673 LS9 0.361294
240218 PE7 0.3606187
240189 PE8 0.3403857
240213 PE2 0.3170995
240710 PE8 0.3165504
239866 PE8 0.3081671
240265 PE1 0.3019131
243033 LS9 0.2970294
239726 PE7 0.2866609
239814 PE1 0.2784982
239864 PE2 0.276923
240332 PE8 0.2760251
239827 PE7 0.2268073
240522 PE8 0.2238119
243113 LS9 0.221034
240014 PE1 0.2119243
243300 LS3 0.2102091
240686 PE7 0.1936860
239800 PE1 0.188382
242771 LS9 0.1868726
239932 PE7 0.1860426
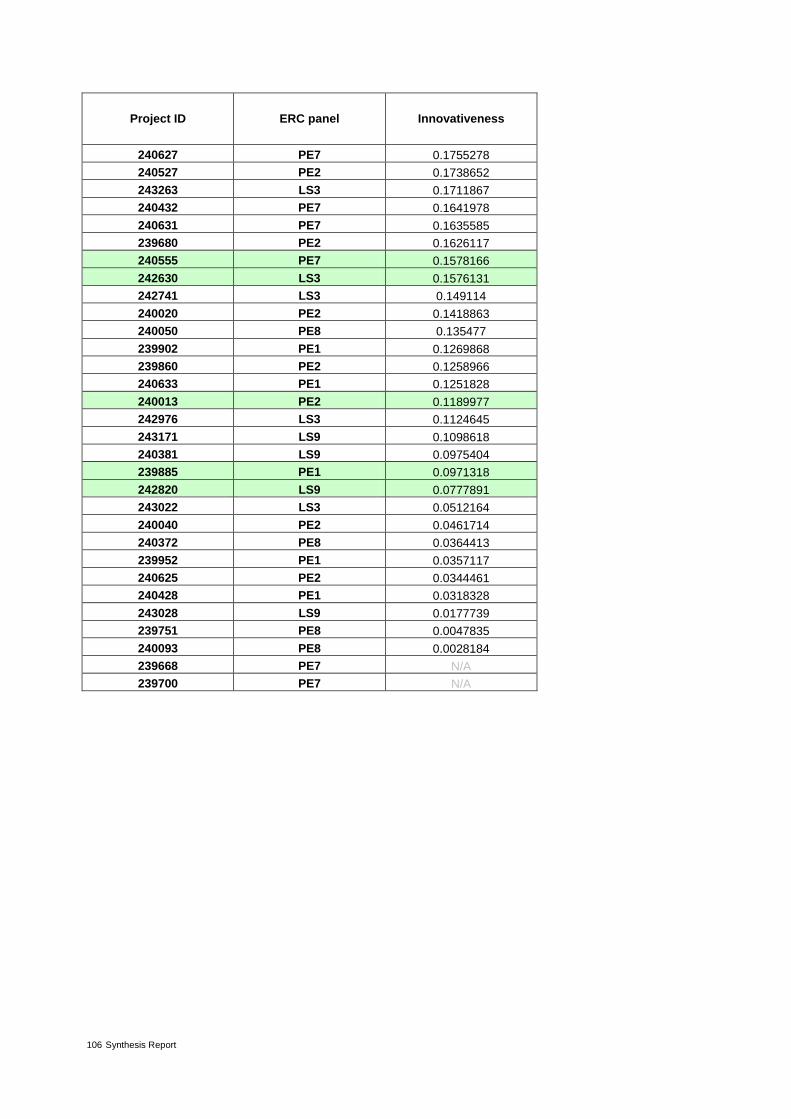
106 Synthesis Report
Project ID ERC panel Innovativeness
240627 PE7 0.1755278
240527 PE2 0.1738652
243263 LS3 0.1711867
240432 PE7 0.1641978
240631 PE7 0.1635585
239680 PE2 0.1626117
240555 PE7 0.1578166
242630 LS3 0.1576131
242741 LS3 0.149114
240020 PE2 0.1418863
240050 PE8 0.135477
239902 PE1 0.1269868
239860 PE2 0.1258966
240633 PE1 0.1251828
240013 PE2 0.1189977
242976 LS3 0.1124645
243171 LS9 0.1098618
240381 LS9 0.0975404
239885 PE1 0.0971318
242820 LS9 0.0777891
243022 LS3 0.0512164
240040 PE2 0.0461714
240372 PE8 0.0364413
239952 PE1 0.0357117
240625 PE2 0.0344461
240428 PE1 0.0318328
243028 LS9 0.0177739
239751 PE8 0.0047835
240093 PE8 0.0028184
239668 PE7 N/A
239700 PE7 N/A

107
Timeliness indicator
Table A.8: The 37 proposals from ERC panel LS3 ranked by increasing value of timeliness calculated as the average age of the cited references (Call 2009 Starting Grant)
Project ID ERC panel Timeliness
243116 LS3 2.556
242651 LS3 2.917
242389 LS3 3.048
243228 LS3 3.14
242617 LS3 3.571
242800 LS3 4.232
242958 LS3 4.326
243022 LS3 4.381
243305 LS3 4.433
242741 LS3 4.645
243316 LS3 4.656
242816 LS3 4.853
243360 LS3 4.914
242976 LS3 5.143
242630 LS3 5.417
242010 LS3 5.704
243258 LS3 5.793
241451 LS3 5.81
243263 LS3 5.931
242620 LS3 5.954
243131 LS3 6.035
243194 LS3 6.079
242850 LS3 6.258
242366 LS3 6.367
243378 LS3 6.397
243267 LS3 6.424
242807 LS3 7.206
243338 LS3 7.629
242553 LS3 7.706
242570 LS3 7.837
242993 LS3 8.051
243341 LS3 8.217
243078 LS3 9.111
243087 LS3 9.175
242914 LS3 9.284
243300 LS3 9.38
242578 LS3 9.515
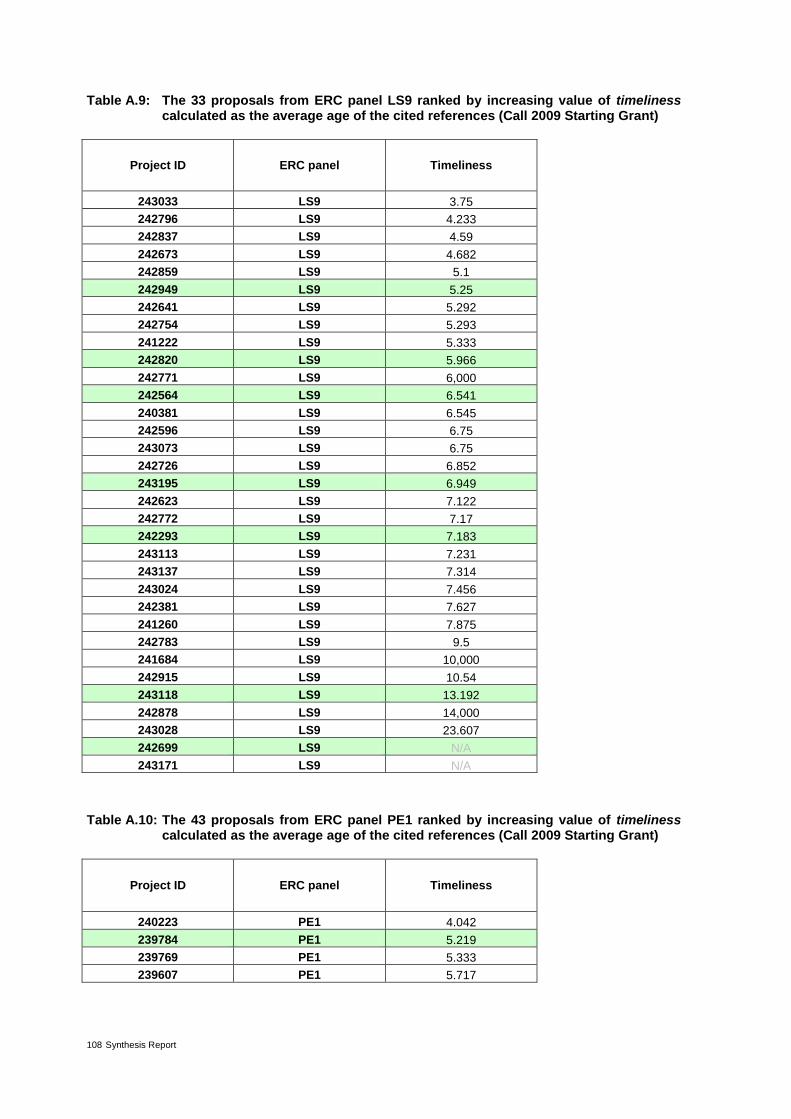
108 Synthesis Report
Table A.9: The 33 proposals from ERC panel LS9 ranked by increasing value of timeliness calculated as the average age of the cited references (Call 2009 Starting Grant)
Project ID ERC panel Timeliness
243033 LS9 3.75
242796 LS9 4.233
242837 LS9 4.59
242673 LS9 4.682
242859 LS9 5.1
242949 LS9 5.25
242641 LS9 5.292
242754 LS9 5.293
241222 LS9 5.333
242820 LS9 5.966
242771 LS9 6,000
242564 LS9 6.541
240381 LS9 6.545
242596 LS9 6.75
243073 LS9 6.75
242726 LS9 6.852
243195 LS9 6.949
242623 LS9 7.122
242772 LS9 7.17
242293 LS9 7.183
243113 LS9 7.231
243137 LS9 7.314
243024 LS9 7.456
242381 LS9 7.627
241260 LS9 7.875
242783 LS9 9.5
241684 LS9 10,000
242915 LS9 10.54
243118 LS9 13.192
242878 LS9 14,000
243028 LS9 23.607
242699 LS9 N/A
243171 LS9 N/A
Table A.10: The 43 proposals from ERC panel PE1 ranked by increasing value of timeliness calculated as the average age of the cited references (Call 2009 Starting Grant)
Project ID ERC panel Timeliness
240223 PE1 4.042
239784 PE1 5.219
239769 PE1 5.333
239607 PE1 5.717

109
Project ID ERC panel Timeliness
240123 PE1 6.045
240693 PE1 6.125
240192 PE1 6.562
240121 PE1 6.607
240269 PE1 7.462
239853 PE1 7.759
239870 PE1 8.032
239800 PE1 8.111
239983 PE1 8.217
239781 PE1 8.25
240471 PE1 8.462
240201 PE1 8.881
240518 PE1 10.033
240265 PE1 10.188
239959 PE1 10.26
239929 PE1 10.362
239748 PE1 11.673
239737 PE1 12.175
239694 PE1 12.25
240157 PE1 13,000
240633 PE1 13.222
240127 PE1 13.235
240459 PE1 13.417
240008 PE1 13.917
240014 PE1 14.204
239885 PE1 15.068
240683 PE1 16.138
239807 PE1 16.391
240428 PE1 16.441
240416 PE1 20.5
239814 PE1 21.543
239952 PE1 26.333
239902 PE1 27.833
240074 PE1 28.683
240053 PE1 59.667
239776 PE1 N/A
239782 PE1 N/A
240621 PE1 N/A
240666 PE1 N/A
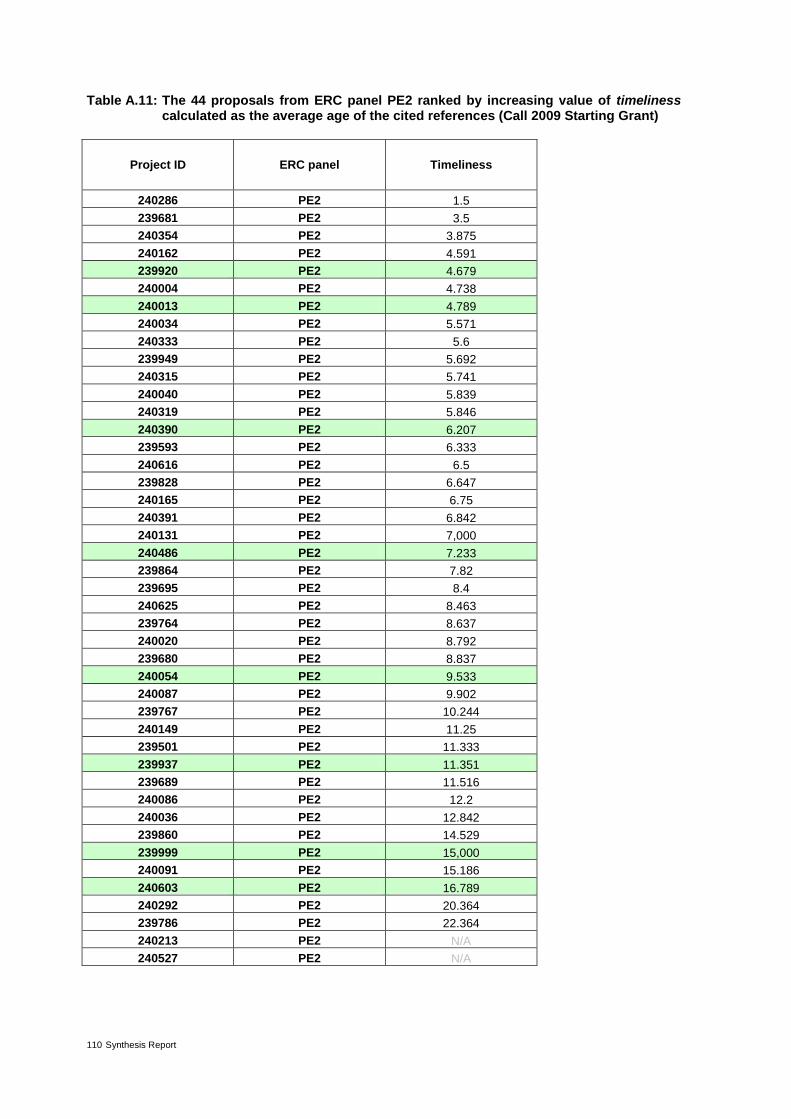
110 Synthesis Report
Table A.11: The 44 proposals from ERC panel PE2 ranked by increasing value of timeliness calculated as the average age of the cited references (Call 2009 Starting Grant)
Project ID ERC panel Timeliness
240286 PE2 1.5
239681 PE2 3.5
240354 PE2 3.875
240162 PE2 4.591
239920 PE2 4.679
240004 PE2 4.738
240013 PE2 4.789
240034 PE2 5.571
240333 PE2 5.6
239949 PE2 5.692
240315 PE2 5.741
240040 PE2 5.839
240319 PE2 5.846
240390 PE2 6.207
239593 PE2 6.333
240616 PE2 6.5
239828 PE2 6.647
240165 PE2 6.75
240391 PE2 6.842
240131 PE2 7,000
240486 PE2 7.233
239864 PE2 7.82
239695 PE2 8.4
240625 PE2 8.463
239764 PE2 8.637
240020 PE2 8.792
239680 PE2 8.837
240054 PE2 9.533
240087 PE2 9.902
239767 PE2 10.244
240149 PE2 11.25
239501 PE2 11.333
239937 PE2 11.351
239689 PE2 11.516
240086 PE2 12.2
240036 PE2 12.842
239860 PE2 14.529
239999 PE2 15,000
240091 PE2 15.186
240603 PE2 16.789
240292 PE2 20.364
239786 PE2 22.364
240213 PE2 N/A
240527 PE2 N/A
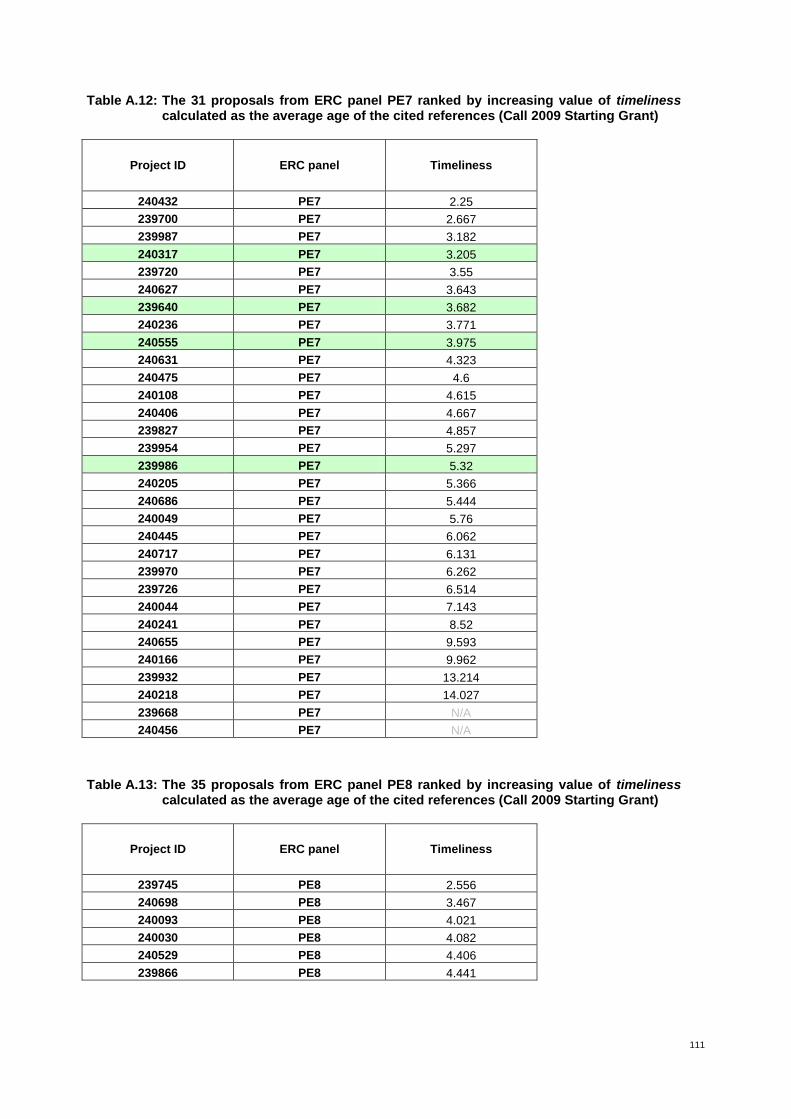
111
Table A.12: The 31 proposals from ERC panel PE7 ranked by increasing value of timeliness calculated as the average age of the cited references (Call 2009 Starting Grant)
Project ID ERC panel Timeliness
240432 PE7 2.25
239700 PE7 2.667
239987 PE7 3.182
240317 PE7 3.205
239720 PE7 3.55
240627 PE7 3.643
239640 PE7 3.682
240236 PE7 3.771
240555 PE7 3.975
240631 PE7 4.323
240475 PE7 4.6
240108 PE7 4.615
240406 PE7 4.667
239827 PE7 4.857
239954 PE7 5.297
239986 PE7 5.32
240205 PE7 5.366
240686 PE7 5.444
240049 PE7 5.76
240445 PE7 6.062
240717 PE7 6.131
239970 PE7 6.262
239726 PE7 6.514
240044 PE7 7.143
240241 PE7 8.52
240655 PE7 9.593
240166 PE7 9.962
239932 PE7 13.214
240218 PE7 14.027
239668 PE7 N/A
240456 PE7 N/A
Table A.13: The 35 proposals from ERC panel PE8 ranked by increasing value of timeliness calculated as the average age of the cited references (Call 2009 Starting Grant)
Project ID ERC panel Timeliness
239745 PE8 2.556
240698 PE8 3.467
240093 PE8 4.021
240030 PE8 4.082
240529 PE8 4.406
239866 PE8 4.441
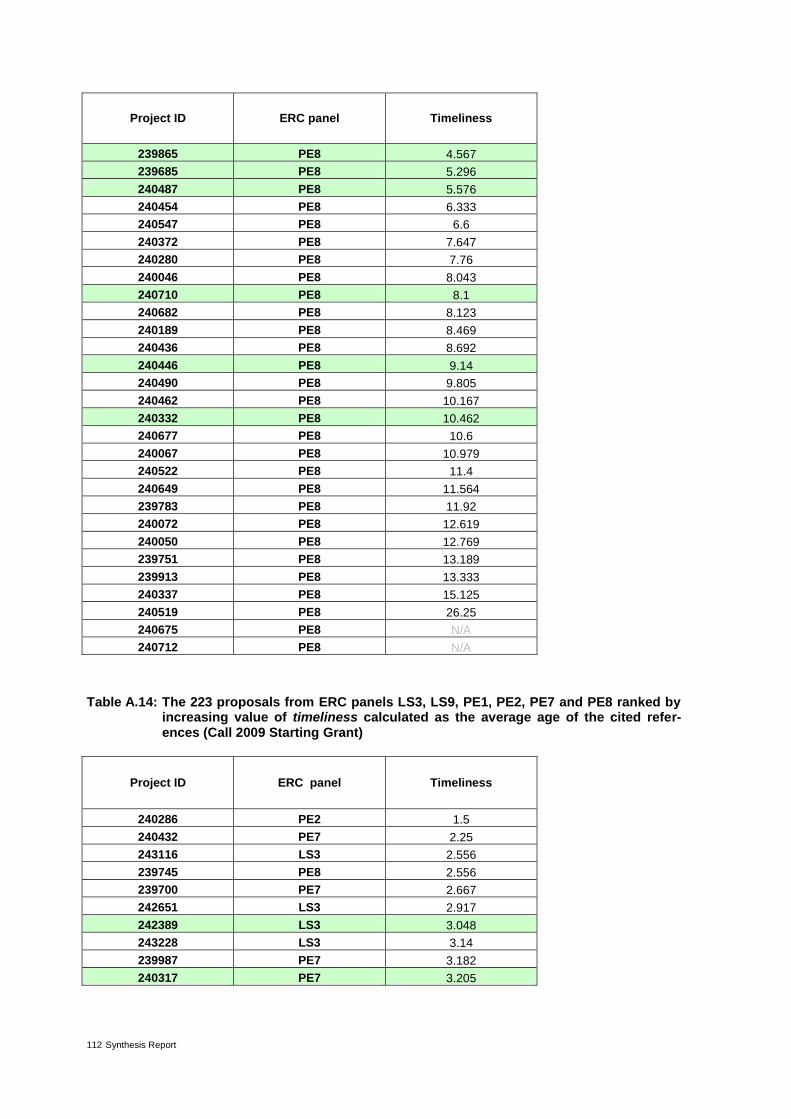
112 Synthesis Report
Project ID ERC panel Timeliness
239865 PE8 4.567
239685 PE8 5.296
240487 PE8 5.576
240454 PE8 6.333
240547 PE8 6.6
240372 PE8 7.647
240280 PE8 7.76
240046 PE8 8.043
240710 PE8 8.1
240682 PE8 8.123
240189 PE8 8.469
240436 PE8 8.692
240446 PE8 9.14
240490 PE8 9.805
240462 PE8 10.167
240332 PE8 10.462
240677 PE8 10.6
240067 PE8 10.979
240522 PE8 11.4
240649 PE8 11.564
239783 PE8 11.92
240072 PE8 12.619
240050 PE8 12.769
239751 PE8 13.189
239913 PE8 13.333
240337 PE8 15.125
240519 PE8 26.25
240675 PE8 N/A
240712 PE8 N/A
Table A.14: The 223 proposals from ERC panels LS3, LS9, PE1, PE2, PE7 and PE8 ranked by increasing value of timeliness calculated as the average age of the cited refer-ences (Call 2009 Starting Grant)
Project ID ERC panel Timeliness
240286 PE2 1.5
240432 PE7 2.25
243116 LS3 2.556
239745 PE8 2.556
239700 PE7 2.667
242651 LS3 2.917
242389 LS3 3.048
243228 LS3 3.14
239987 PE7 3.182
240317 PE7 3.205
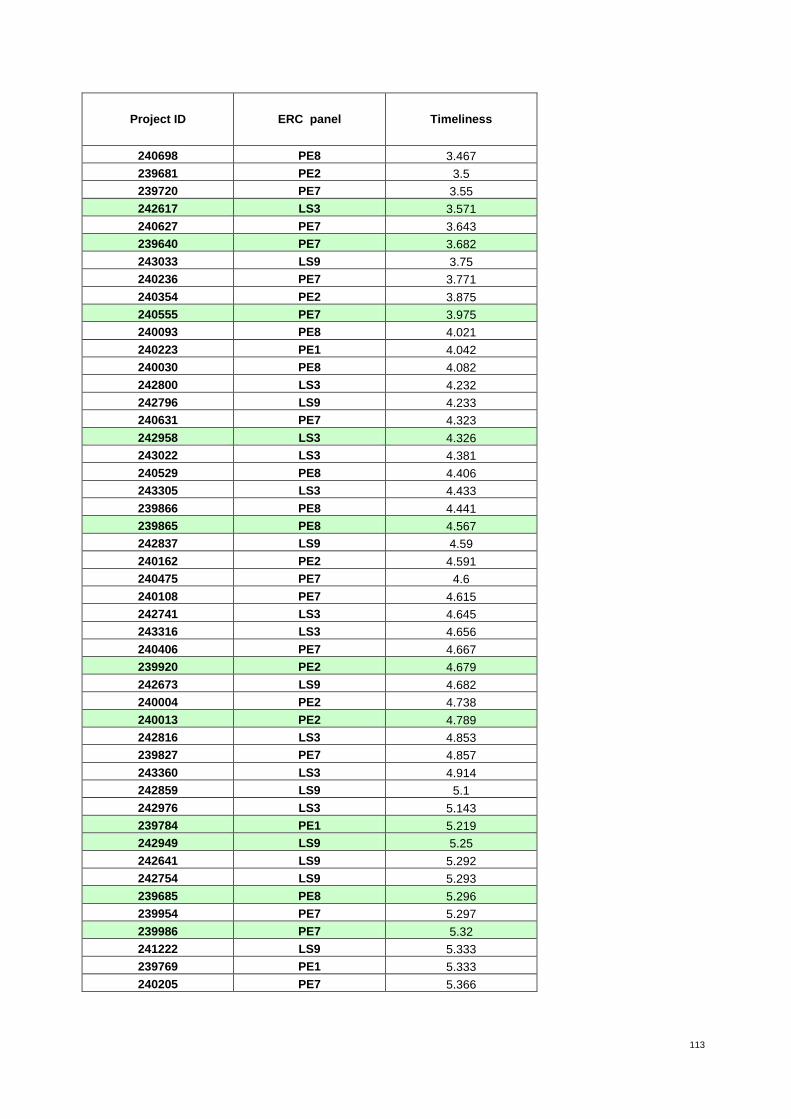
113
Project ID ERC panel Timeliness
240698 PE8 3.467
239681 PE2 3.5
239720 PE7 3.55
242617 LS3 3.571
240627 PE7 3.643
239640 PE7 3.682
243033 LS9 3.75
240236 PE7 3.771
240354 PE2 3.875
240555 PE7 3.975
240093 PE8 4.021
240223 PE1 4.042
240030 PE8 4.082
242800 LS3 4.232
242796 LS9 4.233
240631 PE7 4.323
242958 LS3 4.326
243022 LS3 4.381
240529 PE8 4.406
243305 LS3 4.433
239866 PE8 4.441
239865 PE8 4.567
242837 LS9 4.59
240162 PE2 4.591
240475 PE7 4.6
240108 PE7 4.615
242741 LS3 4.645
243316 LS3 4.656
240406 PE7 4.667
239920 PE2 4.679
242673 LS9 4.682
240004 PE2 4.738
240013 PE2 4.789
242816 LS3 4.853
239827 PE7 4.857
243360 LS3 4.914
242859 LS9 5.1
242976 LS3 5.143
239784 PE1 5.219
242949 LS9 5.25
242641 LS9 5.292
242754 LS9 5.293
239685 PE8 5.296
239954 PE7 5.297
239986 PE7 5.32
241222 LS9 5.333
239769 PE1 5.333
240205 PE7 5.366
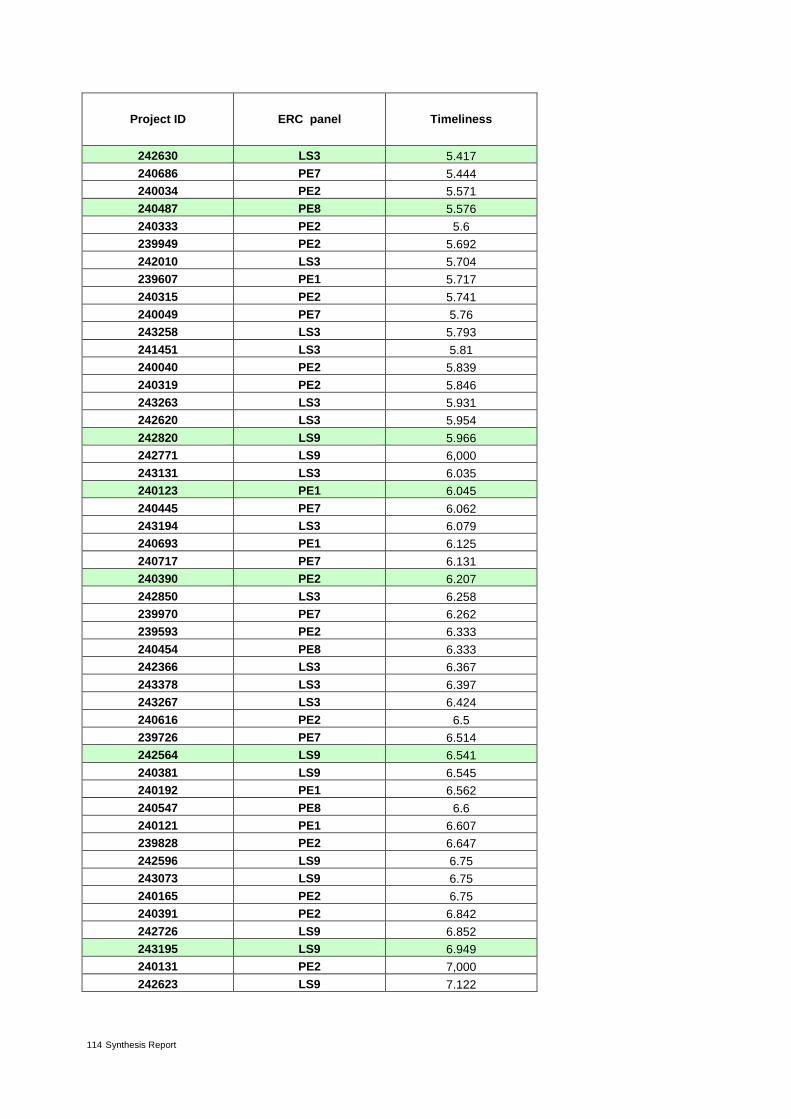
114 Synthesis Report
Project ID ERC panel Timeliness
242630 LS3 5.417
240686 PE7 5.444
240034 PE2 5.571
240487 PE8 5.576
240333 PE2 5.6
239949 PE2 5.692
242010 LS3 5.704
239607 PE1 5.717
240315 PE2 5.741
240049 PE7 5.76
243258 LS3 5.793
241451 LS3 5.81
240040 PE2 5.839
240319 PE2 5.846
243263 LS3 5.931
242620 LS3 5.954
242820 LS9 5.966
242771 LS9 6,000
243131 LS3 6.035
240123 PE1 6.045
240445 PE7 6.062
243194 LS3 6.079
240693 PE1 6.125
240717 PE7 6.131
240390 PE2 6.207
242850 LS3 6.258
239970 PE7 6.262
239593 PE2 6.333
240454 PE8 6.333
242366 LS3 6.367
243378 LS3 6.397
243267 LS3 6.424
240616 PE2 6.5
239726 PE7 6.514
242564 LS9 6.541
240381 LS9 6.545
240192 PE1 6.562
240547 PE8 6.6
240121 PE1 6.607
239828 PE2 6.647
242596 LS9 6.75
243073 LS9 6.75
240165 PE2 6.75
240391 PE2 6.842
242726 LS9 6.852
243195 LS9 6.949
240131 PE2 7,000
242623 LS9 7.122

115
Project ID ERC panel Timeliness
240044 PE7 7.143
242772 LS9 7.17
242293 LS9 7.183
242807 LS3 7.206
243113 LS9 7.231
240486 PE2 7.233
243137 LS9 7.314
243024 LS9 7.456
240269 PE1 7.462
242381 LS9 7.627
243338 LS3 7.629
240372 PE8 7.647
242553 LS3 7.706
239853 PE1 7.759
240280 PE8 7.76
239864 PE2 7.82
242570 LS3 7.837
241260 LS9 7.875
239870 PE1 8.032
240046 PE8 8.043
242993 LS3 8.051
240710 PE8 8.1
239800 PE1 8.111
240682 PE8 8.123
243341 LS3 8.217
239983 PE1 8.217
239781 PE1 8.25
239695 PE2 8.4
240471 PE1 8.462
240625 PE2 8.463
240189 PE8 8.469
240241 PE7 8.52
239764 PE2 8.637
240436 PE8 8.692
240020 PE2 8.792
239680 PE2 8.837
240201 PE1 8.881
243078 LS3 9.111
240446 PE8 9.14
243087 LS3 9.175
242914 LS3 9.284
243300 LS3 9.38
242783 LS9 9.5
242578 LS3 9.515
240054 PE2 9.533
240655 PE7 9.593
240490 PE8 9.805
240087 PE2 9.902
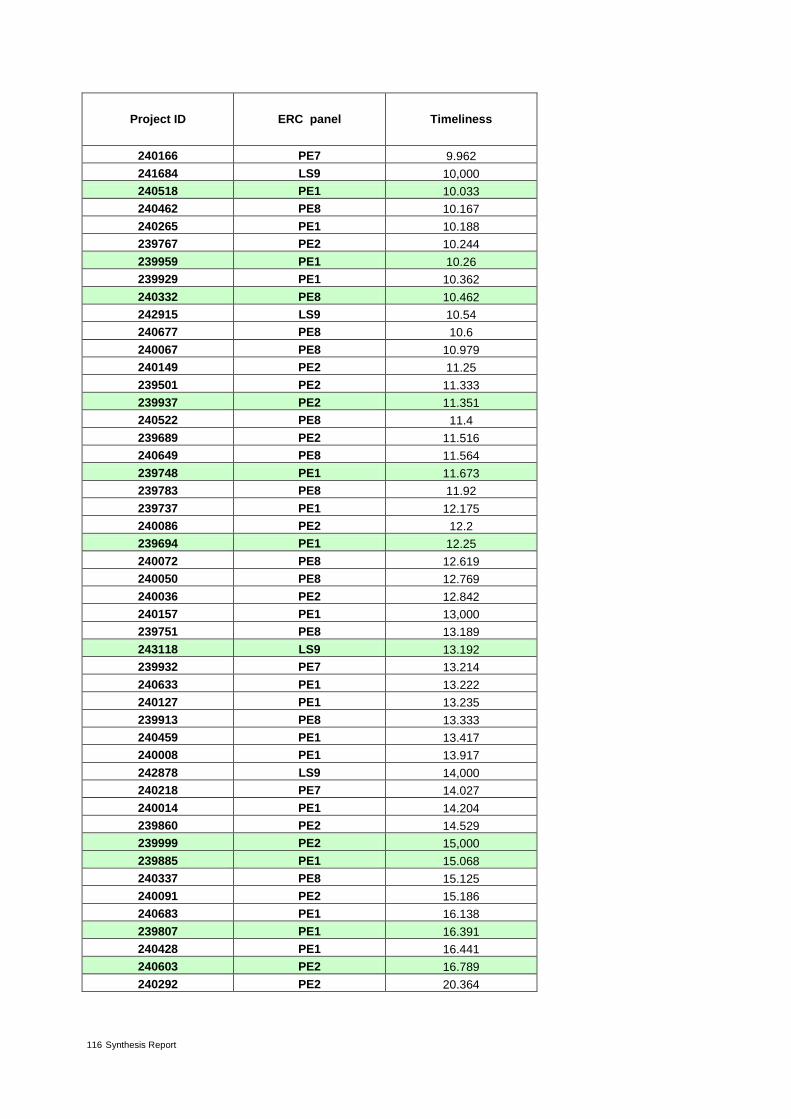
116 Synthesis Report
Project ID ERC panel Timeliness
240166 PE7 9.962
241684 LS9 10,000
240518 PE1 10.033
240462 PE8 10.167
240265 PE1 10.188
239767 PE2 10.244
239959 PE1 10.26
239929 PE1 10.362
240332 PE8 10.462
242915 LS9 10.54
240677 PE8 10.6
240067 PE8 10.979
240149 PE2 11.25
239501 PE2 11.333
239937 PE2 11.351
240522 PE8 11.4
239689 PE2 11.516
240649 PE8 11.564
239748 PE1 11.673
239783 PE8 11.92
239737 PE1 12.175
240086 PE2 12.2
239694 PE1 12.25
240072 PE8 12.619
240050 PE8 12.769
240036 PE2 12.842
240157 PE1 13,000
239751 PE8 13.189
243118 LS9 13.192
239932 PE7 13.214
240633 PE1 13.222
240127 PE1 13.235
239913 PE8 13.333
240459 PE1 13.417
240008 PE1 13.917
242878 LS9 14,000
240218 PE7 14.027
240014 PE1 14.204
239860 PE2 14.529
239999 PE2 15,000
239885 PE1 15.068
240337 PE8 15.125
240091 PE2 15.186
240683 PE1 16.138
239807 PE1 16.391
240428 PE1 16.441
240603 PE2 16.789
240292 PE2 20.364
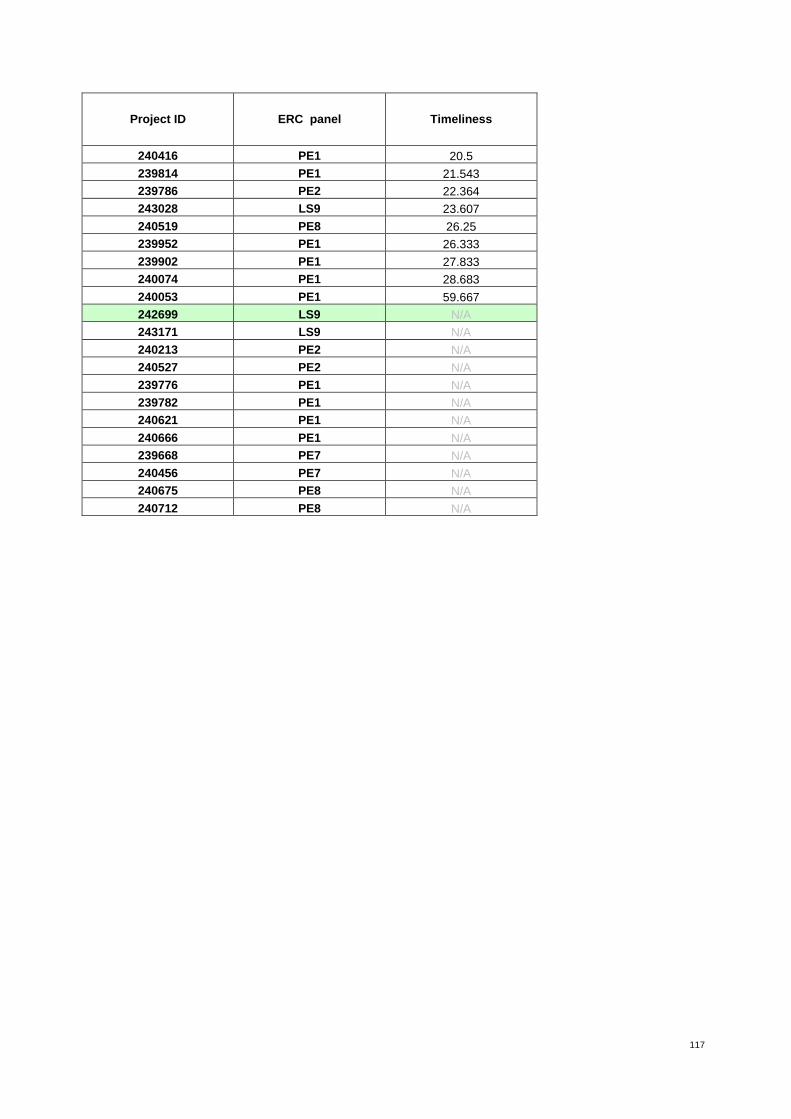
117
Project ID ERC panel Timeliness
240416 PE1 20.5
239814 PE1 21.543
239786 PE2 22.364
243028 LS9 23.607
240519 PE8 26.25
239952 PE1 26.333
239902 PE1 27.833
240074 PE1 28.683
240053 PE1 59.667
242699 LS9 N/A
243171 LS9 N/A
240213 PE2 N/A
240527 PE2 N/A
239776 PE1 N/A
239782 PE1 N/A
240621 PE1 N/A
240666 PE1 N/A
239668 PE7 N/A
240456 PE7 N/A
240675 PE8 N/A
240712 PE8 N/A

118 Synthesis Report
Risk indicator
Table A.15: The 37 proposals from ERC panel LS3 ranked by increasing value of risk – co-sine (Call 2009 Starting Grant)
Project ID ERC panel Risk - corr Risk - cos Risk - sum-product
243258 LS3 -0.60730051040954 0 0
243305 LS3 -0.437346466686124 0 0
242807 LS3 -0.406369702662346 0 0
242570 LS3 -0.35125563089318 0 0
242010 LS3 #DIV/0!8 #DIV/0!
9 0
242553 LS3 #DIV/0! #DIV/0! 0
242617 LS3 #DIV/0! #DIV/0! 0
242630 LS3 #DIV/0! #DIV/0! 0
242651 LS3 #DIV/0! #DIV/0! 0
242816 LS3 #DIV/0! #DIV/0! 0
242850 LS3 #DIV/0! #DIV/0! 0
242914 LS3 #DIV/0! #DIV/0! 0
242958 LS3 #DIV/0! #DIV/0! 0
242976 LS3 #DIV/0! #DIV/0! 0
243078 LS3 #DIV/0! #DIV/0! 0
243116 LS3 #DIV/0! #DIV/0! 0
243228 LS3 #DIV/0! #DIV/0! 0
243263 LS3 #DIV/0! #DIV/0! 0
243300 LS3 #DIV/0! #DIV/0! 0
243316 LS3 #DIV/0! #DIV/0! 0
243338 LS3 #DIV/0! #DIV/0! 0
243341 LS3 #DIV/0! #DIV/0! 0
243360 LS3 #DIV/0! #DIV/0! 0
241451 LS3 -0.362814063010028 0.0000778570468581623 4
242366 LS3 -0.358511502658931 0.00512719394705989 1
242389 LS3 -0.172880564589585 0.0158285864996542 4
243267 LS3 -0.151013420193916 0.03966588663733 15
243087 LS3 -0.565287219085464 0.040282974725538 6
243378 LS3 -0.0294313623621776 0.0404968618085056 28
242993 LS3 -0.287451660603222 0.0449830221131238 10
243022 LS3 -0.305890292299902 0.049808794710717 13
243131 LS3 -0.624450046772016 0.0634241852800746 8
242578 LS3 -0.0910220323336946 0.0744839899156491 23
242741 LS3 -0.0261816026579265 0.0753953231731287 42
242800 LS3 -0.199330582828642 0.0775271287262822 24
242620 LS3 -0.113281636437774 0.0868243142124459 21
8 See Footnote 6.
9 See Footnote 7.
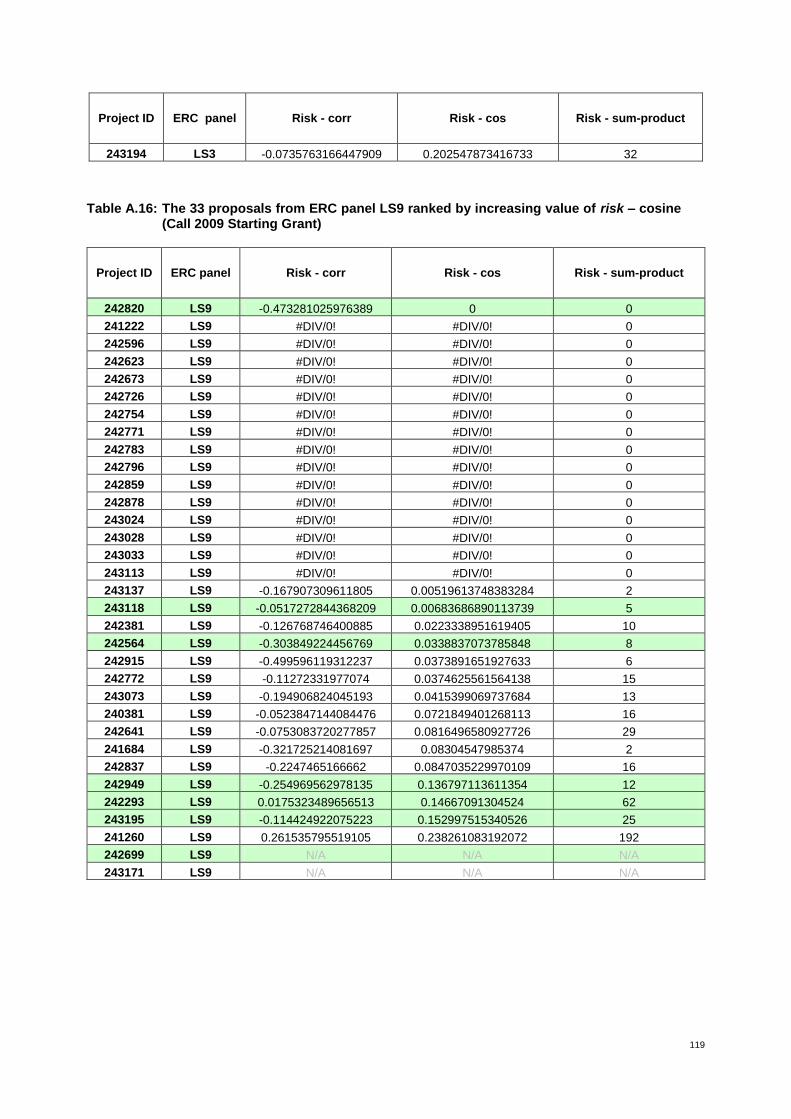
119
Project ID ERC panel Risk - corr Risk - cos Risk - sum-product
243194 LS3 -0.0735763166447909 0.202547873416733 32
Table A.16: The 33 proposals from ERC panel LS9 ranked by increasing value of risk – cosine (Call 2009 Starting Grant)
Project ID ERC panel Risk - corr Risk - cos Risk - sum-product
242820 LS9 -0.473281025976389 0 0
241222 LS9 #DIV/0! #DIV/0! 0
242596 LS9 #DIV/0! #DIV/0! 0
242623 LS9 #DIV/0! #DIV/0! 0
242673 LS9 #DIV/0! #DIV/0! 0
242726 LS9 #DIV/0! #DIV/0! 0
242754 LS9 #DIV/0! #DIV/0! 0
242771 LS9 #DIV/0! #DIV/0! 0
242783 LS9 #DIV/0! #DIV/0! 0
242796 LS9 #DIV/0! #DIV/0! 0
242859 LS9 #DIV/0! #DIV/0! 0
242878 LS9 #DIV/0! #DIV/0! 0
243024 LS9 #DIV/0! #DIV/0! 0
243028 LS9 #DIV/0! #DIV/0! 0
243033 LS9 #DIV/0! #DIV/0! 0
243113 LS9 #DIV/0! #DIV/0! 0
243137 LS9 -0.167907309611805 0.00519613748383284 2
243118 LS9 -0.0517272844368209 0.00683686890113739 5
242381 LS9 -0.126768746400885 0.0223338951619405 10
242564 LS9 -0.303849224456769 0.0338837073785848 8
242915 LS9 -0.499596119312237 0.0373891651927633 6
242772 LS9 -0.11272331977074 0.0374625561564138 15
243073 LS9 -0.194906824045193 0.0415399069737684 13
240381 LS9 -0.0523847144084476 0.0721849401268113 16
242641 LS9 -0.0753083720277857 0.0816496580927726 29
241684 LS9 -0.321725214081697 0.08304547985374 2
242837 LS9 -0.2247465166662 0.0847035229970109 16
242949 LS9 -0.254969562978135 0.136797113611354 12
242293 LS9 0.0175323489656513 0.14667091304524 62
243195 LS9 -0.114424922075223 0.152997515340526 25
241260 LS9 0.261535795519105 0.238261083192072 192
242699 LS9 N/A N/A N/A
243171 LS9 N/A N/A N/A
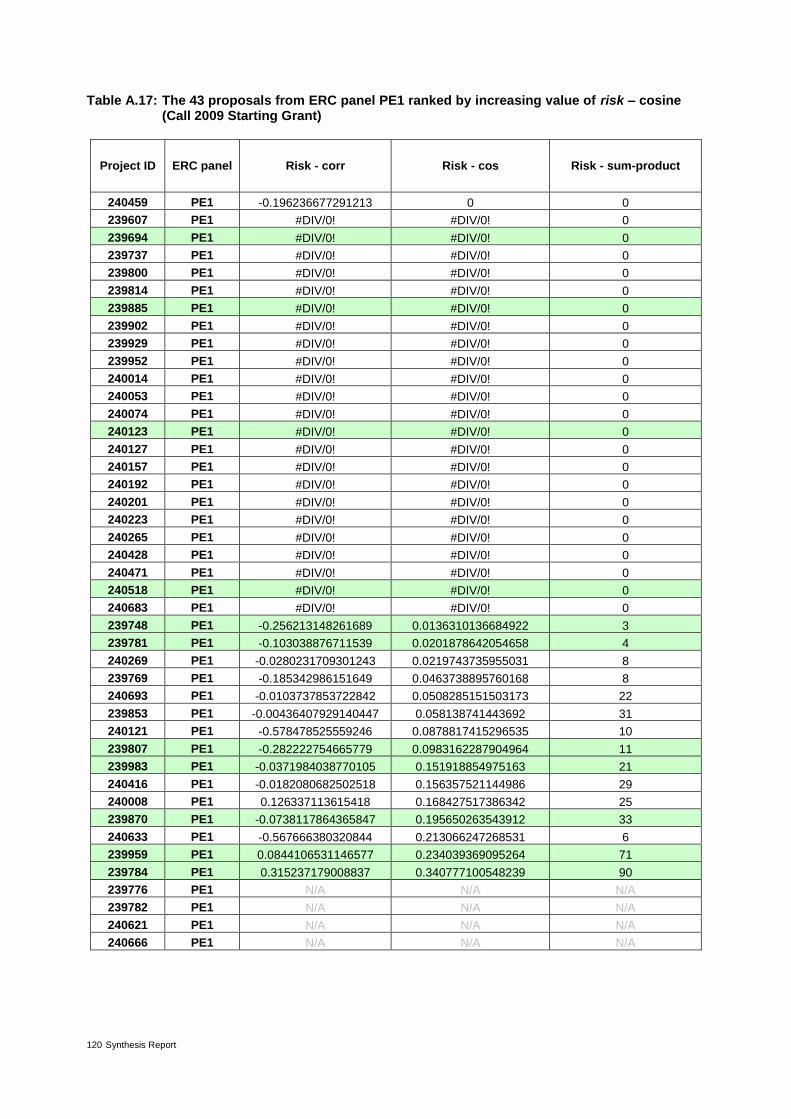
120 Synthesis Report
Table A.17: The 43 proposals from ERC panel PE1 ranked by increasing value of risk – cosine (Call 2009 Starting Grant)
Project ID ERC panel Risk - corr Risk - cos Risk - sum-product
240459 PE1 -0.196236677291213 0 0
239607 PE1 #DIV/0! #DIV/0! 0
239694 PE1 #DIV/0! #DIV/0! 0
239737 PE1 #DIV/0! #DIV/0! 0
239800 PE1 #DIV/0! #DIV/0! 0
239814 PE1 #DIV/0! #DIV/0! 0
239885 PE1 #DIV/0! #DIV/0! 0
239902 PE1 #DIV/0! #DIV/0! 0
239929 PE1 #DIV/0! #DIV/0! 0
239952 PE1 #DIV/0! #DIV/0! 0
240014 PE1 #DIV/0! #DIV/0! 0
240053 PE1 #DIV/0! #DIV/0! 0
240074 PE1 #DIV/0! #DIV/0! 0
240123 PE1 #DIV/0! #DIV/0! 0
240127 PE1 #DIV/0! #DIV/0! 0
240157 PE1 #DIV/0! #DIV/0! 0
240192 PE1 #DIV/0! #DIV/0! 0
240201 PE1 #DIV/0! #DIV/0! 0
240223 PE1 #DIV/0! #DIV/0! 0
240265 PE1 #DIV/0! #DIV/0! 0
240428 PE1 #DIV/0! #DIV/0! 0
240471 PE1 #DIV/0! #DIV/0! 0
240518 PE1 #DIV/0! #DIV/0! 0
240683 PE1 #DIV/0! #DIV/0! 0
239748 PE1 -0.256213148261689 0.0136310136684922 3
239781 PE1 -0.103038876711539 0.0201878642054658 4
240269 PE1 -0.0280231709301243 0.0219743735955031 8
239769 PE1 -0.185342986151649 0.0463738895760168 8
240693 PE1 -0.0103737853722842 0.0508285151503173 22
239853 PE1 -0.00436407929140447 0.058138741443692 31
240121 PE1 -0.578478525559246 0.0878817415296535 10
239807 PE1 -0.282222754665779 0.0983162287904964 11
239983 PE1 -0.0371984038770105 0.151918854975163 21
240416 PE1 -0.0182080682502518 0.156357521144986 29
240008 PE1 0.126337113615418 0.168427517386342 25
239870 PE1 -0.0738117864365847 0.195650263543912 33
240633 PE1 -0.567666380320844 0.213066247268531 6
239959 PE1 0.0844106531146577 0.234039369095264 71
239784 PE1 0.315237179008837 0.340777100548239 90
239776 PE1 N/A N/A N/A
239782 PE1 N/A N/A N/A
240621 PE1 N/A N/A N/A
240666 PE1 N/A N/A N/A
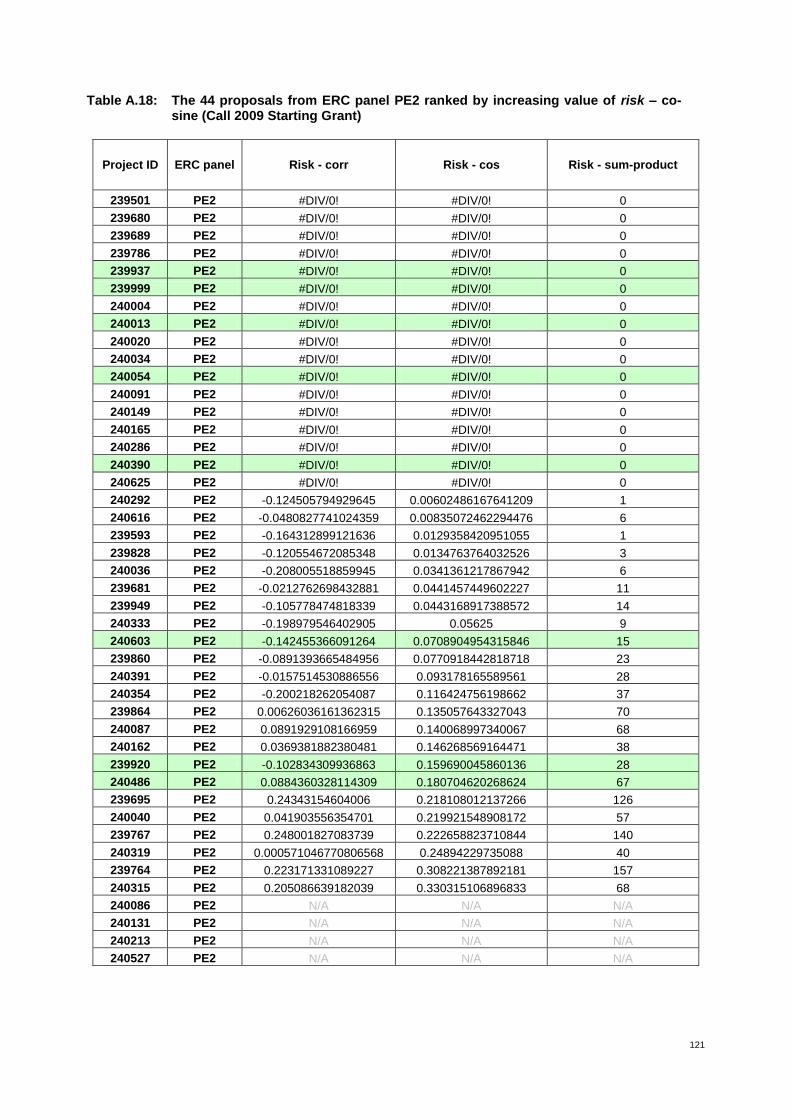
121
Table A.18: The 44 proposals from ERC panel PE2 ranked by increasing value of risk – co-sine (Call 2009 Starting Grant)
Project ID ERC panel Risk - corr Risk - cos Risk - sum-product
239501 PE2 #DIV/0! #DIV/0! 0
239680 PE2 #DIV/0! #DIV/0! 0
239689 PE2 #DIV/0! #DIV/0! 0
239786 PE2 #DIV/0! #DIV/0! 0
239937 PE2 #DIV/0! #DIV/0! 0
239999 PE2 #DIV/0! #DIV/0! 0
240004 PE2 #DIV/0! #DIV/0! 0
240013 PE2 #DIV/0! #DIV/0! 0
240020 PE2 #DIV/0! #DIV/0! 0
240034 PE2 #DIV/0! #DIV/0! 0
240054 PE2 #DIV/0! #DIV/0! 0
240091 PE2 #DIV/0! #DIV/0! 0
240149 PE2 #DIV/0! #DIV/0! 0
240165 PE2 #DIV/0! #DIV/0! 0
240286 PE2 #DIV/0! #DIV/0! 0
240390 PE2 #DIV/0! #DIV/0! 0
240625 PE2 #DIV/0! #DIV/0! 0
240292 PE2 -0.124505794929645 0.00602486167641209 1
240616 PE2 -0.0480827741024359 0.00835072462294476 6
239593 PE2 -0.164312899121636 0.0129358420951055 1
239828 PE2 -0.120554672085348 0.0134763764032526 3
240036 PE2 -0.208005518859945 0.0341361217867942 6
239681 PE2 -0.0212762698432881 0.0441457449602227 11
239949 PE2 -0.105778474818339 0.0443168917388572 14
240333 PE2 -0.198979546402905 0.05625 9
240603 PE2 -0.142455366091264 0.0708904954315846 15
239860 PE2 -0.0891393665484956 0.0770918442818718 23
240391 PE2 -0.0157514530886556 0.093178165589561 28
240354 PE2 -0.200218262054087 0.116424756198662 37
239864 PE2 0.00626036161362315 0.135057643327043 70
240087 PE2 0.0891929108166959 0.140068997340067 68
240162 PE2 0.0369381882380481 0.146268569164471 38
239920 PE2 -0.102834309936863 0.159690045860136 28
240486 PE2 0.0884360328114309 0.180704620268624 67
239695 PE2 0.24343154604006 0.218108012137266 126
240040 PE2 0.041903556354701 0.219921548908172 57
239767 PE2 0.248001827083739 0.222658823710844 140
240319 PE2 0.000571046770806568 0.24894229735088 40
239764 PE2 0.223171331089227 0.308221387892181 157
240315 PE2 0.205086639182039 0.330315106896833 68
240086 PE2 N/A N/A N/A
240131 PE2 N/A N/A N/A
240213 PE2 N/A N/A N/A
240527 PE2 N/A N/A N/A

122 Synthesis Report
Table A.19: The 31 proposals from ERC panel PE7 ranked by increasing value of risk – cosine (Call 2009 Starting Grant)
Project ID ERC panel Risk - corr Risk - cos Risk - sum-product
239700 PE7 -0.0921122477911377 0 0
239827 PE7 -0.309548338936446 0 0
239987 PE7 -0.15888470447265 0 0
239726 PE7 -0.174703089644617 0.0220433357088703 14
240166 PE7 -0.29083758144304 0.0223120923164765 5
239986 PE7 -0.303672950415126 0.0234383494123619 4
240049 PE7 -0.149562211146892 0.0240940540099385 6
240432 PE7 -0.131085423151362 0.0262743137069545 4
240475 PE7 -0.0520573885706751 0.0293388886888819 2
239640 PE7 -0.120333585506142 0.0387104830569382 6
240631 PE7 -0.297587210763772 0.039253433598943 4
240236 PE7 -0.54791699319043 0.0443405574297131 4
240108 PE7 -0.355145499348877 0.0489959197284581 8
239954 PE7 -0.24022651950401 0.0583334839881869 11
239720 PE7 -0.428506950536121 0.0594832531745402 4
240205 PE7 -0.184869095286121 0.0676093686032155 13
240555 PE7 -0.154358311355828 0.0716758407659031 10
240241 PE7 -0.0835586721656136 0.0786135341862084 20
240218 PE7 -0.177888980725538 0.0873447650476012 26
240686 PE7 -0.0878011073568942 0.103209369308428 21
240445 PE7 0.0125600155136899 0.113929792111455 29
240627 PE7 -0.12033339947076 0.11405886723883 14
239970 PE7 -0.306468978707843 0.120791434794041 21
240044 PE7 -0.321292723394757 0.128852713397734 10
240717 PE7 -0.393712246516085 0.135113740016369 16
239932 PE7 0.0457939564512365 0.139875721236047 18
240317 PE7 0.0577112632319429 0.174488451759278 25
240406 PE7 0.10012017465933 0.260060925094017 29
240655 PE7 -0.0121002250232787 0.291444870251122 67
239668 PE7 #DIV/0! #DIV/0! 0
240456 PE7 #DIV/0! #DIV/0! 0
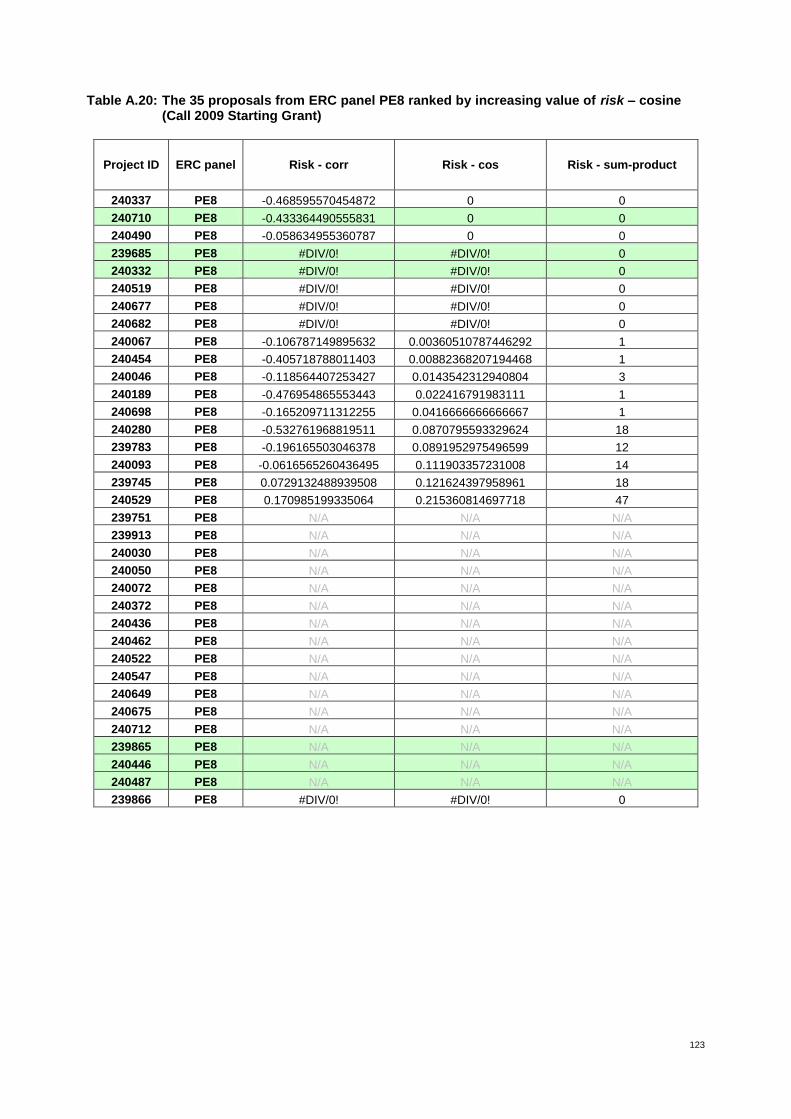
123
Table A.20: The 35 proposals from ERC panel PE8 ranked by increasing value of risk – cosine (Call 2009 Starting Grant)
Project ID ERC panel Risk - corr Risk - cos Risk - sum-product
240337 PE8 -0.468595570454872 0 0
240710 PE8 -0.433364490555831 0 0
240490 PE8 -0.058634955360787 0 0
239685 PE8 #DIV/0! #DIV/0! 0
240332 PE8 #DIV/0! #DIV/0! 0
240519 PE8 #DIV/0! #DIV/0! 0
240677 PE8 #DIV/0! #DIV/0! 0
240682 PE8 #DIV/0! #DIV/0! 0
240067 PE8 -0.106787149895632 0.00360510787446292 1
240454 PE8 -0.405718788011403 0.00882368207194468 1
240046 PE8 -0.118564407253427 0.0143542312940804 3
240189 PE8 -0.476954865553443 0.022416791983111 1
240698 PE8 -0.165209711312255 0.0416666666666667 1
240280 PE8 -0.532761968819511 0.0870795593329624 18
239783 PE8 -0.196165503046378 0.0891952975496599 12
240093 PE8 -0.0616565260436495 0.111903357231008 14
239745 PE8 0.0729132488939508 0.121624397958961 18
240529 PE8 0.170985199335064 0.215360814697718 47
239751 PE8 N/A N/A N/A
239913 PE8 N/A N/A N/A
240030 PE8 N/A N/A N/A
240050 PE8 N/A N/A N/A
240072 PE8 N/A N/A N/A
240372 PE8 N/A N/A N/A
240436 PE8 N/A N/A N/A
240462 PE8 N/A N/A N/A
240522 PE8 N/A N/A N/A
240547 PE8 N/A N/A N/A
240649 PE8 N/A N/A N/A
240675 PE8 N/A N/A N/A
240712 PE8 N/A N/A N/A
239865 PE8 N/A N/A N/A
240446 PE8 N/A N/A N/A
240487 PE8 N/A N/A N/A
239866 PE8 #DIV/0! #DIV/0! 0
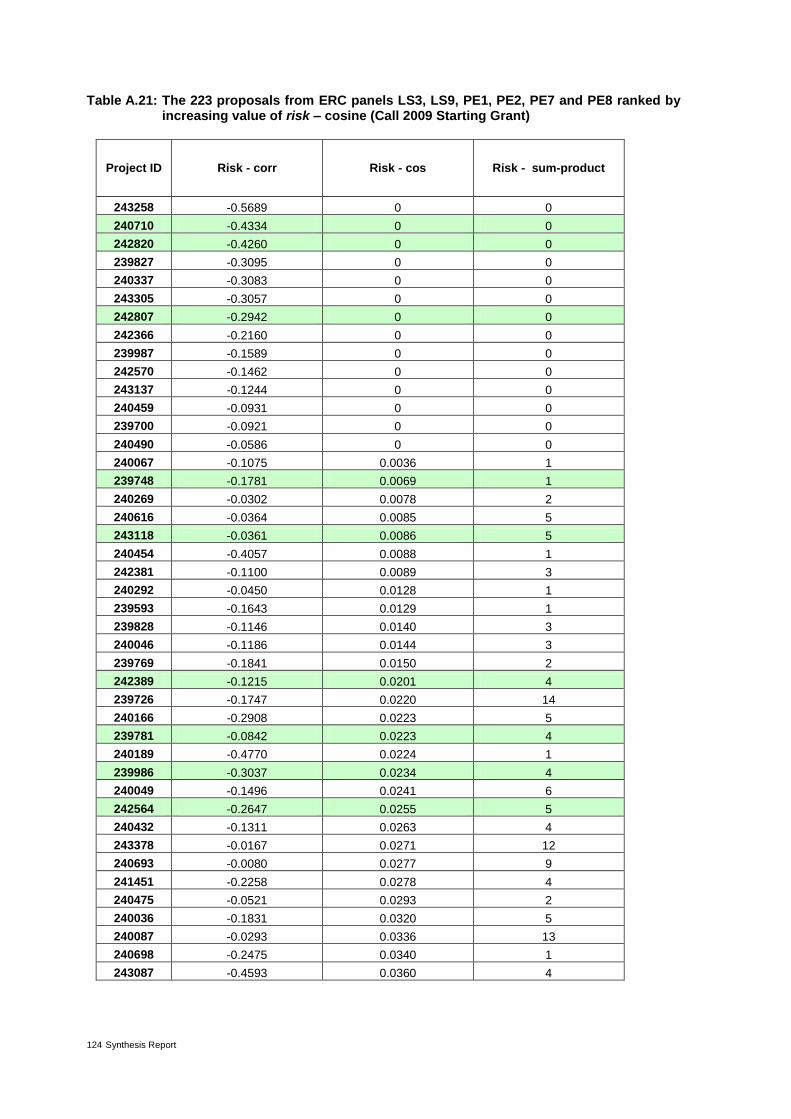
124 Synthesis Report
Table A.21: The 223 proposals from ERC panels LS3, LS9, PE1, PE2, PE7 and PE8 ranked by increasing value of risk – cosine (Call 2009 Starting Grant)
Project ID Risk - corr Risk - cos Risk - sum-product
243258 -0.5689 0 0
240710 -0.4334 0 0
242820 -0.4260 0 0
239827 -0.3095 0 0
240337 -0.3083 0 0
243305 -0.3057 0 0
242807 -0.2942 0 0
242366 -0.2160 0 0
239987 -0.1589 0 0
242570 -0.1462 0 0
243137 -0.1244 0 0
240459 -0.0931 0 0
239700 -0.0921 0 0
240490 -0.0586 0 0
240067 -0.1075 0.0036 1
239748 -0.1781 0.0069 1
240269 -0.0302 0.0078 2
240616 -0.0364 0.0085 5
243118 -0.0361 0.0086 5
240454 -0.4057 0.0088 1
242381 -0.1100 0.0089 3
240292 -0.0450 0.0128 1
239593 -0.1643 0.0129 1
239828 -0.1146 0.0140 3
240046 -0.1186 0.0144 3
239769 -0.1841 0.0150 2
242389 -0.1215 0.0201 4
239726 -0.1747 0.0220 14
240166 -0.2908 0.0223 5
239781 -0.0842 0.0223 4
240189 -0.4770 0.0224 1
239986 -0.3037 0.0234 4
240049 -0.1496 0.0241 6
242564 -0.2647 0.0255 5
240432 -0.1311 0.0263 4
243378 -0.0167 0.0271 12
240693 -0.0080 0.0277 9
241451 -0.2258 0.0278 4
240475 -0.0521 0.0293 2
240036 -0.1831 0.0320 5
240087 -0.0293 0.0336 13
240698 -0.2475 0.0340 1
243087 -0.4593 0.0360 4
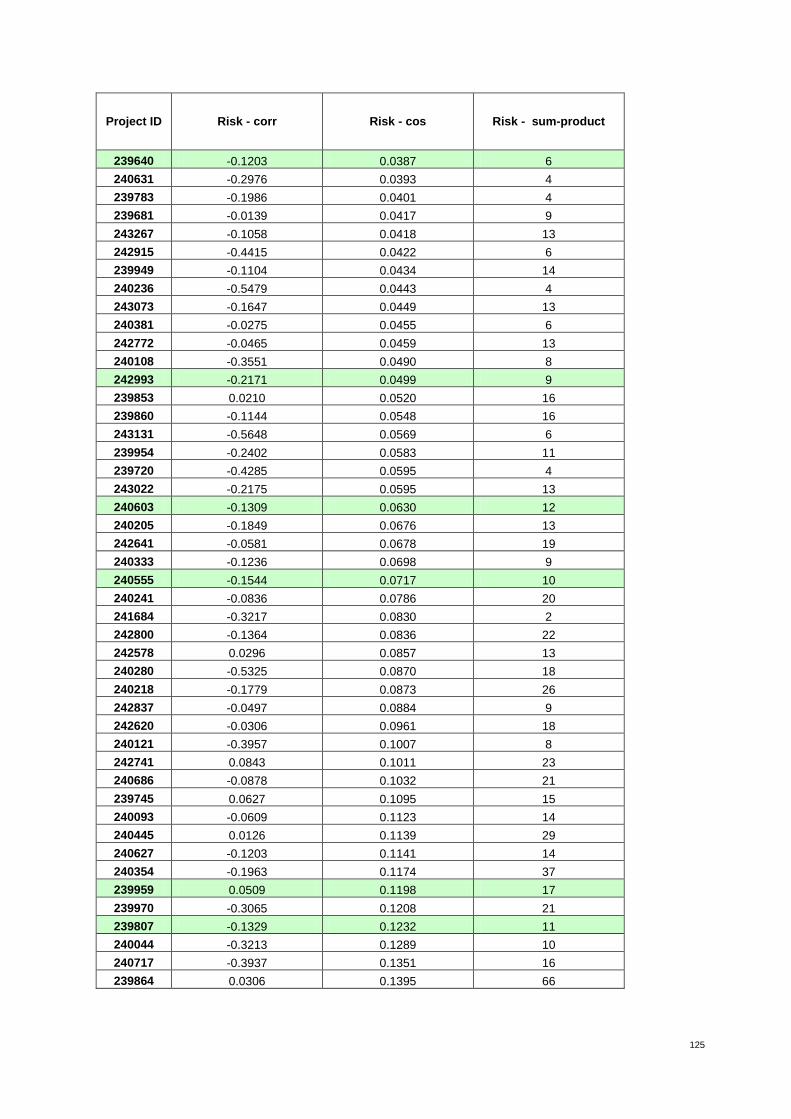
125
Project ID Risk - corr Risk - cos Risk - sum-product
239640 -0.1203 0.0387 6
240631 -0.2976 0.0393 4
239783 -0.1986 0.0401 4
239681 -0.0139 0.0417 9
243267 -0.1058 0.0418 13
242915 -0.4415 0.0422 6
239949 -0.1104 0.0434 14
240236 -0.5479 0.0443 4
243073 -0.1647 0.0449 13
240381 -0.0275 0.0455 6
242772 -0.0465 0.0459 13
240108 -0.3551 0.0490 8
242993 -0.2171 0.0499 9
239853 0.0210 0.0520 16
239860 -0.1144 0.0548 16
243131 -0.5648 0.0569 6
239954 -0.2402 0.0583 11
239720 -0.4285 0.0595 4
243022 -0.2175 0.0595 13
240603 -0.1309 0.0630 12
240205 -0.1849 0.0676 13
242641 -0.0581 0.0678 19
240333 -0.1236 0.0698 9
240555 -0.1544 0.0717 10
240241 -0.0836 0.0786 20
241684 -0.3217 0.0830 2
242800 -0.1364 0.0836 22
242578 0.0296 0.0857 13
240280 -0.5325 0.0870 18
240218 -0.1779 0.0873 26
242837 -0.0497 0.0884 9
242620 -0.0306 0.0961 18
240121 -0.3957 0.1007 8
242741 0.0843 0.1011 23
240686 -0.0878 0.1032 21
239745 0.0627 0.1095 15
240093 -0.0609 0.1123 14
240445 0.0126 0.1139 29
240627 -0.1203 0.1141 14
240354 -0.1963 0.1174 37
239959 0.0509 0.1198 17
239970 -0.3065 0.1208 21
239807 -0.1329 0.1232 11
240044 -0.3213 0.1289 10
240717 -0.3937 0.1351 16
239864 0.0306 0.1395 66
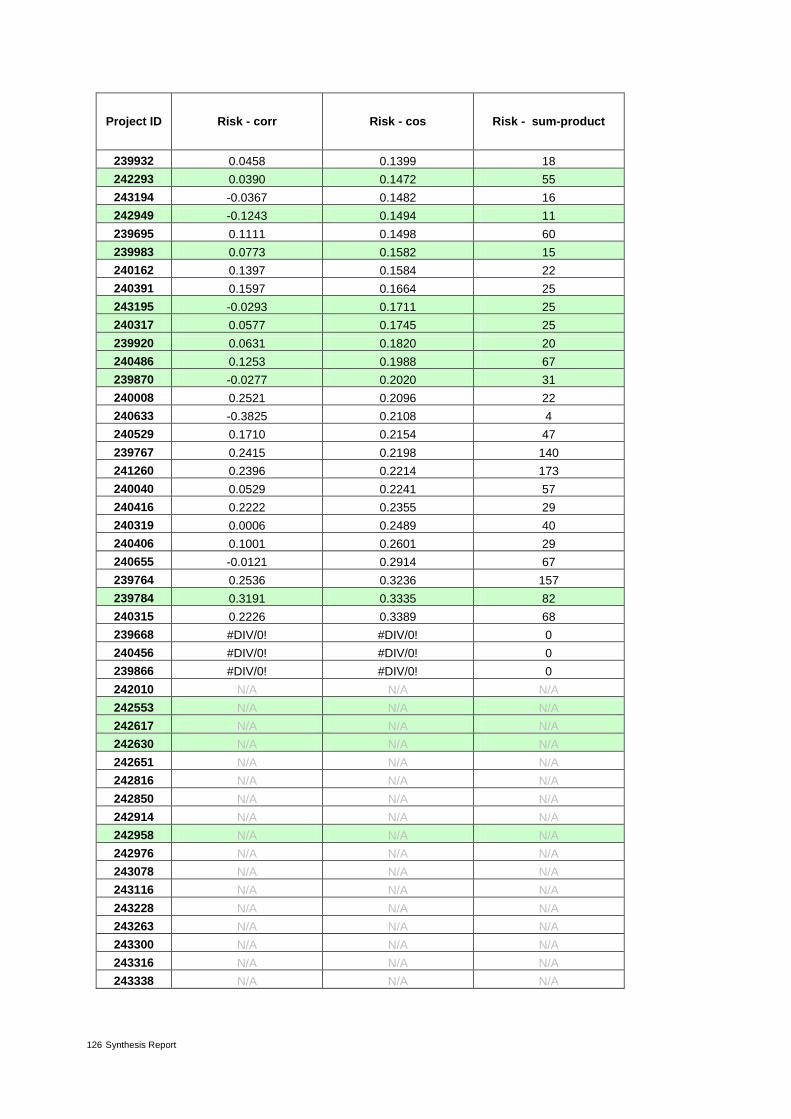
126 Synthesis Report
Project ID Risk - corr Risk - cos Risk - sum-product
239932 0.0458 0.1399 18
242293 0.0390 0.1472 55
243194 -0.0367 0.1482 16
242949 -0.1243 0.1494 11
239695 0.1111 0.1498 60
239983 0.0773 0.1582 15
240162 0.1397 0.1584 22
240391 0.1597 0.1664 25
243195 -0.0293 0.1711 25
240317 0.0577 0.1745 25
239920 0.0631 0.1820 20
240486 0.1253 0.1988 67
239870 -0.0277 0.2020 31
240008 0.2521 0.2096 22
240633 -0.3825 0.2108 4
240529 0.1710 0.2154 47
239767 0.2415 0.2198 140
241260 0.2396 0.2214 173
240040 0.0529 0.2241 57
240416 0.2222 0.2355 29
240319 0.0006 0.2489 40
240406 0.1001 0.2601 29
240655 -0.0121 0.2914 67
239764 0.2536 0.3236 157
239784 0.3191 0.3335 82
240315 0.2226 0.3389 68
239668 #DIV/0! #DIV/0! 0
240456 #DIV/0! #DIV/0! 0
239866 #DIV/0! #DIV/0! 0
242010 N/A N/A N/A
242553 N/A N/A N/A
242617 N/A N/A N/A
242630 N/A N/A N/A
242651 N/A N/A N/A
242816 N/A N/A N/A
242850 N/A N/A N/A
242914 N/A N/A N/A
242958 N/A N/A N/A
242976 N/A N/A N/A
243078 N/A N/A N/A
243116 N/A N/A N/A
243228 N/A N/A N/A
243263 N/A N/A N/A
243300 N/A N/A N/A
243316 N/A N/A N/A
243338 N/A N/A N/A
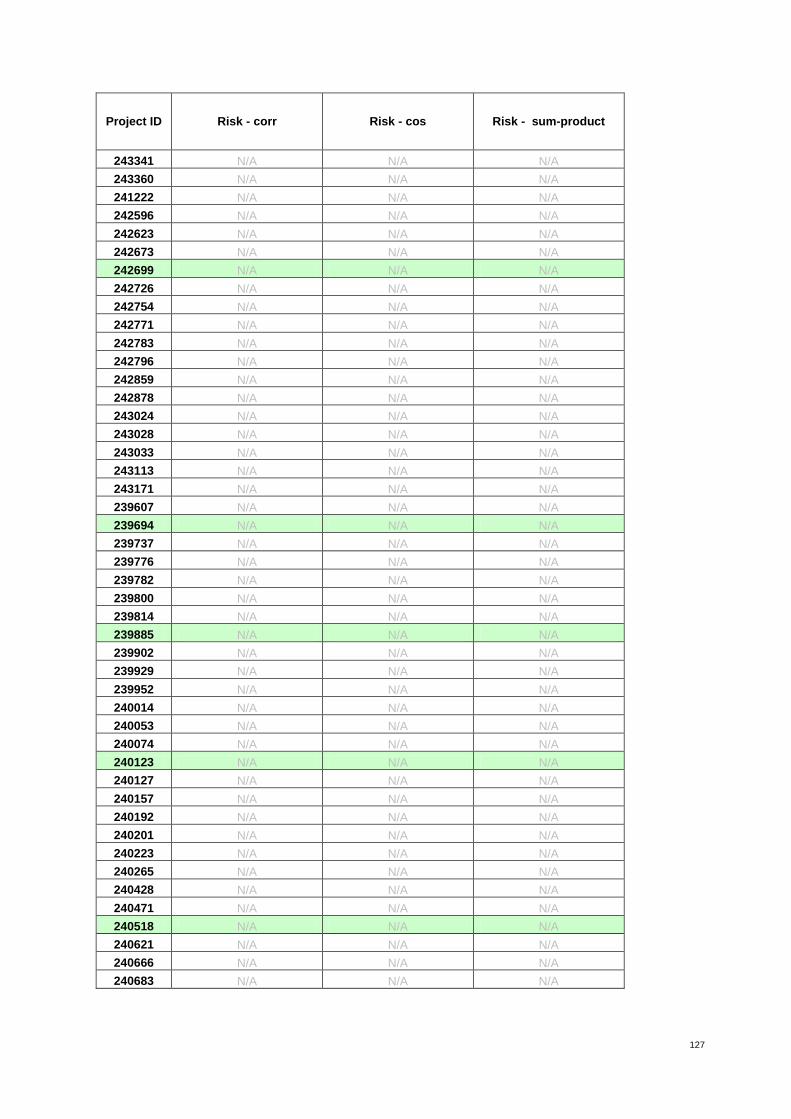
127
Project ID Risk - corr Risk - cos Risk - sum-product
243341 N/A N/A N/A
243360 N/A N/A N/A
241222 N/A N/A N/A
242596 N/A N/A N/A
242623 N/A N/A N/A
242673 N/A N/A N/A
242699 N/A N/A N/A
242726 N/A N/A N/A
242754 N/A N/A N/A
242771 N/A N/A N/A
242783 N/A N/A N/A
242796 N/A N/A N/A
242859 N/A N/A N/A
242878 N/A N/A N/A
243024 N/A N/A N/A
243028 N/A N/A N/A
243033 N/A N/A N/A
243113 N/A N/A N/A
243171 N/A N/A N/A
239607 N/A N/A N/A
239694 N/A N/A N/A
239737 N/A N/A N/A
239776 N/A N/A N/A
239782 N/A N/A N/A
239800 N/A N/A N/A
239814 N/A N/A N/A
239885 N/A N/A N/A
239902 N/A N/A N/A
239929 N/A N/A N/A
239952 N/A N/A N/A
240014 N/A N/A N/A
240053 N/A N/A N/A
240074 N/A N/A N/A
240123 N/A N/A N/A
240127 N/A N/A N/A
240157 N/A N/A N/A
240192 N/A N/A N/A
240201 N/A N/A N/A
240223 N/A N/A N/A
240265 N/A N/A N/A
240428 N/A N/A N/A
240471 N/A N/A N/A
240518 N/A N/A N/A
240621 N/A N/A N/A
240666 N/A N/A N/A
240683 N/A N/A N/A

128 Synthesis Report
Project ID Risk - corr Risk - cos Risk - sum-product
239501 N/A N/A N/A
239680 N/A N/A N/A
239689 N/A N/A N/A
239786 N/A N/A N/A
239937 N/A N/A N/A
239999 N/A N/A N/A
240004 N/A N/A N/A
240013 N/A N/A N/A
240020 N/A N/A N/A
240034 N/A N/A N/A
240054 N/A N/A N/A
240086 N/A N/A N/A
240091 N/A N/A N/A
240131 N/A N/A N/A
240149 N/A N/A N/A
240165 N/A N/A N/A
240213 N/A N/A N/A
240286 N/A N/A N/A
240390 N/A N/A N/A
240527 N/A N/A N/A
240625 N/A N/A N/A
239685 N/A N/A N/A
239751 N/A N/A N/A
239865 N/A N/A N/A
239913 N/A N/A N/A
240030 N/A N/A N/A
240050 N/A N/A N/A
240072 N/A N/A N/A
240332 N/A N/A N/A
240372 N/A N/A N/A
240436 N/A N/A N/A
240446 N/A N/A N/A
240462 N/A N/A N/A
240487 N/A N/A N/A
240519 N/A N/A N/A
240522 N/A N/A N/A
240547 N/A N/A N/A
240649 N/A N/A N/A
240675 N/A N/A N/A
240677 N/A N/A N/A
240682 N/A N/A N/A
240712 N/A N/A N/A

129
Pasteuresqueness indicator
Table A.22: The 37 proposals from ERC panel LS3 ranked by decreasing value of the two sub-indicators of pasteuresqueness: the number of patents and the part of applied works published by the PI (Call 2009 Starting Grant)
Project ID ERC panel Pasteuresqueness -
patents
Pasteuresqueness - applied part of PI's pub-
lications
243300 LS3 0 1
243316 LS3 0 1
242651 LS3 0 0.6896552
242993 LS3 0 0.6363636
243258 LS3 11 0.625
242958 LS3 0 0.6153846
243360 LS3 0 0.6
242914 LS3 3 0.5454545
242850 LS3 0 0.5
242976 LS3 0 0.5
243116 LS3 3 0.3333333
242010 LS3 0 0.3333333
243338 LS3 0 0.3157895
242617 LS3 0 0.2666667
242578 LS3 2 0.2142857
243378 LS3 2 0.1875
242570 LS3 0 0.1666667
243228 LS3 1 0.1428571
242366 LS3 0 0.1428571
242630 LS3 2 0.1304348
242800 LS3 0 0.125
243267 LS3 1 0.1176471
241451 LS3 0 0.0769231
243022 LS3 1 0.0666667
242741 LS3 0 0.0526316
242389 LS3 0 0
242553 LS3 0 0
242620 LS3 0 0
242807 LS3 0 0
242816 LS3 0 0
243078 LS3 0 0
243087 LS3 0 0
243131 LS3 0 0
243194 LS3 0 0
243263 LS3 0 0
243305 LS3 0 0
243341 LS3 0 0

130 Synthesis Report
Table A.23: The 33 proposals from ERC panel LS9 ranked by decreasing value of the two sub-indicators of pasteuresqueness: the number of patents and the part of applied works published by the PI (Call 2009 Starting Grant)
Project ID ERC panel Pasteuresqueness -
patents
Pasteuresqueness - applied part of PI's pub-
lications
242837 LS9 3 1
242783 LS9 1 1
243028 LS9 1 1
242673 LS9 0 1
242859 LS9 0 1
242878 LS9 0 1
242949 LS9 0 1
241260 LS9 0 0.9523801
243171 LS9 0 0.9473684
243195 LS9 2 0.9375
242915 LS9 5 0.9090909
243073 LS9 3 0.875
242596 LS9 0 0.8333333
243113 LS9 1 0.7619048
241684 LS9 0 0.75
243033 LS9 0 0.75
242726 LS9 0 0.7368421
242771 LS9 0 0.7
242564 LS9 0 0.6666667
242699 LS9 3 0.5555556
241222 LS9 0 0.5333333
242623 LS9 0 0.4545455
242820 LS9 0 0.2272727
242381 LS9 0 0.2
243118 LS9 0 0.1538462
240381 LS9 0 0.125
242293 LS9 0 0.0625
242641 LS9 0 0.0625
242754 LS9 0 0
242772 LS9 0 0
242796 LS9 0 0
243024 LS9 0 0
243137 LS9 0 0
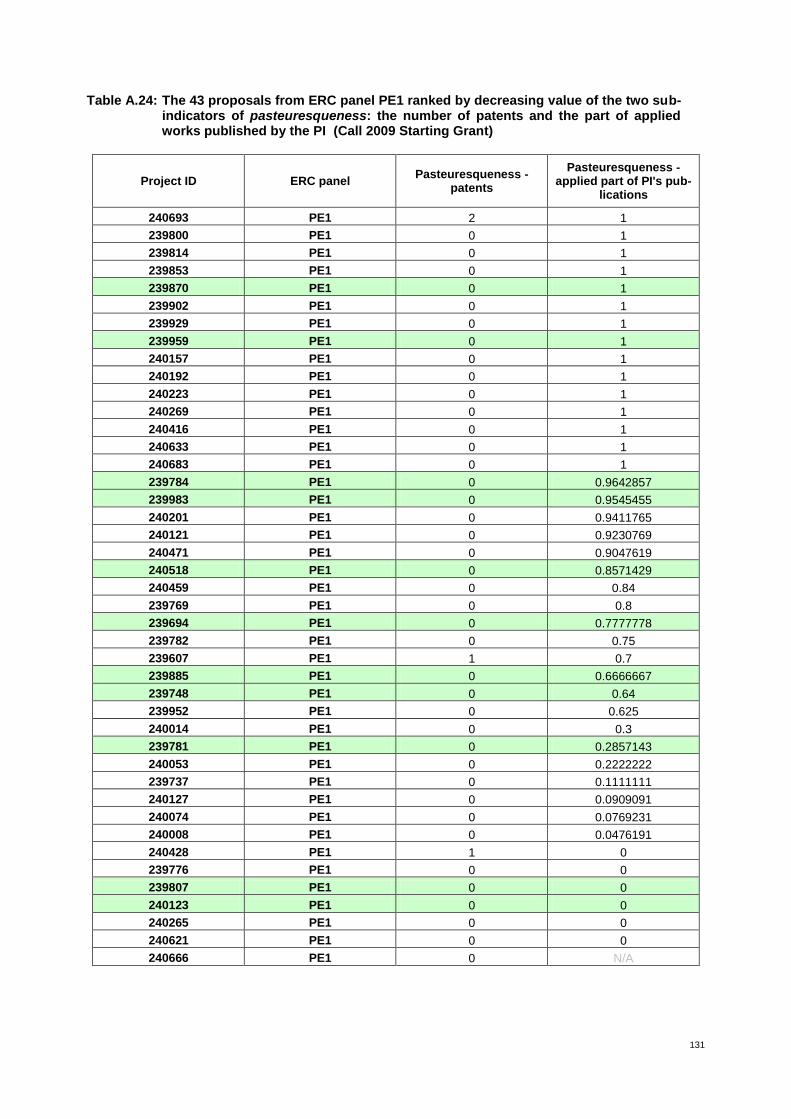
131
Table A.24: The 43 proposals from ERC panel PE1 ranked by decreasing value of the two sub-indicators of pasteuresqueness: the number of patents and the part of applied works published by the PI (Call 2009 Starting Grant)
Project ID ERC panel Pasteuresqueness -
patents
Pasteuresqueness - applied part of PI's pub-
lications
240693 PE1 2 1
239800 PE1 0 1
239814 PE1 0 1
239853 PE1 0 1
239870 PE1 0 1
239902 PE1 0 1
239929 PE1 0 1
239959 PE1 0 1
240157 PE1 0 1
240192 PE1 0 1
240223 PE1 0 1
240269 PE1 0 1
240416 PE1 0 1
240633 PE1 0 1
240683 PE1 0 1
239784 PE1 0 0.9642857
239983 PE1 0 0.9545455
240201 PE1 0 0.9411765
240121 PE1 0 0.9230769
240471 PE1 0 0.9047619
240518 PE1 0 0.8571429
240459 PE1 0 0.84
239769 PE1 0 0.8
239694 PE1 0 0.7777778
239782 PE1 0 0.75
239607 PE1 1 0.7
239885 PE1 0 0.6666667
239748 PE1 0 0.64
239952 PE1 0 0.625
240014 PE1 0 0.3
239781 PE1 0 0.2857143
240053 PE1 0 0.2222222
239737 PE1 0 0.1111111
240127 PE1 0 0.0909091
240074 PE1 0 0.0769231
240008 PE1 0 0.0476191
240428 PE1 1 0
239776 PE1 0 0
239807 PE1 0 0
240123 PE1 0 0
240265 PE1 0 0
240621 PE1 0 0
240666 PE1 0 N/A

132 Synthesis Report
Table A.25: The 44 proposals from ERC panel PE2 ranked by decreasing value of the two sub-indicators of pasteuresqueness: the number of patents and the part of applied works published by the PI (Call 2009 Starting Grant)
Project ID ERC panel Pasteuresqueness -
patents
Pasteuresqueness - applied part of PI's pub-
lications
239593 PE2 0 0.9090909
239680 PE2 0 0.6666667
240040 PE2 0 0.4
239949 PE2 1 0.2857143
240354 PE2 0 0.2
240315 PE2 0 0.1875
240034 PE2 0 0.1764706
240004 PE2 0 0.15
240013 PE2 1 0.125
240391 PE2 0 0.12
240162 PE2 0 0.0869565
239920 PE2 0 0.0714286
240054 PE2 0 0.0588235
240390 PE2 1 0.03125
240616 PE2 1 0
239501 PE2 0 0
239681 PE2 0 0
239689 PE2 0 0
239695 PE2 0 0
239764 PE2 0 0
239767 PE2 0 0
239786 PE2 0 0
239828 PE2 0 0
239860 PE2 0 0
239864 PE2 0 0
239937 PE2 0 0
239999 PE2 0 0
240020 PE2 0 0
240036 PE2 0 0
240086 PE2 0 0
240087 PE2 0 0
240091 PE2 0 0
240131 PE2 0 0
240149 PE2 0 0
240165 PE2 0 0
240213 PE2 0 0
240286 PE2 0 0
240319 PE2 0 0
240333 PE2 0 0
240486 PE2 0 0
240527 PE2 0 0
240603 PE2 0 0
240625 PE2 0 0
240292 PE2 0 N/A
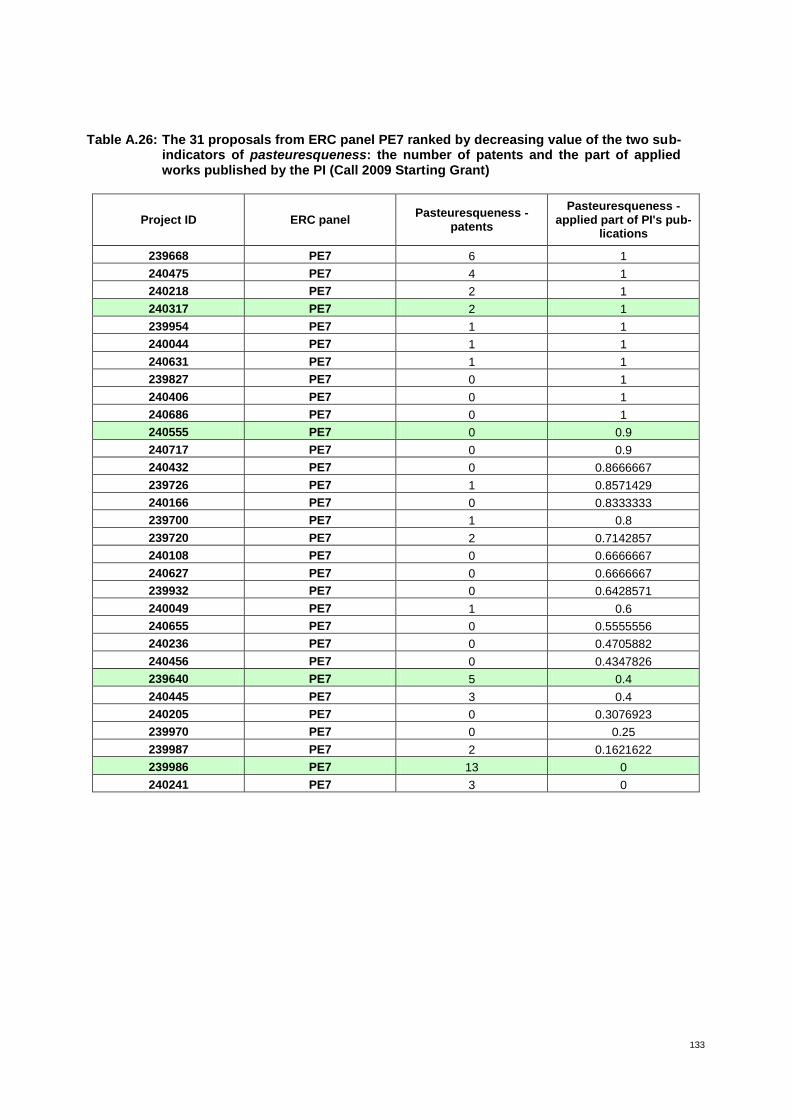
133
Table A.26: The 31 proposals from ERC panel PE7 ranked by decreasing value of the two sub-indicators of pasteuresqueness: the number of patents and the part of applied works published by the PI (Call 2009 Starting Grant)
Project ID ERC panel Pasteuresqueness -
patents
Pasteuresqueness - applied part of PI's pub-
lications
239668 PE7 6 1
240475 PE7 4 1
240218 PE7 2 1
240317 PE7 2 1
239954 PE7 1 1
240044 PE7 1 1
240631 PE7 1 1
239827 PE7 0 1
240406 PE7 0 1
240686 PE7 0 1
240555 PE7 0 0.9
240717 PE7 0 0.9
240432 PE7 0 0.8666667
239726 PE7 1 0.8571429
240166 PE7 0 0.8333333
239700 PE7 1 0.8
239720 PE7 2 0.7142857
240108 PE7 0 0.6666667
240627 PE7 0 0.6666667
239932 PE7 0 0.6428571
240049 PE7 1 0.6
240655 PE7 0 0.5555556
240236 PE7 0 0.4705882
240456 PE7 0 0.4347826
239640 PE7 5 0.4
240445 PE7 3 0.4
240205 PE7 0 0.3076923
239970 PE7 0 0.25
239987 PE7 2 0.1621622
239986 PE7 13 0
240241 PE7 3 0
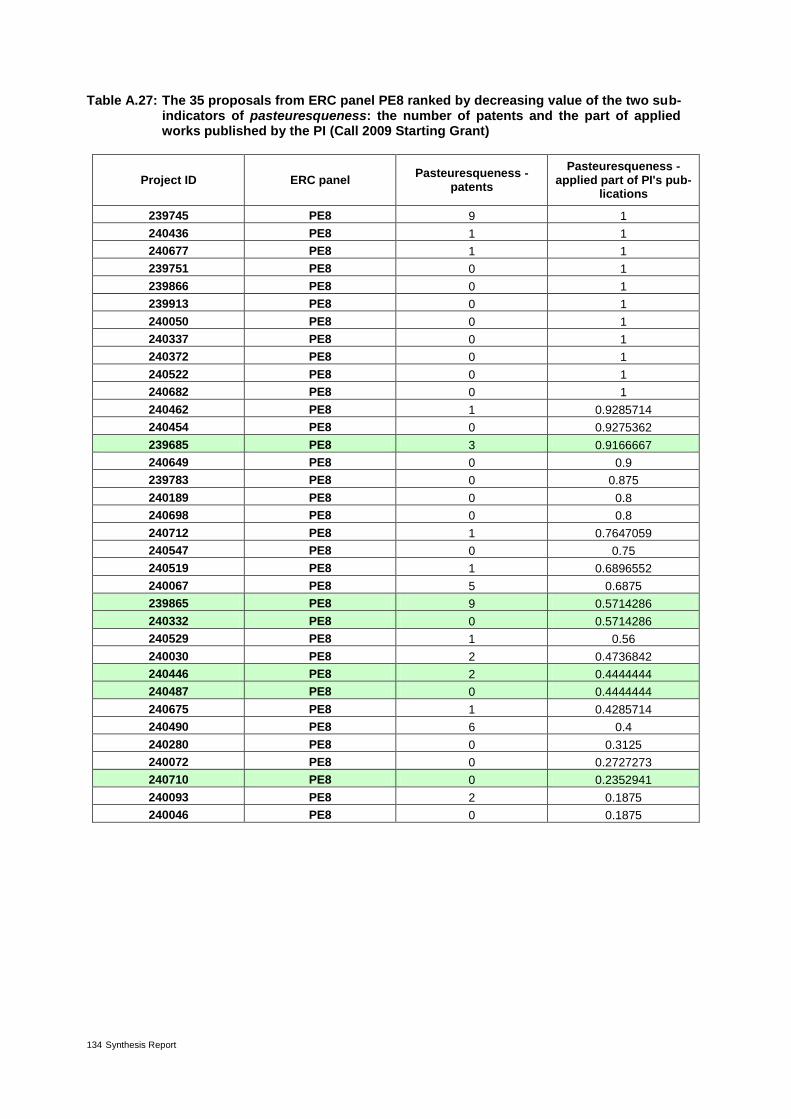
134 Synthesis Report
Table A.27: The 35 proposals from ERC panel PE8 ranked by decreasing value of the two sub-indicators of pasteuresqueness: the number of patents and the part of applied works published by the PI (Call 2009 Starting Grant)
Project ID ERC panel Pasteuresqueness -
patents
Pasteuresqueness - applied part of PI's pub-
lications
239745 PE8 9 1
240436 PE8 1 1
240677 PE8 1 1
239751 PE8 0 1
239866 PE8 0 1
239913 PE8 0 1
240050 PE8 0 1
240337 PE8 0 1
240372 PE8 0 1
240522 PE8 0 1
240682 PE8 0 1
240462 PE8 1 0.9285714
240454 PE8 0 0.9275362
239685 PE8 3 0.9166667
240649 PE8 0 0.9
239783 PE8 0 0.875
240189 PE8 0 0.8
240698 PE8 0 0.8
240712 PE8 1 0.7647059
240547 PE8 0 0.75
240519 PE8 1 0.6896552
240067 PE8 5 0.6875
239865 PE8 9 0.5714286
240332 PE8 0 0.5714286
240529 PE8 1 0.56
240030 PE8 2 0.4736842
240446 PE8 2 0.4444444
240487 PE8 0 0.4444444
240675 PE8 1 0.4285714
240490 PE8 6 0.4
240280 PE8 0 0.3125
240072 PE8 0 0.2727273
240710 PE8 0 0.2352941
240093 PE8 2 0.1875
240046 PE8 0 0.1875

135
Table A.28: The 223 proposals from ERC panels LS3, LS9, PE1, PE2, PE7 and PE8 ranked by decreasing value of the two sub indicators of pasteuresqueness: the number of patents and the part of applied works published by the PI (Call 2009 Starting Grant)
Project ID ERC panel Pasteuresqueness -
patents
Pasteuresqueness - part of PI's applied pub-
lications
239745 PE8 9 1
239668 PE7 6 1
240475 PE7 4 1
242837 LS9 3 1
240693 PE1 2 1
240218 PE7 2 1
240317 PE7 2 1
242783 LS9 1 1
243028 LS9 1 1
239954 PE7 1 1
240044 PE7 1 1
240631 PE7 1 1
240436 PE8 1 1
240677 PE8 1 1
243300 LS3 0 1
243316 LS3 0 1
242673 LS9 0 1
242859 LS9 0 1
242878 LS9 0 1
242949 LS9 0 1
239800 PE1 0 1
239814 PE1 0 1
239853 PE1 0 1
239870 PE1 0 1
239902 PE1 0 1
239929 PE1 0 1
239959 PE1 0 1
240157 PE1 0 1
240192 PE1 0 1
240223 PE1 0 1
240269 PE1 0 1
240416 PE1 0 1
240633 PE1 0 1
240683 PE1 0 1
239827 PE7 0 1
240406 PE7 0 1
240686 PE7 0 1
239751 PE8 0 1
239866 PE8 0 1
239913 PE8 0 1
240050 PE8 0 1
240337 PE8 0 1
240372 PE8 0 1
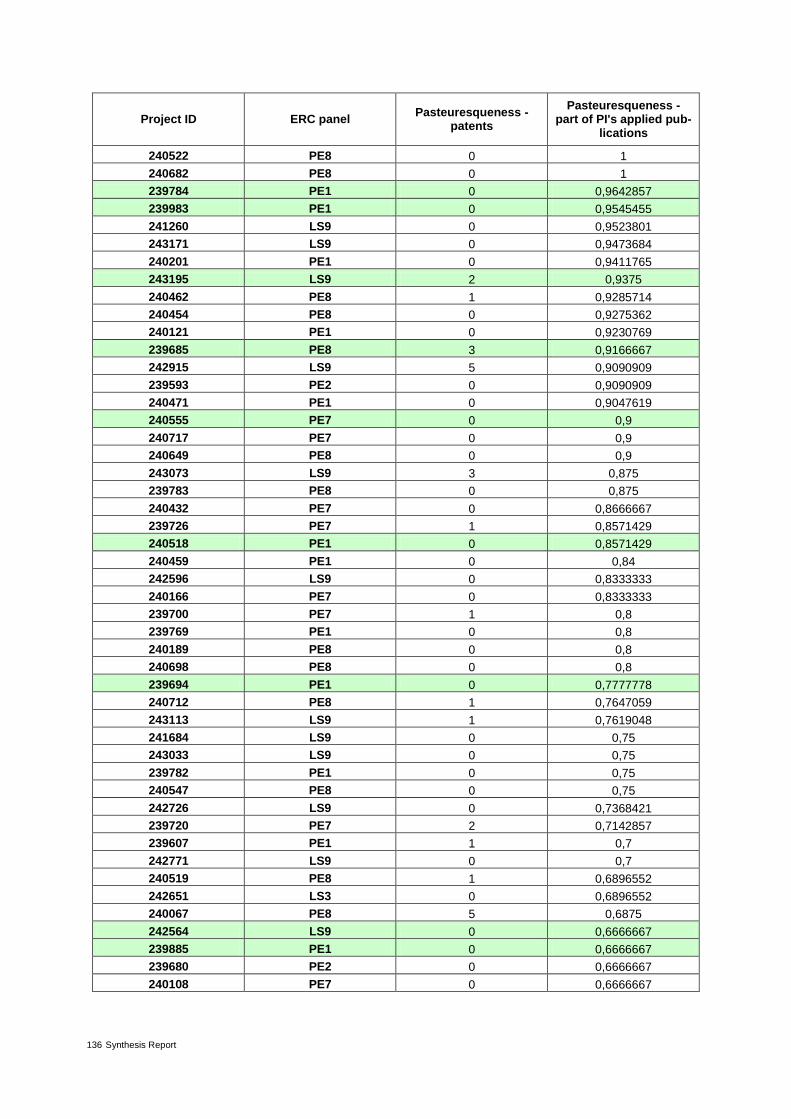
136 Synthesis Report
Project ID ERC panel Pasteuresqueness -
patents
Pasteuresqueness - part of PI's applied pub-
lications
240522 PE8 0 1
240682 PE8 0 1
239784 PE1 0 0,9642857
239983 PE1 0 0,9545455
241260 LS9 0 0,9523801
243171 LS9 0 0,9473684
240201 PE1 0 0,9411765
243195 LS9 2 0,9375
240462 PE8 1 0,9285714
240454 PE8 0 0,9275362
240121 PE1 0 0,9230769
239685 PE8 3 0,9166667
242915 LS9 5 0,9090909
239593 PE2 0 0,9090909
240471 PE1 0 0,9047619
240555 PE7 0 0,9
240717 PE7 0 0,9
240649 PE8 0 0,9
243073 LS9 3 0,875
239783 PE8 0 0,875
240432 PE7 0 0,8666667
239726 PE7 1 0,8571429
240518 PE1 0 0,8571429
240459 PE1 0 0,84
242596 LS9 0 0,8333333
240166 PE7 0 0,8333333
239700 PE7 1 0,8
239769 PE1 0 0,8
240189 PE8 0 0,8
240698 PE8 0 0,8
239694 PE1 0 0,7777778
240712 PE8 1 0,7647059
243113 LS9 1 0,7619048
241684 LS9 0 0,75
243033 LS9 0 0,75
239782 PE1 0 0,75
240547 PE8 0 0,75
242726 LS9 0 0,7368421
239720 PE7 2 0,7142857
239607 PE1 1 0,7
242771 LS9 0 0,7
240519 PE8 1 0,6896552
242651 LS3 0 0,6896552
240067 PE8 5 0,6875
242564 LS9 0 0,6666667
239885 PE1 0 0,6666667
239680 PE2 0 0,6666667
240108 PE7 0 0,6666667

137
Project ID ERC panel Pasteuresqueness -
patents
Pasteuresqueness - part of PI's applied pub-
lications
240627 PE7 0 0,6666667
239932 PE7 0 0,6428571
239748 PE1 0 0,64
242993 LS3 0 0,6363636
243258 LS3 11 0,625
239952 PE1 0 0,625
242958 LS3 0 0,6153846
240049 PE7 1 0,6
243360 LS3 0 0,6
239865 PE8 9 0,5714286
240332 PE8 0 0,5714286
240529 PE8 1 0,56
242699 LS9 3 0,5555556
240655 PE7 0 0,5555556
242914 LS3 3 0,5454545
241222 LS9 0 0,5333333
242850 LS3 0 0,5
242976 LS3 0 0,5
240030 PE8 2 0,4736842
240236 PE7 0 0,4705882
242623 LS9 0 0,4545455
240446 PE8 2 0,4444444
240487 PE8 0 0,4444444
240456 PE7 0 0,4347826
240675 PE8 1 0,4285714
240490 PE8 6 0,4
239640 PE7 5 0,4
240445 PE7 3 0,4
240040 PE2 0 0,4
243116 LS3 3 0,3333333
242010 LS3 0 0,3333333
243338 LS3 0 0,3157895
240280 PE8 0 0,3125
240205 PE7 0 0,3076923
240014 PE1 0 0,3
239949 PE2 1 0,2857143
239781 PE1 0 0,2857143
240072 PE8 0 0,2727273
242617 LS3 0 0,2666667
239970 PE7 0 0,25
240710 PE8 0 0,2352941
242820 LS9 0 0,2272727
240053 PE1 0 0,2222222
242578 LS3 2 0,2142857
242381 LS9 0 0,2
240354 PE2 0 0,2
243378 LS3 2 0,1875
240093 PE8 2 0,1875
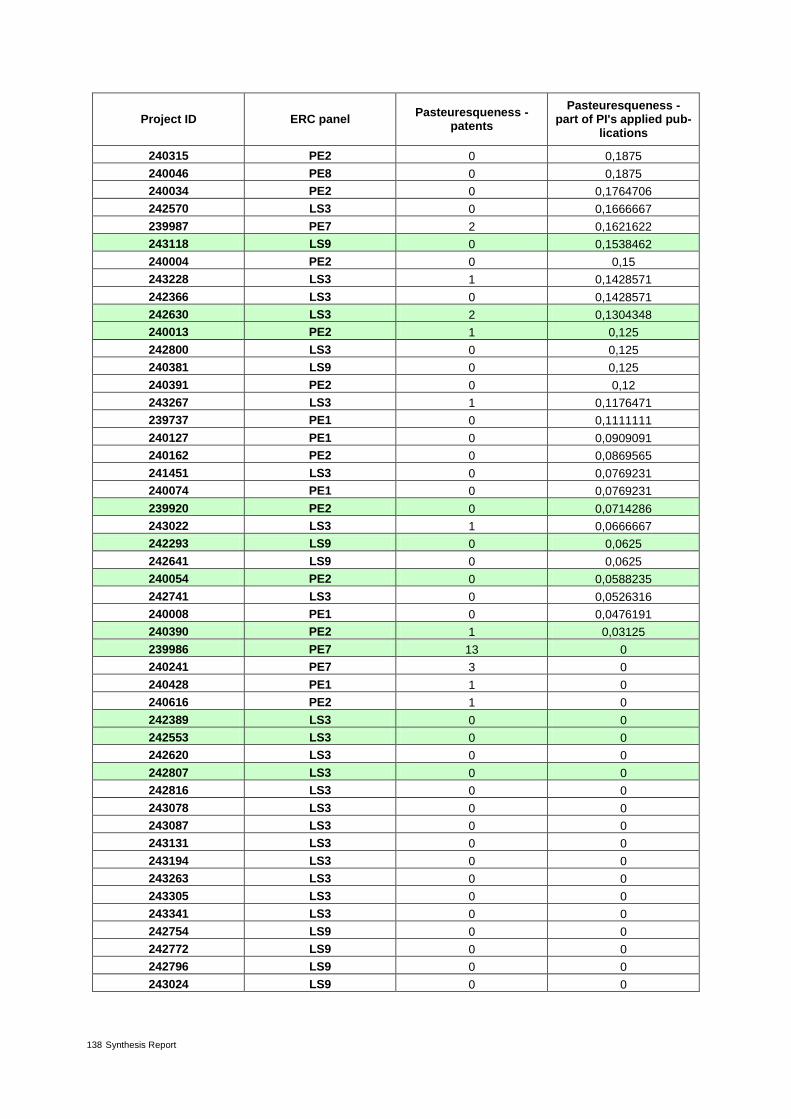
138 Synthesis Report
Project ID ERC panel Pasteuresqueness -
patents
Pasteuresqueness - part of PI's applied pub-
lications
240315 PE2 0 0,1875
240046 PE8 0 0,1875
240034 PE2 0 0,1764706
242570 LS3 0 0,1666667
239987 PE7 2 0,1621622
243118 LS9 0 0,1538462
240004 PE2 0 0,15
243228 LS3 1 0,1428571
242366 LS3 0 0,1428571
242630 LS3 2 0,1304348
240013 PE2 1 0,125
242800 LS3 0 0,125
240381 LS9 0 0,125
240391 PE2 0 0,12
243267 LS3 1 0,1176471
239737 PE1 0 0,1111111
240127 PE1 0 0,0909091
240162 PE2 0 0,0869565
241451 LS3 0 0,0769231
240074 PE1 0 0,0769231
239920 PE2 0 0,0714286
243022 LS3 1 0,0666667
242293 LS9 0 0,0625
242641 LS9 0 0,0625
240054 PE2 0 0,0588235
242741 LS3 0 0,0526316
240008 PE1 0 0,0476191
240390 PE2 1 0,03125
239986 PE7 13 0
240241 PE7 3 0
240428 PE1 1 0
240616 PE2 1 0
242389 LS3 0 0
242553 LS3 0 0
242620 LS3 0 0
242807 LS3 0 0
242816 LS3 0 0
243078 LS3 0 0
243087 LS3 0 0
243131 LS3 0 0
243194 LS3 0 0
243263 LS3 0 0
243305 LS3 0 0
243341 LS3 0 0
242754 LS9 0 0
242772 LS9 0 0
242796 LS9 0 0
243024 LS9 0 0
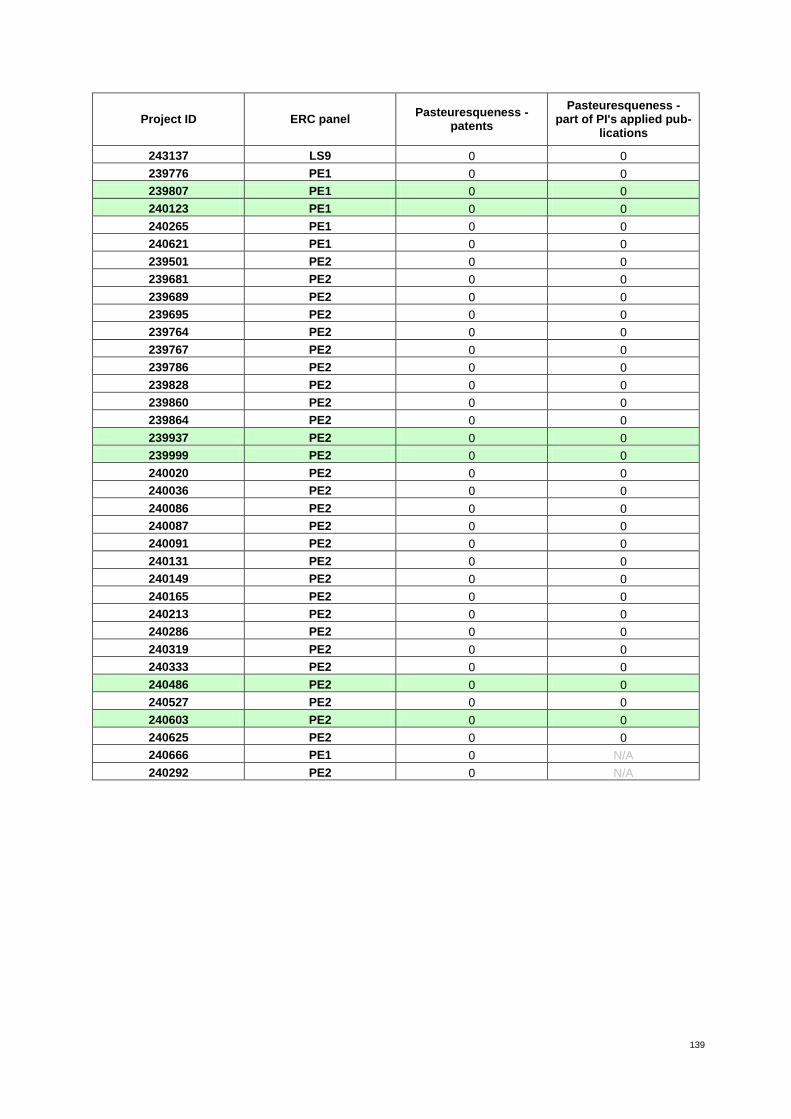
139
Project ID ERC panel Pasteuresqueness -
patents
Pasteuresqueness - part of PI's applied pub-
lications
243137 LS9 0 0
239776 PE1 0 0
239807 PE1 0 0
240123 PE1 0 0
240265 PE1 0 0
240621 PE1 0 0
239501 PE2 0 0
239681 PE2 0 0
239689 PE2 0 0
239695 PE2 0 0
239764 PE2 0 0
239767 PE2 0 0
239786 PE2 0 0
239828 PE2 0 0
239860 PE2 0 0
239864 PE2 0 0
239937 PE2 0 0
239999 PE2 0 0
240020 PE2 0 0
240036 PE2 0 0
240086 PE2 0 0
240087 PE2 0 0
240091 PE2 0 0
240131 PE2 0 0
240149 PE2 0 0
240165 PE2 0 0
240213 PE2 0 0
240286 PE2 0 0
240319 PE2 0 0
240333 PE2 0 0
240486 PE2 0 0
240527 PE2 0 0
240603 PE2 0 0
240625 PE2 0 0
240666 PE1 0 N/A
240292 PE2 0 N/A
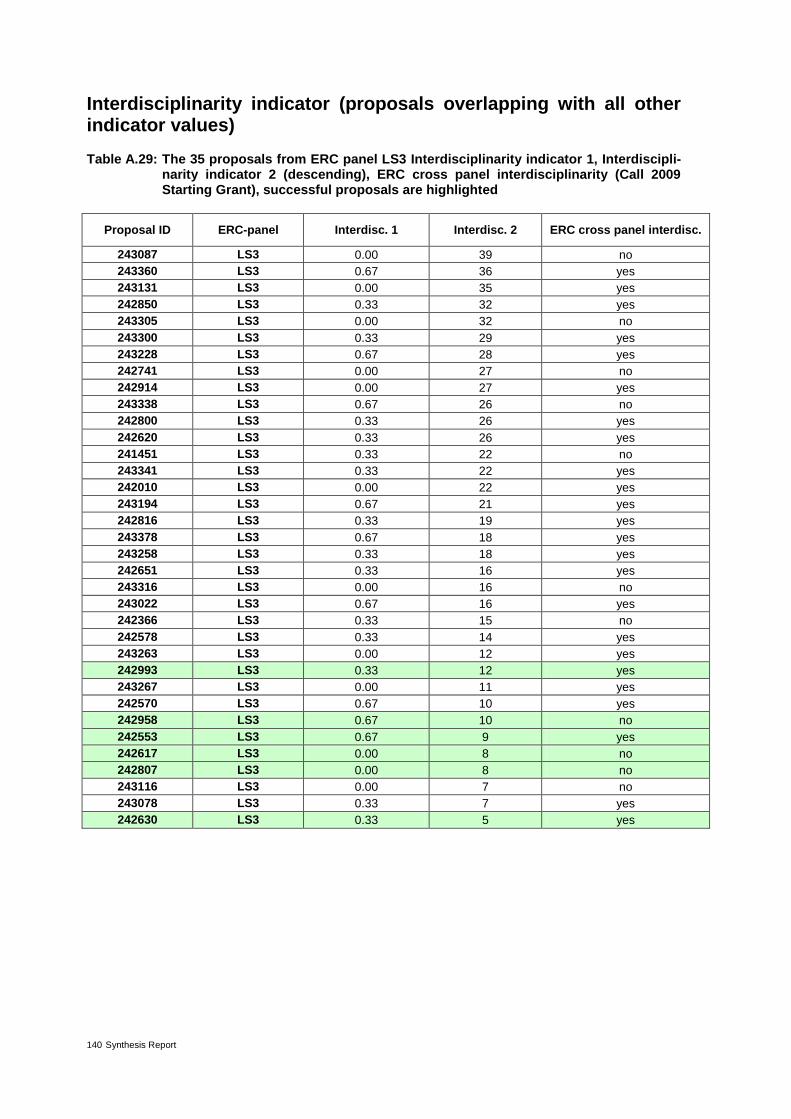
140 Synthesis Report
Interdisciplinarity indicator (proposals overlapping with all other indicator values)
Table A.29: The 35 proposals from ERC panel LS3 Interdisciplinarity indicator 1, Interdiscipli-narity indicator 2 (descending), ERC cross panel interdisciplinarity (Call 2009 Starting Grant), successful proposals are highlighted
Proposal ID ERC-panel Interdisc. 1 Interdisc. 2 ERC cross panel interdisc.
243087 LS3 0.00 39 no
243360 LS3 0.67 36 yes
243131 LS3 0.00 35 yes
242850 LS3 0.33 32 yes
243305 LS3 0.00 32 no
243300 LS3 0.33 29 yes
243228 LS3 0.67 28 yes
242741 LS3 0.00 27 no
242914 LS3 0.00 27 yes
243338 LS3 0.67 26 no
242800 LS3 0.33 26 yes
242620 LS3 0.33 26 yes
241451 LS3 0.33 22 no
243341 LS3 0.33 22 yes
242010 LS3 0.00 22 yes
243194 LS3 0.67 21 yes
242816 LS3 0.33 19 yes
243378 LS3 0.67 18 yes
243258 LS3 0.33 18 yes
242651 LS3 0.33 16 yes
243316 LS3 0.00 16 no
243022 LS3 0.67 16 yes
242366 LS3 0.33 15 no
242578 LS3 0.33 14 yes
243263 LS3 0.00 12 yes
242993 LS3 0.33 12 yes
243267 LS3 0.00 11 yes
242570 LS3 0.67 10 yes
242958 LS3 0.67 10 no
242553 LS3 0.67 9 yes
242617 LS3 0.00 8 no
242807 LS3 0.00 8 no
243116 LS3 0.00 7 no
243078 LS3 0.33 7 yes
242630 LS3 0.33 5 yes

141
Table A.30: The 31 proposals from ERC panel LS9 interdisciplinarity indicator 1, Interdiscipli-narity indicator 2 (descending), ERC cross panel interdisciplinarity (Call 2009 Starting Grant), successful proposals are highlighted
Proposal ID ERC-panel Interdisc. 1 Interdisc. 2 ERC cross panel interdisc.
242783 LS9 0.33 44 yes
242726 LS9 0.33 35 yes
242837 LS9 0.67 28 yes
242820 LS9 0.67 24 yes
242796 LS9 0.33 21 yes
241684 LS9 0.00 19 no
243033 LS9 0.00 17 no
242641 LS9 0.33 16 yes
241222 LS9 0.33 16 no
242754 LS9 0.67 16 yes
241260 LS9 0.67 15 yes
242381 LS9 0.67 14 yes
242673 LS9 0.67 14 yes
243073 LS9 0.33 14 no
242771 LS9 0.67 13 yes
242878 LS9 0.00 13 no
242949 LS9 0.67 12 yes
240381 LS9 0.33 12 yes
242915 LS9 0.33 12 yes
243137 LS9 0.67 10 yes
242293 LS9 0.00 10 no
243118 LS9 0.00 9 no
242596 LS9 0.00 8 no
243024 LS9 0.33 8 yes
243113 LS9 0.33 7 yes
243195 LS9 0.33 6 no
242564 LS9 0.33 6 yes
242772 LS9 0.33 6 yes
242623 LS9 0.00 6 no
242859 LS9 0.33 5 yes
243028 LS9 0.33 1 no
Table A.31: The 38 proposals from ERC panel PE1 Interdisciplinarity indicator 1, Interdiscipli-narity indicator 2 (descending), ERC cross panel interdisciplinarity (Call 2009 Starting Grant), successful proposals are highlighted
Proposal ID ERC-panel Interdisc. 1 Interdisc. 2 ERC cross panel interdisc.
240683 PE1 0.67 44 yes
240192 PE1 0.33 43 yes
240459 PE1 0.00 40 no
240053 PE1 0.00 40 yes
239737 PE1 0.00 38 no
239853 PE1 0.00 27 no
240428 PE1 0.33 26 no
240014 PE1 0.00 25 no
240416 PE1 0.33 25 yes
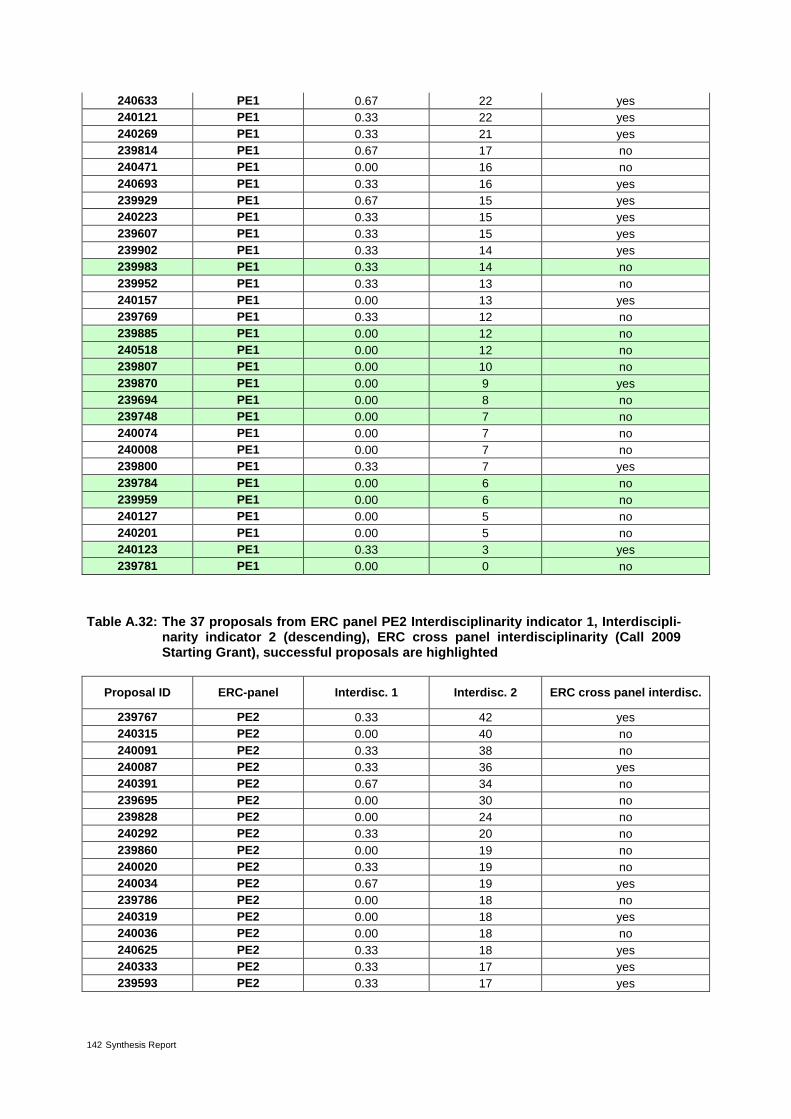
142 Synthesis Report
240633 PE1 0.67 22 yes
240121 PE1 0.33 22 yes
240269 PE1 0.33 21 yes
239814 PE1 0.67 17 no
240471 PE1 0.00 16 no
240693 PE1 0.33 16 yes
239929 PE1 0.67 15 yes
240223 PE1 0.33 15 yes
239607 PE1 0.33 15 yes
239902 PE1 0.33 14 yes
239983 PE1 0.33 14 no
239952 PE1 0.33 13 no
240157 PE1 0.00 13 yes
239769 PE1 0.33 12 no
239885 PE1 0.00 12 no
240518 PE1 0.00 12 no
239807 PE1 0.00 10 no
239870 PE1 0.00 9 yes
239694 PE1 0.00 8 no
239748 PE1 0.00 7 no
240074 PE1 0.00 7 no
240008 PE1 0.00 7 no
239800 PE1 0.33 7 yes
239784 PE1 0.00 6 no
239959 PE1 0.00 6 no
240127 PE1 0.00 5 no
240201 PE1 0.00 5 no
240123 PE1 0.33 3 yes
239781 PE1 0.00 0 no
Table A.32: The 37 proposals from ERC panel PE2 Interdisciplinarity indicator 1, Interdiscipli-narity indicator 2 (descending), ERC cross panel interdisciplinarity (Call 2009 Starting Grant), successful proposals are highlighted
Proposal ID ERC-panel Interdisc. 1 Interdisc. 2 ERC cross panel interdisc.
239767 PE2 0.33 42 yes
240315 PE2 0.00 40 no
240091 PE2 0.33 38 no
240087 PE2 0.33 36 yes
240391 PE2 0.67 34 no
239695 PE2 0.00 30 no
239828 PE2 0.00 24 no
240292 PE2 0.33 20 no
239860 PE2 0.00 19 no
240020 PE2 0.33 19 no
240034 PE2 0.67 19 yes
239786 PE2 0.00 18 no
240319 PE2 0.00 18 yes
240036 PE2 0.00 18 no
240625 PE2 0.33 18 yes
240333 PE2 0.33 17 yes
239593 PE2 0.33 17 yes
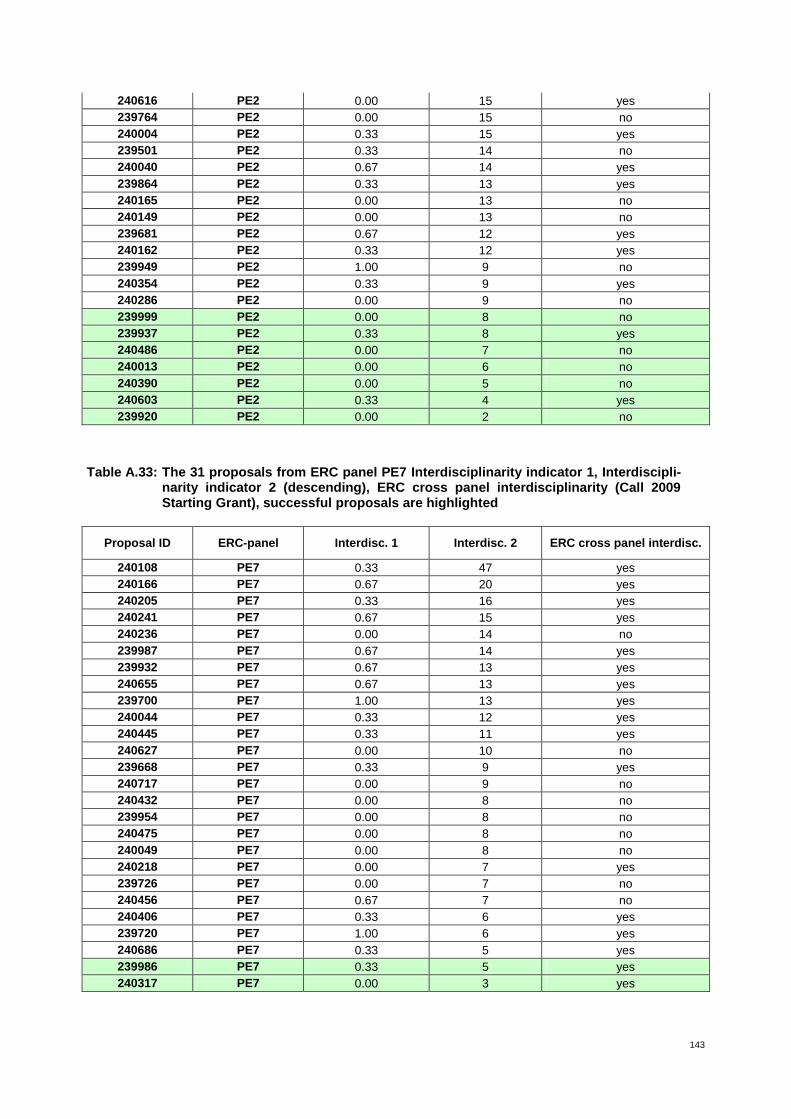
143
240616 PE2 0.00 15 yes
239764 PE2 0.00 15 no
240004 PE2 0.33 15 yes
239501 PE2 0.33 14 no
240040 PE2 0.67 14 yes
239864 PE2 0.33 13 yes
240165 PE2 0.00 13 no
240149 PE2 0.00 13 no
239681 PE2 0.67 12 yes
240162 PE2 0.33 12 yes
239949 PE2 1.00 9 no
240354 PE2 0.33 9 yes
240286 PE2 0.00 9 no
239999 PE2 0.00 8 no
239937 PE2 0.33 8 yes
240486 PE2 0.00 7 no
240013 PE2 0.00 6 no
240390 PE2 0.00 5 no
240603 PE2 0.33 4 yes
239920 PE2 0.00 2 no
Table A.33: The 31 proposals from ERC panel PE7 Interdisciplinarity indicator 1, Interdiscipli-narity indicator 2 (descending), ERC cross panel interdisciplinarity (Call 2009 Starting Grant), successful proposals are highlighted
Proposal ID ERC-panel Interdisc. 1 Interdisc. 2 ERC cross panel interdisc.
240108 PE7 0.33 47 yes
240166 PE7 0.67 20 yes
240205 PE7 0.33 16 yes
240241 PE7 0.67 15 yes
240236 PE7 0.00 14 no
239987 PE7 0.67 14 yes
239932 PE7 0.67 13 yes
240655 PE7 0.67 13 yes
239700 PE7 1.00 13 yes
240044 PE7 0.33 12 yes
240445 PE7 0.33 11 yes
240627 PE7 0.00 10 no
239668 PE7 0.33 9 yes
240717 PE7 0.00 9 no
240432 PE7 0.00 8 no
239954 PE7 0.00 8 no
240475 PE7 0.00 8 no
240049 PE7 0.00 8 no
240218 PE7 0.00 7 yes
239726 PE7 0.00 7 no
240456 PE7 0.67 7 no
240406 PE7 0.33 6 yes
239720 PE7 1.00 6 yes
240686 PE7 0.33 5 yes
239986 PE7 0.33 5 yes
240317 PE7 0.00 3 yes
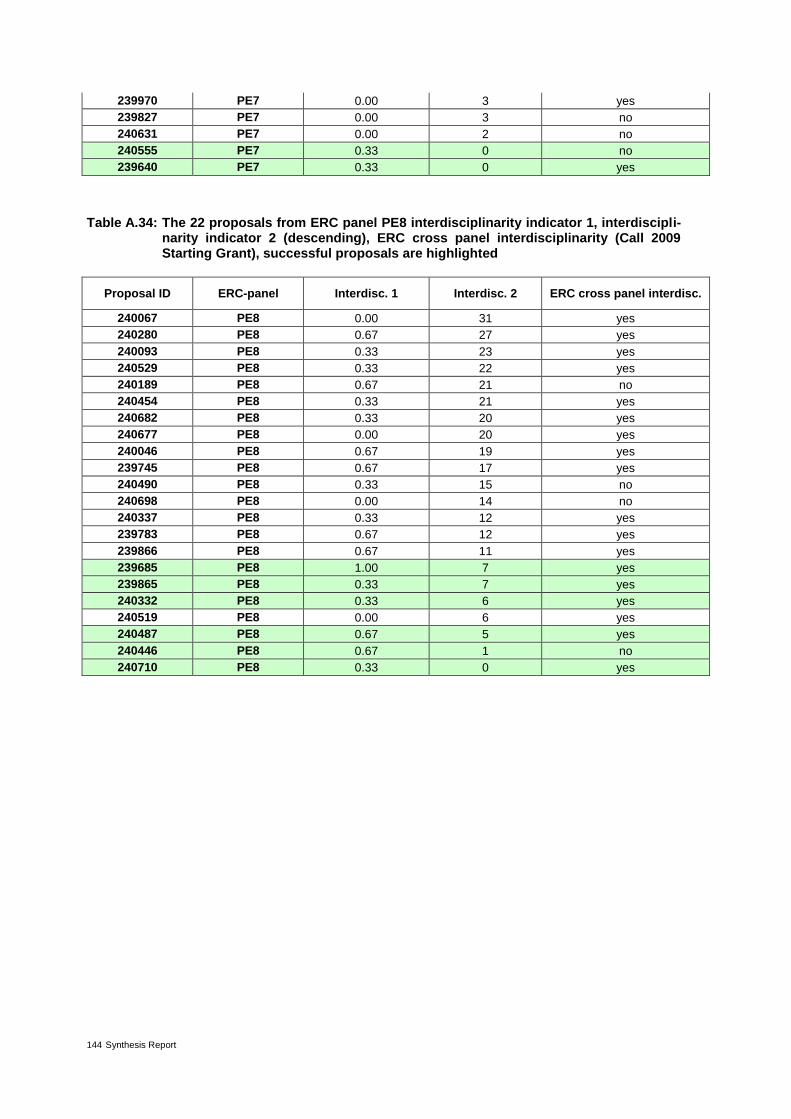
144 Synthesis Report
239970 PE7 0.00 3 yes
239827 PE7 0.00 3 no
240631 PE7 0.00 2 no
240555 PE7 0.33 0 no
239640 PE7 0.33 0 yes
Table A.34: The 22 proposals from ERC panel PE8 interdisciplinarity indicator 1, interdiscipli-narity indicator 2 (descending), ERC cross panel interdisciplinarity (Call 2009 Starting Grant), successful proposals are highlighted
Proposal ID ERC-panel Interdisc. 1 Interdisc. 2 ERC cross panel interdisc.
240067 PE8 0.00 31 yes
240280 PE8 0.67 27 yes
240093 PE8 0.33 23 yes
240529 PE8 0.33 22 yes
240189 PE8 0.67 21 no
240454 PE8 0.33 21 yes
240682 PE8 0.33 20 yes
240677 PE8 0.00 20 yes
240046 PE8 0.67 19 yes
239745 PE8 0.67 17 yes
240490 PE8 0.33 15 no
240698 PE8 0.00 14 no
240337 PE8 0.33 12 yes
239783 PE8 0.67 12 yes
239866 PE8 0.67 11 yes
239685 PE8 1.00 7 yes
239865 PE8 0.33 7 yes
240332 PE8 0.33 6 yes
240519 PE8 0.00 6 yes
240487 PE8 0.67 5 yes
240446 PE8 0.67 1 no
240710 PE8 0.33 0 yes

145
Table A.35: The 194 proposals from ERC panels LS3, LS9, PE1, PE2, PE7 and Interdiscipli-narity indicator 1, Interdisciplinarity indicator 2 (descending), ERC cross panel in-terdisciplinarity (Call 2009 Starting Grant), successful proposals are highlighted
Proposal ID ERC-panel Interdisc. 1 Interdisc. 2 ERC cross panel interdisc.
240108 PE7 0.33 47 yes
242783 LS9 0.33 44 yes
240683 PE1 0.67 44 yes
240192 PE1 0.33 43 yes
239767 PE2 0.33 42 yes
240459 PE1 0.00 40 no
240053 PE1 0.00 40 yes
240315 PE2 0.00 40 no
243087 LS3 0.00 39 no
239737 PE1 0.00 38 no
240091 PE2 0.33 38 no
243360 LS3 0.67 36 yes
240087 PE2 0.33 36 yes
243131 LS3 0.00 35 yes
242726 LS9 0.33 35 yes
240391 PE2 0.67 34 no
242850 LS3 0.33 32 yes
243305 LS3 0.00 32 no
240067 PE8 0.00 31 yes
239695 PE2 0.00 30 no
243300 LS3 0.33 29 yes
243228 LS3 0.67 28 yes
242837 LS9 0.67 28 yes
242741 LS3 0.00 27 no
242914 LS3 0.00 27 yes
239853 PE1 0.00 27 no
240280 PE8 0.67 27 yes
243338 LS3 0.67 26 no
242800 LS3 0.33 26 yes
242620 LS3 0.33 26 yes
240428 PE1 0.33 26 no
240014 PE1 0.00 25 no
240416 PE1 0.33 25 yes
242820 LS9 0.67 24 yes
239828 PE2 0.00 24 no
240093 PE8 0.33 23 yes
241451 LS3 0.33 22 no
243341 LS3 0.33 22 yes
242010 LS3 0.00 22 yes
240633 PE1 0.67 22 yes
240121 PE1 0.33 22 yes
240529 PE8 0.33 22 yes
243194 LS3 0.67 21 yes
242796 LS9 0.33 21 yes
240269 PE1 0.33 21 yes
240189 PE8 0.67 21 no
240454 PE8 0.33 21 yes
240292 PE2 0.33 20 no
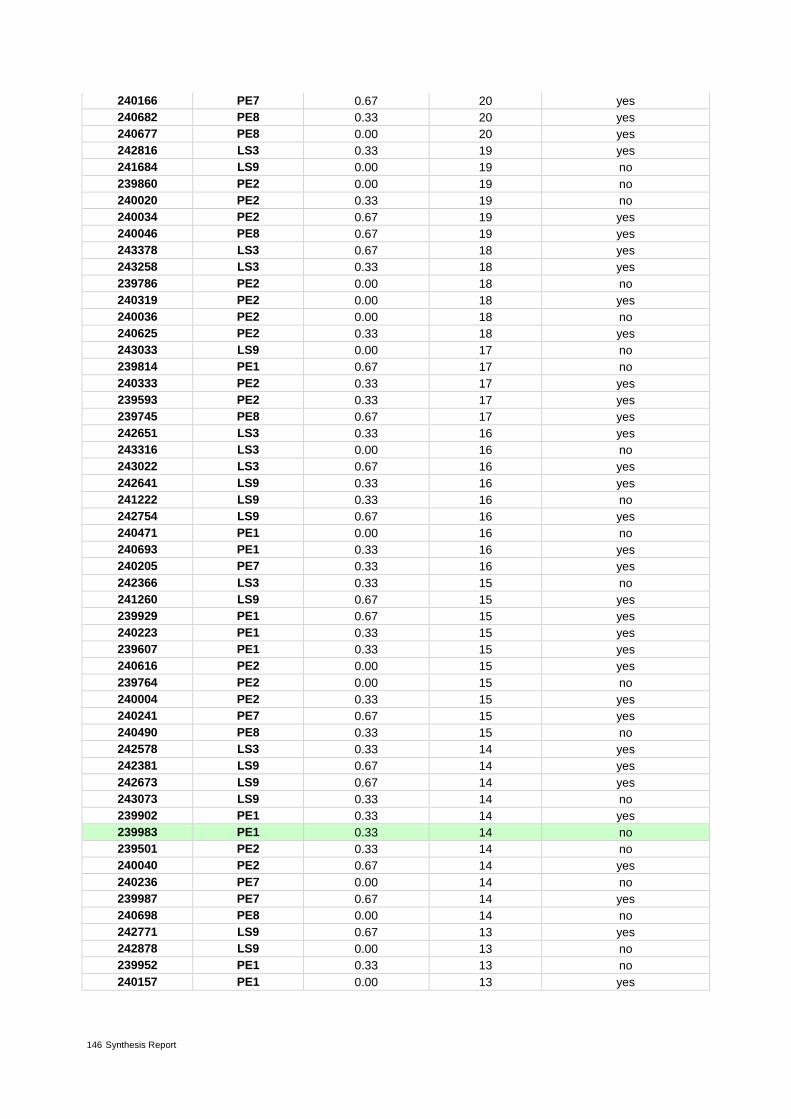
146 Synthesis Report
240166 PE7 0.67 20 yes
240682 PE8 0.33 20 yes
240677 PE8 0.00 20 yes
242816 LS3 0.33 19 yes
241684 LS9 0.00 19 no
239860 PE2 0.00 19 no
240020 PE2 0.33 19 no
240034 PE2 0.67 19 yes
240046 PE8 0.67 19 yes
243378 LS3 0.67 18 yes
243258 LS3 0.33 18 yes
239786 PE2 0.00 18 no
240319 PE2 0.00 18 yes
240036 PE2 0.00 18 no
240625 PE2 0.33 18 yes
243033 LS9 0.00 17 no
239814 PE1 0.67 17 no
240333 PE2 0.33 17 yes
239593 PE2 0.33 17 yes
239745 PE8 0.67 17 yes
242651 LS3 0.33 16 yes
243316 LS3 0.00 16 no
243022 LS3 0.67 16 yes
242641 LS9 0.33 16 yes
241222 LS9 0.33 16 no
242754 LS9 0.67 16 yes
240471 PE1 0.00 16 no
240693 PE1 0.33 16 yes
240205 PE7 0.33 16 yes
242366 LS3 0.33 15 no
241260 LS9 0.67 15 yes
239929 PE1 0.67 15 yes
240223 PE1 0.33 15 yes
239607 PE1 0.33 15 yes
240616 PE2 0.00 15 yes
239764 PE2 0.00 15 no
240004 PE2 0.33 15 yes
240241 PE7 0.67 15 yes
240490 PE8 0.33 15 no
242578 LS3 0.33 14 yes
242381 LS9 0.67 14 yes
242673 LS9 0.67 14 yes
243073 LS9 0.33 14 no
239902 PE1 0.33 14 yes
239983 PE1 0.33 14 no
239501 PE2 0.33 14 no
240040 PE2 0.67 14 yes
240236 PE7 0.00 14 no
239987 PE7 0.67 14 yes
240698 PE8 0.00 14 no
242771 LS9 0.67 13 yes
242878 LS9 0.00 13 no
239952 PE1 0.33 13 no
240157 PE1 0.00 13 yes
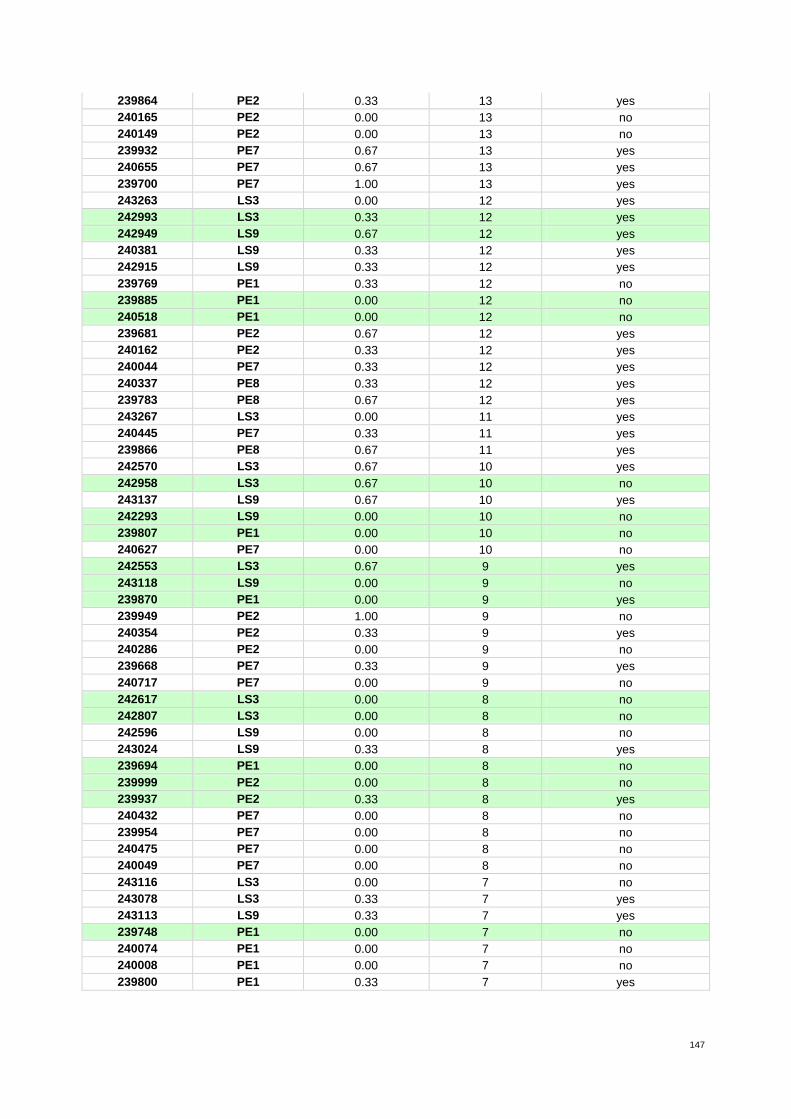
147
239864 PE2 0.33 13 yes
240165 PE2 0.00 13 no
240149 PE2 0.00 13 no
239932 PE7 0.67 13 yes
240655 PE7 0.67 13 yes
239700 PE7 1.00 13 yes
243263 LS3 0.00 12 yes
242993 LS3 0.33 12 yes
242949 LS9 0.67 12 yes
240381 LS9 0.33 12 yes
242915 LS9 0.33 12 yes
239769 PE1 0.33 12 no
239885 PE1 0.00 12 no
240518 PE1 0.00 12 no
239681 PE2 0.67 12 yes
240162 PE2 0.33 12 yes
240044 PE7 0.33 12 yes
240337 PE8 0.33 12 yes
239783 PE8 0.67 12 yes
243267 LS3 0.00 11 yes
240445 PE7 0.33 11 yes
239866 PE8 0.67 11 yes
242570 LS3 0.67 10 yes
242958 LS3 0.67 10 no
243137 LS9 0.67 10 yes
242293 LS9 0.00 10 no
239807 PE1 0.00 10 no
240627 PE7 0.00 10 no
242553 LS3 0.67 9 yes
243118 LS9 0.00 9 no
239870 PE1 0.00 9 yes
239949 PE2 1.00 9 no
240354 PE2 0.33 9 yes
240286 PE2 0.00 9 no
239668 PE7 0.33 9 yes
240717 PE7 0.00 9 no
242617 LS3 0.00 8 no
242807 LS3 0.00 8 no
242596 LS9 0.00 8 no
243024 LS9 0.33 8 yes
239694 PE1 0.00 8 no
239999 PE2 0.00 8 no
239937 PE2 0.33 8 yes
240432 PE7 0.00 8 no
239954 PE7 0.00 8 no
240475 PE7 0.00 8 no
240049 PE7 0.00 8 no
243116 LS3 0.00 7 no
243078 LS3 0.33 7 yes
243113 LS9 0.33 7 yes
239748 PE1 0.00 7 no
240074 PE1 0.00 7 no
240008 PE1 0.00 7 no
239800 PE1 0.33 7 yes
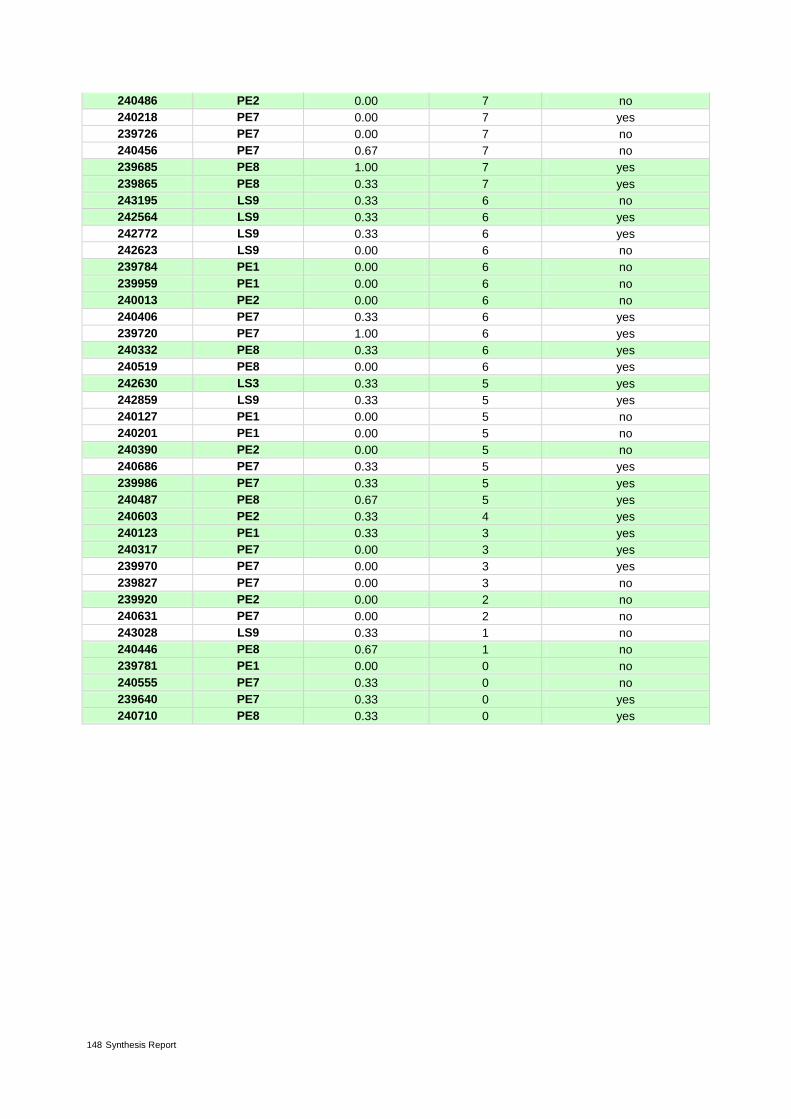
148 Synthesis Report
240486 PE2 0.00 7 no
240218 PE7 0.00 7 yes
239726 PE7 0.00 7 no
240456 PE7 0.67 7 no
239685 PE8 1.00 7 yes
239865 PE8 0.33 7 yes
243195 LS9 0.33 6 no
242564 LS9 0.33 6 yes
242772 LS9 0.33 6 yes
242623 LS9 0.00 6 no
239784 PE1 0.00 6 no
239959 PE1 0.00 6 no
240013 PE2 0.00 6 no
240406 PE7 0.33 6 yes
239720 PE7 1.00 6 yes
240332 PE8 0.33 6 yes
240519 PE8 0.00 6 yes
242630 LS3 0.33 5 yes
242859 LS9 0.33 5 yes
240127 PE1 0.00 5 no
240201 PE1 0.00 5 no
240390 PE2 0.00 5 no
240686 PE7 0.33 5 yes
239986 PE7 0.33 5 yes
240487 PE8 0.67 5 yes
240603 PE2 0.33 4 yes
240123 PE1 0.33 3 yes
240317 PE7 0.00 3 yes
239970 PE7 0.00 3 yes
239827 PE7 0.00 3 no
239920 PE2 0.00 2 no
240631 PE7 0.00 2 no
243028 LS9 0.33 1 no
240446 PE8 0.67 1 no
239781 PE1 0.00 0 no
240555 PE7 0.33 0 no
239640 PE7 0.33 0 yes
240710 PE8 0.33 0 yes
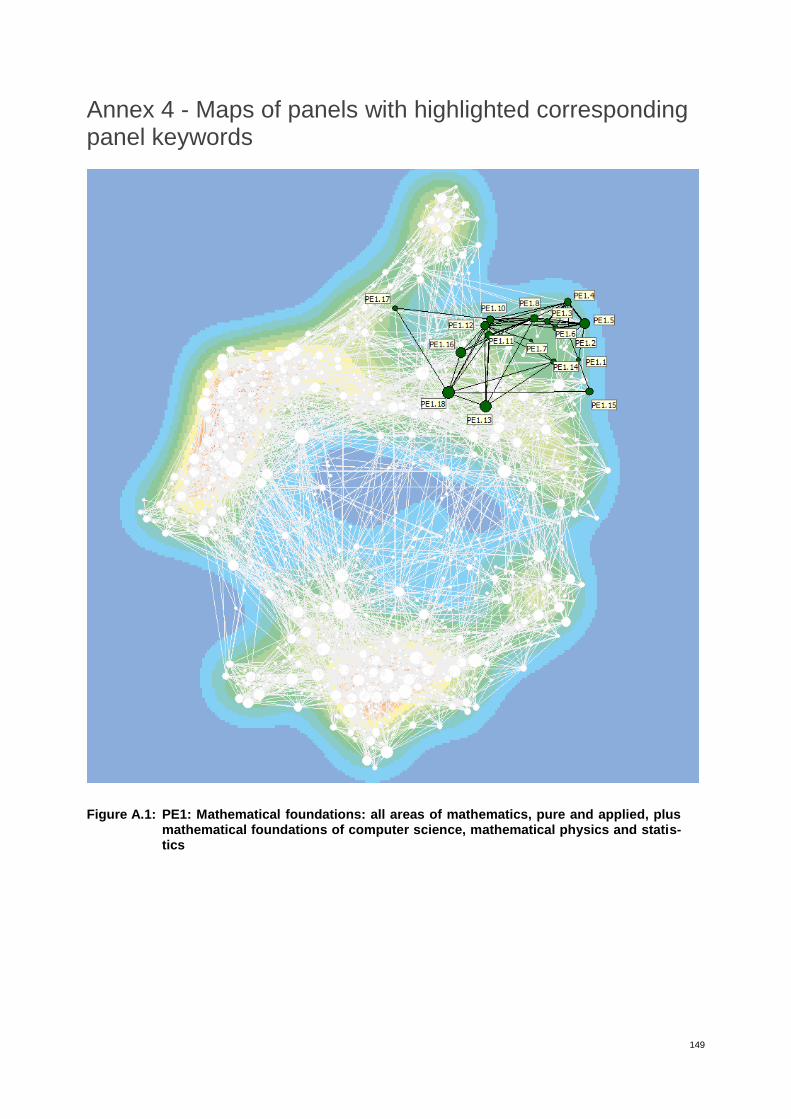
149
Annex 4 - Maps of panels with highlighted corresponding panel keywords
Figure A.1: PE1: Mathematical foundations: all areas of mathematics, pure and applied, plus mathematical foundations of computer science, mathematical physics and statis-tics

150 Synthesis Report
Figure A.2: PE2 Fundamental constituents of matter: particle, nuclear, plasma, atomic, mo-lecular, gas, and optical physics

151
Figure A.3: PE3 Condensed matter physics: structure, electronic properties, fluids, nanosci-ences Panel keyword map for PE3
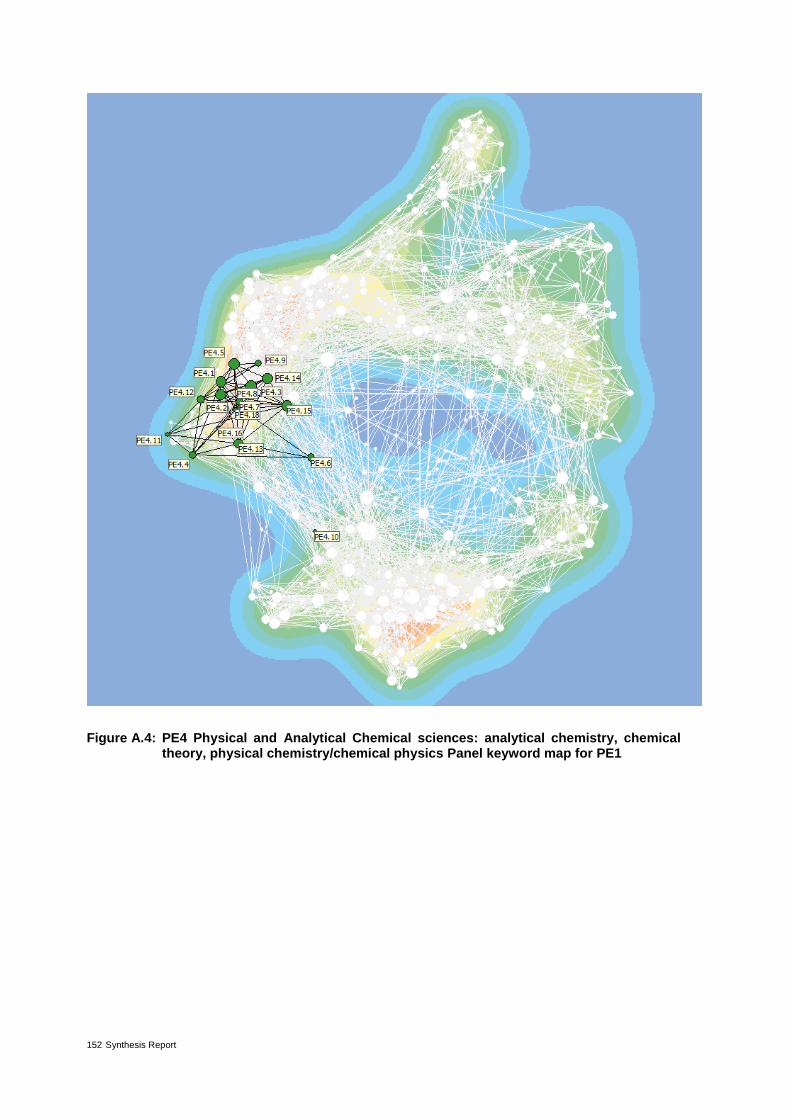
152 Synthesis Report
Figure A.4: PE4 Physical and Analytical Chemical sciences: analytical chemistry, chemical theory, physical chemistry/chemical physics Panel keyword map for PE1
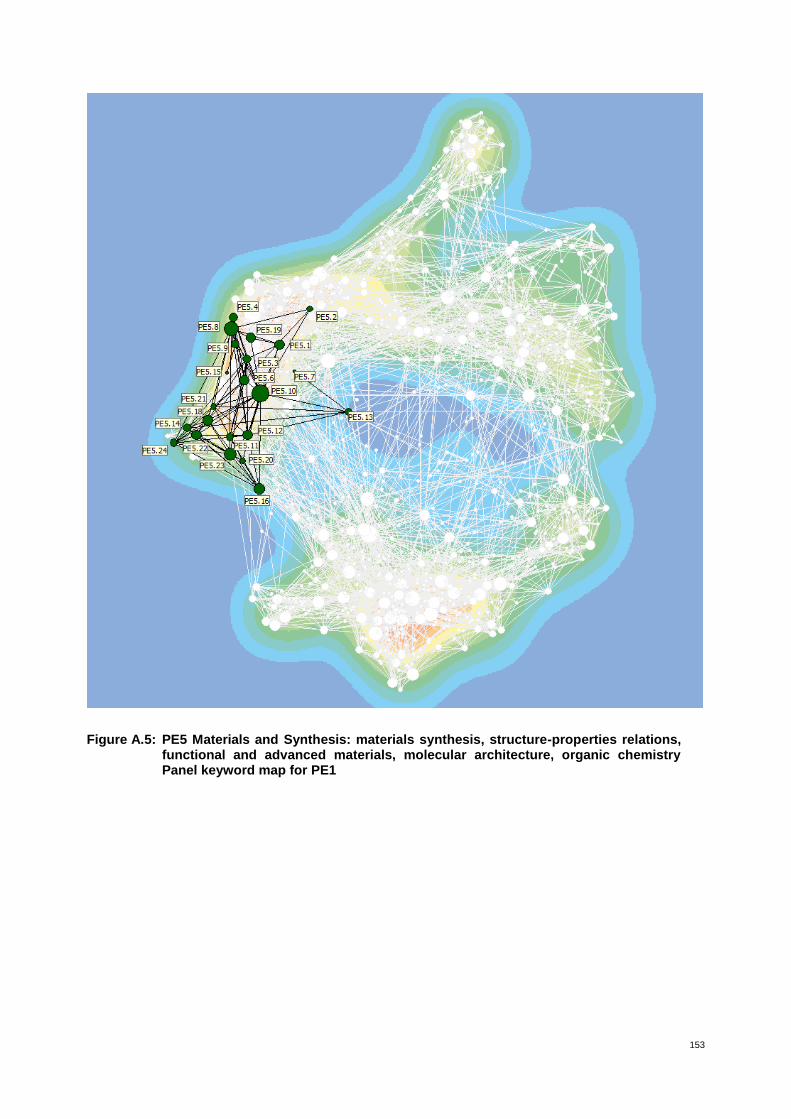
153
Figure A.5: PE5 Materials and Synthesis: materials synthesis, structure-properties relations, functional and advanced materials, molecular architecture, organic chemistry Panel keyword map for PE1
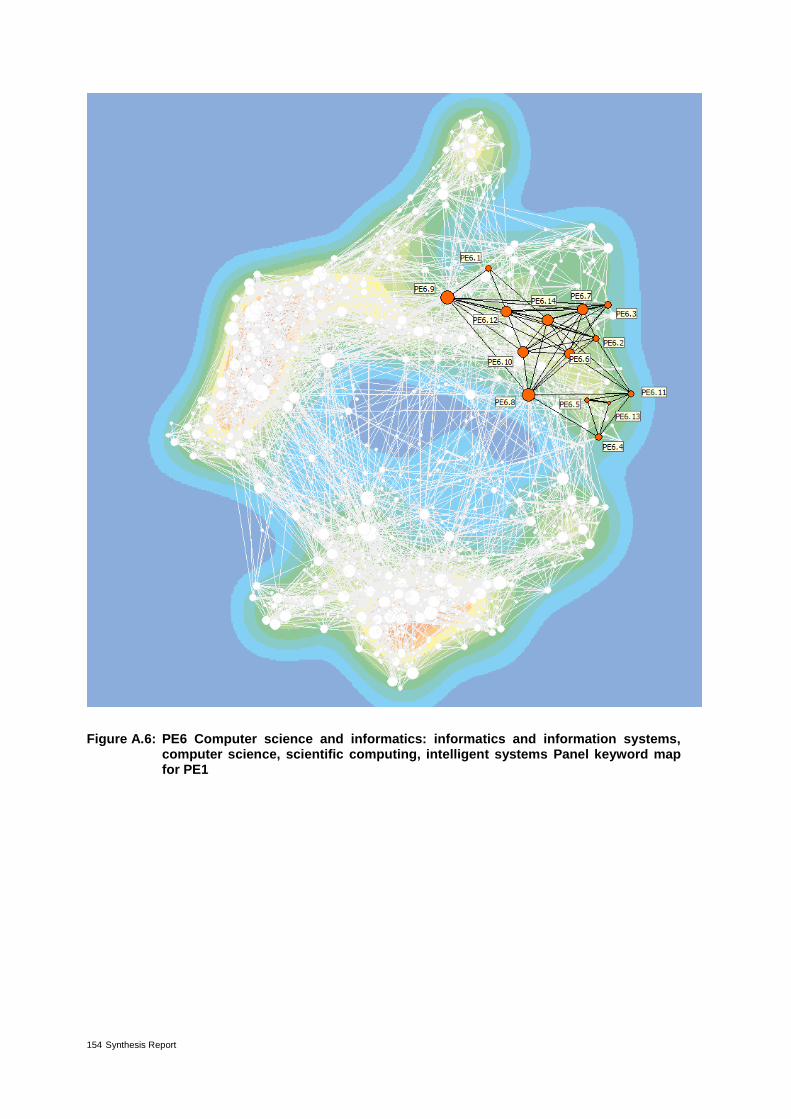
154 Synthesis Report
Figure A.6: PE6 Computer science and informatics: informatics and information systems, computer science, scientific computing, intelligent systems Panel keyword map for PE1

155
Figure A.7: PE7.7 Signal processing
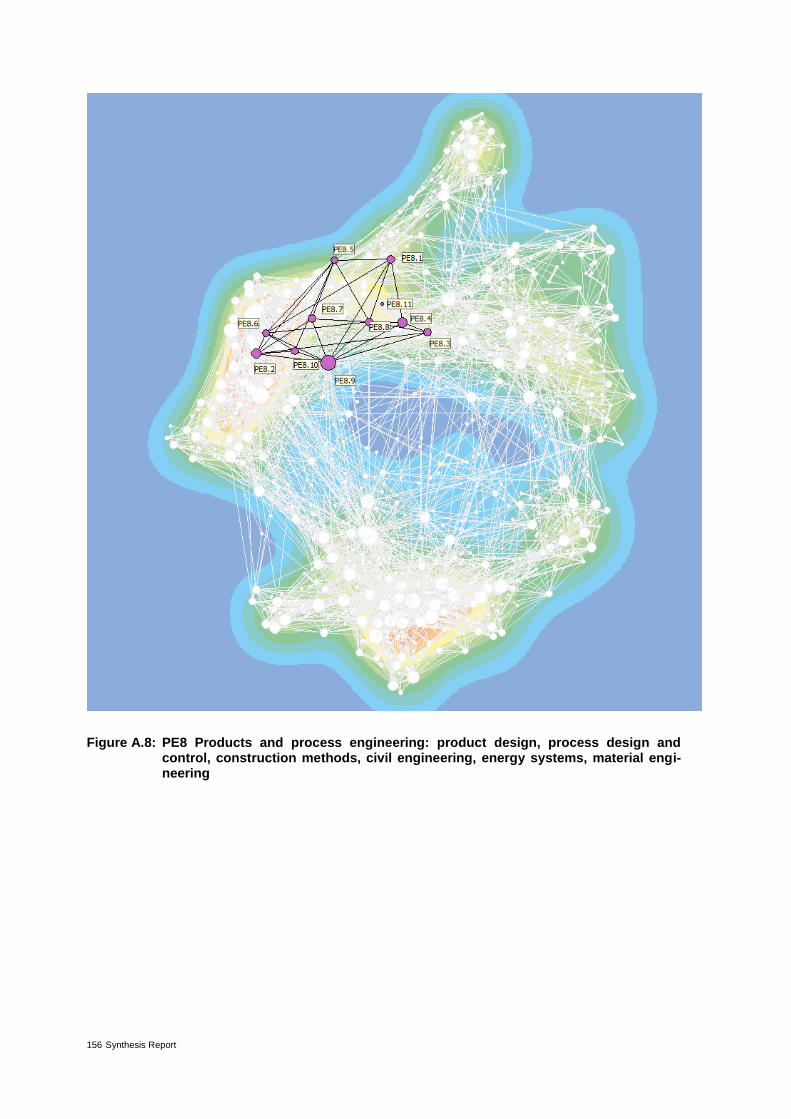
156 Synthesis Report
Figure A.8: PE8 Products and process engineering: product design, process design and control, construction methods, civil engineering, energy systems, material engi-neering

157
Figure A.9: PE9 Universe sciences: astro-physics/chemistry/biology; solar system; stellar, galactic and extragalactic astronomy, planetary systems, cosmology; space sci-ence, instrumentation
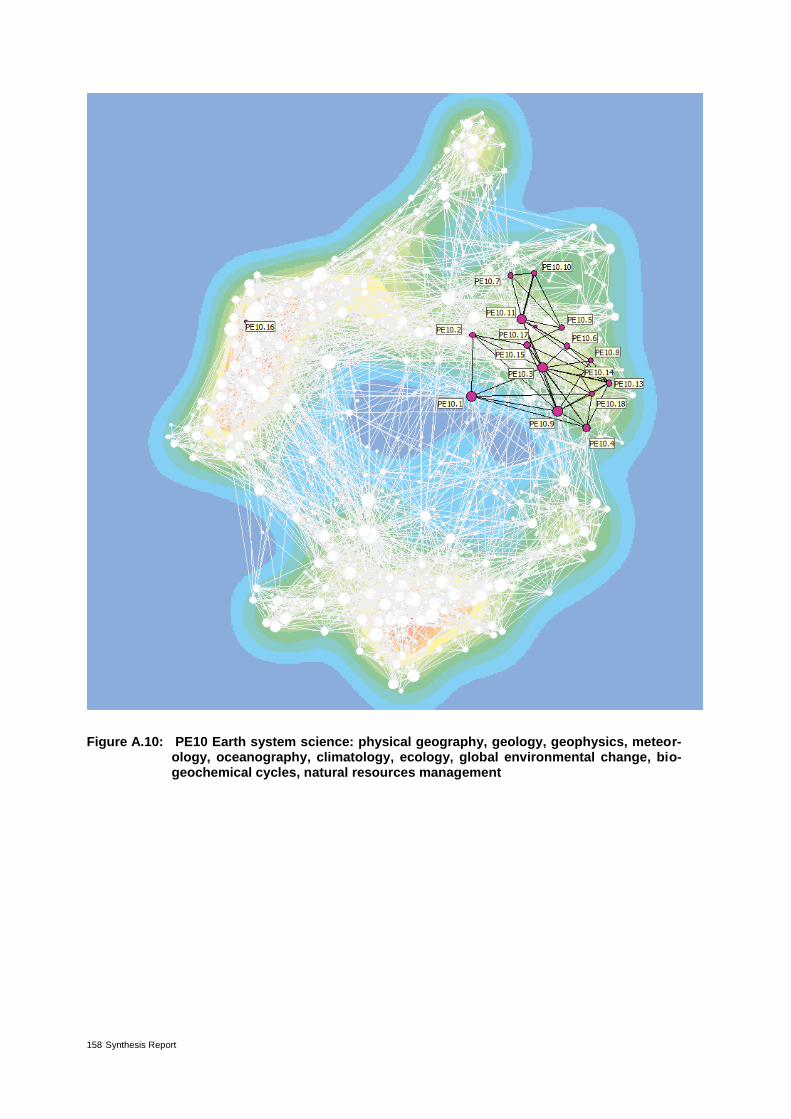
158 Synthesis Report
Figure A.10: PE10 Earth system science: physical geography, geology, geophysics, meteor-ology, oceanography, climatology, ecology, global environmental change, bio-geochemical cycles, natural resources management

159
Figure A.11: LS1 Molecular and Structural Biology and Biochemistry: molecular biology, bio-chemistry, biophysics, structural biology, biochemistry of signal transduction
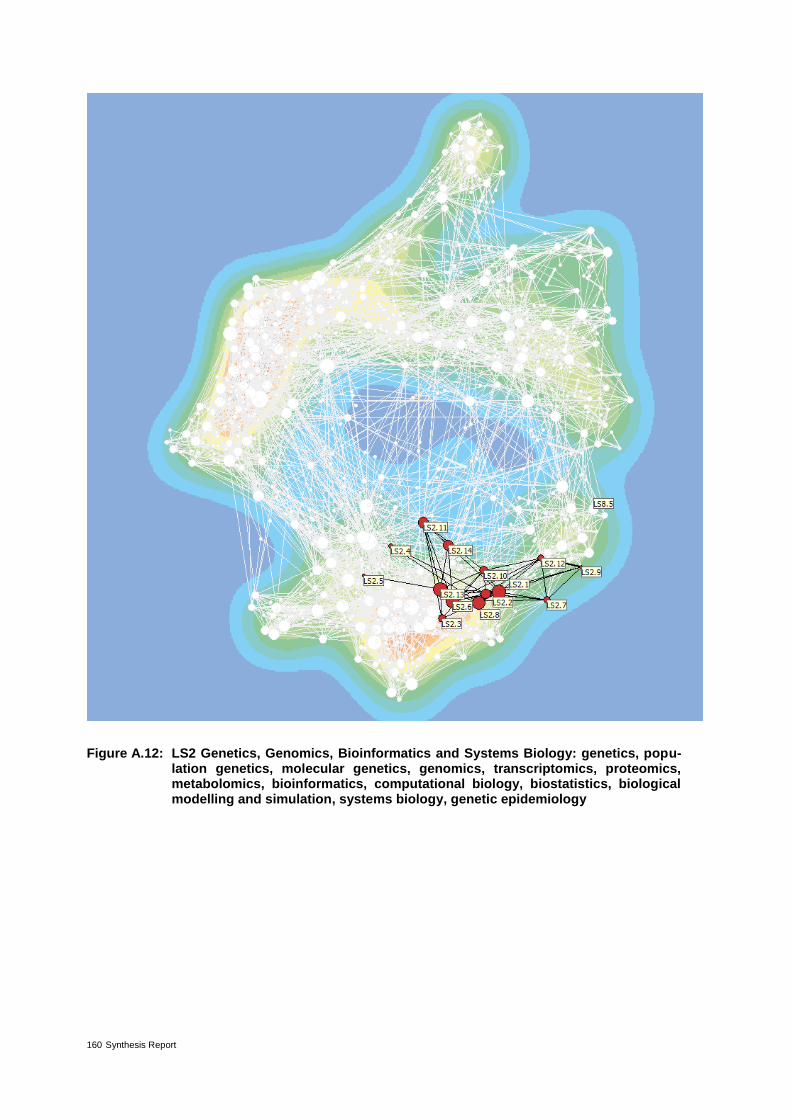
160 Synthesis Report
Figure A.12: LS2 Genetics, Genomics, Bioinformatics and Systems Biology: genetics, popu-lation genetics, molecular genetics, genomics, transcriptomics, proteomics, metabolomics, bioinformatics, computational biology, biostatistics, biological modelling and simulation, systems biology, genetic epidemiology
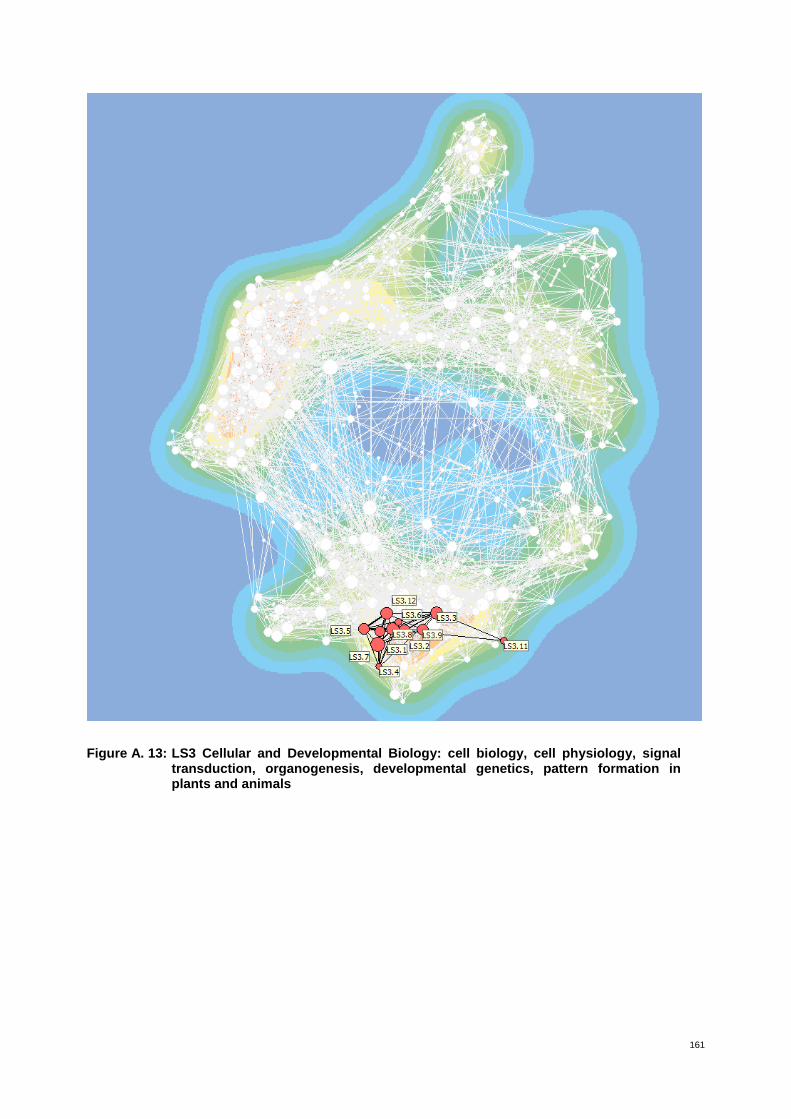
161
Figure A. 13: LS3 Cellular and Developmental Biology: cell biology, cell physiology, signal transduction, organogenesis, developmental genetics, pattern formation in plants and animals
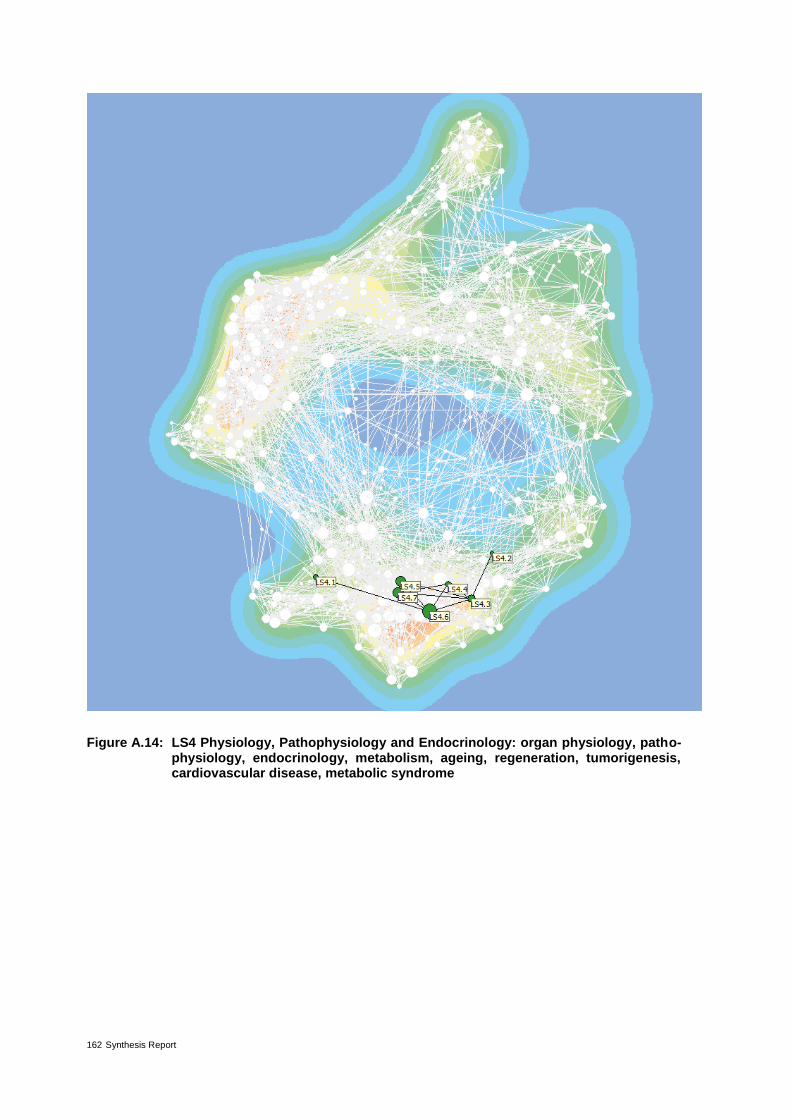
162 Synthesis Report
Figure A.14: LS4 Physiology, Pathophysiology and Endocrinology: organ physiology, patho-physiology, endocrinology, metabolism, ageing, regeneration, tumorigenesis, cardiovascular disease, metabolic syndrome
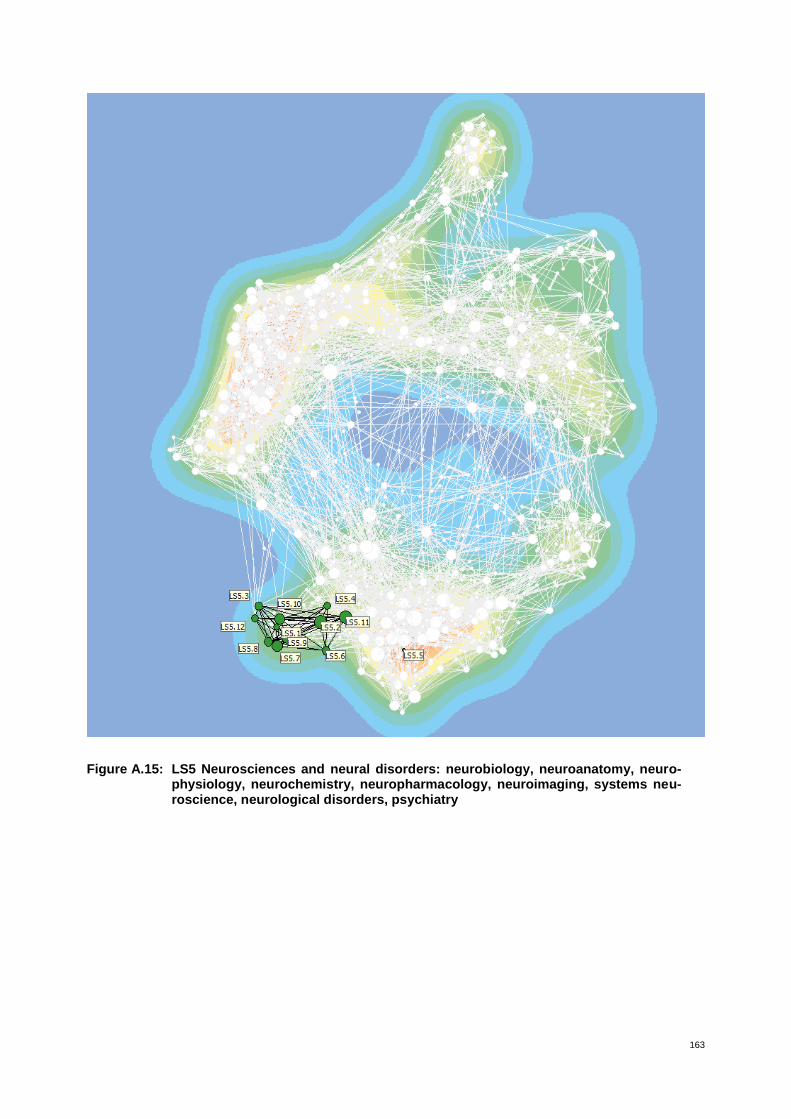
163
Figure A.15: LS5 Neurosciences and neural disorders: neurobiology, neuroanatomy, neuro-physiology, neurochemistry, neuropharmacology, neuroimaging, systems neu-roscience, neurological disorders, psychiatry

164 Synthesis Report
Figure A.16: LS6 Immunity and infection: immunobiology, aetiology of immune disorders, microbiology, virology, parasitology, global and other infectious diseases, pop-ulation dynamics of infectious diseases, veterinary medicine
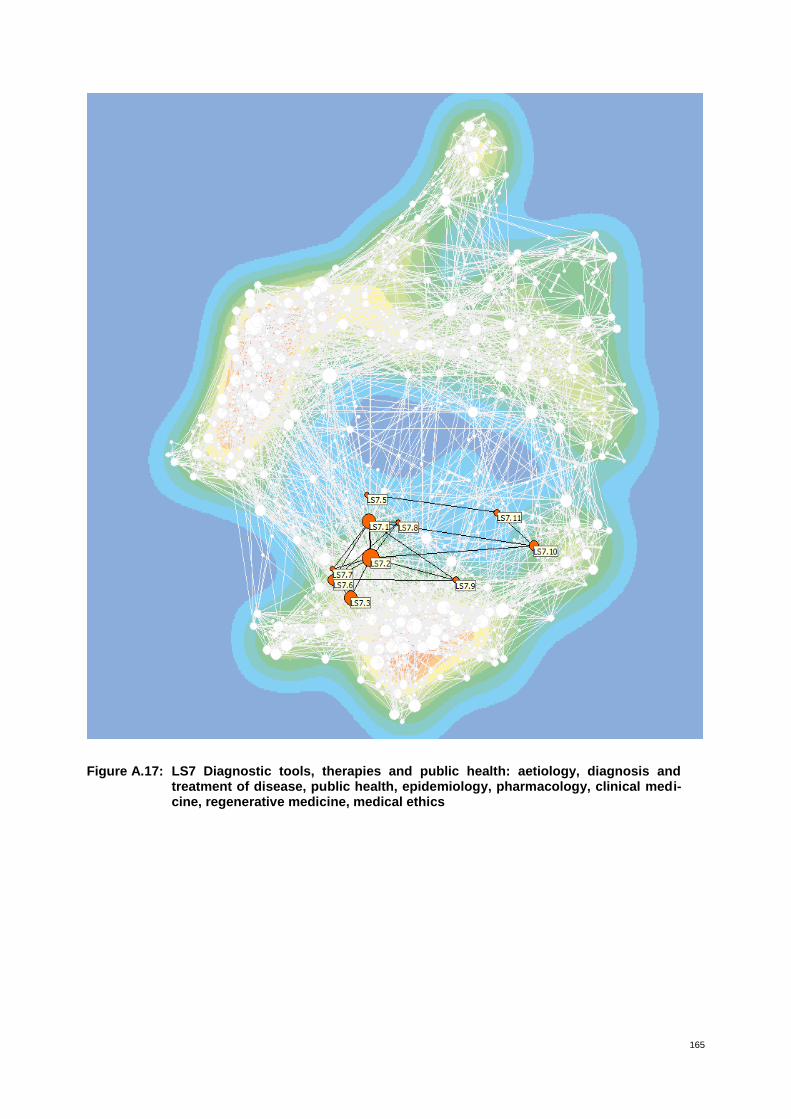
165
Figure A.17: LS7 Diagnostic tools, therapies and public health: aetiology, diagnosis and treatment of disease, public health, epidemiology, pharmacology, clinical medi-cine, regenerative medicine, medical ethics
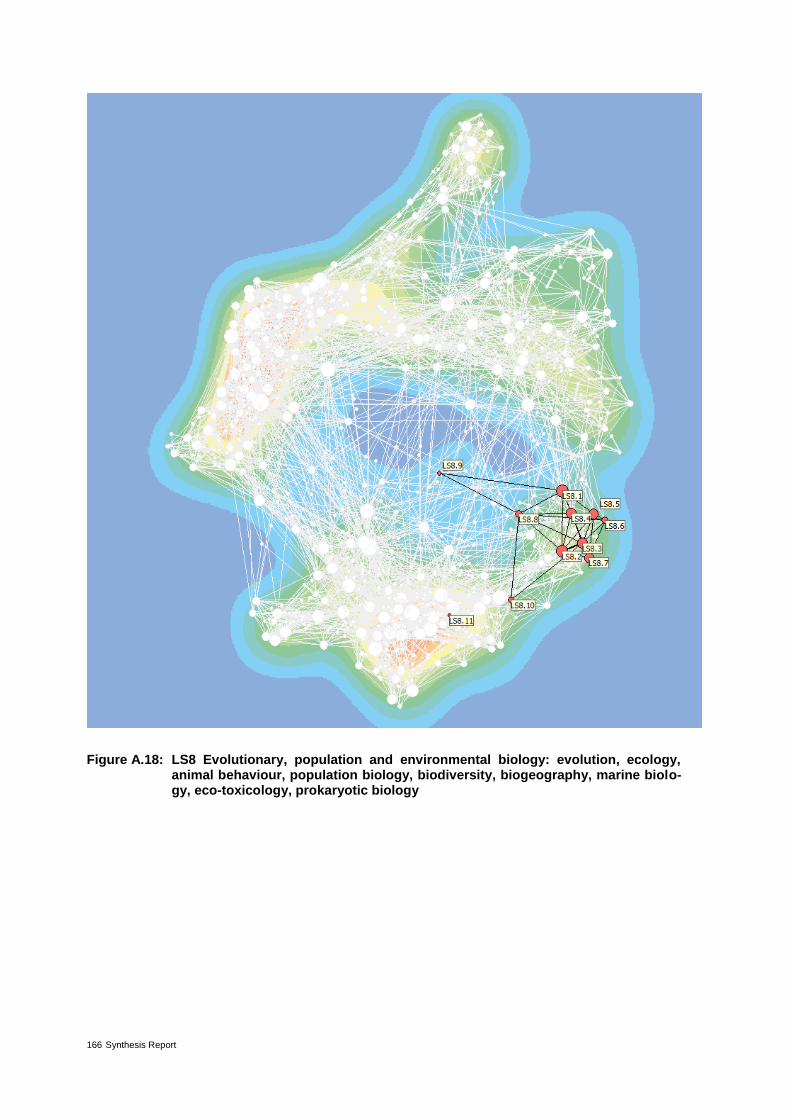
166 Synthesis Report
Figure A.18: LS8 Evolutionary, population and environmental biology: evolution, ecology, animal behaviour, population biology, biodiversity, biogeography, marine biolo-gy, eco-toxicology, prokaryotic biology

167
Figure A.19: LS9 Applied life sciences and biotechnology: agricultural, animal, fishery, for-estry and food sciences; biotechnology, chemical biology, genetic engineering, synthetic biology, industrial biosciences; environmental biotechnology and re-mediation
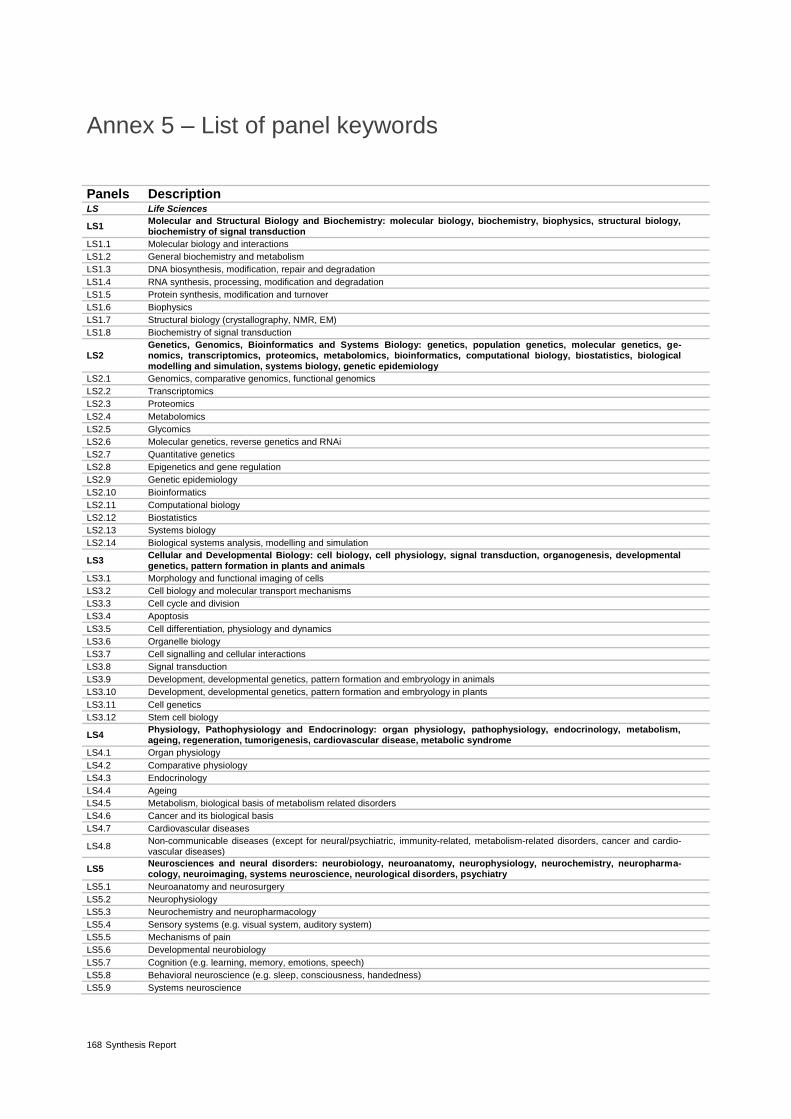
168 Synthesis Report
Annex 5 – List of panel keywords
Panels Description LS Life Sciences
LS1 Molecular and Structural Biology and Biochemistry: molecular biology, biochemistry, biophysics, structural biology, biochemistry of signal transduction
LS1.1 Molecular biology and interactions
LS1.2 General biochemistry and metabolism
LS1.3 DNA biosynthesis, modification, repair and degradation
LS1.4 RNA synthesis, processing, modification and degradation
LS1.5 Protein synthesis, modification and turnover
LS1.6 Biophysics
LS1.7 Structural biology (crystallography, NMR, EM)
LS1.8 Biochemistry of signal transduction
LS2 Genetics, Genomics, Bioinformatics and Systems Biology: genetics, population genetics, molecular genetics, ge-nomics, transcriptomics, proteomics, metabolomics, bioinformatics, computational biology, biostatistics, biological modelling and simulation, systems biology, genetic epidemiology
LS2.1 Genomics, comparative genomics, functional genomics
LS2.2 Transcriptomics
LS2.3 Proteomics
LS2.4 Metabolomics
LS2.5 Glycomics
LS2.6 Molecular genetics, reverse genetics and RNAi
LS2.7 Quantitative genetics
LS2.8 Epigenetics and gene regulation
LS2.9 Genetic epidemiology
LS2.10 Bioinformatics
LS2.11 Computational biology
LS2.12 Biostatistics
LS2.13 Systems biology
LS2.14 Biological systems analysis, modelling and simulation
LS3 Cellular and Developmental Biology: cell biology, cell physiology, signal transduction, organogenesis, developmental genetics, pattern formation in plants and animals
LS3.1 Morphology and functional imaging of cells
LS3.2 Cell biology and molecular transport mechanisms
LS3.3 Cell cycle and division
LS3.4 Apoptosis
LS3.5 Cell differentiation, physiology and dynamics
LS3.6 Organelle biology
LS3.7 Cell signalling and cellular interactions
LS3.8 Signal transduction
LS3.9 Development, developmental genetics, pattern formation and embryology in animals
LS3.10 Development, developmental genetics, pattern formation and embryology in plants
LS3.11 Cell genetics
LS3.12 Stem cell biology
LS4 Physiology, Pathophysiology and Endocrinology: organ physiology, pathophysiology, endocrinology, metabolism, ageing, regeneration, tumorigenesis, cardiovascular disease, metabolic syndrome
LS4.1 Organ physiology
LS4.2 Comparative physiology
LS4.3 Endocrinology
LS4.4 Ageing
LS4.5 Metabolism, biological basis of metabolism related disorders
LS4.6 Cancer and its biological basis
LS4.7 Cardiovascular diseases
LS4.8 Non-communicable diseases (except for neural/psychiatric, immunity-related, metabolism-related disorders, cancer and cardio-vascular diseases)
LS5 Neurosciences and neural disorders: neurobiology, neuroanatomy, neurophysiology, neurochemistry, neuropharma-cology, neuroimaging, systems neuroscience, neurological disorders, psychiatry
LS5.1 Neuroanatomy and neurosurgery
LS5.2 Neurophysiology
LS5.3 Neurochemistry and neuropharmacology
LS5.4 Sensory systems (e.g. visual system, auditory system)
LS5.5 Mechanisms of pain
LS5.6 Developmental neurobiology
LS5.7 Cognition (e.g. learning, memory, emotions, speech)
LS5.8 Behavioral neuroscience (e.g. sleep, consciousness, handedness)
LS5.9 Systems neuroscience
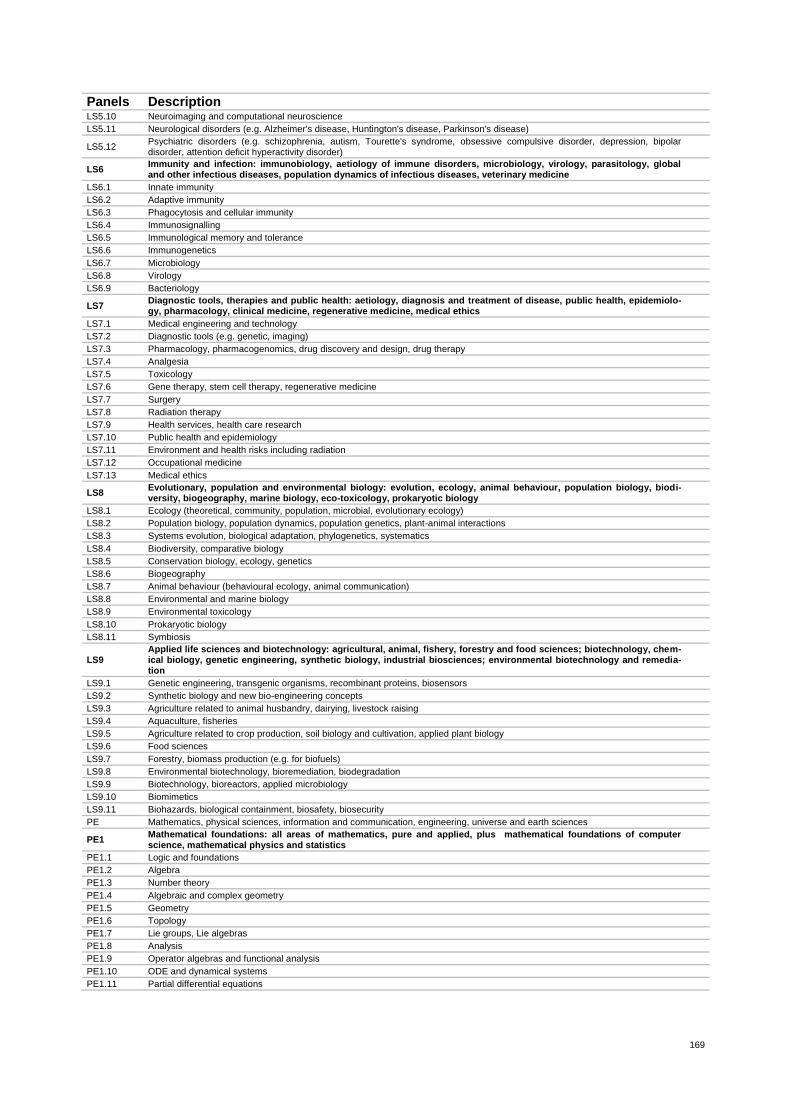
169
Panels Description LS5.10 Neuroimaging and computational neuroscience
LS5.11 Neurological disorders (e.g. Alzheimer's disease, Huntington's disease, Parkinson's disease)
LS5.12 Psychiatric disorders (e.g. schizophrenia, autism, Tourette's syndrome, obsessive compulsive disorder, depression, bipolar disorder, attention deficit hyperactivity disorder)
LS6 Immunity and infection: immunobiology, aetiology of immune disorders, microbiology, virology, parasitology, global and other infectious diseases, population dynamics of infectious diseases, veterinary medicine
LS6.1 Innate immunity
LS6.2 Adaptive immunity
LS6.3 Phagocytosis and cellular immunity
LS6.4 Immunosignalling
LS6.5 Immunological memory and tolerance
LS6.6 Immunogenetics
LS6.7 Microbiology
LS6.8 Virology
LS6.9 Bacteriology
LS7 Diagnostic tools, therapies and public health: aetiology, diagnosis and treatment of disease, public health, epidemiolo-gy, pharmacology, clinical medicine, regenerative medicine, medical ethics
LS7.1 Medical engineering and technology
LS7.2 Diagnostic tools (e.g. genetic, imaging)
LS7.3 Pharmacology, pharmacogenomics, drug discovery and design, drug therapy
LS7.4 Analgesia
LS7.5 Toxicology
LS7.6 Gene therapy, stem cell therapy, regenerative medicine
LS7.7 Surgery
LS7.8 Radiation therapy
LS7.9 Health services, health care research
LS7.10 Public health and epidemiology
LS7.11 Environment and health risks including radiation
LS7.12 Occupational medicine
LS7.13 Medical ethics
LS8 Evolutionary, population and environmental biology: evolution, ecology, animal behaviour, population biology, biodi-versity, biogeography, marine biology, eco-toxicology, prokaryotic biology
LS8.1 Ecology (theoretical, community, population, microbial, evolutionary ecology)
LS8.2 Population biology, population dynamics, population genetics, plant-animal interactions
LS8.3 Systems evolution, biological adaptation, phylogenetics, systematics
LS8.4 Biodiversity, comparative biology
LS8.5 Conservation biology, ecology, genetics
LS8.6 Biogeography
LS8.7 Animal behaviour (behavioural ecology, animal communication)
LS8.8 Environmental and marine biology
LS8.9 Environmental toxicology
LS8.10 Prokaryotic biology
LS8.11 Symbiosis
LS9 Applied life sciences and biotechnology: agricultural, animal, fishery, forestry and food sciences; biotechnology, chem-ical biology, genetic engineering, synthetic biology, industrial biosciences; environmental biotechnology and remedia-tion
LS9.1 Genetic engineering, transgenic organisms, recombinant proteins, biosensors
LS9.2 Synthetic biology and new bio-engineering concepts
LS9.3 Agriculture related to animal husbandry, dairying, livestock raising
LS9.4 Aquaculture, fisheries
LS9.5 Agriculture related to crop production, soil biology and cultivation, applied plant biology
LS9.6 Food sciences
LS9.7 Forestry, biomass production (e.g. for biofuels)
LS9.8 Environmental biotechnology, bioremediation, biodegradation
LS9.9 Biotechnology, bioreactors, applied microbiology
LS9.10 Biomimetics
LS9.11 Biohazards, biological containment, biosafety, biosecurity
PE Mathematics, physical sciences, information and communication, engineering, universe and earth sciences
PE1 Mathematical foundations: all areas of mathematics, pure and applied, plus mathematical foundations of computer science, mathematical physics and statistics
PE1.1 Logic and foundations
PE1.2 Algebra
PE1.3 Number theory
PE1.4 Algebraic and complex geometry
PE1.5 Geometry
PE1.6 Topology
PE1.7 Lie groups, Lie algebras
PE1.8 Analysis
PE1.9 Operator algebras and functional analysis
PE1.10 ODE and dynamical systems
PE1.11 Partial differential equations
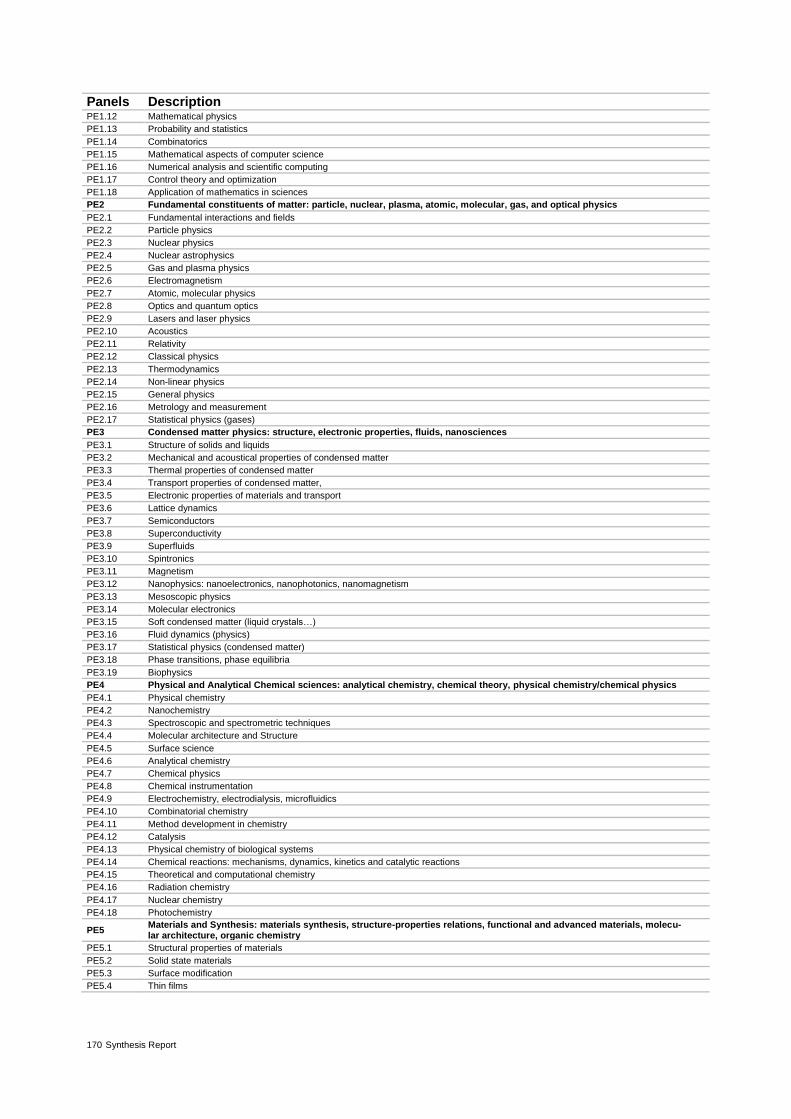
170 Synthesis Report
Panels Description PE1.12 Mathematical physics
PE1.13 Probability and statistics
PE1.14 Combinatorics
PE1.15 Mathematical aspects of computer science
PE1.16 Numerical analysis and scientific computing
PE1.17 Control theory and optimization
PE1.18 Application of mathematics in sciences
PE2 Fundamental constituents of matter: particle, nuclear, plasma, atomic, molecular, gas, and optical physics
PE2.1 Fundamental interactions and fields
PE2.2 Particle physics
PE2.3 Nuclear physics
PE2.4 Nuclear astrophysics
PE2.5 Gas and plasma physics
PE2.6 Electromagnetism
PE2.7 Atomic, molecular physics
PE2.8 Optics and quantum optics
PE2.9 Lasers and laser physics
PE2.10 Acoustics
PE2.11 Relativity
PE2.12 Classical physics
PE2.13 Thermodynamics
PE2.14 Non-linear physics
PE2.15 General physics
PE2.16 Metrology and measurement
PE2.17 Statistical physics (gases)
PE3 Condensed matter physics: structure, electronic properties, fluids, nanosciences
PE3.1 Structure of solids and liquids
PE3.2 Mechanical and acoustical properties of condensed matter
PE3.3 Thermal properties of condensed matter
PE3.4 Transport properties of condensed matter,
PE3.5 Electronic properties of materials and transport
PE3.6 Lattice dynamics
PE3.7 Semiconductors
PE3.8 Superconductivity
PE3.9 Superfluids
PE3.10 Spintronics
PE3.11 Magnetism
PE3.12 Nanophysics: nanoelectronics, nanophotonics, nanomagnetism
PE3.13 Mesoscopic physics
PE3.14 Molecular electronics
PE3.15 Soft condensed matter (liquid crystals…)
PE3.16 Fluid dynamics (physics)
PE3.17 Statistical physics (condensed matter)
PE3.18 Phase transitions, phase equilibria
PE3.19 Biophysics
PE4 Physical and Analytical Chemical sciences: analytical chemistry, chemical theory, physical chemistry/chemical physics
PE4.1 Physical chemistry
PE4.2 Nanochemistry
PE4.3 Spectroscopic and spectrometric techniques
PE4.4 Molecular architecture and Structure
PE4.5 Surface science
PE4.6 Analytical chemistry
PE4.7 Chemical physics
PE4.8 Chemical instrumentation
PE4.9 Electrochemistry, electrodialysis, microfluidics
PE4.10 Combinatorial chemistry
PE4.11 Method development in chemistry
PE4.12 Catalysis
PE4.13 Physical chemistry of biological systems
PE4.14 Chemical reactions: mechanisms, dynamics, kinetics and catalytic reactions
PE4.15 Theoretical and computational chemistry
PE4.16 Radiation chemistry
PE4.17 Nuclear chemistry
PE4.18 Photochemistry
PE5 Materials and Synthesis: materials synthesis, structure-properties relations, functional and advanced materials, molecu-lar architecture, organic chemistry
PE5.1 Structural properties of materials
PE5.2 Solid state materials
PE5.3 Surface modification
PE5.4 Thin films
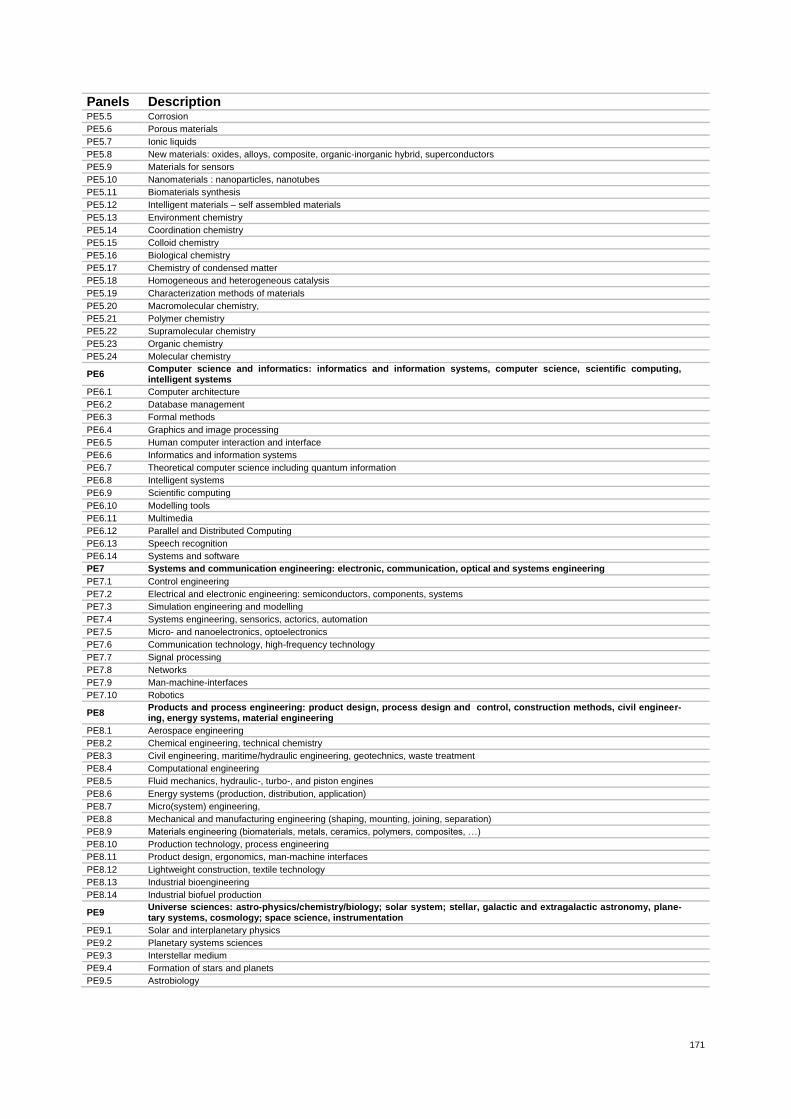
171
Panels Description PE5.5 Corrosion
PE5.6 Porous materials
PE5.7 Ionic liquids
PE5.8 New materials: oxides, alloys, composite, organic-inorganic hybrid, superconductors
PE5.9 Materials for sensors
PE5.10 Nanomaterials : nanoparticles, nanotubes
PE5.11 Biomaterials synthesis
PE5.12 Intelligent materials – self assembled materials
PE5.13 Environment chemistry
PE5.14 Coordination chemistry
PE5.15 Colloid chemistry
PE5.16 Biological chemistry
PE5.17 Chemistry of condensed matter
PE5.18 Homogeneous and heterogeneous catalysis
PE5.19 Characterization methods of materials
PE5.20 Macromolecular chemistry,
PE5.21 Polymer chemistry
PE5.22 Supramolecular chemistry
PE5.23 Organic chemistry
PE5.24 Molecular chemistry
PE6 Computer science and informatics: informatics and information systems, computer science, scientific computing, intelligent systems
PE6.1 Computer architecture
PE6.2 Database management
PE6.3 Formal methods
PE6.4 Graphics and image processing
PE6.5 Human computer interaction and interface
PE6.6 Informatics and information systems
PE6.7 Theoretical computer science including quantum information
PE6.8 Intelligent systems
PE6.9 Scientific computing
PE6.10 Modelling tools
PE6.11 Multimedia
PE6.12 Parallel and Distributed Computing
PE6.13 Speech recognition
PE6.14 Systems and software
PE7 Systems and communication engineering: electronic, communication, optical and systems engineering
PE7.1 Control engineering
PE7.2 Electrical and electronic engineering: semiconductors, components, systems
PE7.3 Simulation engineering and modelling
PE7.4 Systems engineering, sensorics, actorics, automation
PE7.5 Micro- and nanoelectronics, optoelectronics
PE7.6 Communication technology, high-frequency technology
PE7.7 Signal processing
PE7.8 Networks
PE7.9 Man-machine-interfaces
PE7.10 Robotics
PE8 Products and process engineering: product design, process design and control, construction methods, civil engineer-ing, energy systems, material engineering
PE8.1 Aerospace engineering
PE8.2 Chemical engineering, technical chemistry
PE8.3 Civil engineering, maritime/hydraulic engineering, geotechnics, waste treatment
PE8.4 Computational engineering
PE8.5 Fluid mechanics, hydraulic-, turbo-, and piston engines
PE8.6 Energy systems (production, distribution, application)
PE8.7 Micro(system) engineering,
PE8.8 Mechanical and manufacturing engineering (shaping, mounting, joining, separation)
PE8.9 Materials engineering (biomaterials, metals, ceramics, polymers, composites, …)
PE8.10 Production technology, process engineering
PE8.11 Product design, ergonomics, man-machine interfaces
PE8.12 Lightweight construction, textile technology
PE8.13 Industrial bioengineering
PE8.14 Industrial biofuel production
PE9 Universe sciences: astro-physics/chemistry/biology; solar system; stellar, galactic and extragalactic astronomy, plane-tary systems, cosmology; space science, instrumentation
PE9.1 Solar and interplanetary physics
PE9.2 Planetary systems sciences
PE9.3 Interstellar medium
PE9.4 Formation of stars and planets
PE9.5 Astrobiology
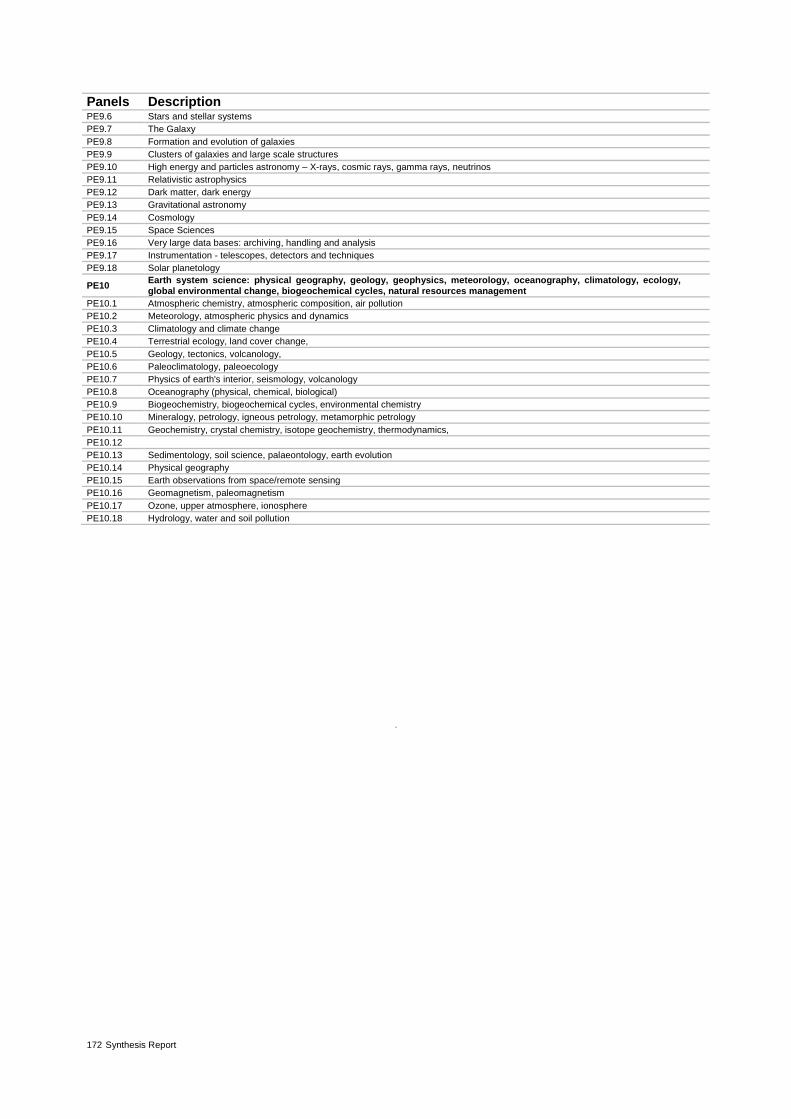
172 Synthesis Report
Panels Description PE9.6 Stars and stellar systems
PE9.7 The Galaxy
PE9.8 Formation and evolution of galaxies
PE9.9 Clusters of galaxies and large scale structures
PE9.10 High energy and particles astronomy – X-rays, cosmic rays, gamma rays, neutrinos
PE9.11 Relativistic astrophysics
PE9.12 Dark matter, dark energy
PE9.13 Gravitational astronomy
PE9.14 Cosmology
PE9.15 Space Sciences
PE9.16 Very large data bases: archiving, handling and analysis
PE9.17 Instrumentation - telescopes, detectors and techniques
PE9.18 Solar planetology
PE10 Earth system science: physical geography, geology, geophysics, meteorology, oceanography, climatology, ecology, global environmental change, biogeochemical cycles, natural resources management
PE10.1 Atmospheric chemistry, atmospheric composition, air pollution
PE10.2 Meteorology, atmospheric physics and dynamics
PE10.3 Climatology and climate change
PE10.4 Terrestrial ecology, land cover change,
PE10.5 Geology, tectonics, volcanology,
PE10.6 Paleoclimatology, paleoecology
PE10.7 Physics of earth's interior, seismology, volcanology
PE10.8 Oceanography (physical, chemical, biological)
PE10.9 Biogeochemistry, biogeochemical cycles, environmental chemistry
PE10.10 Mineralogy, petrology, igneous petrology, metamorphic petrology
PE10.11 Geochemistry, crystal chemistry, isotope geochemistry, thermodynamics,
PE10.12
PE10.13 Sedimentology, soil science, palaeontology, earth evolution
PE10.14 Physical geography
PE10.15 Earth observations from space/remote sensing
PE10.16 Geomagnetism, paleomagnetism
PE10.17 Ozone, upper atmosphere, ionosphere
PE10.18 Hydrology, water and soil pollution
.