Embed Size (px)
Citation preview
®
IBM Software Group
© 2014 IBM Corporation
DB2 Systems Management: It's WhatYou Don't Know That Can Hurt You
Ed Woods - IBM Corporation
IBM Software Group | Tivoli software
2© 2014 IBM Corporation
It’s What You Don’t Know That Can Hurt You
� There are known knowns. These are things
we know that we know. There are known
unknowns. That is to say, there are things
that we know we don't know. But there are
also unknown unknowns. There are things
we don't know we don't know.
�Donald Rumsfeld – former US Secretary of Defense
IBM Software Group | Tivoli software
3© 2014 IBM Corporation
Agenda
� Introduction
� Industry ‘Best Practices’ – What You Know
�Examples of What You May Not Know
�z/OS Workload Manager, Critical DB2 messages
�A look at the Unknown Unknowns
�A strategy to address the unknown unknowns
�zAware, Predictive Analytics
IBM Software Group | Tivoli software
4© 2014 IBM Corporation
What You Know You KnowMany Industry Standard ‘Best Practices’
� Performance analysis best practices are well established for z/OS systems and its various subsystems
�Many sources of well documented management and tuning best practices for DB2, z/OS, CICS, IMS
�DB2 on z/OS now has over 30 years of established best practices
� Sources include
�IBM Red Books - http://www.redbooks.ibm.com/
�IDUG presentations - www.idug.org
�Share conference - www.share.org
�Computer Measurement Group - CMG – www.cmg.org
IBM Software Group | Tivoli software
5© 2014 IBM Corporation
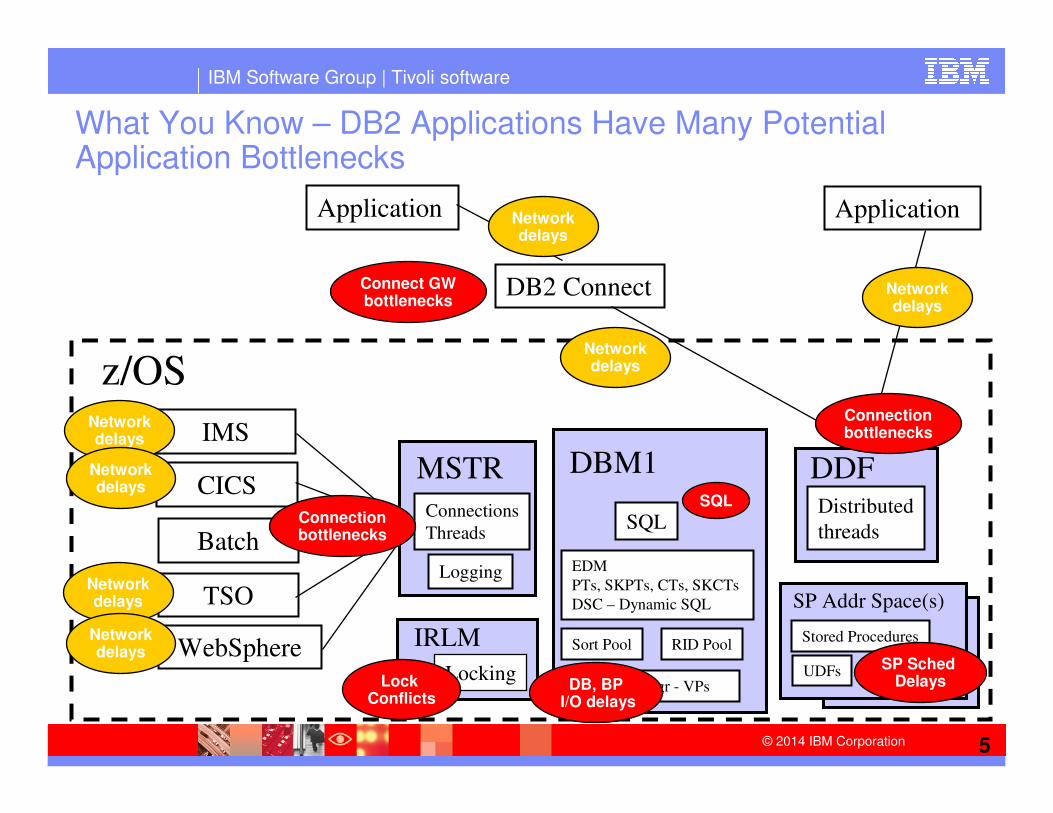
What You Know – DB2 Applications Have Many Potential Application Bottlenecks
DBM1MSTR
EDM
PTs, SKPTs, CTs, SKCTs
DSC – Dynamic SQL
Buffer Mgr - VPs
Sort Pool RID Pool
SQL
DDFDistributed
threads
Locking
IRLM
Connections
Threads
Logging
z/OS
IMS
Stored Procedures
SP Addr Space(s)
UDFs
CICS
Batch
TSO
WebSphere
DB2 Connect
Application Application
Networkdelays
Lock Conflicts
DB, BPI/O delays
Connectionbottlenecks
Connectionbottlenecks
SQL
SP SchedDelays
Networkdelays
Connect GWbottlenecks
Networkdelays
Networkdelays
Networkdelays
Networkdelays
Networkdelays
IBM Software Group | Tivoli software
6© 2014 IBM Corporation
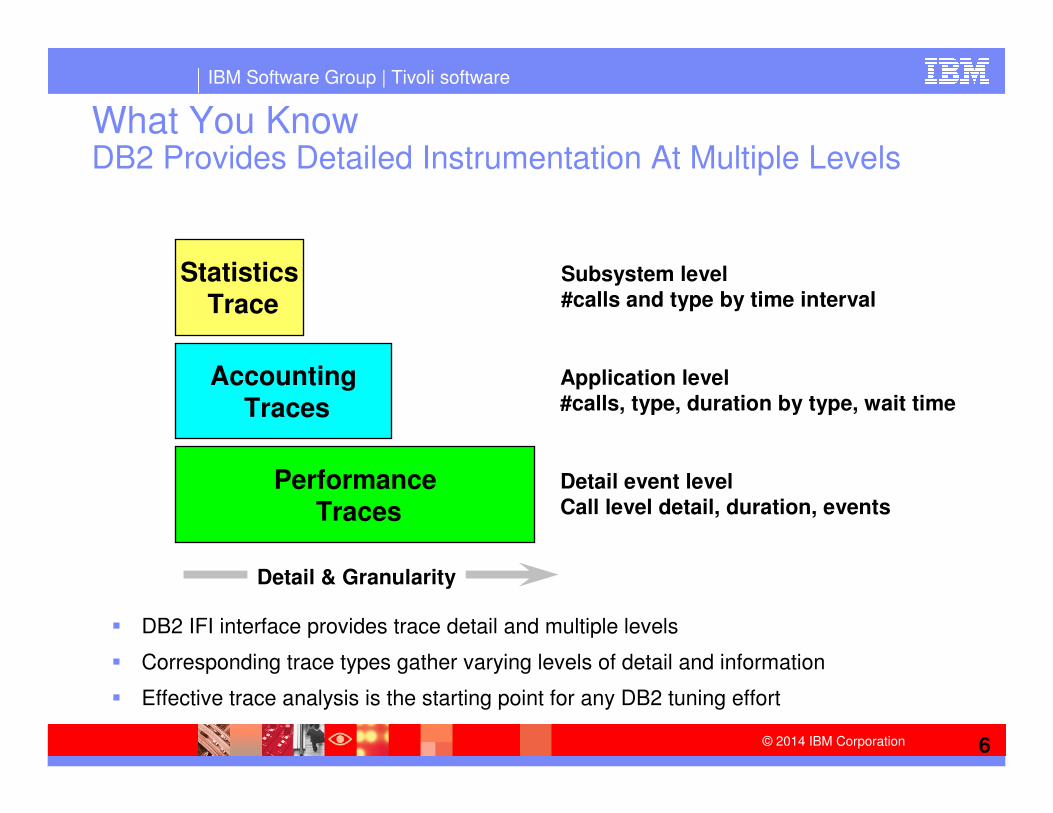
What You KnowDB2 Provides Detailed Instrumentation At Multiple Levels
� DB2 IFI interface provides trace detail and multiple levels
� Corresponding trace types gather varying levels of detail and information
� Effective trace analysis is the starting point for any DB2 tuning effort
StatisticsTrace
AccountingTraces
PerformanceTraces
Subsystem level#calls and type by time interval
Application level#calls, type, duration by type, wait time
Detail event levelCall level detail, duration, events
Detail & Granularity
IBM Software Group | Tivoli software
7© 2014 IBM Corporation
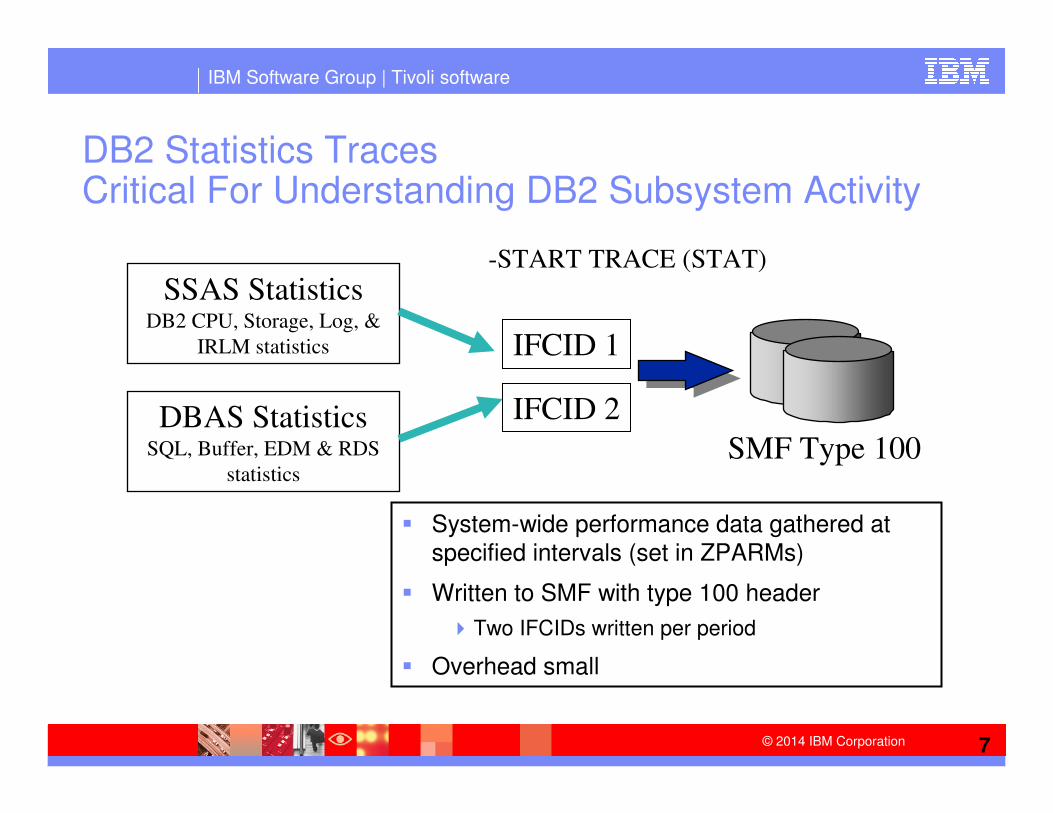
DB2 Statistics TracesCritical For Understanding DB2 Subsystem Activity
� System-wide performance data gathered at specified intervals (set in ZPARMs)
� Written to SMF with type 100 header
�Two IFCIDs written per period
� Overhead small
SSAS StatisticsDB2 CPU, Storage, Log, &
IRLM statistics
DBAS StatisticsSQL, Buffer, EDM & RDS
statistics
IFCID 1
SMF Type 100
IFCID 2
-START TRACE (STAT)
IBM Software Group | Tivoli software
8© 2014 IBM Corporation
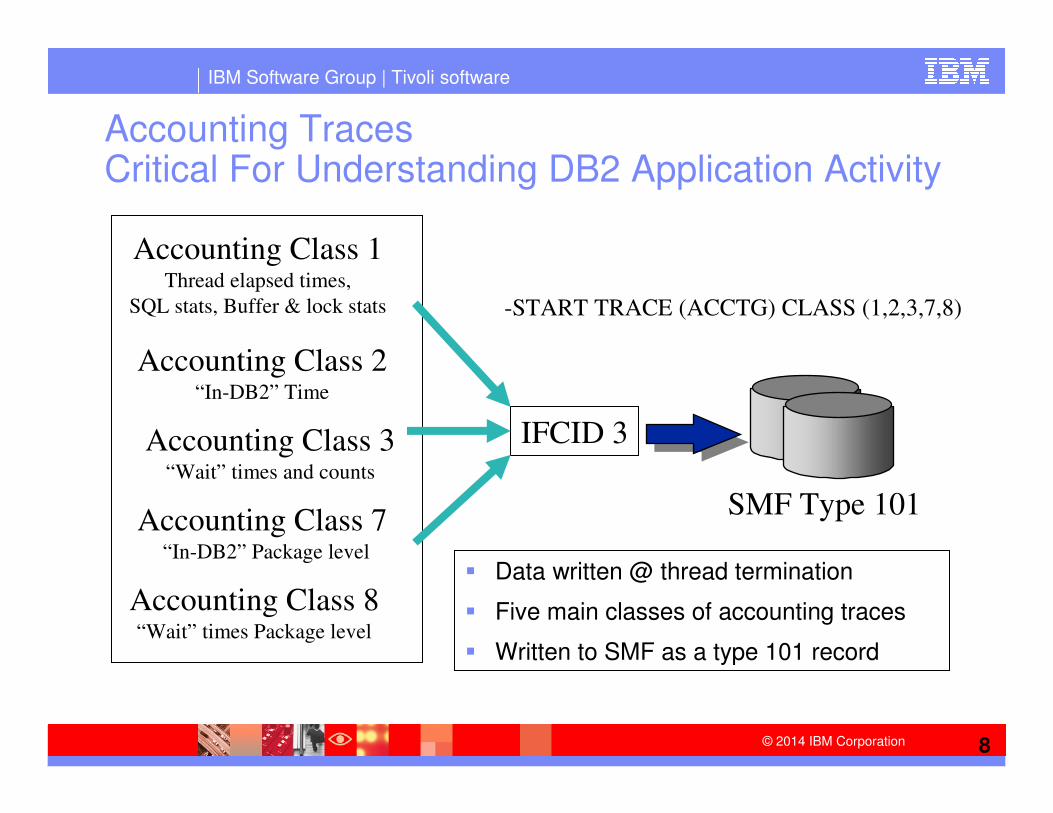
Accounting TracesCritical For Understanding DB2 Application Activity
� Data written @ thread termination
� Five main classes of accounting traces
� Written to SMF as a type 101 record
Accounting Class 1Thread elapsed times,
SQL stats, Buffer & lock stats
Accounting Class 2“In-DB2” Time
Accounting Class 3“Wait” times and counts
IFCID 3
SMF Type 101
-START TRACE (ACCTG) CLASS (1,2,3,7,8)
Accounting Class 7 “In-DB2” Package level
Accounting Class 8“Wait” times Package level
IBM Software Group | Tivoli software
9© 2014 IBM Corporation
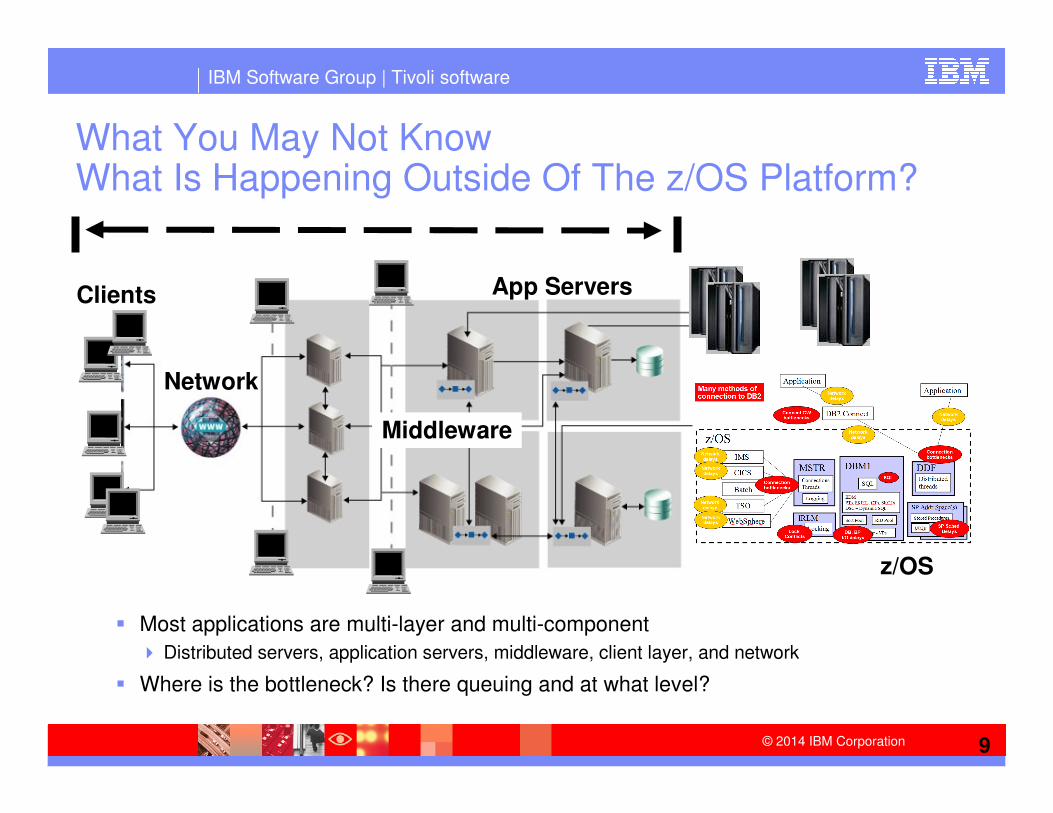
What You May Not KnowWhat Is Happening Outside Of The z/OS Platform?
� Most applications are multi-layer and multi-component
� Distributed servers, application servers, middleware, client layer, and network
� Where is the bottleneck? Is there queuing and at what level?
z/OS
Network
Clients
Middleware
App Servers
IBM Software Group | Tivoli software
10© 2014 IBM Corporation
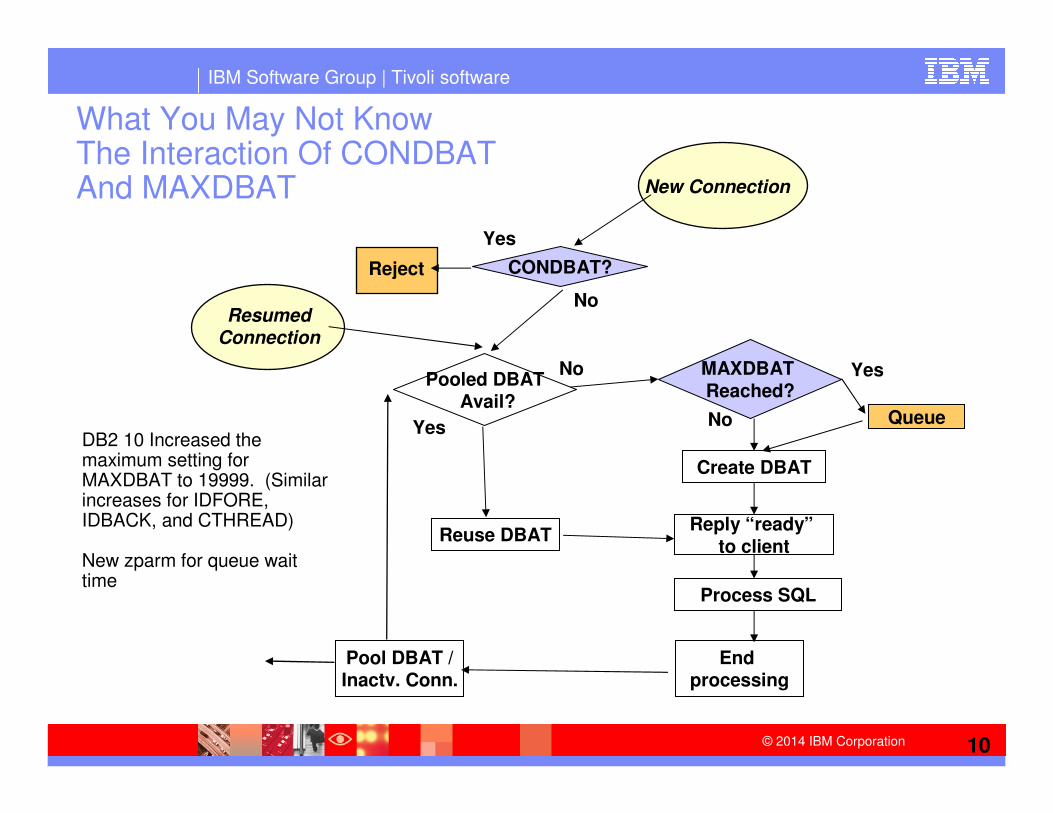
What You May Not KnowThe Interaction Of CONDBAT And MAXDBAT New Connection
CONDBAT?Reject
Yes
Pooled DBATAvail?
Yes
MAXDBAT Reached?
No
Queue
Yes
Create DBAT
No
Reply “ready”to client
Process SQL
Reuse DBAT
End processing
Pool DBAT /Inactv. Conn.
ResumedConnection
No
DB2 10 Increased the maximum setting for MAXDBAT to 19999. (Similar increases for IDFORE, IDBACK, and CTHREAD)
New zparm for queue wait time
IBM Software Group | Tivoli software
11© 2014 IBM Corporation
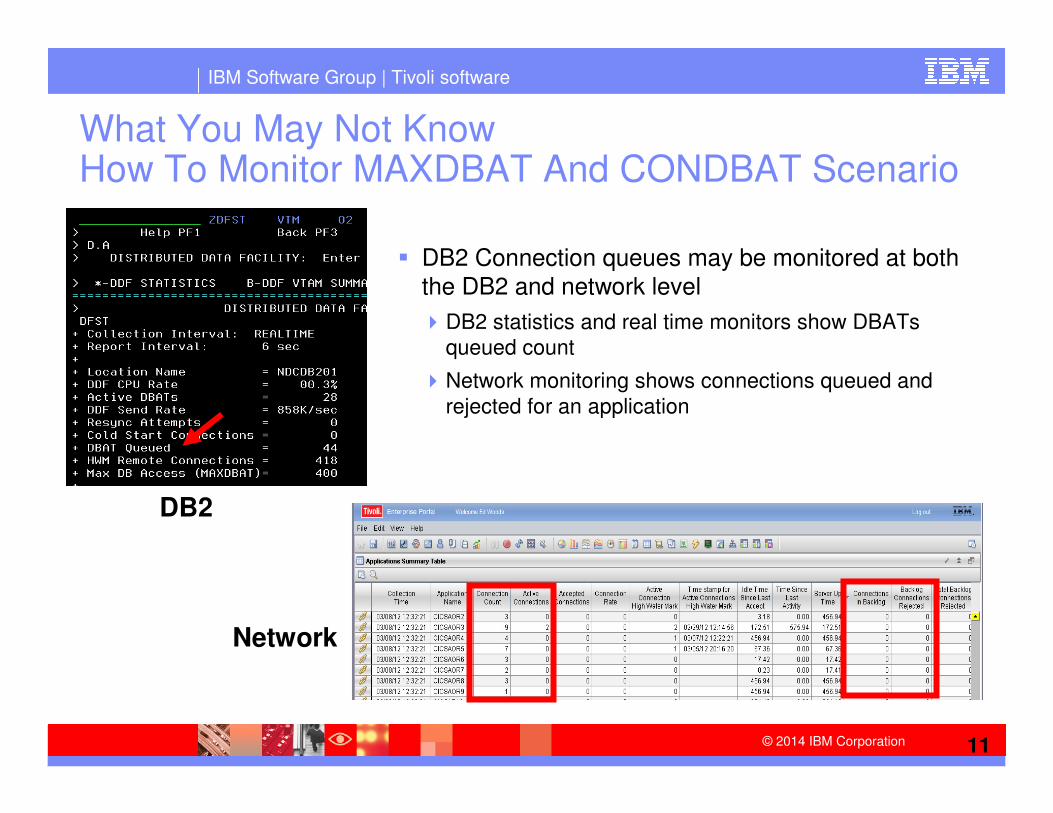
What You May Not KnowHow To Monitor MAXDBAT And CONDBAT Scenario
� DB2 Connection queues may be monitored at both the DB2 and network level
�DB2 statistics and real time monitors show DBATs
queued count
�Network monitoring shows connections queued and
rejected for an application
DB2
Network
IBM Software Group | Tivoli software
12© 2014 IBM Corporation
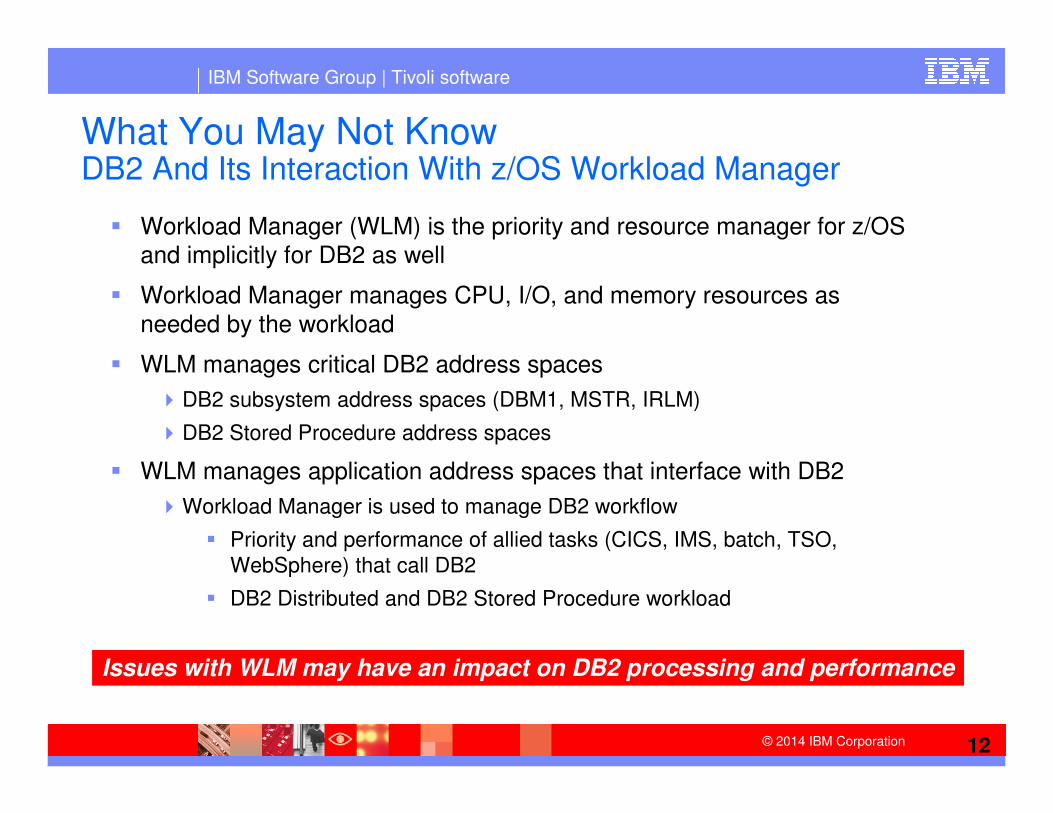
What You May Not KnowDB2 And Its Interaction With z/OS Workload Manager
� Workload Manager (WLM) is the priority and resource manager for z/OS
and implicitly for DB2 as well
� Workload Manager manages CPU, I/O, and memory resources as
needed by the workload
� WLM manages critical DB2 address spaces
�DB2 subsystem address spaces (DBM1, MSTR, IRLM)
�DB2 Stored Procedure address spaces
� WLM manages application address spaces that interface with DB2
�Workload Manager is used to manage DB2 workflow
� Priority and performance of allied tasks (CICS, IMS, batch, TSO,
WebSphere) that call DB2
� DB2 Distributed and DB2 Stored Procedure workload
Issues with WLM may have an impact on DB2 processing and performance
IBM Software Group | Tivoli software
13© 2014 IBM Corporation
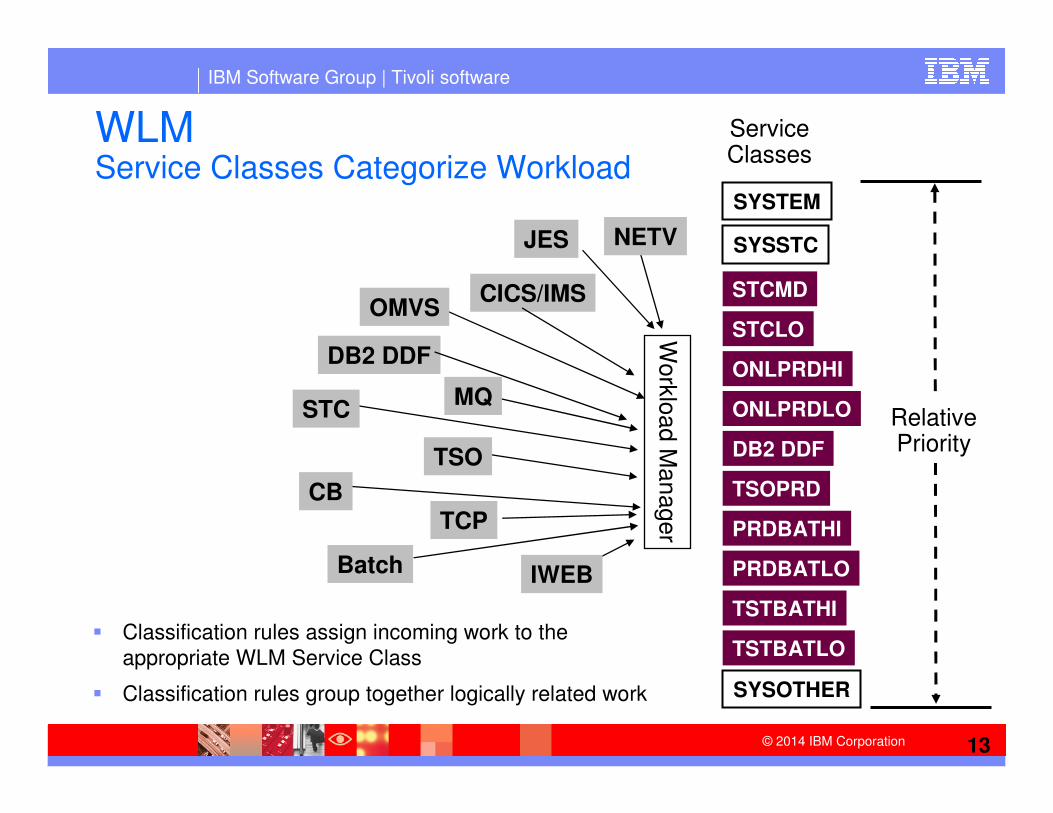
WLMService Classes Categorize Workload
� Classification rules assign incoming work to the
appropriate WLM Service Class
� Classification rules group together logically related work
ONLPRDHI
ONLPRDLO
DB2 DDF
PRDBATHI
PRDBATLO
STCLO
STCMD
TSOPRD
TSTBATHI
TSTBATLO
SYSTEM
SYSSTC
SYSOTHER
CICS/IMS
DB2 DDF
TSO
Batch
Work
load M
an
ager
RelativePriority
ServiceClasses
CB
STCMQ
OMVS
NETV
IWEB
JES
TCP
IBM Software Group | Tivoli software
14© 2014 IBM Corporation
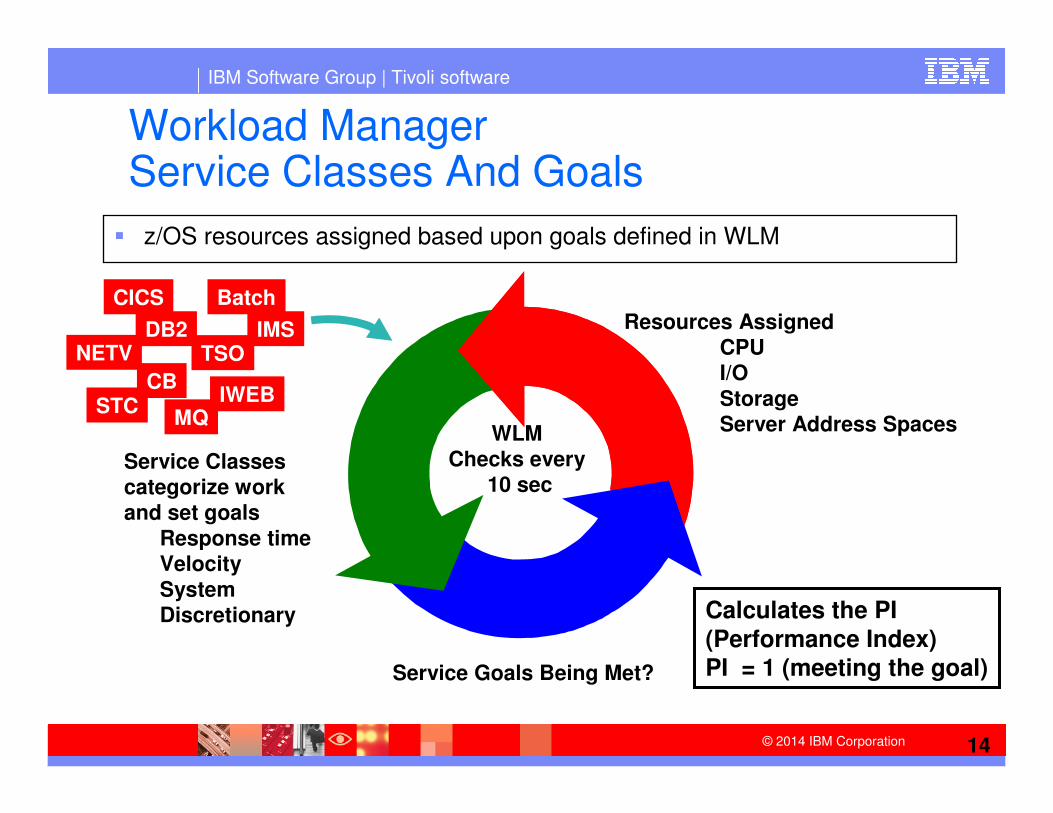
Workload ManagerService Classes And Goals
� z/OS resources assigned based upon goals defined in WLM
Service Classescategorize workand set goals
Response timeVelocity
SystemDiscretionary
Resources AssignedCPUI/O
StorageServer Address Spaces
Service Goals Being Met?
WLMChecks every
10 sec
CICS
IMSTSO
Batch
DB2
Calculates the PI
(Performance Index)PI = 1 (meeting the goal)
CBIWEB
NETV
STCMQ
IBM Software Group | Tivoli software
15© 2014 IBM Corporation
What You May Not KnowHow WLM May Impact DB2 Processing
� WLM controls resources assigned to DB2 and DB2 related workloads
� Problems with WLM can result in stalled DB2 workload
�May result in a hung subsystem or hung sysplex
�May result in held locks, held latches, issues with p-lock negotiation
IBM Software Group | Tivoli software
16© 2014 IBM Corporation
WLM Contention Management
� WLM Contention Management helps addressing chronic or long
lasting contention situations
�WLM provides interfaces to allow resource managers (for example – DB2) to
signal contention situations
�WLM has had the ability to promote (increase the DP) for a short duration to
resolve the issue
� DB2 example scenario
�Lock/latch contention in DB2 may impact performance
�Often contention may be resolved with a short boost of resource
�DB2 may notify WLM if a contention occurs
�WLM may optionally raise the priority for the holder to complete the work
� WLM can promote units of work for longer periods of time, and
promote them to the priority of the highest-priority units of work waiting for a resource they are holding.
IBM Software Group | Tivoli software
17© 2014 IBM Corporation
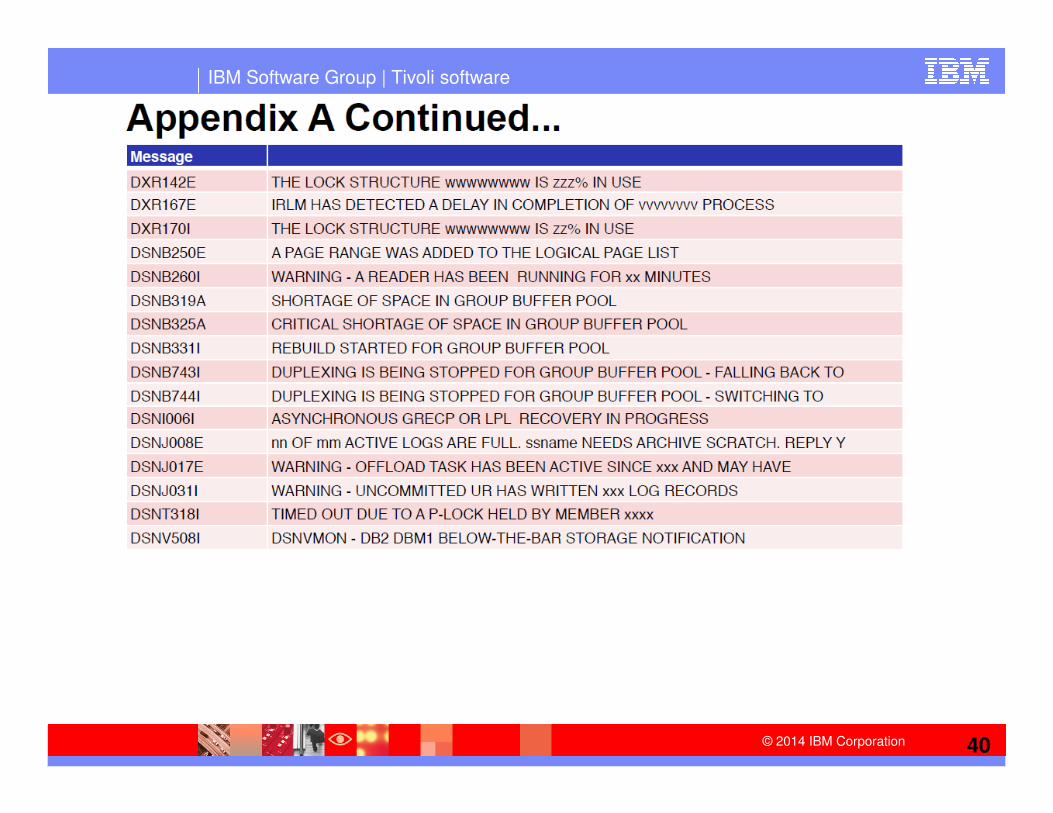
What You May Not KnowOverlooking Critical DB2 Messages – May Impact Availability
� Are you monitoring all the most critical messages?
� Missing critical messages is a common source of DB2 outages
� Share Conference presentation, John Tobler & Nigel Slinger
– “What Happened to My DB2? The Top Missteps in High Availability”https://share.confex.com/share/121/webprogram/Session13729.html
� There are many critical messages that indicate potential issues that may impact availability
�See Appendix A in this presentation for a list of recommended messages
IBM Software Group | Tivoli software
18© 2014 IBM Corporation
What You May Not KnowMissing Critical DB2 Messages – Example Scenarios
� Example scenario - logging
�DB2 is out or almost out of active log space
� System may hang as logging comes to a halt
� Messages DSNJ110E and DSNJ111E indicate the issue
� May be due to insufficient log space or an offload failure (DSNJ115I)
� Example scenario – real storage utilization
�DB2 is consuming large amounts of real storage
� DB2 or entire LPAR may crash
�DSNS003I message (more than 80% REALSTORAGE_MAX used)
� REALSTORAGE_MAX is a DB2 zparm setting
�Actions include reviewing DB2 storage usage with real time monitor
� Presentation on DB2 memory management
– http://www.slideshare.net/Caroldm/db2-10-memory-management
IBM Software Group | Tivoli software
19© 2014 IBM Corporation
Understanding Critical z/OS MessagesAbout zAware
� IBM zAware – IBM System z Advanced Workload Analysis Reporter
� Monitors z/OS OPERLOG including all messages written to z/OS console, including ISV and application generated messages
�Early detection and focused diagnosis can help improve time to recovery
� Technology based on machine learning developed by IBM Research
�Pattern recognition techniques look at the health of a system to pinpoint
deviations from the ‘norm’
�High speed analytics facilitates the ability to consume large quantities of message logs
� Allow establishment of procedures to prevent reoccurrence
� IBM Red Book - http://www.redbooks.ibm.com/redbooks/pdfs/sg248070.pdf
IBM Software Group | Tivoli software
20© 2014 IBM Corporation
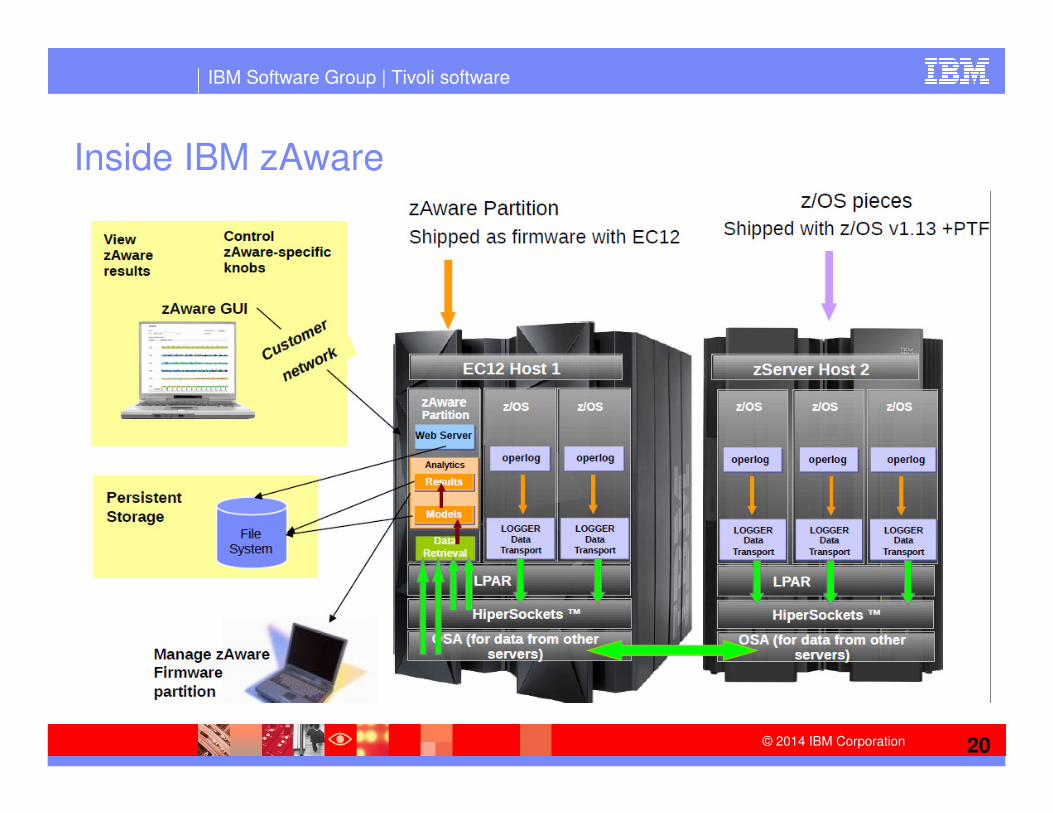
Inside IBM zAware
IBM Software Group | Tivoli software
21© 2014 IBM Corporation
How zAware Operates
� OPERLOG is processed per-system
�zAware recognizes any well-formed message Ids, including IBM and non-IBM
products and customer applications
� zAware builds a model of normal behavior based on the last 90 days
�Called “Training”, automatically trains every 30 days, customizable
�Unusual days can be excluded from future models
� Real-time OPERLOG data is compared to the model
� Assigns a message anomaly score to indicate deviation from the model
�Rare messages, Out of context from normal patterns, high counts
� Uses z/OS-specific knowledge to influence the scores
�Generates an interval anomaly score
� Provides a GUI for analysis
�GUI shows number of unique message IDs and interval anomaly score
� Provides API for real time monitoring
IBM Software Group | Tivoli software
22© 2014 IBM Corporation
Finding The ‘Unknown Unknowns”Predictive Analytics
� An area of analysis that deals with extracting information from data and using it to predict future trends and behavior patterns
� Relies on capturing relationships between explanatory variables and the predicted variables from past occurrences
�Exploit the information to predict future outcomes
� Accuracy and usability of results will depend greatly on the quality of data analysis and the quality of assumptions
� Predictive analysis is used in many facets of business
�Common example would be credit score
� Function of many data items
� Income, payment history, amount of outstanding debt, etc…
IBM Software Group | Tivoli software
23© 2014 IBM Corporation
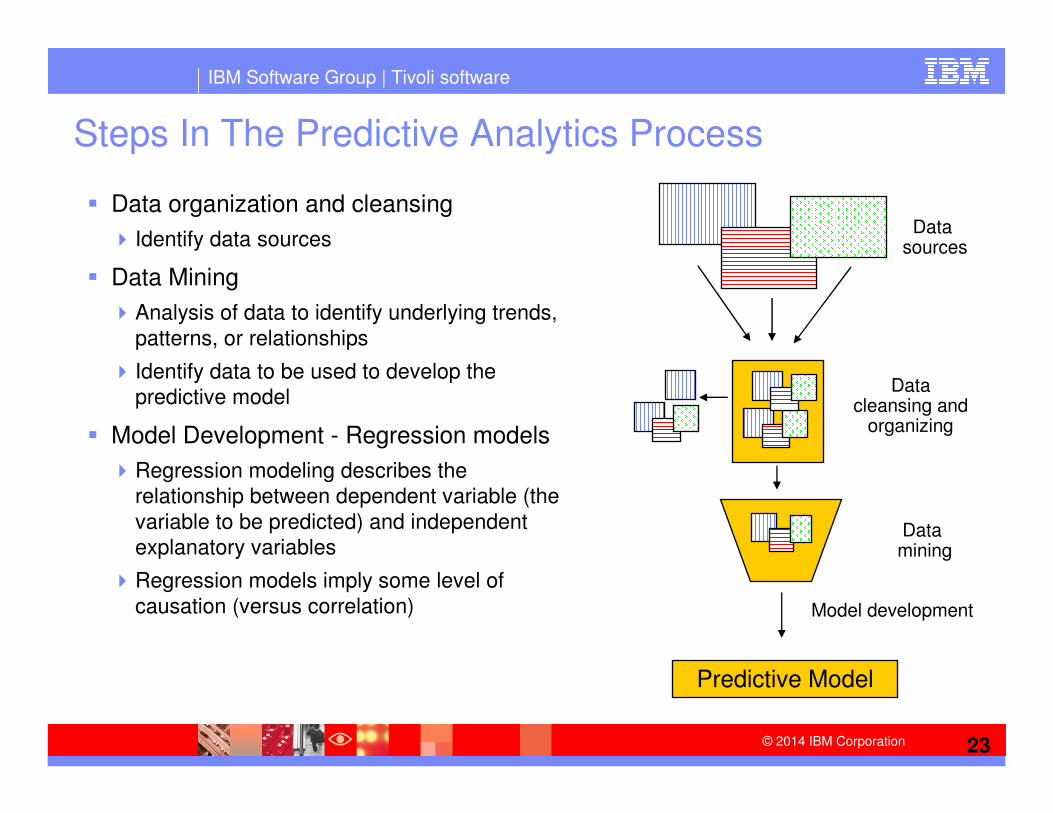
Steps In The Predictive Analytics Process
� Data organization and cleansing
� Identify data sources
� Data Mining
�Analysis of data to identify underlying trends,
patterns, or relationships
� Identify data to be used to develop the
predictive model
� Model Development - Regression models
�Regression modeling describes the
relationship between dependent variable (the
variable to be predicted) and independent
explanatory variables
�Regression models imply some level of
causation (versus correlation)
Predictive Model
Datasources
Data cleansing and
organizing
Datamining
Model development
IBM Software Group | Tivoli software
24© 2014 IBM Corporation
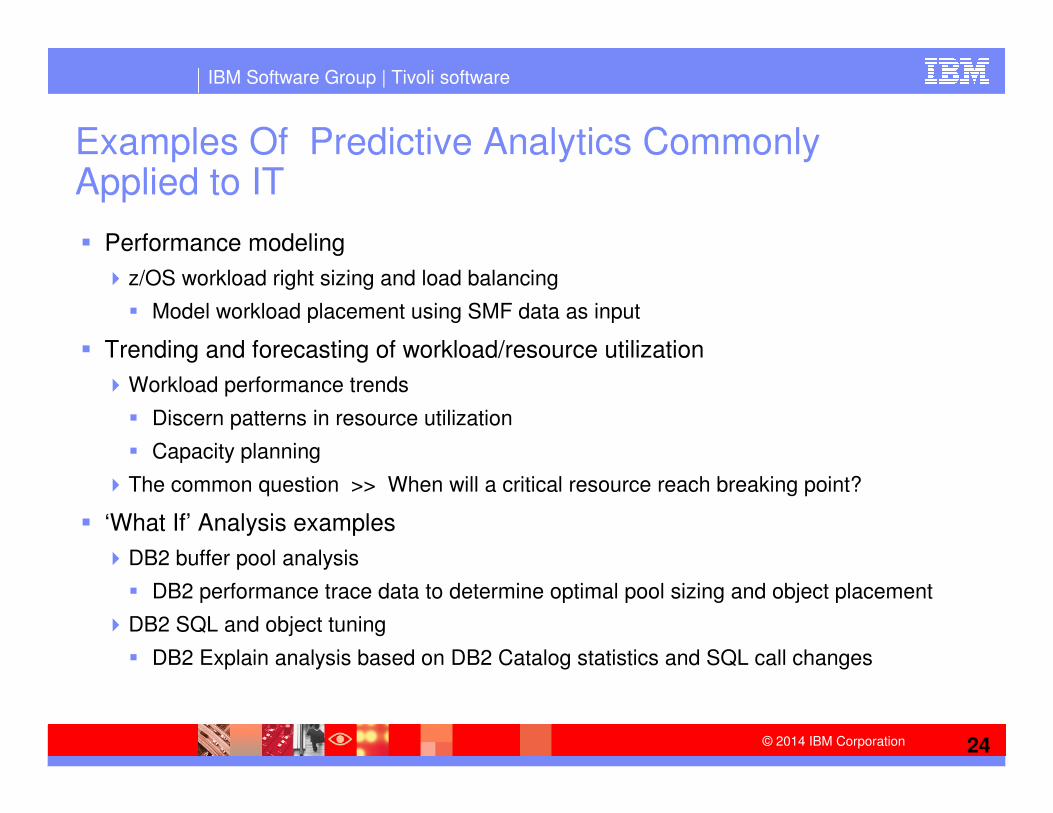
Examples Of Predictive Analytics Commonly Applied to IT
� Performance modeling
�z/OS workload right sizing and load balancing
� Model workload placement using SMF data as input
� Trending and forecasting of workload/resource utilization
�Workload performance trends
� Discern patterns in resource utilization
� Capacity planning
�The common question >> When will a critical resource reach breaking point?
� ‘What If’ Analysis examples
�DB2 buffer pool analysis
� DB2 performance trace data to determine optimal pool sizing and object placement
�DB2 SQL and object tuning
� DB2 Explain analysis based on DB2 Catalog statistics and SQL call changes
IBM Software Group | Tivoli software
25© 2014 IBM Corporation
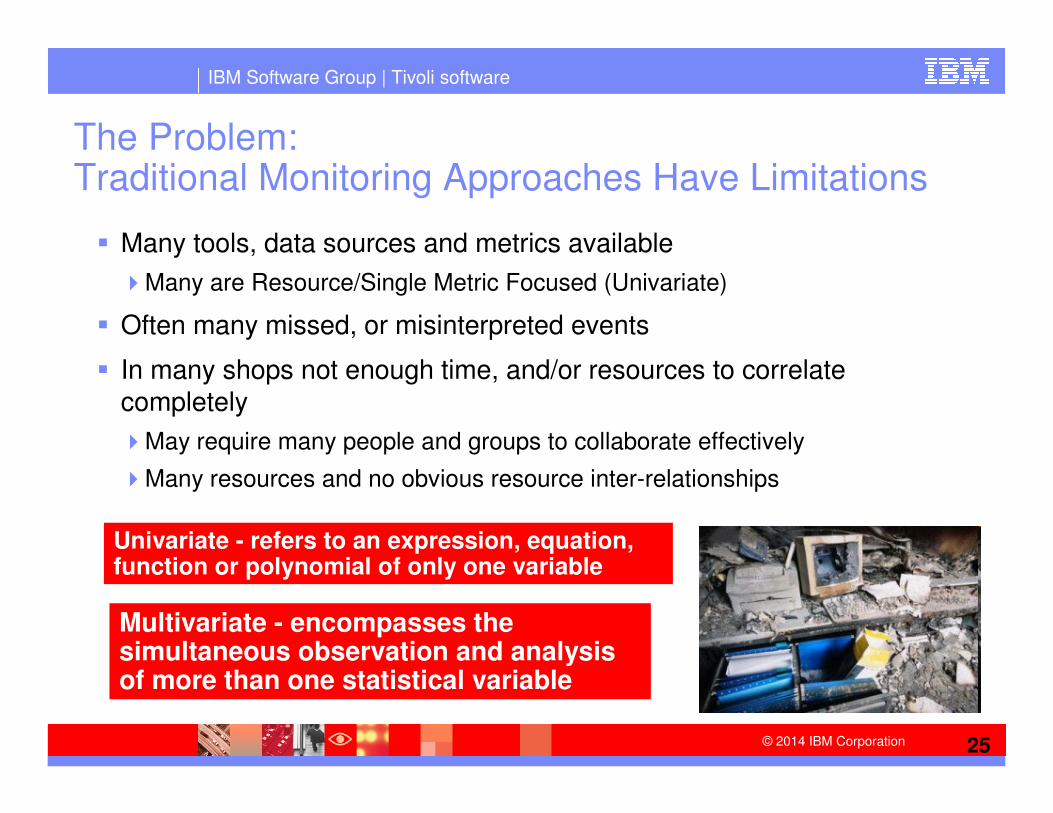
The Problem: Traditional Monitoring Approaches Have Limitations
� Many tools, data sources and metrics available
�Many are Resource/Single Metric Focused (Univariate)
� Often many missed, or misinterpreted events
� In many shops not enough time, and/or resources to correlate
completely
�May require many people and groups to collaborate effectively
�Many resources and no obvious resource inter-relationships
Univariate - refers to an expression, equation, function or polynomial of only one variable
Multivariate - encompasses the simultaneous observation and analysis of more than one statistical variable
IBM Software Group | Tivoli software
26© 2014 IBM Corporation
Problem Analysis And Resolution
� In many IT environments
�Problem identification and notification may be ad hoc
� Alert notification via phone calls, emails, or paging
�Problem analysis is often after the fact
� Problem analysis and resolution often involves rounding up the usual suspects (and getting them to confess)
� Issue resolution relies heavily on the knowledge and intuition of the SME’s
�Knowledge of the systems and business applications
� The ‘known knowns’
�Understanding complex problems will be multivariate in nature
IBM Software Group | Tivoli software
27© 2014 IBM Corporation
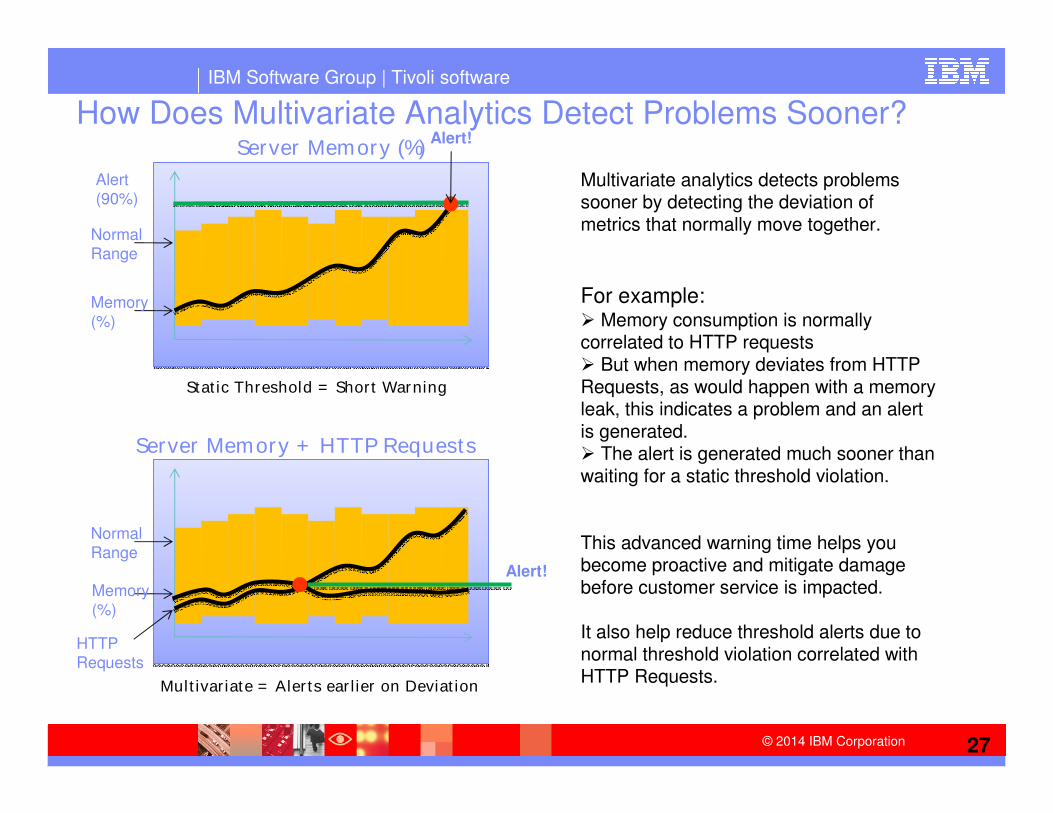
How Does Multivariate Analytics Detect Problems Sooner?Server Memory (%)
Normal Range
Static Threshold = Short Warning
Server Memory + HTTP Requests
Normal Range
Multivariate analytics detects problems sooner by detecting the deviation of metrics that normally move together.
For example:� Memory consumption is normally correlated to HTTP requests� But when memory deviates from HTTP Requests, as would happen with a memory leak, this indicates a problem and an alert is generated.� The alert is generated much sooner than waiting for a static threshold violation.
This advanced warning time helps you become proactive and mitigate damage before customer service is impacted.
It also help reduce threshold alerts due to normal threshold violation correlated with HTTP Requests.
Memory(%)
HTTP Requests
Multivariate = Alerts earlier on Deviation
Alert!
Memory(%)
Alert!
Alert(90%)
IBM Software Group | Tivoli software
28© 2014 IBM Corporation
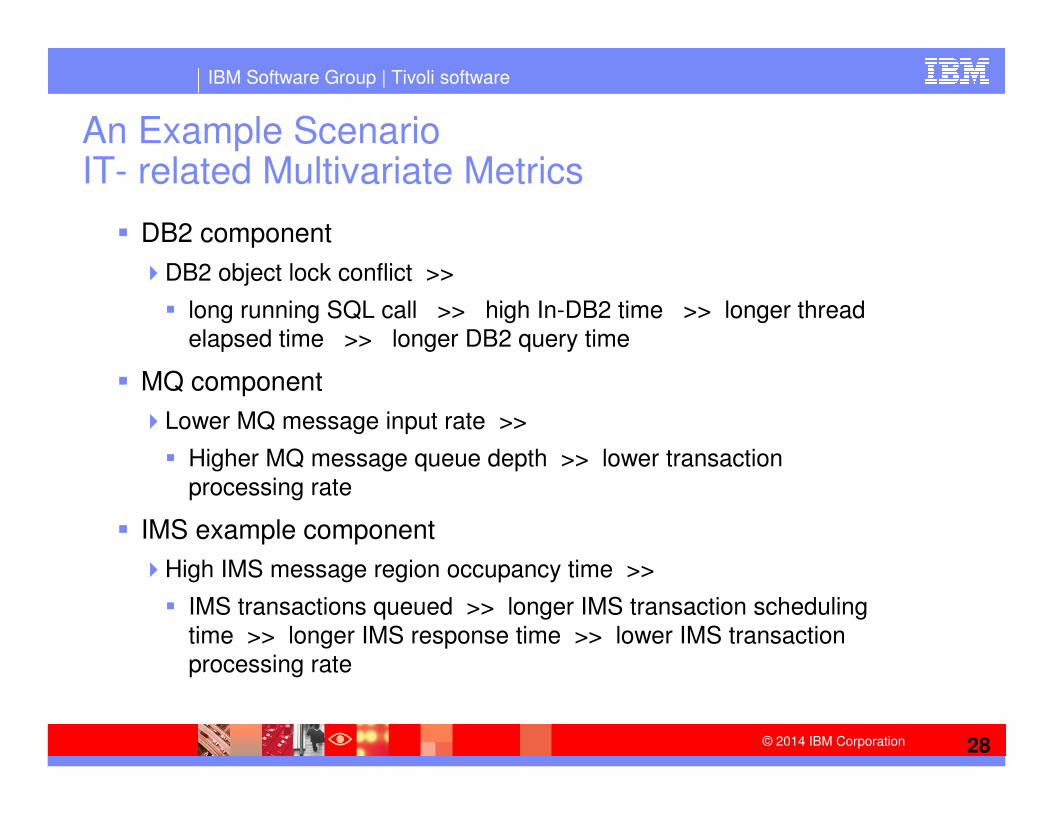
An Example Scenario IT- related Multivariate Metrics
� DB2 component
�DB2 object lock conflict >>
� long running SQL call >> high In-DB2 time >> longer thread elapsed time >> longer DB2 query time
� MQ component
�Lower MQ message input rate >>
� Higher MQ message queue depth >> lower transaction
processing rate
� IMS example component
�High IMS message region occupancy time >>
� IMS transactions queued >> longer IMS transaction scheduling
time >> longer IMS response time >> lower IMS transaction
processing rate
IBM Software Group | Tivoli software
29© 2014 IBM Corporation
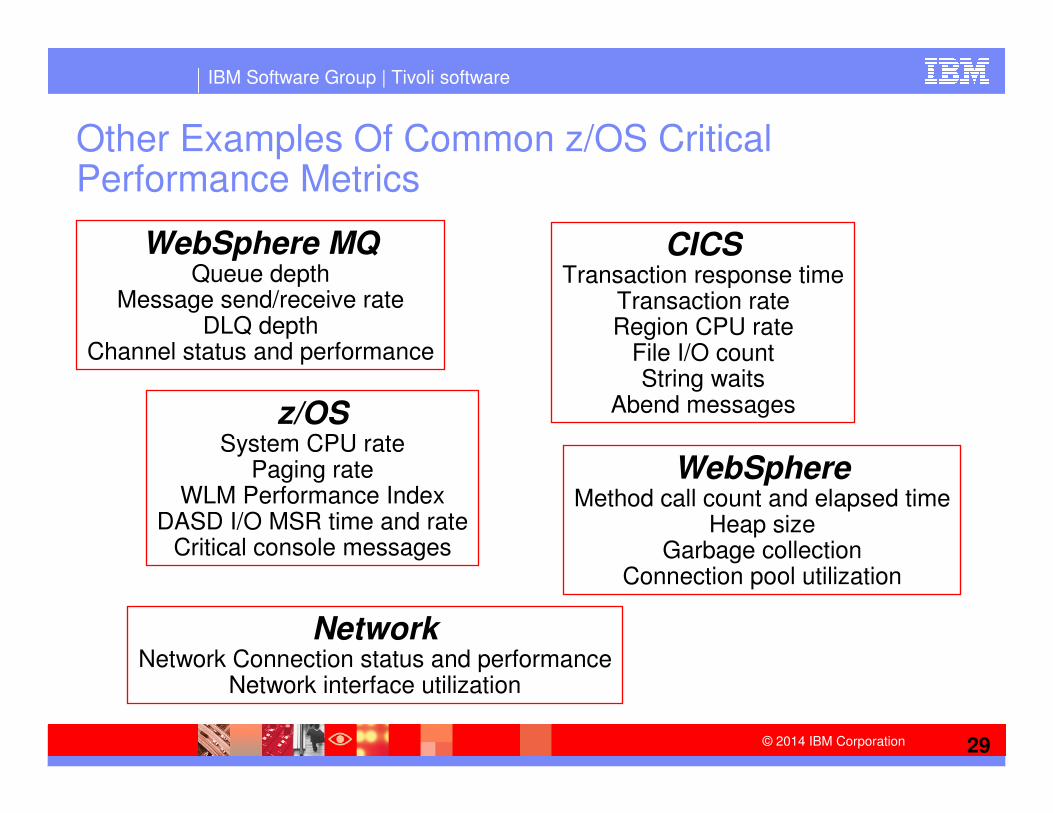
Other Examples Of Common z/OS Critical Performance Metrics
WebSphere MQQueue depth
Message send/receive rateDLQ depth
Channel status and performance
z/OSSystem CPU rate
Paging rateWLM Performance Index
DASD I/O MSR time and rateCritical console messages
CICSTransaction response time
Transaction rateRegion CPU rate
File I/O countString waits
Abend messages
WebSphereMethod call count and elapsed time
Heap sizeGarbage collection
Connection pool utilization
NetworkNetwork Connection status and performance
Network interface utilization
IBM Software Group | Tivoli software
30© 2014 IBM Corporation
What You May Not KnowIs It A Good Number? Is It A Bad Number?
� Established ‘best practices’ document many recommended numbers and settings
�Many numbers reflect documented concerns (as in prior examples)
� Some numbers may not be so clear
�Workloads are unique in each installation
� Examples – In-DB2 times, CPU times, getpage counts may vary widely by shop, by workload and by workload type
� How do you know what is a bad number?
�The first question should be – “What is a good number?”
�How does the application appear when things are running well?
IBM Software Group | Tivoli software
31© 2014 IBM Corporation
What You May Not KnowThe Challenge Of The Whitespace Gap
� Whitespace gap
�A disconnect between various groups in an organization
� What are assumed requirements versus actual requirements?
�May take many forms
� Various SME groups, technical versus operations, technical versus line of business
� In most shops monitoring and management still tends to be ‘silo’ in nature
�Focus is usually on the SME (Subject matter expert)
� Problem analysis may be more complex
�Problem resolution may require many groups and SMEs
IBM Software Group | Tivoli software
32© 2014 IBM Corporation
What You May Not KnowThe Challenge Of Composite Applications And The Whitespace Gap
� Most new applications are composite in design and deployment
� The management of composite applications may be challenged by the common issue of the white space gap
�Problem analysis is often done in a ‘silo’ fashion
� Tools are traditionally been used in a ‘silo’ fashion
� Poses challenges in terms of identifying and resolving complex
application issues
� Islands of automation
�Poses challenges when trying to become more proactive
� How does this impact DB2? - Where is the problem?
IBM Software Group | Tivoli software
33© 2014 IBM Corporation
Bringing It All TogetherAddressing The “Knowns” And The “Unknowns”
� Start with the knowns
�DB2 Subject Matter Experts (SMEs) will always be essential
� Knowledgable SMEs are key to knowing best practices
� Ensure you have the most appropriate information
�You cannot always predict defects (Just assume there are some)
�How well are you prepared?
� Do you know where all your JCL is for
– Traces, Reports, Diagnostics
�What history are you collecting?
� Statistics, Accounting, Console messages, Alerts
IBM Software Group | Tivoli software
34© 2014 IBM Corporation
Focus First On Your Knowns
� The more that you can add to the list of “knowns” the better
� Have representative Statistics and Accounting trace information available
�Establish good number versus bad number base lines
� Don’t overlook the importance of DB2 messages
�Make sure console automation or monitoring alerts on critical messages (see list in Appendix A for examples)
� Don’t overlook the value of having a history of alerts
�How often is an issue occurring?
� Important for issue prioritization
� Having good history may feed other analysis processes
IBM Software Group | Tivoli software
35© 2014 IBM Corporation
Turning “Unknowns” Into “Knowns”
� Bridging the islands of automation gap
�Where possible close the islands of automation
� SMEs and SME tools are critical
� Where feasible look at more integrated tool sets that expedite root
cause analysis
– Address the key questions
– Is the problem DB2? Is it in the SQL? Is it somewhere else
in DB2? Or the network? Or z/OS/ Or z/OS WLM? Is it an
SQL problem? Is it an application issued? Is there an issue with middleware? Or CICS? Or IMS? Or distributed OS?
� Improve knowledge of other facets of the business
�OS knowledge, Operations, Lines of business
IBM Software Group | Tivoli software
36© 2014 IBM Corporation
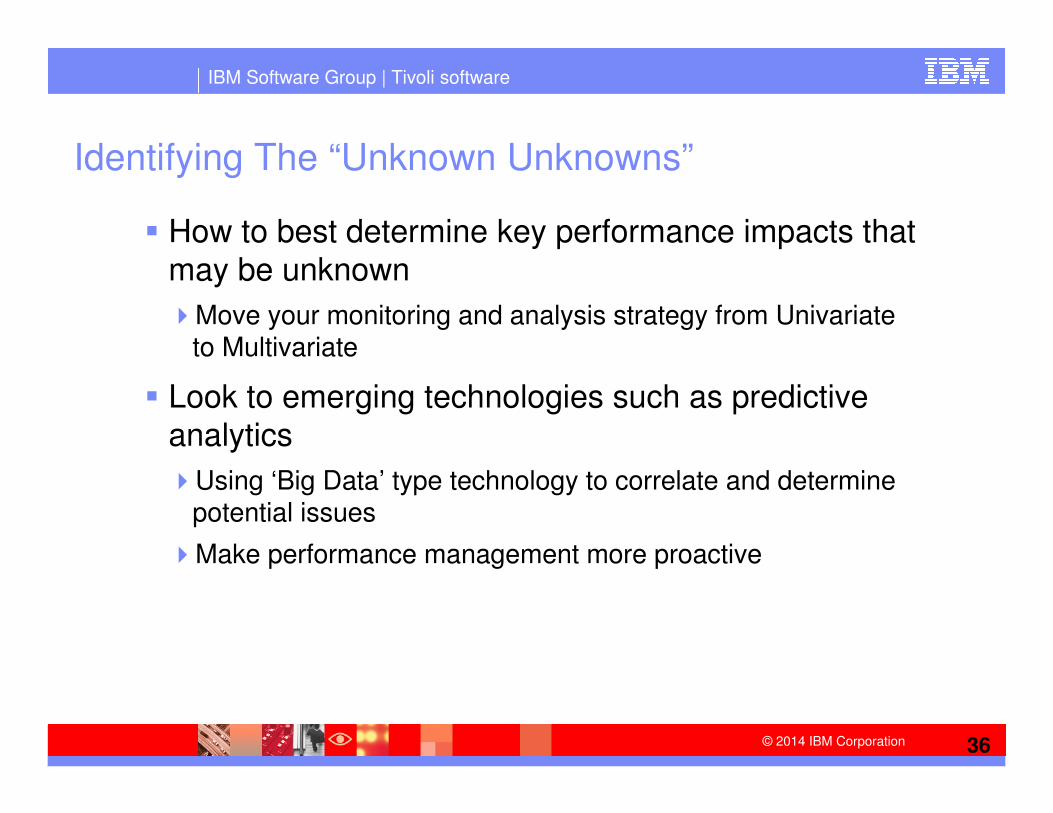
Identifying The “Unknown Unknowns”
� How to best determine key performance impacts that may be unknown
�Move your monitoring and analysis strategy from Univariateto Multivariate
� Look to emerging technologies such as predictive analytics
�Using ‘Big Data’ type technology to correlate and determine potential issues
�Make performance management more proactive
IBM Software Group | Tivoli software
37© 2014 IBM Corporation
Thank You!
IBM Software Group | Tivoli software
38© 2014 IBM Corporation
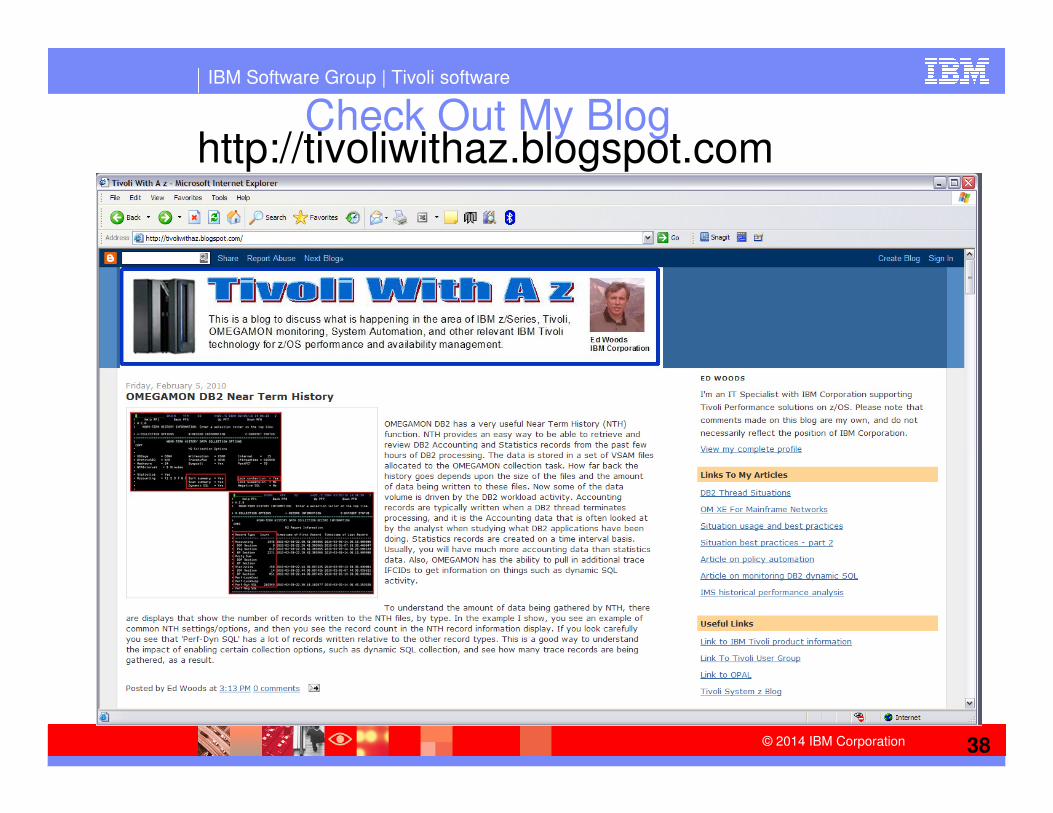
Check Out My Bloghttp://tivoliwithaz.blogspot.com
IBM Software Group | Tivoli software
39© 2014 IBM Corporation
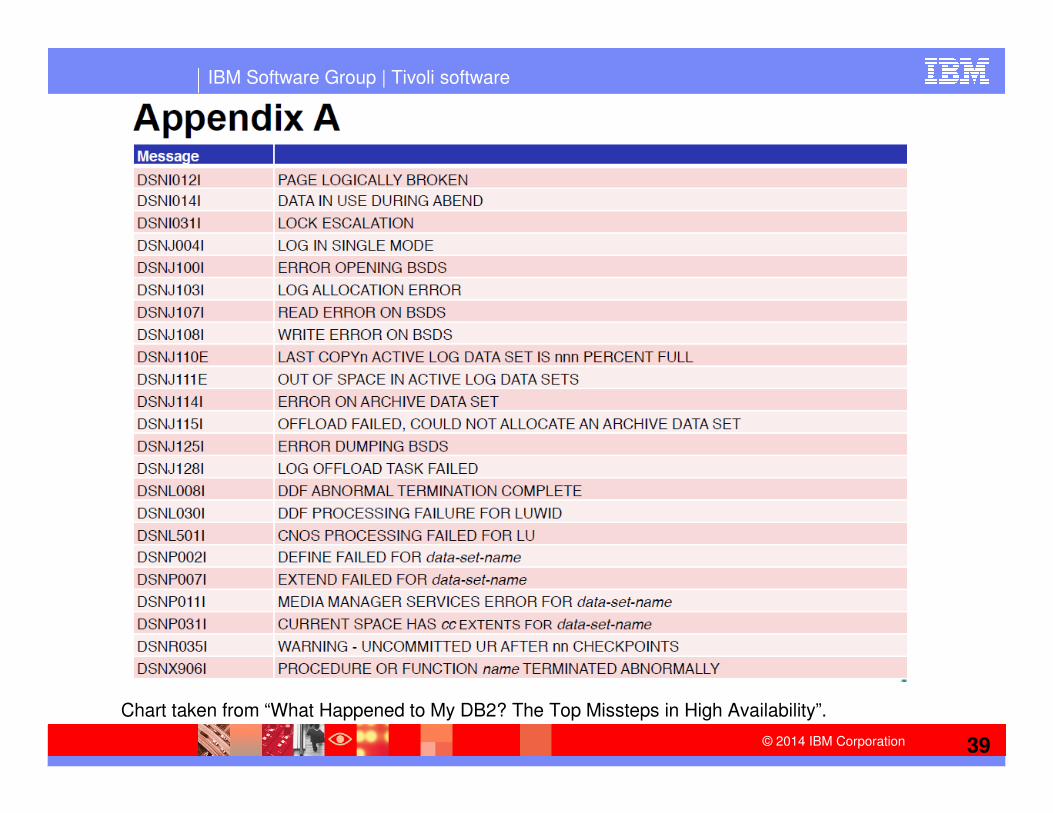
Chart taken from “What Happened to My DB2? The Top Missteps in High Availability”.
IBM Software Group | Tivoli software
40© 2014 IBM Corporation


![Saxos Don't Know Why [Murtha]](https://img.pdfslide.us/doc/110x75/577c7f0c1a28abe054a30488/saxos-dont-know-why-murtha.jpg)