Embed Size (px)
Citation preview
10/20/11
1
Building Evidence on Results-‐Based Financing for Health 3rd Annual Impact EvaluaAon Training Workshop
Bangkok, October 17-‐21, 2011
Data Quality Assurance: Sampling, Ques6onnaire, Fieldwork
Beatriz Godoy and Juan Muñoz – Sistemas Integrales
October 18, 2011
Sampling
• Health faciliAes and households should be selected through a documented process that gives each unit in the populaAon of interest a probability of being chosen that is posi6ve and known – This permits making inferences from the sample to the enAre
populaAon with known margins of error (external validity)
• Samples are generally not simple random samples
• Samples are instead – StraAfied
• by Region, by Urban/Rural, by IntervenAon / Control, … – Selected in two stages or more
• Area Units in the first stage/s • Households in the last stage
2
10/20/11
2
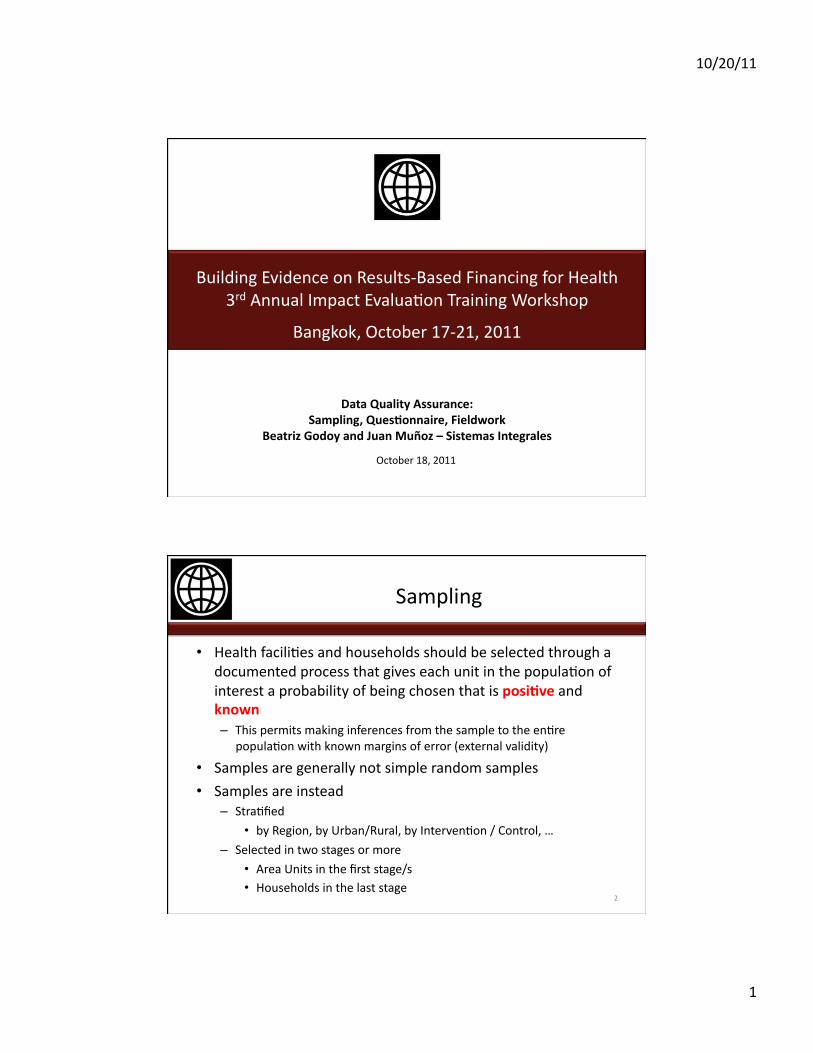
Sampling error
• Sampling error is the result of observing a sample of n households (the sample size) rather than all N households in the populaAon of interest
• The standard error e is a measure of a sample’s precision
– The chances for the true value of an indicator being farther than 2e apart from its sampling esAmate are about 95 percent
• The standard error e decreases with the square root of the sample size n. – To reduce the error to one half, the sample size must be quadrupled
• The size of the populaAon N has almost no influence on the size of the sample that is needed to achieve a given precision
– To obtain naAonal esAmates, big countries and small countries require samples of about the same size
• Increasing the sample size will generally reduce sampling errors
– However, it is also likely to increase non-‐sampling errors
3
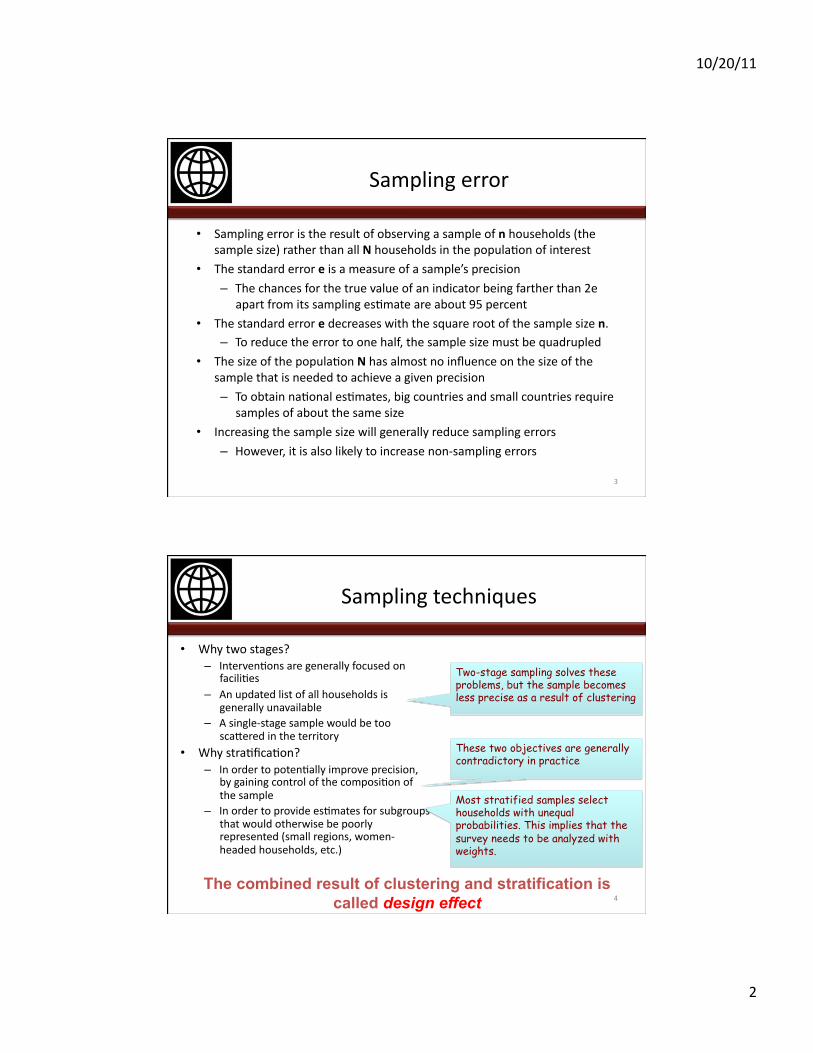
Sampling techniques
• Why two stages? – IntervenAons are generally focused on
faciliAes – An updated list of all households is
generally unavailable – A single-‐stage sample would be too
sca\ered in the territory • Why straAficaAon?
– In order to potenAally improve precision, by gaining control of the composiAon of the sample
– In order to provide esAmates for subgroups that would otherwise be poorly represented (small regions, women-‐headed households, etc.)
4
Two-stage sampling solves these problems, but the sample becomes less precise as a result of clustering
These two objectives are generally contradictory in practice
Most stratified samples select households with unequal probabilities. This implies that the survey needs to be analyzed with weights.
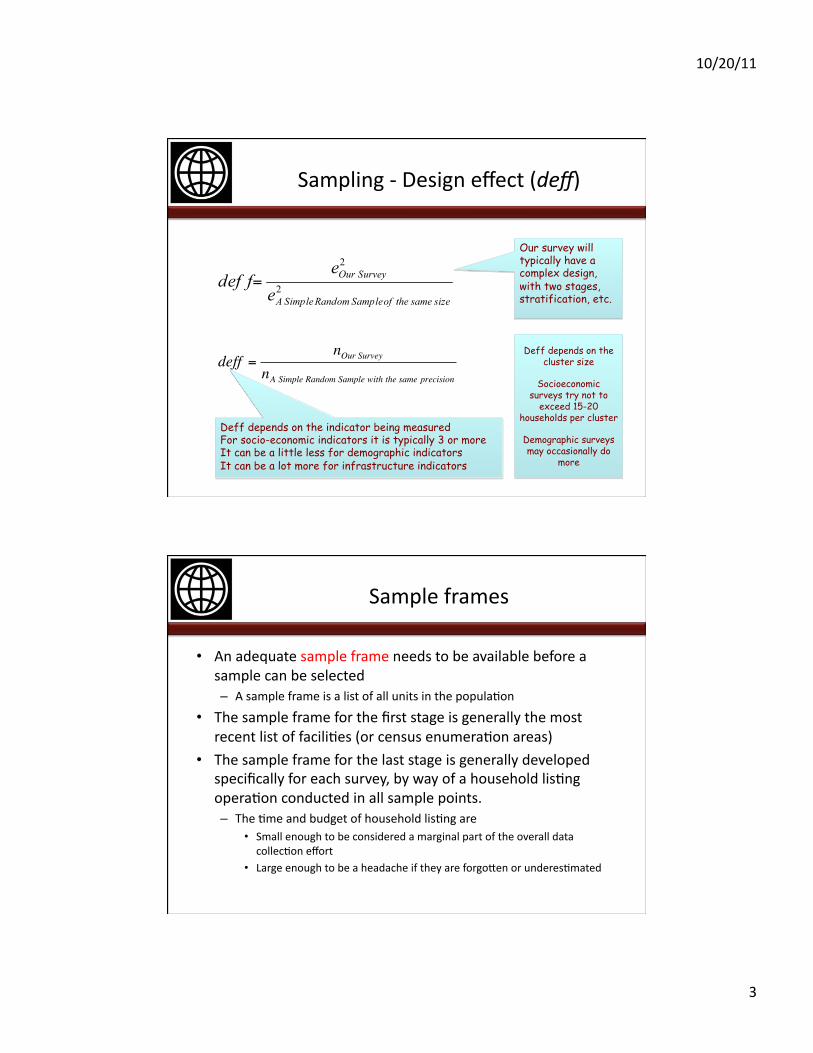
The combined result of clustering and stratification is called design effect
10/20/11
3
!
deff =nOur Survey
nA Simple Random Sample with the same precision
Our survey will typically have a complex design, with two stages, stratification, etc.
Deff depends on the indicator being measured For socio-economic indicators it is typically 3 or more It can be a little less for demographic indicators It can be a lot more for infrastructure indicators
Deff depends on the cluster size
Socioeconomic surveys try not to
exceed 15-20 households per cluster
Demographic surveys may occasionally do
more
Sampling -‐ Design effect (deff)
• An adequate sample frame needs to be available before a sample can be selected – A sample frame is a list of all units in the populaAon
• The sample frame for the first stage is generally the most recent list of faciliAes (or census enumeraAon areas)
• The sample frame for the last stage is generally developed specifically for each survey, by way of a household lisAng operaAon conducted in all sample points. – The Ame and budget of household lisAng are
• Small enough to be considered a marginal part of the overall data collecAon effort
• Large enough to be a headache if they are forgo\en or underesAmated
Sample frames
10/20/11
4
• Household lisAngs (and the subsequent selecAon of the households to be visited) can be prepared – by the same fieldworkers who will conduct the interviews, or
– by independent enumerators
– The choice is difficult.
• Sample points larger than a few hundred households may require segmentaAon – The sample point is divided into smaller areas of approximately equal size called
segments. Then one (or maybe a few) of the segments are randomly selected and listed. – SegmentaAon is a de facto extra sampling stage that is very difficult to supervise. It
should only be used as a last resort.
• Beware of imitaAons and shortcuts – Implicit lisAng (a.k.a. “random walk”) consists of asking the interviewers to select every
n-‐th household on the ground rather than on paper. It is not a recommended opAon.
Sampling -‐ Household lisAng issues
• None of the following is a soluAon for nonresponse – Replace nonrespondents with similar households – Increase the sample size to compensate for it – Use correcAon formulas – Use imputaAon techniques (hot-‐deck, cold-‐deck, warm-‐deck, etc.) to
simulate the answers of nonrespondents
• The best way to deal with nonresponse is to prevent it – Some of the above may have a prevenAve value
• A\riAon – Things that happen out there in the world – Things that happen to us in the project
Sampling -‐ Nonresponse
10/20/11
5
QuesAonnaire design Asking the right quesAons
• Are the relevant topics covered? Is each topic adequately covered?
– Discussions with key stakeholders – Indicators needed
• For monitoring (MDGS, Etc.)
• For impact evaluaAon
– Review of previous surveys – Review of relevant qualitaAve studies
• Reality checks – PiloAng – Field-‐tesAng – To avoid respondent faAgue:
Maximum 90 minutes per respondent in a single sikng
9
QuesAonnaire design Choosing the respondents
• Each quesAon should be addressed to the person who is be\er informed to answer
• Different respondents may need to be interviewed in each facility or household
• Who signs the le\er of consent?
• Proxy respondents to be avoided
10
10/20/11
6
QuesAonnaire design Assuring comprehension
• Wording – Avoid ambiguous wording – Ask one quesAon at a Ame (don’t ask double-‐barreled quesAons) – Be clear who the quesAon refers to – Make the reference period explicit – Make measurement units explicit – Avoid jargon or academic phrases – Straighmorward language (avoid double negaAves) – QuesAons should be culturally sensiAve and appropriate
• TranslaAon – Interviewers to read quesAons as they are wri\en – Back-‐translaAon is needed – DiagnosAc tools (Peabody, Mc Arthur, etc.) should be adapted to local
context 11
QuesAonnaire design The flow of quesAons
• QuesAons should be asked in a logical order • QuesAons should only be asked when applicable • The decision of when and to whom a quesAon should be asked should never be len to the interviewer judgment
• This is done by establishing an explicit skip pa\ern
12
10/20/11
7
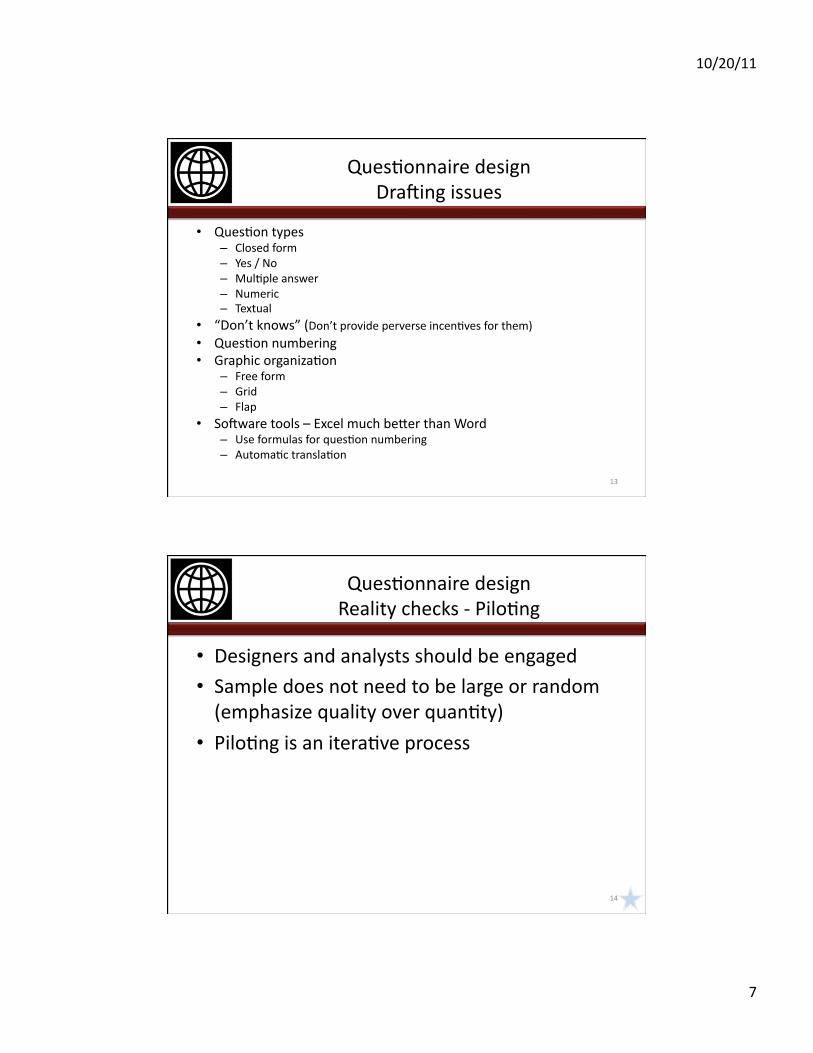
QuesAonnaire design Draning issues
• QuesAon types – Closed form – Yes / No – MulAple answer – Numeric – Textual
• “Don’t knows” (Don’t provide perverse incenAves for them) • QuesAon numbering • Graphic organizaAon
– Free form – Grid – Flap
• Sonware tools – Excel much be\er than Word – Use formulas for quesAon numbering – AutomaAc translaAon
13
QuesAonnaire design Reality checks -‐ PiloAng
• Designers and analysts should be engaged • Sample does not need to be large or random (emphasize quality over quanAty)
• PiloAng is an iteraAve process
14
10/20/11
8
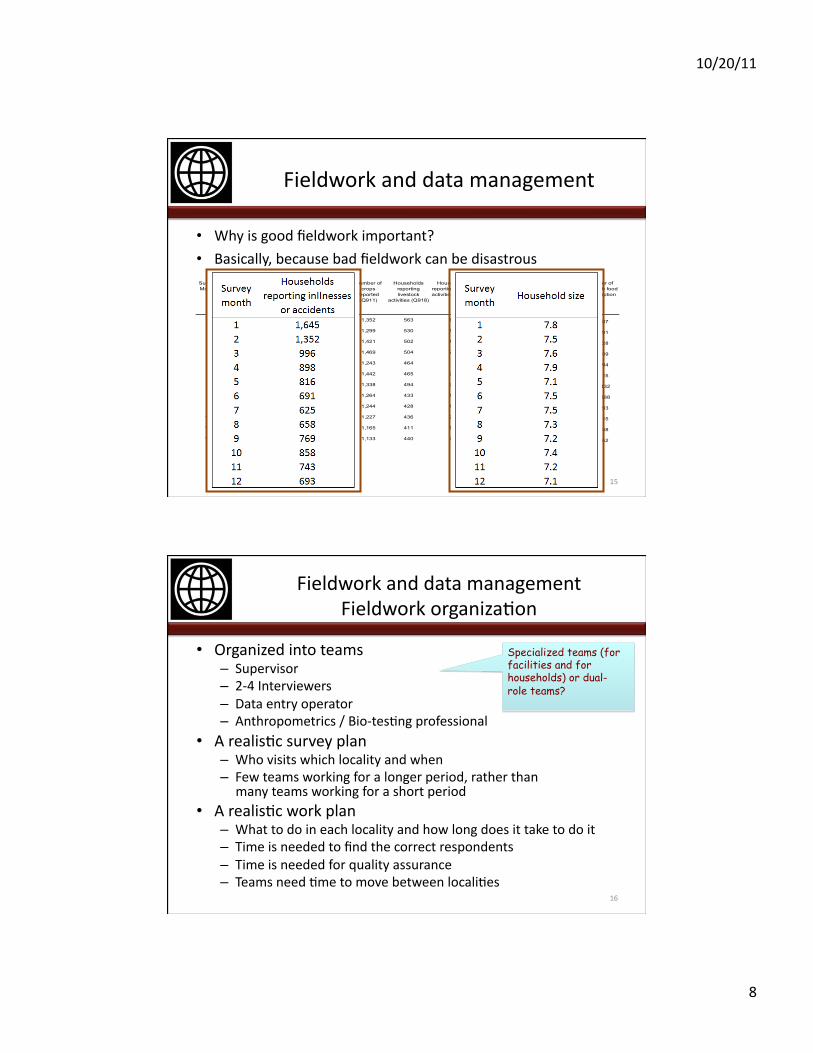
• Why is good fieldwork important?
• Basically, because bad fieldwork can be disastrous Survey Month
Households reporting illnesses, accidents (Q407)
Households reporting chronic
deseases (Q401)
Households reporting
agricultural activities (Q901)
Number of crops
reported (Q911)
Households reporting livestock
activities (Q918)
Households reporting fishing activities (Q924)
Total Nb of durables
(Section 12)
Nb of HH having credit (Section 13)
HH size mean
Number of lines with food consumption
1 1,645 705 572 1,352 563 17 9,538 1,017 7.8 95,687
2 1,352 624 503 1,299 530 13 8,853 937 7.5 99,491
3 996 577 507 1,421 502 12 9,818 910 7.6 96,028
4 898 642 486 1,469 504 25 9,301 880 7.9 96,139
5 816 545 436 1,243 464 3 9,180 811 7.1 97,094
6 691 513 477 1,442 465 23 9,667 841 7.5 97,315
7 625 529 465 1,338 494 26 9,621 738 7.5 108,432
8 658 498 439 1,264 433 17 9,437 707 7.3 100,888
9 769 552 433 1,244 428 11 9,584 740 7.2 98,893
10 858 534 468 1,227 436 25 9,224 719 7.4 98,415
11 743 517 399 1,165 411 10 9,294 737 7.2 97,138
12 693 464 356 1,133 440 25 9,722 705 7.1 96,052
Fieldwork and data management
15
Fieldwork and data management Fieldwork organizaAon
• Organized into teams – Supervisor – 2-‐4 Interviewers – Data entry operator – Anthropometrics / Bio-‐tesAng professional
• A realisAc survey plan – Who visits which locality and when – Few teams working for a longer period, rather than
many teams working for a short period • A realisAc work plan
– What to do in each locality and how long does it take to do it – Time is needed to find the correct respondents – Time is needed for quality assurance – Teams need Ame to move between localiAes
16
Specialized teams (for facilities and for households) or dual- role teams?
10/20/11
9
Fieldwork and data management Fieldworker selecAon
• Need to consider – Gender – Age – Language – EducaAon (sufficient, but not much more)
– Compliance with naAonal health regulaAons
– Willingness to accept the realiAes of fieldwork – Etc.
• SelecAon requires – CV scanning – Face to face interviews – Be\er train more than needed, and select the best aner training
17
Fieldwork and data management Fieldworker training
• A well-‐defined training plan (measured in weeks, not in days)
• Senior speakers for plenary sessions • A group of master trainers to conduct the group sessions in parallel
• Lodging, catering and transportaAon • Equipment and supplies • Households for field pracAce • Space for plenary and group sessions
10/20/11
10
Fieldwork and data management Quality assurance
• Human supervision – Visual scruAny of completed quesAonnaires – Observing interviewers during fieldwork – Check-‐up interviews
• Computer-‐based checks (Computer Assisted Field Edits: The CAFE approach) – Use the computer to detect inconsistencies while the team is in the
cluster and can correct them by re-‐visiAng the households – Timely available datasets are also useful for
• Monitoring fieldwork • Analysis of parAal datasets • Opportune decision-‐making
– Avoid “data cleaning” • Reliance on external fieldwork implementaAon firms makes
the above parAcularly challenging
Need to implement adequate data transmission and concentration protocols
The bo\om line
• Gekng good quality data is – Important
– Difficult
– Time-‐consuming
• Needs to be accounted for at the Ame of
– Planning – BudgeAng

10/20/11
11
21