Embed Size (px)
Citation preview
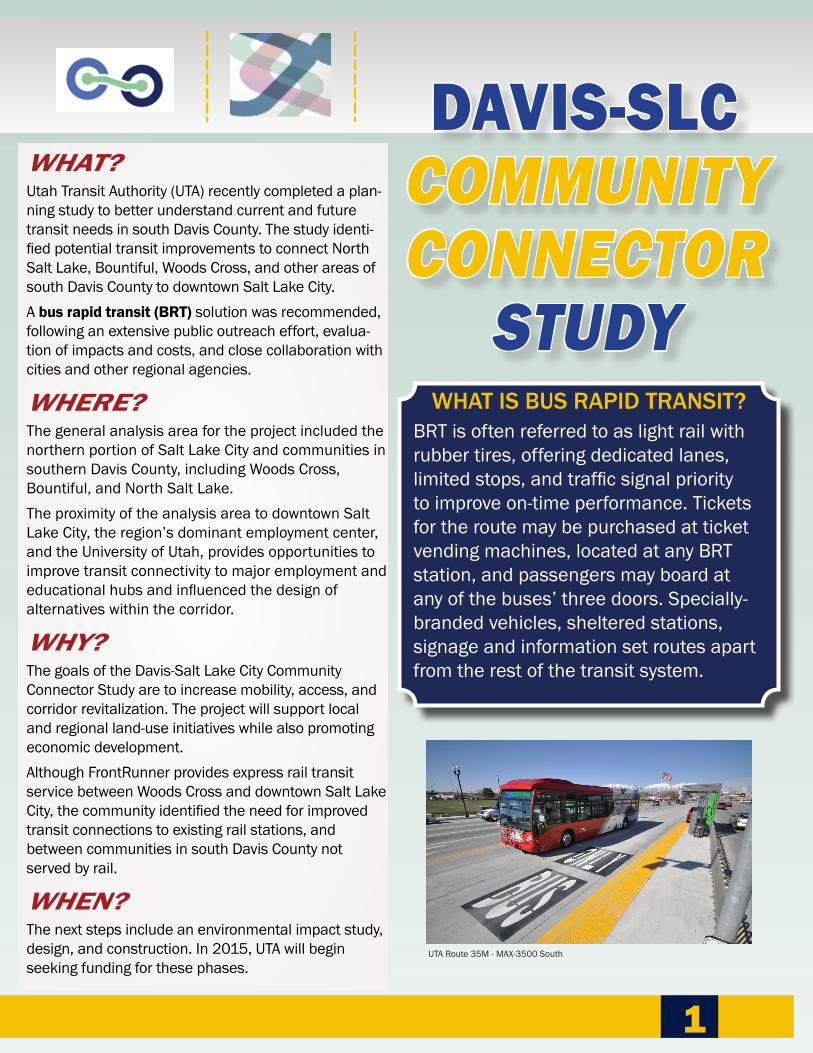
WHAT?Utah Transit Authority (UTA) recently completed a plan-ning study to better understand current and future transit needs in south Davis County. The study identi-fied potential transit improvements to connect North Salt Lake, Bountiful, Woods Cross, and other areas of south Davis County to downtown Salt Lake City. A bus rapid transit (BRT) solution was recommended, following an extensive public outreach effort, evalua-tion of impacts and costs, and close collaboration with cities and other regional agencies.
WHERE?The general analysis area for the project included the northern portion of Salt Lake City and communities in southern Davis County, including Woods Cross,Bountiful, and North Salt Lake. The proximity of the analysis area to downtown Salt Lake City, the region’s dominant employment center, and the University of Utah, provides opportunities to improve transit connectivity to major employment and educational hubs and influenced the design of alternatives within the corridor.
WHY?The goals of the Davis-Salt Lake City Community Connector Study are to increase mobility, access, and corridor revitalization. The project will support local and regional land-use initiatives while also promoting economic development. Although FrontRunner provides express rail transit service between Woods Cross and downtown Salt Lake City, the community identified the need for improved transit connections to existing rail stations, and between communities in south Davis County not served by rail.
WHEN?The next steps include an environmental impact study, design, and construction. In 2015, UTA will begin seeking funding for these phases.
BRT is often referred to as light rail with rubber tires, offering dedicated lanes, limited stops, and traffic signal priority to improve on-time performance. Tickets for the route may be purchased at ticket vending machines, located at any BRT station, and passengers may board at any of the buses’ three doors. Specially-branded vehicles, sheltered stations, signage and information set routes apart from the rest of the transit system.
WHAT IS BUS RAPID TRANSIT?
DAVIS-SLC COMMUNITYCONNECTOR
STUDY
1
UTA Route 35M - MAX-3500 South
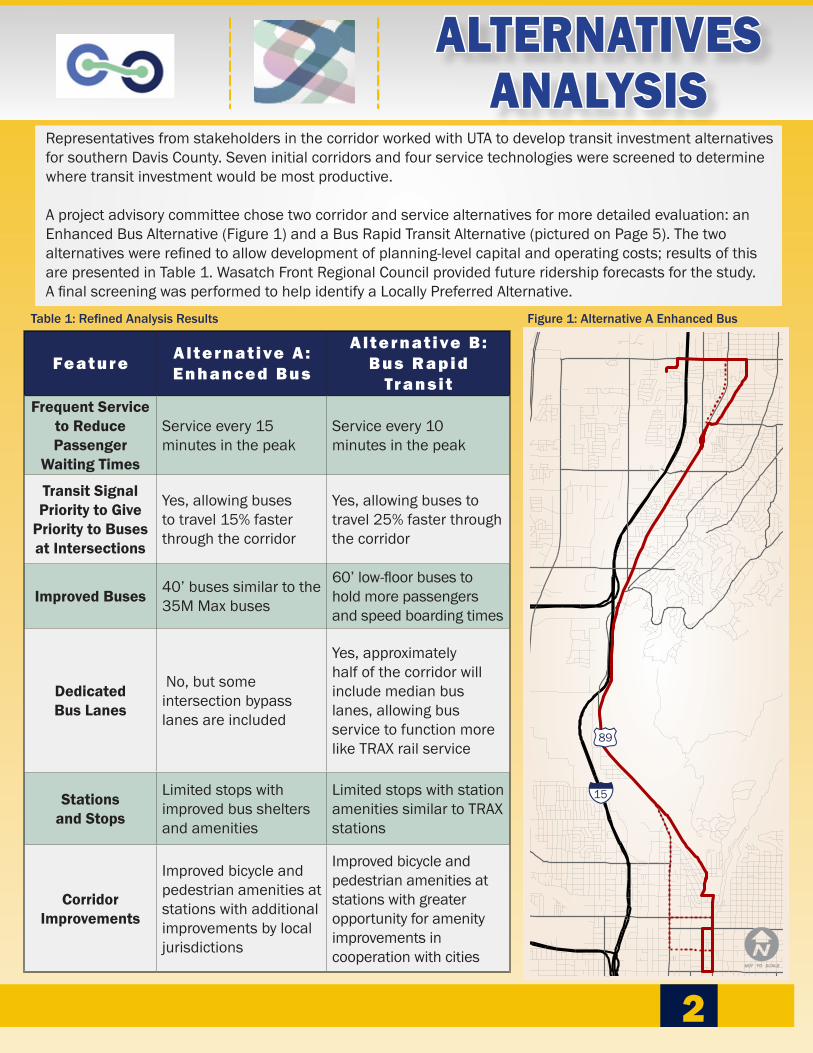
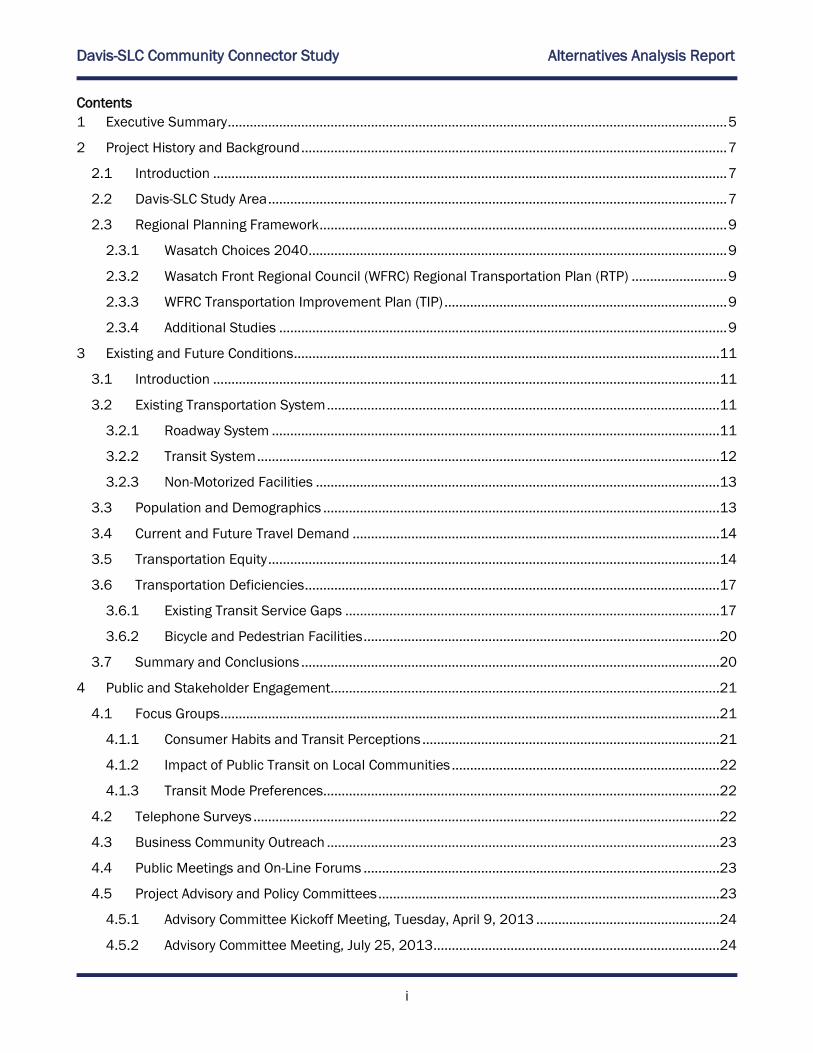
Feature Alternat ive A : Enhanced Bus
Alternat ive B : Bus Rapid
Transi tFrequent Service
to Reduce Passenger
Waiting Times
Service every 15 minutes in the peak
Service every 10minutes in the peak
Transit Signal Priority to Give
Priority to Buses at Intersections
Yes, allowing buses to travel 15% faster through the corridor
Yes, allowing buses to travel 25% faster through the corridor
Improved Buses 40’ buses similar to the 35M Max buses
60’ low-floor buses to hold more passengers and speed boarding times
Dedicated Bus Lanes
No, but some intersection bypass lanes are included
Yes, approximately half of the corridor will include median bus lanes, allowing bus service to function more like TRAX rail service
Stations and Stops
Limited stops with improved bus shelters and amenities
Limited stops with station amenities similar to TRAX stations
Corridor Improvements
Improved bicycle and pedestrian amenities at stations with additional improvements by local jurisdictions
Improved bicycle and pedestrian amenities at stations with greater opportunity for amenity improvements in cooperation with cities
Figure 1: Alternative A Enhanced BusTable 1: Refined Analysis Results
ALTERNATIVESANALYSIS
Representatives from stakeholders in the corridor worked with UTA to develop transit investment alternatives for southern Davis County. Seven initial corridors and four service technologies were screened to determine where transit investment would be most productive.
A project advisory committee chose two corridor and service alternatives for more detailed evaluation: an Enhanced Bus Alternative (Figure 1) and a Bus Rapid Transit Alternative (pictured on Page 5). The two alternatives were refined to allow development of planning-level capital and operating costs; results of this are presented in Table 1. Wasatch Front Regional Council provided future ridership forecasts for the study. A final screening was performed to help identify a Locally Preferred Alternative.
89
15
2
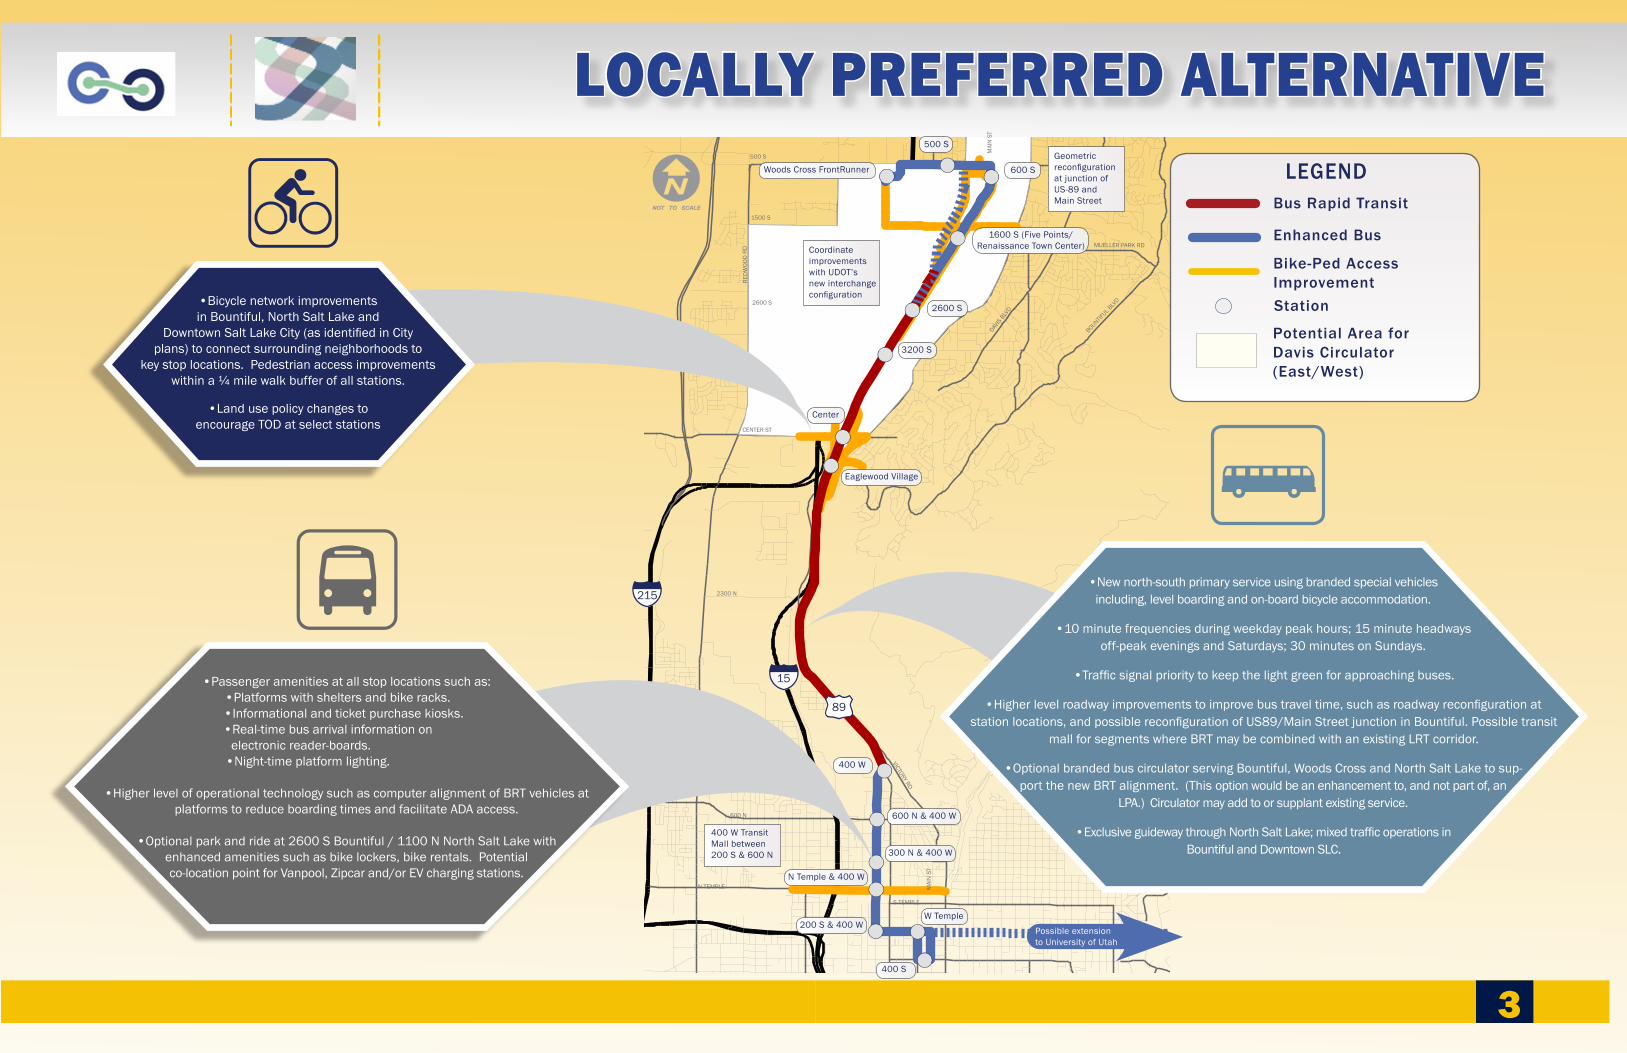
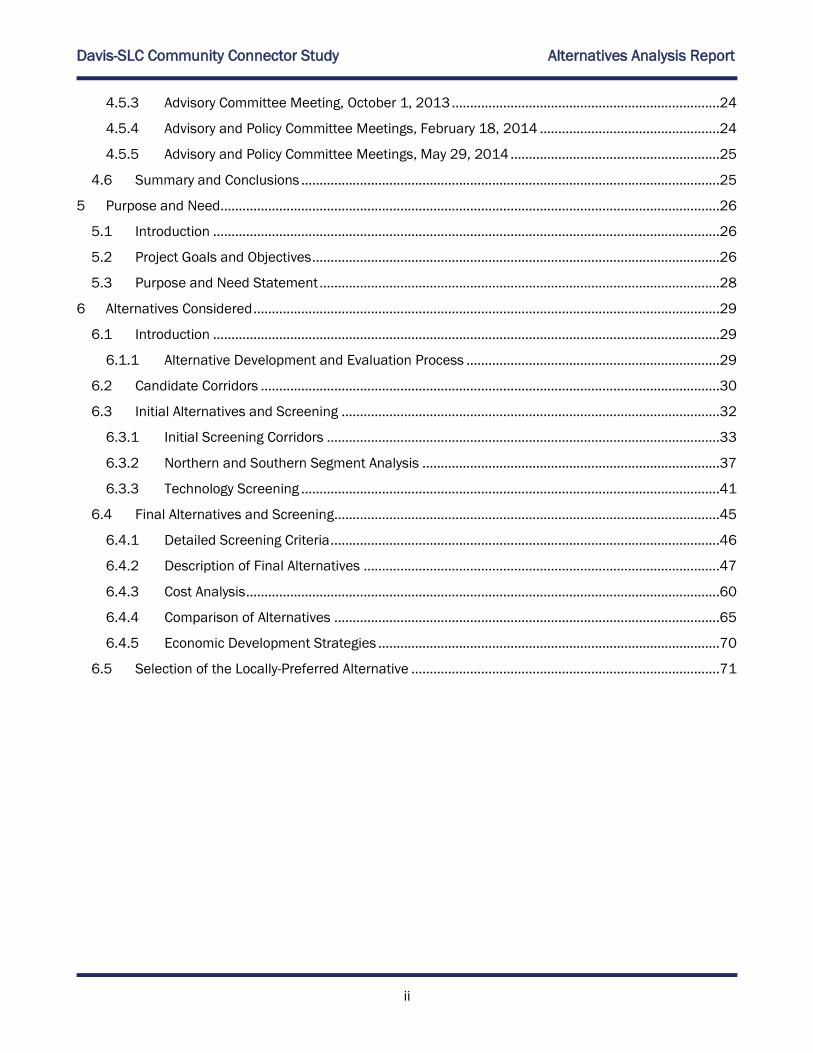
•New north-south primary service using branded special vehicles including, level boarding and on-board bicycle accommodation.
•10 minute frequencies during weekday peak hours; 15 minute headways off-peak evenings and Saturdays; 30 minutes on Sundays.
•Traffic signal priority to keep the light green for approaching buses.
•Higher level roadway improvements to improve bus travel time, such as roadway reconfiguration at station locations, and possible reconfiguration of US89/Main Street junction in Bountiful. Possible transit
mall for segments where BRT may be combined with an existing LRT corridor.
•Optional branded bus circulator serving Bountiful, Woods Cross and North Salt Lake to sup-port the new BRT alignment. (This option would be an enhancement to, and not part of, an
LPA.) Circulator may add to or supplant existing service.
•Exclusive guideway through North Salt Lake; mixed traffic operations in Bountiful and Downtown SLC.
•Passenger amenities at all stop locations such as:•Platforms with shelters and bike racks.•Informational and ticket purchase kiosks.•Real-time bus arrival information on
electronic reader-boards.•Night-time platform lighting.
•Higher level of operational technology such as computer alignment of BRT vehicles at platforms to reduce boarding times and facilitate ADA access.
•Optional park and ride at 2600 S Bountiful / 1100 N North Salt Lake with enhanced amenities such as bike lockers, bike rentals. Potential co-location point for Vanpool, Zipcar and/or EV charging stations.
Woods Cross FrontRunner
Coordinate improvements with UDOT’s new interchange configuration
600 S
2600 S
1600 S (Five Points/Renaissance Town Center)
Geometric reconfiguration at junction of US-89 andMain Street
3200 S
Center
Eaglewood Village
600 N & 400 W
N Temple & 400 W
200 S & 400 WW Temple
400 S
300 N & 400 W
400 W
400 W Transit Mall between 200 S & 600 N
Possible extension to University of Utah
•Bicycle network improvements in Bountiful, North Salt Lake and
Downtown Salt Lake City (as identified in City plans) to connect surrounding neighborhoods to
key stop locations. Pedestrian access improvements within a ¼ mile walk buffer of all stations.
•Land use policy changes to encourage TOD at select stations
LEGEND
LOCALLY PREFERRED ALTERNATIVE500 S
N TEMPLE
S TEMPLE
600 N
VICTORY RD
CENTER ST
DAVIS
BLVD
RED
WOO
D R
D
500 S
1500 S
MUELLER PARK RD
2300 N
BOUNTIFUL B
LVD2600 S
Bus Rapid Transit
Enhanced Bus
Bike-Ped Access Improvement
Potential Area for Davis Circulator (East/West)
Station
215
15
89
MAI
N S
T
MAI
N S
T
3
ALTERNATIVESANALYSIS
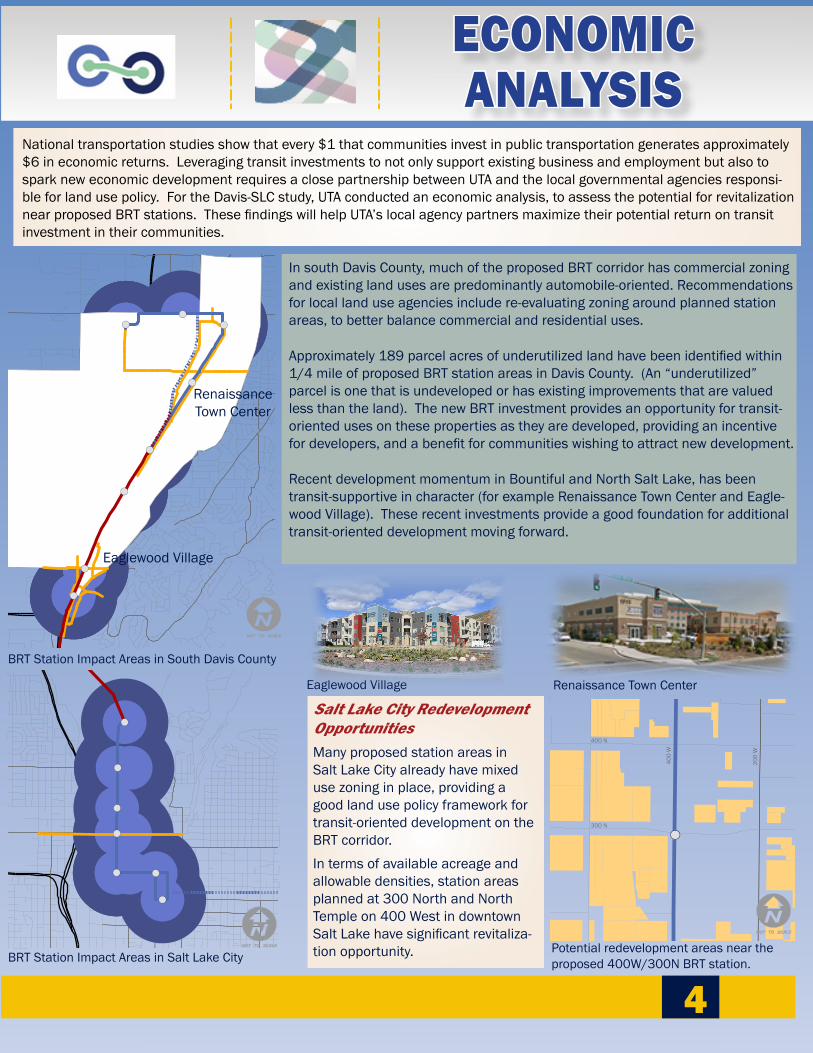
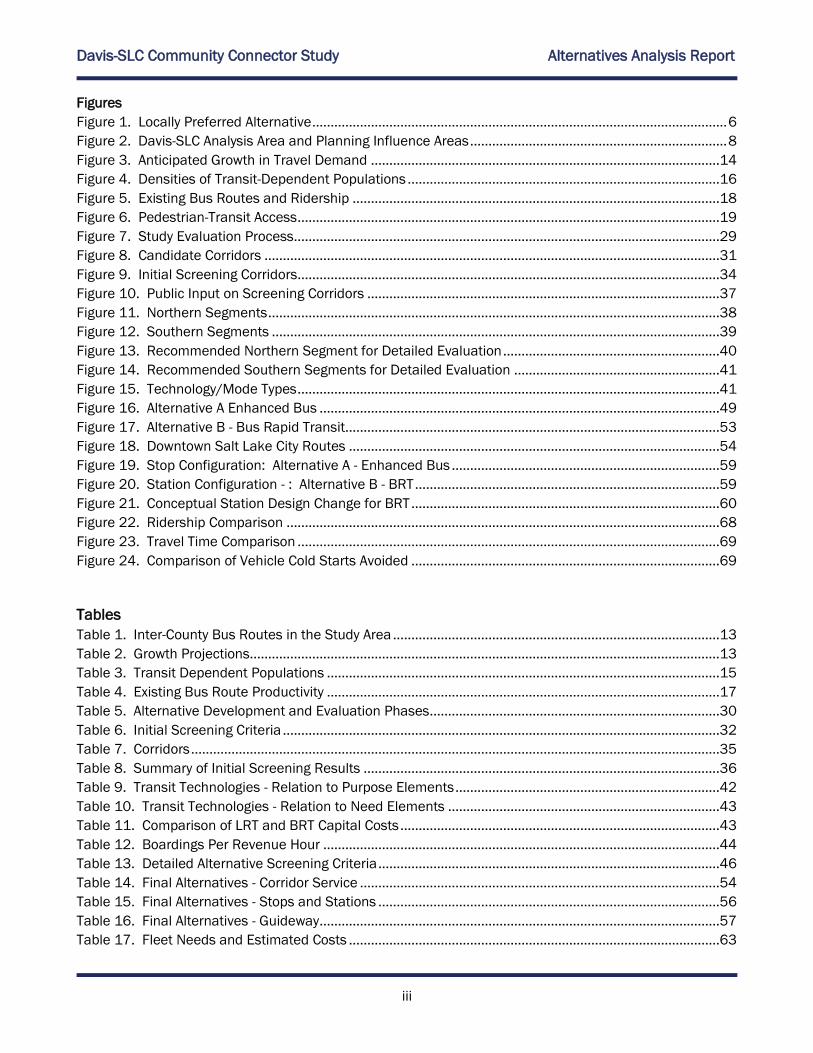
National transportation studies show that every $1 that communities invest in public transportation generates approximately $6 in economic returns. Leveraging transit investments to not only support existing business and employment but also to spark new economic development requires a close partnership between UTA and the local governmental agencies responsi-ble for land use policy. For the Davis-SLC study, UTA conducted an economic analysis, to assess the potential for revitalization near proposed BRT stations. These findings will help UTA’s local agency partners maximize their potential return on transit investment in their communities.
ECONOMICANALYSIS
Salt Lake City Redevelopment OpportunitiesMany proposed station areas in Salt Lake City already have mixed use zoning in place, providing a good land use policy framework for transit-oriented development on the BRT corridor.
In terms of available acreage and allowable densities, station areas planned at 300 North and North Temple on 400 West in downtown Salt Lake have significant revitaliza-tion opportunity.
In south Davis County, much of the proposed BRT corridor has commercial zoning and existing land uses are predominantly automobile-oriented. Recommendations for local land use agencies include re-evaluating zoning around planned station areas, to better balance commercial and residential uses.
Approximately 189 parcel acres of underutilized land have been identified within 1/4 mile of proposed BRT station areas in Davis County. (An “underutilized” parcel is one that is undeveloped or has existing improvements that are valued less than the land). The new BRT investment provides an opportunity for transit-oriented uses on these properties as they are developed, providing an incentive for developers, and a benefit for communities wishing to attract new development.
Recent development momentum in Bountiful and North Salt Lake, has been transit-supportive in character (for example Renaissance Town Center and Eagle-wood Village). These recent investments provide a good foundation for additional transit-oriented development moving forward.
4
Renaissance Town CenterEaglewood Village
BRT Station Impact Areas in South Davis County
BRT Station Impact Areas in Salt Lake CityPotential redevelopment areas near the proposed 400W/300N BRT station.
300 N
400 N
200
W
400
W
Eaglewood Village
RenaissanceTown Center
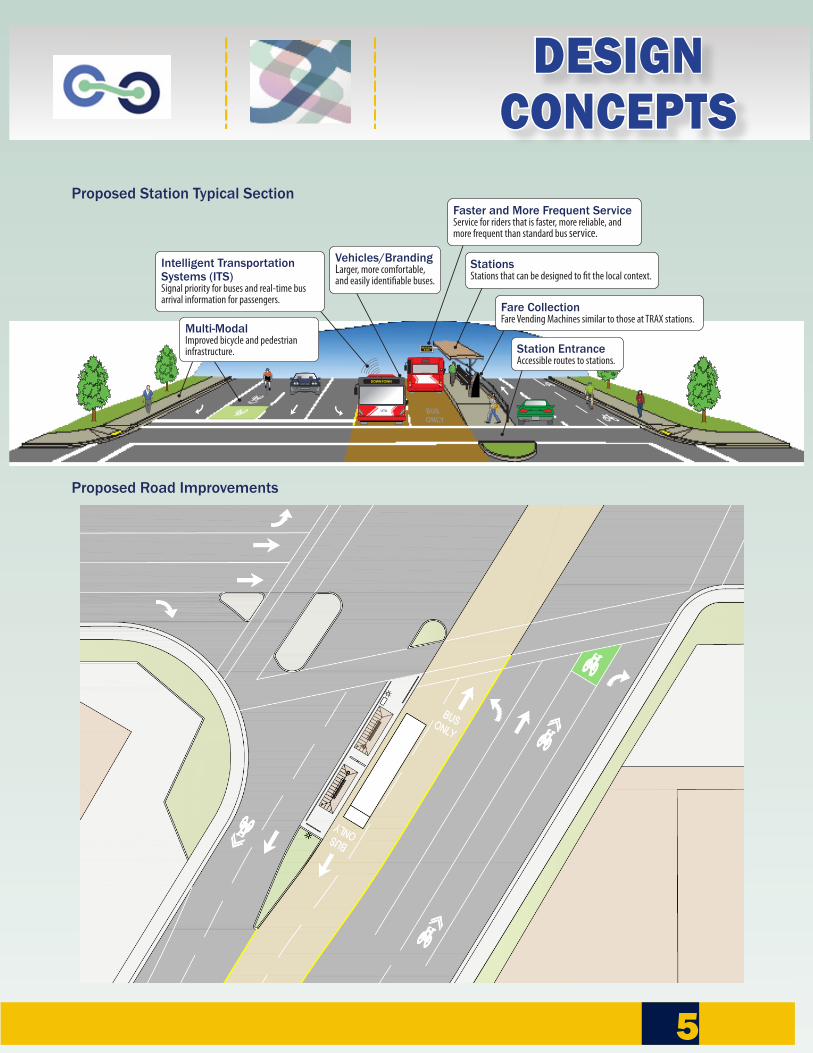
Proposed Station Typical Section
DESIGNCONCEPTS
Proposed Road Improvements
DOWNTOWN
UTA
NEXT BUS8 MIN
Multi-ModalImproved bicycle and pedestrian infrastructure.
StationsStations that can be designed to fit the local context.
Faster and More Frequent ServiceService for riders that is faster, more reliable, and more frequent than standard bus service.
Fare CollectionFare Vending Machines similar to those at TRAX stations.
Station EntranceAccessible routes to stations.
Vehicles/BrandingLarger, more comfortable, and easily identifiable buses.
Intelligent Transportation Systems (ITS)Signal priority for buses and real-time bus arrival information for passengers.
5
Davis-SLC Community Connector Study
ALTERNATIVES ANALYSIS
REPORT August 2014

Davis-SLC Community Connector Study Alternatives Analysis Report
i
Contents
1 Executive Summary ........................................................................................................................................ 5
2 Project History and Background .................................................................................................................... 7
2.1 Introduction ............................................................................................................................................ 7
2.2 Davis-SLC Study Area ............................................................................................................................. 7
2.3 Regional Planning Framework ............................................................................................................... 9
2.3.1 Wasatch Choices 2040 .................................................................................................................. 9
2.3.2 Wasatch Front Regional Council (WFRC) Regional Transportation Plan (RTP) .......................... 9
2.3.3 WFRC Transportation Improvement Plan (TIP) ............................................................................. 9
2.3.4 Additional Studies .......................................................................................................................... 9
3 Existing and Future Conditions ....................................................................................................................11
3.1 Introduction ..........................................................................................................................................11
3.2 Existing Transportation System ...........................................................................................................11
3.2.1 Roadway System ..........................................................................................................................11
3.2.2 Transit System ..............................................................................................................................12
3.2.3 Non-Motorized Facilities ..............................................................................................................13
3.3 Population and Demographics ............................................................................................................13
3.4 Current and Future Travel Demand ....................................................................................................14
3.5 Transportation Equity ...........................................................................................................................14
3.6 Transportation Deficiencies .................................................................................................................17
3.6.1 Existing Transit Service Gaps ......................................................................................................17
3.6.2 Bicycle and Pedestrian Facilities .................................................................................................20
3.7 Summary and Conclusions ..................................................................................................................20
4 Public and Stakeholder Engagement ..........................................................................................................21
4.1 Focus Groups ........................................................................................................................................21
4.1.1 Consumer Habits and Transit Perceptions .................................................................................21
4.1.2 Impact of Public Transit on Local Communities .........................................................................22
4.1.3 Transit Mode Preferences............................................................................................................22
4.2 Telephone Surveys ...............................................................................................................................22
4.3 Business Community Outreach ...........................................................................................................23
4.4 Public Meetings and On-Line Forums .................................................................................................23
4.5 Project Advisory and Policy Committees .............................................................................................23
4.5.1 Advisory Committee Kickoff Meeting, Tuesday, April 9, 2013 ..................................................24
4.5.2 Advisory Committee Meeting, July 25, 2013 ..............................................................................24
Davis-SLC Community Connector Study Alternatives Analysis Report
ii
4.5.3 Advisory Committee Meeting, October 1, 2013 .........................................................................24
4.5.4 Advisory and Policy Committee Meetings, February 18, 2014 .................................................24
4.5.5 Advisory and Policy Committee Meetings, May 29, 2014 .........................................................25
4.6 Summary and Conclusions ..................................................................................................................25
5 Purpose and Need ........................................................................................................................................26
5.1 Introduction ..........................................................................................................................................26
5.2 Project Goals and Objectives ...............................................................................................................26
5.3 Purpose and Need Statement .............................................................................................................28
6 Alternatives Considered ...............................................................................................................................29
6.1 Introduction ..........................................................................................................................................29
6.1.1 Alternative Development and Evaluation Process .....................................................................29
6.2 Candidate Corridors .............................................................................................................................30
6.3 Initial Alternatives and Screening .......................................................................................................32
6.3.1 Initial Screening Corridors ...........................................................................................................33
6.3.2 Northern and Southern Segment Analysis .................................................................................37
6.3.3 Technology Screening ..................................................................................................................41
6.4 Final Alternatives and Screening .........................................................................................................45
6.4.1 Detailed Screening Criteria ..........................................................................................................46
6.4.2 Description of Final Alternatives .................................................................................................47
6.4.3 Cost Analysis .................................................................................................................................60
6.4.4 Comparison of Alternatives .........................................................................................................65
6.4.5 Economic Development Strategies .............................................................................................70
6.5 Selection of the Locally-Preferred Alternative ....................................................................................71
Davis-SLC Community Connector Study Alternatives Analysis Report
iii
Figures
Figure 1. Locally Preferred Alternative ................................................................................................................. 6
Figure 2. Davis-SLC Analysis Area and Planning Influence Areas ...................................................................... 8
Figure 3. Anticipated Growth in Travel Demand ...............................................................................................14
Figure 4. Densities of Transit-Dependent Populations .....................................................................................16
Figure 5. Existing Bus Routes and Ridership ....................................................................................................18
Figure 6. Pedestrian-Transit Access ...................................................................................................................19
Figure 7. Study Evaluation Process ....................................................................................................................29
Figure 8. Candidate Corridors ............................................................................................................................31
Figure 9. Initial Screening Corridors ...................................................................................................................34
Figure 10. Public Input on Screening Corridors ................................................................................................37
Figure 11. Northern Segments ...........................................................................................................................38
Figure 12. Southern Segments ..........................................................................................................................39
Figure 13. Recommended Northern Segment for Detailed Evaluation ...........................................................40
Figure 14. Recommended Southern Segments for Detailed Evaluation ........................................................41
Figure 15. Technology/Mode Types ...................................................................................................................41
Figure 16. Alternative A Enhanced Bus .............................................................................................................49
Figure 17. Alternative B - Bus Rapid Transit ......................................................................................................53
Figure 18. Downtown Salt Lake City Routes .....................................................................................................54
Figure 19. Stop Configuration: Alternative A - Enhanced Bus .........................................................................59
Figure 20. Station Configuration - : Alternative B - BRT ...................................................................................59
Figure 21. Conceptual Station Design Change for BRT ....................................................................................60
Figure 22. Ridership Comparison ......................................................................................................................68
Figure 23. Travel Time Comparison ...................................................................................................................69
Figure 24. Comparison of Vehicle Cold Starts Avoided ....................................................................................69
Tables
Table 1. Inter-County Bus Routes in the Study Area .........................................................................................13
Table 2. Growth Projections................................................................................................................................13
Table 3. Transit Dependent Populations ...........................................................................................................15
Table 4. Existing Bus Route Productivity ...........................................................................................................17
Table 5. Alternative Development and Evaluation Phases ...............................................................................30
Table 6. Initial Screening Criteria .......................................................................................................................32
Table 7. Corridors ................................................................................................................................................35
Table 8. Summary of Initial Screening Results .................................................................................................36
Table 9. Transit Technologies - Relation to Purpose Elements ........................................................................42
Table 10. Transit Technologies - Relation to Need Elements ..........................................................................43
Table 11. Comparison of LRT and BRT Capital Costs .......................................................................................43
Table 12. Boardings Per Revenue Hour ............................................................................................................44
Table 13. Detailed Alternative Screening Criteria .............................................................................................46
Table 14. Final Alternatives - Corridor Service ..................................................................................................54
Table 15. Final Alternatives - Stops and Stations .............................................................................................56
Table 16. Final Alternatives - Guideway .............................................................................................................57
Table 17. Fleet Needs and Estimated Costs .....................................................................................................63
Davis-SLC Community Connector Study Alternatives Analysis Report
iv
Table 18. Alternative A - Enhanced Bus Operating Assumptions and Costs ...................................................64
Table 19. Alternative B - BRT Operating Assumptions and Costs ....................................................................64
Table 20. Summary of Operating and Maintenance Costs ..............................................................................65
Table 21. Service Level Comparison..................................................................................................................65
Table 22. Comparison of Capital Costs .............................................................................................................66
Table 23. Annualized Cost Comparison .............................................................................................................67
Table 24. Cost Per Ride Comparison .................................................................................................................67
Table 25. Summary of Planning Level Costs for LPA Selection .......................................................................71
Table 26. Summary of Technical Advisory Committee Ratings ........................................................................72
Appendices
A – Needs Assessment Technical Memorandum
B – Evaluation Criteria Technical Memorandum
C – Initial Corridor and Technology Screening Technical Memorandum
D – Public Involvement
D-1 Public Involvement Plan
D-2 Public Comment Report (The Langdon Group)
D-3 Summary of Outreach Activities (UTA)
D-4 Focus Group Summary (The Langdon Group)
D-5 Telephone Survey Summary (The Langdon Group)
E – Assessment of Economic Development Potential
F – Operations and Maintenance (O&M) and Fleet Costs Technical Memorandum
F-1 OPEX Estimate
F-2 Bus Calculations
F-3 Operating and Maintenance Cost Estimates for Alternatives A and B
F-4 Operating and Maintenance Cost Estimates for Circulator
G – Infrastructure Costs Technical Memorandum
H – Service and Operations Analysis

Davis-SLC Community Connector Study Alternatives Analysis Report
5
1 EXECUTIVE SUMMARY
Utah Transit Authority (UTA), in partnership with Bountiful, North Salt Lake, Salt Lake City, Davis
County, and WFRC conducted an analysis of transit investment alternatives to connect
communities in south Davis County with downtown Salt Lake City. The “Davis-SLC Community
Connector Study” was undertaken to identify potential transit solutions to:
Increase mobility, connectivity and travel choices,
Support local and regional land use initiatives, and
Promote economic development.
A robust stakeholder and community engagement process was combined with technical analysis
to establish goals and objectives for a new transit service corridor, and narrow the universe of
alternatives down to two final alternatives – Enhanced Bus and Bus Rapid Transit (BRT).
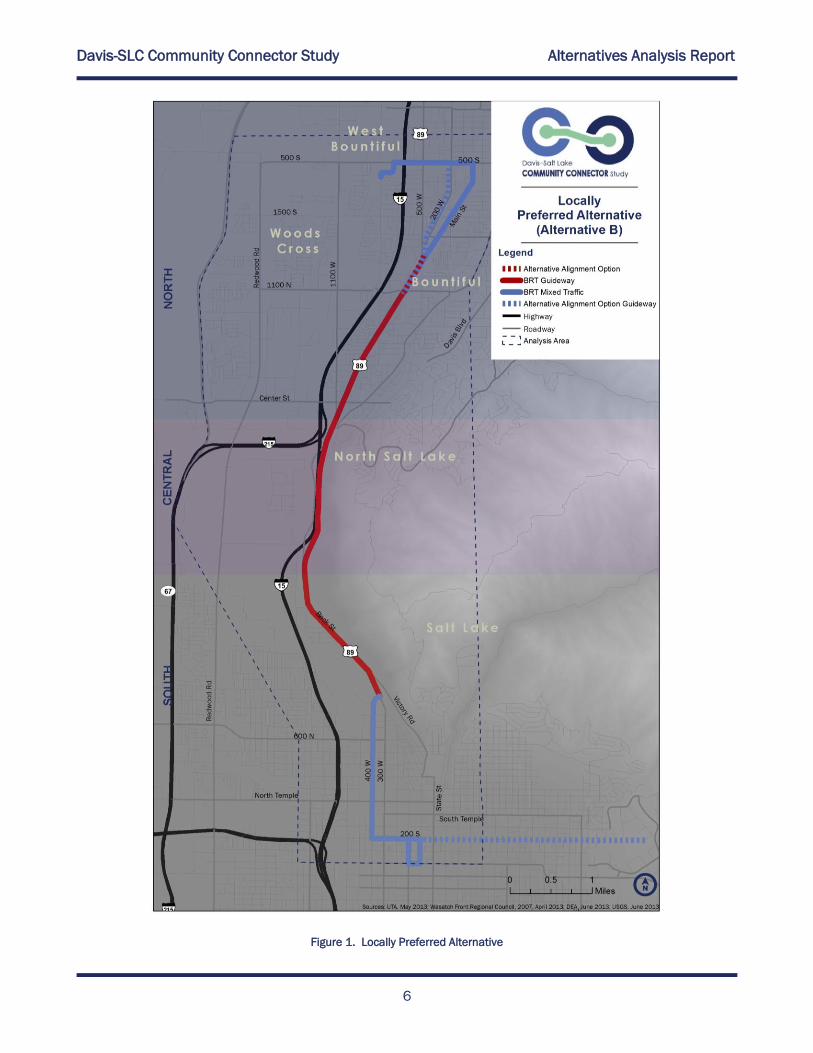
The resulting Locally Preferred Alternative (LPA), BRT, will operate in mixed traffic through
downtown Salt Lake City and Bountiful, and within an exclusive guideway section through North
Salt Lake in the central portion of the study area. The LPA is depicted in Figure 1. Additional
characteristics of the LPA include:
Service frequencies and infrastructure designed to make travel by transit an attractive
option of choice:
o 10 minute weekday peak headways.
o 15 minute headways off-peak, weekends and Saturdays.
o 30 minute service on Sundays.
o Signal priority for BRT vehicles.
Passenger amenities to improve comfort, safety and convenience:
o Platforms with shelters and bike racks at all station locations.
o Informational and ticket purchase kiosks.
o Real-time bus arrival information on electronic reader-boards.
o Night-time platform lighting.
o Modern operational technology (such as computer alignment of BRT vehicles
at platforms to reduce boarding times).
Strategies to leverage transit investment in the Davis-SLC Community Connector line
for local and regional economic development:
o Branding and special marketing program for new BRT service.
o Land use policy changes to encourage transit-oriented development at new
station locations.
With the completion of this Alternatives Analysis (AA), next steps for UTA will include securing
funding for environmental and preliminary engineering phases of the project development
process, and working with local land use jurisdictions on supportive zoning and policy changes.
Davis-SLC Community Connector Study Alternatives Analysis Report
6
Figure 1. Locally Preferred Alternative
Davis-SLC Community Connector Study Alternatives Analysis Report
7
2 PROJECT HISTORY AND BACKGROUND
2.1 INTRODUCTION
Utah Transit Authority (UTA) partnered with other city, county and regional agencies on an analysis
of transit investment alternatives to connect communities in south Davis County with downtown
Salt Lake City. The “Davis-SLC Community Connector Study” was undertaken to identify potential
transit solutions to:
Increase mobility, connectivity and travel choices,
Support local and regional land use initiatives, and
Promote economic development.
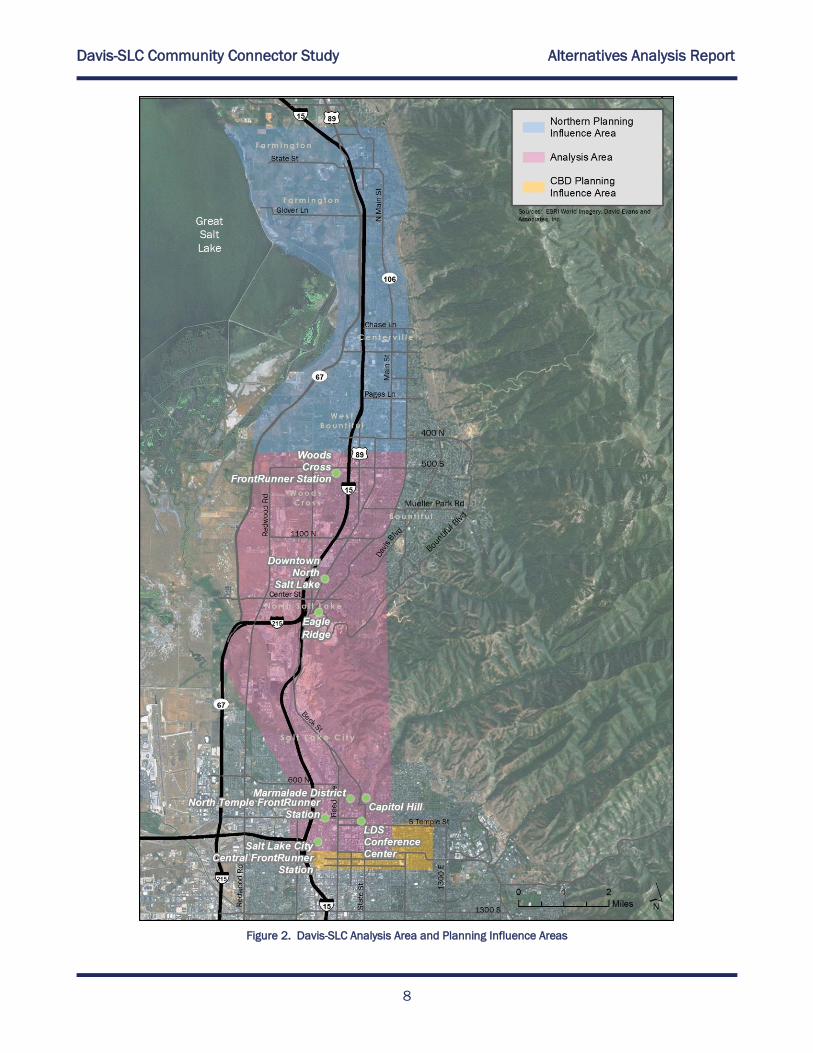
2.2 DAVIS-SLC STUDY AREA
The study area includes the northern portion of Salt Lake City, portions of North Salt Lake,
Bountiful and Woods Cross, as well as unincorporated areas of Davis and Salt Lake counties.
Adjacent planning influence areas were also identified to consider north/south travel needs as
they affect the primary study area. Downtown Salt Lake City’s Central Business District (CBD),
which has the region’s highest employment and population densities, is adjacent to and
contiguous with the study area, providing an opportunity to integrate a new transit corridor with
existing transportation systems and regional connection points. Additionally, while not included in
the specific analysis area for this study, communities to the north, including Centerville and
Farmington were considered as a contributing travel shed for the study area.
Major activity nodes within the study area include:
Temple Square and the LDS Conference Center
Marmalade District
Capitol Hill
Eagle Ridge
Downtown North Salt Lake
FrontRunner Commuter Rail Stations at Woods Cross and in Downtown Salt Lake City
Figure 2 shows the analysis area in relation to adjoining planning influence areas.
Davis-SLC Community Connector Study Alternatives Analysis Report
8
Figure 2. Davis-SLC Analysis Area and Planning Influence Areas
Davis-SLC Community Connector Study Alternatives Analysis Report
9
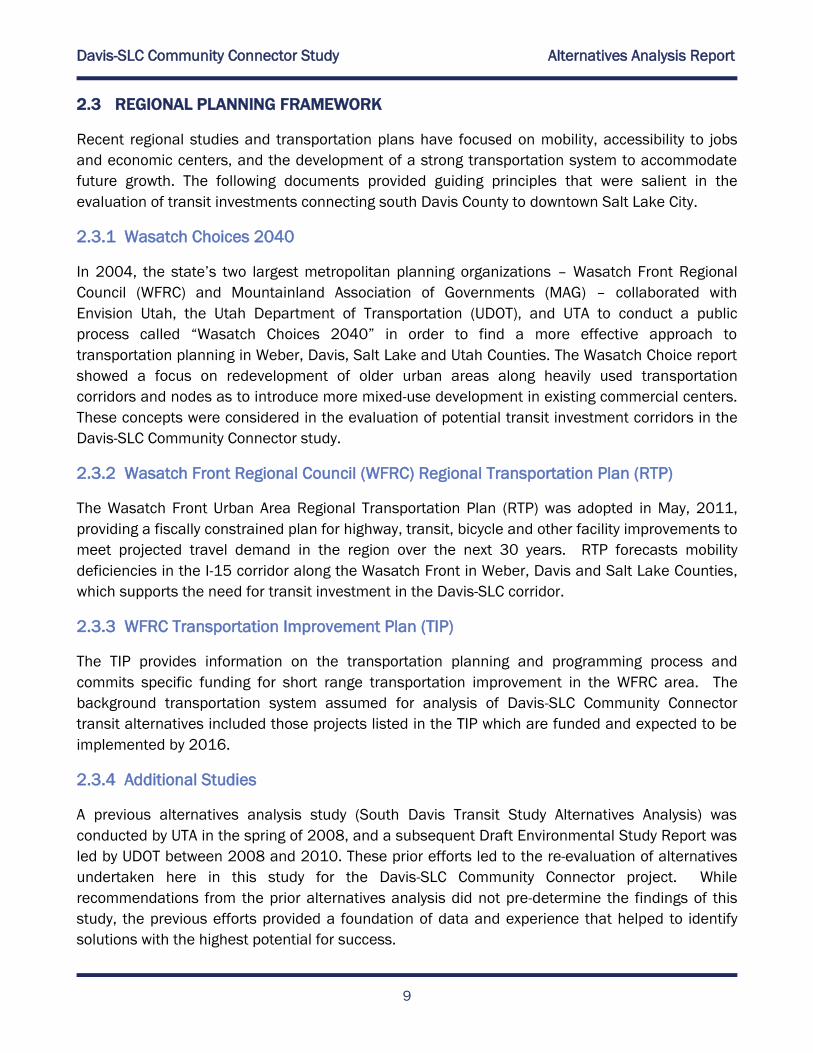
2.3 REGIONAL PLANNING FRAMEWORK
Recent regional studies and transportation plans have focused on mobility, accessibility to jobs
and economic centers, and the development of a strong transportation system to accommodate
future growth. The following documents provided guiding principles that were salient in the
evaluation of transit investments connecting south Davis County to downtown Salt Lake City.
2.3.1 Wasatch Choices 2040
In 2004, the state’s two largest metropolitan planning organizations – Wasatch Front Regional
Council (WFRC) and Mountainland Association of Governments (MAG) – collaborated with
Envision Utah, the Utah Department of Transportation (UDOT), and UTA to conduct a public
process called “Wasatch Choices 2040” in order to find a more effective approach to
transportation planning in Weber, Davis, Salt Lake and Utah Counties. The Wasatch Choice report
showed a focus on redevelopment of older urban areas along heavily used transportation
corridors and nodes as to introduce more mixed-use development in existing commercial centers.
These concepts were considered in the evaluation of potential transit investment corridors in the
Davis-SLC Community Connector study.
2.3.2 Wasatch Front Regional Council (WFRC) Regional Transportation Plan (RTP)
The Wasatch Front Urban Area Regional Transportation Plan (RTP) was adopted in May, 2011,
providing a fiscally constrained plan for highway, transit, bicycle and other facility improvements to
meet projected travel demand in the region over the next 30 years. RTP forecasts mobility
deficiencies in the I-15 corridor along the Wasatch Front in Weber, Davis and Salt Lake Counties,
which supports the need for transit investment in the Davis-SLC corridor.
2.3.3 WFRC Transportation Improvement Plan (TIP)
The TIP provides information on the transportation planning and programming process and
commits specific funding for short range transportation improvement in the WFRC area. The
background transportation system assumed for analysis of Davis-SLC Community Connector
transit alternatives included those projects listed in the TIP which are funded and expected to be
implemented by 2016.
2.3.4 Additional Studies
A previous alternatives analysis study (South Davis Transit Study Alternatives Analysis) was
conducted by UTA in the spring of 2008, and a subsequent Draft Environmental Study Report was
led by UDOT between 2008 and 2010. These prior efforts led to the re-evaluation of alternatives
undertaken here in this study for the Davis-SLC Community Connector project. While
recommendations from the prior alternatives analysis did not pre-determine the findings of this
study, the previous efforts provided a foundation of data and experience that helped to identify
solutions with the highest potential for success.
Davis-SLC Community Connector Study Alternatives Analysis Report
10
Additional regional studies reviewed as background for the Davis-SLC Community Connector Study
included:
Wasatch Mobility Management Study (February 2010)
Legacy Parkway Supplemental Environmental Impact Statement/Reevaluation
South Davis Transit Needs Assessment (2005)
Utah’s Unified Transportation Plan 2011 – 2040
These documents are further summarized in the Needs Assessment technical memorandum
prepared for the project (Appendix A).
Davis-SLC Community Connector Study Alternatives Analysis Report
11
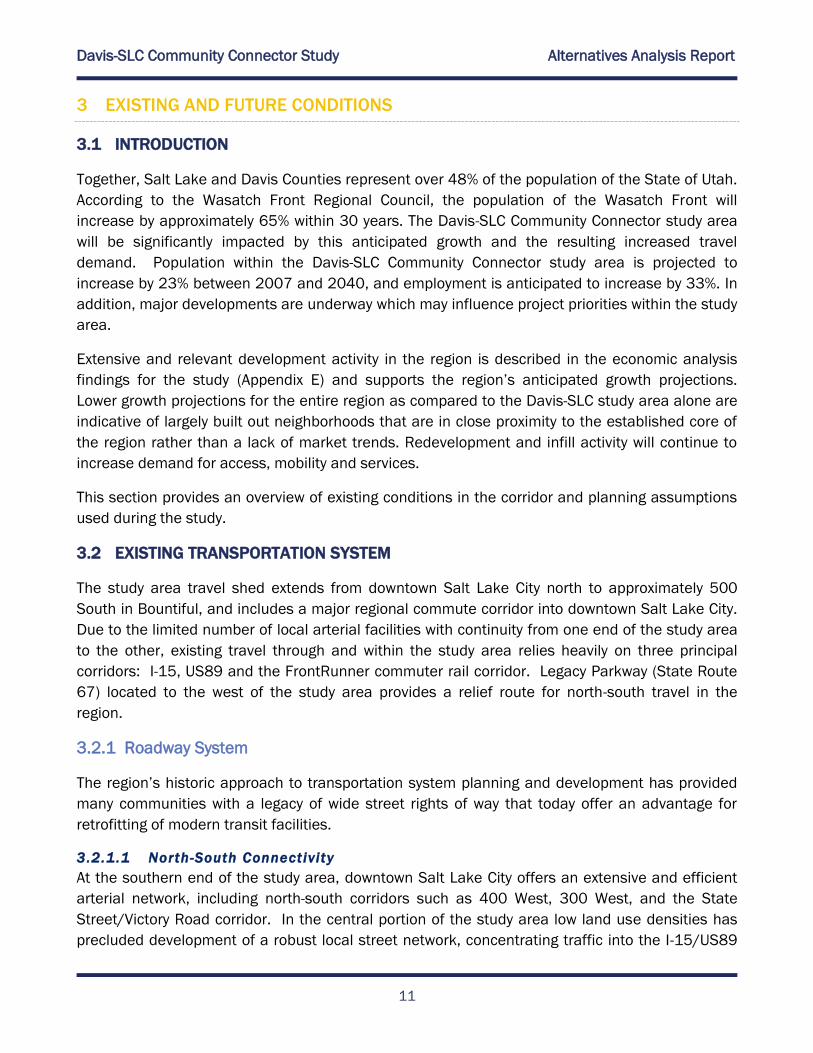
3 EXISTING AND FUTURE CONDITIONS
3.1 INTRODUCTION
Together, Salt Lake and Davis Counties represent over 48% of the population of the State of Utah.
According to the Wasatch Front Regional Council, the population of the Wasatch Front will
increase by approximately 65% within 30 years. The Davis-SLC Community Connector study area
will be significantly impacted by this anticipated growth and the resulting increased travel
demand. Population within the Davis-SLC Community Connector study area is projected to
increase by 23% between 2007 and 2040, and employment is anticipated to increase by 33%. In
addition, major developments are underway which may influence project priorities within the study
area.
Extensive and relevant development activity in the region is described in the economic analysis
findings for the study (Appendix E) and supports the region’s anticipated growth projections.
Lower growth projections for the entire region as compared to the Davis-SLC study area alone are
indicative of largely built out neighborhoods that are in close proximity to the established core of
the region rather than a lack of market trends. Redevelopment and infill activity will continue to
increase demand for access, mobility and services.
This section provides an overview of existing conditions in the corridor and planning assumptions
used during the study.
3.2 EXISTING TRANSPORTATION SYSTEM
The study area travel shed extends from downtown Salt Lake City north to approximately 500
South in Bountiful, and includes a major regional commute corridor into downtown Salt Lake City.
Due to the limited number of local arterial facilities with continuity from one end of the study area
to the other, existing travel through and within the study area relies heavily on three principal
corridors: I-15, US89 and the FrontRunner commuter rail corridor. Legacy Parkway (State Route
67) located to the west of the study area provides a relief route for north-south travel in the
region.
3.2.1 Roadway System
The region’s historic approach to transportation system planning and development has provided
many communities with a legacy of wide street rights of way that today offer an advantage for
retrofitting of modern transit facilities.
3.2.1.1 North-South Connectivity
At the southern end of the study area, downtown Salt Lake City offers an extensive and efficient
arterial network, including north-south corridors such as 400 West, 300 West, and the State
Street/Victory Road corridor. In the central portion of the study area low land use densities has
precluded development of a robust local street network, concentrating traffic into the I-15/US89
Davis-SLC Community Connector Study Alternatives Analysis Report
12
corridors. Through North Salt Lake, US89 has developed as a five-lane automobile-oriented
commercial arterial, and in Bountiful, the portion of Main Street within the study area is three to
five-lanes with a similar commercial character. Redwood Road, in the eastern portion of North
Salt Lake and Woods Cross is growing in importance as a regional north-south facility, as the
surrounding area attracts new residential development.
3.2.1.2 East -West Connectivity
The I-15 and FrontRunner corridors are both barriers to east-west connectivity in the study area
and east-west travel tends to be concentrated at freeway under or overcrossings. Notable east-
west street connectors are North Temple and 600 North in downtown Salt Lake City; Center Street
in North Salt Lake; 2600 South, 1500 South and 500 South in Bountiful.
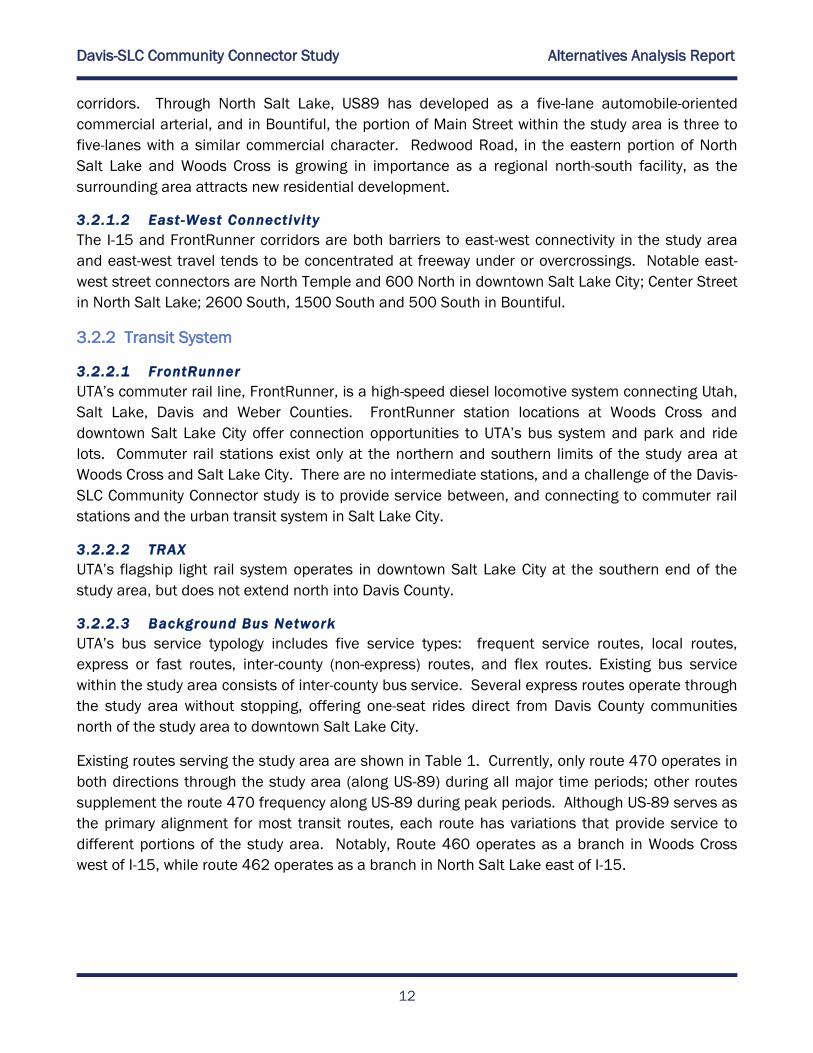
3.2.2 Transit System
3.2.2.1 FrontRunner
UTA’s commuter rail line, FrontRunner, is a high-speed diesel locomotive system connecting Utah,
Salt Lake, Davis and Weber Counties. FrontRunner station locations at Woods Cross and
downtown Salt Lake City offer connection opportunities to UTA’s bus system and park and ride
lots. Commuter rail stations exist only at the northern and southern limits of the study area at
Woods Cross and Salt Lake City. There are no intermediate stations, and a challenge of the Davis-
SLC Community Connector study is to provide service between, and connecting to commuter rail
stations and the urban transit system in Salt Lake City.
3.2.2.2 TRAX
UTA’s flagship light rail system operates in downtown Salt Lake City at the southern end of the
study area, but does not extend north into Davis County.
3.2.2.3 Background Bus Network
UTA’s bus service typology includes five service types: frequent service routes, local routes,
express or fast routes, inter-county (non-express) routes, and flex routes. Existing bus service
within the study area consists of inter-county bus service. Several express routes operate through
the study area without stopping, offering one-seat rides direct from Davis County communities
north of the study area to downtown Salt Lake City.
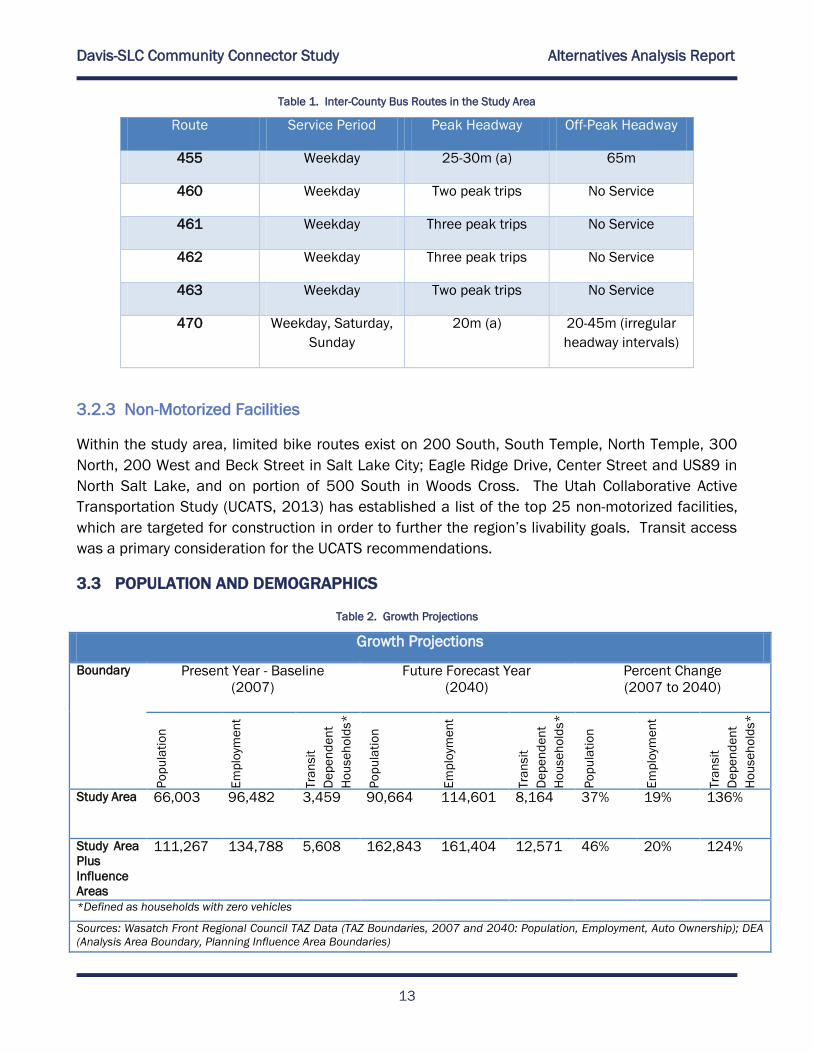
Existing routes serving the study area are shown in Table 1. Currently, only route 470 operates in
both directions through the study area (along US-89) during all major time periods; other routes
supplement the route 470 frequency along US-89 during peak periods. Although US-89 serves as
the primary alignment for most transit routes, each route has variations that provide service to
different portions of the study area. Notably, Route 460 operates as a branch in Woods Cross
west of I-15, while route 462 operates as a branch in North Salt Lake east of I-15.
Davis-SLC Community Connector Study Alternatives Analysis Report
13
Table 1. Inter-County Bus Routes in the Study Area
Route Service Period Peak Headway Off-Peak Headway
455 Weekday 25-30m (a) 65m
460 Weekday Two peak trips No Service
461 Weekday Three peak trips No Service
462 Weekday Three peak trips No Service
463 Weekday Two peak trips No Service
470 Weekday, Saturday,
Sunday
20m (a) 20-45m (irregular
headway intervals)
3.2.3 Non-Motorized Facilities
Within the study area, limited bike routes exist on 200 South, South Temple, North Temple, 300
North, 200 West and Beck Street in Salt Lake City; Eagle Ridge Drive, Center Street and US89 in
North Salt Lake, and on portion of 500 South in Woods Cross. The Utah Collaborative Active
Transportation Study (UCATS, 2013) has established a list of the top 25 non-motorized facilities,
which are targeted for construction in order to further the region’s livability goals. Transit access
was a primary consideration for the UCATS recommendations.
3.3 POPULATION AND DEMOGRAPHICS
Table 2. Growth Projections
Growth Projections
Boundary Present Year - Baseline
(2007)
Future Forecast Year
(2040)
Percent Change
(2007 to 2040)
Po
pu
lati
on
Em
plo
yme
nt
Tra
nsit
De
pe
nd
en
t
Ho
use
ho
lds*
Po
pu
lati
on
Em
plo
yme
nt
Tra
nsit
De
pe
nd
en
t
Ho
use
ho
lds*
Po
pu
lati
on
Em
plo
yme
nt
Tra
nsit
De
pe
nd
en
t
Ho
use
ho
lds*
Study Area 66,003 96,482 3,459 90,664 114,601 8,164 37% 19% 136%
Study Area
Plus
Influence
Areas
111,267 134,788 5,608 162,843 161,404 12,571 46% 20% 124%
*Defined as households with zero vehicles
Sources: Wasatch Front Regional Council TAZ Data (TAZ Boundaries, 2007 and 2040: Population, Employment, Auto Ownership); DEA
(Analysis Area Boundary, Planning Influence Area Boundaries)
Davis-SLC Community Connector Study Alternatives Analysis Report
14
3.4 CURRENT AND FUTURE TRAVEL DEMAND
A review of 2009 Data from WFRC’s regional travel demand model indicated the following major
travel findings related to the study area:
Approximately half of all trips originating within the study area are destined to other
locations within the study area (53%)
Approximately 12% of trips originating with the study area are destined to Salt Lake City
Moderate travel demand to the University District in Salt Lake City (6%)
Moderate travel demand to other areas of Salt Lake County (outside of Salt Lake City)
(10%)
Moderate travel demand between the study area and the planning influence area to
the north (7%)
Minimal travel demand to areas north of Farmington (<1%)
Minimal travel demand south to Utah County (<1%)
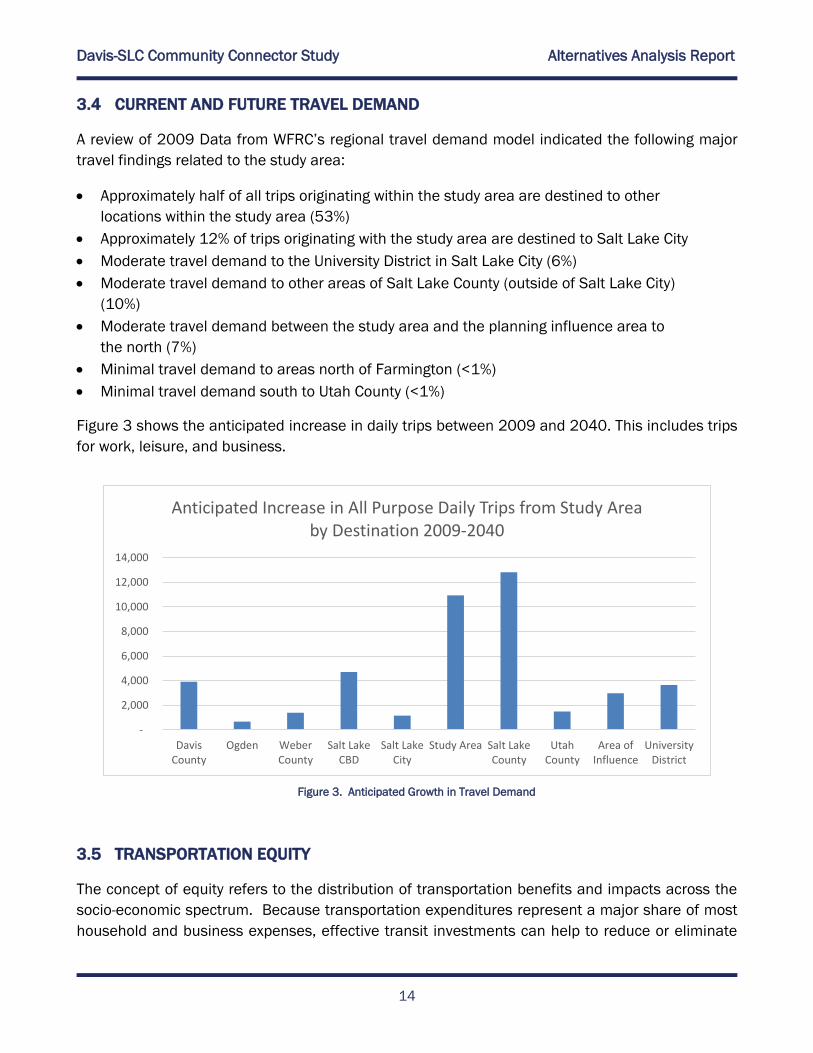
Figure 3 shows the anticipated increase in daily trips between 2009 and 2040. This includes trips
for work, leisure, and business.
3.5 TRANSPORTATION EQUITY
The concept of equity refers to the distribution of transportation benefits and impacts across the
socio-economic spectrum. Because transportation expenditures represent a major share of most
household and business expenses, effective transit investments can help to reduce or eliminate
Figure 3. Anticipated Growth in Travel Demand
-
2,000
4,000
6,000
8,000
10,000
12,000
14,000
DavisCounty
Ogden WeberCounty
Salt LakeCBD
Salt LakeCity
Study Area Salt LakeCounty
UtahCounty
Area ofInfluence
UniversityDistrict
Anticipated Increase in All Purpose Daily Trips from Study Area by Destination 2009-2040
Davis-SLC Community Connector Study Alternatives Analysis Report
15
disparities in accessibility, mobility, and economic factors between transportation-disadvantaged
populations and non-disadvantaged populations.
To successfully compete for federal funding within the Federal Transit Administration’s (FTA)
capital funding programs, transit projects must provide benefits for transit-dependent populations,
which FTA defines as zero-vehicle households. When compared to peer metropolitan areas, the
greater Salt Lake City metropolitan area ranks second in the nation for transit coverage and job
accessibility for zero-vehicle households.1 Within the Davis-SLC Community Connector study area,
however, existing local bus service lacks adequate frequency and amenities to provide reliable
transportation for households without access to an automobile.
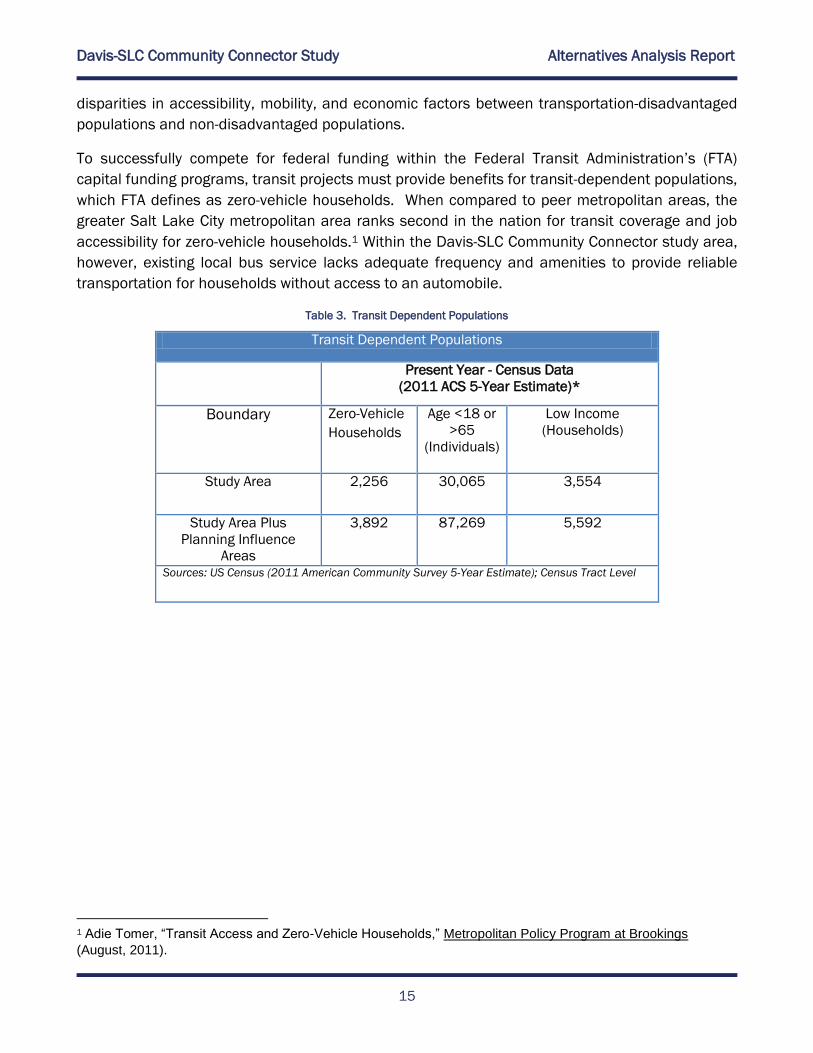
Table 3. Transit Dependent Populations
Transit Dependent Populations
Present Year - Census Data
(2011 ACS 5-Year Estimate)*
Boundary Zero-Vehicle
Households
Age <18 or
>65
(Individuals)
Low Income
(Households)
Study Area 2,256 30,065 3,554
Study Area Plus
Planning Influence
Areas
3,892 87,269 5,592
Sources: US Census (2011 American Community Survey 5-Year Estimate); Census Tract Level
1 Adie Tomer, “Transit Access and Zero-Vehicle Households,” Metropolitan Policy Program at Brookings
(August, 2011).
Davis-SLC Community Connector Study Alternatives Analysis Report
16
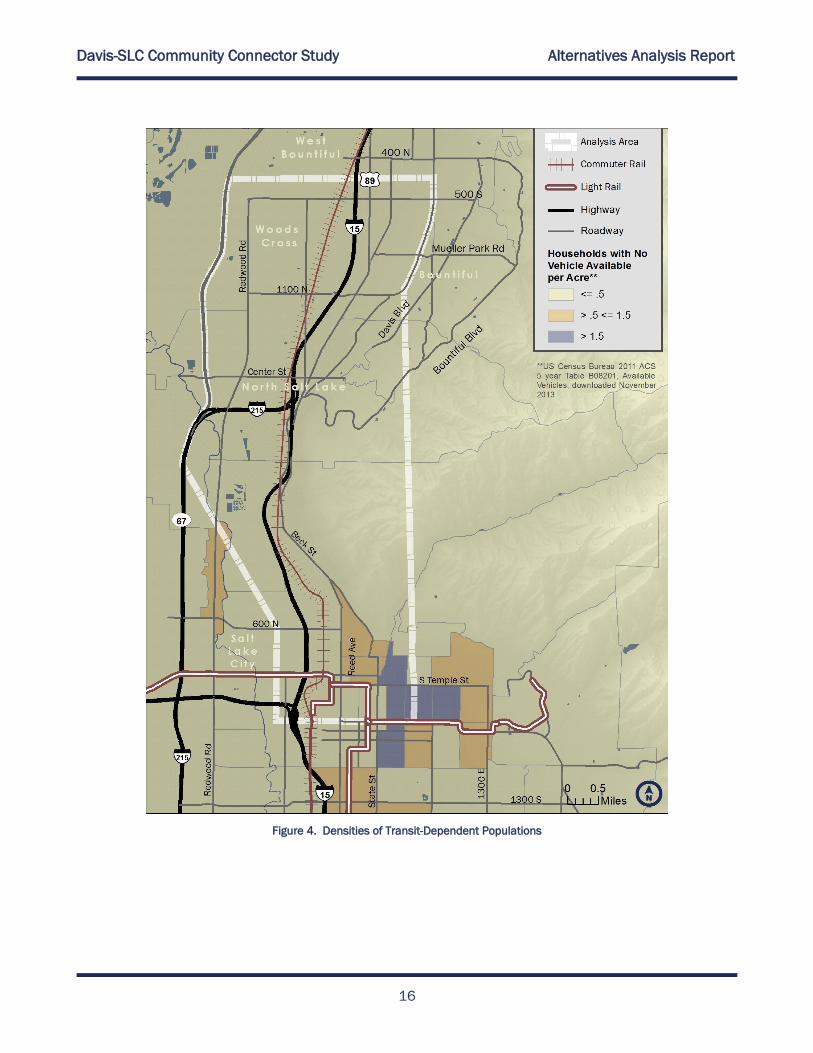
Figure 4. Densities of Transit-Dependent Populations
Davis-SLC Community Connector Study Alternatives Analysis Report
17
3.6 TRANSPORTATION DEFICIENCIES
3.6.1 Existing Transit Service Gaps
Existing bus services are predominantly commuter-focused. Off-peak service as well as east-west
transit connections and transit circulators within and between communities in south Davis County
are lacking.
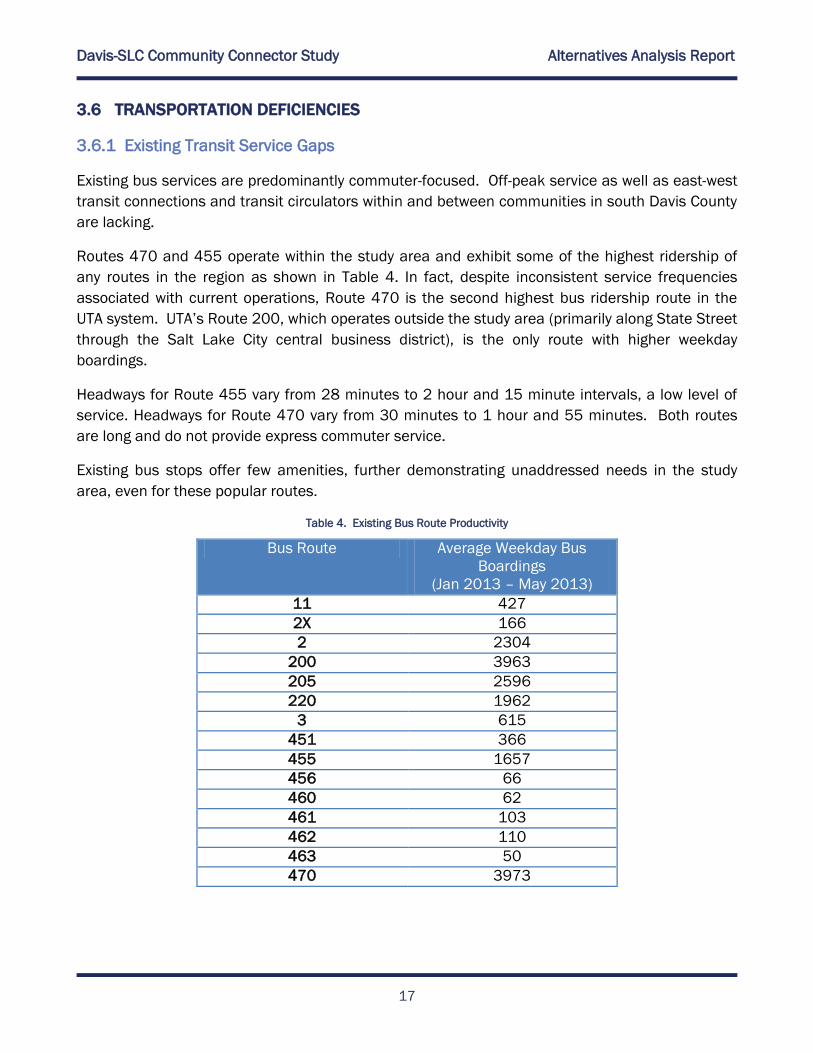
Routes 470 and 455 operate within the study area and exhibit some of the highest ridership of
any routes in the region as shown in Table 4. In fact, despite inconsistent service frequencies
associated with current operations, Route 470 is the second highest bus ridership route in the
UTA system. UTA’s Route 200, which operates outside the study area (primarily along State Street
through the Salt Lake City central business district), is the only route with higher weekday
boardings.
Headways for Route 455 vary from 28 minutes to 2 hour and 15 minute intervals, a low level of
service. Headways for Route 470 vary from 30 minutes to 1 hour and 55 minutes. Both routes
are long and do not provide express commuter service.
Existing bus stops offer few amenities, further demonstrating unaddressed needs in the study
area, even for these popular routes.
Table 4. Existing Bus Route Productivity
Bus Route Average Weekday Bus
Boardings
(Jan 2013 – May 2013)
11 427
2X 166
2 2304
200 3963
205 2596
220 1962
3 615
451 366
455 1657
456 66
460 62
461 103
462 110
463 50
470 3973
Davis-SLC Community Connector Study Alternatives Analysis Report
18
Figure 5. Existing Bus Routes and Ridership
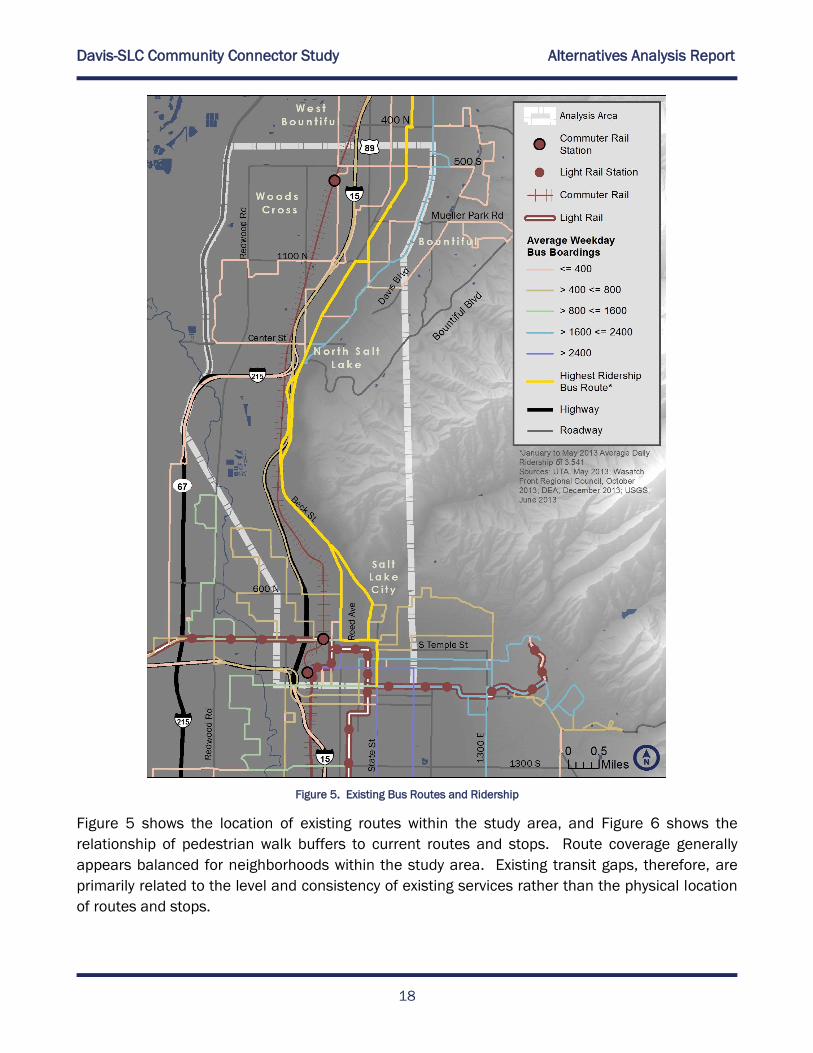
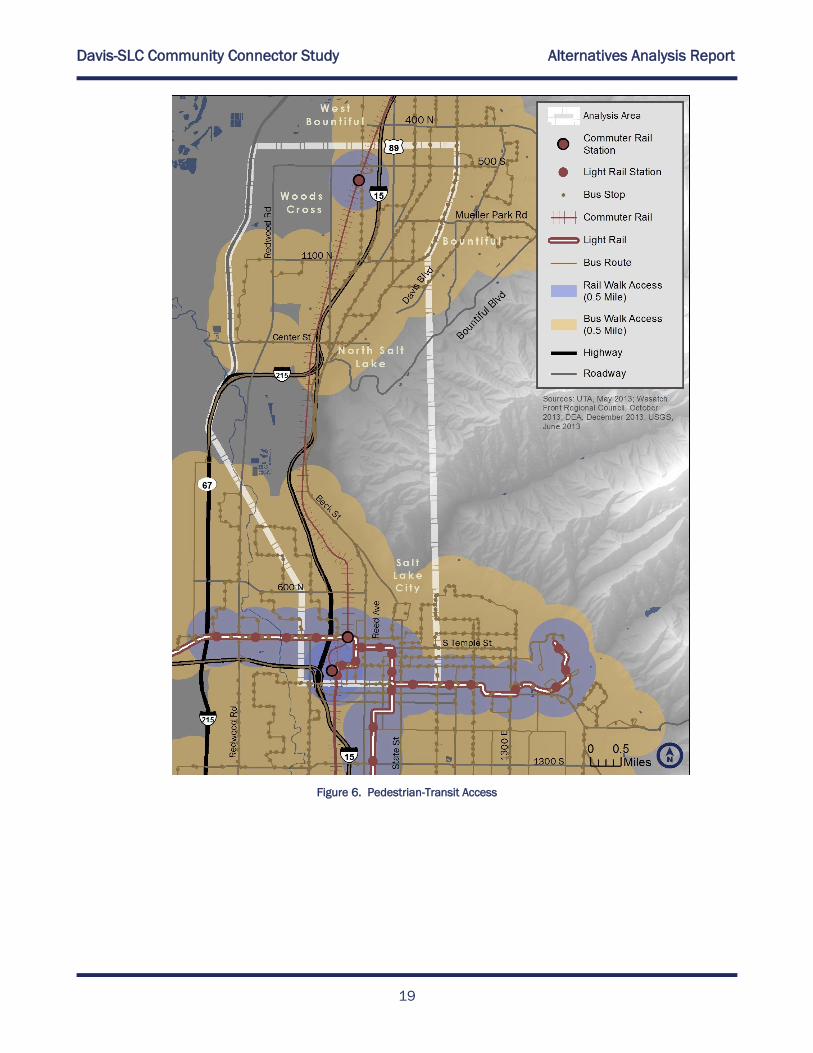
Figure 5 shows the location of existing routes within the study area, and Figure 6 shows the
relationship of pedestrian walk buffers to current routes and stops. Route coverage generally
appears balanced for neighborhoods within the study area. Existing transit gaps, therefore, are
primarily related to the level and consistency of existing services rather than the physical location
of routes and stops.
Davis-SLC Community Connector Study Alternatives Analysis Report
19
Figure 6. Pedestrian-Transit Access
Davis-SLC Community Connector Study Alternatives Analysis Report
20
3.6.2 Bicycle and Pedestrian Facilities
The study area lacks an effective network of non-motorized facilities. Two project areas on the
2013 Utah Collaborative Active Transportation Study (UCATS) Top 25 priority list for the Wasatch
Front region are located within the study area:
Bountiful/West Bountiful Active Transportation Feasibility Study
US89/Main Street Intersection Improvements (North Salt Lake and UDOT)
The recent development of a bikeway from North Salt Lake to downtown Salt Lake created non-
motorized travel and access opportunities, however the character of the corridor through
industrial areas warrants an exploration of enhanced facilities. Efforts to create a more walkable
environment along US89 with town centers and higher density development will require physical
improvements. The proximity of the study area to a large urban core, with successful strides in
mode shift suggests the potential for similar livability benefits within the study area. Over $1
billion of investments over the past decade have been focused on downtown Salt Lake City to
increase the urban experience. This has included plazas, new developments, light rail systems,
and bus enhancements. Salt Lake City continues to move forward in this arena, with the potential
addition of a streetcar system and BRT services.
3.7 SUMMARY AND CONCLUSIONS
Anticipated growth along the Wasatch Front, the presence of transit-supportive markets, and
growing travel demand within the Davis-SLC study area indicate the need for transit and other
active transportation investments. Current commuter-oriented transit service lacks the
frequencies, consistency and rider amenities necessary to meet the present needs.
Davis-SLC Community Connector Study Alternatives Analysis Report
21
4 PUBLIC AND STAKEHOLDER ENGAGEMENT
Meaningful public involvement is a key component of any planning process. Engaging the public
and stakeholders has been fundamental to developing transit alternatives with the greatest
likelihood of success within the Davis-SLC Community Connector study area.
The intent of UTA’s public involvement program has been to provide affected residents, including
traditionally under-represented populations, with opportunities to learn about potential
alternatives and provide feedback to help inform agency decisions. Public involvement strategies
for this study were designed to accomplish the following objectives:
Foster open and honest communication
Understand jurisdictional concerns and desires
Manage expectations
Reduce duplication of effort
Identify and explain roles and responsibilities
Share information with appropriate audiences at the appropriate times.
A robust community outreach effort was undertaken for the project which included a telephone
survey, focus groups, two public open houses, and opportunities to provide comment via UTA’s
“Open UTA” website. In addition, UTA performed targeted outreach to business groups in the
corridor. Public comments were carefully considered by UTA and study partners at each project
decision stage.
A summary of public involvement activities and comments is provided in Appendix D.
4.1 FOCUS GROUPS
Focus groups were convened to assess the transportation needs within the target market and to
gauge public perceptions of specific transportation modes. The target market for this project
included individuals within 1) the study area (Salt Lake City, North Salt Lake, and Bountiful) and 2)
influence areas (Woods Cross, Centerville, and Farmington). To accomplish the project objectives,
participants were guided through a discussion that encompassed the following topics and themes:
4.1.1 Consumer Habits and Transit Perceptions
Discovered if participants have used public transit in the last two years
Determined the reasons participants have or have not used public transit in the last
two years
Discovered top-of-mind perceptions of public transit Identify the benefits and
drawbacks of using public transit systems
Determined the pros and cons of using various modes of transportation (i.e. SOV,
Urban Rail, Commuter Rail, bus transit, walking, and biking)
Davis-SLC Community Connector Study Alternatives Analysis Report
22
4.1.2 Impact of Public Transit on Local Communities
Identified the perceived transportation challenges facing Davis County in the future
Discovered aspects of other transit systems that appeal to individuals
Determined if participants perceive transit systems as a means for creating vitality in
surrounding communities
Identified transportation needs and expectations
Identified the most important elements of a transit system, as perceived by participants
Defined characteristics and attributes the ideal transit system would include
Identified obstacles a transit system could potentially face and identify solutions for
overcoming these challenges
4.1.3 Transit Mode Preferences
Evaluated and compared the benefits of Bus Rapid Transit (BRT) and Urban Rail
Discovered which form of transit is preferable to participants
Focus group participants also offered perceptions of existing transit services and suggestions on
how to improve and promote public transit in the region. Considering the different technologies for
this alignment, the Focus Group was mixed in their preferences. Though participants preferred rail
transit, they considered BRT to be less intrusive and costly to implement. A complete report of on
the Focus Group’s findings is available in Appendix D-4.
4.2 TELEPHONE SURVEYS
A telephone survey of residents in Davis County and Salt Lake City was conducted to capture
additional input on travel behaviors and preferences for the study area. Survey objectives
included:
Understand and confirm regional travel patterns, modes used and purpose for travel
Discover whether respondents use public transportation to get to work, and if so,
identify the modes of transit respondents typically use
Evaluate respondents’ satisfaction with current public transportation in Davis County
Discover the likelihood of respondents increasing their ridership of public transit if
public transit were improved
Identify the greatest public transit needs in southern Davis County
Identify perceived reasonable timeframes
Determine whether respondents would be more likely to ride FrontRunner if there was
increased frequency of shuttle or bus travel
Determine the perceived impact of public transit on economic growth within
communities
Davis-SLC Community Connector Study Alternatives Analysis Report
23
Gather demographic information such as gender, age, education, annual household
income, marital status, household size, and city of residence.
Survey findings, which are summarized in Appendix D-5 were shared with the Advisory and Policy
committees for the study, to help inform the decision-making process.
4.3 BUSINESS COMMUNITY OUTREACH
UTA, through an independent consultant, conducted a comprehensive grass-roots business
outreach program specifically to contact every business along the corridor(s) to create project
ownership. Outreach strategies included visiting with and educating individual business/property
owners on project options and processes while logging their input on opinions and concerns. In
addition, UTA visited all businesses door-to-door to make sure no one was left out.
UTA and the outreach team contacted all area chambers of commerce as well as other civic
organizations to provide presentation of the project including potential impacts from construction.
Project partners were included, or given the opportunity to be included, in every outreach effort.
All coordination activities are summarized in Appendix D.
4.4 PUBLIC MEETINGS AND ON-LINE FORUMS
Following the previous alternatives analysis prepared in 2008, community dissention related to
the prior study recommendation led to a decision to re-evaluate options. UTA therefore
emphasized a broad public outreach campaign for the Davis-SLC Community Connector project,
providing supplemental outreach activities with in-house staff as the project progressed, to ensure
adequate opportunities for feedback and comment were made available. Two public open houses
were held on December 10, 2013 and April 1, 2014 at the North Salt Lake City Hall. Additionally,
UTA solicited public comments via “Open UTA”, an on-line forum for information dissemination
and public input. Comments received at each meeting and via Open UTA were reviewed,
consolidated, summarized, and presented to project decision-makers prior to key decision points
during the study. Approximately 577 members of the public at-large participated in open houses
and on-line comment opportunities.
Appendix D-1 provides documentation of the public involvement process and comments received.
4.5 PROJECT ADVISORY AND POLICY COMMITTEES
A collaborative, multi-jurisdictional approach was used for the Davis-SLC Community Connector
study, which allowed the project team to draw from the collective knowledge and expertise of staff
members and elected officials representing affected cities, Davis County and the Wasatch Front
Regional Council. Meetings of these groups coincided with key decision points including
development of study goals and objectives, evaluation criteria, initial corridor and technology
screening, review of detailed alternatives and recommendation of a LPA.
Davis-SLC Community Connector Study Alternatives Analysis Report
24
4.5.1 Advisory Committee Kickoff Meeting, Tuesday, April 9, 2013
After group introductions and an overview of the project, the consultant team introduced project
branding options. The committee determined that “community connector” fit the project and was
consistent with other current transit project themes. Federal Transit Administration (FTA) funding
trends for capital improvement projects were explained at this meeting, as well as other FTA
trends, including mobility improvements, economic development effects, environmental benefits,
cost effectiveness, and land use. The meeting concluded with a broad discussion of project goals
and objectives.
4.5.2 Advisory Committee Meeting, July 25, 2013
Project purpose and need elements were presented to committee members, along with
supporting goals and objectives to guide development of a reasonable range of alternatives.
Evaluation criteria to be used during the screening process, which were based on the project goals
and objectives, were also reviewed by the Advisory Committee. A long list of candidate corridors
was presented to the group, and feedback was solicited to help narrow the field so that initial
corridor screening work could begin. Several members suggested extensions or modifications to
potential corridors. The public involvement plan was also shared with the committee.
The initial study area did not extend into Bountiful. At this meeting, the Advisory Committee
discussed whether the Study Area should be adjusted to encompass Bountiful’s Main Street up to
500 South. (Note: After this meeting, UTA and the City of Bountiful agreed to expand the study
area boundary so that routes using Main Street in Bountiful could be considered in the analysis.)
4.5.3 Advisory Committee Meeting, October 1, 2013
Results of public outreach activities, including results from focus group research and a telephone
survey were shared with the Advisory Committee. The project team provided a status update on
the evaluation process, including a preliminary review of initial corridors which were selected for
screening analysis based on public input and one-on-one discussions with affected local agencies.
The Advisory Committee was asked to confirm the list of corridors that were advancing into the
screening process.
4.5.4 Advisory and Policy Committee Meetings, February 18, 2014
The project team provided an overview of findings from the initial corridor screening process as
well as findings from initial technology review for the initial corridors. Alternatives recommended
to be carried forward into detailed evaluation phase were presented. As this meeting represented
a critical juncture in the evaluation process, the concurrence of both committees was sought
before the project team began the work to develop and analyze detailed alternatives. Mapping
exercises were facilitated with both committees, to provide an opportunity for input and to
determine if any adjustments to proposed routes, stops/stations or preliminary service levels
were needed.
Davis-SLC Community Connector Study Alternatives Analysis Report
25
4.5.5 Advisory and Policy Committee Meetings, May 29, 2014
Project team members provided an overview of the project accomplishments, including defined
alternatives for detailed evaluation, technical analysis, and the draft Locally Preferred Alternative
(LPA). The two final alternatives were presented and confirmed with the committees: Alternative A
– Enhanced Bus and Alternative B – Bus Rapid Transit.
Based on public input and local agency desires, possible circulators may be developed for Davis
County communities, but would be considered independent of the Davis-SLC LPA.
For both final alternatives, service levels, station locations, and an example of station design were
presented and confirmed with each committee. There was discussion about the potential for a
one-seat ride from south Davis County to the University of Utah. Planning-level costs associated
with both final alternatives, including Total Cost per Ride (annualized capital and Operations &
Maintenance), were presented and discussed.
A summary of key findings, both qualitative and quantitative, was presented including capital
costs, operating and maintenance costs, transit ridership, property acquisition and right-of-way
impacts, project effectiveness, land use, revitalization opportunities, and economic development
considerations. Alternative B, the BRT alternative, exceeded the baseline thresholds for meeting
the established criteria and emerged as the recommended option.
4.6 SUMMARY AND CONCLUSIONS
UTA’s commitment to an extensive outreach program for the Davis-SLC Community Connector
Study provided a strong foundation and the local buy-in necessary for a successful transit
investment. Complete documentation of public involvement activities can be found in Appendix D.
Davis-SLC Community Connector Study Alternatives Analysis Report
26
5 PURPOSE AND NEED
5.1 INTRODUCTION
The following purpose and need elements were discussed with stakeholder groups early in the
study process.
These elements were used as a guide to identify a range of reasonable alternatives, and
ultimately select a LPA. The existing conditions analysis provided in Attachment A supports UTA’s
initial premise that transit investment is needed in the Davis-SLC study area. Further justification
for this assertion was established through the following study components:
Needs Assessment (See Appendix A for compilation & analysis of transportation and
urban planning indicators)
Goals and Objectives
Confirmation of Purpose & Need elements with project Advisory and Policy Committees.
5.2 PROJECT GOALS AND OBJECTIVES
Project goals and objectives were derived from Advisory Committee discussions which occurred in
April 2013 as well as from an initial review of regional plans, data and trends.
Purpose Elements o Increase mobility, connectivity,
and travel choices
o Support local and regional
land use initiatives
o Promote economic
development
Need Elements
o Projected growth
o Service gaps
o Access & mobility barriers
o Bicycle & pedestrian facilities
o Revitalization (deteriorating
neighborhoods & corridors)
o Air quality mitigation
o Markets not served
Davis-SLC Community Connector Study Alternatives Analysis Report
27
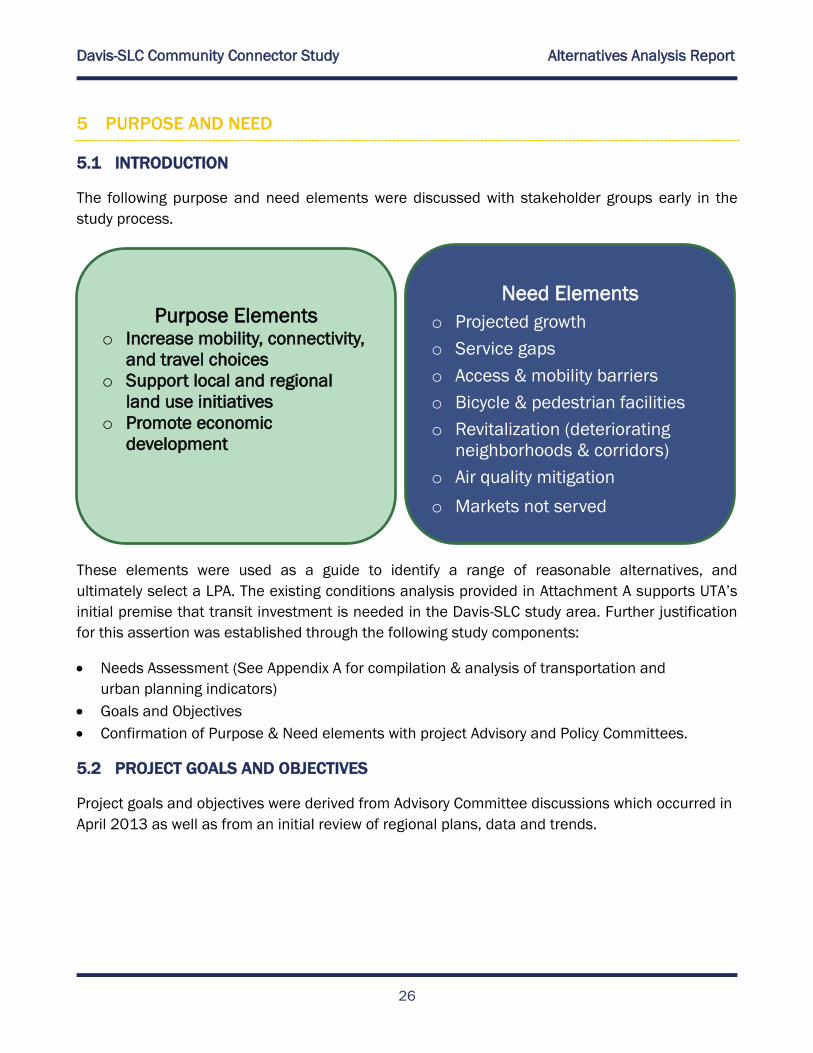
Improve Regional Connectivity
o Improve transit service/options between south Davis County communities
and Salt Lake City (e.g., improve current bus service, provide more
equitable transit service)
o Better connections to regional transit services in the downtown Salt Lake
core
o Connections to FrontRunner
Match Transportation Solutions to Potential Markets
o Identify viable transportation user market segments
o Serve markets not served by current transit services
o Enhance service to existing markets
o Fill in current gaps in transit service
Increase Bike and Pedestrian Mode Share
o Implement new bike and pedestrian amenities
o Improve linkages to existing and new transit facilities
o Create bike/pedestrian friendly environments
Balance East West & North South Travel Needs
o Solutions to serve regional and local travel patterns
Revitalize Corridors
o Improve land use opportunities
o Enhance the urban environment
Create Jobs
o Attract and support business activity
o Increase tax base through development/redevelopment of urban centers
Improve Travel through the Study Area
o Increase mobility options
o Integrate with existing transportation facilities
Davis-SLC Community Connector Study Alternatives Analysis Report
28
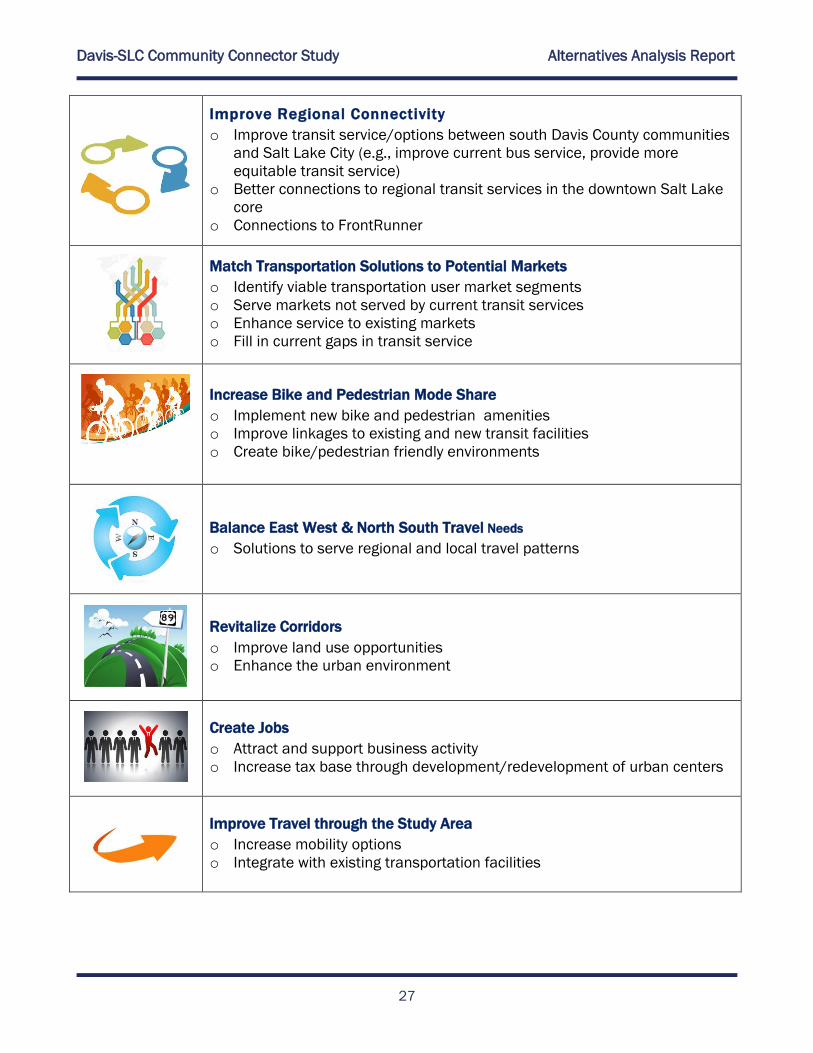
Identify Viable Transit Solutions
o Garner significant stakeholder support
o Create ability to obtain funding
Support Wasatch Choice 2040 Growth Principles
o Enable interconnection of transportation systems
o Balance jobs and housing
o Enhance regional economy
o Enhance regional collaboration
o Strengthen sense of community
o Protect and enhance the environment
5.3 PURPOSE AND NEED STATEMENT
A preliminary statement of Purpose and Need can be valuable at the Alternatives Analysis stage to
document the reasons for undertaking a project study, and to support advancement of
investments once they are defined and evaluated. If the Davis-SLC Corridor moves forward for
further development, a formal Purpose and Need statement will be an outcome of the
environmental review process. The suggested statements below may therefore be refined or
expanded to illuminate later findings in the environmental phase of the project development
process.
Based on the original purpose and need elements that were confirmed with key stakeholders,
evaluation of existing transportation services within the study area, and goals and objectives
developed for the corridor, the following preliminary Purpose and Need statement is proposed for
the Davis-SLC Community Connector project:
Purpose: The purpose of the Davis-SLC Community Connector project is to increase mobility,
connectivity, and travel choices for communities in southern Davis County and neighborhoods in
downtown and northern Salt Lake City. The project will support the region’s active transportation
goals, align transportation investments with local and regional land-use initiatives and promote
economic development.
Need: Increased capacity, frequency and quality of transit service is necessary to improve
connections between south Davis county communities and downtown Salt Lake City, address
gaps in existing service, and support regional accessibility and mobility, including for improved
mobility for off-peak travel and essential service for transit-dependent populations. Targeted
transit investment is also needed to catalyze community revitalization initiatives.

Davis-SLC Community Connector Study Alternatives Analysis Report
29
6 ALTERNATIVES CONSIDERED
6.1 INTRODUCTION
The process shown in Figure 7 was used to progress from a universe of alternatives to selection of
a LPA.
Figure 7. Study Evaluation Process
This section provides an overview of the alternative development and evaluation process, and
summarizes key findings from the initial screening and detailed evaluation phases. The resulting
LPA is also presented.
6.1.1 Alternative Development and Evaluation Process
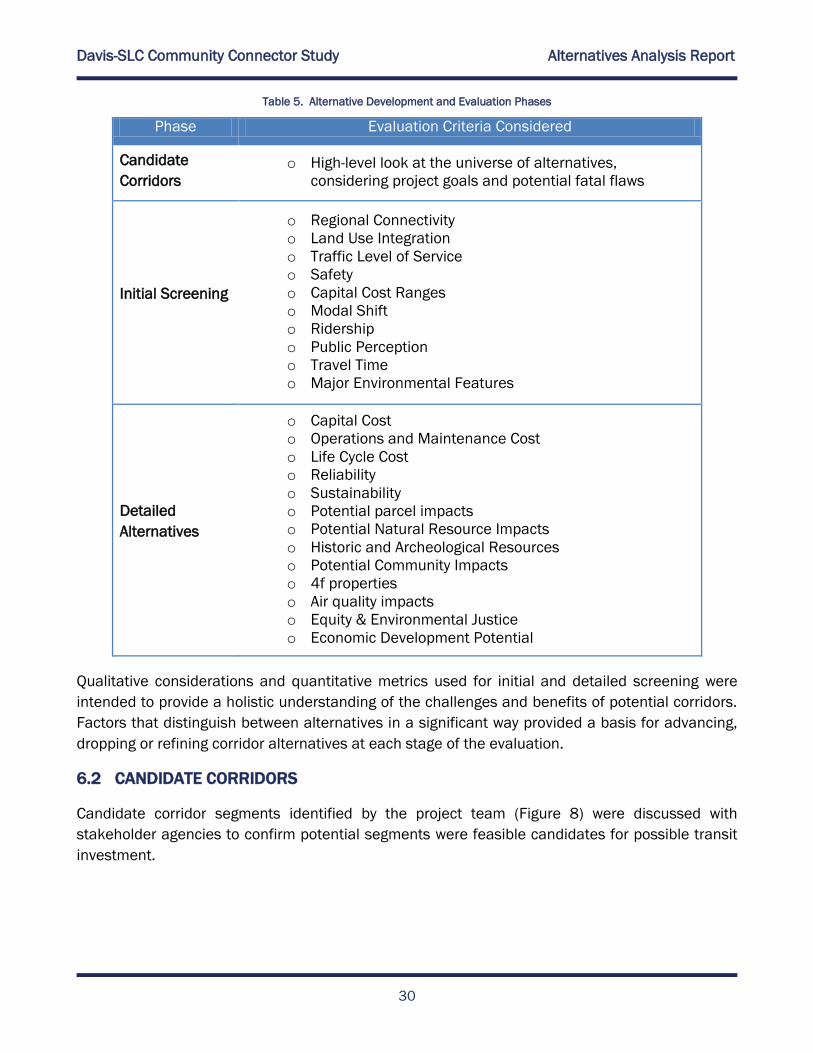
Evaluation criteria were developed and applied at three phases of the project as shown in Table 5.
Candidate Corridors (universe of alternatives)
Initial Screening (7 initial corridors)
Detailed Screening (2 detailed alternatives)
Davis-SLC Community Connector Study Alternatives Analysis Report
30
Table 5. Alternative Development and Evaluation Phases
Phase Evaluation Criteria Considered
Candidate
Corridors
o High-level look at the universe of alternatives,
considering project goals and potential fatal flaws
Initial Screening
o Regional Connectivity
o Land Use Integration
o Traffic Level of Service
o Safety
o Capital Cost Ranges
o Modal Shift
o Ridership
o Public Perception
o Travel Time
o Major Environmental Features
Detailed
Alternatives
o Capital Cost
o Operations and Maintenance Cost
o Life Cycle Cost
o Reliability
o Sustainability
o Potential parcel impacts
o Potential Natural Resource Impacts
o Historic and Archeological Resources
o Potential Community Impacts
o 4f properties
o Air quality impacts
o Equity & Environmental Justice
o Economic Development Potential
Qualitative considerations and quantitative metrics used for initial and detailed screening were
intended to provide a holistic understanding of the challenges and benefits of potential corridors.
Factors that distinguish between alternatives in a significant way provided a basis for advancing,
dropping or refining corridor alternatives at each stage of the evaluation.
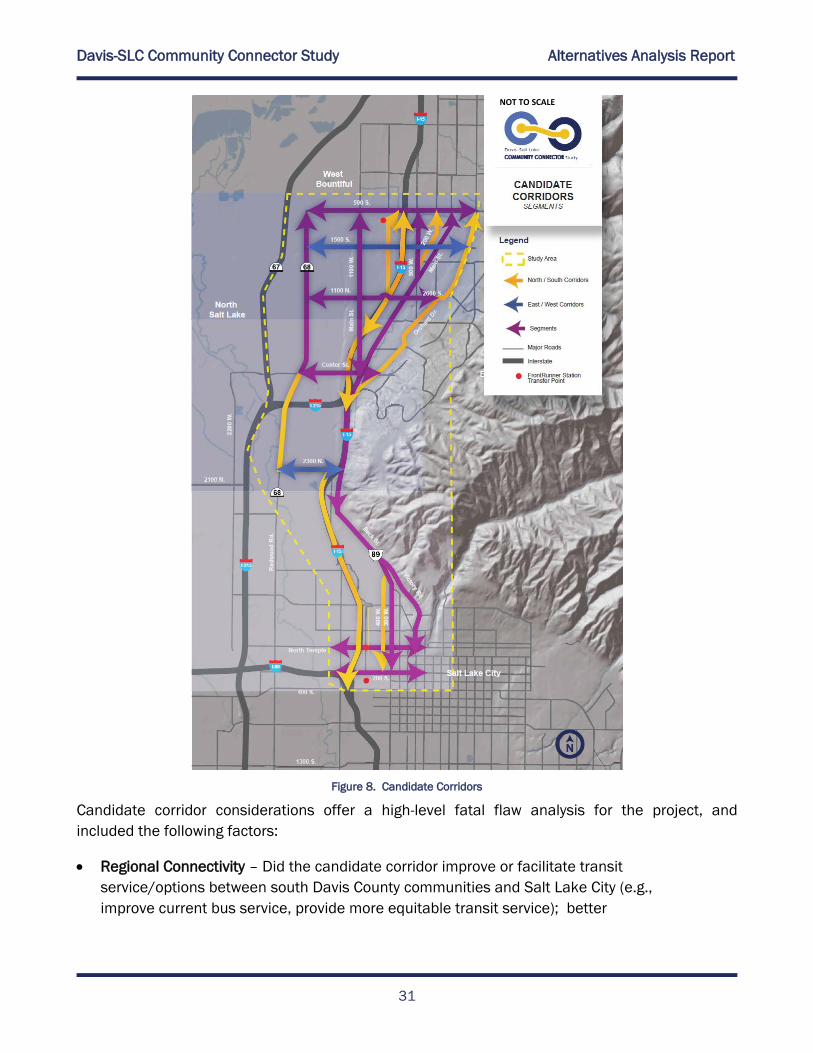
6.2 CANDIDATE CORRIDORS
Candidate corridor segments identified by the project team (Figure 8) were discussed with
stakeholder agencies to confirm potential segments were feasible candidates for possible transit
investment.
Davis-SLC Community Connector Study Alternatives Analysis Report
31
Figure 8. Candidate Corridors
Candidate corridor considerations offer a high-level fatal flaw analysis for the project, and
included the following factors:
Regional Connectivity – Did the candidate corridor improve or facilitate transit
service/options between south Davis County communities and Salt Lake City (e.g.,
improve current bus service, provide more equitable transit service); better
NOT TO SCALE
Davis-SLC Community Connector Study Alternatives Analysis Report
32
connections to regional transit services in the downtown Salt Lake core; connections to
FrontRunner rail service?
Ability to Serve Markets – Did the candidate corridor serve markets not served by
current transit services? Does it enhance service to existing markets? Did this
candidate corridor serve the ridership potential in the study area?
Transit System Gaps – Did the candidate corridor fill in current gaps in transit service?
Bike and Pedestrian Accommodation – Did the candidate corridor make possible the
implementation of new bike and pedestrian amenities? Does it improve linkages to
existing and new transit facilities? Is this route part of the UCATS Top 25 Projects?
Revitalization – Did the candidate corridor support local and regional land use goals or
enhances the use of transit-supported land use, planning, and design strategies.
East West Travel Needs – Did the candidate corridor primarily provide east/west
connectivity in the south Davis County area?
North South Travel Needs – Did the candidate corridor primarily provide north/south
connectivity in the south Davis County area?
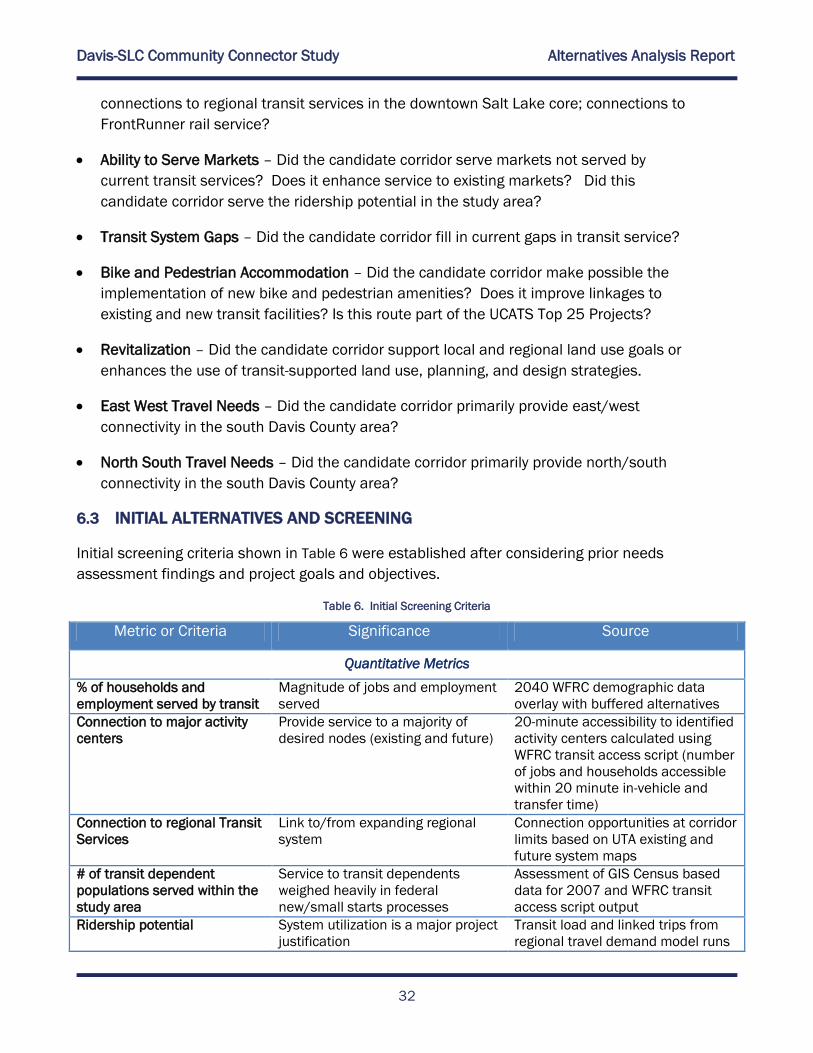
6.3 INITIAL ALTERNATIVES AND SCREENING
Initial screening criteria shown in Table 6 were established after considering prior needs
assessment findings and project goals and objectives.
Table 6. Initial Screening Criteria
Metric or Criteria Significance Source
Quantitative Metrics
% of households and
employment served by transit
Magnitude of jobs and employment
served
2040 WFRC demographic data
overlay with buffered alternatives
Connection to major activity
centers
Provide service to a majority of
desired nodes (existing and future)
20-minute accessibility to identified
activity centers calculated using
WFRC transit access script (number
of jobs and households accessible
within 20 minute in-vehicle and
transfer time)
Connection to regional Transit
Services
Link to/from expanding regional
system
Connection opportunities at corridor
limits based on UTA existing and
future system maps
# of transit dependent
populations served within the
study area
Service to transit dependents
weighed heavily in federal
new/small starts processes
Assessment of GIS Census based
data for 2007 and WFRC transit
access script output
Ridership potential System utilization is a major project
justification
Transit load and linked trips from
regional travel demand model runs
Davis-SLC Community Connector Study Alternatives Analysis Report
33
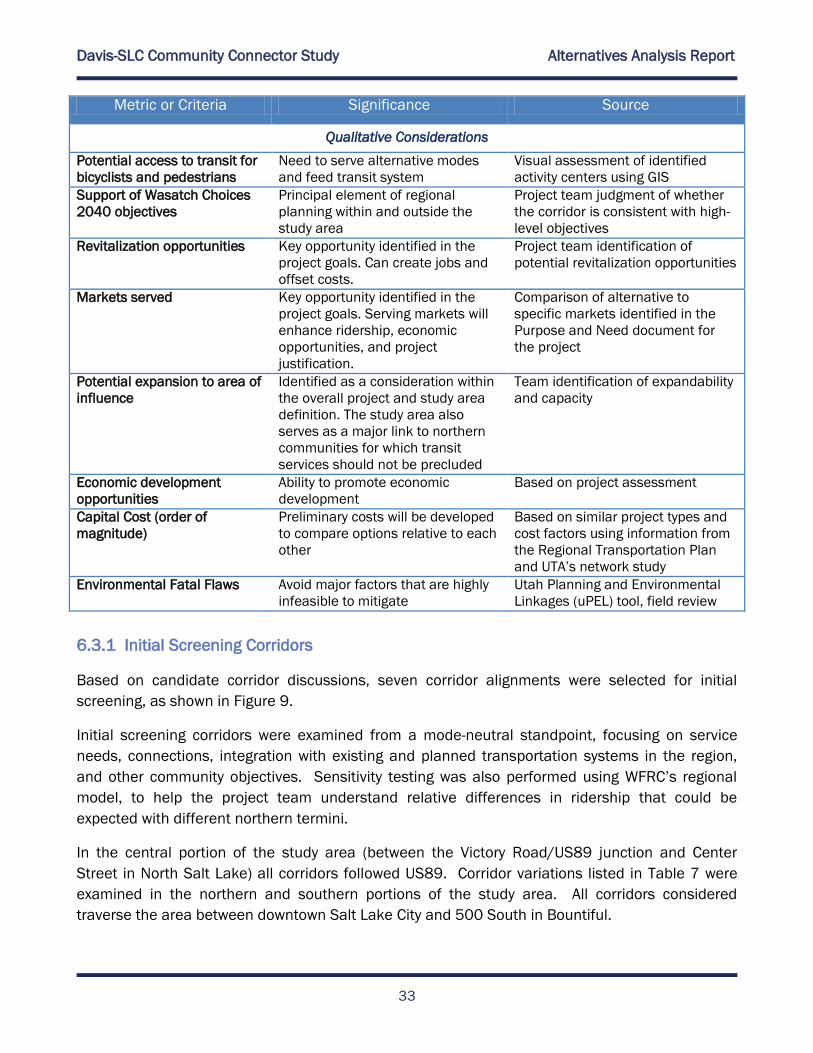
Metric or Criteria Significance Source
Qualitative Considerations
Potential access to transit for
bicyclists and pedestrians
Need to serve alternative modes
and feed transit system
Visual assessment of identified
activity centers using GIS
Support of Wasatch Choices
2040 objectives
Principal element of regional
planning within and outside the
study area
Project team judgment of whether
the corridor is consistent with high-
level objectives
Revitalization opportunities Key opportunity identified in the
project goals. Can create jobs and
offset costs.
Project team identification of
potential revitalization opportunities
Markets served Key opportunity identified in the
project goals. Serving markets will
enhance ridership, economic
opportunities, and project
justification.
Comparison of alternative to
specific markets identified in the
Purpose and Need document for
the project
Potential expansion to area of
influence
Identified as a consideration within
the overall project and study area
definition. The study area also
serves as a major link to northern
communities for which transit
services should not be precluded
Team identification of expandability
and capacity
Economic development
opportunities
Ability to promote economic
development
Based on project assessment
Capital Cost (order of
magnitude)
Preliminary costs will be developed
to compare options relative to each
other
Based on similar project types and
cost factors using information from
the Regional Transportation Plan
and UTA’s network study
Environmental Fatal Flaws Avoid major factors that are highly
infeasible to mitigate
Utah Planning and Environmental
Linkages (uPEL) tool, field review
6.3.1 Initial Screening Corridors
Based on candidate corridor discussions, seven corridor alignments were selected for initial
screening, as shown in Figure 9.
Initial screening corridors were examined from a mode-neutral standpoint, focusing on service
needs, connections, integration with existing and planned transportation systems in the region,
and other community objectives. Sensitivity testing was also performed using WFRC’s regional
model, to help the project team understand relative differences in ridership that could be
expected with different northern termini.
In the central portion of the study area (between the Victory Road/US89 junction and Center
Street in North Salt Lake) all corridors followed US89. Corridor variations listed in Table 7 were
examined in the northern and southern portions of the study area. All corridors considered
traverse the area between downtown Salt Lake City and 500 South in Bountiful.

Davis-SLC Community Connector Study Alternatives Analysis Report
34
Figure 9. Initial Screening Corridors

Davis-SLC Community Connector Study Alternatives Analysis Report
35
At the southern end of the study area, initial corridors were assumed to provide a connection to a
future Downtown Streetcar under development in a separate study. A terminal near 200 South
and State Street for the Davis-SLC Community Connector was determined to be more
advantageous than other potential southern termini after discussions with agency staff and a
visual scan of land uses and economic development opportunities in the southern part of the
study area.
In the northern portion of the study area, a variety of corridors were selected for screening based
on discussions with the Advisory Committee, conversations with local agency land use staff, and a
visual scan of existing land uses and assessment of future economic development opportunities.
The area of influence extending north to Farmington was considered for impacts and future
opportunities, but alternatives did not extend north of 500 South in Bountiful. Extension into the
area of influence is not a determined outcome of the current study.
A complete summary of the initial corridor screening process is provided in Appendix C.
Table 7. Corridors
Corridor
Number
Southern Segment Northern Segment and Communities Served
1 200 South, 300 West Bountiful: US89, 500 West
2 State Street, Victory Road Bountiful: US89, 500 West
3 200 South, 300 West Bountiful: US89, Main Street
4 200 South, 400 West Bountiful: US89, Main Street
5A 200 South, 300 West North Salt Lake, Woods Cross, and West Bountiful:
Center Street, Redwood Road, 500 South
5B 200 South, 300 West North Salt Lake, Woods Cross, West Bountiful and
Bountiful: Center Street, Redwood Road, 500 South,
US89 (Loop Route)
6 200 South, 300 West North Salt Lake, Woods Cross, West Bountiful and
Bountiful: 1100 West, 500 South
Information developed for the screening corridors was compared to a 2016 No Build scenario.
WFRC has developed a version of the regional travel demand model which includes land use and
demographic projections for 2016, as well as funded transportation projects which are expected
to be complete by 2016. As 2016 is likely the earliest that any alternative recommended by this
study could begin to be implemented, the year 2016 was selected as a reasonable baseline.
Table 8 provides a summary of advantages for each initial screening corridor when compared to
the baseline. Figure 10 summarizes community input received when initial corridors were
presented at a public open house in December, 2013. Additional screening results are included
in the Screening and Technology Memo provided as Appendix C.
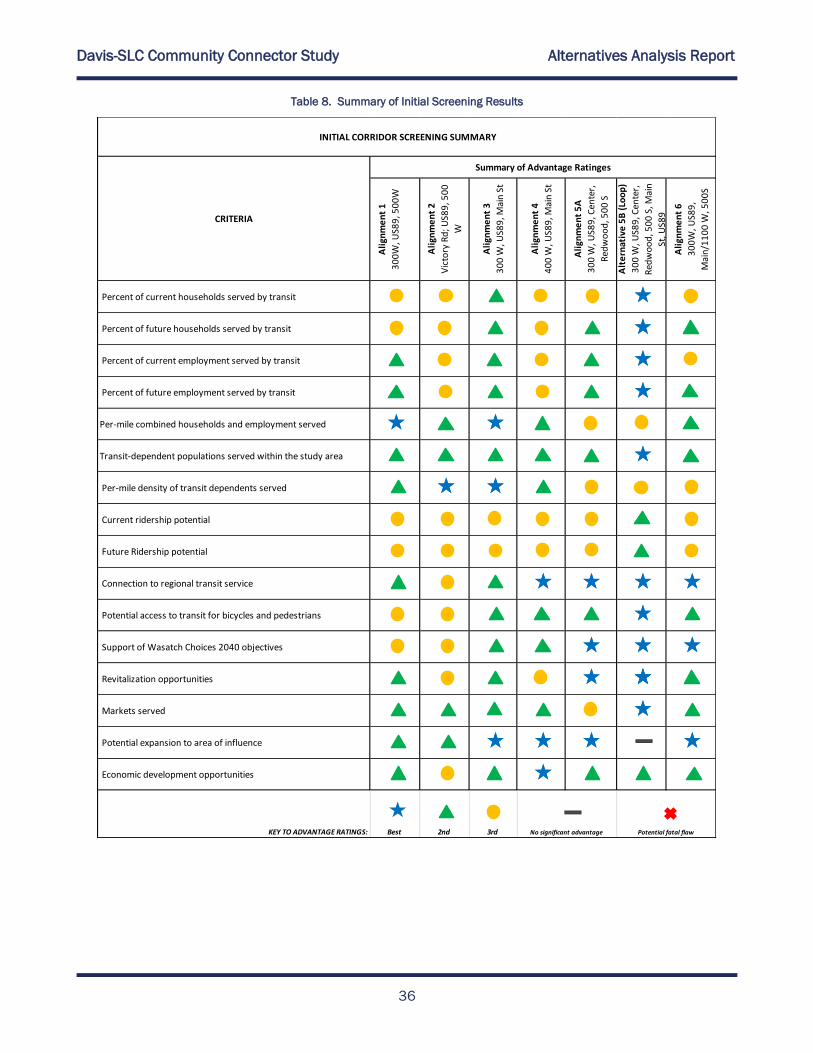
Davis-SLC Community Connector Study Alternatives Analysis Report
36
Table 8. Summary of Initial Screening Results
Percent of current households served by transit
Percent of future households served by transit
Percent of current employment served by transit
Percent of future employment served by transit
Per-mile combined households and employment served
Transit-dependent populations served within the study area
Per-mile density of transit dependents served
Current ridership potential
Connection to regional transit service
Potential access to transit for bicycles and pedestrians
Support of Wasatch Choices 2040 objectives
Revitalization opportunities
Markets served
Potential expansion to area of influence
Economic development opportunities
KEY TO ADVANTAGE RATINGS: Best 2nd 3rd
CRITERIA
Ali
gnm
en
t 5
A
30
0 W
, US8
9, C
ente
r,
Red
wo
od
, 50
0 S
Alt
ern
ativ
e 5
B (
Loo
p)
30
0 W
, US8
9, C
ente
r,
Red
wo
od
, 50
0 S
, Mai
n
St, U
S89
Ali
gnm
en
t 6
30
0W
, US8
9,
Mai
n/1
10
0 W
, 50
0S
Ali
gnm
en
t 4
40
0 W
, US8
9, M
ain
St
Potential fatal flawNo significant advantage
INITIAL CORRIDOR SCREENING SUMMARY
Future Ridership potential
Ali
gnm
en
t 1
30
0W
, US8
9, 5
00
W
Ali
gnm
en
t 2
Vic
tory
Rd
; US8
9, 5
00
W
Ali
gnm
en
t 3
30
0 W
, US8
9, M
ain
St
Summary of Advantage Ratinges
DAVIS-SLC COMMUNITY
CONNECTOR STUDY
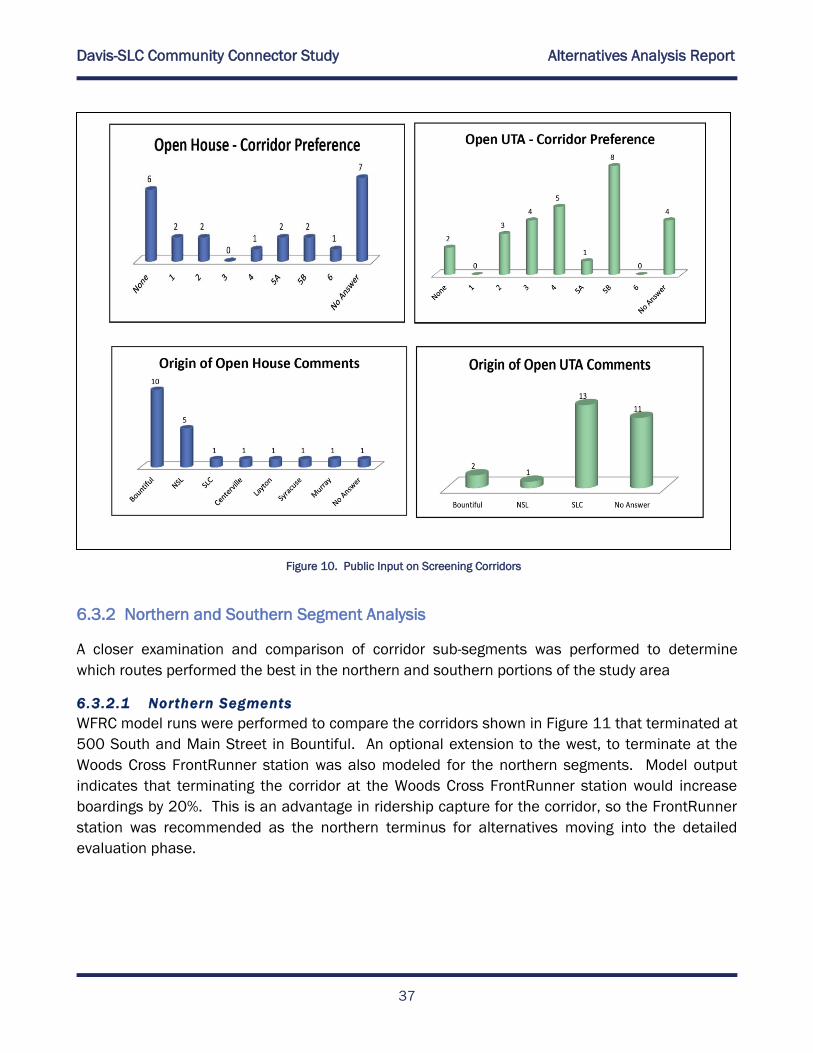
Davis-SLC Community Connector Study Alternatives Analysis Report
37
6.3.2 Northern and Southern Segment Analysis
A closer examination and comparison of corridor sub-segments was performed to determine
which routes performed the best in the northern and southern portions of the study area
6.3.2.1 Northern Segments
WFRC model runs were performed to compare the corridors shown in Figure 11 that terminated at
500 South and Main Street in Bountiful. An optional extension to the west, to terminate at the
Woods Cross FrontRunner station was also modeled for the northern segments. Model output
indicates that terminating the corridor at the Woods Cross FrontRunner station would increase
boardings by 20%. This is an advantage in ridership capture for the corridor, so the FrontRunner
station was recommended as the northern terminus for alternatives moving into the detailed
evaluation phase.
Figure 10. Public Input on Screening Corridors
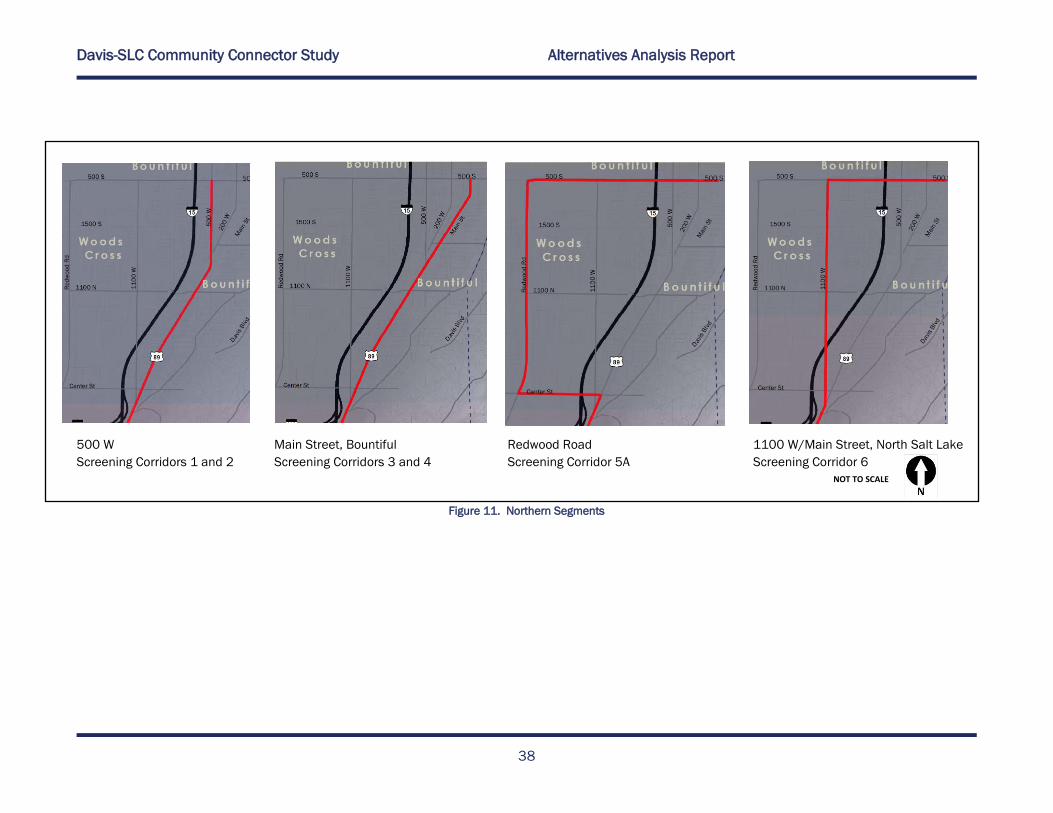
Davis-SLC Community Connector Study Alternatives Analysis Report
38
500 W Main Street, Bountiful Redwood Road 1100 W/Main Street, North Salt Lake
Screening Corridors 1 and 2 Screening Corridors 3 and 4 Screening Corridor 5A Screening Corridor 6
Figure 11. Northern Segments
NOT TO SCALE
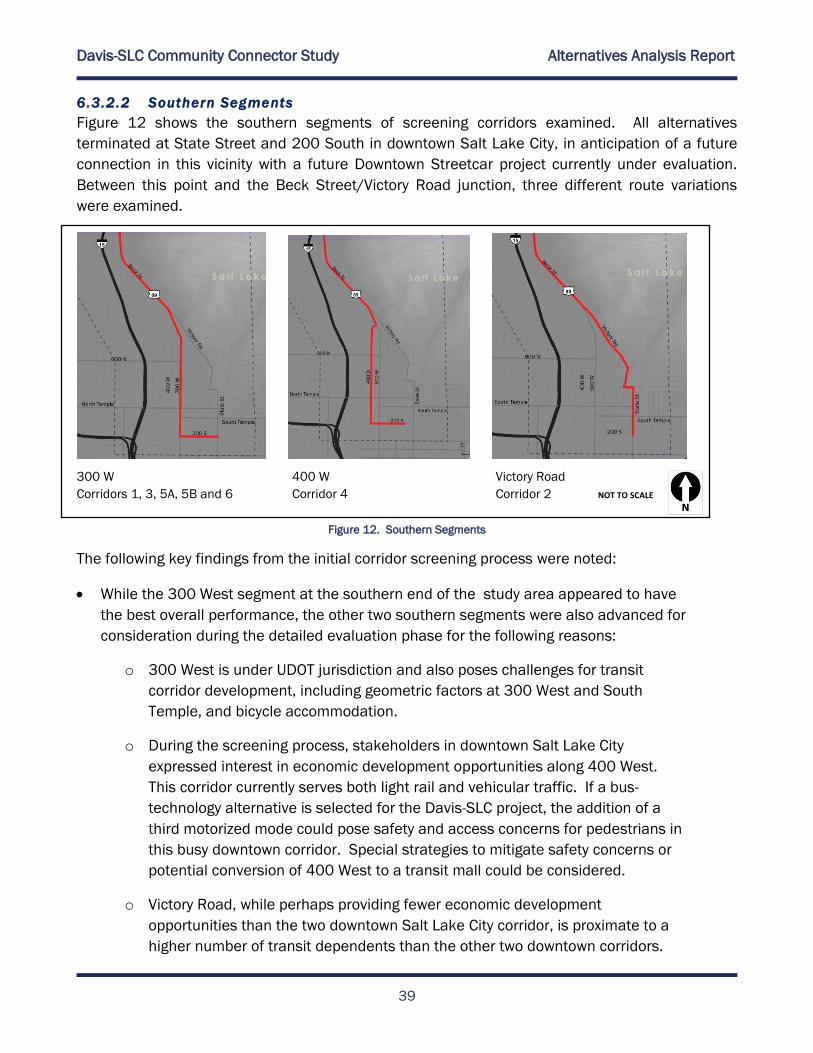
Davis-SLC Community Connector Study Alternatives Analysis Report
39
6.3.2.2 Southern Segments
Figure 12 shows the southern segments of screening corridors examined. All alternatives
terminated at State Street and 200 South in downtown Salt Lake City, in anticipation of a future
connection in this vicinity with a future Downtown Streetcar project currently under evaluation.
Between this point and the Beck Street/Victory Road junction, three different route variations
were examined.
300 W 400 W Victory Road
Corridors 1, 3, 5A, 5B and 6 Corridor 4 Corridor 2
Figure 12. Southern Segments
The following key findings from the initial corridor screening process were noted:
While the 300 West segment at the southern end of the study area appeared to have
the best overall performance, the other two southern segments were also advanced for
consideration during the detailed evaluation phase for the following reasons:
o 300 West is under UDOT jurisdiction and also poses challenges for transit
corridor development, including geometric factors at 300 West and South
Temple, and bicycle accommodation.
o During the screening process, stakeholders in downtown Salt Lake City
expressed interest in economic development opportunities along 400 West.
This corridor currently serves both light rail and vehicular traffic. If a bus-
technology alternative is selected for the Davis-SLC project, the addition of a
third motorized mode could pose safety and access concerns for pedestrians in
this busy downtown corridor. Special strategies to mitigate safety concerns or
potential conversion of 400 West to a transit mall could be considered.
o Victory Road, while perhaps providing fewer economic development
opportunities than the two downtown Salt Lake City corridor, is proximate to a
higher number of transit dependents than the other two downtown corridors.
NOT TO SCALE
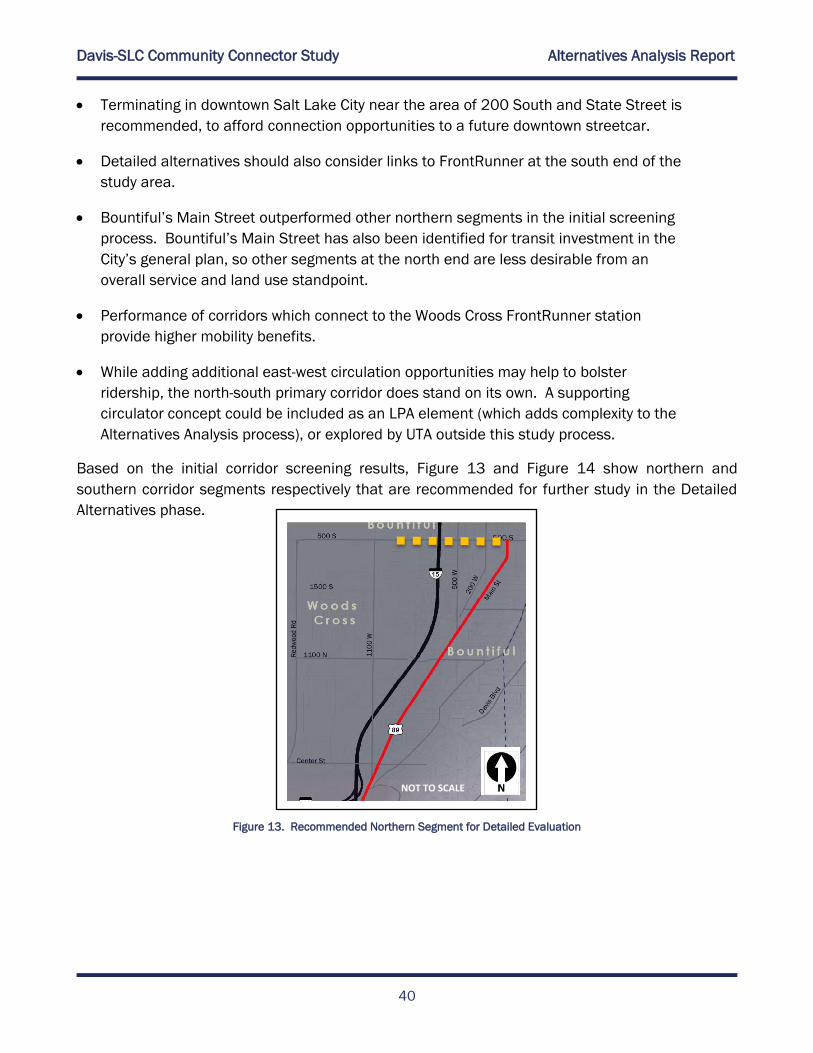
Davis-SLC Community Connector Study Alternatives Analysis Report
40
Terminating in downtown Salt Lake City near the area of 200 South and State Street is
recommended, to afford connection opportunities to a future downtown streetcar.
Detailed alternatives should also consider links to FrontRunner at the south end of the
study area.
Bountiful’s Main Street outperformed other northern segments in the initial screening
process. Bountiful’s Main Street has also been identified for transit investment in the
City’s general plan, so other segments at the north end are less desirable from an
overall service and land use standpoint.
Performance of corridors which connect to the Woods Cross FrontRunner station
provide higher mobility benefits.
While adding additional east-west circulation opportunities may help to bolster
ridership, the north-south primary corridor does stand on its own. A supporting
circulator concept could be included as an LPA element (which adds complexity to the
Alternatives Analysis process), or explored by UTA outside this study process.
Based on the initial corridor screening results, Figure 13 and Figure 14 show northern and
southern corridor segments respectively that are recommended for further study in the Detailed
Alternatives phase.
Figure 13. Recommended Northern Segment for Detailed Evaluation
NOT TO SCALE

Davis-SLC Community Connector Study Alternatives Analysis Report
41
6.3.3 Technology Screening
Four modal technologies were evaluated in prior Alternatives Analysis study efforts.
Streetcar;
Light Rail;
Enhanced Bus; and
Bus Rapid Transit
Figure 15. Technology/Mode Types
Commuter Rail already exists within the area and was not considered as an option to serve urban
connectivity, however connections to FrontRunner services in the study area were considered to
be key to the project objectives.
300 West 400 West Victory Road
Figure 14. Recommended Southern Segments for Detailed Evaluation
NOT TO SCALE
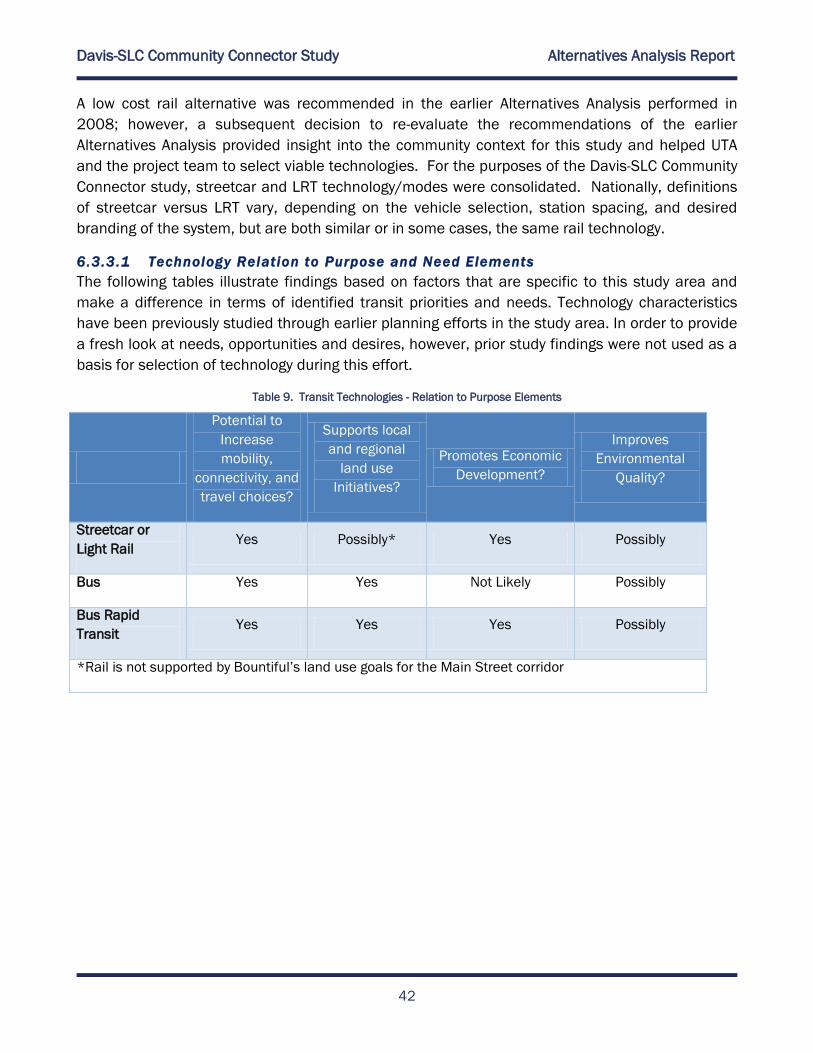
Davis-SLC Community Connector Study Alternatives Analysis Report
42
A low cost rail alternative was recommended in the earlier Alternatives Analysis performed in
2008; however, a subsequent decision to re-evaluate the recommendations of the earlier
Alternatives Analysis provided insight into the community context for this study and helped UTA
and the project team to select viable technologies. For the purposes of the Davis-SLC Community
Connector study, streetcar and LRT technology/modes were consolidated. Nationally, definitions
of streetcar versus LRT vary, depending on the vehicle selection, station spacing, and desired
branding of the system, but are both similar or in some cases, the same rail technology.
6.3.3.1 Technology Relation to Purpose and Need Elements
The following tables illustrate findings based on factors that are specific to this study area and
make a difference in terms of identified transit priorities and needs. Technology characteristics
have been previously studied through earlier planning efforts in the study area. In order to provide
a fresh look at needs, opportunities and desires, however, prior study findings were not used as a
basis for selection of technology during this effort.
Table 9. Transit Technologies - Relation to Purpose Elements
Potential to
Increase
mobility,
connectivity, and
travel choices?
Supports local
and regional
land use
Initiatives?
Promotes Economic
Development?
Improves
Environmental
Quality?
Streetcar or
Light Rail Yes Possibly* Yes Possibly
Bus Yes Yes Not Likely Possibly
Bus Rapid
Transit Yes Yes Yes Possibly
*Rail is not supported by Bountiful’s land use goals for the Main Street corridor
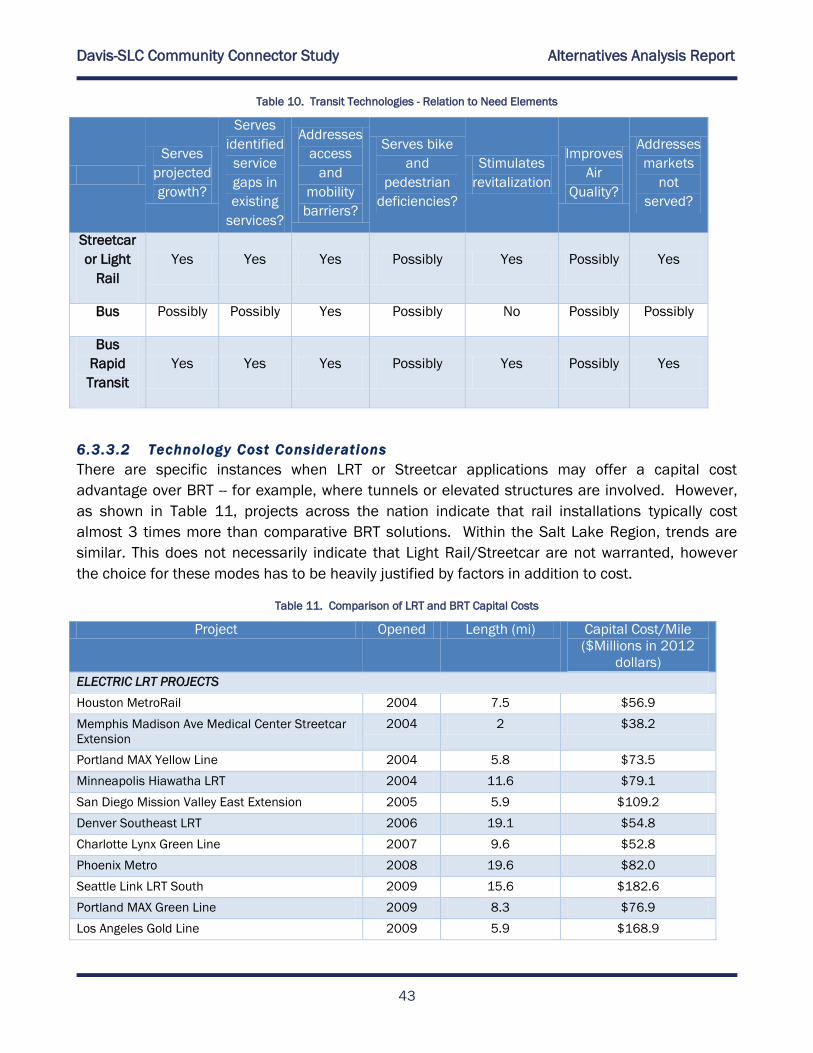
Davis-SLC Community Connector Study Alternatives Analysis Report
43
Table 10. Transit Technologies - Relation to Need Elements
Serves
projected
growth?
Serves
identified
service
gaps in
existing
services?
Addresses
access
and
mobility
barriers?
Serves bike
and
pedestrian
deficiencies?
Stimulates
revitalization
Improves
Air
Quality?
Addresses
markets
not
served?
Streetcar
or Light
Rail
Yes Yes Yes Possibly Yes Possibly Yes
Bus Possibly Possibly Yes Possibly No Possibly Possibly
Bus
Rapid
Transit
Yes Yes Yes Possibly Yes Possibly Yes
6.3.3.2 Technology Cost Considerations
There are specific instances when LRT or Streetcar applications may offer a capital cost
advantage over BRT -- for example, where tunnels or elevated structures are involved. However,
as shown in Table 11, projects across the nation indicate that rail installations typically cost
almost 3 times more than comparative BRT solutions. Within the Salt Lake Region, trends are
similar. This does not necessarily indicate that Light Rail/Streetcar are not warranted, however
the choice for these modes has to be heavily justified by factors in addition to cost.
Table 11. Comparison of LRT and BRT Capital Costs
Project Opened Length (mi) Capital Cost/Mile
($Millions in 2012
dollars)
ELECTRIC LRT PROJECTS
Houston MetroRail 2004 7.5 $56.9
Memphis Madison Ave Medical Center Streetcar
Extension
2004 2 $38.2
Portland MAX Yellow Line 2004 5.8 $73.5
Minneapolis Hiawatha LRT 2004 11.6 $79.1
San Diego Mission Valley East Extension 2005 5.9 $109.2
Denver Southeast LRT 2006 19.1 $54.8
Charlotte Lynx Green Line 2007 9.6 $52.8
Phoenix Metro 2008 19.6 $82.0
Seattle Link LRT South 2009 15.6 $182.6
Portland MAX Green Line 2009 8.3 $76.9
Los Angeles Gold Line 2009 5.9 $168.9
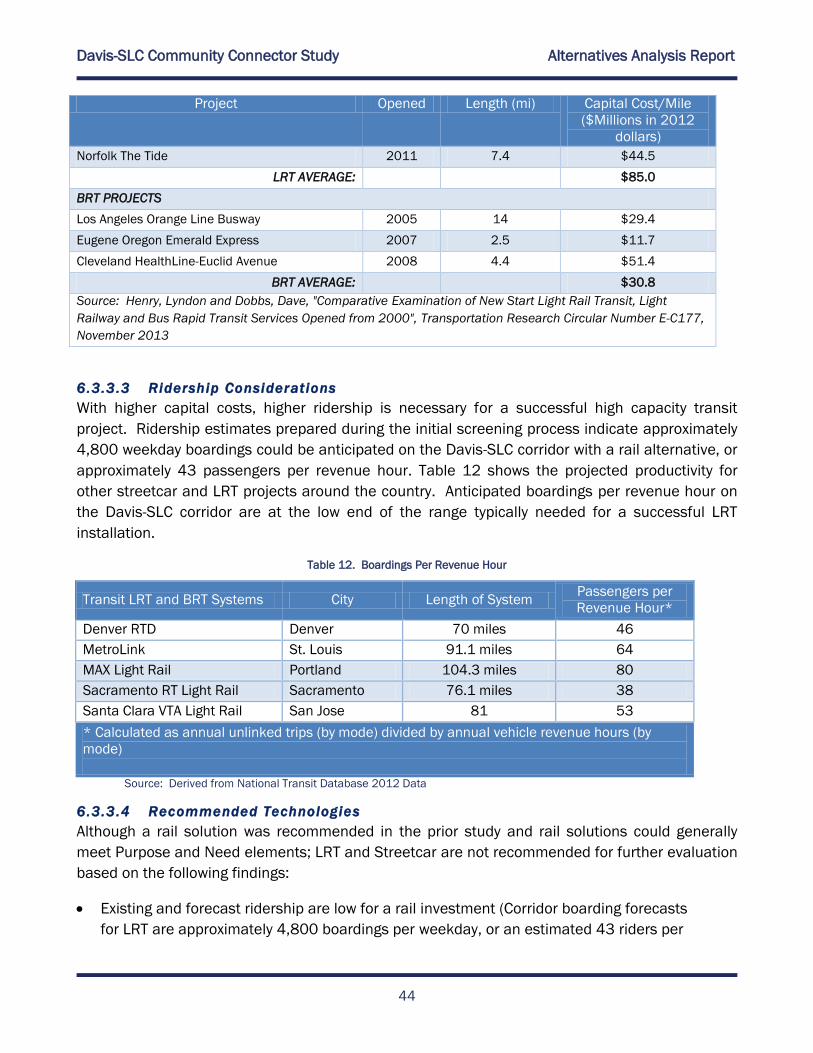
Davis-SLC Community Connector Study Alternatives Analysis Report
44
Project Opened Length (mi) Capital Cost/Mile
($Millions in 2012
dollars)
Norfolk The Tide 2011 7.4 $44.5
LRT AVERAGE: $85.0
BRT PROJECTS
Los Angeles Orange Line Busway 2005 14 $29.4
Eugene Oregon Emerald Express 2007 2.5 $11.7
Cleveland HealthLine-Euclid Avenue 2008 4.4 $51.4
BRT AVERAGE: $30.8
Source: Henry, Lyndon and Dobbs, Dave, "Comparative Examination of New Start Light Rail Transit, Light
Railway and Bus Rapid Transit Services Opened from 2000", Transportation Research Circular Number E-C177,
November 2013
6.3.3.3 Ridership Considerations
With higher capital costs, higher ridership is necessary for a successful high capacity transit
project. Ridership estimates prepared during the initial screening process indicate approximately
4,800 weekday boardings could be anticipated on the Davis-SLC corridor with a rail alternative, or
approximately 43 passengers per revenue hour. Table 12 shows the projected productivity for
other streetcar and LRT projects around the country. Anticipated boardings per revenue hour on
the Davis-SLC corridor are at the low end of the range typically needed for a successful LRT
installation.
Table 12. Boardings Per Revenue Hour
Transit LRT and BRT Systems City Length of System Passengers per
Revenue Hour*
Denver RTD Denver 70 miles 46
MetroLink St. Louis 91.1 miles 64
MAX Light Rail Portland 104.3 miles 80
Sacramento RT Light Rail Sacramento 76.1 miles 38
Santa Clara VTA Light Rail San Jose 81 53
* Calculated as annual unlinked trips (by mode) divided by annual vehicle revenue hours (by
mode)
Source: Derived from National Transit Database 2012 Data
6.3.3.4 Recommended Technologies
Although a rail solution was recommended in the prior study and rail solutions could generally
meet Purpose and Need elements; LRT and Streetcar are not recommended for further evaluation
based on the following findings:
Existing and forecast ridership are low for a rail investment (Corridor boarding forecasts
for LRT are approximately 4,800 boardings per weekday, or an estimated 43 riders per
Davis-SLC Community Connector Study Alternatives Analysis Report
45
weekday revenue hour. Peer systems indicate this is low for successful rail
implementation.)
A primary goal is to allow flexibility of service.
Highly notable opposition to rail solutions in the corridor was evidenced after the
previous study.
Based on public comments received, and input from study partner agencies, support
for rail solutions during the current study effort is not prevalent.
Support for bus-based technologies has been expressed by partner agencies and
stakeholders at the northern end of the corridor.
Integration with regional services and connections to major activities is not dependent
on a rail option for this corridor.
Funding for a rail option could be secured for a rail solution with significant effort;
however no funds are reasonably available at this stage to support rail investments.
Finally, a large difference in alternatives, where higher costs or significant
environmental impacts and public acceptance are not accompanied by higher benefits
might suggest that the more expensive and/or impacting option be eliminated.
Recommended technologies to be carried forward for detailed evaluation therefore included:
Enhanced Bus; and
Bus Rapid Transit
6.4 FINAL ALTERNATIVES AND SCREENING
At the conclusion of the initial screening of alternatives, two final alternatives were recommended
to be carried forward into advanced screening. The Initial Screening Corridors evaluated early in
the process had a common central segment along US 89 between North Salt Lake and downtown
Salt Lake City. Alignment alternatives varied in the northern end of the corridor and within
downtown Salt Lake City to meet a range of identified needs in each of those areas, and
alignment alternatives in the northern and southern portions of the corridor were independent of
one another.
At the conclusion of the initial screening, Initial Screening Corridors 2 and 4 were selected as the
base alternatives to carry forward, but these corridors were refined to better meet objectives
identified in the public and stakeholder evaluation process.
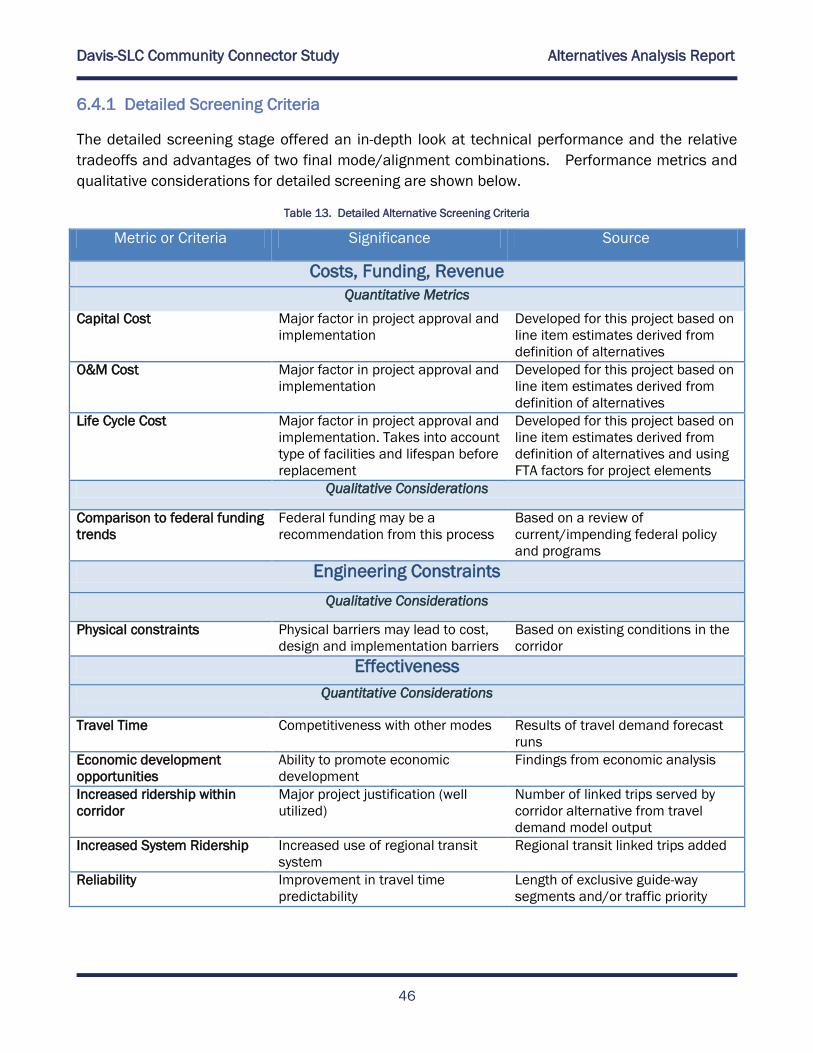
Davis-SLC Community Connector Study Alternatives Analysis Report
46
6.4.1 Detailed Screening Criteria
The detailed screening stage offered an in-depth look at technical performance and the relative
tradeoffs and advantages of two final mode/alignment combinations. Performance metrics and
qualitative considerations for detailed screening are shown below.
Table 13. Detailed Alternative Screening Criteria
Metric or Criteria Significance Source
Costs, Funding, Revenue
Quantitative Metrics
Capital Cost Major factor in project approval and
implementation
Developed for this project based on
line item estimates derived from
definition of alternatives
O&M Cost Major factor in project approval and
implementation
Developed for this project based on
line item estimates derived from
definition of alternatives
Life Cycle Cost Major factor in project approval and
implementation. Takes into account
type of facilities and lifespan before
replacement
Developed for this project based on
line item estimates derived from
definition of alternatives and using
FTA factors for project elements
Qualitative Considerations
Comparison to federal funding
trends
Federal funding may be a
recommendation from this process
Based on a review of
current/impending federal policy
and programs
Engineering Constraints
Qualitative Considerations
Physical constraints Physical barriers may lead to cost,
design and implementation barriers
Based on existing conditions in the
corridor
Effectiveness
Quantitative Considerations
Travel Time Competitiveness with other modes Results of travel demand forecast
runs
Economic development
opportunities
Ability to promote economic
development
Findings from economic analysis
Increased ridership within
corridor
Major project justification (well
utilized)
Number of linked trips served by
corridor alternative from travel
demand model output
Increased System Ridership Increased use of regional transit
system
Regional transit linked trips added
Reliability Improvement in travel time
predictability
Length of exclusive guide-way
segments and/or traffic priority
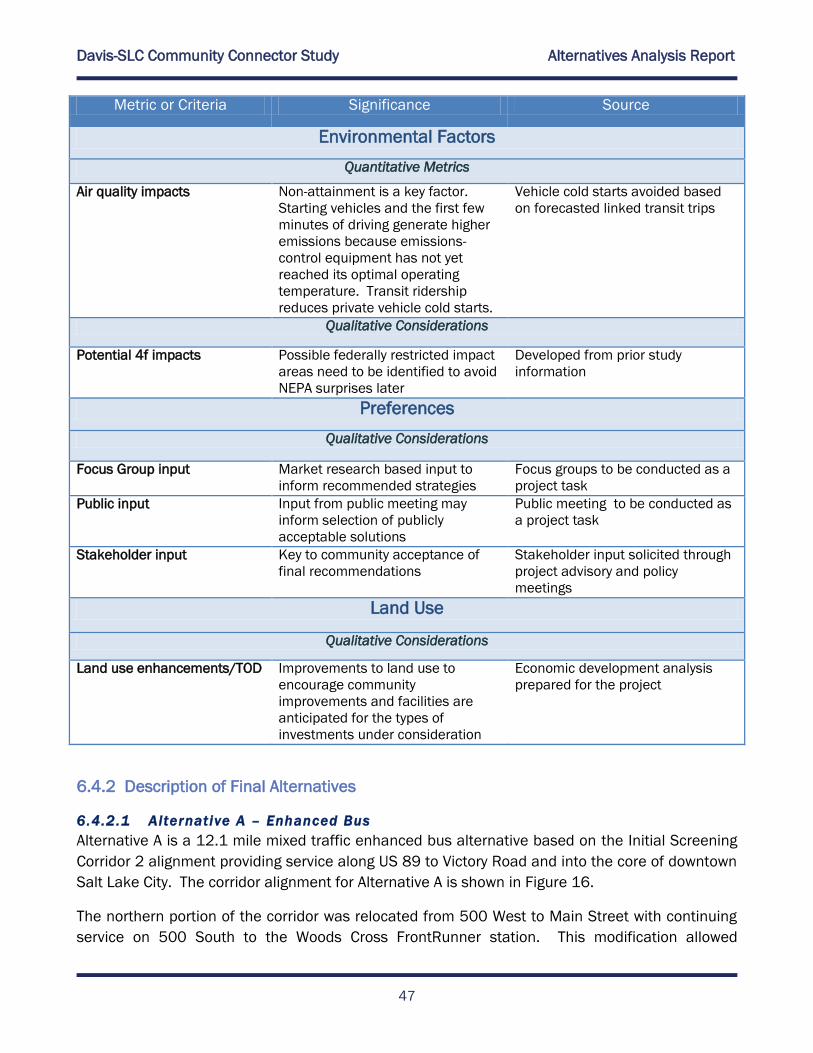
Davis-SLC Community Connector Study Alternatives Analysis Report
47
Metric or Criteria Significance Source
Environmental Factors
Quantitative Metrics
Air quality impacts Non-attainment is a key factor.
Starting vehicles and the first few
minutes of driving generate higher
emissions because emissions-
control equipment has not yet
reached its optimal operating
temperature. Transit ridership
reduces private vehicle cold starts.
Vehicle cold starts avoided based
on forecasted linked transit trips
Qualitative Considerations
Potential 4f impacts Possible federally restricted impact
areas need to be identified to avoid
NEPA surprises later
Developed from prior study
information
Preferences
Qualitative Considerations
Focus Group input Market research based input to
inform recommended strategies
Focus groups to be conducted as a
project task
Public input Input from public meeting may
inform selection of publicly
acceptable solutions
Public meeting to be conducted as
a project task
Stakeholder input Key to community acceptance of
final recommendations
Stakeholder input solicited through
project advisory and policy
meetings
Land Use
Qualitative Considerations
Land use enhancements/TOD Improvements to land use to
encourage community
improvements and facilities are
anticipated for the types of
investments under consideration
Economic development analysis
prepared for the project
6.4.2 Description of Final Alternatives
6.4.2.1 Alternative A – Enhanced Bus
Alternative A is a 12.1 mile mixed traffic enhanced bus alternative based on the Initial Screening
Corridor 2 alignment providing service along US 89 to Victory Road and into the core of downtown
Salt Lake City. The corridor alignment for Alternative A is shown in Figure 16.
The northern portion of the corridor was relocated from 500 West to Main Street with continuing
service on 500 South to the Woods Cross FrontRunner station. This modification allowed
Davis-SLC Community Connector Study Alternatives Analysis Report
48
improved bus service to serve downtown Bountiful, a major transit destination, and meet the
community’s objective of enhanced east-west service between existing commuter rail stations in
the western portion of the corridor and major destinations in the eastern portion of the corridor.
(Note that a desire was expressed by UTA and the City of Bountiful to retain alternate alignment
options on 500 West and 200 West through the environmental and preliminary engineering
phases of the project.)
Within downtown Salt Lake City, the alignment was refined to provide for a turnaround loop and
direct transfers to TRAX light rail transit stations going east to the University of Utah, south to
Sandy City and South Jordan City, and west to the airport.
These modifications to the alternative include a FrontRunner connection at the northern end of
the corridor and connections to the major light rail transfer hub in downtown Salt Lake City. This
alternative also provides direct service to the major employment destinations within downtown
Salt Lake City.
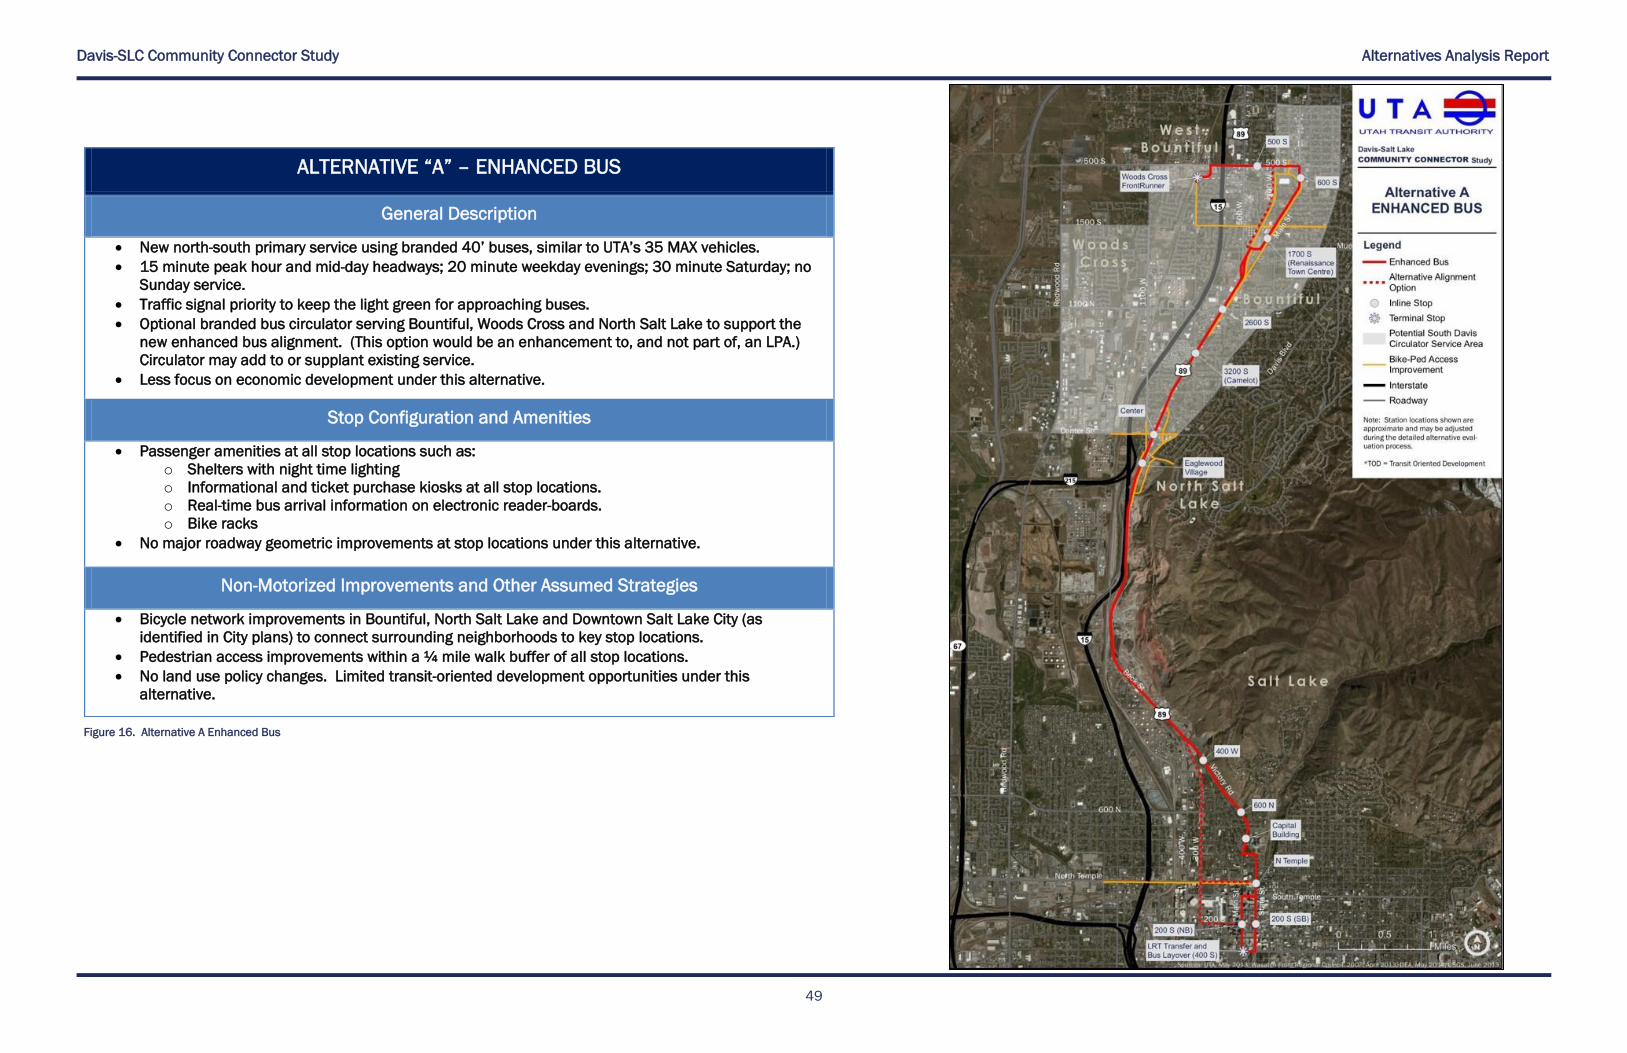
Davis-SLC Community Connector Study Alternatives Analysis Report
49
ALTERNATIVE “A” – ENHANCED BUS
General Description
New north-south primary service using branded 40’ buses, similar to UTA’s 35 MAX vehicles.
15 minute peak hour and mid-day headways; 20 minute weekday evenings; 30 minute Saturday; no
Sunday service.
Traffic signal priority to keep the light green for approaching buses.
Optional branded bus circulator serving Bountiful, Woods Cross and North Salt Lake to support the
new enhanced bus alignment. (This option would be an enhancement to, and not part of, an LPA.)
Circulator may add to or supplant existing service.
Less focus on economic development under this alternative.
Stop Configuration and Amenities
Passenger amenities at all stop locations such as:
o Shelters with night time lighting
o Informational and ticket purchase kiosks at all stop locations.
o Real-time bus arrival information on electronic reader-boards.
o Bike racks
No major roadway geometric improvements at stop locations under this alternative.
Non-Motorized Improvements and Other Assumed Strategies
Bicycle network improvements in Bountiful, North Salt Lake and Downtown Salt Lake City (as
identified in City plans) to connect surrounding neighborhoods to key stop locations.
Pedestrian access improvements within a ¼ mile walk buffer of all stop locations.
No land use policy changes. Limited transit-oriented development opportunities under this
alternative.
Figure 16. Alternative A Enhanced Bus
Davis-SLC Community Connector Study Alternatives Analysis Report
50
Intentionally Blank Page.
Davis-SLC Community Connector Study Alternatives Analysis Report
51
6.4.2.2 Alternative B – Bus Rapid Transit (BRT)
Alternative B is an 11.8 mile corridor with 5.6 miles of busway and is based on Initial Screening
Corridor 4 alignment providing service along US 89 to 400 West along the western edge of
downtown Salt Lake City.
The corridor alignment for Alternative B is shown in Figure 17.
An extension of the northern portion of the corridor was added along 500 South to the Woods
Cross FrontRunner station. This modification met the community’s objective of enhanced east-
west service between existing commuter rail stations in the western portion of the corridor and
major destinations in the eastern portion of the corridor.
Within downtown Salt Lake City, the alignment was refined to provide for a turnaround loop
between 200 South and 400 South, allowing direct transfers to TRAX light rail transit stations
going east to the University of Utah, South to Sandy and South Jordan, and west to the airport. An
option to extend mixed-flow BRT service along 200 South to the University of Utah was retained as
a temporary service option until the planned streetcar service is completed. Additionally, the
assumed route for the BRT alternative was shifted slightly from 300 West to the 400 West
corridor. This change was made based on a higher potential for economic development and
transit-focused zoning in the 400 West corridor.
These modifications to the alternative include a FrontRunner connection at the northern end of
the corridor and connections to the major light rail transfer hub in downtown Salt Lake City.
Service to downtown FrontRunner stations is also in close proximity to downtown BRT stations
provided in this alternative. The refined downtown alignments and stations for both alternatives
are shown in Figure 18.
Davis-SLC Community Connector Study Alternatives Analysis Report
52
Intentionally Blank Page.
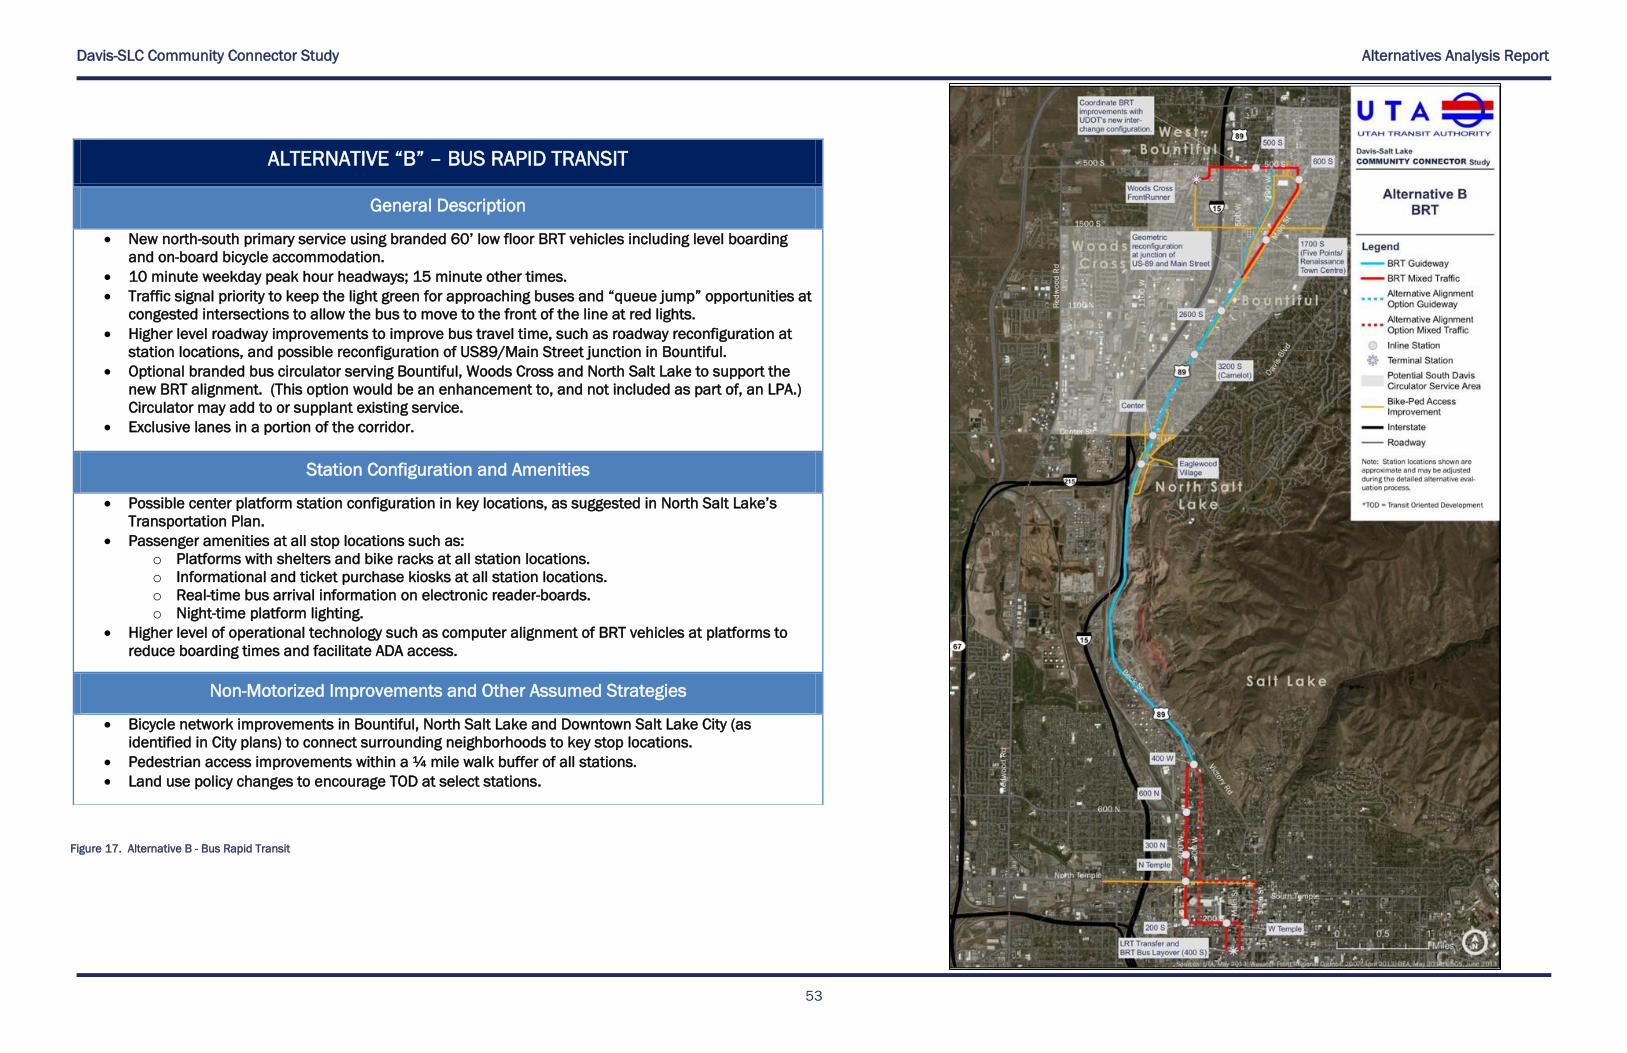
Davis-SLC Community Connector Study Alternatives Analysis Report
53
ALTERNATIVE “B” – BUS RAPID TRANSIT
General Description
New north-south primary service using branded 60’ low floor BRT vehicles including level boarding
and on-board bicycle accommodation.
10 minute weekday peak hour headways; 15 minute other times.
Traffic signal priority to keep the light green for approaching buses and “queue jump” opportunities at
congested intersections to allow the bus to move to the front of the line at red lights.
Higher level roadway improvements to improve bus travel time, such as roadway reconfiguration at
station locations, and possible reconfiguration of US89/Main Street junction in Bountiful.
Optional branded bus circulator serving Bountiful, Woods Cross and North Salt Lake to support the
new BRT alignment. (This option would be an enhancement to, and not included as part of, an LPA.)
Circulator may add to or supplant existing service.
Exclusive lanes in a portion of the corridor.
Station Configuration and Amenities
Possible center platform station configuration in key locations, as suggested in North Salt Lake’s
Transportation Plan.
Passenger amenities at all stop locations such as:
o Platforms with shelters and bike racks at all station locations.
o Informational and ticket purchase kiosks at all station locations.
o Real-time bus arrival information on electronic reader-boards.
o Night-time platform lighting.
Higher level of operational technology such as computer alignment of BRT vehicles at platforms to
reduce boarding times and facilitate ADA access.
Non-Motorized Improvements and Other Assumed Strategies
Bicycle network improvements in Bountiful, North Salt Lake and Downtown Salt Lake City (as
identified in City plans) to connect surrounding neighborhoods to key stop locations.
Pedestrian access improvements within a ¼ mile walk buffer of all stations.
Land use policy changes to encourage TOD at select stations.
Figure 17. Alternative B - Bus Rapid Transit
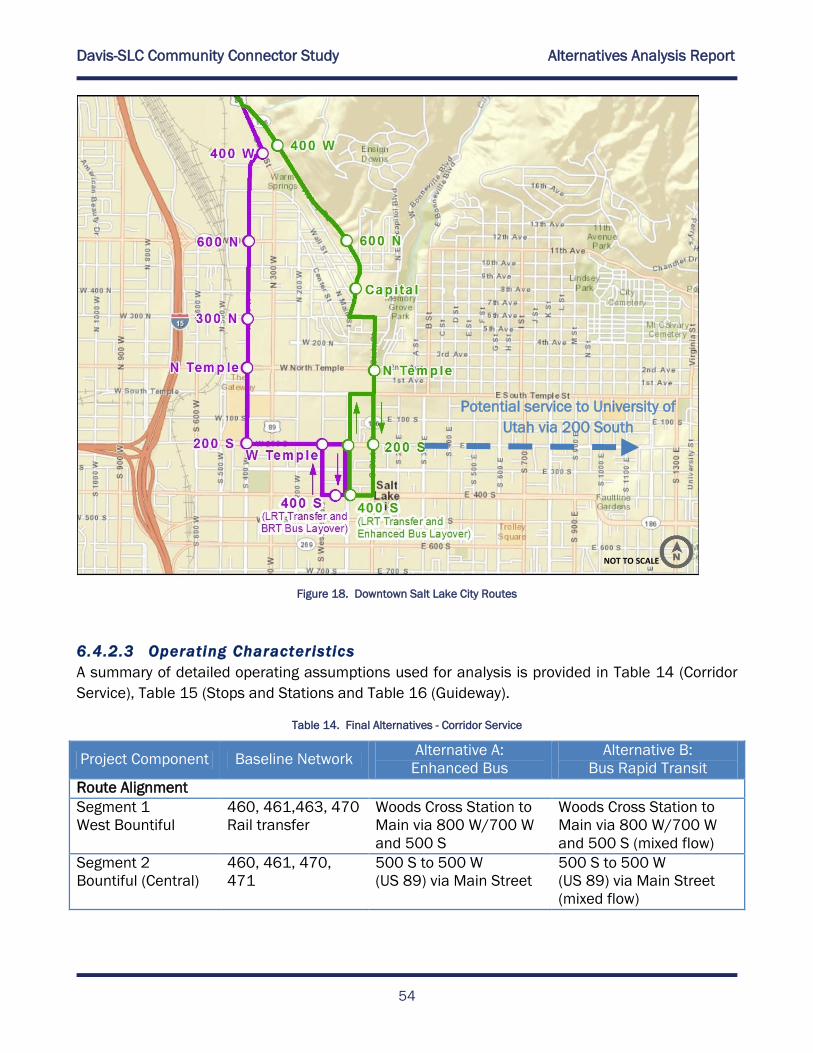
Davis-SLC Community Connector Study Alternatives Analysis Report
54
Figure 18. Downtown Salt Lake City Routes
6.4.2.3 Operating Characteristics
A summary of detailed operating assumptions used for analysis is provided in Table 14 (Corridor
Service), Table 15 (Stops and Stations and Table 16 (Guideway).
Table 14. Final Alternatives - Corridor Service
Project Component Baseline Network Alternative A:
Enhanced Bus
Alternative B:
Bus Rapid Transit
Route Alignment
Segment 1
West Bountiful
460, 461,463, 470
Rail transfer
Woods Cross Station to
Main via 800 W/700 W
and 500 S
Woods Cross Station to
Main via 800 W/700 W
and 500 S (mixed flow)
Segment 2
Bountiful (Central)
460, 461, 470,
471
500 S to 500 W
(US 89) via Main Street
500 S to 500 W
(US 89) via Main Street
(mixed flow)
Potential service to University of
Utah via 200 South
NOT TO SCALE
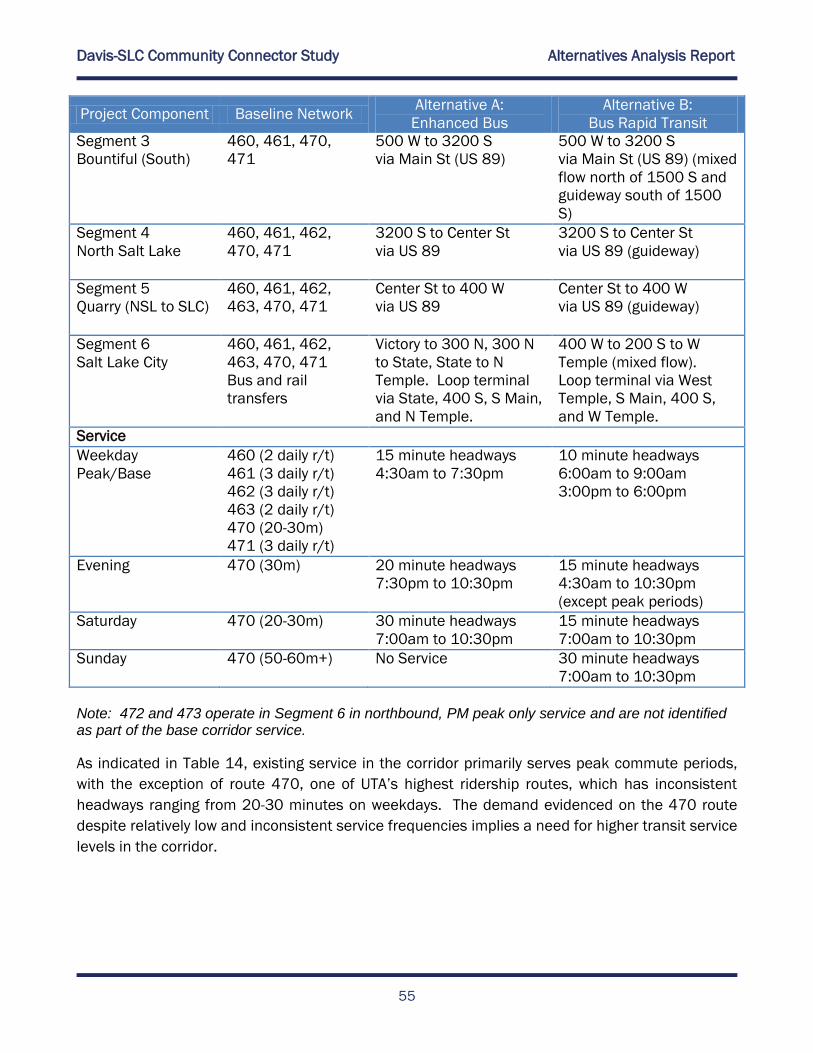
Davis-SLC Community Connector Study Alternatives Analysis Report
55
Project Component Baseline Network Alternative A:
Enhanced Bus
Alternative B:
Bus Rapid Transit
Segment 3
Bountiful (South)
460, 461, 470,
471
500 W to 3200 S
via Main St (US 89)
500 W to 3200 S
via Main St (US 89) (mixed
flow north of 1500 S and
guideway south of 1500
S)
Segment 4
North Salt Lake
460, 461, 462,
470, 471
3200 S to Center St
via US 89
3200 S to Center St
via US 89 (guideway)
Segment 5
Quarry (NSL to SLC)
460, 461, 462,
463, 470, 471
Center St to 400 W
via US 89
Center St to 400 W
via US 89 (guideway)
Segment 6
Salt Lake City
460, 461, 462,
463, 470, 471
Bus and rail
transfers
Victory to 300 N, 300 N
to State, State to N
Temple. Loop terminal
via State, 400 S, S Main,
and N Temple.
400 W to 200 S to W
Temple (mixed flow).
Loop terminal via West
Temple, S Main, 400 S,
and W Temple.
Service
Weekday
Peak/Base
460 (2 daily r/t)
461 (3 daily r/t)
462 (3 daily r/t)
463 (2 daily r/t)
470 (20-30m)
471 (3 daily r/t)
15 minute headways
4:30am to 7:30pm
10 minute headways
6:00am to 9:00am
3:00pm to 6:00pm
Evening 470 (30m) 20 minute headways
7:30pm to 10:30pm
15 minute headways
4:30am to 10:30pm
(except peak periods)
Saturday 470 (20-30m) 30 minute headways
7:00am to 10:30pm
15 minute headways
7:00am to 10:30pm
Sunday 470 (50-60m+) No Service 30 minute headways
7:00am to 10:30pm
Note: 472 and 473 operate in Segment 6 in northbound, PM peak only service and are not identified as part of the base corridor service. As indicated in Table 14, existing service in the corridor primarily serves peak commute periods,
with the exception of route 470, one of UTA’s highest ridership routes, which has inconsistent
headways ranging from 20-30 minutes on weekdays. The demand evidenced on the 470 route
despite relatively low and inconsistent service frequencies implies a need for higher transit service
levels in the corridor.
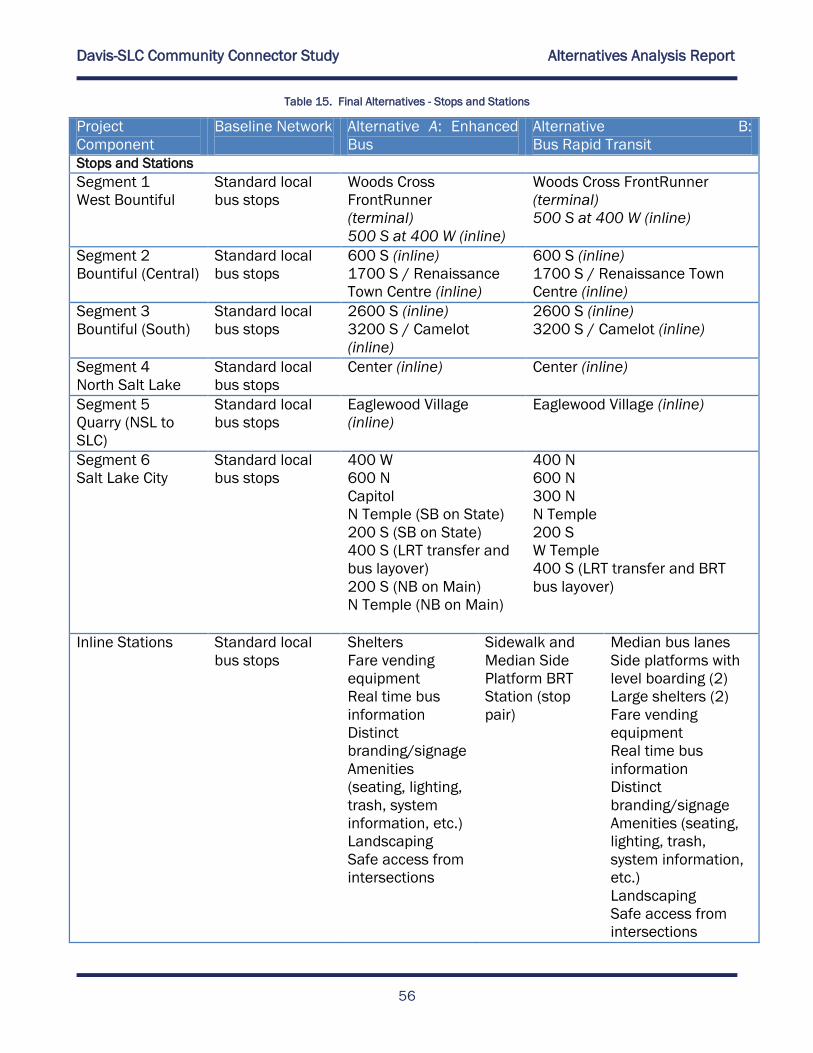
Davis-SLC Community Connector Study Alternatives Analysis Report
56
Table 15. Final Alternatives - Stops and Stations
Project
Component
Baseline Network
Alternative A: Enhanced
Bus
Alternative B:
Bus Rapid Transit
Stops and Stations
Segment 1
West Bountiful
Standard local
bus stops
Woods Cross
FrontRunner
(terminal)
500 S at 400 W (inline)
Woods Cross FrontRunner
(terminal)
500 S at 400 W (inline)
Segment 2
Bountiful (Central)
Standard local
bus stops
600 S (inline)
1700 S / Renaissance
Town Centre (inline)
600 S (inline)
1700 S / Renaissance Town
Centre (inline)
Segment 3
Bountiful (South)
Standard local
bus stops
2600 S (inline)
3200 S / Camelot
(inline)
2600 S (inline)
3200 S / Camelot (inline)
Segment 4
North Salt Lake
Standard local
bus stops
Center (inline)
Center (inline)
Segment 5
Quarry (NSL to
SLC)
Standard local
bus stops
Eaglewood Village
(inline)
Eaglewood Village (inline)
Segment 6
Salt Lake City
Standard local
bus stops
400 W
600 N
Capitol
N Temple (SB on State)
200 S (SB on State)
400 S (LRT transfer and
bus layover)
200 S (NB on Main)
N Temple (NB on Main)
400 N
600 N
300 N
N Temple
200 S
W Temple
400 S (LRT transfer and BRT
bus layover)
Inline Stations Standard local
bus stops
Shelters
Fare vending
equipment
Real time bus
information
Distinct
branding/signage
Amenities
(seating, lighting,
trash, system
information, etc.)
Landscaping
Safe access from
intersections
Sidewalk and
Median Side
Platform BRT
Station (stop
pair)
Median bus lanes
Side platforms with
level boarding (2)
Large shelters (2)
Fare vending
equipment
Real time bus
information
Distinct
branding/signage
Amenities (seating,
lighting, trash,
system information,
etc.)
Landscaping
Safe access from
intersections
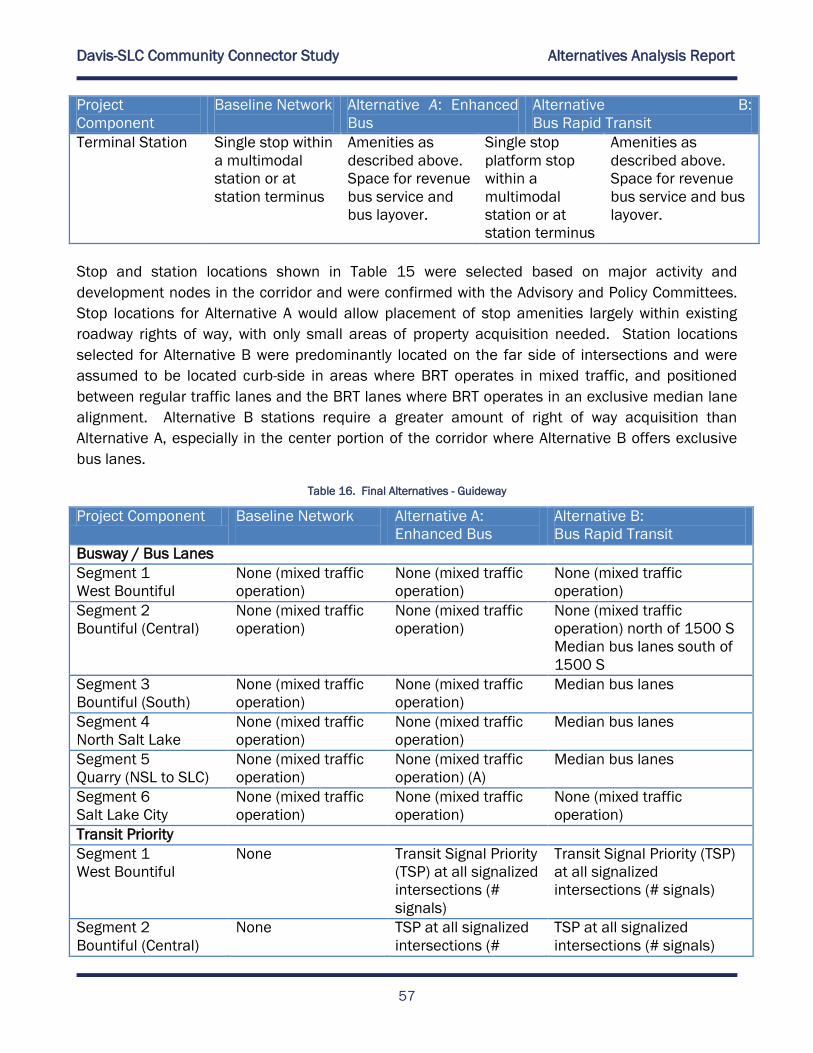
Davis-SLC Community Connector Study Alternatives Analysis Report
57
Project
Component
Baseline Network
Alternative A: Enhanced
Bus
Alternative B:
Bus Rapid Transit
Terminal Station Single stop within
a multimodal
station or at
station terminus
Amenities as
described above.
Space for revenue
bus service and
bus layover.
Single stop
platform stop
within a
multimodal
station or at
station terminus
Amenities as
described above.
Space for revenue
bus service and bus
layover.
Stop and station locations shown in Table 15 were selected based on major activity and
development nodes in the corridor and were confirmed with the Advisory and Policy Committees.
Stop locations for Alternative A would allow placement of stop amenities largely within existing
roadway rights of way, with only small areas of property acquisition needed. Station locations
selected for Alternative B were predominantly located on the far side of intersections and were
assumed to be located curb-side in areas where BRT operates in mixed traffic, and positioned
between regular traffic lanes and the BRT lanes where BRT operates in an exclusive median lane
alignment. Alternative B stations require a greater amount of right of way acquisition than
Alternative A, especially in the center portion of the corridor where Alternative B offers exclusive
bus lanes.
Table 16. Final Alternatives - Guideway
Project Component Baseline Network
Alternative A:
Enhanced Bus
Alternative B:
Bus Rapid Transit
Busway / Bus Lanes
Segment 1
West Bountiful
None (mixed traffic
operation)
None (mixed traffic
operation)
None (mixed traffic
operation)
Segment 2
Bountiful (Central)
None (mixed traffic
operation)
None (mixed traffic
operation)
None (mixed traffic
operation) north of 1500 S
Median bus lanes south of
1500 S
Segment 3
Bountiful (South)
None (mixed traffic
operation)
None (mixed traffic
operation)
Median bus lanes
Segment 4
North Salt Lake
None (mixed traffic
operation)
None (mixed traffic
operation)
Median bus lanes
Segment 5
Quarry (NSL to SLC)
None (mixed traffic
operation)
None (mixed traffic
operation) (A)
Median bus lanes
Segment 6
Salt Lake City
None (mixed traffic
operation)
None (mixed traffic
operation)
None (mixed traffic
operation)
Transit Priority
Segment 1
West Bountiful
None Transit Signal Priority
(TSP) at all signalized
intersections (#
signals)
Transit Signal Priority (TSP)
at all signalized
intersections (# signals)
Segment 2
Bountiful (Central)
None TSP at all signalized
intersections (#
TSP at all signalized
intersections (# signals)
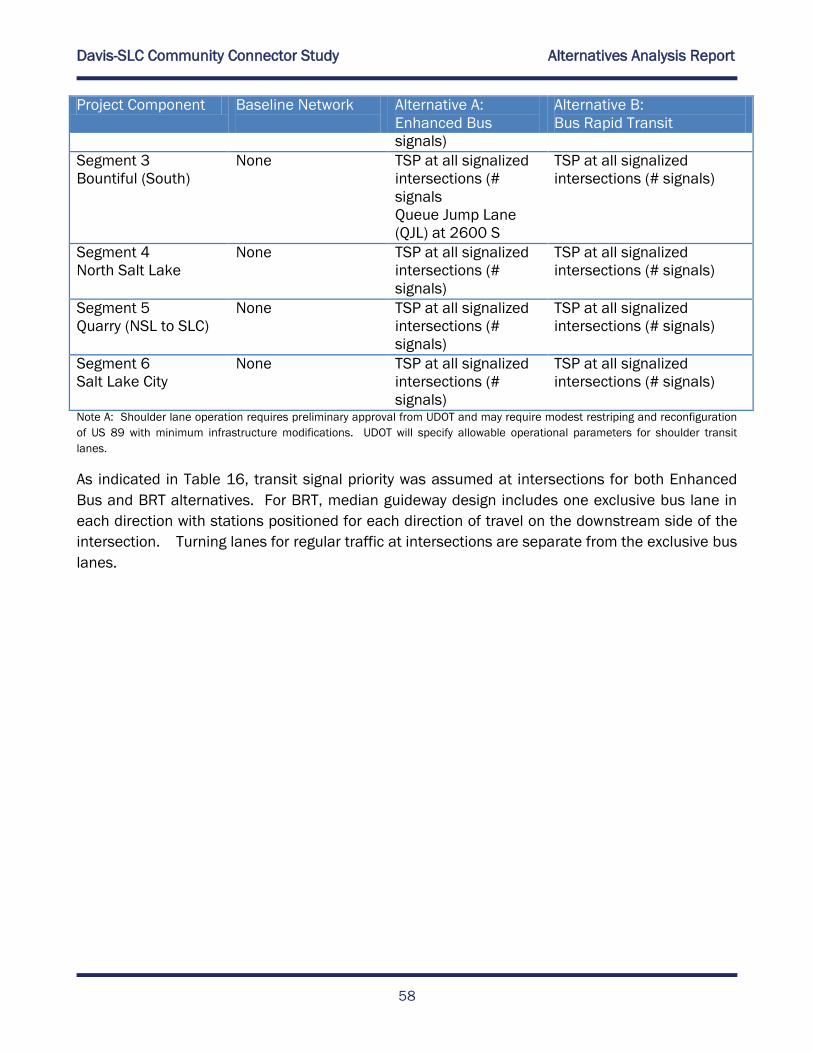
Davis-SLC Community Connector Study Alternatives Analysis Report
58
Project Component Baseline Network
Alternative A:
Enhanced Bus
Alternative B:
Bus Rapid Transit
signals)
Segment 3
Bountiful (South)
None TSP at all signalized
intersections (#
signals
Queue Jump Lane
(QJL) at 2600 S
TSP at all signalized
intersections (# signals)
Segment 4
North Salt Lake
None TSP at all signalized
intersections (#
signals)
TSP at all signalized
intersections (# signals)
Segment 5
Quarry (NSL to SLC)
None TSP at all signalized
intersections (#
signals)
TSP at all signalized
intersections (# signals)
Segment 6
Salt Lake City
None TSP at all signalized
intersections (#
signals)
TSP at all signalized
intersections (# signals)
Note A: Shoulder lane operation requires preliminary approval from UDOT and may require modest restriping and reconfiguration
of US 89 with minimum infrastructure modifications. UDOT will specify allowable operational parameters for shoulder transit
lanes.
As indicated in Table 16, transit signal priority was assumed at intersections for both Enhanced
Bus and BRT alternatives. For BRT, median guideway design includes one exclusive bus lane in
each direction with stations positioned for each direction of travel on the downstream side of the
intersection. Turning lanes for regular traffic at intersections are separate from the exclusive bus
lanes.
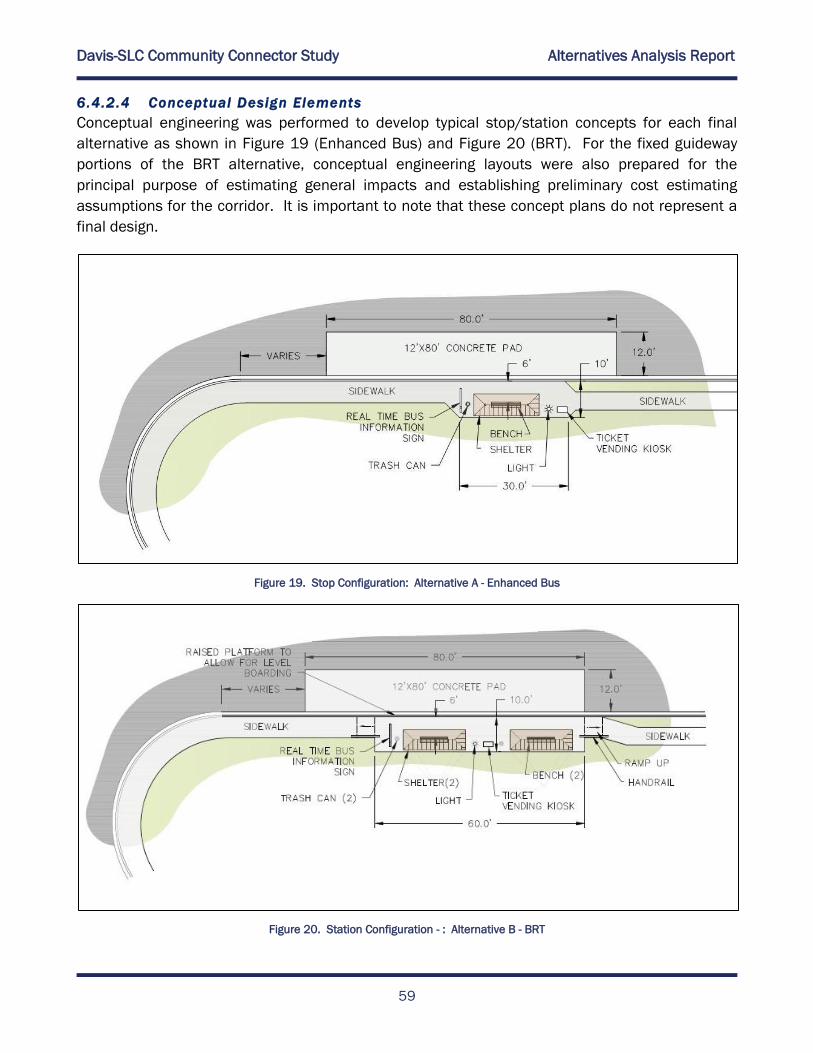
Davis-SLC Community Connector Study Alternatives Analysis Report
59
6.4.2.4 Conceptual Design Elements
Conceptual engineering was performed to develop typical stop/station concepts for each final
alternative as shown in Figure 19 (Enhanced Bus) and Figure 20 (BRT). For the fixed guideway
portions of the BRT alternative, conceptual engineering layouts were also prepared for the
principal purpose of estimating general impacts and establishing preliminary cost estimating
assumptions for the corridor. It is important to note that these concept plans do not represent a
final design.
Figure 19. Stop Configuration: Alternative A - Enhanced Bus
Figure 20. Station Configuration - : Alternative B - BRT
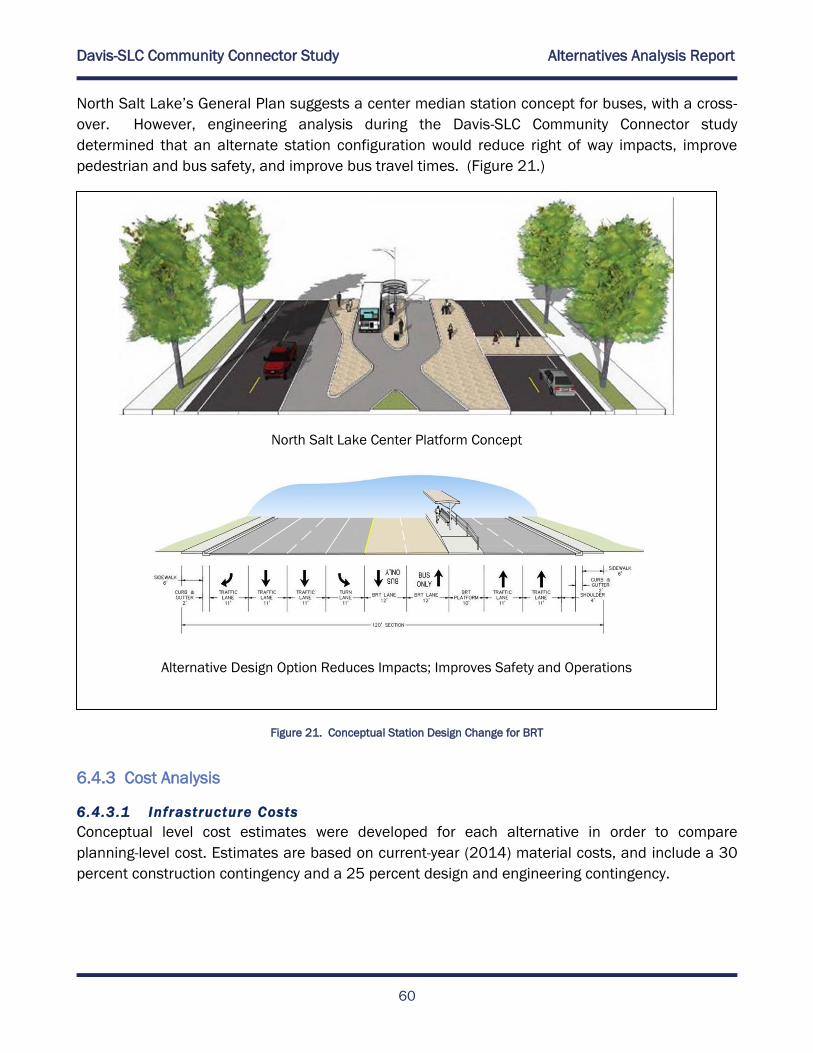
Davis-SLC Community Connector Study Alternatives Analysis Report
60
North Salt Lake’s General Plan suggests a center median station concept for buses, with a cross-
over. However, engineering analysis during the Davis-SLC Community Connector study
determined that an alternate station configuration would reduce right of way impacts, improve
pedestrian and bus safety, and improve bus travel times. (Figure 21.)
Figure 21. Conceptual Station Design Change for BRT
6.4.3 Cost Analysis
6.4.3.1 Infrastructure Costs
Conceptual level cost estimates were developed for each alternative in order to compare
planning-level cost. Estimates are based on current-year (2014) material costs, and include a 30
percent construction contingency and a 25 percent design and engineering contingency.
North Salt Lake Center Platform Concept
Alternative Design Option Reduces Impacts; Improves Safety and Operations
Davis-SLC Community Connector Study Alternatives Analysis Report
61
Alternative A – Enhanced Bus Infrastructure Summary and Costs
There are a total of 14 new stop locations as part of Alternative A; 11 bi-directional stops and
three one-directional stop totaling 25 new stop platforms. Each stop is 10’ wide by approximately
30 feet long and includes the amenities summarized in Appendix G. The cost for the stops only is
estimated to be:
Estimated Cost per Stop: $150,000
Estimated Total cost: $3,750,000
Alternative A also includes modifications to each signalized intersection to provide traffic signal
priority to the buses. Additionally, removal of existing asphalt and replacement with a concrete
stop pad is proposed for the outside lane at each signalized intersection. The cost for the
intersection modifications is estimated to be:
Traffic Signal Priority (19 intersections): $350,000
Concrete approach slabs (2 per intersection): $1,300,000
The total estimated infrastructure cost for Alternative A – Enhanced Bus, excluding right-of-way
cost, is estimated at $5,430,000.
Alternative B - Bus Rapid Transit (BRT) Infrastructure Summary and Costs
For Alternative B, four primary elements were included as part of the infrastructure costs;
exclusive guideway BRT lanes, improvements of the stops, modifications to traffic signals, and the
addition of concrete stop pads at signalized intersection.
BRT will operate in either mixed flow or in exclusive center guideway lanes. The center guideway
portion of the BRT route was assumed to run from 1500 South to 400 West with the exception of
in the area of US 89/Main Street where the route follows the existing ramp alignments from 1800
South to approximately 2300 South.
Where the BRT is operating in the mixed flow condition, limited infrastructure improvements are
proposed. For the exclusive guideway sections of BRT, full curb to curb replacement is only
proposed when the existing roadway is in poor condition. Since much of the route appears to be
relatively new pavement, the 24’ concrete exclusive BRT lanes would be cut into the existing
roadway, and curb and sidewalk removed and replaced on one or both sides to allow for the
necessary widening of the road section. The cost for the exclusive guideway BRT lanes and
associated road widening is estimated to be:
Exclusive Guideway BRT Lanes
24’ wide concrete lanes including road widening: $28,000,000
Two types of stations are proposed for Alternative B, center median platform stations and side
running platform stations. While the location of the stations differs, the amenities for each are
generally the same.
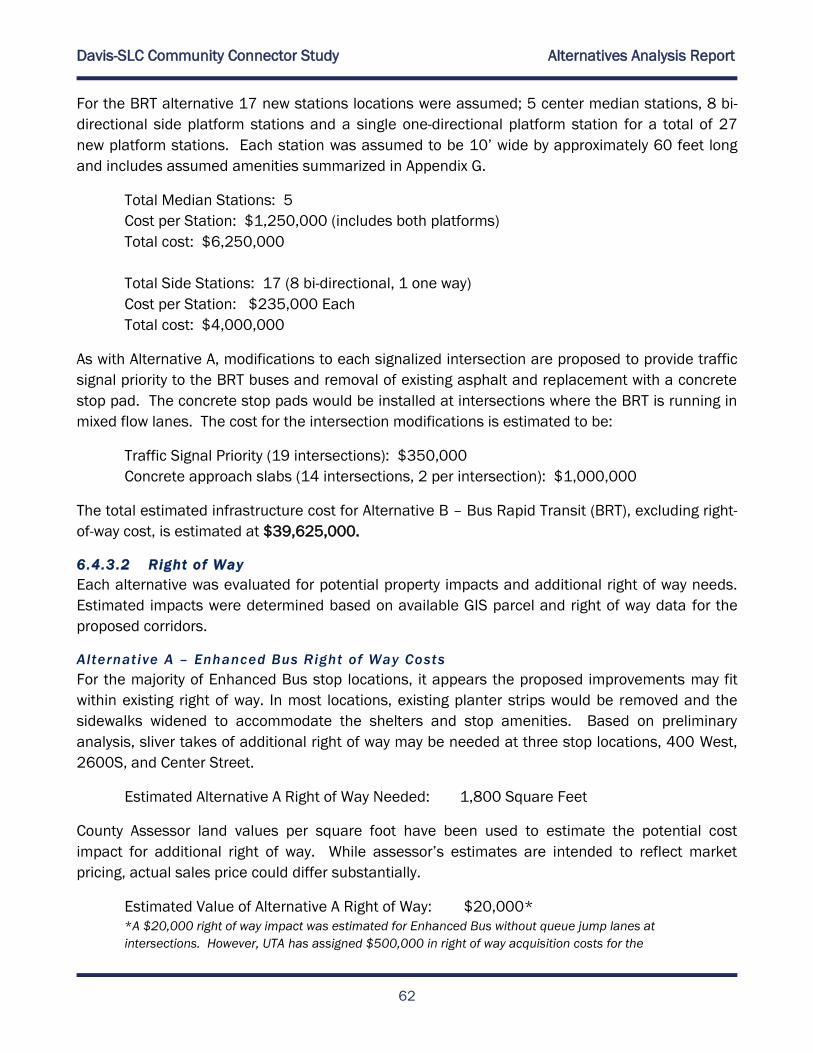
Davis-SLC Community Connector Study Alternatives Analysis Report
62
For the BRT alternative 17 new stations locations were assumed; 5 center median stations, 8 bi-
directional side platform stations and a single one-directional platform station for a total of 27
new platform stations. Each station was assumed to be 10’ wide by approximately 60 feet long
and includes assumed amenities summarized in Appendix G.
Total Median Stations: 5
Cost per Station: $1,250,000 (includes both platforms)
Total cost: $6,250,000
Total Side Stations: 17 (8 bi-directional, 1 one way)
Cost per Station: $235,000 Each
Total cost: $4,000,000
As with Alternative A, modifications to each signalized intersection are proposed to provide traffic
signal priority to the BRT buses and removal of existing asphalt and replacement with a concrete
stop pad. The concrete stop pads would be installed at intersections where the BRT is running in
mixed flow lanes. The cost for the intersection modifications is estimated to be:
Traffic Signal Priority (19 intersections): $350,000
Concrete approach slabs (14 intersections, 2 per intersection): $1,000,000
The total estimated infrastructure cost for Alternative B – Bus Rapid Transit (BRT), excluding right-
of-way cost, is estimated at $39,625,000.
6.4.3.2 Right of Way
Each alternative was evaluated for potential property impacts and additional right of way needs.
Estimated impacts were determined based on available GIS parcel and right of way data for the
proposed corridors.
Alternative A – Enhanced Bus Right of Way Costs
For the majority of Enhanced Bus stop locations, it appears the proposed improvements may fit
within existing right of way. In most locations, existing planter strips would be removed and the
sidewalks widened to accommodate the shelters and stop amenities. Based on preliminary
analysis, sliver takes of additional right of way may be needed at three stop locations, 400 West,
2600S, and Center Street.
Estimated Alternative A Right of Way Needed: 1,800 Square Feet
County Assessor land values per square foot have been used to estimate the potential cost
impact for additional right of way. While assessor’s estimates are intended to reflect market
pricing, actual sales price could differ substantially.
Estimated Value of Alternative A Right of Way: $20,000*
*A $20,000 right of way impact was estimated for Enhanced Bus without queue jump lanes at
intersections. However, UTA has assigned $500,000 in right of way acquisition costs for the
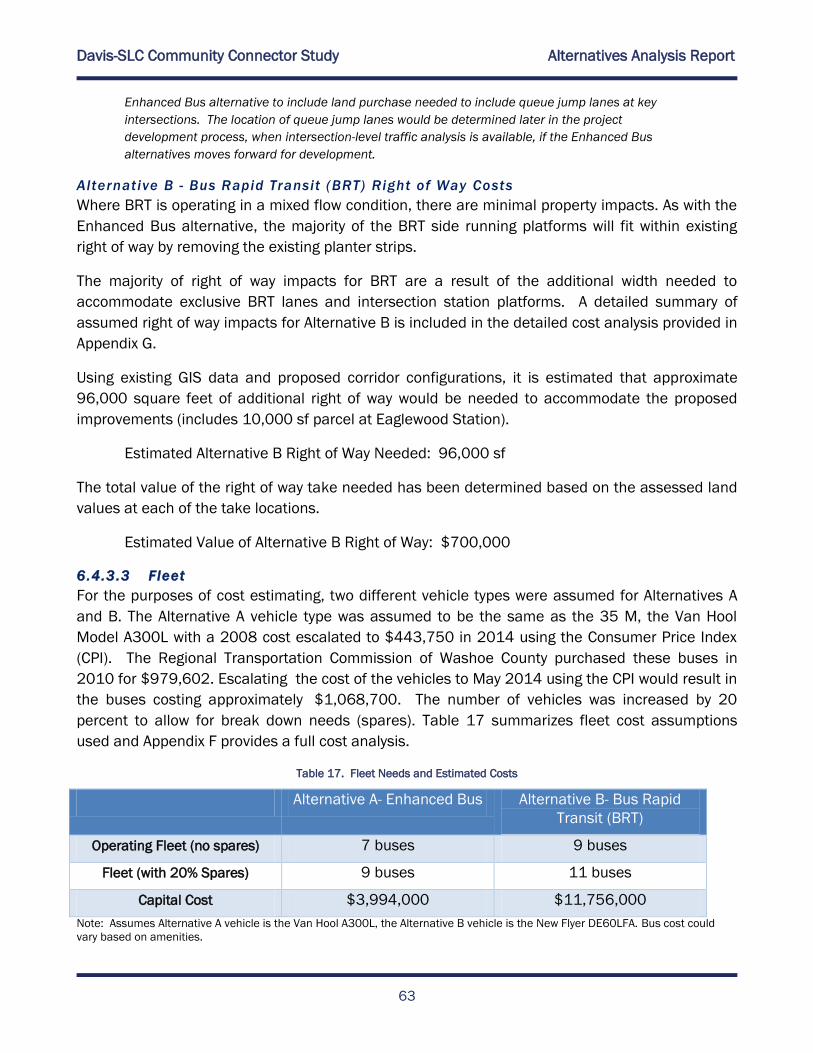
Davis-SLC Community Connector Study Alternatives Analysis Report
63
Enhanced Bus alternative to include land purchase needed to include queue jump lanes at key
intersections. The location of queue jump lanes would be determined later in the project
development process, when intersection-level traffic analysis is available, if the Enhanced Bus
alternatives moves forward for development.
Alternative B - Bus Rapid Transit (BRT) Right of Way Costs
Where BRT is operating in a mixed flow condition, there are minimal property impacts. As with the
Enhanced Bus alternative, the majority of the BRT side running platforms will fit within existing
right of way by removing the existing planter strips.
The majority of right of way impacts for BRT are a result of the additional width needed to
accommodate exclusive BRT lanes and intersection station platforms. A detailed summary of
assumed right of way impacts for Alternative B is included in the detailed cost analysis provided in
Appendix G.
Using existing GIS data and proposed corridor configurations, it is estimated that approximate
96,000 square feet of additional right of way would be needed to accommodate the proposed
improvements (includes 10,000 sf parcel at Eaglewood Station).
Estimated Alternative B Right of Way Needed: 96,000 sf
The total value of the right of way take needed has been determined based on the assessed land
values at each of the take locations.
Estimated Value of Alternative B Right of Way: $700,000
6.4.3.3 Fleet
For the purposes of cost estimating, two different vehicle types were assumed for Alternatives A
and B. The Alternative A vehicle type was assumed to be the same as the 35 M, the Van Hool
Model A300L with a 2008 cost escalated to $443,750 in 2014 using the Consumer Price Index
(CPI). The Regional Transportation Commission of Washoe County purchased these buses in
2010 for $979,602. Escalating the cost of the vehicles to May 2014 using the CPI would result in
the buses costing approximately $1,068,700. The number of vehicles was increased by 20
percent to allow for break down needs (spares). Table 17 summarizes fleet cost assumptions
used and Appendix F provides a full cost analysis.
Table 17. Fleet Needs and Estimated Costs
Alternative A- Enhanced Bus Alternative B- Bus Rapid
Transit (BRT)
Operating Fleet (no spares) 7 buses 9 buses
Fleet (with 20% Spares) 9 buses 11 buses
Capital Cost $3,994,000 $11,756,000
Note: Assumes Alternative A vehicle is the Van Hool A300L, the Alternative B vehicle is the New Flyer DE60LFA. Bus cost could
vary based on amenities.
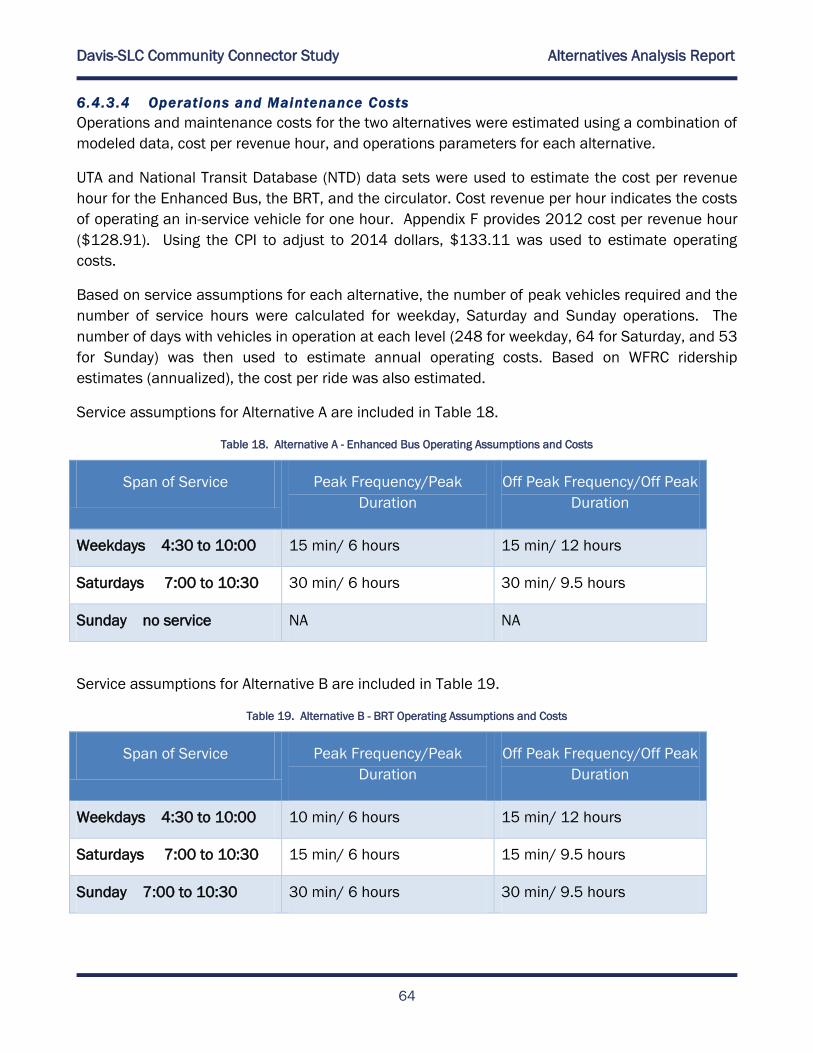
Davis-SLC Community Connector Study Alternatives Analysis Report
64
6.4.3.4 Operations and Maintenance Costs
Operations and maintenance costs for the two alternatives were estimated using a combination of
modeled data, cost per revenue hour, and operations parameters for each alternative.
UTA and National Transit Database (NTD) data sets were used to estimate the cost per revenue
hour for the Enhanced Bus, the BRT, and the circulator. Cost revenue per hour indicates the costs
of operating an in-service vehicle for one hour. Appendix F provides 2012 cost per revenue hour
($128.91). Using the CPI to adjust to 2014 dollars, $133.11 was used to estimate operating
costs.
Based on service assumptions for each alternative, the number of peak vehicles required and the
number of service hours were calculated for weekday, Saturday and Sunday operations. The
number of days with vehicles in operation at each level (248 for weekday, 64 for Saturday, and 53
for Sunday) was then used to estimate annual operating costs. Based on WFRC ridership
estimates (annualized), the cost per ride was also estimated.
Service assumptions for Alternative A are included in Table 18.
Table 18. Alternative A - Enhanced Bus Operating Assumptions and Costs
Span of Service Peak Frequency/Peak
Duration
Off Peak Frequency/Off Peak
Duration
Weekdays 4:30 to 10:00 15 min/ 6 hours 15 min/ 12 hours
Saturdays 7:00 to 10:30 30 min/ 6 hours 30 min/ 9.5 hours
Sunday no service NA NA
Service assumptions for Alternative B are included in Table 19.
Table 19. Alternative B - BRT Operating Assumptions and Costs
Span of Service Peak Frequency/Peak
Duration
Off Peak Frequency/Off Peak
Duration
Weekdays 4:30 to 10:00 10 min/ 6 hours 15 min/ 12 hours
Saturdays 7:00 to 10:30 15 min/ 6 hours 15 min/ 9.5 hours
Sunday 7:00 to 10:30 30 min/ 6 hours 30 min/ 9.5 hours
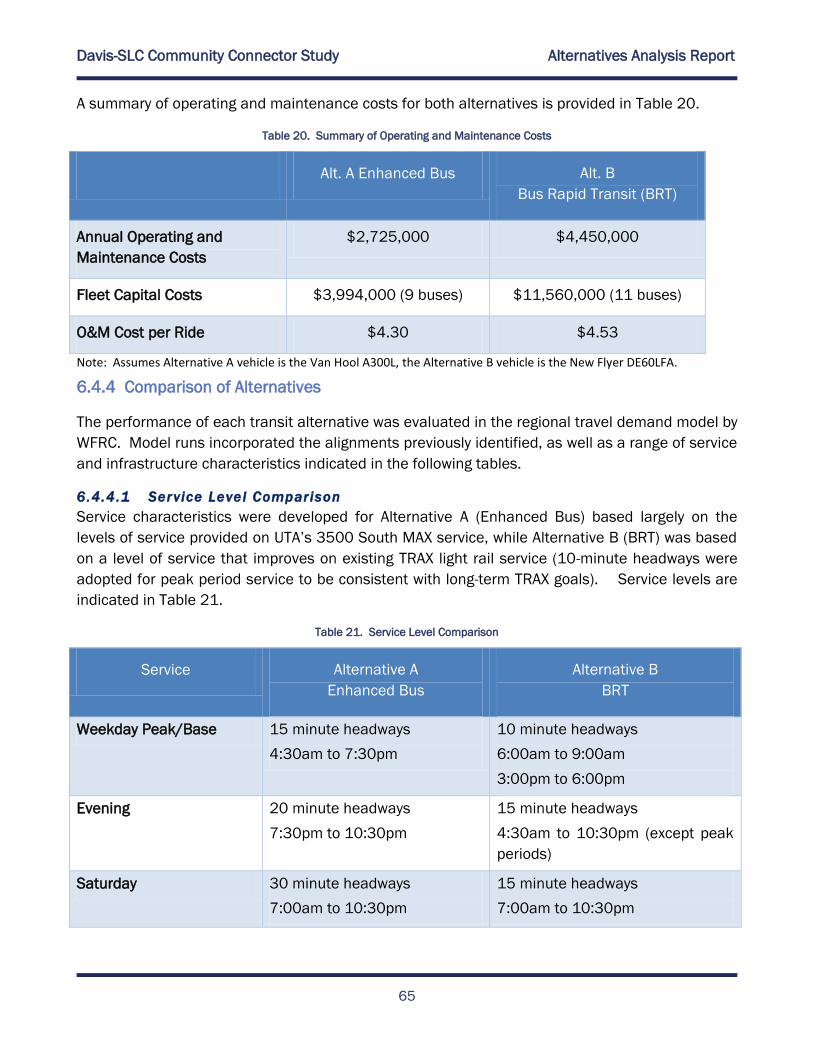
Davis-SLC Community Connector Study Alternatives Analysis Report
65
A summary of operating and maintenance costs for both alternatives is provided in Table 20.
Table 20. Summary of Operating and Maintenance Costs
Alt. A Enhanced Bus Alt. B
Bus Rapid Transit (BRT)
Annual Operating and
Maintenance Costs
$2,725,000 $4,450,000
Fleet Capital Costs $3,994,000 (9 buses) $11,560,000 (11 buses)
O&M Cost per Ride $4.30 $4.53
Note: Assumes Alternative A vehicle is the Van Hool A300L, the Alternative B vehicle is the New Flyer DE60LFA.
6.4.4 Comparison of Alternatives
The performance of each transit alternative was evaluated in the regional travel demand model by
WFRC. Model runs incorporated the alignments previously identified, as well as a range of service
and infrastructure characteristics indicated in the following tables.
6.4.4.1 Service Level Comparison
Service characteristics were developed for Alternative A (Enhanced Bus) based largely on the
levels of service provided on UTA’s 3500 South MAX service, while Alternative B (BRT) was based
on a level of service that improves on existing TRAX light rail service (10-minute headways were
adopted for peak period service to be consistent with long-term TRAX goals). Service levels are
indicated in Table 21.
Table 21. Service Level Comparison
Service Alternative A
Enhanced Bus Alternative B
BRT
Weekday Peak/Base 15 minute headways 4:30am to 7:30pm
10 minute headways 6:00am to 9:00am 3:00pm to 6:00pm
Evening 20 minute headways 7:30pm to 10:30pm
15 minute headways 4:30am to 10:30pm (except peak
periods)
Saturday 30 minute headways 7:00am to 10:30pm
15 minute headways 7:00am to 10:30pm
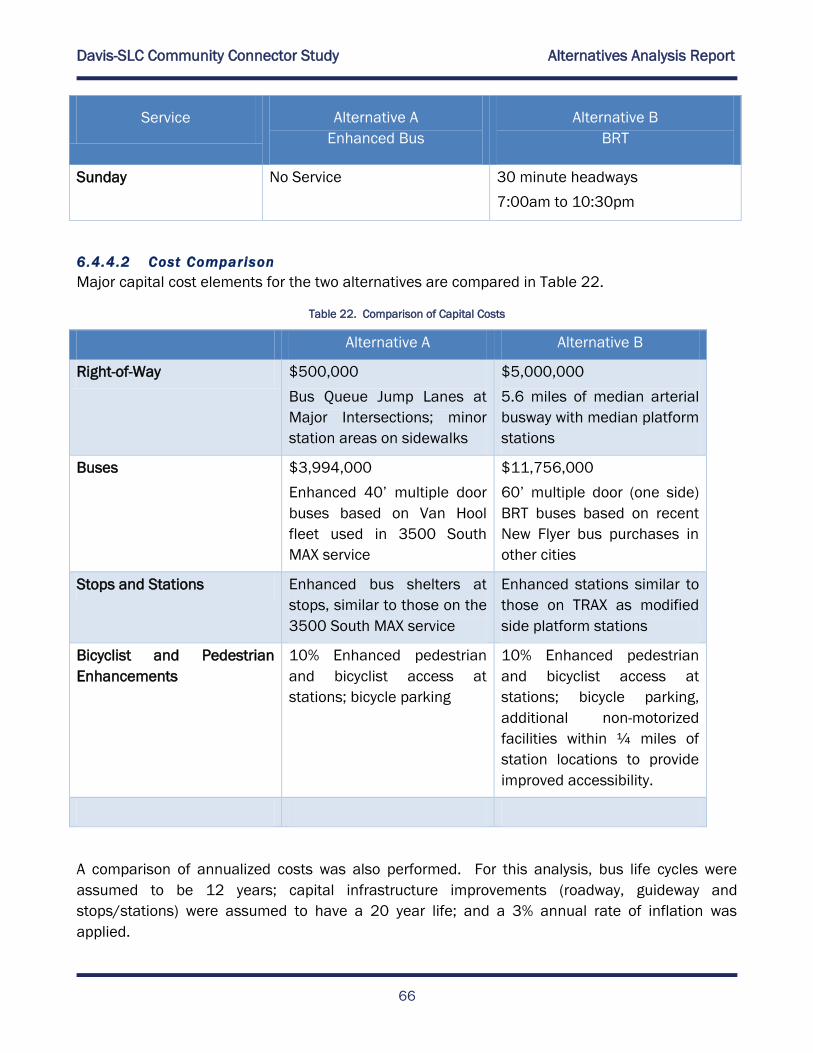
Davis-SLC Community Connector Study Alternatives Analysis Report
66
Service Alternative A
Enhanced Bus Alternative B
BRT
Sunday No Service 30 minute headways 7:00am to 10:30pm
6.4.4.2 Cost Comparison
Major capital cost elements for the two alternatives are compared in Table 22.
Table 22. Comparison of Capital Costs
Alternative A Alternative B
Right-of-Way $500,000
Bus Queue Jump Lanes at
Major Intersections; minor
station areas on sidewalks
$5,000,000
5.6 miles of median arterial
busway with median platform
stations
Buses $3,994,000
Enhanced 40’ multiple door
buses based on Van Hool
fleet used in 3500 South
MAX service
$11,756,000
60’ multiple door (one side)
BRT buses based on recent
New Flyer bus purchases in
other cities
Stops and Stations Enhanced bus shelters at
stops, similar to those on the
3500 South MAX service
Enhanced stations similar to
those on TRAX as modified
side platform stations
Bicyclist and Pedestrian
Enhancements
10% Enhanced pedestrian
and bicyclist access at
stations; bicycle parking
10% Enhanced pedestrian
and bicyclist access at
stations; bicycle parking,
additional non-motorized
facilities within ¼ miles of
station locations to provide
improved accessibility.
A comparison of annualized costs was also performed. For this analysis, bus life cycles were
assumed to be 12 years; capital infrastructure improvements (roadway, guideway and
stops/stations) were assumed to have a 20 year life; and a 3% annual rate of inflation was
applied.
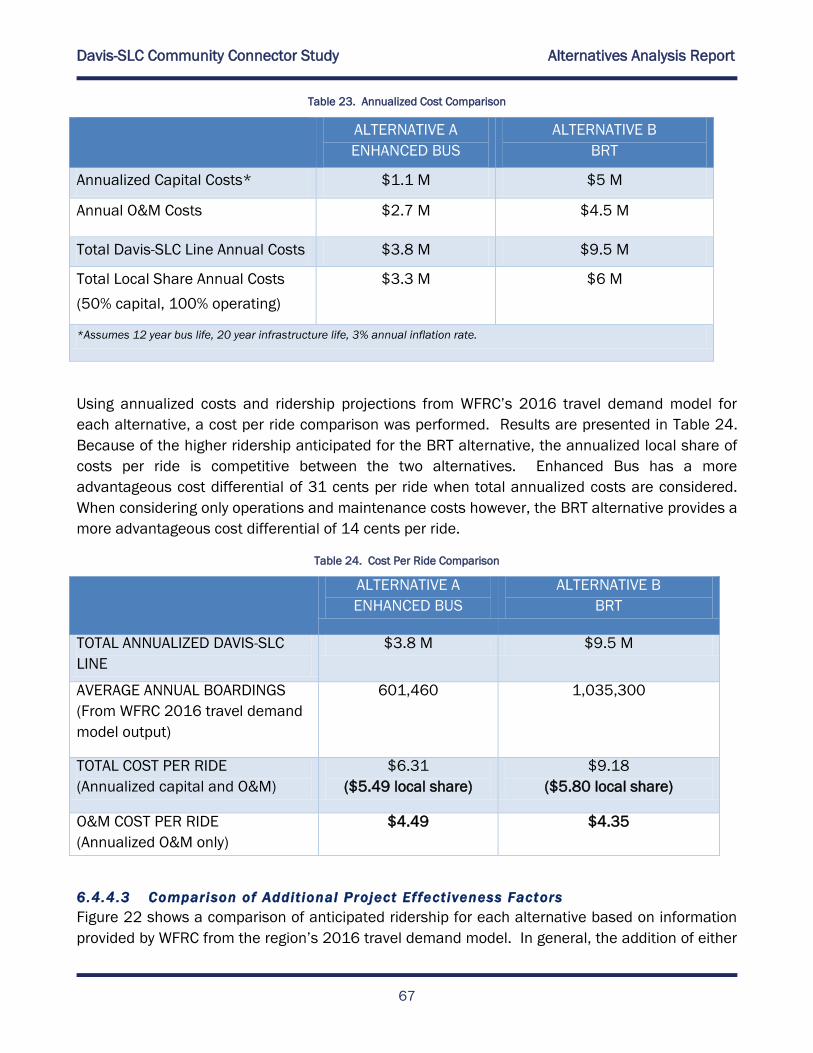
Davis-SLC Community Connector Study Alternatives Analysis Report
67
Table 23. Annualized Cost Comparison
ALTERNATIVE A
ENHANCED BUS
ALTERNATIVE B
BRT
Annualized Capital Costs* $1.1 M $5 M
Annual O&M Costs $2.7 M $4.5 M
Total Davis-SLC Line Annual Costs $3.8 M $9.5 M
Total Local Share Annual Costs
(50% capital, 100% operating)
$3.3 M $6 M
*Assumes 12 year bus life, 20 year infrastructure life, 3% annual inflation rate.
Using annualized costs and ridership projections from WFRC’s 2016 travel demand model for
each alternative, a cost per ride comparison was performed. Results are presented in Table 24.
Because of the higher ridership anticipated for the BRT alternative, the annualized local share of
costs per ride is competitive between the two alternatives. Enhanced Bus has a more
advantageous cost differential of 31 cents per ride when total annualized costs are considered.
When considering only operations and maintenance costs however, the BRT alternative provides a
more advantageous cost differential of 14 cents per ride.
Table 24. Cost Per Ride Comparison
ALTERNATIVE A
ENHANCED BUS
ALTERNATIVE B
BRT
TOTAL ANNUALIZED DAVIS-SLC
LINE
$3.8 M $9.5 M
AVERAGE ANNUAL BOARDINGS
(From WFRC 2016 travel demand
model output)
601,460 1,035,300
TOTAL COST PER RIDE
(Annualized capital and O&M)
$6.31
($5.49 local share)
$9.18
($5.80 local share)
O&M COST PER RIDE
(Annualized O&M only)
$4.49 $4.35
6.4.4.3 Comparison of Addit ional Project Effectiveness Factors
Figure 22 shows a comparison of anticipated ridership for each alternative based on information
provided by WFRC from the region’s 2016 travel demand model. In general, the addition of either
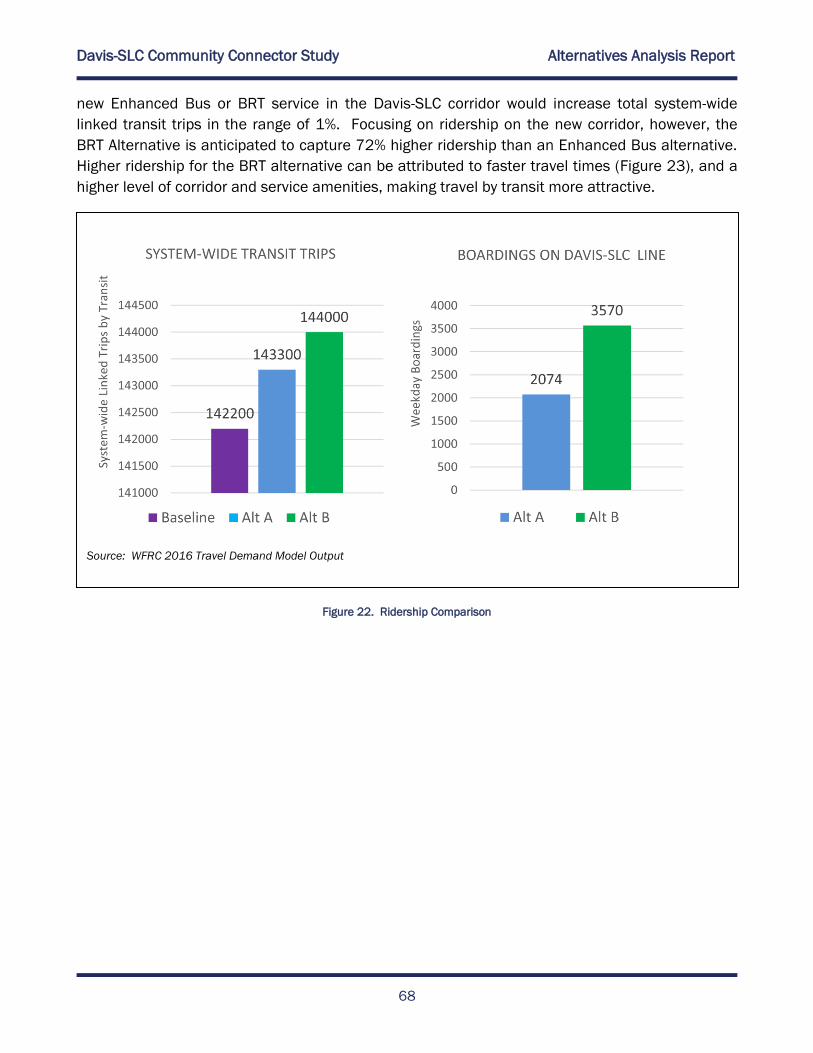
Davis-SLC Community Connector Study Alternatives Analysis Report
68
new Enhanced Bus or BRT service in the Davis-SLC corridor would increase total system-wide
linked transit trips in the range of 1%. Focusing on ridership on the new corridor, however, the
BRT Alternative is anticipated to capture 72% higher ridership than an Enhanced Bus alternative.
Higher ridership for the BRT alternative can be attributed to faster travel times (Figure 23), and a
higher level of corridor and service amenities, making travel by transit more attractive.
Figure 22. Ridership Comparison
Source: WFRC 2016 Travel Demand Model Output
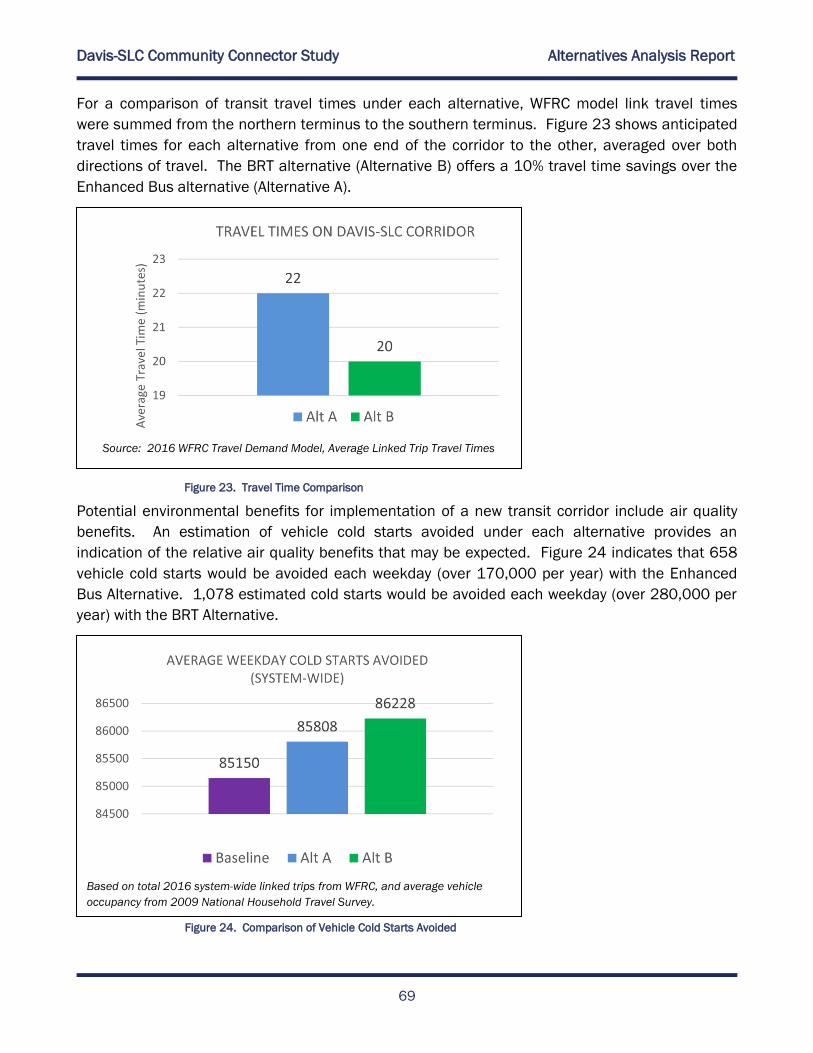
Davis-SLC Community Connector Study Alternatives Analysis Report
69
For a comparison of transit travel times under each alternative, WFRC model link travel times
were summed from the northern terminus to the southern terminus. Figure 23 shows anticipated
travel times for each alternative from one end of the corridor to the other, averaged over both
directions of travel. The BRT alternative (Alternative B) offers a 10% travel time savings over the
Enhanced Bus alternative (Alternative A).
Figure 23. Travel Time Comparison
Potential environmental benefits for implementation of a new transit corridor include air quality
benefits. An estimation of vehicle cold starts avoided under each alternative provides an
indication of the relative air quality benefits that may be expected. Figure 24 indicates that 658
vehicle cold starts would be avoided each weekday (over 170,000 per year) with the Enhanced
Bus Alternative. 1,078 estimated cold starts would be avoided each weekday (over 280,000 per
year) with the BRT Alternative.
Figure 24. Comparison of Vehicle Cold Starts Avoided
Source: 2016 WFRC Travel Demand Model, Average Linked Trip Travel Times
Based on total 2016 system-wide linked trips from WFRC, and average vehicle
occupancy from 2009 National Household Travel Survey.
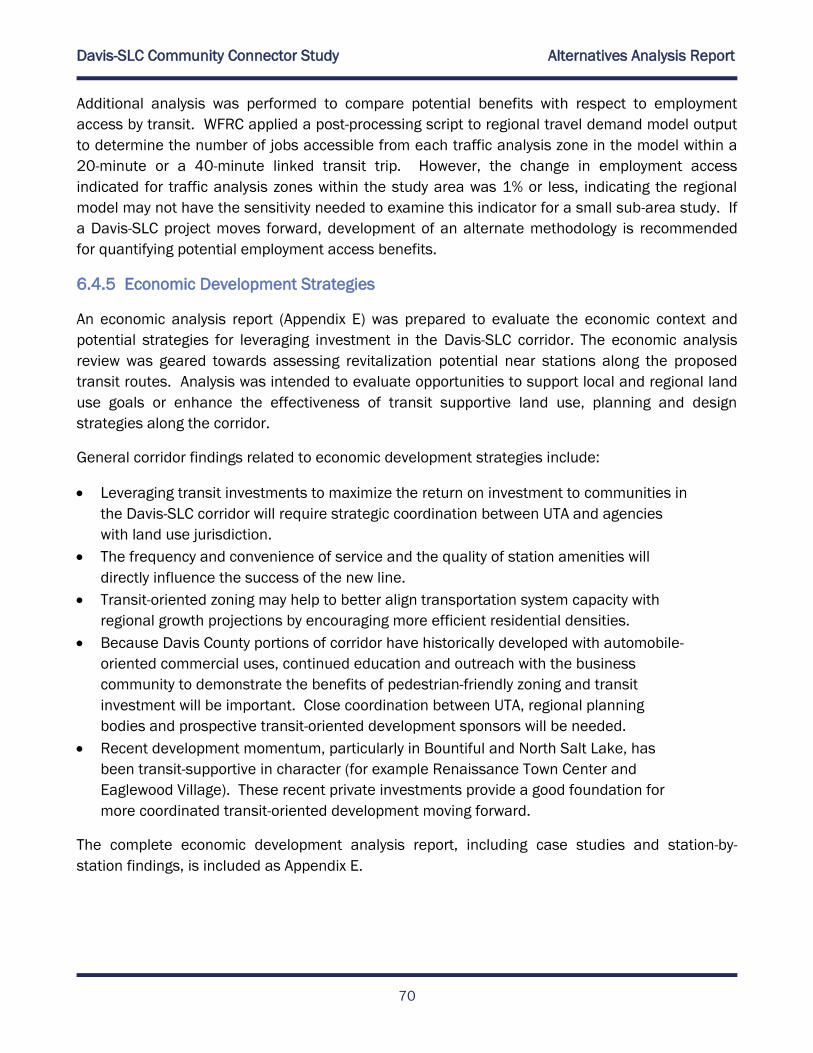
Davis-SLC Community Connector Study Alternatives Analysis Report
70
Additional analysis was performed to compare potential benefits with respect to employment
access by transit. WFRC applied a post-processing script to regional travel demand model output
to determine the number of jobs accessible from each traffic analysis zone in the model within a
20-minute or a 40-minute linked transit trip. However, the change in employment access
indicated for traffic analysis zones within the study area was 1% or less, indicating the regional
model may not have the sensitivity needed to examine this indicator for a small sub-area study. If
a Davis-SLC project moves forward, development of an alternate methodology is recommended
for quantifying potential employment access benefits.
6.4.5 Economic Development Strategies
An economic analysis report (Appendix E) was prepared to evaluate the economic context and
potential strategies for leveraging investment in the Davis-SLC corridor. The economic analysis
review was geared towards assessing revitalization potential near stations along the proposed
transit routes. Analysis was intended to evaluate opportunities to support local and regional land
use goals or enhance the effectiveness of transit supportive land use, planning and design
strategies along the corridor.
General corridor findings related to economic development strategies include:
Leveraging transit investments to maximize the return on investment to communities in
the Davis-SLC corridor will require strategic coordination between UTA and agencies
with land use jurisdiction.
The frequency and convenience of service and the quality of station amenities will
directly influence the success of the new line.
Transit-oriented zoning may help to better align transportation system capacity with
regional growth projections by encouraging more efficient residential densities.
Because Davis County portions of corridor have historically developed with automobile-
oriented commercial uses, continued education and outreach with the business
community to demonstrate the benefits of pedestrian-friendly zoning and transit
investment will be important. Close coordination between UTA, regional planning
bodies and prospective transit-oriented development sponsors will be needed.
Recent development momentum, particularly in Bountiful and North Salt Lake, has
been transit-supportive in character (for example Renaissance Town Center and
Eaglewood Village). These recent private investments provide a good foundation for
more coordinated transit-oriented development moving forward.
The complete economic development analysis report, including case studies and station-by-
station findings, is included as Appendix E.
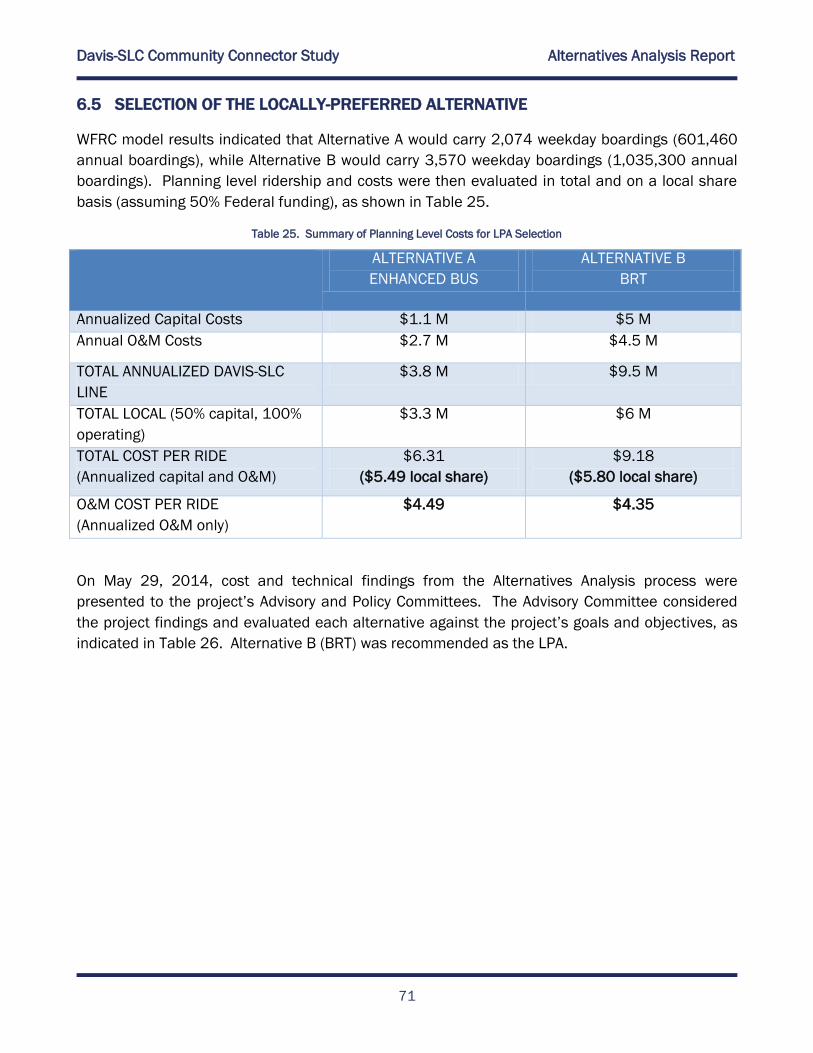
Davis-SLC Community Connector Study Alternatives Analysis Report
71
6.5 SELECTION OF THE LOCALLY-PREFERRED ALTERNATIVE
WFRC model results indicated that Alternative A would carry 2,074 weekday boardings (601,460
annual boardings), while Alternative B would carry 3,570 weekday boardings (1,035,300 annual
boardings). Planning level ridership and costs were then evaluated in total and on a local share
basis (assuming 50% Federal funding), as shown in Table 25.
Table 25. Summary of Planning Level Costs for LPA Selection
ALTERNATIVE A
ENHANCED BUS
ALTERNATIVE B
BRT
Annualized Capital Costs $1.1 M $5 M
Annual O&M Costs $2.7 M $4.5 M
TOTAL ANNUALIZED DAVIS-SLC
LINE
$3.8 M $9.5 M
TOTAL LOCAL (50% capital, 100%
operating)
$3.3 M $6 M
TOTAL COST PER RIDE
(Annualized capital and O&M)
$6.31
($5.49 local share)
$9.18
($5.80 local share)
O&M COST PER RIDE
(Annualized O&M only)
$4.49 $4.35
On May 29, 2014, cost and technical findings from the Alternatives Analysis process were
presented to the project’s Advisory and Policy Committees. The Advisory Committee considered
the project findings and evaluated each alternative against the project’s goals and objectives, as
indicated in Table 26. Alternative B (BRT) was recommended as the LPA.
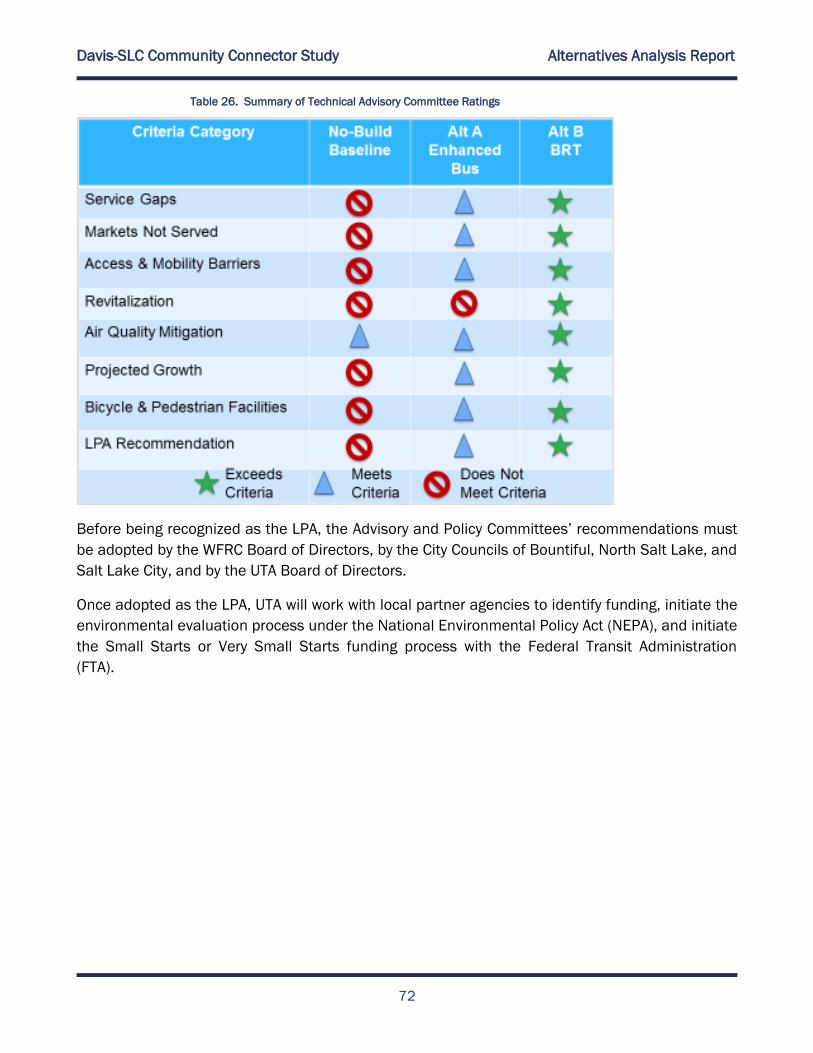
Davis-SLC Community Connector Study Alternatives Analysis Report
72
Table 26. Summary of Technical Advisory Committee Ratings
Before being recognized as the LPA, the Advisory and Policy Committees’ recommendations must
be adopted by the WFRC Board of Directors, by the City Councils of Bountiful, North Salt Lake, and
Salt Lake City, and by the UTA Board of Directors.
Once adopted as the LPA, UTA will work with local partner agencies to identify funding, initiate the
environmental evaluation process under the National Environmental Policy Act (NEPA), and initiate
the Small Starts or Very Small Starts funding process with the Federal Transit Administration
(FTA).
Davis-SLC Community Connector Study Alternatives Analysis Report
73
Intentionally Blank Page.